Article

Assessing the Spatial and Temporal Patterns of Seasonal Precipitation Extremes and the Potential Influencing Factors in Dongting Lake Basin, China

1
School of Education Science, Hunan First Normal University, Changsha 410205, China
2
Key Laboratory for Agro-ecological Processes in Subtropical Region, Institute of Subtropical Agriculture, Chinese Academy of Sciences, Changsha 410125, China
3
Huanjiang Observation and Research Station for Karst Ecosystem, Chinese Academy of Sciences, Huanjiang 547100, China
*
Author to whom correspondence should be addressed.
Water 2016, 8(12), 558; https://doi.org/10.3390/w8120558
Submission received: 13 October 2016 / Revised: 15 November 2016 / Accepted: 24 November 2016 / Published: 29 November 2016

Abstract

:
The Dongting Lake Basin (DTLB) of China is a flood prone area. Knowledge of the spatiotemporal characteristics and risks of precipitation extremes is essential for flood mitigation. Based on the precipitation amount (R), precipitation intensity (Ri), max 1 day precipitation amount (Rx1) and max 5 day precipitation amount (Rx5), this study analyzed the spatial-temporal patterns, risks and investigated the influences of the precipitation extremes at seasonal scale. The distributed high values of R, Ri, Rx1, Rx5 and their 5-year return levels (R5, Ri5, Rx15, Rx55) indicated high flood risks in the eastern and northern parts of the basin, and the general upward trends of these indices suggested increasing flood risks, except for some areas in southwestern part in spring and autumn. The precipitation extremes were related to the topographic and circulation factors, within which the latter might have greater roles. Furthermore, the trend directions of the 5-year return levels (R5, Ri5, Rx15, Rx55) were not always the same as the initial indices (R, Ri, Rx1, Rx5), suggesting that overall decreasing (increasing) precipitation extremes do not always represent decreasing (increasing) risks of floods. Hence, policy makers should pay more attention to the risks of precipitation extremes rather than their overall tendencies.

1. Introduction

There is growing concern about extreme climate events due to the vulnerability of our society to the adverse impacts of such events [1,2,3,4]. Climate extremes, such as droughts, floods, cold weather, have brought huge damages on human society and the ecological environment around the world [1,5,6,7,8]. However, in a gradually warming environment, the intensity and frequency of climate extremes have changed considerably in the past decades [8].
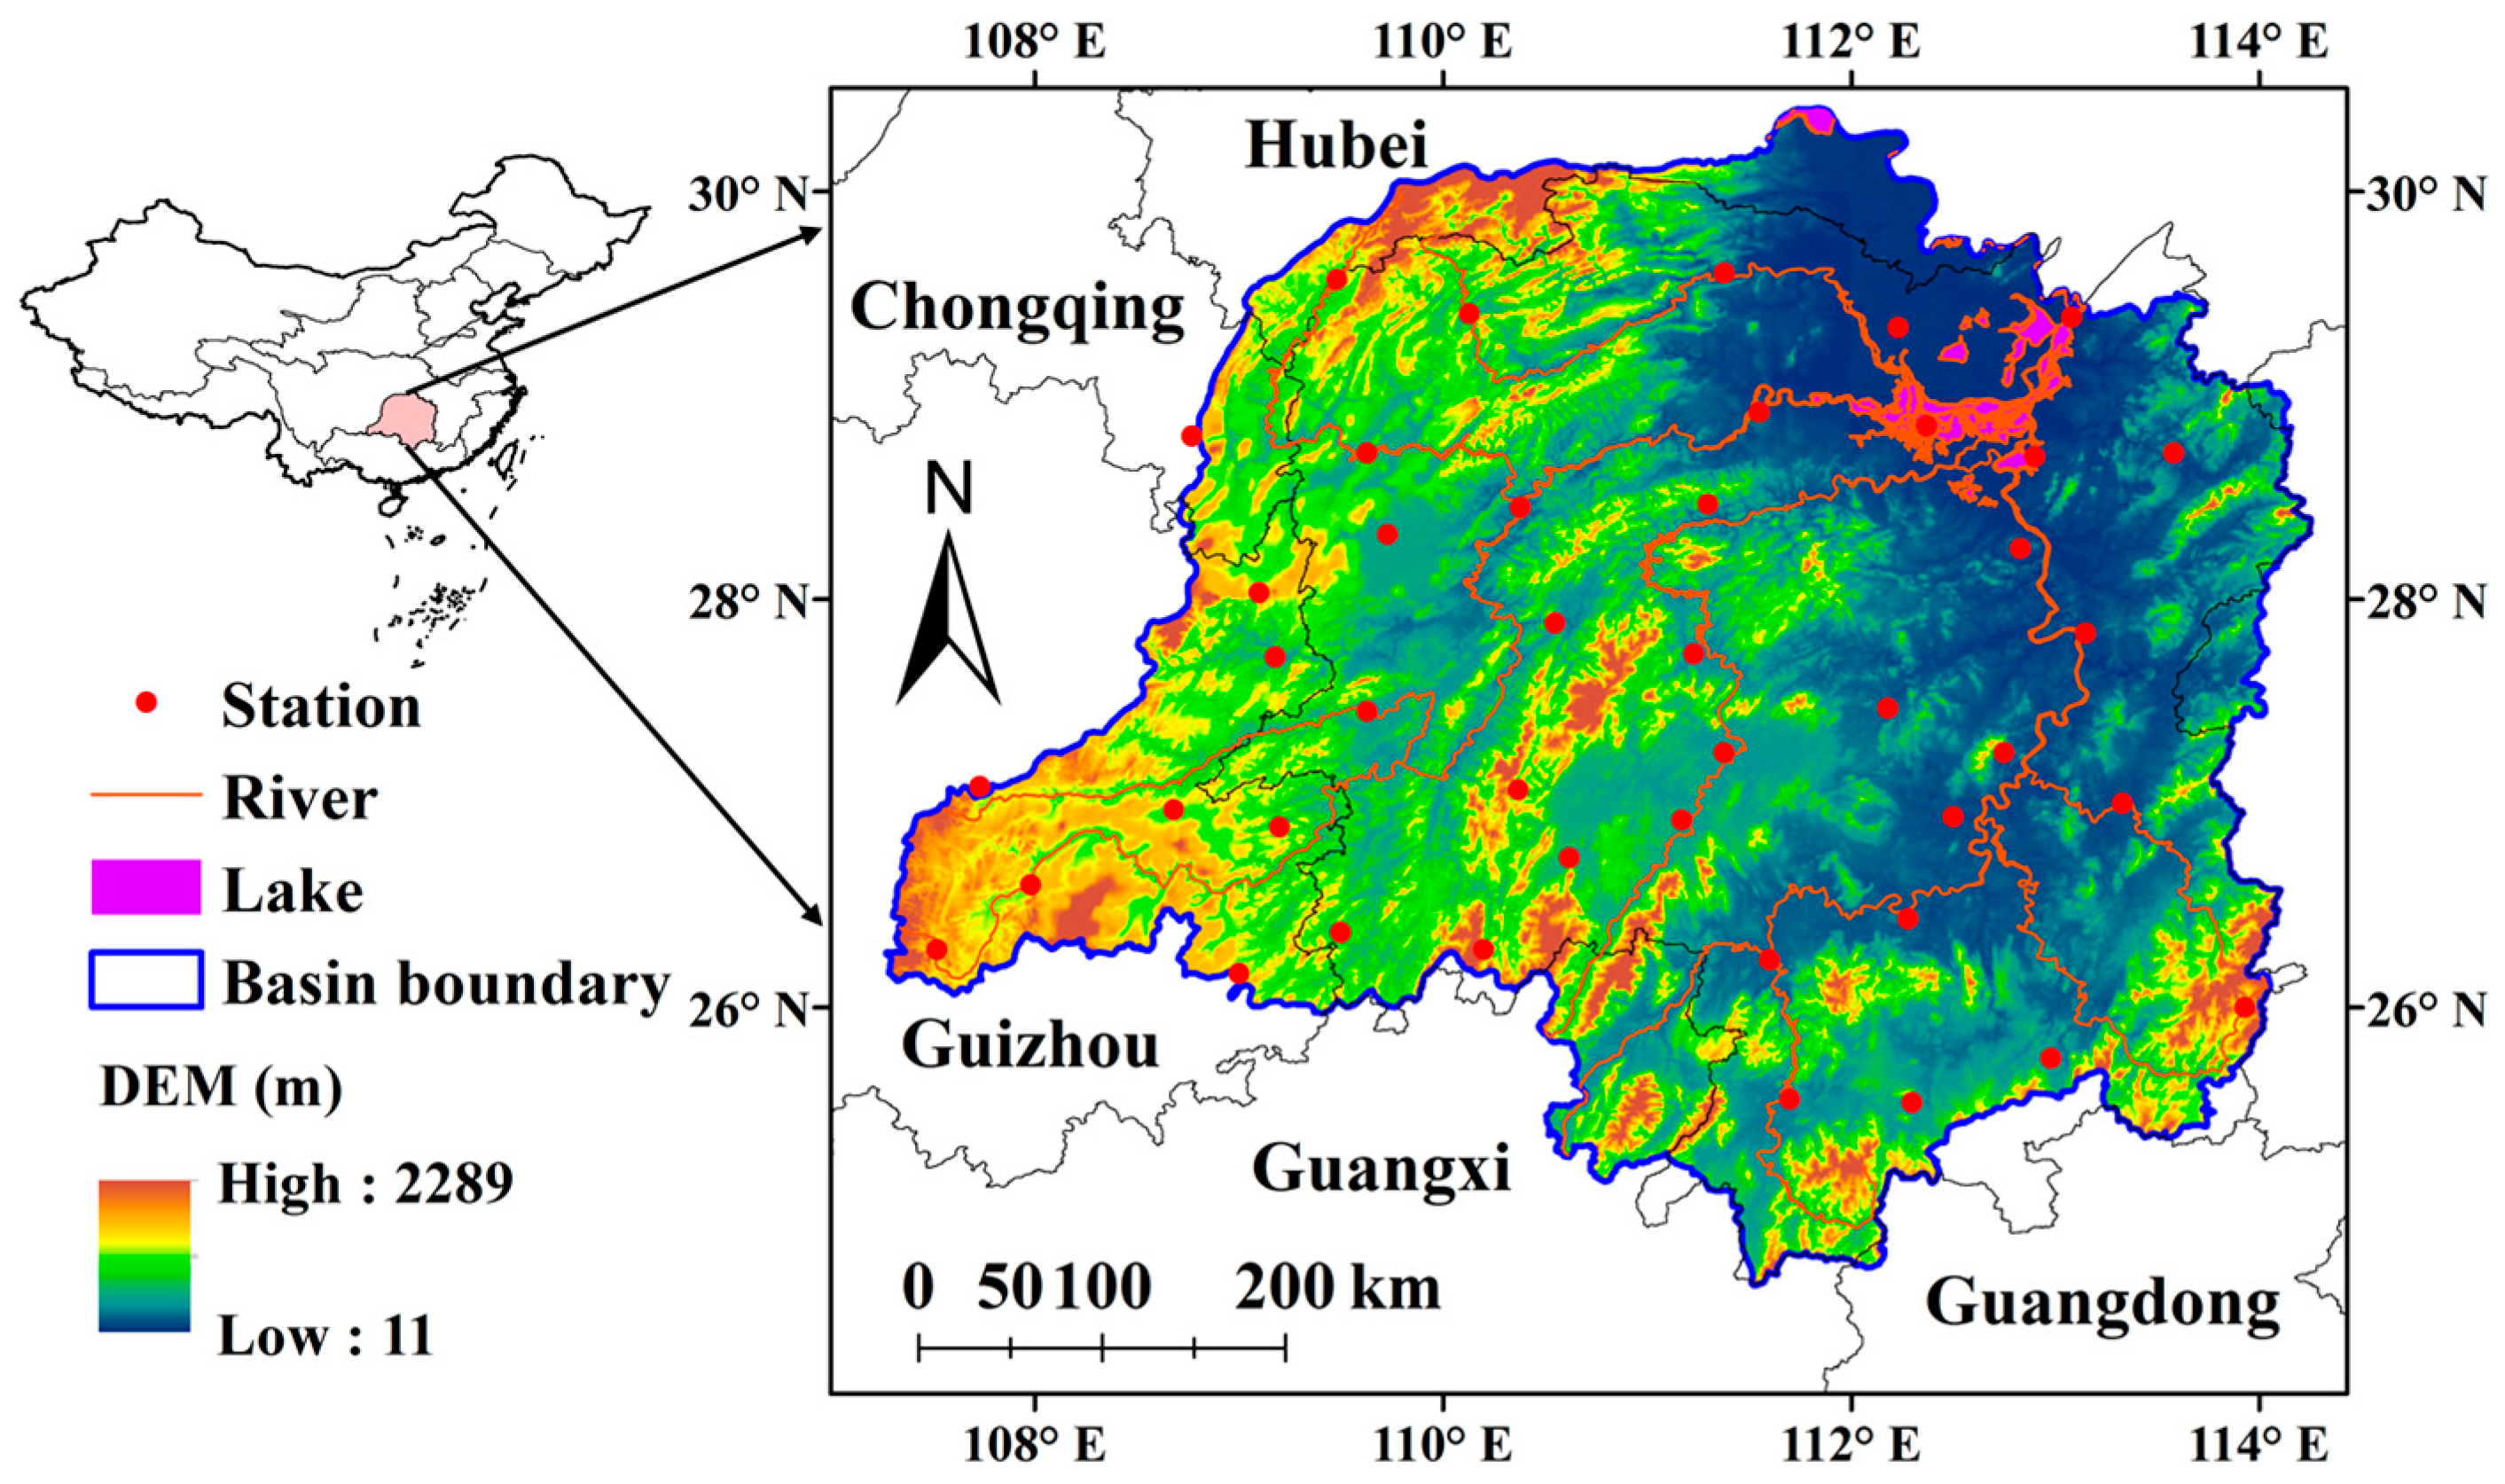
The Dongting Lake Basin (DTLB), located in the middle reach of the Yangtze River, is an important grain and cash crop planting base in China. However, this region is sensitive to natural hazards [9], and is also a well-known flood prone region [10]. Records show that during the period of 1950–2009, floods (regardless of the severity) occurred almost every year in this basin [11], and caused economical loss of about $0.3 billion per year in agriculture [9,12]. For example, the 1996 flood affected 38 cities, 1.1 × 10⁶ hectare farmland, and about 7.2 million people’s livelihood and wealth, causing direct economic loss of $4.95 billion [13]. While in 1998, a similar severe flooding hit this basin again and brought out huge damages to the water conservancy facilities, agriculture, and influenced deeply the people’s lives. However, climate change in this region is also relatively considerable [14,15]. Previous studies pointed out that the frequency of floods in DTLB increased significantly in the last half century [16]. For example, in the periods of 1931–1990 and 1991–2000, there were 14 and 6 major floods, with the return periods of 4.3 and 1.7 years, respectively.
Indeed, there exist many factors that can influence the formation of flood, such as the water conservancy facilities, land cover and land usage, precipitation, etc. Nevertheless, paroxysmal large amount of water could be the prerequisite, which mainly attribute to heavy precipitation [1]. Therefore, knowledge of the spatial-temporal characteristics of precipitation extremes is very important in disaster mitigation, water resources management, agriculture and policy making [1]. Recently, many studies have focused on climate extremes at regional and global scale [1,3,4,8,17,18], and at varying time scales [7,19]. Similarly, climate extremes have also been intensively studied in China [20,21,22,23]. Overall, many of these studies focused on the changing patterns of several climate extreme indices [20,22], and some of them analyzed the probability distributions of the climate extremes [1,23,24,25] and investigated the potential underlying mechanisms or influencing factors, such as the ENSO events, SST, atmospheric circulation and topography [15,23,26,27]. A number of previous studies have attempted to characterize climate extremes in the DTLB. For example, Wang, Jiang, Wang and Yu [14] reported that precipitation in DTLB exhibited apparent upward trends after 1990s (especially in summer), and the storm frequency in summer also increased obviously, while the storm intensity showed no significant changes. However, Xu, et al. [28] concluded that during the period of 1960–2011, annual precipitation decreased gradually and had different changing directions in different seasons, but the trends were not significant; Song, et al. [29] also pointed out that the precipitation extremes changed insignificantly in DTLB.
From these existing literatures, most of the researchers concluded that the precipitation had overall downward trends and precipitation extremes changed insignificantly in DTLB [28,29,30,31,32]. The insignificant changing precipitation extremes could not reflect the facts that floods occurred more frequently in DTLB [11,13]. The explanation is that the previous studies mainly used some trend detection methods (e.g., MK test) to examine the trends of the precipitation [28,29,31]. However, though trend detection can point out the overall changing patterns of a time series, it would also miss some information of individual events, e.g., the floods. In recent years, scholars tried to investigate the risks of precipitation extremes by employing probability distributions [1,23,24,25]. They found that although the initial precipitation indices had no significant trends, the risks of precipitation extremes always exhibited significant changes [1,23]. The risk of precipitation extreme shows the severity of event would reach at a given probability or the possibility that an extreme event would occur. Hence, the risk (or probability) characteristics of a precipitation index may be more effective in implying the evolution of extreme events. However, few studies have focused on this issue in DTLB. Therefore, this study aimed to (1) analyze the trends and probabilistic characteristics of precipitation extremes at seasonal scale; (2) investigate the potential influencing factors for the changing patterns of the precipitation extremes; and (3) evaluate the changing patterns of floods implied by the precipitation extremes.

2. Data and Methods

2.1. Study Area

The Dongting Lake Basin (DTLB) is situated in the middle reach of the Yangtze River (approximately 24°38′ N–30°26′ N, 107°16′ E–114°17′ E) [33]. Within which the Dongting Lake is the second largest freshwater lake in China, and is also one of the most important international wetlands [33]. The lake is fed by four other major rivers, namely the Xiangjiang River, Zishui River, Yuanjiang River and Lishui River (Figure 1). The total area of DTLB is about 2.62 × 10⁵ km2, and occupies about 14% of the Yangtze River Basin. This region has a subtropical monsoon climate, jointly influenced by the southeast monsoon, southwest monsoon, subtropical anticyclone and the westerly. The wet season in DTLB is between July and September while the dry season is between November and the next February. The topography in this basin is relatively complex (Figure 1), with mountains located in the eastern, southern and western parts, and low hills and flatlands in the central and northern part (Figure 1).

2.2. Data and Indices

This study used a 54-year (1960–2013) dataset of daily meteorological observations [34] at 43 stations (Figure 1), which has gone through quality control procedures. For the purpose of representing the extreme precipitation events, four precipitation indices, including the seasonal total precipitation (R), simple precipitation intensity (Ri), max 1 day precipitation amount (Rx1) and the max 5 day precipitation amount (Rx5), were employed [1]. These indices were calculated at the seasonal scale. The definitions and units of these indices are summarized in Table 1. Note that here the four seasons, the spring, summer, autumn and winter, were defined as the periods of March–May, June–August, September–November and December–February, respectively. Therefore, a total of 53 data (1960–2012) for each precipitation indices were obtained.
The circulation factors were reflected by using the atmospheric moisture flux (AMF) and moisture flux divergence (AMD). The vertically integrated seasonal mean AMF, mean AMD of the layer (surface–300 hPa) [35] in different seasons were calculated using the NCEP/NCAR reanalysis dataset (1960–2013) [36]. Note that due to the resolution of NCEP/NCAR is 2.5 degrees, the atmospheric moisture flux at each station was generated using the linear interpolation method. In order to represent the topographic conditions (topographic factors), the mean elevation (ME), standard deviation of elevation (SE), mean slope (MS), and standard deviation of slope (SS) were used (Table 2) [23,37]. The topographic factors were calculated using the digital elevation model (DEM) (30-m spatial resolution) in a circular area within 50 km of each meteorological station (the area is 1962.5 km2) [23].

2.3. Methods

The trends of the four precipitation indices, the atmospheric moisture flux (AMF) and atmospheric moisture divergence (AMD) and the corresponding regional mean of these indices in various seasons were firstly analyzed using the modified pre-whitening Mann–Kendall trend test (MK-TFPW) [38,39,40]. The regional mean series were calculated as an arithmetic mean of values at all stations:
x t = 1 n 1 n x i , t
where the xt is the regional mean index at year t, xi,t is the index for station i at year t.
For estimating the probability characteristics of these precipitation indices, 13 probability distributions were used to fit the distributions of the seasonal series. These probability distributions were the Gaussian, Student’s t-test, Poisson, exponential, Rayleigh, Weibull, generalized extreme value (GEV), binomial, negative binomial, lognormal, geometric, generalized Pareto (GP), and extreme value (EV) distribution. These probability distributions were widely used in hydrometeorological studies [1,23,41,42]. The parameters of these probability distributions were estimated using the maximum likelihood method, and the Kolmogorov Smirnov test was used to choose the optimal distribution for each index. Then based on the optimal distribution, the 5-year return levels of the four precipitation indices at each station were determined. Here the 5-year return levels for R, Ri, Rx1, Rx5 were denoted as the R5, Ri5, Rx15, Rx55, respectively. Note that the reason for using 5-year return levels is that the return period of floods (or extreme precipitation events) was shorter than 5 years. As pointed out in Reference [16], there were 14 and 6 floods occurred during 1931–1990 and 1991–2000, with the flood return periods being 4.3 and 1.7 years, respectively. Hence, 5-year return level could represent well floods in this region. Note that in order to facilitate the distinction between the precipitation indices and their 5-year return levels, here we denote the precipitation indices defined in Table 1 as the ‘initial indices’ in the next context.
For examining the changing patterns of the 5-year return levels (R5, Ri5, Rx15, Rx55), a 30-year moving window was used [23]. Therefore, for each precipitation indices, a total of 24 windows could be obtained in the 53-year period (1960–1989, 1961–1990, …, 1983–2012). In each window, the 13 probability distributions and the same procedures mentioned above were used to determine the 5-year return levels. Hence, a total of 24 5-year return levels for each indices (R5, Ri5, Rx15, Rx55) at each station were obtained, and the trends of these 5-year return levels were examined also using the modified pre-whitening Mann–Kendall trend test.
Correlation analyses were used to study the relationships between the precipitation extremes and the topographic/circulation factors. Particularly, in each moving window (30-year), correlation analyses were conducted between the 5-year return levels of each extreme index and the topographic (ME, SE, MS, SS) and circulation factors (AMF and AMD) in the same window. For example, the correlation between Rx55 and MF in the 1960–1989 window was conducted between the 43 Rx55 (at the 43 stations) in the whole basin and the 43 AMF in the same window (1960–1989) (spatial correlation), while the correlation between Rx55 and ME (e.g., in the 1960–1989 window) was conducted between the 43 Rx55 and the 43 ME (the topographical factor at each station was a constant). Therefore, 24 values of correlations could be obtained (such as Rx1 vs. AMF, Rx1 vs. ME, etc.), and then the MK-TFPW was used to examine the trends of these correlations.

3. Results

3.1. Trends of the Seasonal Precipitation Indices

As shown in Figure 2, the four precipitation indices had different changing patterns and spatial distribution in the four seasons. In particular, the R (seasonal total precipitation) exhibited descend trends at almost all the stations (about 93%) in spring and in autumn, and upward trends in summer and winter (Figure 2a–d). The Ri decreased in the central part of the DTLB and increased in other parts in spring, and showed uptrends in summer, autumn and winter (Figure 2e–h). While the Rx1 and Rx5 had generally the same changing patterns in summer, autumn and winter (Figure 2j–l,n–p), and differed slightly in spring. Particularly, the Rx1 and Rx5 increased in summer, autumn and winter in major part of the basin; whereas in spring, the Rx1 decreased in the central part and increased in the south and north part (Figure 2i), while the Rx5 had general tendencies to decline except at few stations located in the southeastern mountainous regions (Figure 2m).
Overall, the regional mean R (seasonal) decreased by −9.30 and −10.29 mm∙season−1∙decade−1 in spring and autumn, and increased by 7.40 and 5.91 mm∙season−1∙decade−1 in summer and winter, respectively; data also showed that the regional annual mean R (annual) decreased by −5.6 mm∙year−1∙decade−1 in this basin. The Ri increased by 0.06, 0.34, 0.23 and 0.25 mm∙day−1∙decade−1 in spring, summer, autumn and winter, respectively; the Rx1 decreased by −0.28 and −0.26 mm·day−1·decade−1 in spring and autumn, and increased by 0.87 and 0.97 mm∙day−1∙decade−1 in summer and winter; while the Rx5 decreased by −1.74 and −0.79 mm∙(5·days)−1∙decade−1 in spring and autumn, and increased by 1.66 and 2.30 mm∙(5·days)−1∙decade−1 in summer and winter (Table 3). However, these changing trends mentioned above were generally not significant (p > 0.05) (Figure 2, Table 3).

3.2. Spatial-Temporal Patterns of the 5-Year Return Levels

Overall, the order of these 5-year return levels from high to low were summer > spring > autumn > winter (Figure 3). Furthermore, the distribution of these return levels also exhibited apparent regional features (Figure 3). Figure 3a–d showed that relatively high R5 were mainly distributed in the eastern part in spring and winter, and in the western part in summer and autumn (Figure 3a–d). As for the Ri5, high values were distributed in northeastern, northern, northeastern and eastern part in the four seasons (Figure 3e–h). The distribution of Rx15 and Rx55 were generally the same to each other (Figure 3i–p), with relative high values being observed in the eastern, northern, eastern and southeastern parts.
The changing patterns of the 5-year return levels (Figure 4) were overall the same to the initial precipitation indices (Figure 2). However, there still existed some differences. The first is that the trends for the return levels were statistically significant (p < 0.05) at most of the stations (Figure 4). Second, the trends of the return levels were not always the same to those of the initial indices defined in Table 1. For example, Figure 2a showed that the R (initial index) increased at most of the stations except at 3 stations located in the southeastern part, while the R5 (probability-based index) exhibited uptrends at 6 stations in the northeast part. The number of the stations that had opposite trends in the initial indices and the 5-year return levels are summarized in Table 4. Clearly, the number of stations with increasing initial indices were not always equal to those with increasing 5-year return levels. In general, the number of the stations that had different trends in initial indices and 5-year return levels were higher in the spring, summer, autumn than in winter (Table 4).
At the regional scale, Table 5 shows that the regional mean R5 decreased by −16.95 (p < 0.05) and −14.29 (p < 0.05) mm∙season−1∙year−1 in spring and autumn, and increased by 11.56 (p < 0.05), and 12.82 (p < 0.05) mm∙season−1∙year−1 in summer and winter. The regional mean Ri5 increased in all the seasons by 0.13 (p < 0.05), 0.36 (p < 0.05), 0.34 (p < 0.05), and 0.41 (p < 0.05) mm∙day−1∙year−1 respectively. In addition, the regional mean Rx15 increased in all the seasons by 0.06 (p > 0.05), 1.11 (p < 0.05), 0.02 (p > 0.05), and 1.71 (p < 0.05) mm∙day−1∙year−1, respectively. While the Rx55 decreased by −0.85 (p < 0.05) mm∙day−1∙year−1 in spring and increased by 2.38 (p < 0.05), 0.61 (p > 0.05), and 3.11 (p < 0.05) mm∙(5·days)−1∙year−1 in summer, autumn and winter, respectively.

3.3. Relationships between Precipitation Extremes and Environmental Factors

Figure 5 showed that the four topographic factors (ME, SE, MS and SS) have apparent decline trends from the southwestern part to the northeastern part. These distributions are coincided with the topography of this catchment, with mountains located in the eastern, southern and western parts, and low hills and flatlands in the central and northern part (Figure 1). As for the circulation factors, the regional mean atmospheric moisture flux (SMF) decreased significantly in all the seasons (p < 0.05), and the atmospheric moisture divergence (AMD) decreased (p < 0.05) in summer and increased (p < 0.05) in other seasons (Figure 6).
Table 6 showed that the four return levels had relationships with the topographic and circulation factors. Particularly, the R5, Ri5, Rx15 and Rx55 were negatively correlated to the ME, SE, MS and SS in spring and in winter. While in summer and autumn, the R5, Rx15, Rx55 were generally positively and Ri5 negatively correlated to the topographic factors (Table 6). As for the circulation factors, R5, Ri5, Rx15 and Rx55 were negatively correlated to AMD in all the seasons, and generally positively correlated to the AMF (Table 6). However, negative correlation for AMF could also be observed in summer and autumn (Table 6). Relatively, the R5 and Ri5, especially the Ri5, had higher correlations than the Rx15 and Rx55 (Table 6).
Furthermore, the correlations generally exhibited significant (p < 0.05) trends in the past decades. As for the topographic factors (ME, SE, MS and SS), the R5, Rx15 and Rx55 mainly had increasing correlations in spring, summer, and winter, and had downward correlations in autumn; while the Ri5 mainly had increasing correlations in spring, autumn, and winter, and had decreasing increasing correlations in summer. As for the circulation factors (AMF and AMD), the correlations were mainly increasing except that for the R5 in summer (Table 6).

4. Discussion

Humans and natural environment are vulnerable to the impacts of climate and weather extremes [1]. The Dongting Lake Basin (DTLB) is a flood prone area in China, and floods have resulted in dramatic damages to the society and natural environment in this region [43]. On the other hand, the Dongting Lake is the secondary largest freshwater lake in China, which plays important roles in regional economy development, regional environmental and ecological issues [33]. Intensive precipitation events also have impacts on soil erosion and bring huge sediments or pollutants into the lake and result in high pressure of lake degradation and water pollution [44,45]. Comprehensive knowledge of the probability or risks of the precipitation extremes and the potential influencing factors is essential for the management and mitigation of natural hazards and for the Dongting wetland protection. This study analyzed the trends and probabilistic characteristics of four precipitation extremes, including the total precipitation amount (R), simple precipitation intensity (Ri), max 1 day precipitation amount (Rx1) and max 5 day precipitation amount (Rx5) in different seasons in the DTLB, and investigated the relationship between the precipitation extremes and the local topographic and circulation factors. It would be meaningful for evaluating the changing patterns of floods or droughts and improving water resources management in this region.
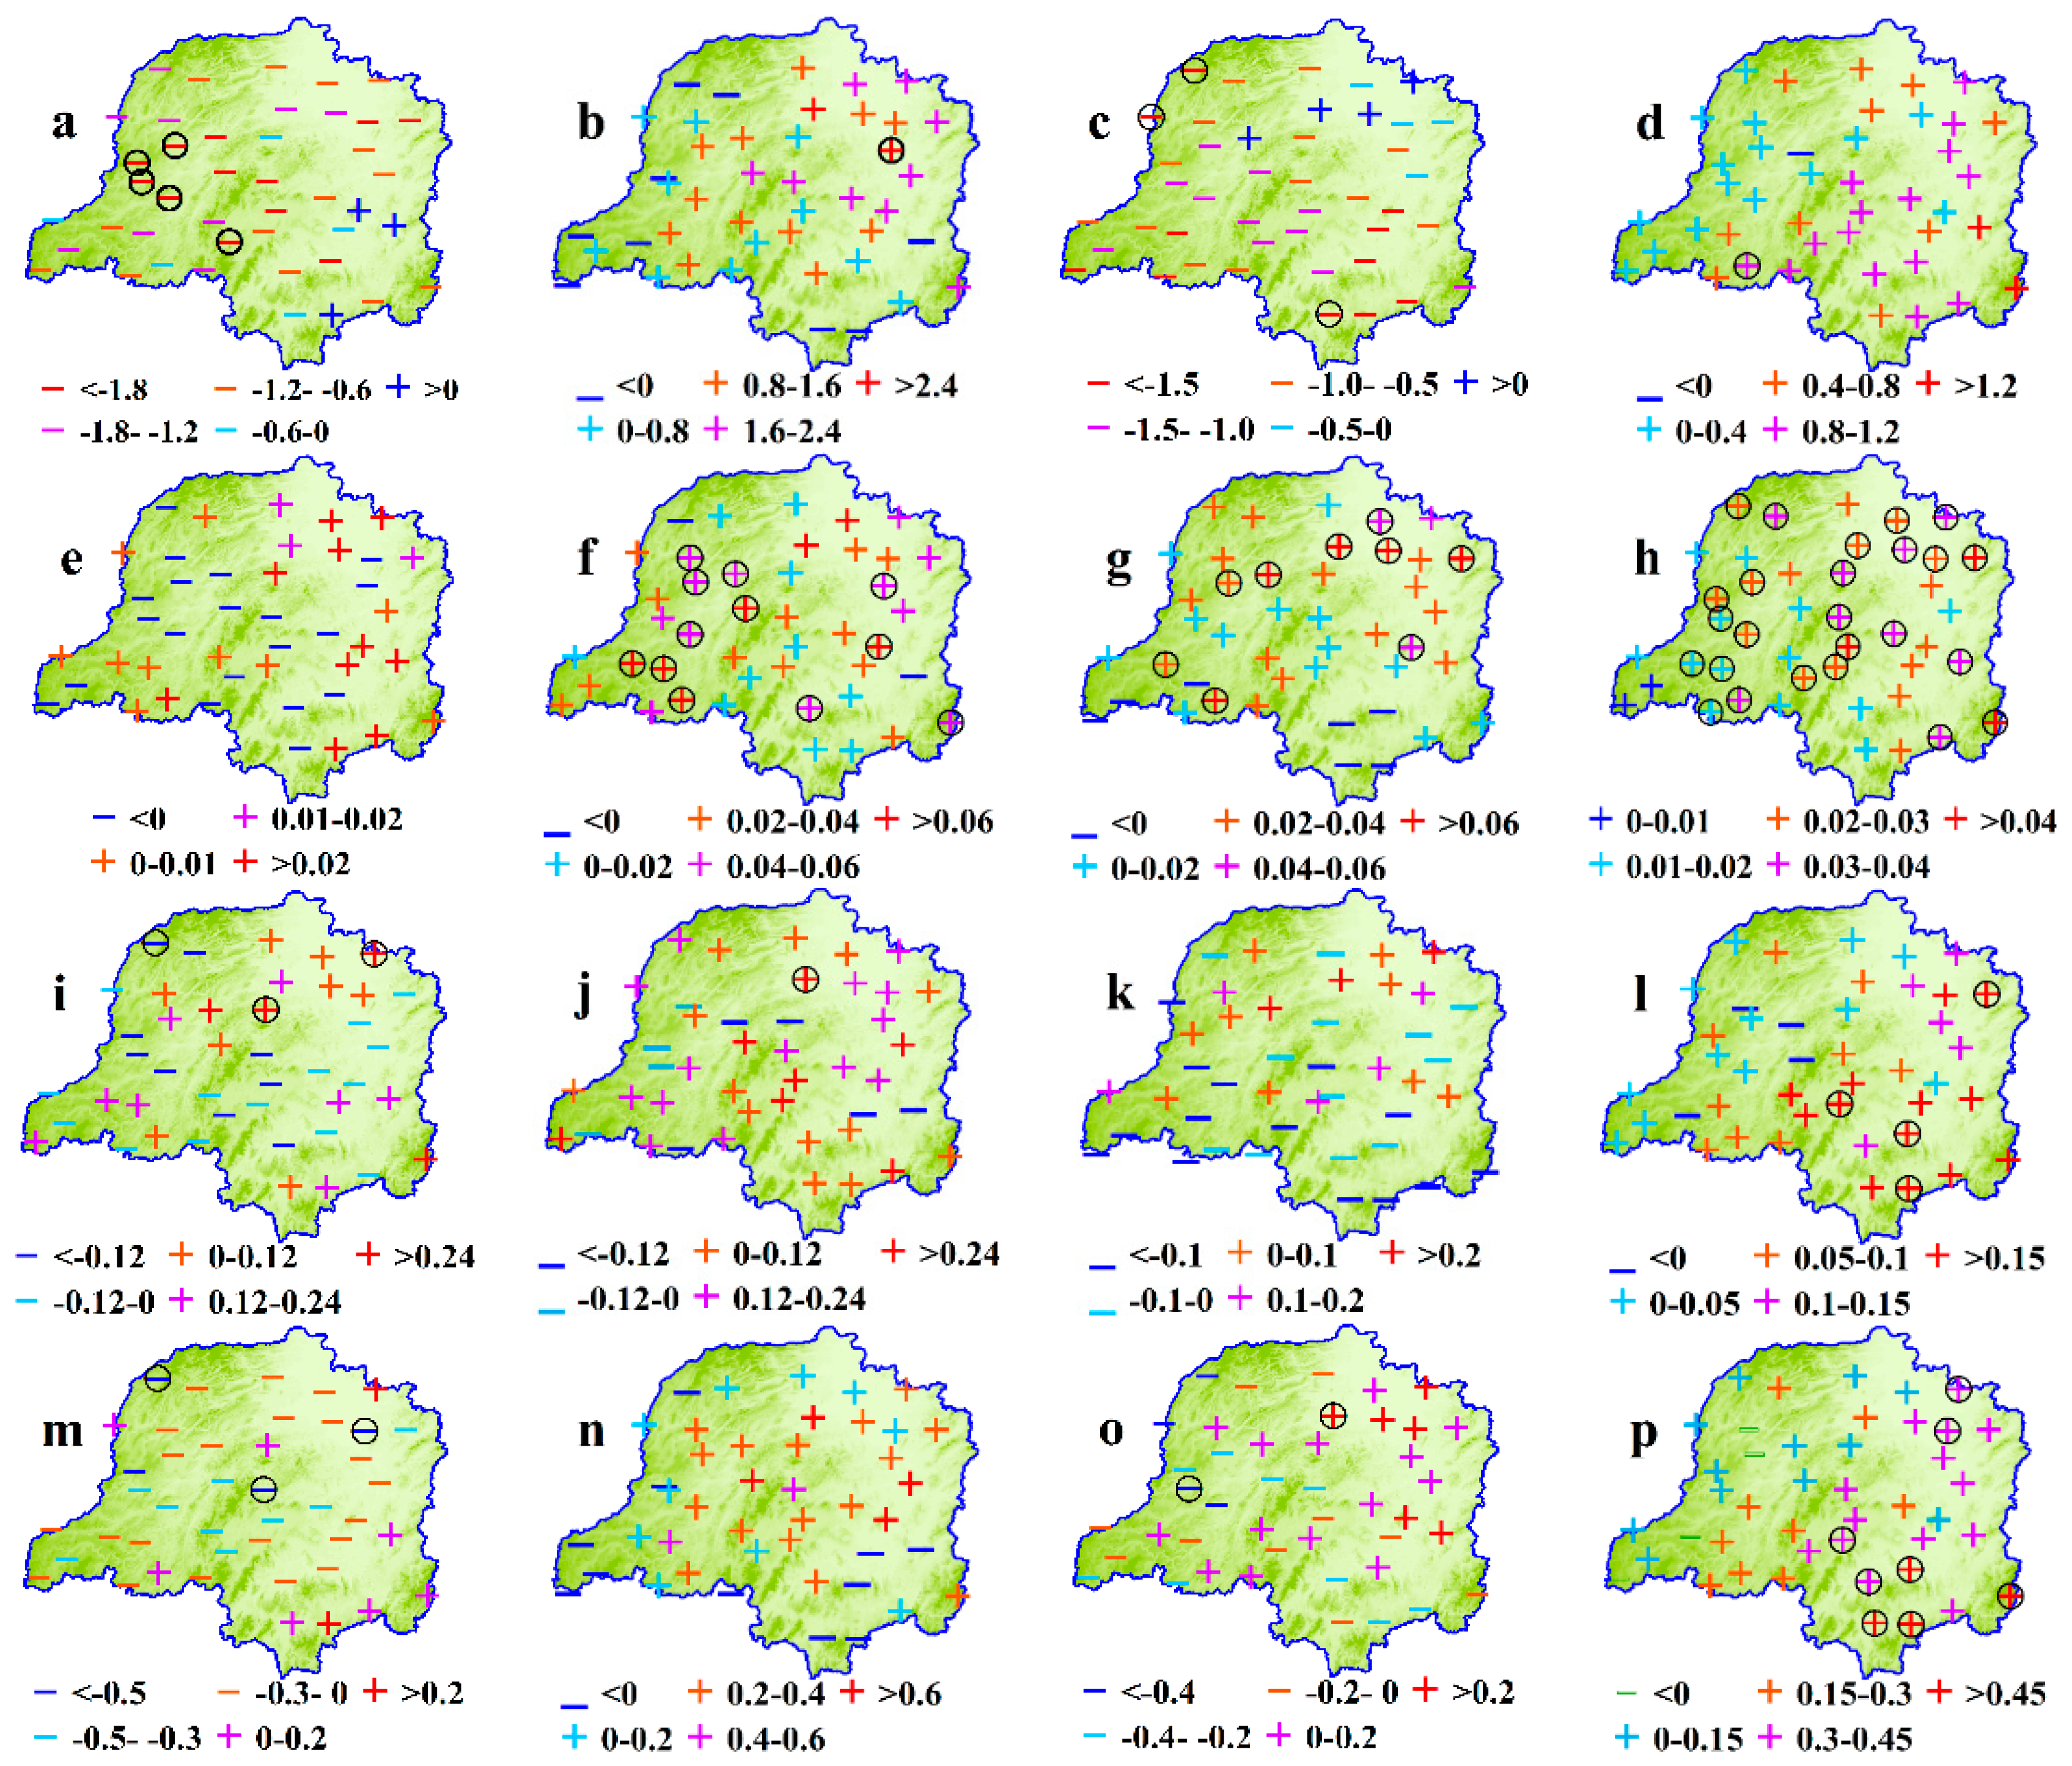
The results showed that the selected precipitation indices at most of the stations generally had insignificant changing trends in the four seasons (Figure 2) [29,31]. However, the direction of the trends differed in different seasons. At the regional scale, the R, Rx1 and Rx5 decreased in spring and autumn, and increased in summer and winter, while the Ri exhibited upward trends in all the seasons. These results were consistent with other regions in China [46]. Together with the facts that the annual precipitation amount decreased in the same decades, the results above indicate that the precipitation would have tended to concentrate in summer and winter, especially in summer. Furthermore, the trends of the Rx1 and Rx5 in winter were 0.97 mm∙days−1∙decade−1 and 2.30 mm∙(5·days)−1∙decade−1, respectively, being generally higher than those (absolute value) in other seasons, implying that extreme precipitation events in winter were enhanced more significantly.
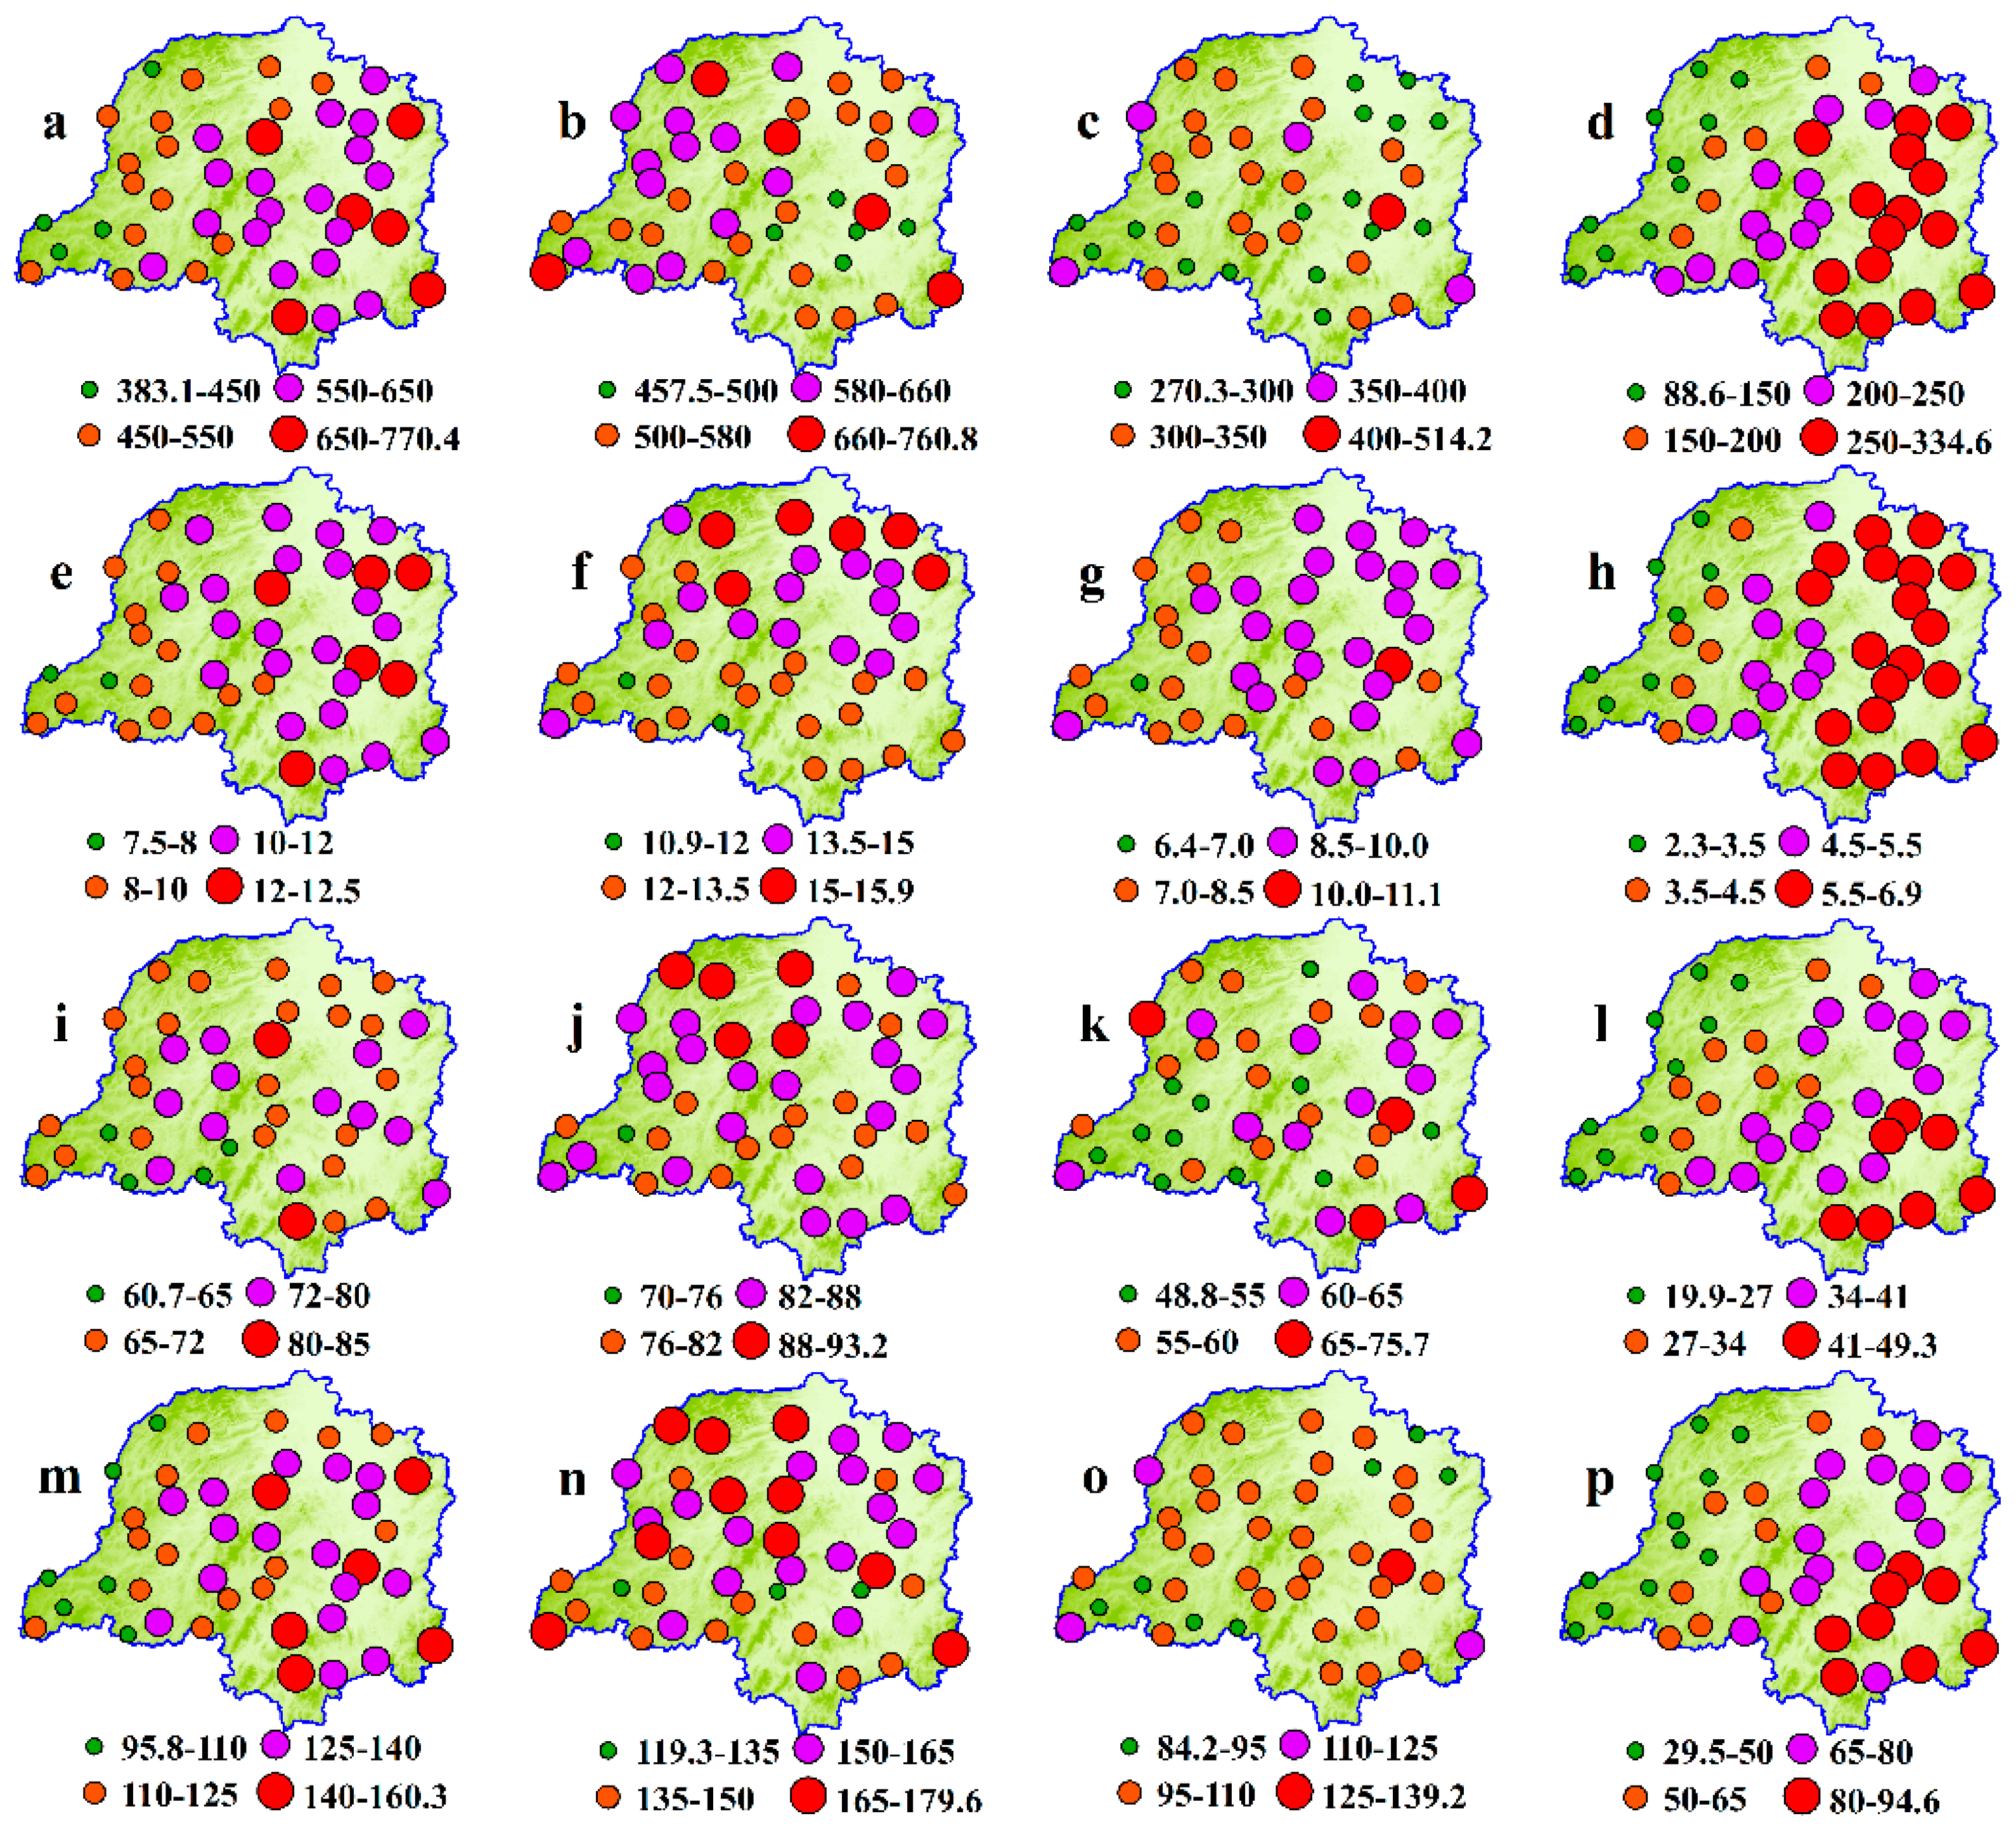
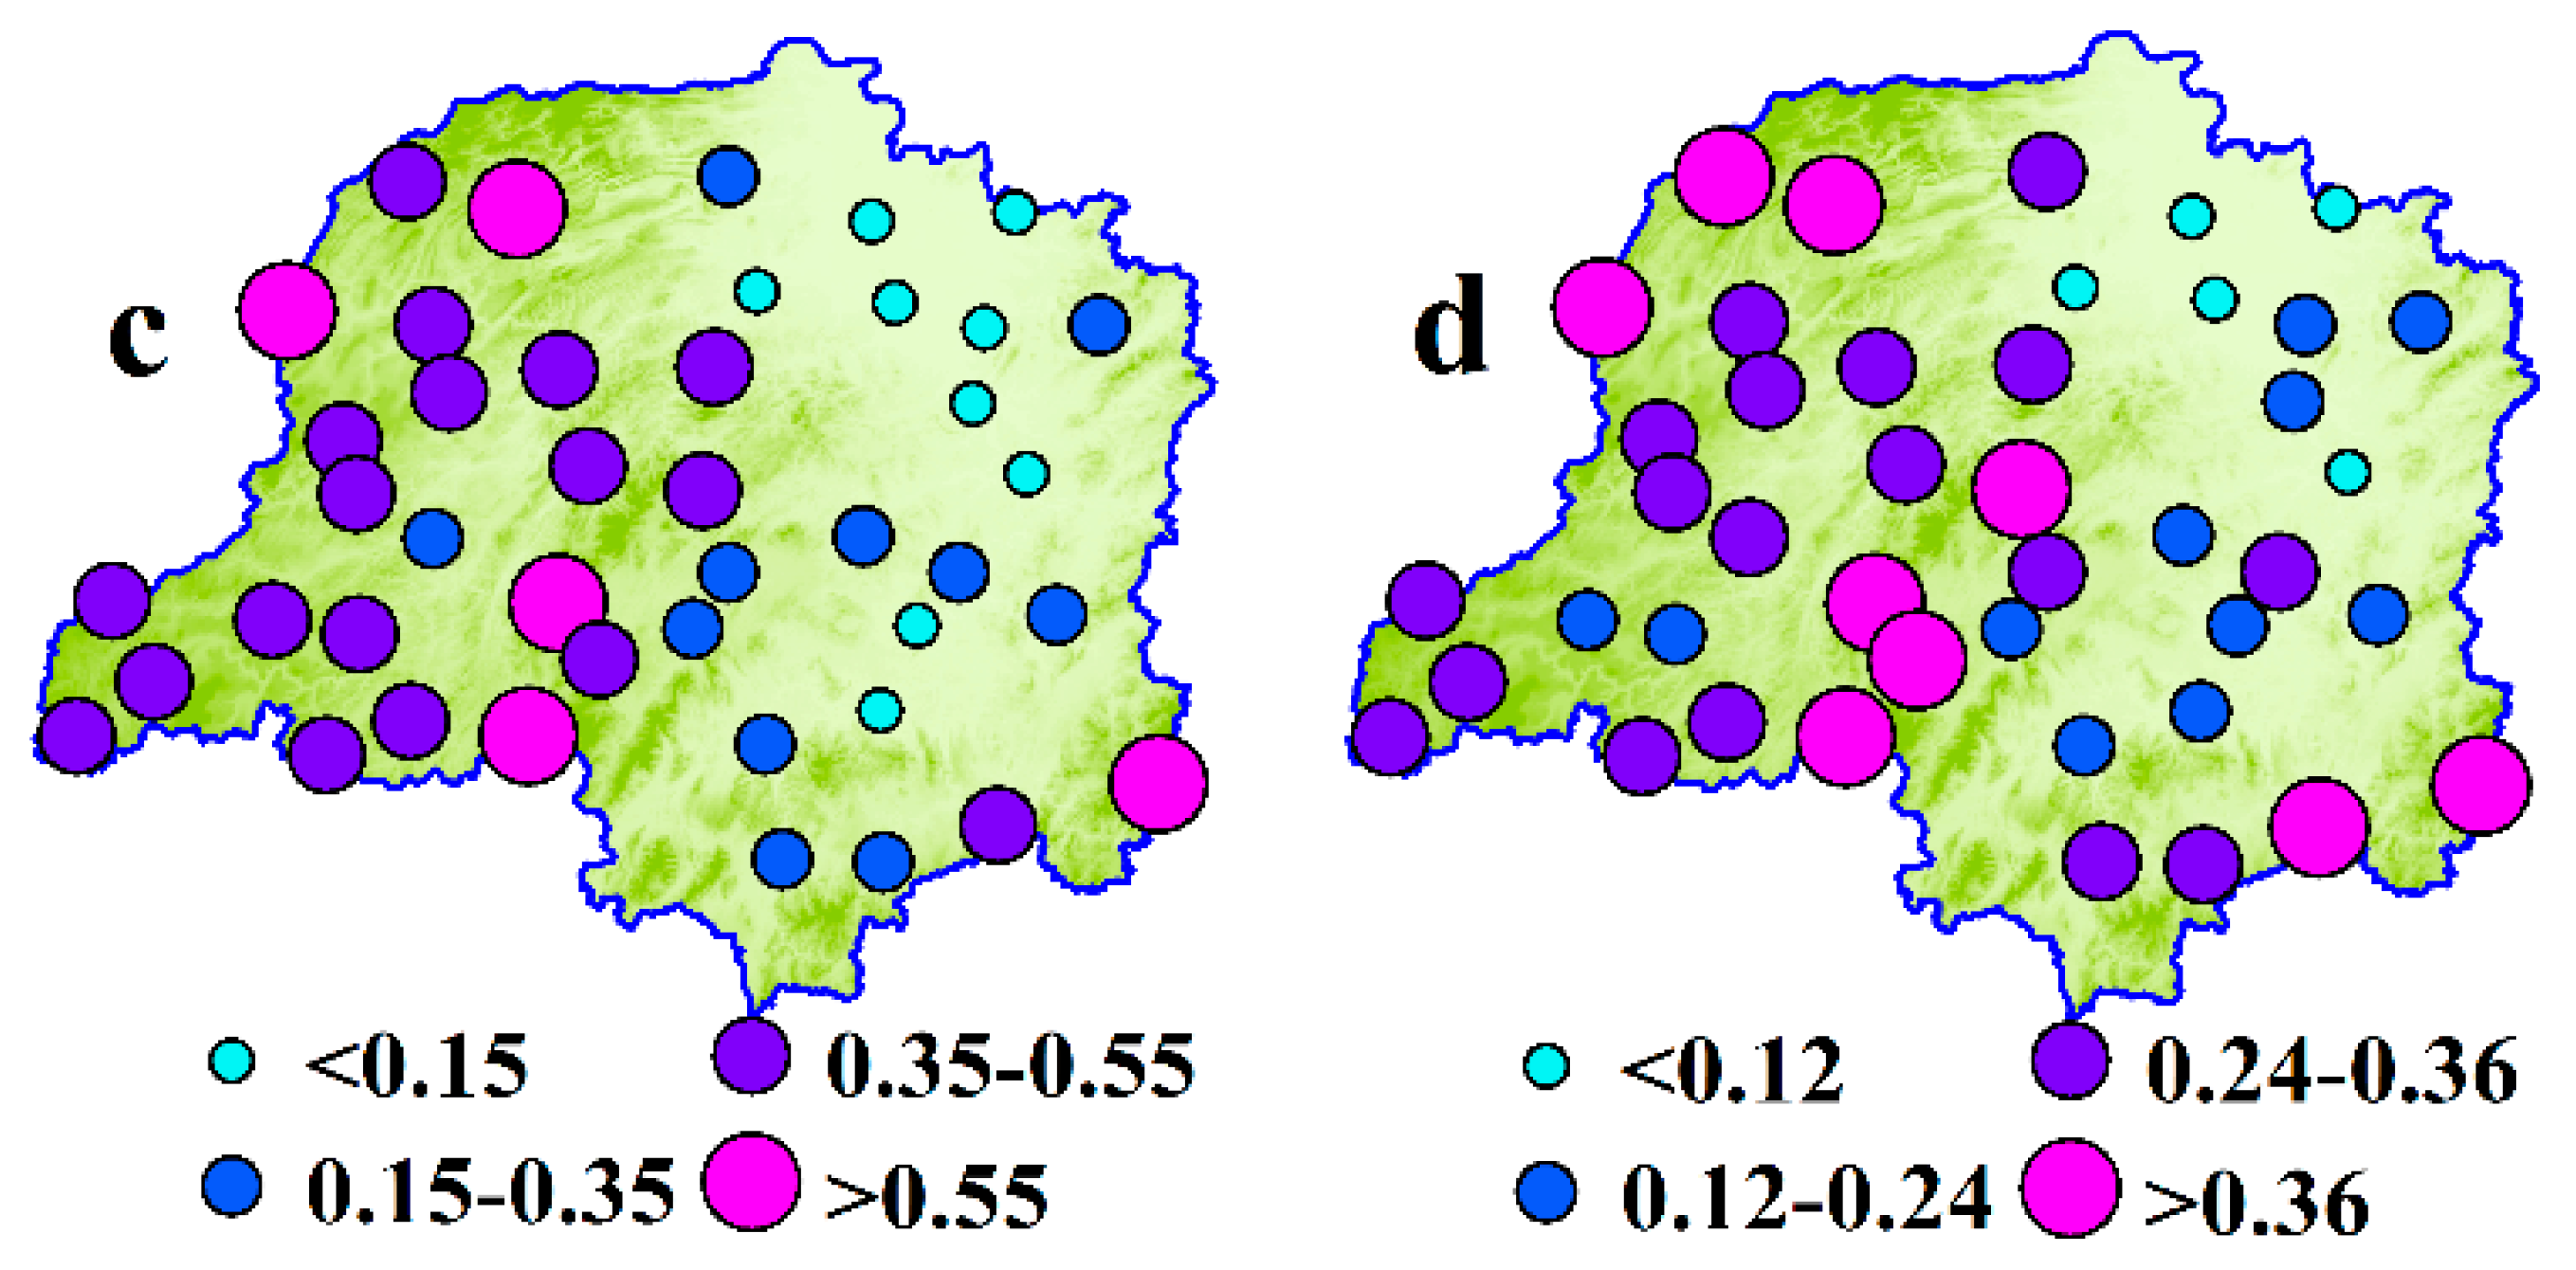
The distribution of 5-year return levels of the four precipitation indices were overall similar to each other, with high value being in the eastern and northern parts of the basin (Figure 3). The 5-year return level represents the value that the precipitation extremes could reach at a probability of 80% in a period. Higher the value is, higher the risk of floods is [1]. Please note that there are many factors affect the occurrence of floods besides the extreme precipitation, such as the land use and vegetation change, dam construction, which can change the response of a region (catchment) to the storm [47]. In the Dongting Lake Basin, ecological restoration was implemented (e.g., the “Green for Grain” program [48]) and water conservancy facilities [13,49] were constructed and improved for alleviating flood hazards in the past decades. However, these factors (e.g., land use or cover change) can decrease the occurrence frequency of floods, but cannot control the flood risks brought by the extreme precipitation, since the latter is mainly determined by the climate (weather) change though feedbacks also existing between the land surface and precipitation. Due to the improvement of floods prevention measures, a relative extreme precipitation event may not result in a real flood in the region, however, this extreme events would also bring high pressure to the water conservancy facilities. In other words, the flood risk brought by the extreme precipitation still exists even in this case. On the other hand, in this study the flood risk was implied using the 5-year return levels of the precipitation extremes. According to the historical records [
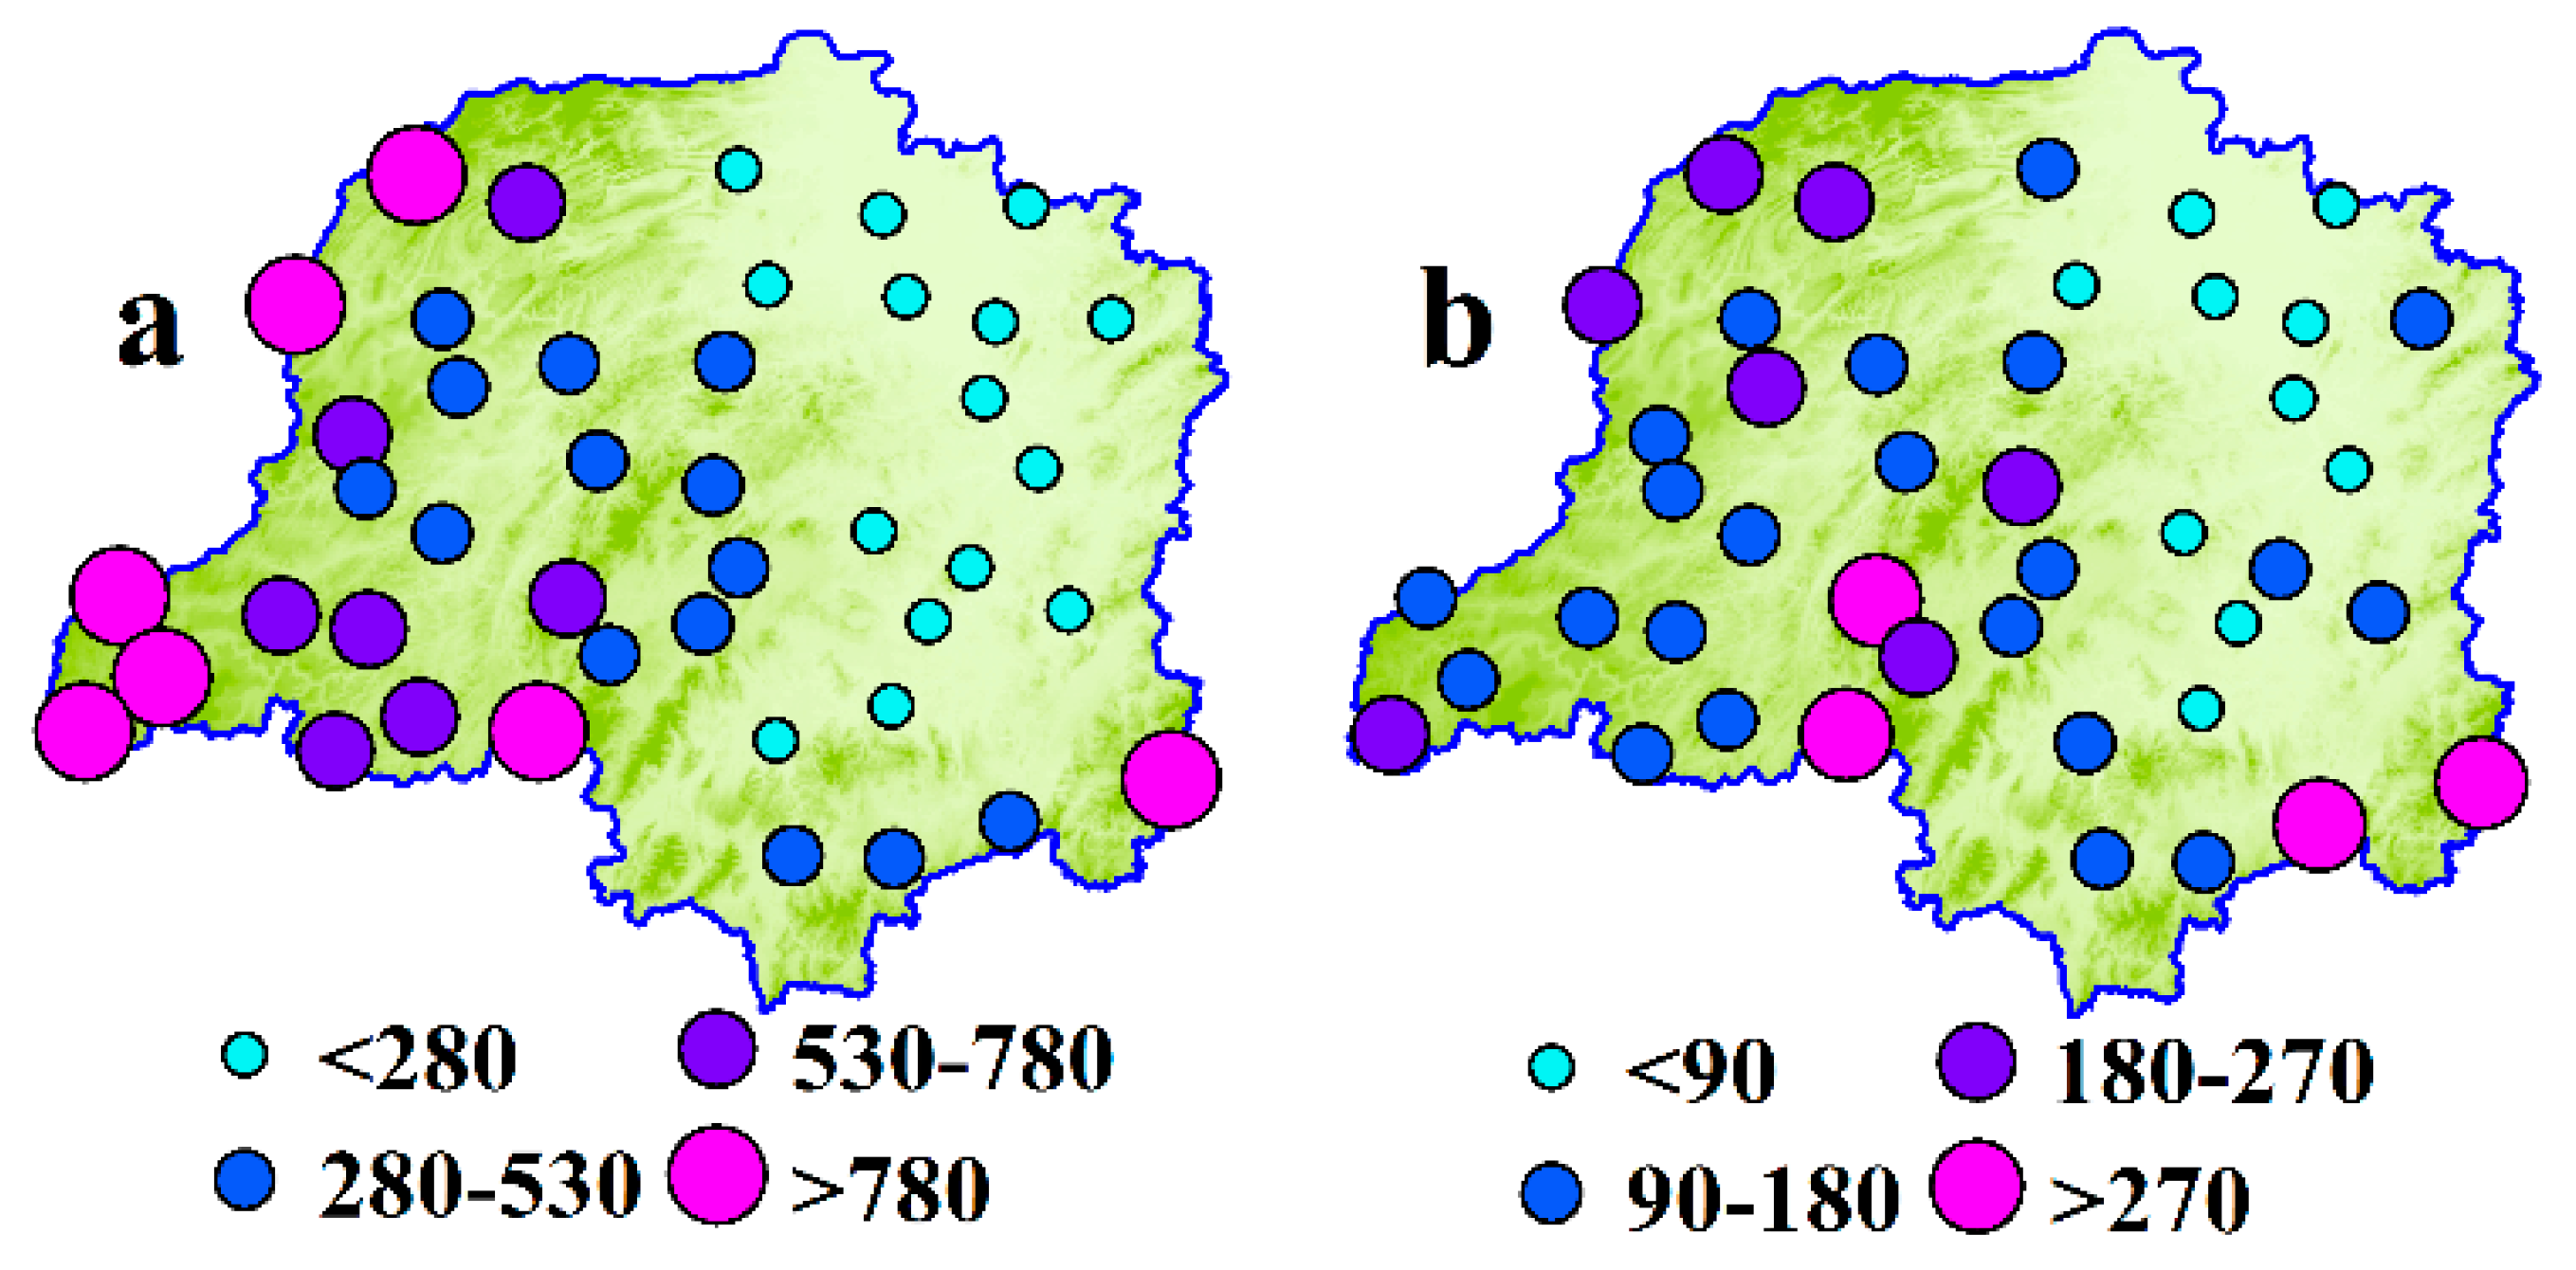
16], the return period of floods was shorter than 5 years in this catchments. Therefore, the 5-year return levels can indicate floods risks well. From this perspective, the distribution of the 5-year return levels indicated that the eastern and northern part of DTLB were in higher risks of floods. Moreover, in spring and autumn, the decreasing trends of the 5-year return levels (Figure 4) suggested that flood risks generally decreased (decreasing 5-year return levels) in the southwestern part and increased (increasing 5-year return levels) in other parts of the basin. While in summer and winter, the overall increasing 5-year return levels indicated that the flood risks increased in the entire basin. Indeed, the wet season in DTLB generally covers the period from April to September [33], within which the floods mainly occurred. However, the results indicated that risks of floods in winter increased significantly, especially in the southeastern part of the basin (Figure 3 and Figure 4). This is consistent with the records that in the winter in 1997, 2002 and 2015, terribly unusual floods occurred in the southeastern part of the basin [50,51].
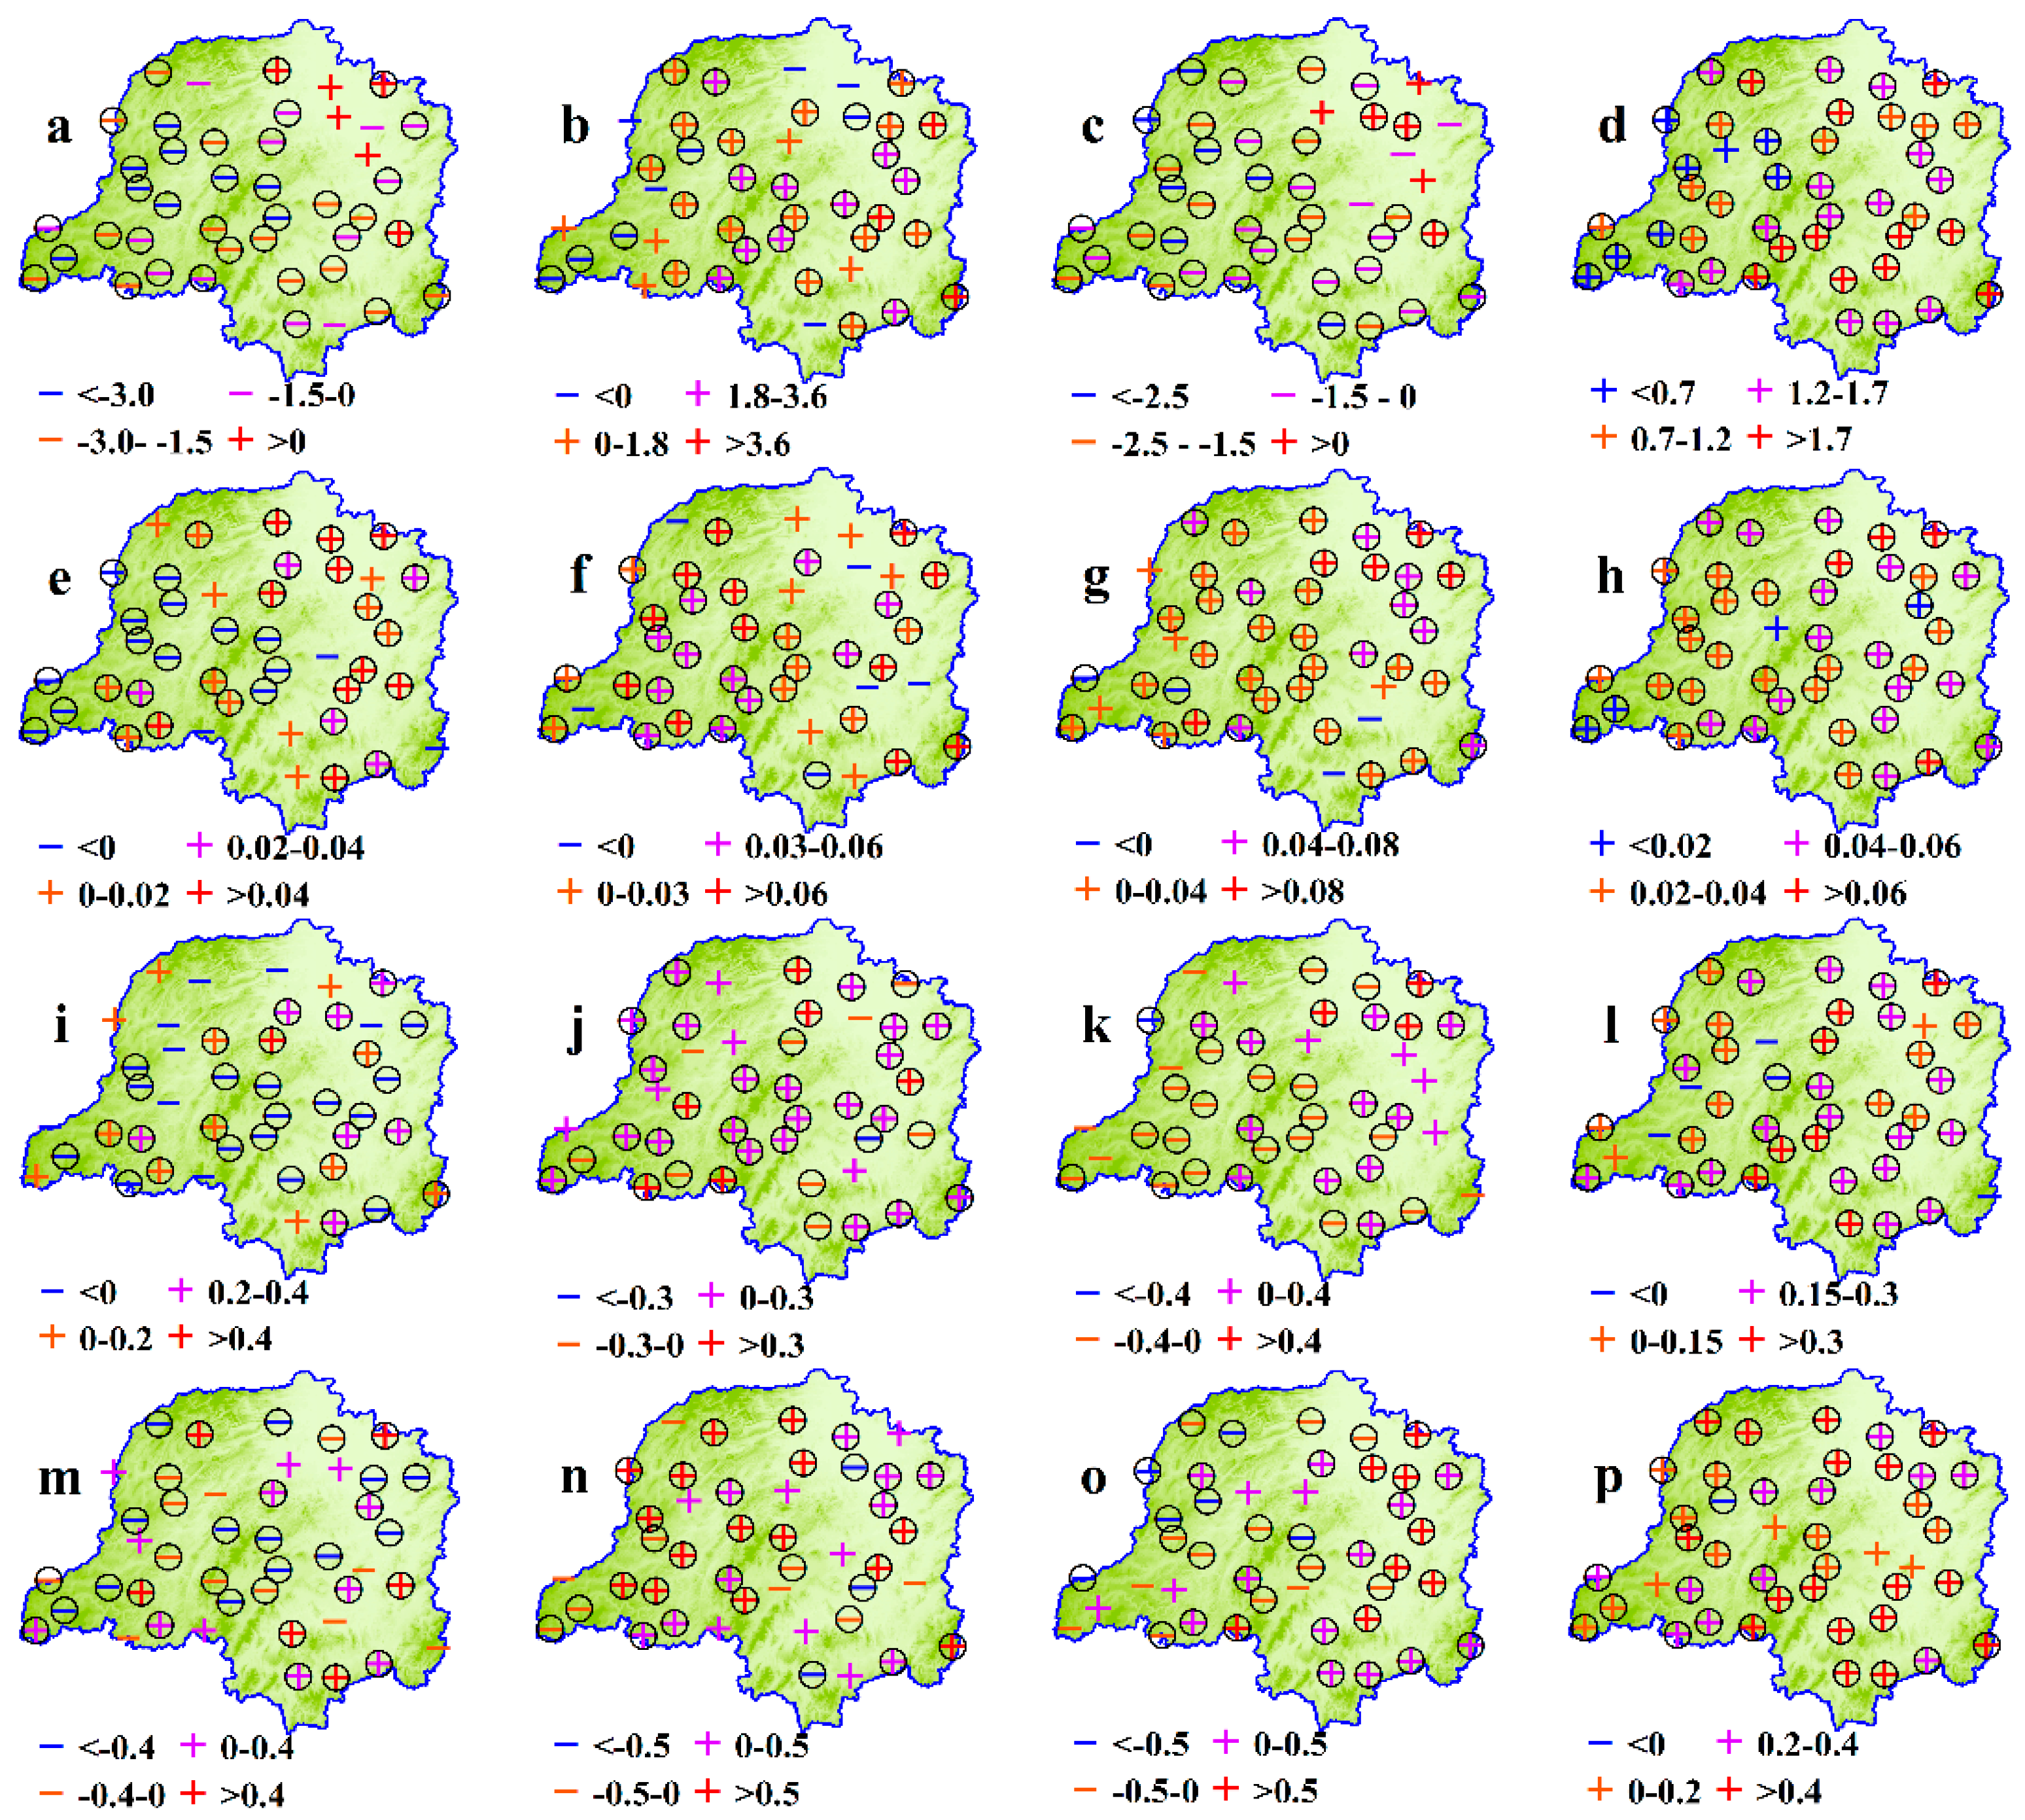
Unlike the initial indices, the changing trends for the probability-based indices (5-year return levels) were mainly significantly (Figure 4). These indicated that though the precipitation indices changed insignificantly, the risks of floods had been significantly changed in this region. Furthermore, the direction of the trends for the probability-based indices were not always the same as those for the initial indices (Table 5). These means that overall decreasing precipitation not always represent decreasing risks of floods, and vice versa. Results in Table 4 also showed that in spring, autumn and winter, the number of the stations that had increasing 5-year return levels was generally higher than that had increasing initial precipitation extremes, while in summer, the results were opposite. These alert us that in water resources management, water conservancy project construction and hazards mitigation, the policy maker should pay more attention to the risks of the precipitation extremes.
Circulation and topography are two main influencing factors for the precipitation extremes [4,17,19,23,52,53]. As showed in this study, the changing patterns of these precipitation extremes have relationships (reflected using the correlation) with these two types of factors (Table 6). In general, the R5 and Ri5 had higher correlations than the Rx15 and Rx55. The reasonable explanation is that the R and Ri were the general characteristics of the precipitation, while the Rx1 and Rx5 were individual events in a period. The influencing factors selected here were the overall characteristics of the topography or the circulation features. Furthermore, the correlations exhibited significant trends in the past decades (Table 6). Actually, correlation measures the strength of a relationship between two variables [23]. The trends of the correlation reflect the strength of the relationship between two variables, or the strength of the impacts that the independent variables (the environmental factors here) have on the dependent variable (the precipitation extremes here) [23]. From this perspective, the overall increasing (absolute) correlations for the circulation factors (AMF, AMD) indicated that the large circulation would have increasing influence on the precipitation extremes (Table 6). While the mixed changing correlations for topographic factors (ME, SE, MS and SS) (Table 6) in different seasons suggested that the influence of topography have different behaviors.
The results were partly different from Liu, Xu and Sun [23], who reported that the correlations for topographical factors generally decreased and the correlations for circulation generally increased in southwestern China at the annual scale. These may be due to the differences in time scales, topography and the climate systems. The climate in DTLB is controlled by the subtropical anticyclone, southeast monsoon, southwest monsoon, and the westerly. The evolution of these climate systems result in a unsteady climate system in this basin [54]. While the climate in southwestern China is controlled by the South Asia monsoon but also influenced by the East Asia monsoon and the Tibetan Plateau monsoon and the westerlies [32]. As for the topography, mountainous landscape distributed in the eastern, southern and western part of the basin, and low hills and flat plain in the central and northern part in DTLB (Figure 1). These are quite different from that in southwestern China [23], which generally declines from west toward east and from north toward south. Therefore, the interaction of topography and climate systems would be different in the two regions, as Shi and Durran [55] pointed out that the sensitivities of extreme precipitation to global warming were lower over mountains than over oceans and plains.
However, precipitation formation is a complex processes, and is influenced by many local and large scale factors [17,56,57,58]. The topography and circulation factors are the main factors, but also cannot fully explain the behaviors of the precipitation extremes. For example, the land cover changes (e.g., deforestation), soil moisture and urbanization also exert potential influences [58,59,60,61]. In this study, the mixed changing trends of the correlations between topographic factors and the precipitation extremes in different seasons also demonstrated the complexity of the underlying mechanisms. Results also showed that the atmospheric moisture flux (AMF) and atmospheric moisture divergence (AMD) were decreasing in most of the seasons in the past decades (
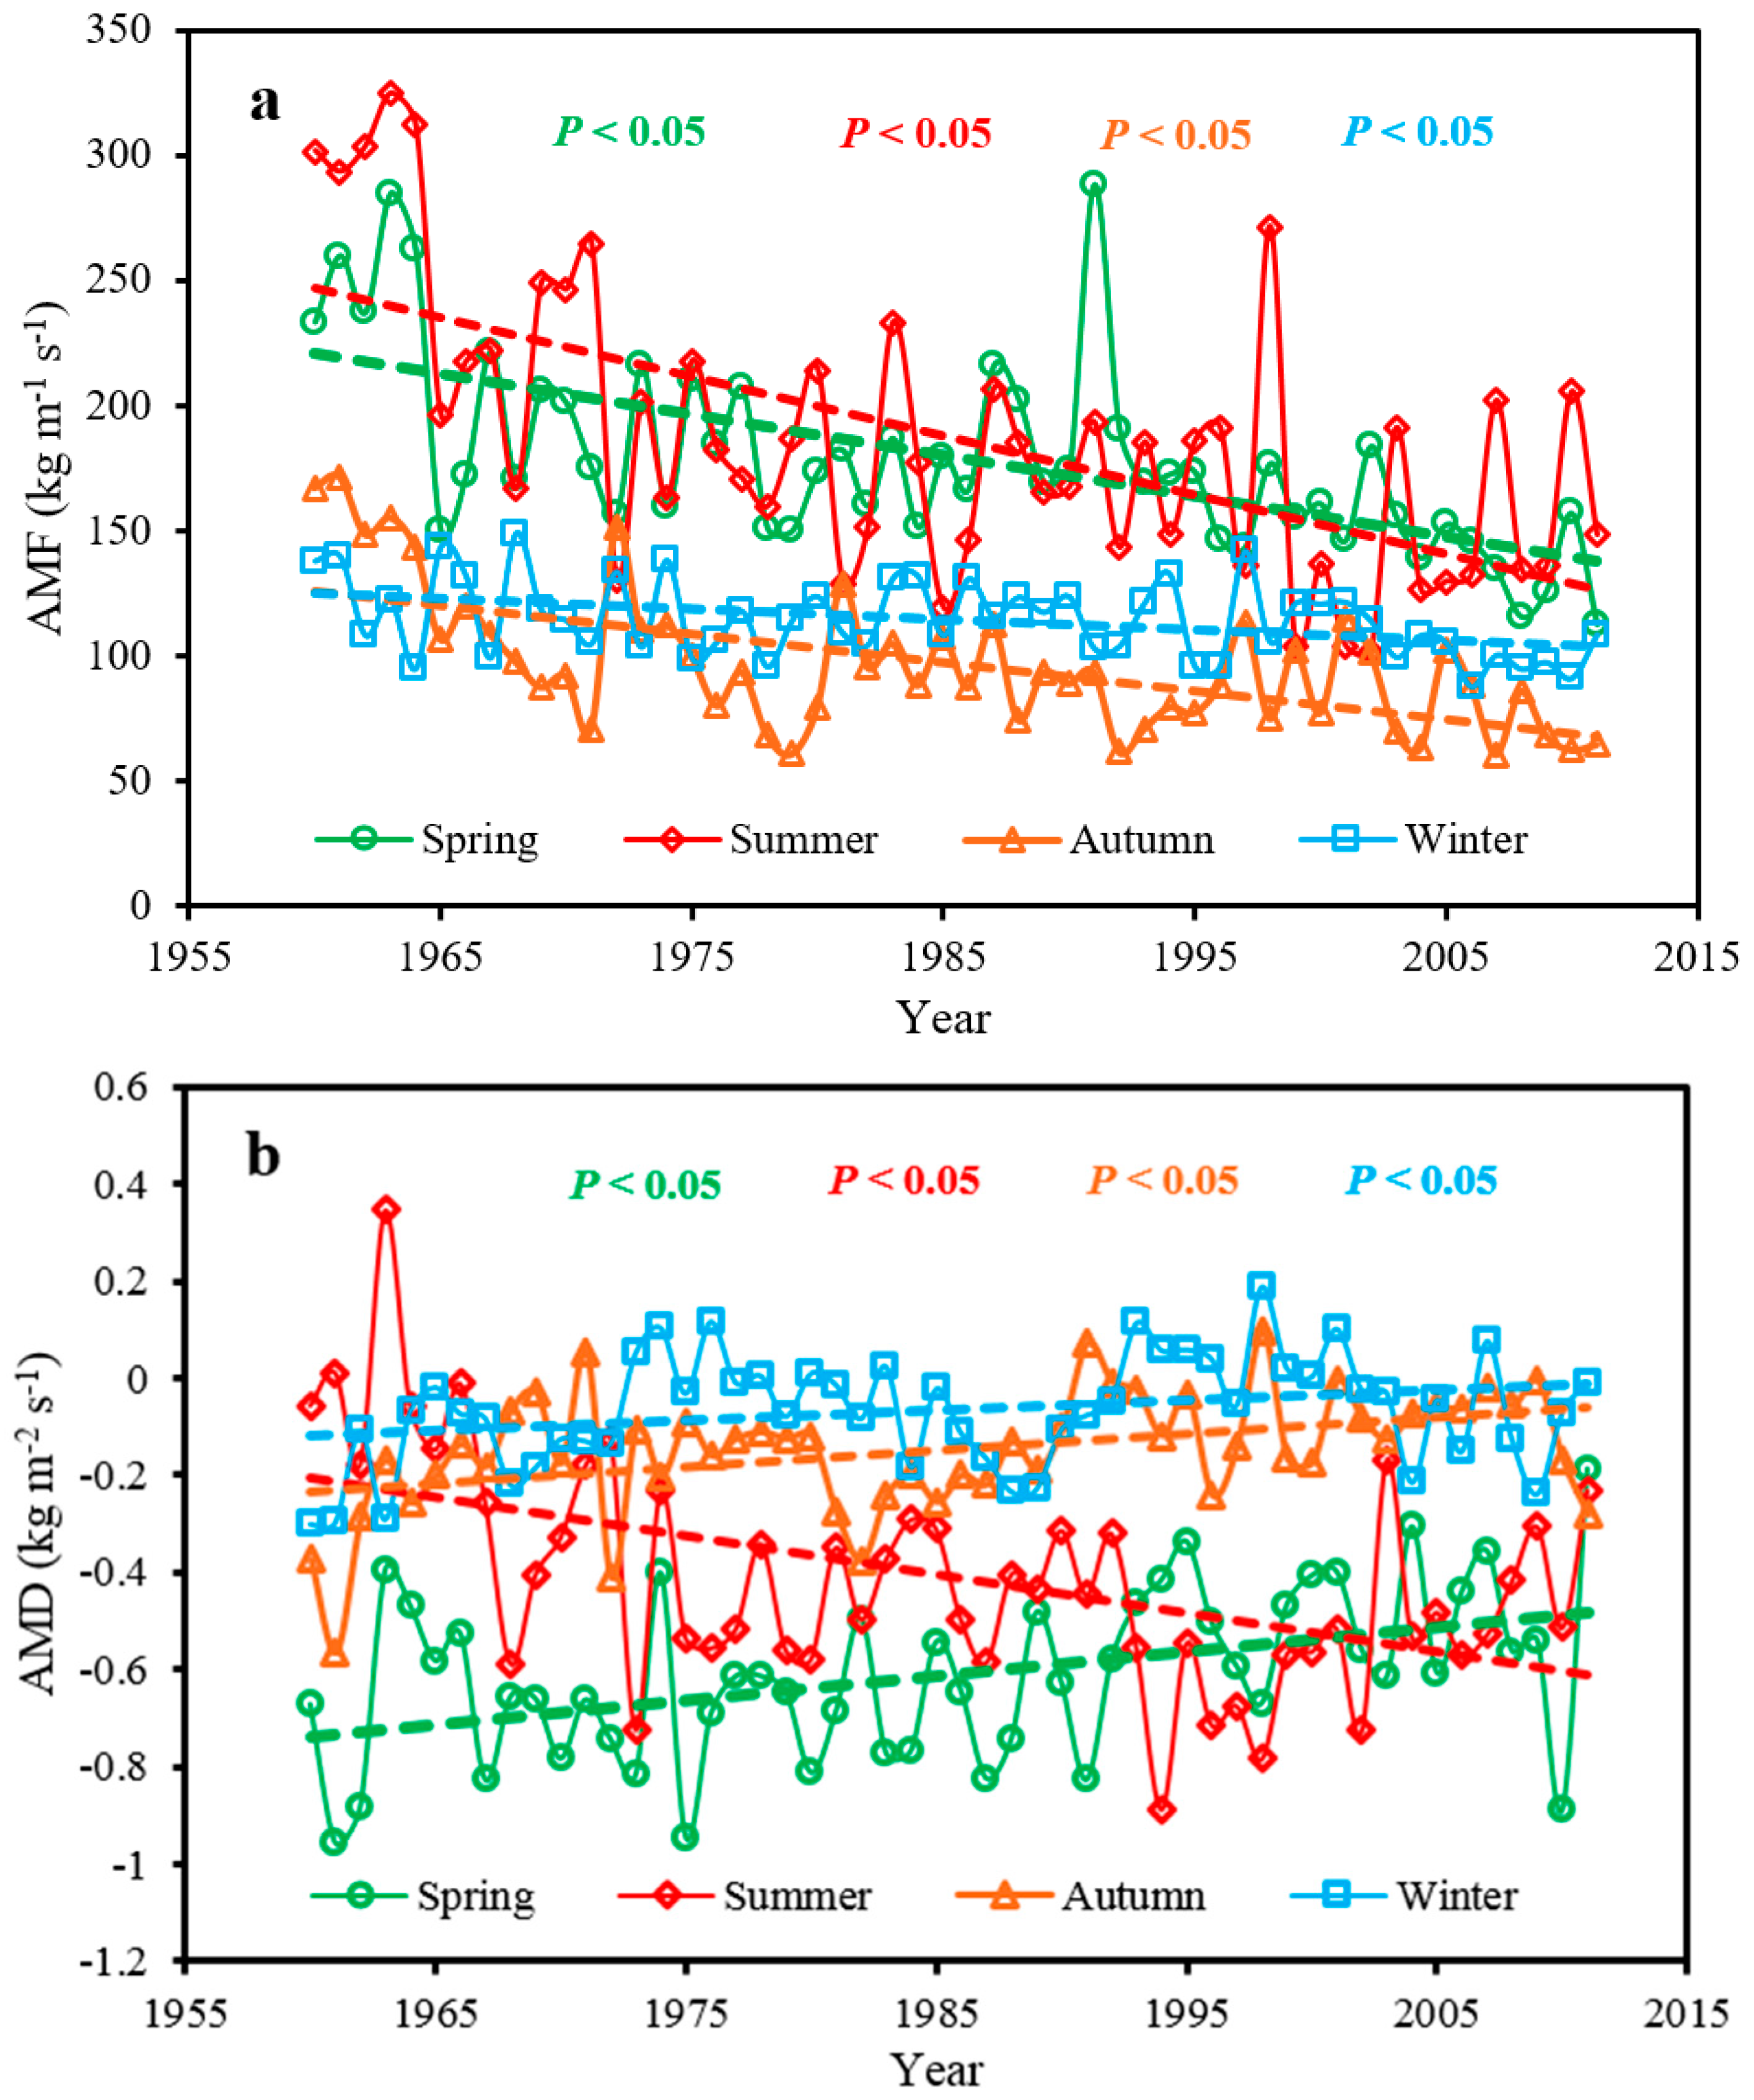
Figure 6) [62]. These trends of were not always the same to the precipitation extremes. For example, in the summer and winter, the precipitation and precipitation extremes had considerable upward trends. However, through the atmospheric moisture flux was weakening in the past decades, the atmospheric moisture budget in this region seemed to be increasing [63]. In the context of a warming environment, low-level moisture changes with warming atmosphere could fuel comparable changes in heavy precipitation events [18], many studies pointed out that global warming could lead to a global increase in extreme rainfall events [64,65]. Hence, the more detailed studies are still needed to fully understand the linkage between precipitation extremes and the local drivers, large circulation, temperature and other environmental factors.

5. Conclusions

This study investigated the changing patterns, probabilistic characteristics and the potential influencing factors of the precipitation extremes in Dongting Lake basin (DTLB) at a seasonal scale. Results showed that the DTLB had overall decreasing annual precipitation in the past decades. However, the precipitation extremes had apparent regional features and had different behaviors in different seasons. High precipitation extremes (R-total precipitation amount, Ri-precipitation intensity, Rx1-max 1 day precipitation amount, Rx5-max 5 day precipitation amount and their 5-year return levels R5, Ri5, Rx15, Rx55) were generally distributed in the eastern and northern parts of the basin, implying high risks of floods in this regions. Furthermore, overall upward trends of these precipitation extremes (5-year return levels) mainly occurred throughout the basin, indicating that the risks of floods increased in the past decades, except for some areas located in the southwestern part of the basin in the spring and autumn. Meanwhile, the directions of the trends of the 5-year return levels (R5, Ri5, Rx15, Rx55) were not always the same as the initial precipitation indices (R, Ri, Rx1, Rx5), suggesting that decreasing (increasing) precipitation extremes not always represent decreasing (increasing) risks of floods. Therefore, policy makers should pay more attention to the risks (probability characteristics) of the precipitation extremes. On the other hand, these precipitation extremes were related to the topographic (mean elevation, standard deviation of elevation, mean slope and standard deviation of slope) and circulation factors (atmospheric moisture flux (AMF) and atmospheric moisture divergence (AMD)). The gradually increasing correlations between AMF, AMD and the precipitation extremes implied that the circulation factors might have greater and increasing roles in influencing the behaviors of these precipitation extremes. However, further studies on the interaction of local drivers, large scale circulation, temperature and other potential environmental factors are in great need for understanding the underlying mechanisms of the behaviors of the precipitation extremes.

Acknowledgments

This study was supported by the National Natural Science Foundation of China (41601262), the Natural Science Foundation of Hunan Province (2016JJ4025), and the West Light Foundation of The Chinese Academy of Sciences (Y523061111). We gratefully acknowledge the meteorological, DEM data received from the China Meteorological Administration, and the Data Sharing Infrastructure of Earth System Science, respectively.

Author Contributions

Xiaoyan Zhang, and Meixian Liu designed the work; Xiaoyan Zhang and Meixian Liu did the programming and analyzed the data; Xiaoyan Zhang wrote the paper; and all co-authors took part in the writing process.

Conflicts of Interest

The authors declare no conflict of interest.

References

  1. Liu, M.X.; Xu, X.L.; Sun, A.Y.; Wang, K.L.; Liu, W.; Zhang, X.Y. Is southwestern china experiencing more frequent precipitation extremes? Environ. Res. Lett. 2014, 9. [Google Scholar] [CrossRef]
  2. Chen, W.J.; Chen, C.H.; Li, L.B.; Xing, L.T.; Huang, G.R.; Wu, C.H. Spatiotemporal analysis of extreme hourly precipitation patterns in hainan island, south china. Water-Sui 2015, 7, 2239–2253. [Google Scholar] [CrossRef]
  3. Gemmer, M.; Fischer, T.; Jiang, T.; Su, B.D.; Liu, L.L. Trends in precipitation extremes in the zhujiang river basin, south china. J. Clim. 2011, 24, 750–761. [Google Scholar] [CrossRef]
  4. Orsolini, Y.J.; Zhang, L.; Peters, D.H.W.; Fraedrich, K.; Zhu, X.H.; Schneidereit, A.; van den Hurk, B. Extreme precipitation events over north china in august 2010 and their link to eastward-propagating wave-trains across eurasia: Observations and monthly forecasting. Q. J. R. Meteorol. Soc. 2015, 141, 3097–3105. [Google Scholar] [CrossRef]
  5. Dai, A.G. Drought under global warming: A review. Wires Clim. Chang. 2011, 2, 45–65. [Google Scholar] [CrossRef]
  6. Soneja, S.; Jiang, C.S.; Upperman, C.R.; Murtugudde, R.; Mitchell, C.S.; Blythe, D.; Sapkota, A.R.; Sapkota, A. Extreme precipitation events and increased risk of campylobacteriosis in maryland, USA. Environ. Res. 2016, 149, 216–221. [Google Scholar] [CrossRef] [PubMed]
  7. Voskresenskaya, E.; Vyshkvarkova, E. Extreme precipitation over the crimean peninsula. Quat. Int. 2016, 409, 75–80. [Google Scholar] [CrossRef]
  8. Easterling, D.R.; Evans, J.L.; Groisman, P.Y.; Karl, T.R.; Kunkel, K.E.; Ambenje, P. Observed variability and trends in extreme climate events: A brief review. Bull. Am. Meteorol. Soc. 2000, 81, 417–425. [Google Scholar] [CrossRef]
  9. Wang, K.L.; Zhang, C.H.; Yi, A.J. Formation mechanism of flooding and waterlogging disasters in region of dongting lake and their ecological reducing strategies and watershed management. Chin. J. Appl. Ecol. 1998, 9, 561–568. [Google Scholar]
  10. Xue, L.Q.; Hao, Z.C.; Liu, X.Q.; Li, Y.K. Numerical simulation and optimal system scheduling on flood diversion and storage in dongting basin, china. Procedia Environ. Sci. 2012, 12, 1089–1096. [Google Scholar]
  11. Li, J.B.; Hu, W.; Yin, H.; Mao, D.H.; Zeng, F.M.; Deng, C.X.; Dai, Y. Evolutive characteristics and differentiation rules of agricultural flood in dongting lake basin from 1950 to 2009. J. Nat. Resour. 2011, 26, 1496–1505. [Google Scholar]
  12. Li, J.B.; Zheng, Y.Y.; Gao, C.H. A discussion on geographical regularity of flood and drought in hunan province. J. Nat. Resour. Disaster 2000, 9, 115–120. [Google Scholar]
  13. Li, J.B. A study on the features and causes of the flood disasters in dongting lake plain in 1996. Acta Geogr. Sin. 1998, 53, 166–173. [Google Scholar]
  14. Wang, G.J.; Jiang, T.; Wang, Y.J.; Yu, Z.Y. Characteristics of climate change in the lake dongting basin. J. Lake Sci. 2006, 18, 470–475. [Google Scholar]
  15. Zhang, X.Y.; Liu, M.X. Spatial-temperal variation and risks of precipitation extremes in dongting lake catchment. J. Nat. Sci. Hum. Norm. Univ. 2016, 39, 10–15. [Google Scholar]
  16. Su, C.; Mo, D.W.; Wang, H. Evolution of lake dongting and its flood disasters. Res. Soil Water Conserv. 2001, 8, 52–55. [Google Scholar]
  17. Chen, F.L.; Chen, H.M.; Yang, Y.Y. Annual and seasonal changes in means and extreme events of precipitation and their connection to elevation over yunnan province, china. Quat. Int. 2015, 374, 46–61. [Google Scholar] [CrossRef]
  18. Trenberth, K.E.; Dai, A.; Rasmussen, R.M.; Parsons, D.B. The changing character of precipitation. Bull. Am. Meteorol. Soc. 2003, 84, 1205–1217. [Google Scholar] [CrossRef]
  19. Zhang, J.S.; Shen, X.J.; Wang, B.L. Changes in precipitation extremes in southeastern tibet, china. Quat. Int. 2015, 380, 49–59. [Google Scholar] [CrossRef]
  20. Chen, Y.D.; Zhang, Q.; Xiao, M.Z.; Singh, V.P.; Leung, Y.; Jiang, L.G. Precipitation extremes in the yangtze river basin, china: Regional frequency and spatial-temporal patterns. Theor. Appl. Climatol. 2014, 116, 447–461. [Google Scholar] [CrossRef]
  21. Deng, H.J.; Chen, Y.N.; Shi, X.; Li, W.H.; Wang, H.J.; Zhang, S.H.; Fang, G.H. Dynamics of temperature and precipitation extremes and their spatial variation in the arid region of northwest china. Atmos. Res. 2014, 138, 346–355. [Google Scholar] [CrossRef]
  22. Fischer, T.; Su, B.; Luo, Y.; Scholten, T. Probability distribution of precipitation extremes for weather index-based insurance in the zhujiang river basin, south china. J. Hydrometeorol. 2012, 13, 1023–1037. [Google Scholar] [CrossRef]
  23. Liu, M.X.; Xu, X.L.; Sun, A. Decreasing spatial variability in precipitation extremes in southwestern china and the local/large-scale influencing factors. J. Geophys. Res.-Atmos. 2015, 120, 6480–6488. [Google Scholar] [CrossRef]
  24. Li, Z.L.; Li, Z.J.; Zhao, W.; Wang, Y.H. Probability modeling of precipitation extremes over two river basins in northwest of china. Adv. Meteorol. 2015, 2015, 374127. [Google Scholar] [CrossRef]
  25. Zhang, Q.; Li, J.F.; Singh, V.P.; Xu, C.Y. Copula-based spatio-temporal patterns of precipitation extremes in china. Int. J. Climatol. 2013, 33, 1140–1152. [Google Scholar] [CrossRef]
  26. Zhao, Y.F.; Zou, X.Q.; Cao, L.G.; Xu, X.W.H. Changes in precipitation extremes over the pearl river basin, southern china, during 1960–2012. Quat. Int. 2014, 333, 26–39. [Google Scholar] [CrossRef]
  27. Liu, R.; Liu, S.C.; Cicerone, R.J.; Shiu, C.J.; Li, J.; Wang, J.L.; Zhang, Y.H. Trends of extreme precipitation in eastern china and their possible causes. Adv. Atmos. Sci. 2015, 32, 1027–1037. [Google Scholar] [CrossRef]
  28. Xu, W.H.; Ge, D.X.; Li, N.; Zhang, S.H.; Peng, H. Characteristics of precipitation variation in the dongting lake basin during 1961–2011. Wetl. Sci. 2016, 14, 108–112. [Google Scholar]
  29. Song, J.J.; Xue, L.Q.; Liu, X.Q.; Li, Y.K.; Zhang, J.N. Variation characteristics analysis of extreme precipitation indexes in dongting lake basin. Water Resour. Power 2012, 30, 17–19. [Google Scholar]
  30. Wang, S.Q.; Xue, L.Q.; Wang, L.R.; Liu, Y.H.; Duan, Z. Multi-scale periodic features and trend prediction and theri spatial distribution pattern of precipitation in dongting lake basin. Chin. Rural Water Hydropower 2015, 3, 34–38. [Google Scholar]
  31. Huang, J.M.; Zou, Y.C.; Peng, J.D.; Cai, H.C.; Qin, H. Variation characteristics of annual precipitation from 1960 to 2011 in dongting lake area. J. Meteorol. Environ. 2013, 29, 81–86. [Google Scholar]
  32. Li, Z.X.; He, Y.Q.; Wang, P.Y.; Theakstone, W.H.; An, W.L.; Wang, X.F.; Lu, A.G.; Zhang, W.; Cao, W.H. Changes of daily climate extremes in southwestern china during 1961–2008. Glob. Planet Chang. 2012, 80–81, 255–272. [Google Scholar]
  33. Yuan, Y.J.; Zeng, G.M.; Liang, J.; Huang, L.; Hua, S.S.; Li, F.; Zhu, Y.; Wu, H.P.; Liu, J.Y.; He, X.X.; et al. Variation of water level in dongting lake over a 50-year period: Implications for the impacts of anthropogenic and climatic factors. J. Hydrol. 2015, 525, 450–456. [Google Scholar] [CrossRef]
  34. China Meteorological Data Sharing Service System. Available online: http://cdc.cma.gov.cn/deepdate.do (accessed on 13 August 2014).
  35. Zhou, T.J.; Yu, R.C. Atmospheric water vapor transport associated with typical anomalous summer rainfall patterns in China. J. Geophys. Res.-Atmos. 2005, 110. [Google Scholar] [CrossRef]
  36. NCEP/NCAR Reanalysis Data. Available online: http://www.esrl.noaa.gov/psd/data/gridded/data.ncep.reanalysis.html (accessed on 24 October 2014).
  37. Zhang, H.; Wang, X.F.; Zheng, J.Y. Slope surface complexity factor extract and analysis based on arcgis. J. Cent. China Norm. Univ. Nat. Sci. 2009, 43, 323–326. [Google Scholar]
  38. Maurice Kendall, M.G.; Gibbons, J.D. Rank Correlation Methods, 5th ed.; Charles Griffin Book Series; Oxford University Press: New York, NY, USA, 1990; pp. 1–272. [Google Scholar]
  39. Mann, H.B. Nonparametric tests against trend. Econometrica 1945, 13, 245–259. [Google Scholar] [CrossRef]
  40. Yue, S.; Wang, C.Y. Applicability of prewhitening to eliminate the influence of serial correlation on the mann-kendall test. Water Resour. Res. 2002, 38. [Google Scholar] [CrossRef]
  41. Bardossy, A.; Pegram, G.G.S. Copula based multisite model for daily precipitation simulation. Hydrol. Earth Syst. Sci. 2009, 13, 2299–2314. [Google Scholar] [CrossRef]
  42. Wilks, D.S. Interannual variability and extreme-value characteristics of several stochastic daily precipitation models. Agric. Forest. Meteorol. 1999, 93, 153–169. [Google Scholar] [CrossRef]
  43. Hu, G.W.; Mao, D.H.; Li, Z.Z.; Tian, Z.H.; Feng, C. Analysis on the runoff characteristics in and out dongting lake in recent 60 years. Sci. Geogr. Sin. 2014, 34, 89–96. [Google Scholar]
  44. Sun, Z.D.; Huang, Q.; Jiang, J.H. Changes of major ecological and environmental issues in dongting lake region. Resour. Environ. Yangtze Basin 2011, 20, 1108–1113. [Google Scholar]
  45. Feng, Q.; Guo, X.D.; Zhao, W.W.; Qiu, Y.; Zhang, X. A comparative analysis of runoff and soil loss characteristics between “extreme precipitation year” and “normal precipitation year” at the plot scale: A case study in the loess plateau in china. Water-Sui 2015, 7, 3343–3366. [Google Scholar] [CrossRef]
  46. Wang, Y.; Yan, Z. Trends in seasonal total and extreme precipitation over china during 1961–2007. Atmos. Ocean Sci. Lett. 2009, 2, 165–171. [Google Scholar]
  47. Viglione, A.; Bloschl, G. On the role of storm duration in the mapping of rainfall to flood return periods. Hydrol. Earth Syst. Sci. 2009, 13, 205–216. [Google Scholar] [CrossRef]
  48. Li, X.M.; Chen, W.J. Analysis on benefit evaluation and the construction of ecological forestry in plain areas china: Take dongting lake region as an example. Econ. Geogr. 2010, 30, 1729–1734. [Google Scholar]
  49. Li, J.B.; Wang, K.L.; Qin, J.X.; Xiao, H.; Chao, L. The evolution of annual runoff and sediment in the dongting lake and their driving forces. Acta Geogr. Sin. 2005, 60, 503–510. [Google Scholar]
  50. Huang, B.; Luo, D. Meteorologists Explain the Potential Reasons for Recent Precipitation and Rarely Seen Winter Floods in Hunan Province. Available online: http://www.cma.gov.cn/2011xwzx/2011xqxxw/2011xqxyw/201511/t20151117_297553.html (accessed on 17 November 2015).
  51. Hao, J.Y. Rarely Seen Winter Flood in Dongting Lake Breaks the Food Chains and Threatens Tens of Thousands of Migrant Birds. Available online: http://hunan.ifeng.com/news/detail_2015_11/23/4583537_0.shtml (accessed on 23 November 2015).
  52. Zhang, Q.; Xiao, M.Z.; Li, J.F.; Singh, V.P.; Wang, Z.Z. Topography-based spatial patterns of precipitation extremes in the poyang lake basin, china: Changing properties and causes. J. Hydrol. 2014, 512, 229–239. [Google Scholar] [CrossRef]
  53. Simmonds, I.; Bi, D.H.; Hope, P. Atmospheric water vapor flux and its association with rainfall over china in summer. J. Clim. 1999, 12, 1353–1367. [Google Scholar] [CrossRef]
  54. Jiang, M.Y.; Shi, P.J.; Cheng, Z.H.; Hu, J.D.; Chen, H. Natural Disaster System and Insurance Research in Hunan Province; Ocean Press: Beijing, China, 1993. [Google Scholar]
  55. Shi, X.M.; Durran, D. Sensitivities of extreme precipitation to global warming are lower over mountains than over oceans and plains. J. Clim. 2016, 29, 4779–4791. [Google Scholar] [CrossRef]
  56. Mao, R.; Gong, D.Y.; Yang, J.; Bao, J.D. Linkage between the arctic oscillation and winter extreme precipitation over central-southern china. Clim. Res. 2011, 50, 187–201. [Google Scholar] [CrossRef]
  57. Wang, F.; Yang, S.; Higgins, W.; Li, Q.P.; Zuo, Z.Y. Long-term changes in total and extreme precipitation over china and the united states and their links to oceanic-atmospheric features. Int. J. Climatol. 2014, 34, 286–302. [Google Scholar] [CrossRef]
  58. Zhao, M.; Pitman, A.J. The impact of land cover change and increasing carbon dioxide on the extreme and frequency of maximum temperature and convective precipitation. Geophys. Res. Lett. 2002, 29. [Google Scholar] [CrossRef]
  59. Wei, J.F.; Su, H.; Yang, Z.L. Impact of moisture flux convergence and soil moisture on precipitation: A case study for the southern united states with implications for the globe. Clim. Dyn. 2016, 46, 467–481. [Google Scholar] [CrossRef]
  60. Koster, R.D.; Dirmeyer, P.A.; Guo, Z.C.; Bonan, G.; Chan, E.; Cox, P.; Gordon, C.T.; Kanae, S.; Kowalczyk, E.; Lawrence, D.; et al. Regions of strong coupling between soil moisture and precipitation. Science 2004, 305, 1138–1140. [Google Scholar] [CrossRef] [PubMed]
  61. Asharaf, S.; Dobler, A.; Ahrens, B. Soil moisture-precipitation feedback processes in the indian summer monsoon season. J. Hydrometeorol. 2012, 13, 1461–1474. [Google Scholar] [CrossRef]
  62. Jiang, Y.; Zhai, P.M.; Wang, Q. Variability of summer atmospheric moisture flux and its effects on precipitation over east china. Acta Meteorol. Sin. 2005, 47, 469–478. [Google Scholar]
  63. Zhang, Z.X.; Zhang, Q.; Xu, C.Y.; Liu, C.L.; Jiang, T. Atmospheric moisture budget and floods in the yangtze river basin, china. Theor. Appl. Climatol. 2009, 95, 331–340. [Google Scholar] [CrossRef]
  64. Min, S.K.; Zhang, X.B.; Zwiers, F.W.; Hegerl, G.C. Human contribution to more-intense precipitation extremes. Nature 2011, 470, 378–381. [Google Scholar] [CrossRef] [PubMed]
  65. Allan, R.P.; Soden, B.J. Atmospheric warming and the amplification of precipitation extremes. Science 2008, 321, 1481–1484. [Google Scholar] [CrossRef] [PubMed]
Figure 1. The topographical map and distribution of the meteorological stations in DTLB.
Water 08 00558 g001
Figure 2. Trends for the four precipitation indices. (ad): trends for total precipitation amount (R) in spring, summer, autumn and winter, respectively, and similarly (ep) shows the trends for the Ri, Rx1 and Rx5 in the four seasons. The “+” and “−” represent increasing and decreasing trends, respectively, and the black circles indicate significance at p < 0.05.
Water 08 00558 g002
Figure 3. Distribution of the 5-year return levels for the four precipitation indices. (ad): the 5-year return levels for total seasonal precipitation amount (R5) in spring, summer, autumn and winter, respectively, and similarly the (ep) shows the 5-year return levels for the Ri5, Rx15 and Rx55 in the four seasons.
Water 08 00558 g003
Figure 4. Trends of the 5-year return levels for the four precipitation indices. (ad) changing trends for R5 in spring, summer, autumn and winter, respectively, and similarly the (ep) shows the trends for the Ri5, Rx15 and Rx55 in the four seasons. The “+” and “−” represent increasing and decreasing trends respectively, and the black circle indicate significance at p < 0.05.
Water 08 00558 g004
Figure 5. Distribution of the ME (a), SE (b), MS (c) and SS (d).
Water 08 00558 g005aWater 08 00558 g005b
Figure 6. Changing patterns of the (a) atmospheric moisture flux (AMF) and (b) atmospheric moisture divergence (AMD) in varying seasons in Dongting Lake Basin.
Water 08 00558 g006
Table 1. Precipitation indices and their definitions in this study.
IndicesUnitDefinition
seasonal total precipitation (R)mmTotal precipitation in a season
simple precipitation intensity (Ri)mm/dayThe mean precipitation in the rainy days in a season
max 1 day precipitation amount (Rx1)mmMaximum daily precipitation in a season
max 5 day precipitation amount (Rx5)mmseasonal maximum consecutive 5 days precipitation
Table 2. Definition and calculation methods of the topographic factors.
FactorsAbbreviationsEquations *
Mean elevationME (m) ME = 1 n 1 n E l e i (1)
standard deviation of elevationSE (m) SE = 1 n 1 n ( E l e i E l e ¯ ) 2 (2)
Mean slopeMS (°) MS = 1 n 1 n β i (3)
standard deviation of slopeSS (°) SS = 1 n 1 n ( β i β ¯ ) 2 (4)
Notes: * β is the slope, Elei is the elevation of each element (i), and n is the number of elements in the circular area.
Table 3. Changing trends for the regional mean R (mm∙season−1∙decade−1), Ri (mm∙day−1∙decade−1), Rx1 (mm∙day−1∙decade−1) and Rx5 (mm∙(5·days)−1∙decade−1) in different seasons.
IndicesSpringSummerAutumnWinterIndicesSpringSummerAutumnWinter
R−9.307.40−10.295.91Rx1−0.280.87−0.260.97
Ri0.060.34 *0.230.25Rx5−1.741.66−0.792.30
Note: * The bold number in the table means significance at p < 0.05.
Table 4. Numbers of stations that had increasing primary precipitation indices and had increasing 5-year return levels, and numbers of the stations that had different trend directions in initial indices and 5-year return levels in different seasons.
SeasonsRRiRx1Rx5
R5 (1)R (2)NDiff (3)Ri5RiNDiffRx15Rx1NDiffRx55Rx5NDiff
Spring63727231220201018911
Summer333413374143334931327
Autumn64439365191714242010
Winter43421434303839342393
Note: (1) Number of stations that had increasing R5; (2) number of stations that had increasing R; (3) number of the stations had different trends in R5 and R, the same in the other columns.
Table 5. Trends for the 5-year return levels for the four precipitation indices (mm∙year−1∙decade−1).
IndicesSpringSummerAutumnWinterIndicesSpringSummerAutumnWinter
R5−16.95 *11.56−14.2912.82Rx150.061.110.021.71
Ri50.130.360.370.41Rx55−0.852.380.613.11
Note: * The bold number in the table means significance at p < 0.05.
Table 6. Correlation between the precipitation extremes and the topographic and circulation factors and the corresponding trends.
IndicesCorrelationsChanging Trends of Correlations (× 10−4∙Year−1) **
MSSSMESEAMFAMDMSSSMESEAMFAMD
R5−0.26−0.09−0.50 *−0.140.55−0.605.26.14.05.20.14.5
0.540.440.460.42−0.490.062.14.2−3.73.4−11.8−10.4
0.280.370.140.320.05−0.03−11.8−12.3−9.1−11.43.95.7
−0.37−0.20−0.56−0.210.59−0.75−1.1−1.5−1.1−1.20.51.0
Ri5−0.46−0.30−0.71−0.360.24−0.665.97.05.25.80.43.5
−0.37−0.35−0.51−0.40−0.14−0.65−6.6−3.6−3.5−4.21.10.6
−0.31−0.21−0.52−0.26−0.41−0.387.612.27.29.1−8.713.0
−0.49−0.34−0.69−0.370.39−0.750.81.11.21.1−2.30.4
Rx15−0.14−0.09−0.31−0.110.13−0.273.04.62.74.7−2.55.1
0.010.04−0.13−0.04−0.24−0.355.76.410.0−1.65.62.2
0.060.16−0.060.10−0.05−0.26−4.5−13.512.3−7.73.916.2
−0.34−0.17−0.49−0.180.61−0.760.9−0.20.10.21.1−4.2
Rx55−0.24−0.11−0.44−0.130.45−0.47−0.51.0−0.90.16.4−1.4
0.160.12−0.030.08−0.21−0.326.36.40.65.20.24.0
0.180.290.070.260.15−0.16−17.6−21.6−4.4−16.113.218.3
−0.36−0.22−0.55−0.220.55−0.780.40.4−0.30.70.2−0.6
Notes: * The bold number in the table means that the correlation or the trends were significant at p = 0.05; ** the changing trends was calculated based on the absolute value of the correlations.

