Article

Integrated Water Resources Management in a Lake System: A Case Study in Central Italy

by
Stefano Casadei
1,*,
Arnaldo Pierleoni
2 and
Michele Bellezza
3
1
Department of Civil and Environmental Engineering, University of Perugia, Borgo XX Giugno 74, 06121 Perugia, Italy
2
Civil Engineering Section, Niccolò Cusano University, Via Don Carlo Gnocchi 3, 00166 Roma, Italy
3
T4E University of Perugia Spin-Off, Via Birago 18, 06124 Perugia, Italy
*
Author to whom correspondence should be addressed.
Water 2016, 8(12), 570; https://doi.org/10.3390/w8120570
Submission received: 5 October 2016 / Revised: 25 November 2016 / Accepted: 29 November 2016 / Published: 5 December 2016

Abstract

:
Lake Trasimeno is a closed lake in Central Italy and in historically its water level has been affected by wide fluctuations mostly depending on the climate. The lake has suffered many water crises due to water scarcity and in recent decades, droughts have also severely affected the economic and environmental situation. The aim of this study was to analyze the possibility of limiting these severe level fluctuations by evaluating of feasible water resource management policies that could also reduce the environmental stress of this area. Therefore, a specific decision support system (DSS) has been developed in order to simulate different scenarios for the entire water system of the Trasimeno area. In particular, the hydrological model implemented in the DSS allowed for the simulation and validation of different management policy hypotheses for the water resource in order to mitigate environmental and water crises for the Lake Trasimeno. Results indicated that it is possible to transfer a certain amount of water from nearby reservoirs without affecting the availability of the resource for specific users. In this way, Lake Trasimeno can benefit both from an increase in water levels in the lake, so a possible better situation in quantitatively and qualitatively.

1. Introduction

Lake Trasimeno is a shallow lake of orogenic origin, dating back one million and seven hundred years. Its origin is mainly alluvial and tectonic because of the crustal movements that occurred during the mid-Quaternary period, involving the western side of Umbria. Many researchers have supposed that crustal movements brought about the separation of Val di Chiana from the nearby depression occupied by the lake [1]. This can also be observed from Leonardo’s famous map [2], now in the Royal Library of Windsor, which shows this area around the year 1500. In the last century, the lowest level of the lake was 254.69 m above sea level (m a.s.l.) in October 1958 (Figure 1). Then, the natural catchment basin was enlarged in years 1960–1962, allowing the lake to rapidly recover from drought.
Lake Trasimeno is continuously subject to level fluctuations, but nowadays climate change [3] and water quality [4] need to be taken into account in order to manage the level of the lake in the next years. For this reason it is important to project an integrated water resources management plan for the Upper Tiber River Basin, where two artificial reservoirs have been projected and partly built: the Montedoglio reservoir on the Tiber River and the Casanova reservoir on the Chiascio River (Figure 2). The storage capacities of the Montedoglio and Casanova reservoirs are, respectively, 142 and 185 Mm3. They are multi-purpose artificial basins and their long-term management may involve the area of Lake Trasimeno for both irrigation and municipal use in order to minimize water withdrawal from Lake Trasimeno during dry periods.
In this context, it is necessary to evaluate the management policies of the available resource stored in the artificial reservoirs on the basis of the water demand of these uses. Among these Lake Trasimeno itself should be included as a multiple use, i.e., environmental [5], municipal and agricultural. Therefore a mathematical model that can manage the water resource at the basin scale and that is capable of simulating different management scenarios has been developed [6]. The model is embedded in a Decision Support System (DSS).
Decision support systems are intended to help people make decisions, usually in complicated situations [7,8]. This can be obtained with the support of web tools [9,10,11,12], optimization models [13,14,15], simulation models [16,17], statistic and intelligent methods [18] and also combined with GIS models [19]. Applications can be found in different fields involving water resources management, such as agriculture especially when quantity or quality issues are concearned [20,21,22,23]. Very important studies can be found also in lake level management, for example through the collaborative modeling process [24] or in predicting water level fluctuations [25,26], in other works the role of hydrological processes and water diversion are analyzed [27,28,29].
In this study, the solution proposed is the integration of a DSS and a hydrologic model to simulate the levels of Lake Trasimeno, thus combining the benefits of integrated hydrologic models as components of a decision support system. A simulation model (SimBaT-DSS) has been designed and built by the authors in order to manage water resources in the Tiber River Basin (Tiber Basin Simulation), the second largest basin in Italy. Special attention was given to the schematization of the river network, adopting a sequential topological order from upstream to downstream. The programming language used to write the software was Java, because by means of virtual machine technology, it can run on computers with different operating systems.
This model differs from the others mentioned in the references, because it does not use optimization criteria, which is a constrain from social and political points of view in an area with different fields of development. Instead, it use a simulation policy of water management based on the “Pareto efficiency” philosophy, which is implemented in an algorithm called “balanced priority”. The link between simulation criteria and this algorithm leads to a water deficit equitably shared. In fact, in the case of water scarcity, each user will contribute to reducing the deficit by decreasing its own water demand according to previously simulated and shared scenarios. From the point of view of the temporal scale, the simulation can be run with monthly and also weekly steps, so that runoff time can be omitted according to the size of the basin, and at the same time good precision can be obtained in defining critical periods. These features place the SimBaT system in a position of particular interest among decision support tools in order to facilitate water diplomacy, improve communication between stakeholders, implement integrated water resources management (IWRM) [30] and propose a proactive approach [31] to mitigate the possible effects resulting from increase in water demand and/or water deficits, which are expected to be more likely in future scenarios [32].
The present paper is divided into three main sections. After describing the methodology and issues involved in the modeling approach in Section 2, the application of the model to the case study with the results obtained from the water resources management model and in improving the level of Lake Trasimeno are presented in Section 3. The main conclusions of this work are summarized in Section 4.

2. Materials and Methods

The methodology adopted focuses on evaluating of interventions that may lead to an improvement of hydrological and environmental conditions of Lake Trasimeno. For this purpose a water management model was developed at the basin scale, which combines its outputs with a specific simulation model for the levels of Lake Trasimeno. This procedure allows for evaluation of the effects of water resource management policies on the specific environmental problem of Lake Trasimeno, which is closely linked to the fluctuation of water levels of the lake and to the possibility of increasing the water exchange. The first DSS (see Section 2.1) evaluates the effect of reserving a specific volume of water for Lake Trasimeno, in a complex system that involves two large reservoirs and many water users. The second model (see Section 2.2) simulates how the levels of the lake can increase by means of this possible water volume transfer.

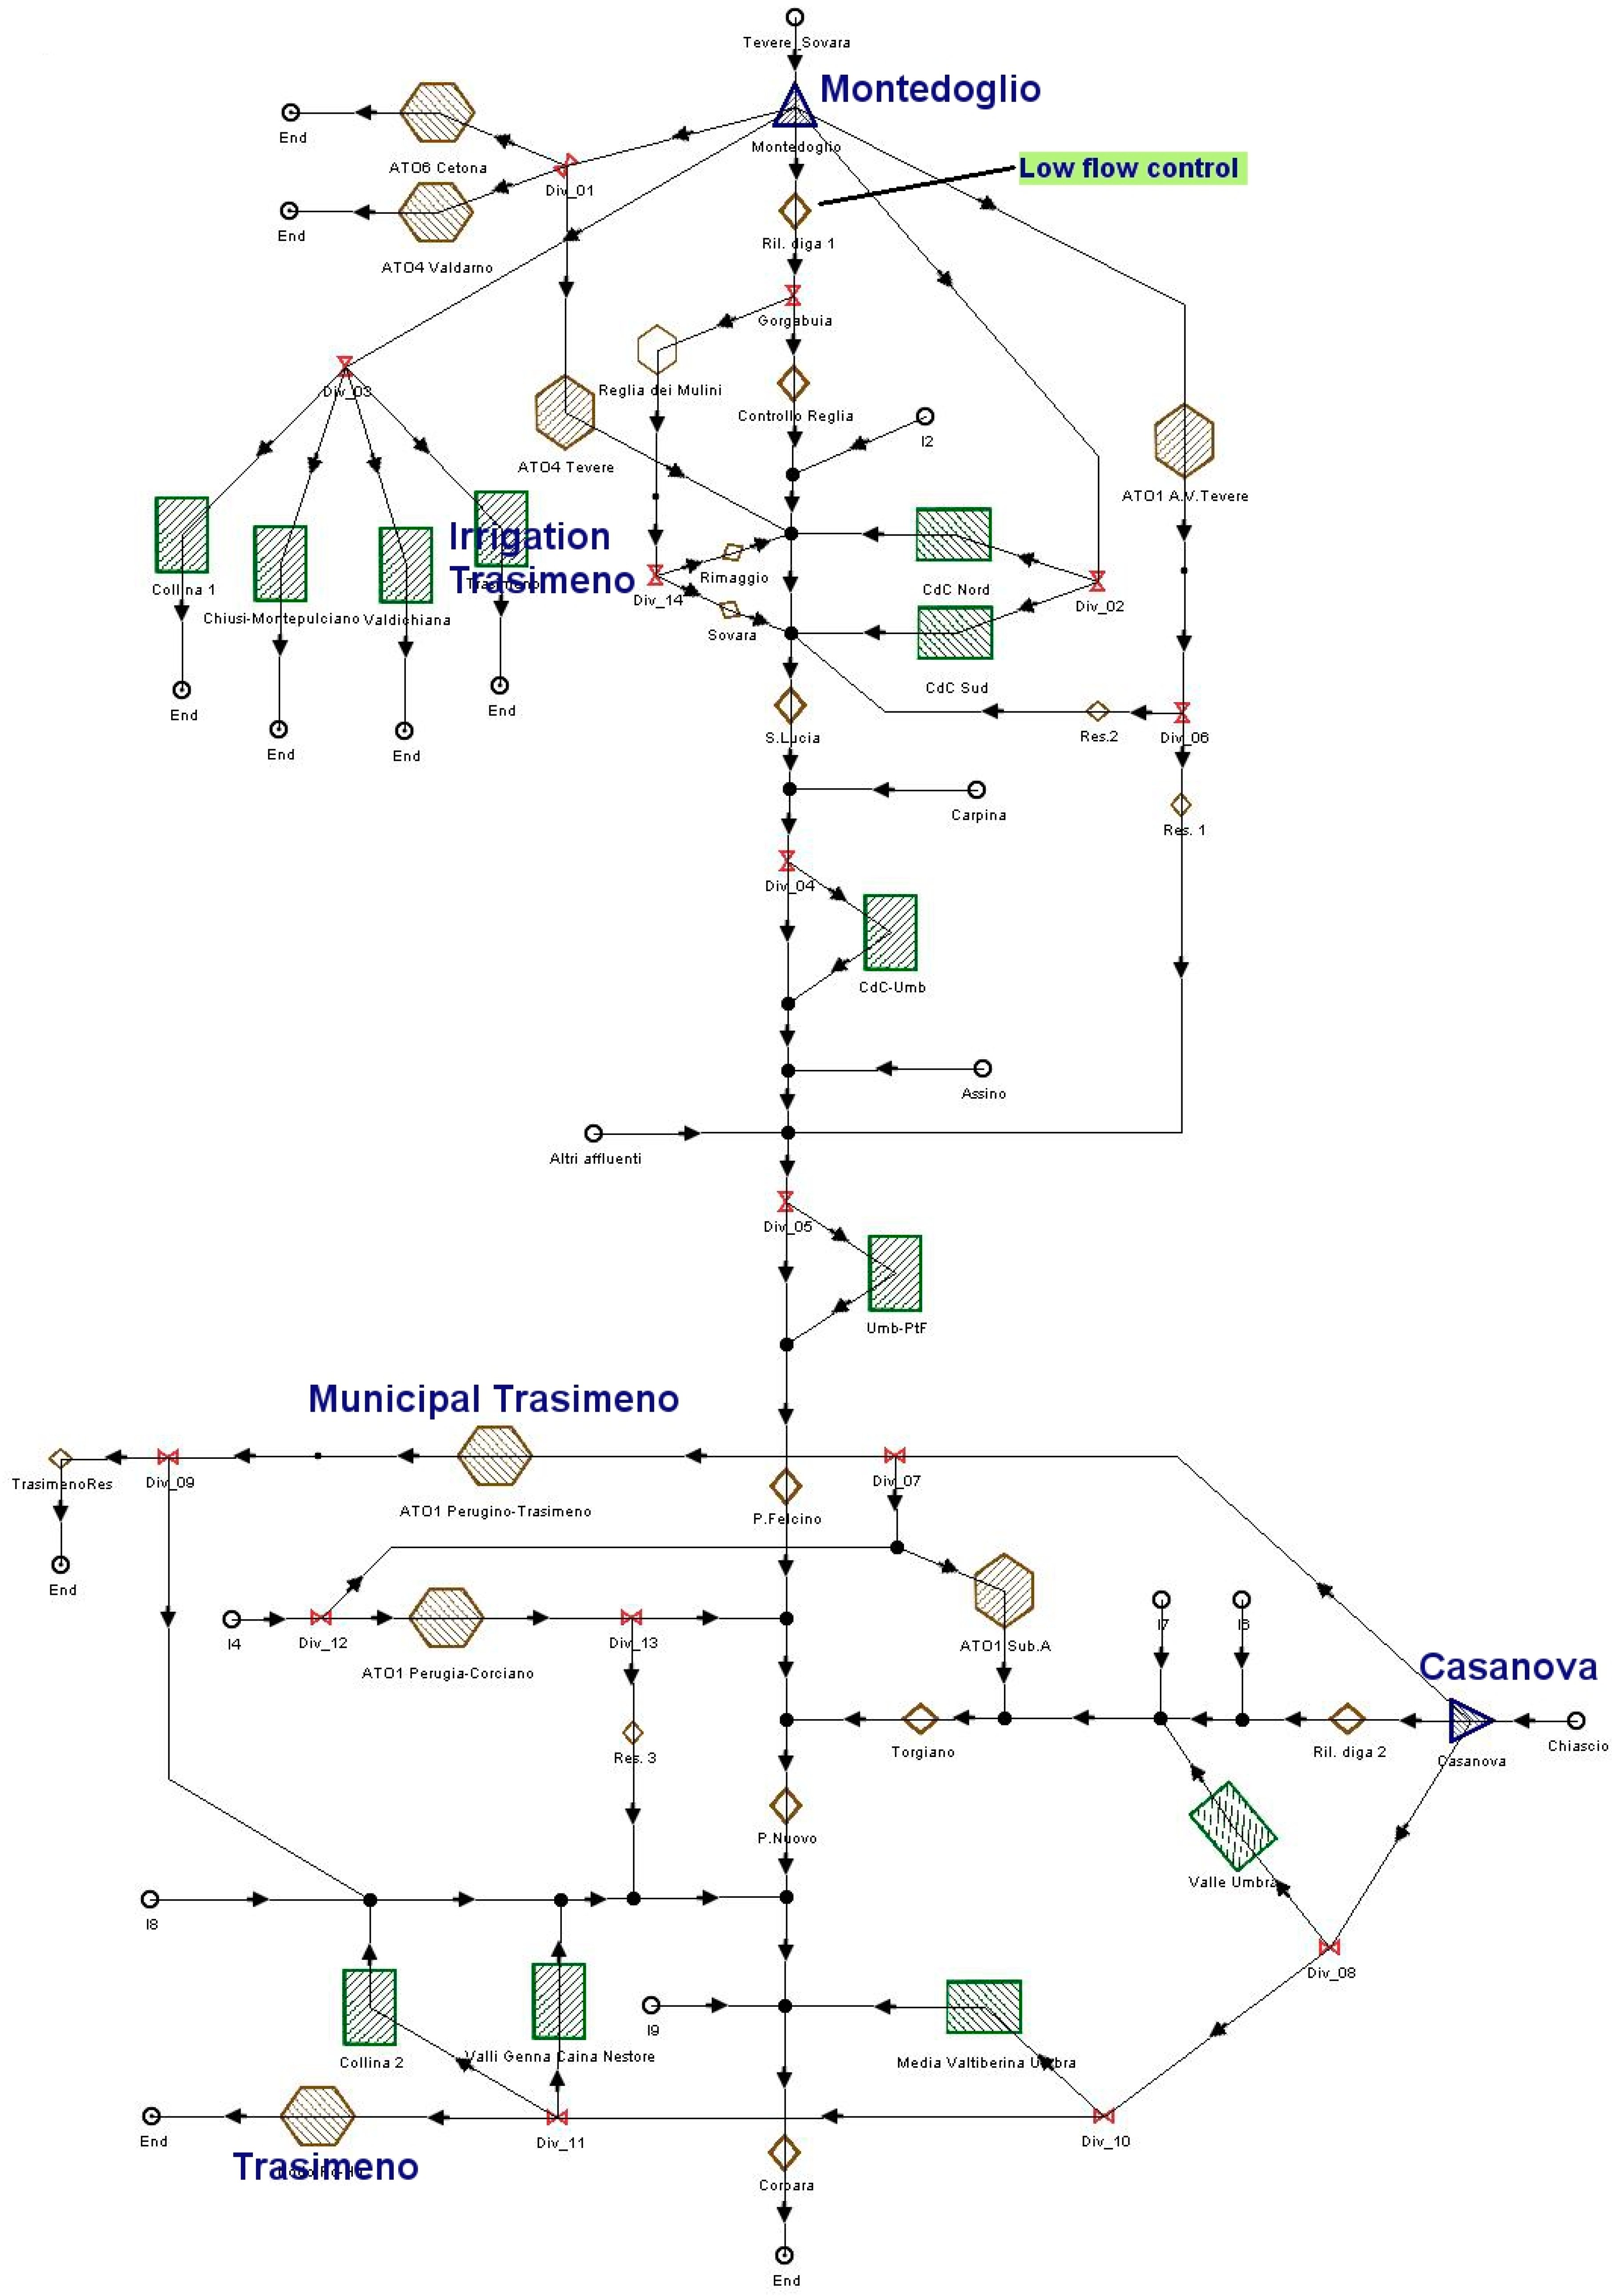
2.1. SimBaT Decision Support System

The proper management of surface water resources at the basin scale necessarily involves two basic steps: the first is evaluation of the available water resource, and the second is integrated management of the resource itself, with particular attention to the development of the uses and the occurrence of increasingly critical periods of deficit [33,34]. All the problems encountered, if approached from a rigorous theoretical point of view, are extremely complex because of the multiplicity of the technical, economic and political issues involved. However, significant advances in technologies for collecting and processing data may at least allow these problems to be studied, by means of a set of different results that are still interesting from a scientific point of view [35] and also useful for decision support practices [36].
The characteristics of the SimBaT simulation model are summarized in the following three points, while for a more detailed description of the model, refer to [6,37].
(1)
The first section covers the input of digital data (reservoir, flows, demands, minimum instream flow), as time series or typical year, together with the river network topology information. These operations are made easy by user-friendly interfaces, which during the construction of the network automatically store the topological features according to a hierarchical structure of nodes-arcs.
(2)
The second section is the core of the model with the calculation algorithm, which performs a water balance between availability and demand all over the basin, where the environmental water use has, in any case, a strict priority and it is reserved before calculating the Total Available Volume (TAV) and it is monitored in the control node. According to the concept of ecological flow or environmental flow, SimBaT supports the simulation of ecological discharges which can be artificially maintained by reservoir management. The algorithm for water management applied under deficit conditions uses a “balanced priority”, according to a principle of sustainability and sharing of expected deficits. The balances are calculated on a projection of some time steps in advance, t = (i; i + k). Therefore the decision whether or not to manage and thus to reduce the distribution of water (αrid), depends on the values taken on by the ratio between the Total Requirement Volume (TRV) and the Total Available Volume in the reservoir (S).
α r i d ( i ) = T A V s ( i ; i + k ) T R V ( i ; i + k )
When in fact this ratio (1) assumes a value less than 1, it is necessary to reduce the releases for the users (FAj), thus defining a management scenario in which the Available Volume (AV) in the simulation period i is a function of the value αrid as follows,
A V ( i ) = α r i d ( i ) j = 1 n F A j ( i )
The problem of managing reservoir releases during periods of deficit can be studied in terms of optimization between the various uses, or in terms of the simulation of hypothetical scenarios. Partly, in this model, an attempt was made to interpret the logic of optimization, which, however, is difficult to apply in the presence of environmental forcing, and when economic values, which are difficult to quantify, are taken into account. Therefore we tried to make the management phase of the model more flexible, in order to develop a tool that can be adapted to the needs of various political and economic constraints and in different territorial scenarios. Therefore, a management procedure called “balanced priority” was studied. The term “priority” means that priorities must be set among the various users served, as foreseen in the national legislation, while the term “balanced” means that the system deviates from the strict logic of distributing the resource first to uses with higher priority and then to those with a lower priority, or by serving the economically advantageous uses first. In “balanced priority” the water released is reduced by a certain percentage, which varies from use to use, starting from the last in order of priority, each time repeating the budget until αrid > 1 [37]. This procedure essentially allows the deficit between the various types of uses to be distributed, according to different levels of tolerance that can be decided and commonly agreed upon among the various stakeholders.
(3)
The third section concerns the data output. Reading of the output data is extremely flexible both in graphic and numerical terms, with particular attention to the possible use of the model when short-term probabilistic assessments are concerned.

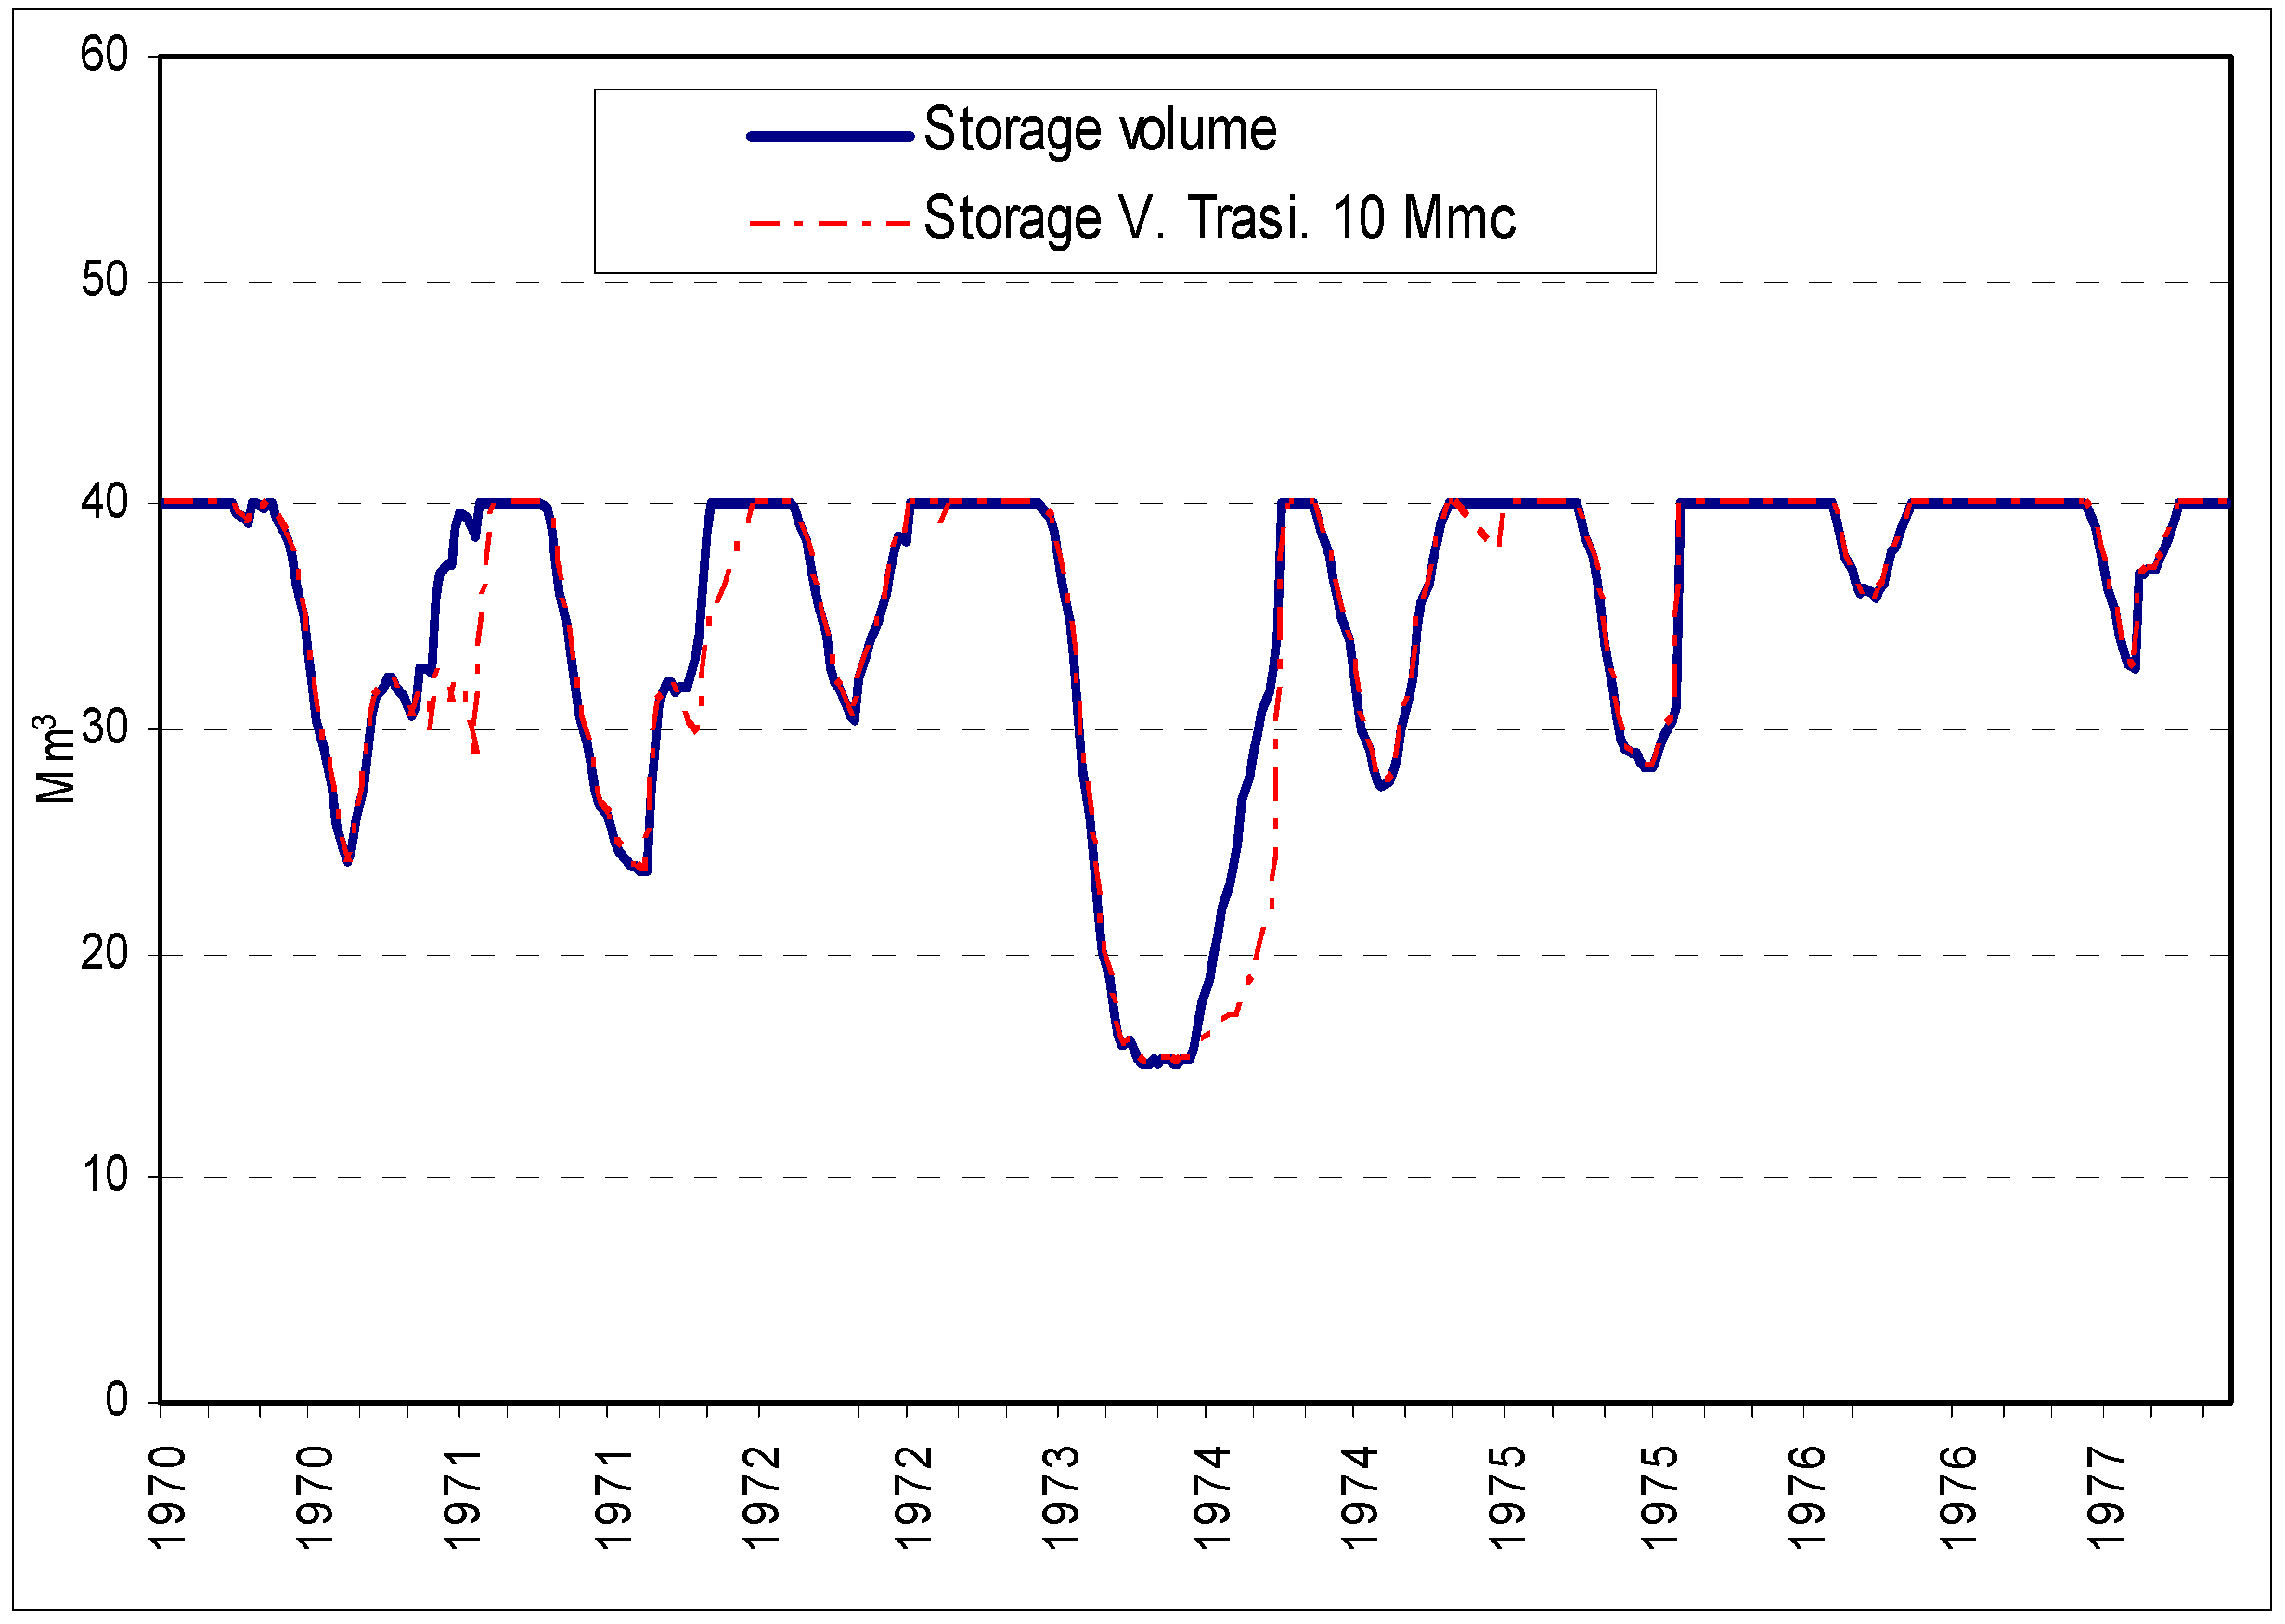
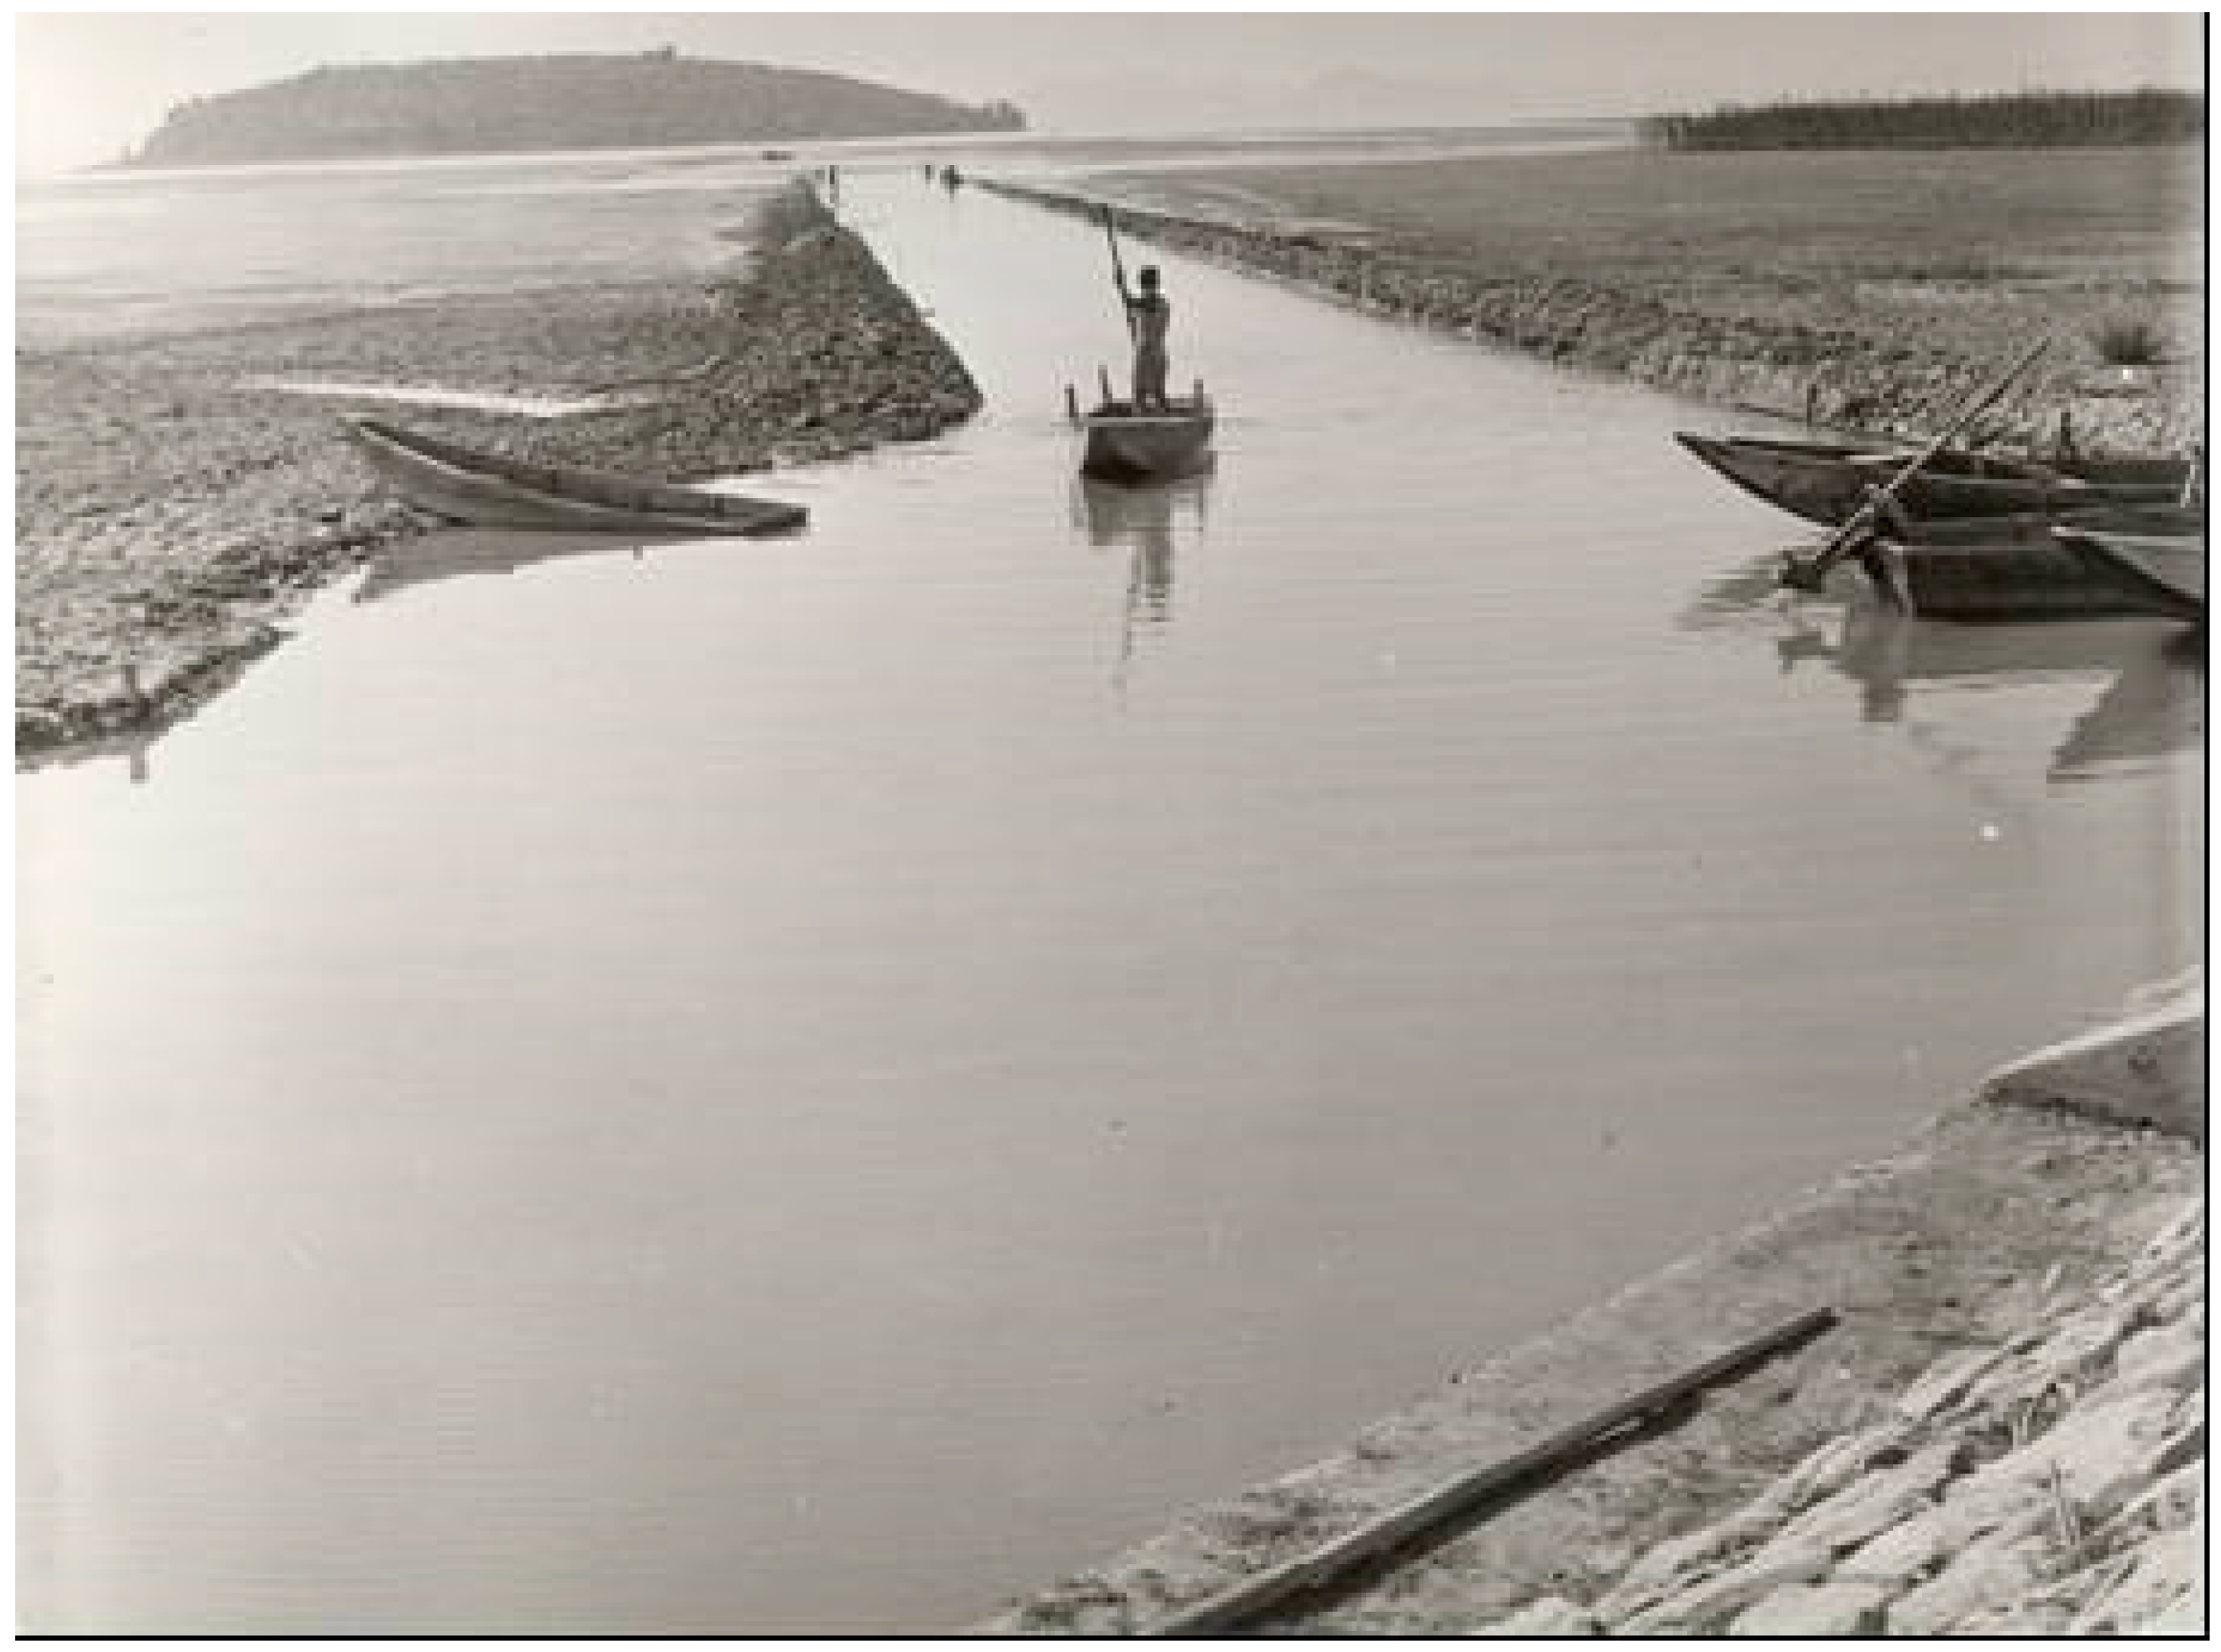
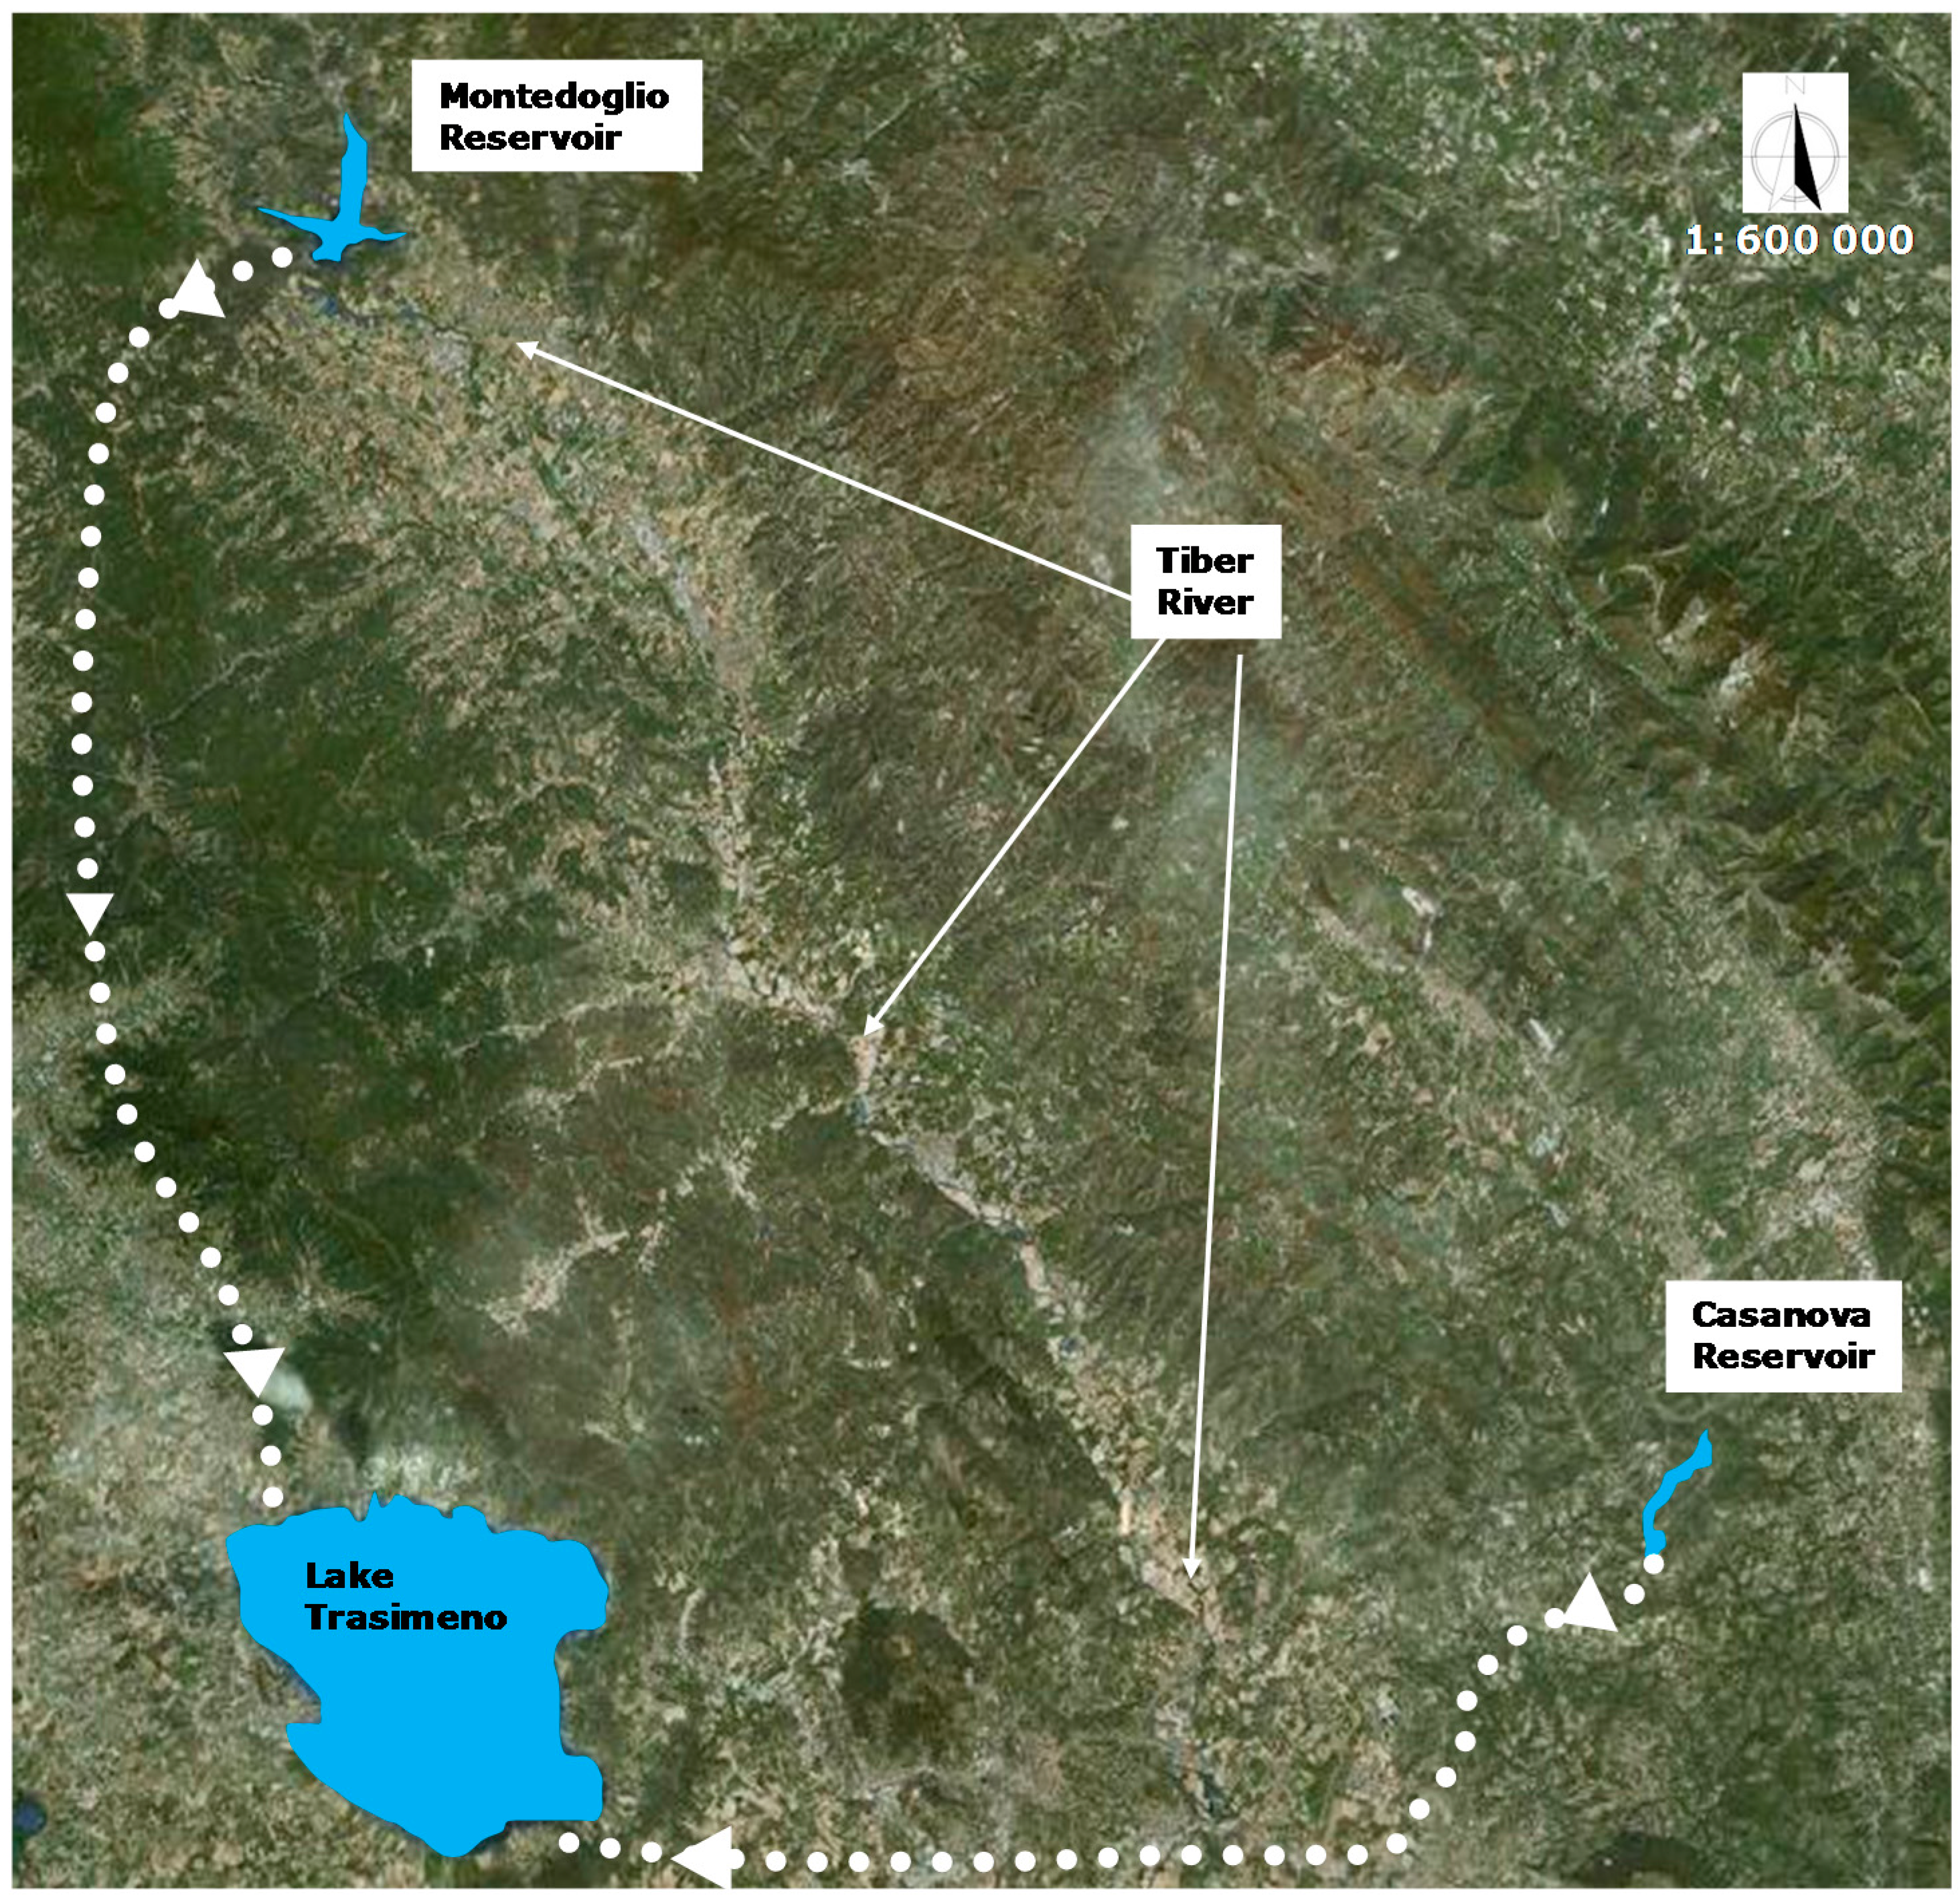
2.2. Water Balance of Lake Trasimeno

Together with estimating of the availability of water for Lake Trasimeno, it is necessary to evaluate the effects that these releases can have on the lake itself. Therefore, a balance equation for the inflows and outflows of the lake has been introduced, which can been applied to the available time series of the lake levels. In this case the time step is monthly, because the variations in the level are very slow and the evaporation data can be estimated better in terms of monthly data [38]. The link with the SimBaT model output is not a problem, because the monthly volume is the sum of the corresponding weekly volumes, or, in the other direction, the weekly volume can be considered a uniform distribution of the monthly volume.
The monthly balance equation calculates the monthly water inflows Am [mm] for Lake Trasimeno. Neglecting the permeability of its substratum the equation can be defined as follows:
Am = (Ps·Ss + Pb·Sb·C)/Ss − E − (Vd + Va)/1000·Ss
The terms Ps and Pb are, respectively, the average rainfalls (mm) during the period concerned over the surface of the lake (average surface Ss = 121.5 km2) and over the watershed of Lake Trasimeno (Sb = 261.9 km2). The monthly run-off coefficient is expressed by the term C, while E represents the monthly evaporation from the lake (mm). This last term also takes into account the evapotranspiration from the riparian vegetation. The term Vd is the monthly water volume flowing through the San Savino outlet; these volumes are a function of Lake Trasimeno levels once the spill level is reached (257.8 m a.s.l.). The term Va takes into consideration both the agricultural withdrawals (average withdrawals: 7–5 Mm3/year in calibration; 2 Mm3/year in simulation) and possible external inflows like those from the reservoirs.

3. Results and Discussion

The application of the SimBaT model to the case study provides an analysis of the availability of water resources in the global system of the Casanova and Montedoglio reservoirs, in order to increase also the annual water volume inflow into Lake Trasimeno. The results of these simulations were then evaluated in term of the water balance of Lake Trasimeno, which takes into account evaporation losses, irrigation withdrawals and the possibility of bringing water into Lake Trasimeno, in addition to natural inflows and direct runoff from the drainage basin area.

3.1. SimBaT Simulation

The proposed sketch of the hydraulic network refers to the entire system of the Tiber River, with its Montedoglio reservoir and the Chiascio River with the Casanova reservoir (Figure 3).
The scheme highlights all the water demands (irrigation rectangle symbol, municipal hexagon symbol, and the control node for the minimum instream flow, rhombus symbol). In the case of the Trasimeno node, it is fed by the Montedoglio reservoir for agricultural needs, while the Casanova reservoir provides water supplies for municipal and environmental purposes, this last in order to increase the lake level during dry periods.
The hydrological input in SimBaT is a time series of flow for each input node. These nodes represent the points where water enters the river system (i.e., springs, tributaries, increases of flow from groundwater or other). The time series of flow, in the chosen time scale (month, week), are recorded in these nodes and the input data can be values from gauged station, if available, or synthetically generated by models [39]. In this study, the hydrological input used for the simulation is a time series of weekly flows from 1946 to 1978. This period was chosen because, in previous studies [37], it was possible to reconstruct the natural flows on the basis of the flows measured with the hydrometric stations and of the upstream use; this condition is essential since the hydrologic input should not be biased by water uses that will be calculated again within the simulations. The range of the time series and its features in terms of sequence of dry and wet periods are meaningful, so that the DSS can produce useful management results in a general way. In particular, the hypothesis of volume release for Lake Trasimeno can be used as input in the Lake Trasimeno levels model, also for a future period of simulation (see Section 3.2). In summary, the time series on which the two models operate should be hydrologically significant, but essentially they can be independent, according also the results of studies conducted in this basin [40] which don’t find significant annual and seasonal rainfall trends. In particular the annual trend is the most important parameter to evaluate the possible influence in reservoir recharge.
Amongst the many simulated scenarios for the entire system shown in Figure 2, attention must be focused on the hypothesis that the available volume in the Montedoglio and Casanova reservoirs will also be diverted for Lake Trasimeno restoration, evaluating its impact on other uses and on the entire environmental system in the basin.
The following is a description of the results of the simulations of the two scenarios: the first one concerns the water management of the actual uses fed and placed in the hydraulic network already analyzed. The aim of this study was to evaluate whether the reservoirs are in the condition to provide up to 10 Mm3 of water to Lake Trasimeno. The second scenario takes into account temporary operating conditions during the test phase of the Casanova dam, for a storage volume in the reservoir of not more than 40 Mm3. The hypothesis is feeding all the municipal uses, 50% of the agricultural ones and release 10 Mm3 for Lake Trasimeno restoration. This value is the annual volume that the lake loses, on average, during drought periods, and it is indicated as the possible volume needed for lake restoration [41].

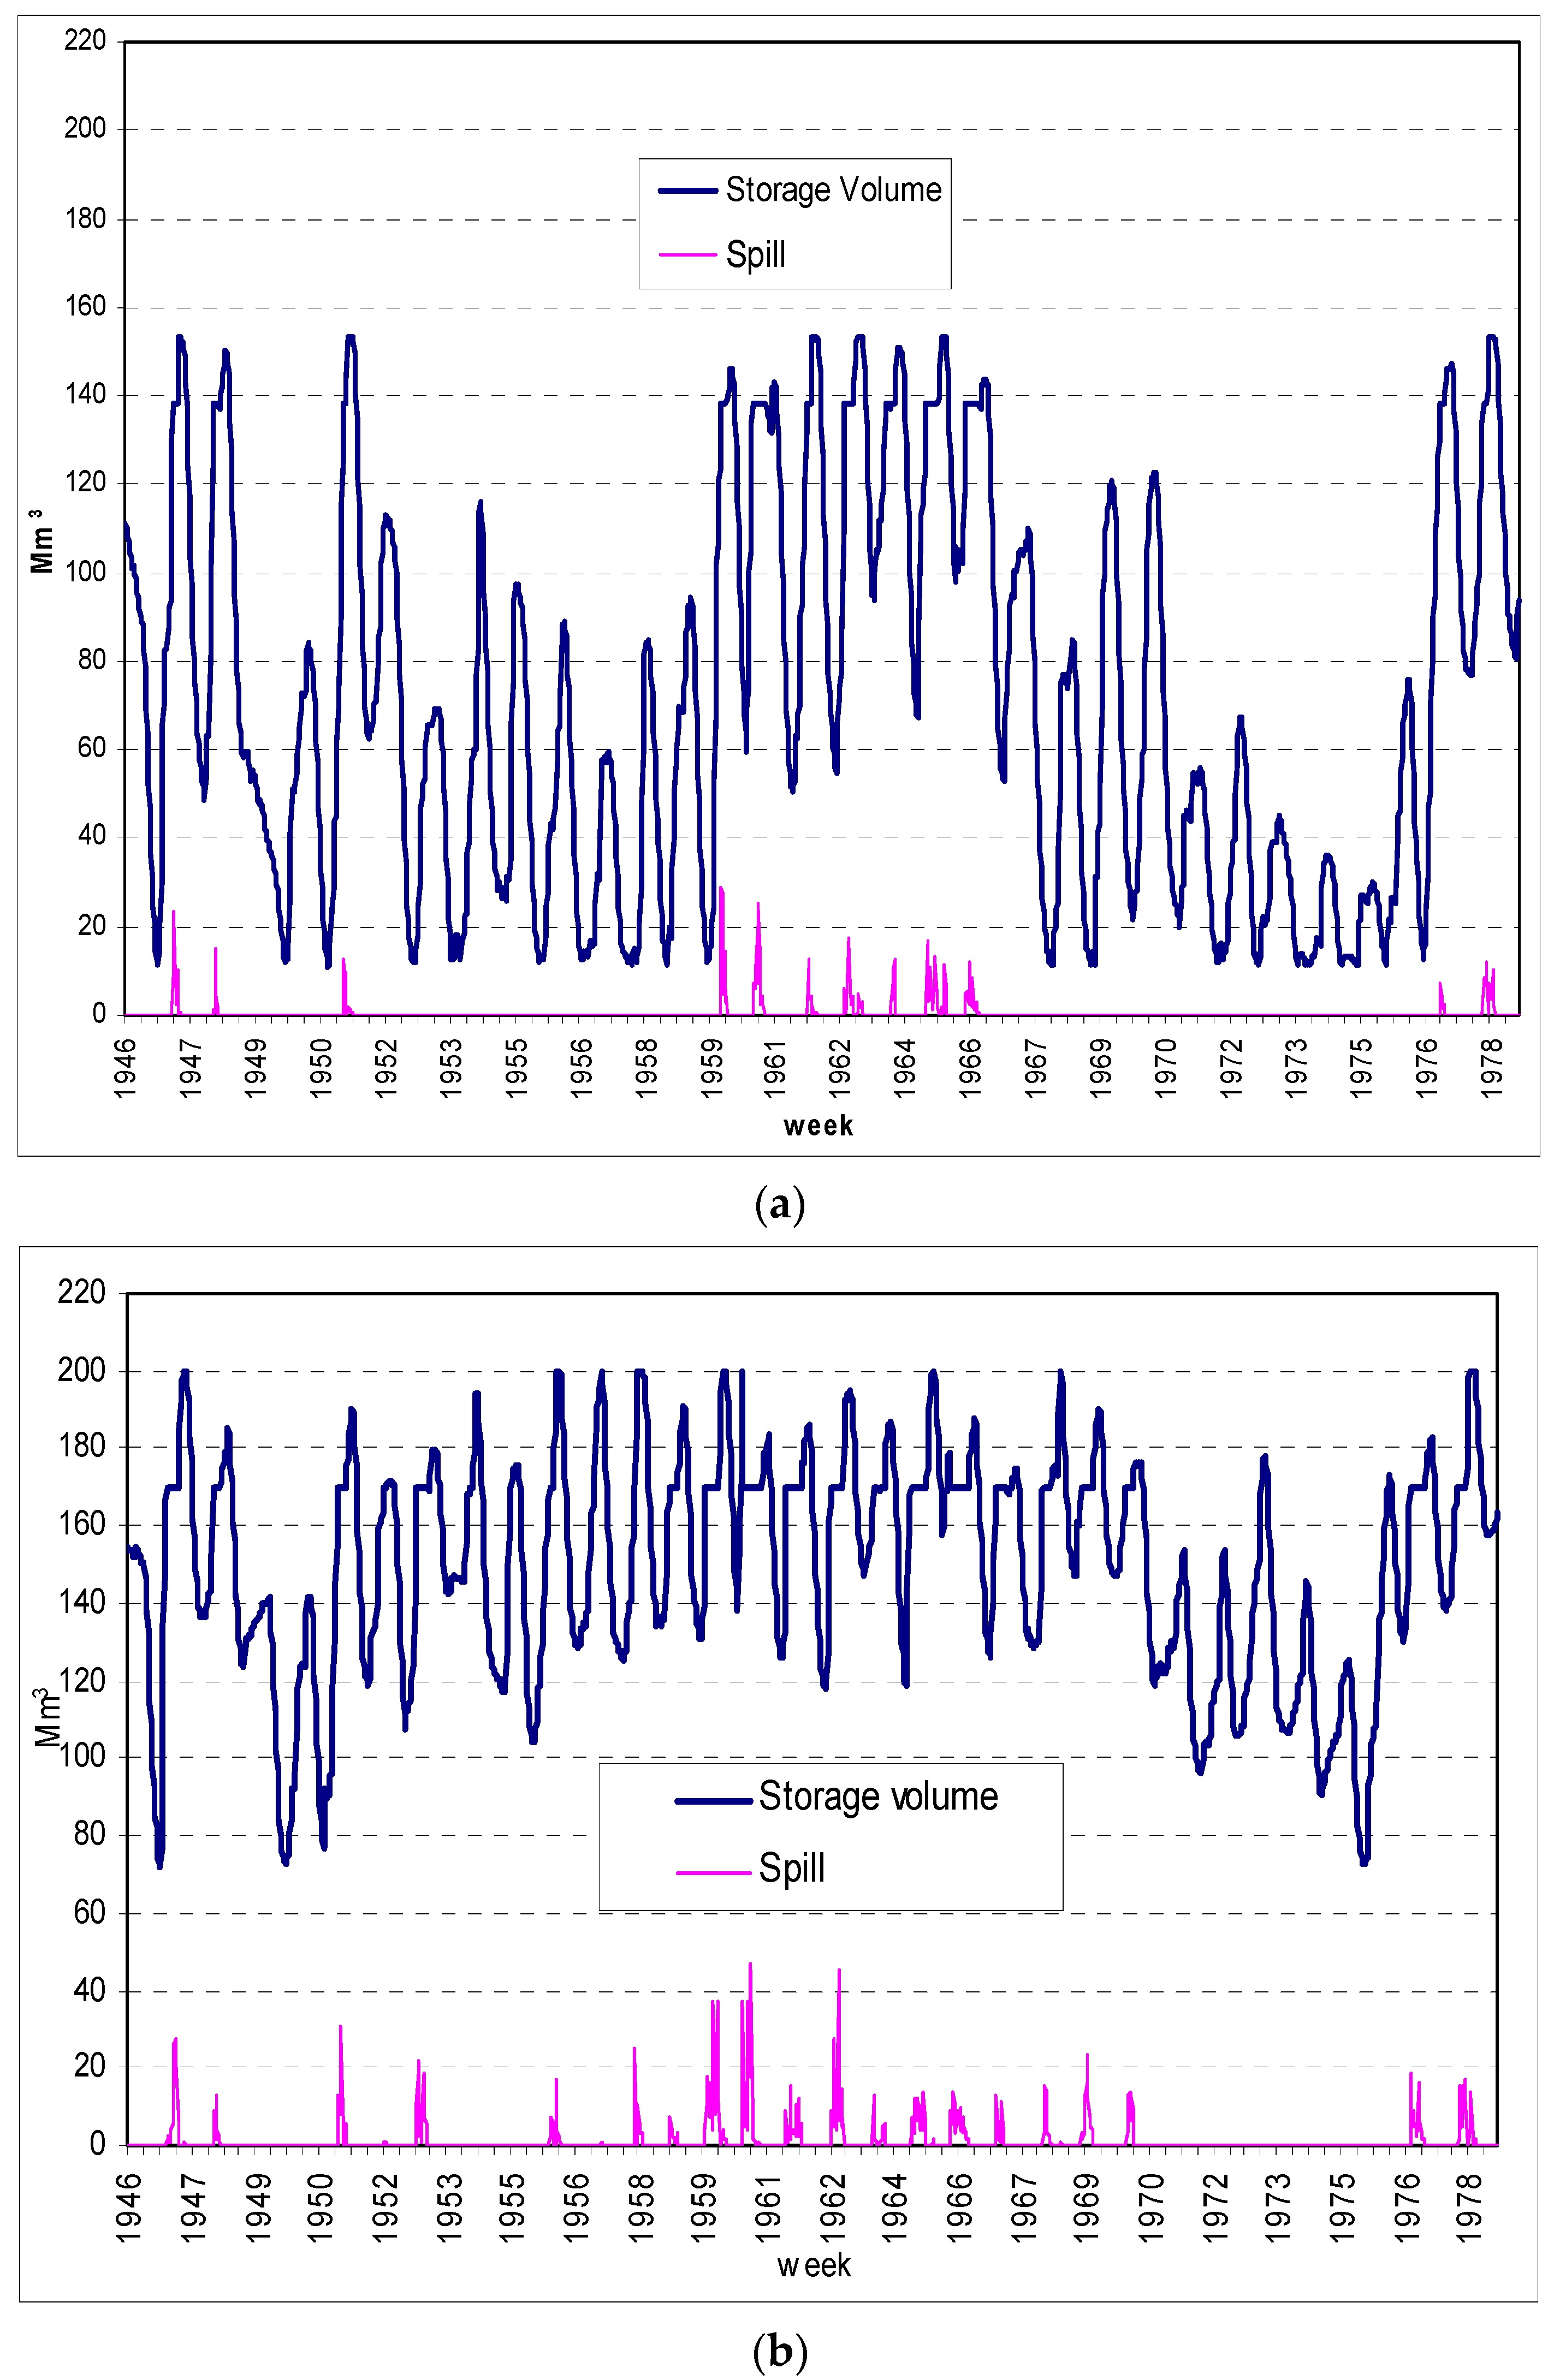
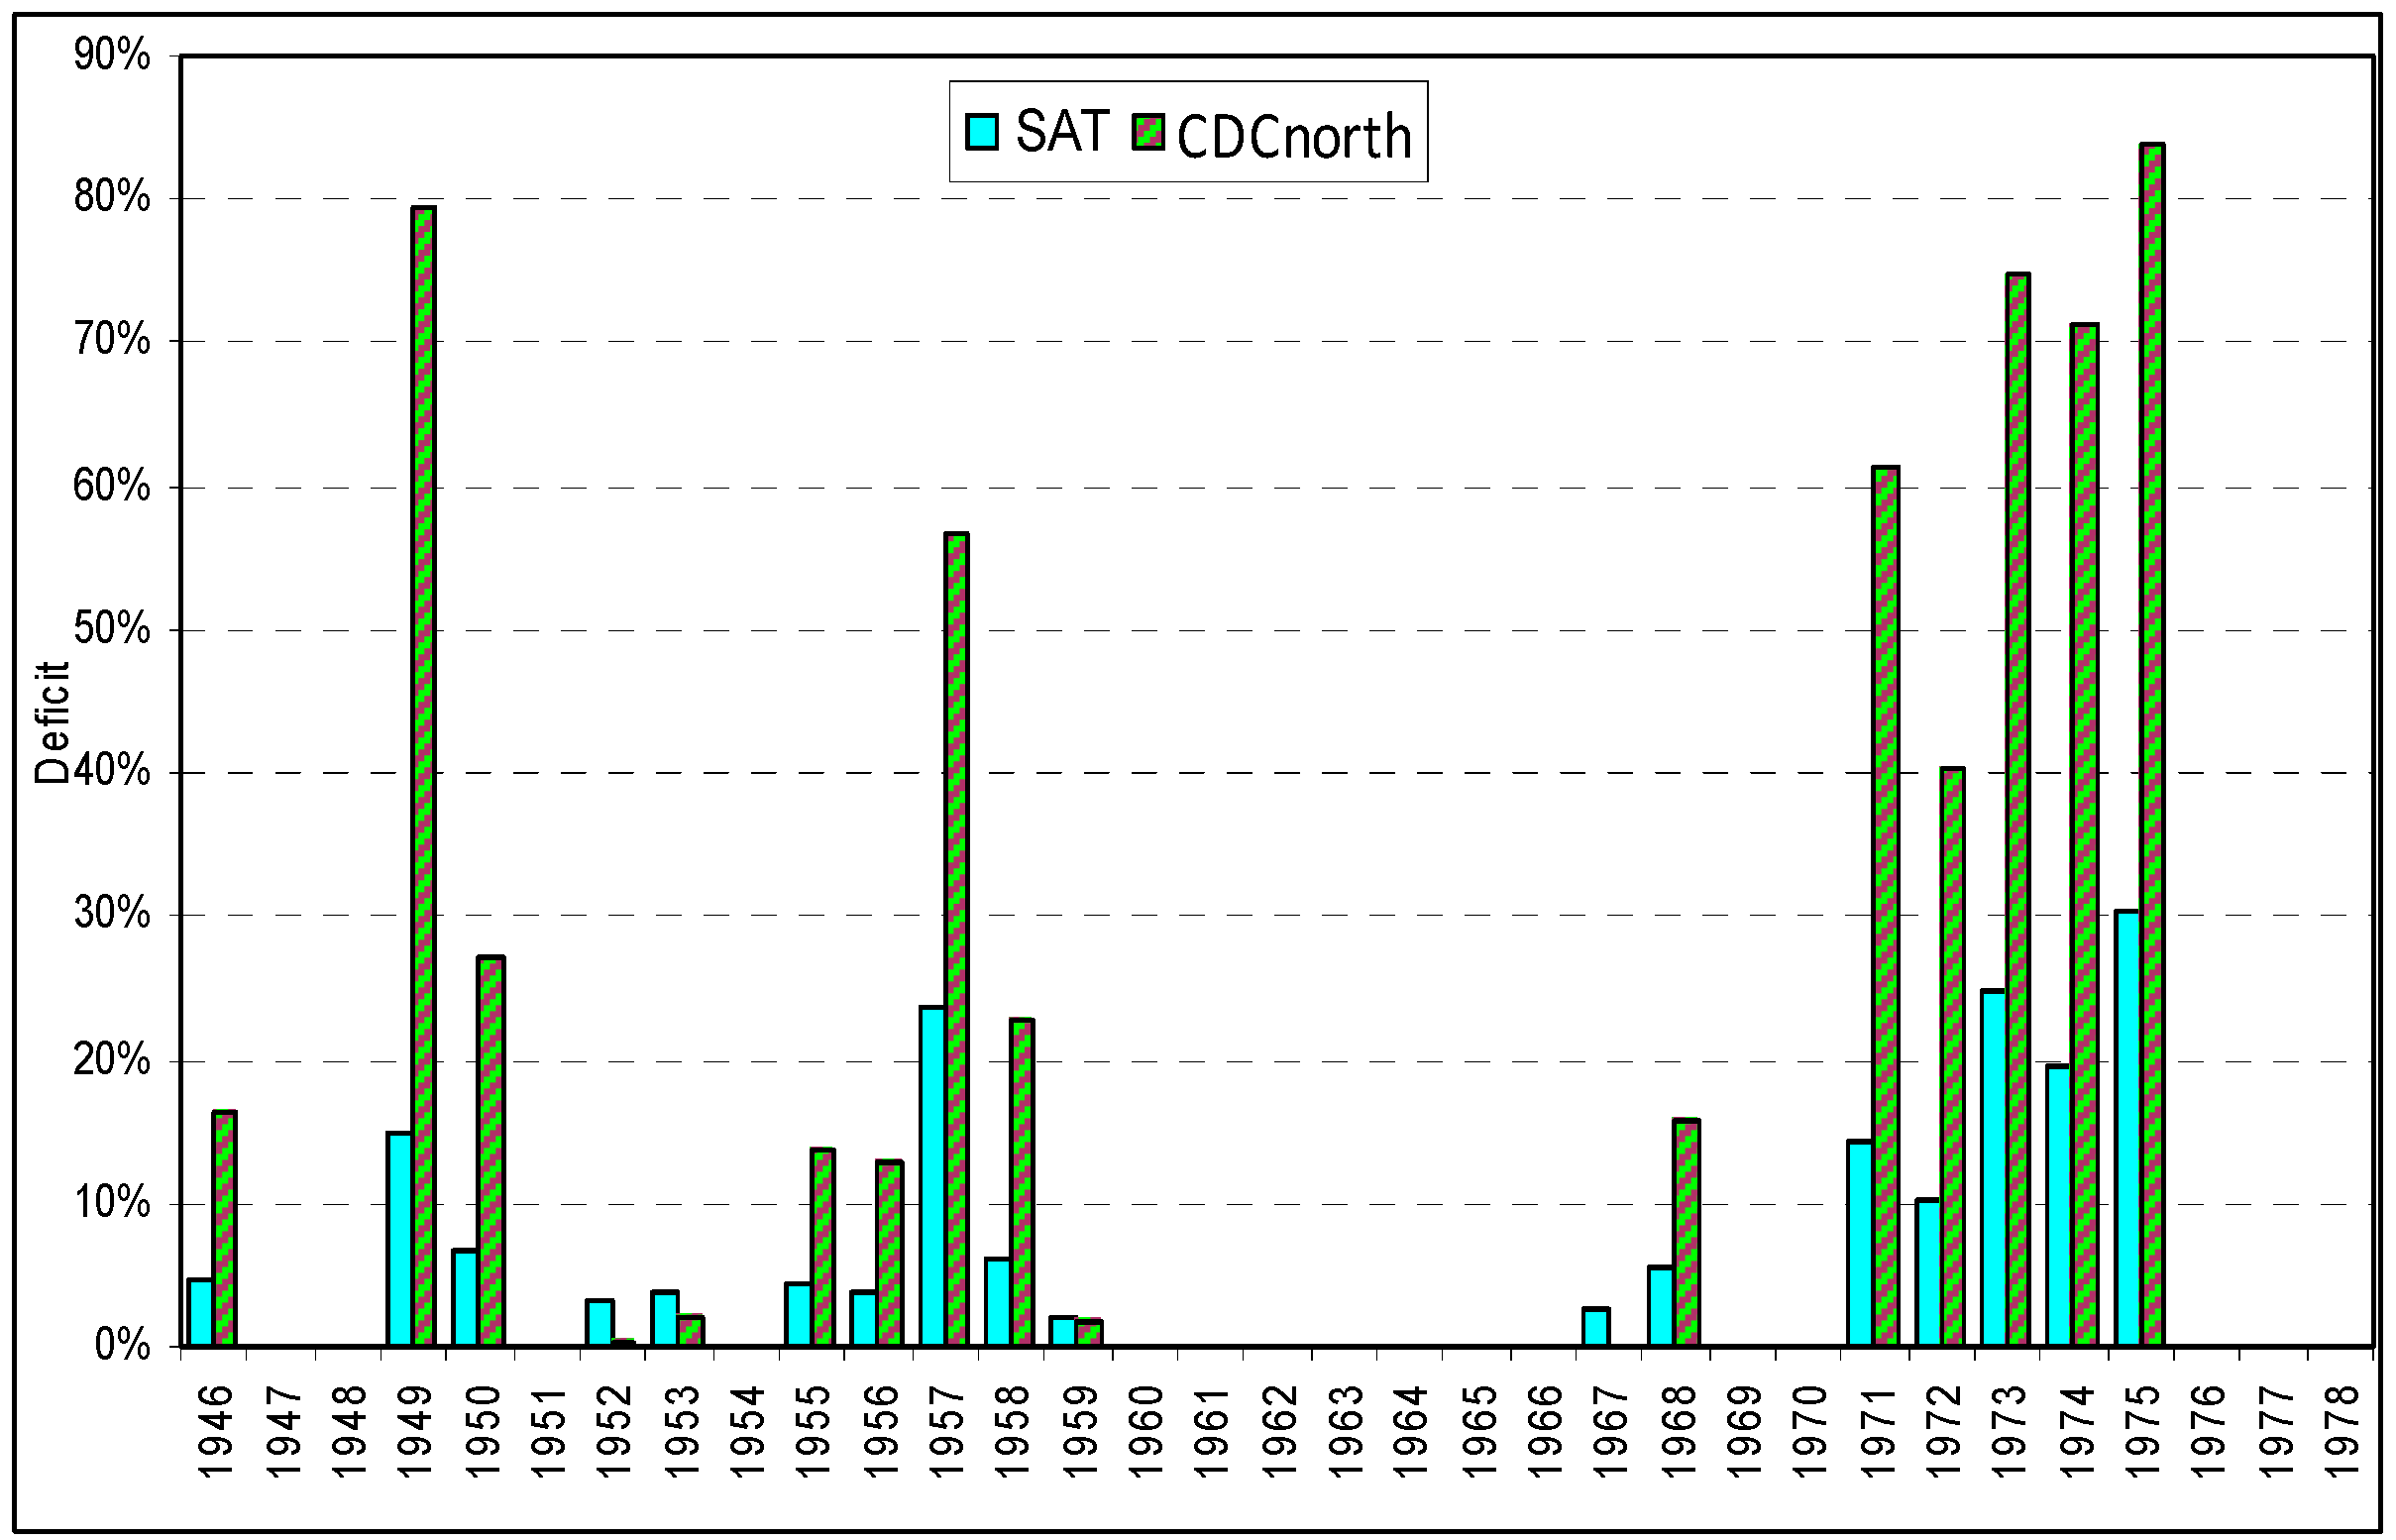
3.1.1. Simulation Scenario n.1

The trends of the volumes and spills of the two reservoirs are shown in Figure 4. It is clear the Montedoglio reservoir (Figure 4a) is much more stressed and frequently reaches its dead volume (11 Mm3) and this leads to periods of water deficit for the connected uses (Figure 5). This situation also impacts the conservation of the minimum instream flow (MIF), In fact, the intense exploitation of the reservoir limits the water releases in the river bed for environmental uses, with frequent periods when levels reach the minimum allowed by the standards for environmental protection (Figure 6). All these results suggest that the Montedoglio reservoir is probably not able to provide water to Lake Trasimeno for environmental use.
On the contrary, the results of the simulations for the Casanova reservoir show a good trend for the stored volume (Figure 4b). This trend indicates that a considerable amount of water is still available. In fact the stored volume is never less than 70 Mm3 (on average 88 Mm3/year) and there are frequent water spills (25 years out of 33 simulated).
On the basis of the results of this initial simulation and in order to have a more robust evaluation, the amount of 10 Mm3 of water released for Lake Trasimeno was taken into account for the Casanova reservoir.
This new volume was distributed over 12 weeks in the period January–March, so as not to overlap with the drier months of the year and with greater water demand. In Figure 7 it is possible to notice how, in the dry periods, the Casanova reservoir levels go down till a minimum of about 25 Mm3, but never reach the dead volume level (15 Mm3). This situation does not generate deficit problems for the other water uses.

3.1.2. Simulation Scenario n.2

Since the artificial Casanova reservoir is now not operative, it is very interesting to simulate scenarios that predict the possibility of having increasing available volumes of water. Particularly, for the next years it is actually possible to hypothesize about a first simulation scenario with a maximum capacity limited to 40 Mm3 during the period of dam testing. This volume will be mainly available for environmental use (MIF) and municipal uses, while 50% for agricultural use. Actually this describes a possible scenario that could be adapted to different developments of the works, in dam testing or in the development of the downstream pipeline network, and SimBaT can support the planning of water use in this phase.
In this case the results of the simulation show how the withdrawal of 10 Mm3 to feed the environmental demand of Lake Trasimeno does not cause deficit to the other active uses; in fact the trend of the stored water varies minimally also in a critical period (Figure 8). This is because the reservoir spills occurring during the winter season are so efficiently used.
This result can be more accurately analyzed with the possibility of increasing the annual stored volume in the Casanova reservoir for multi-purpose uses. In this way the model can be gradually used to optimally schedule the completion of the entire project.

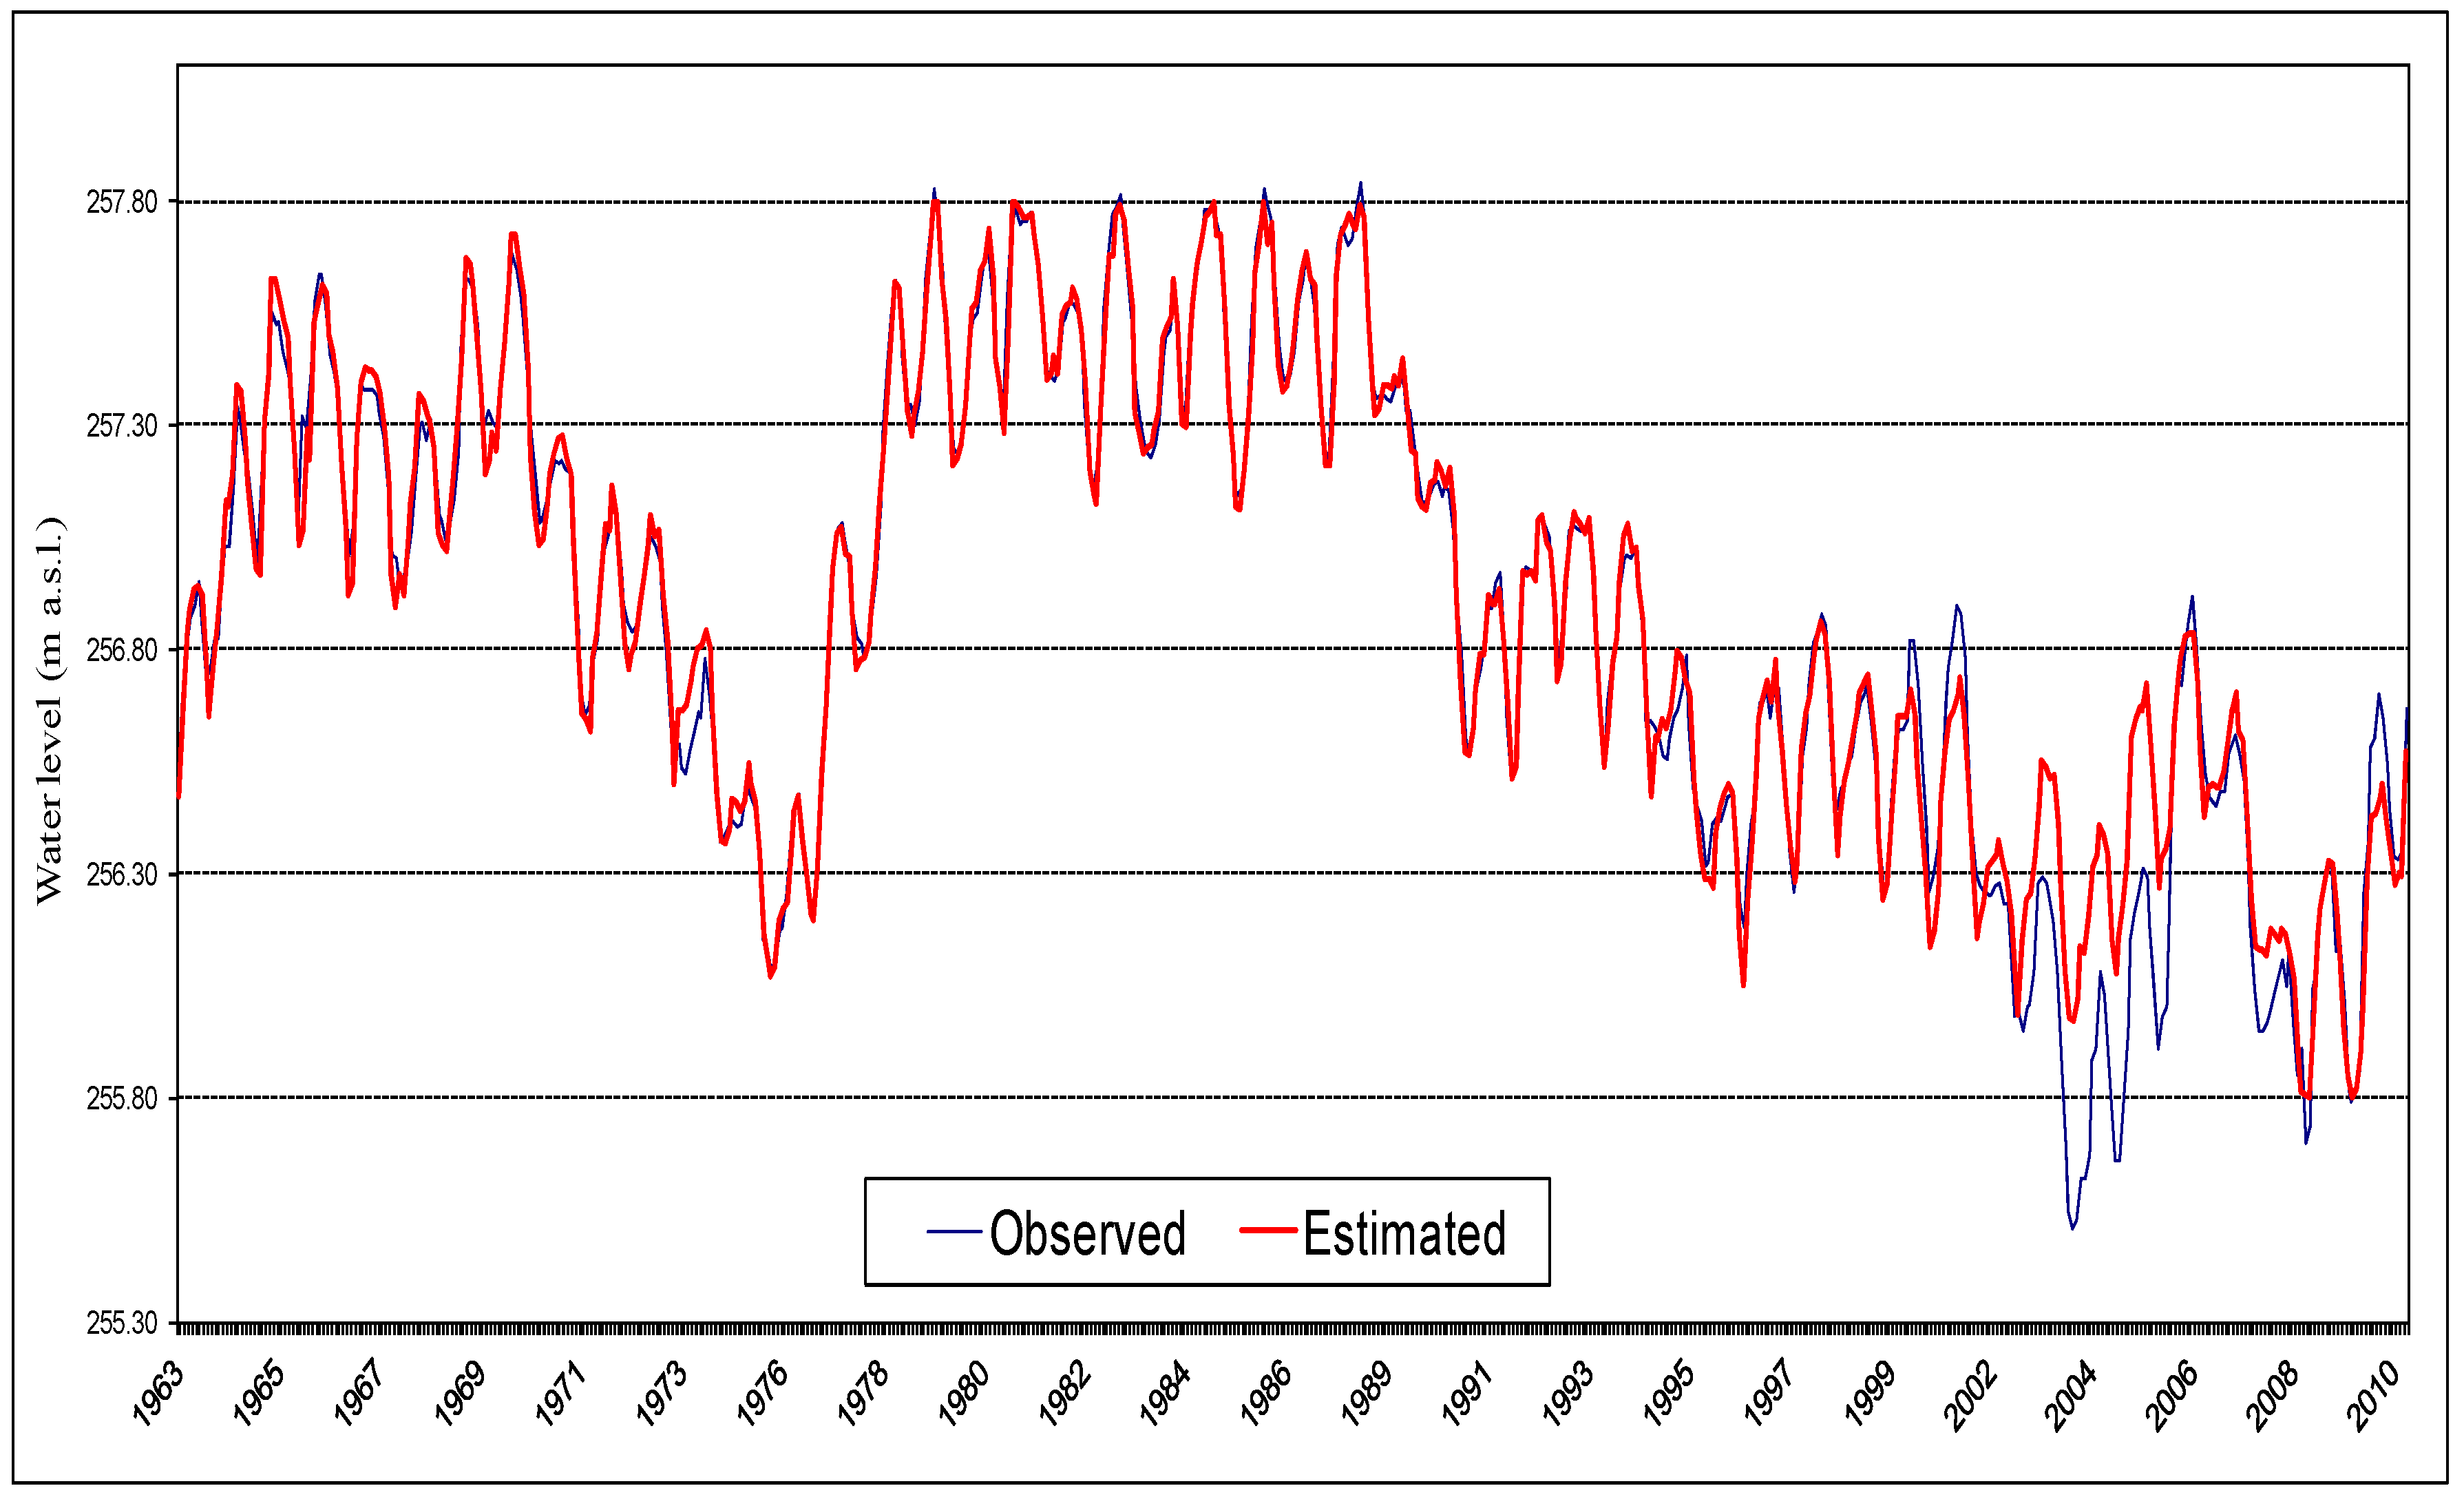
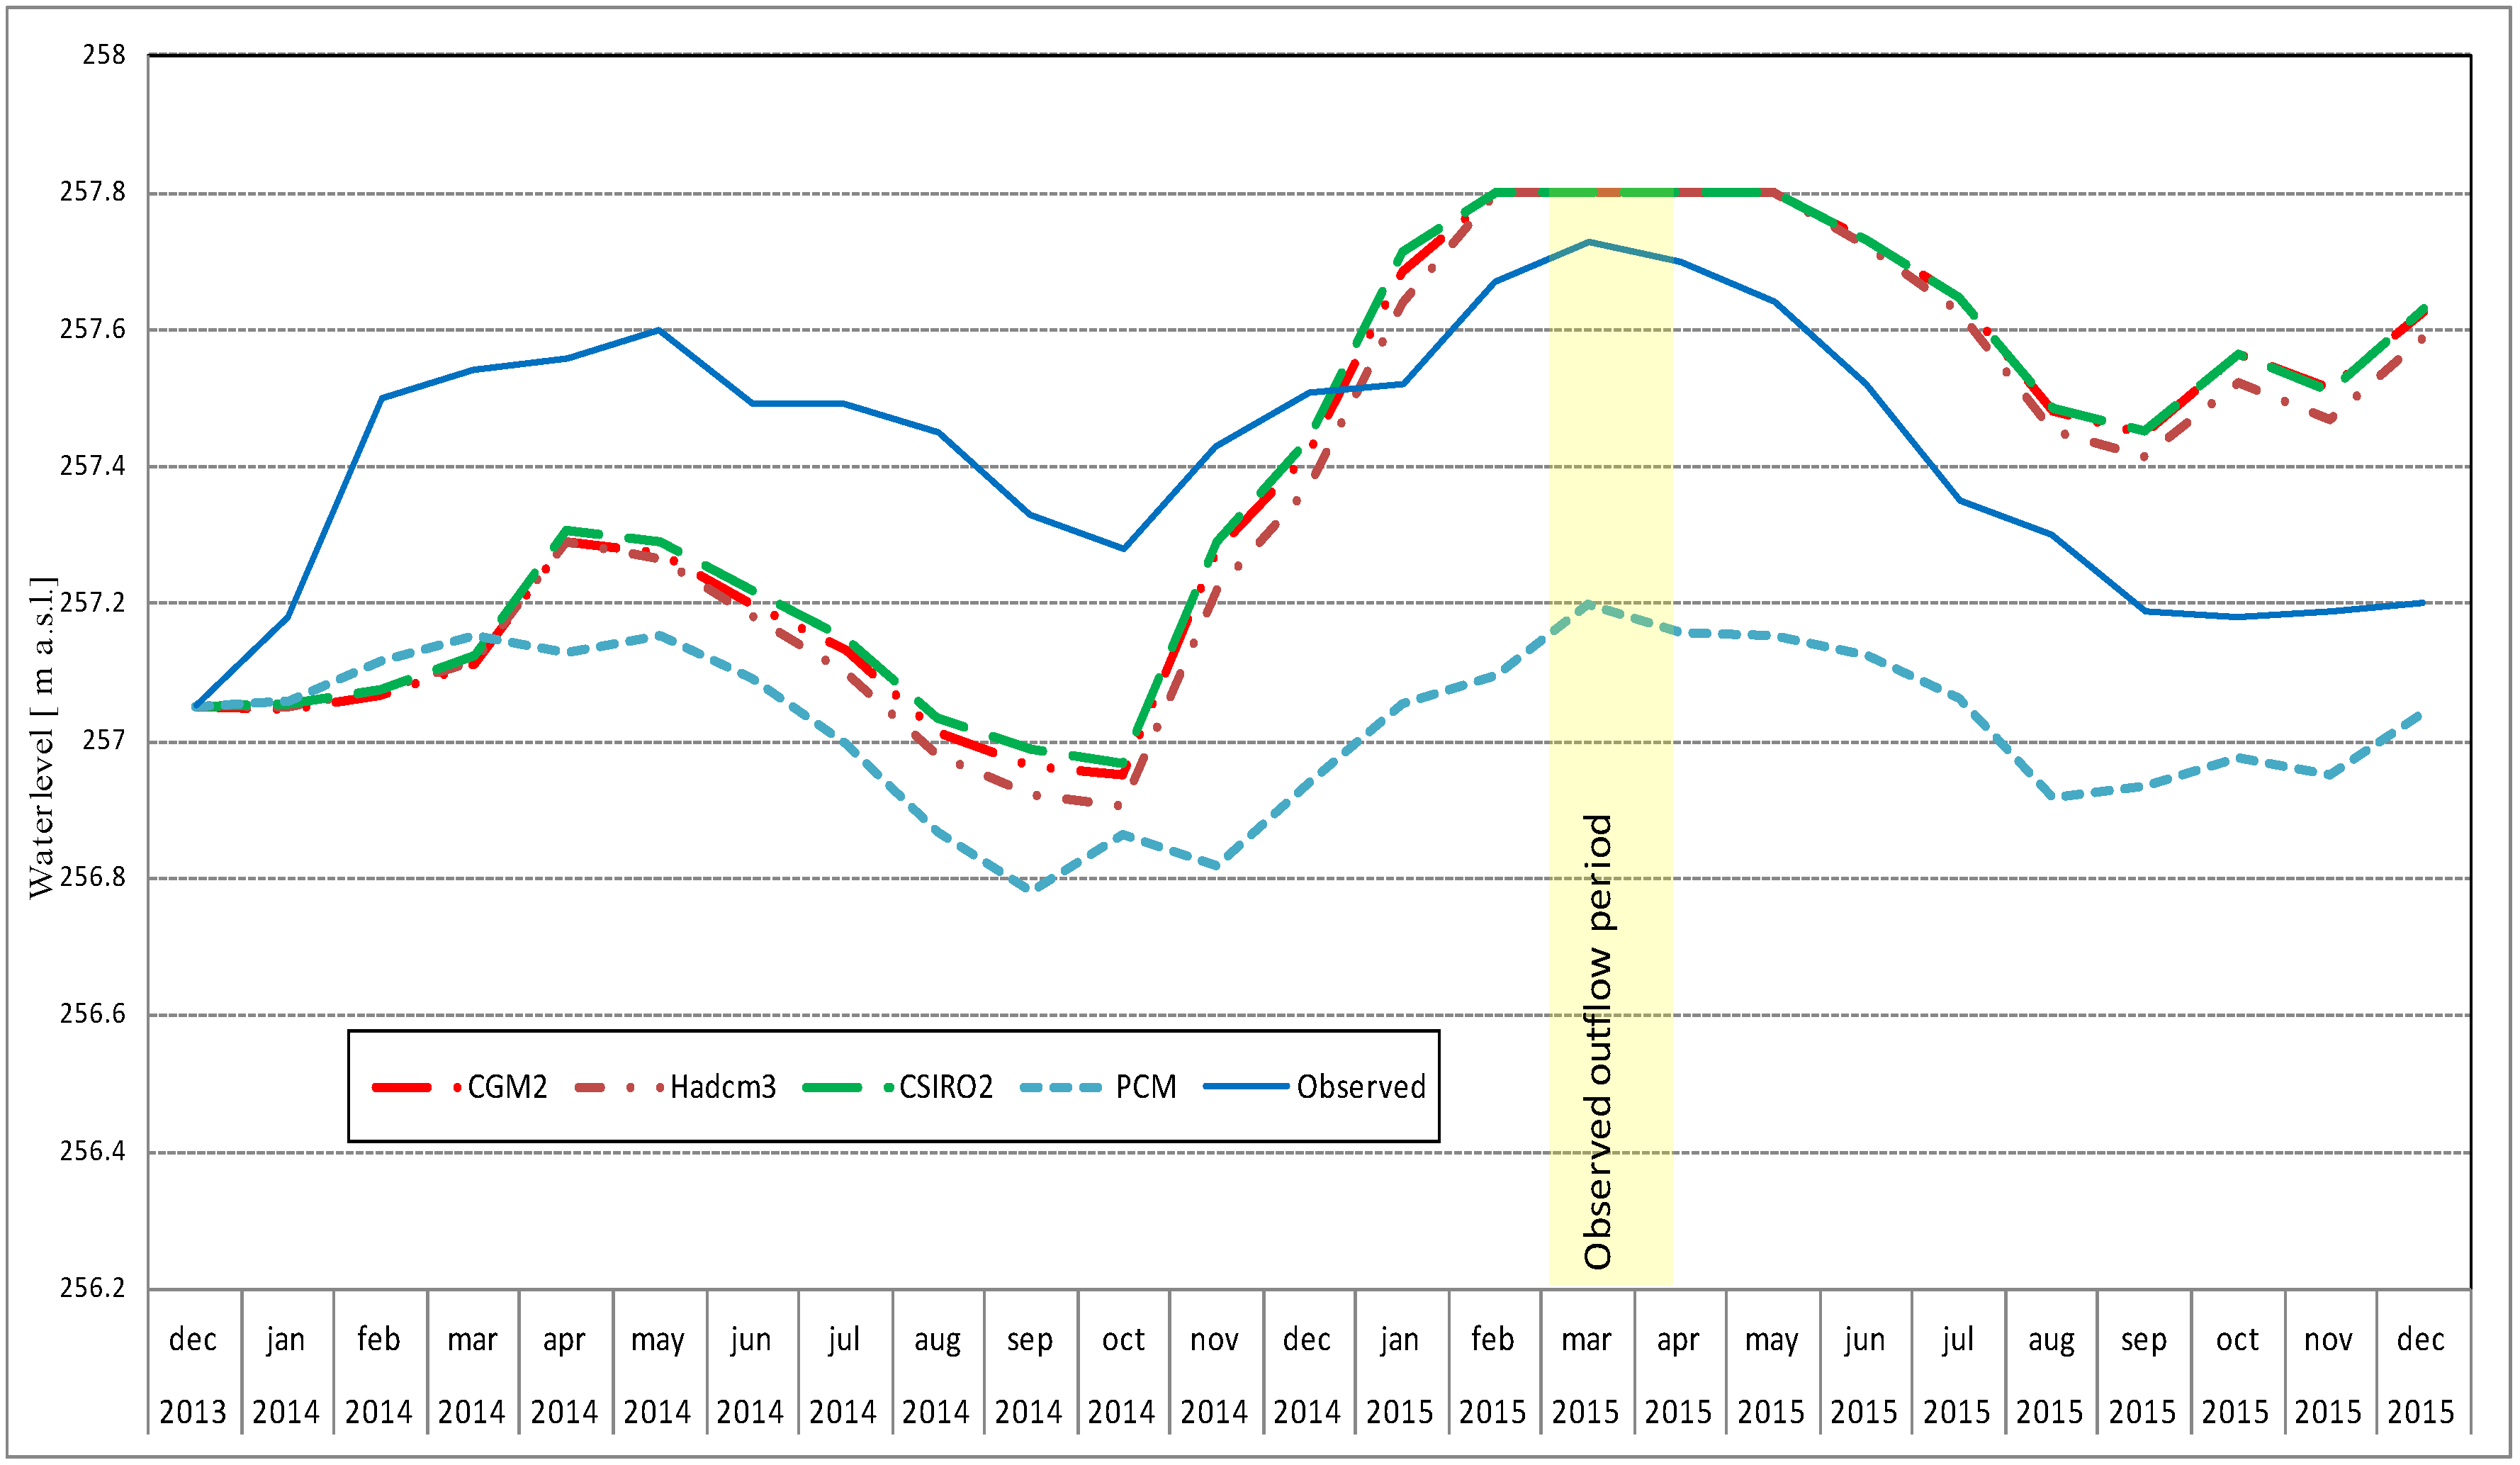
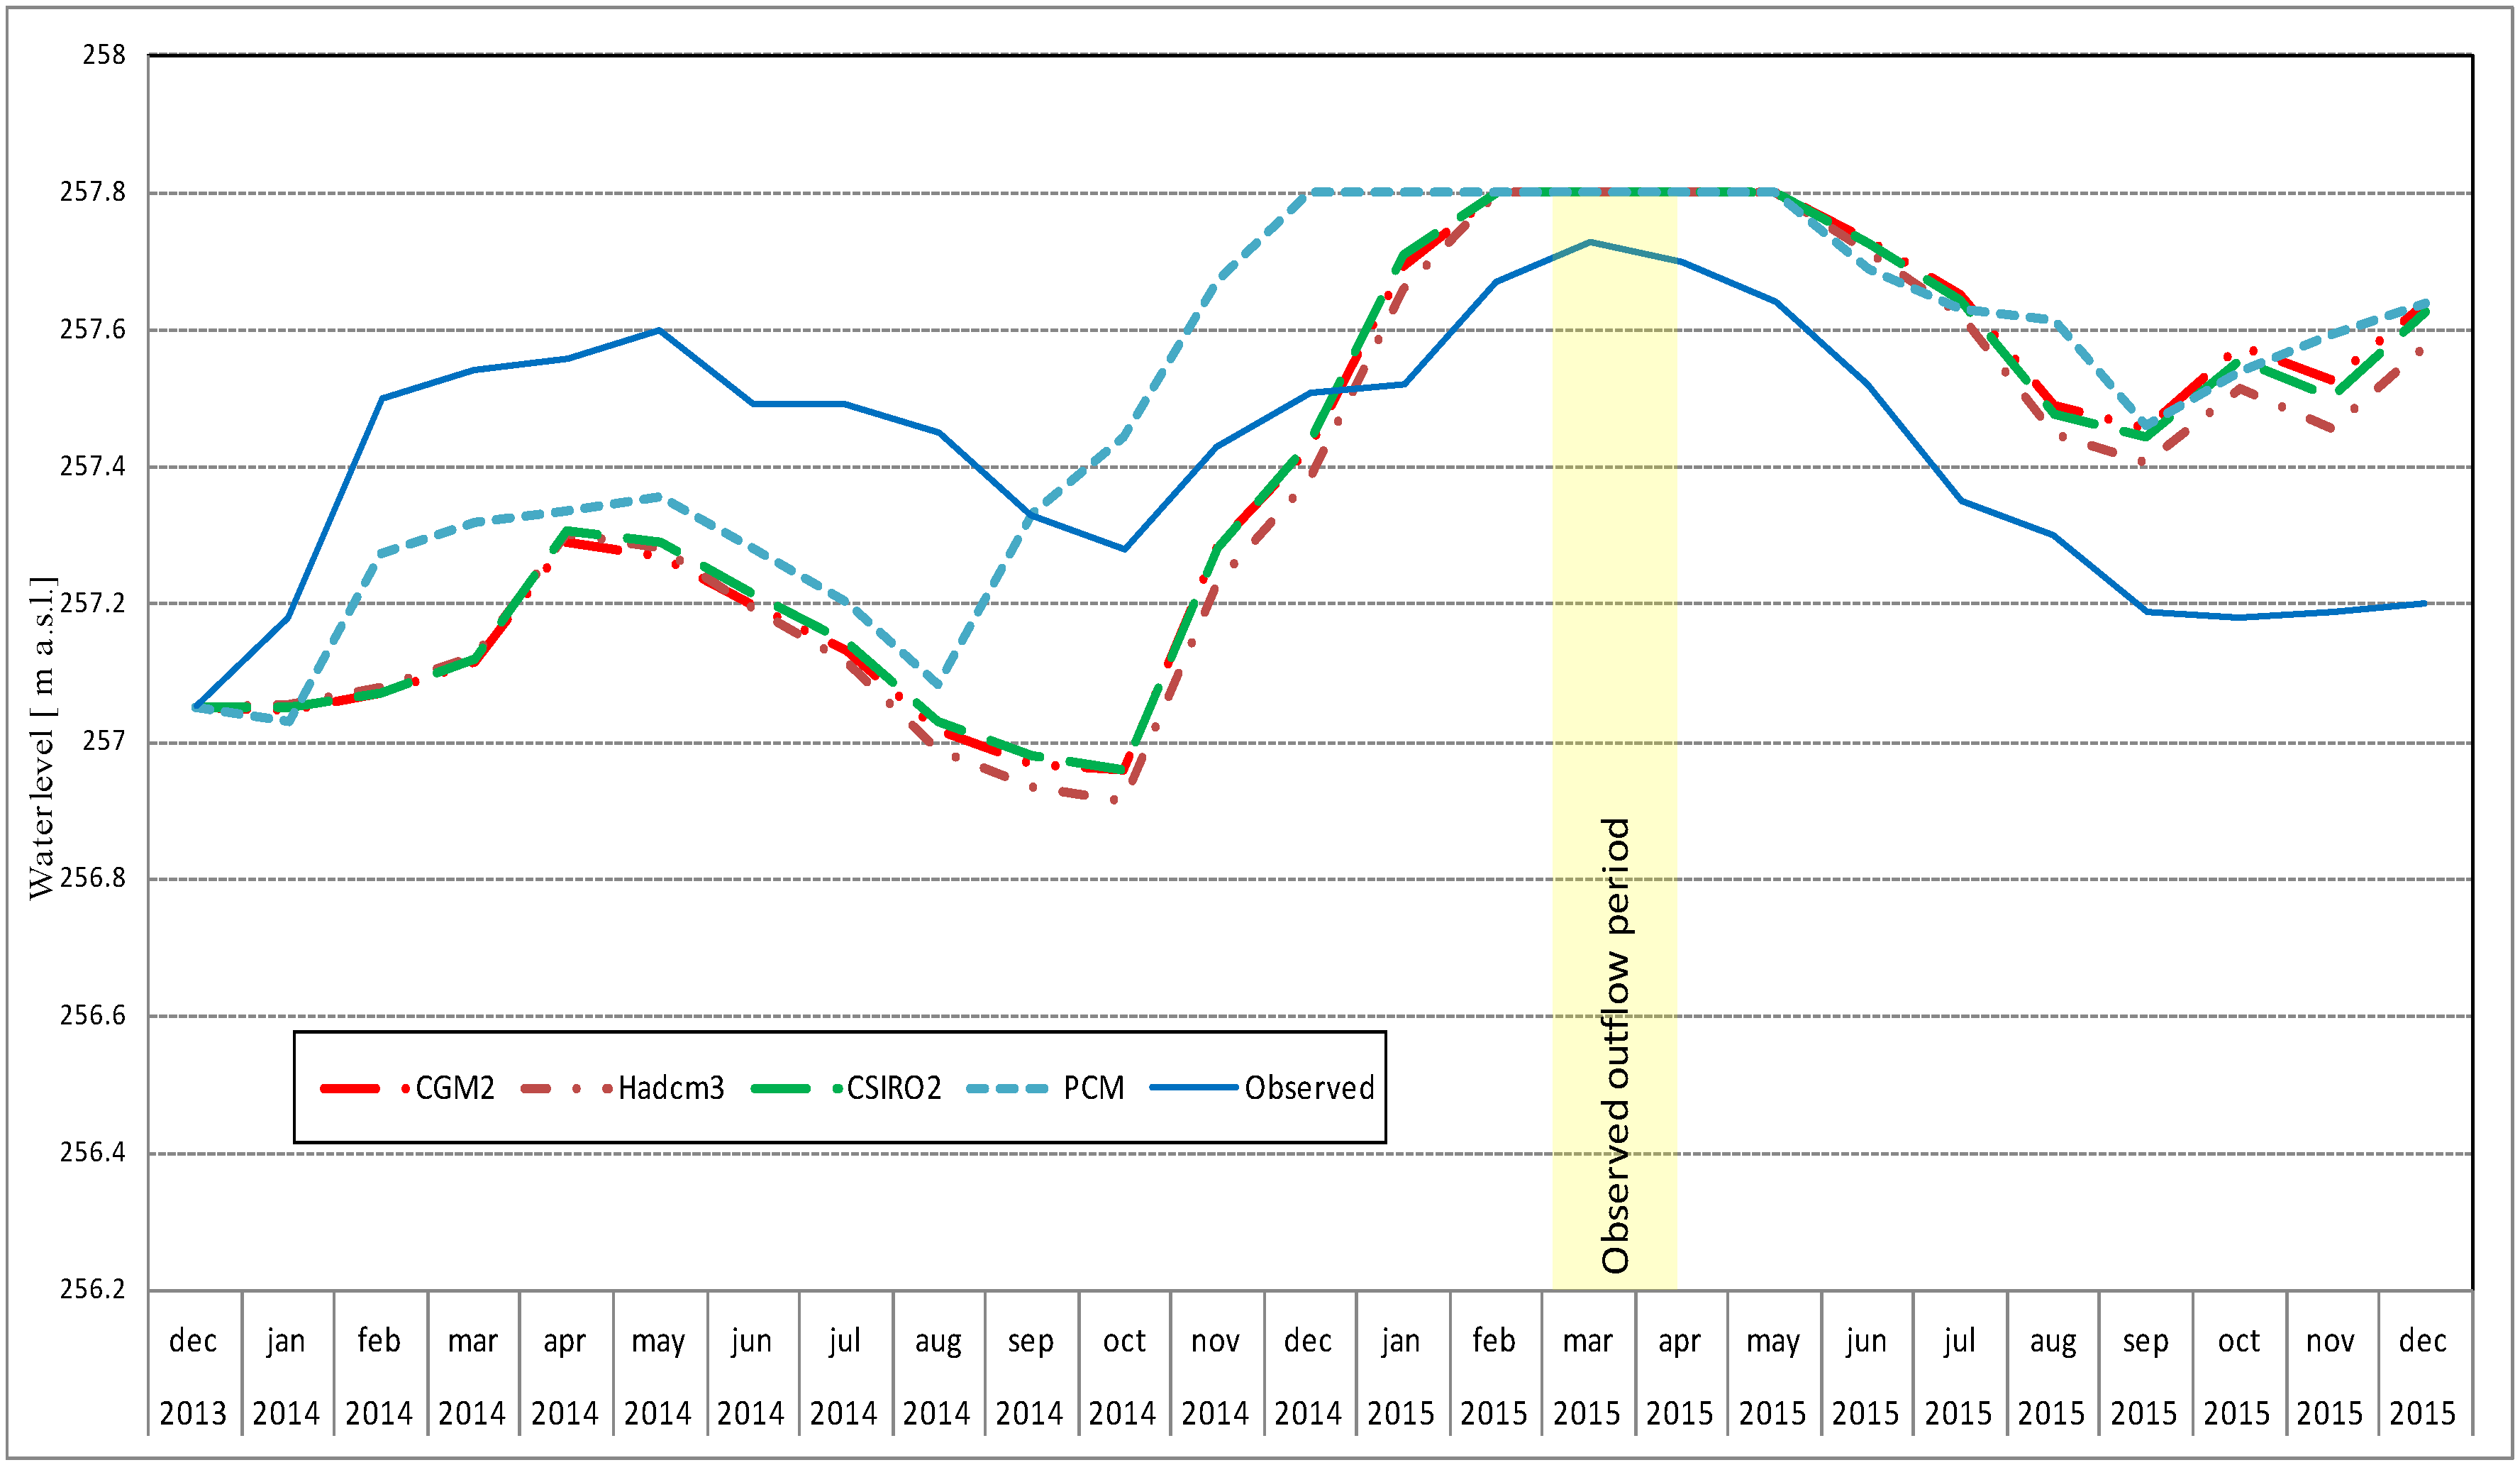
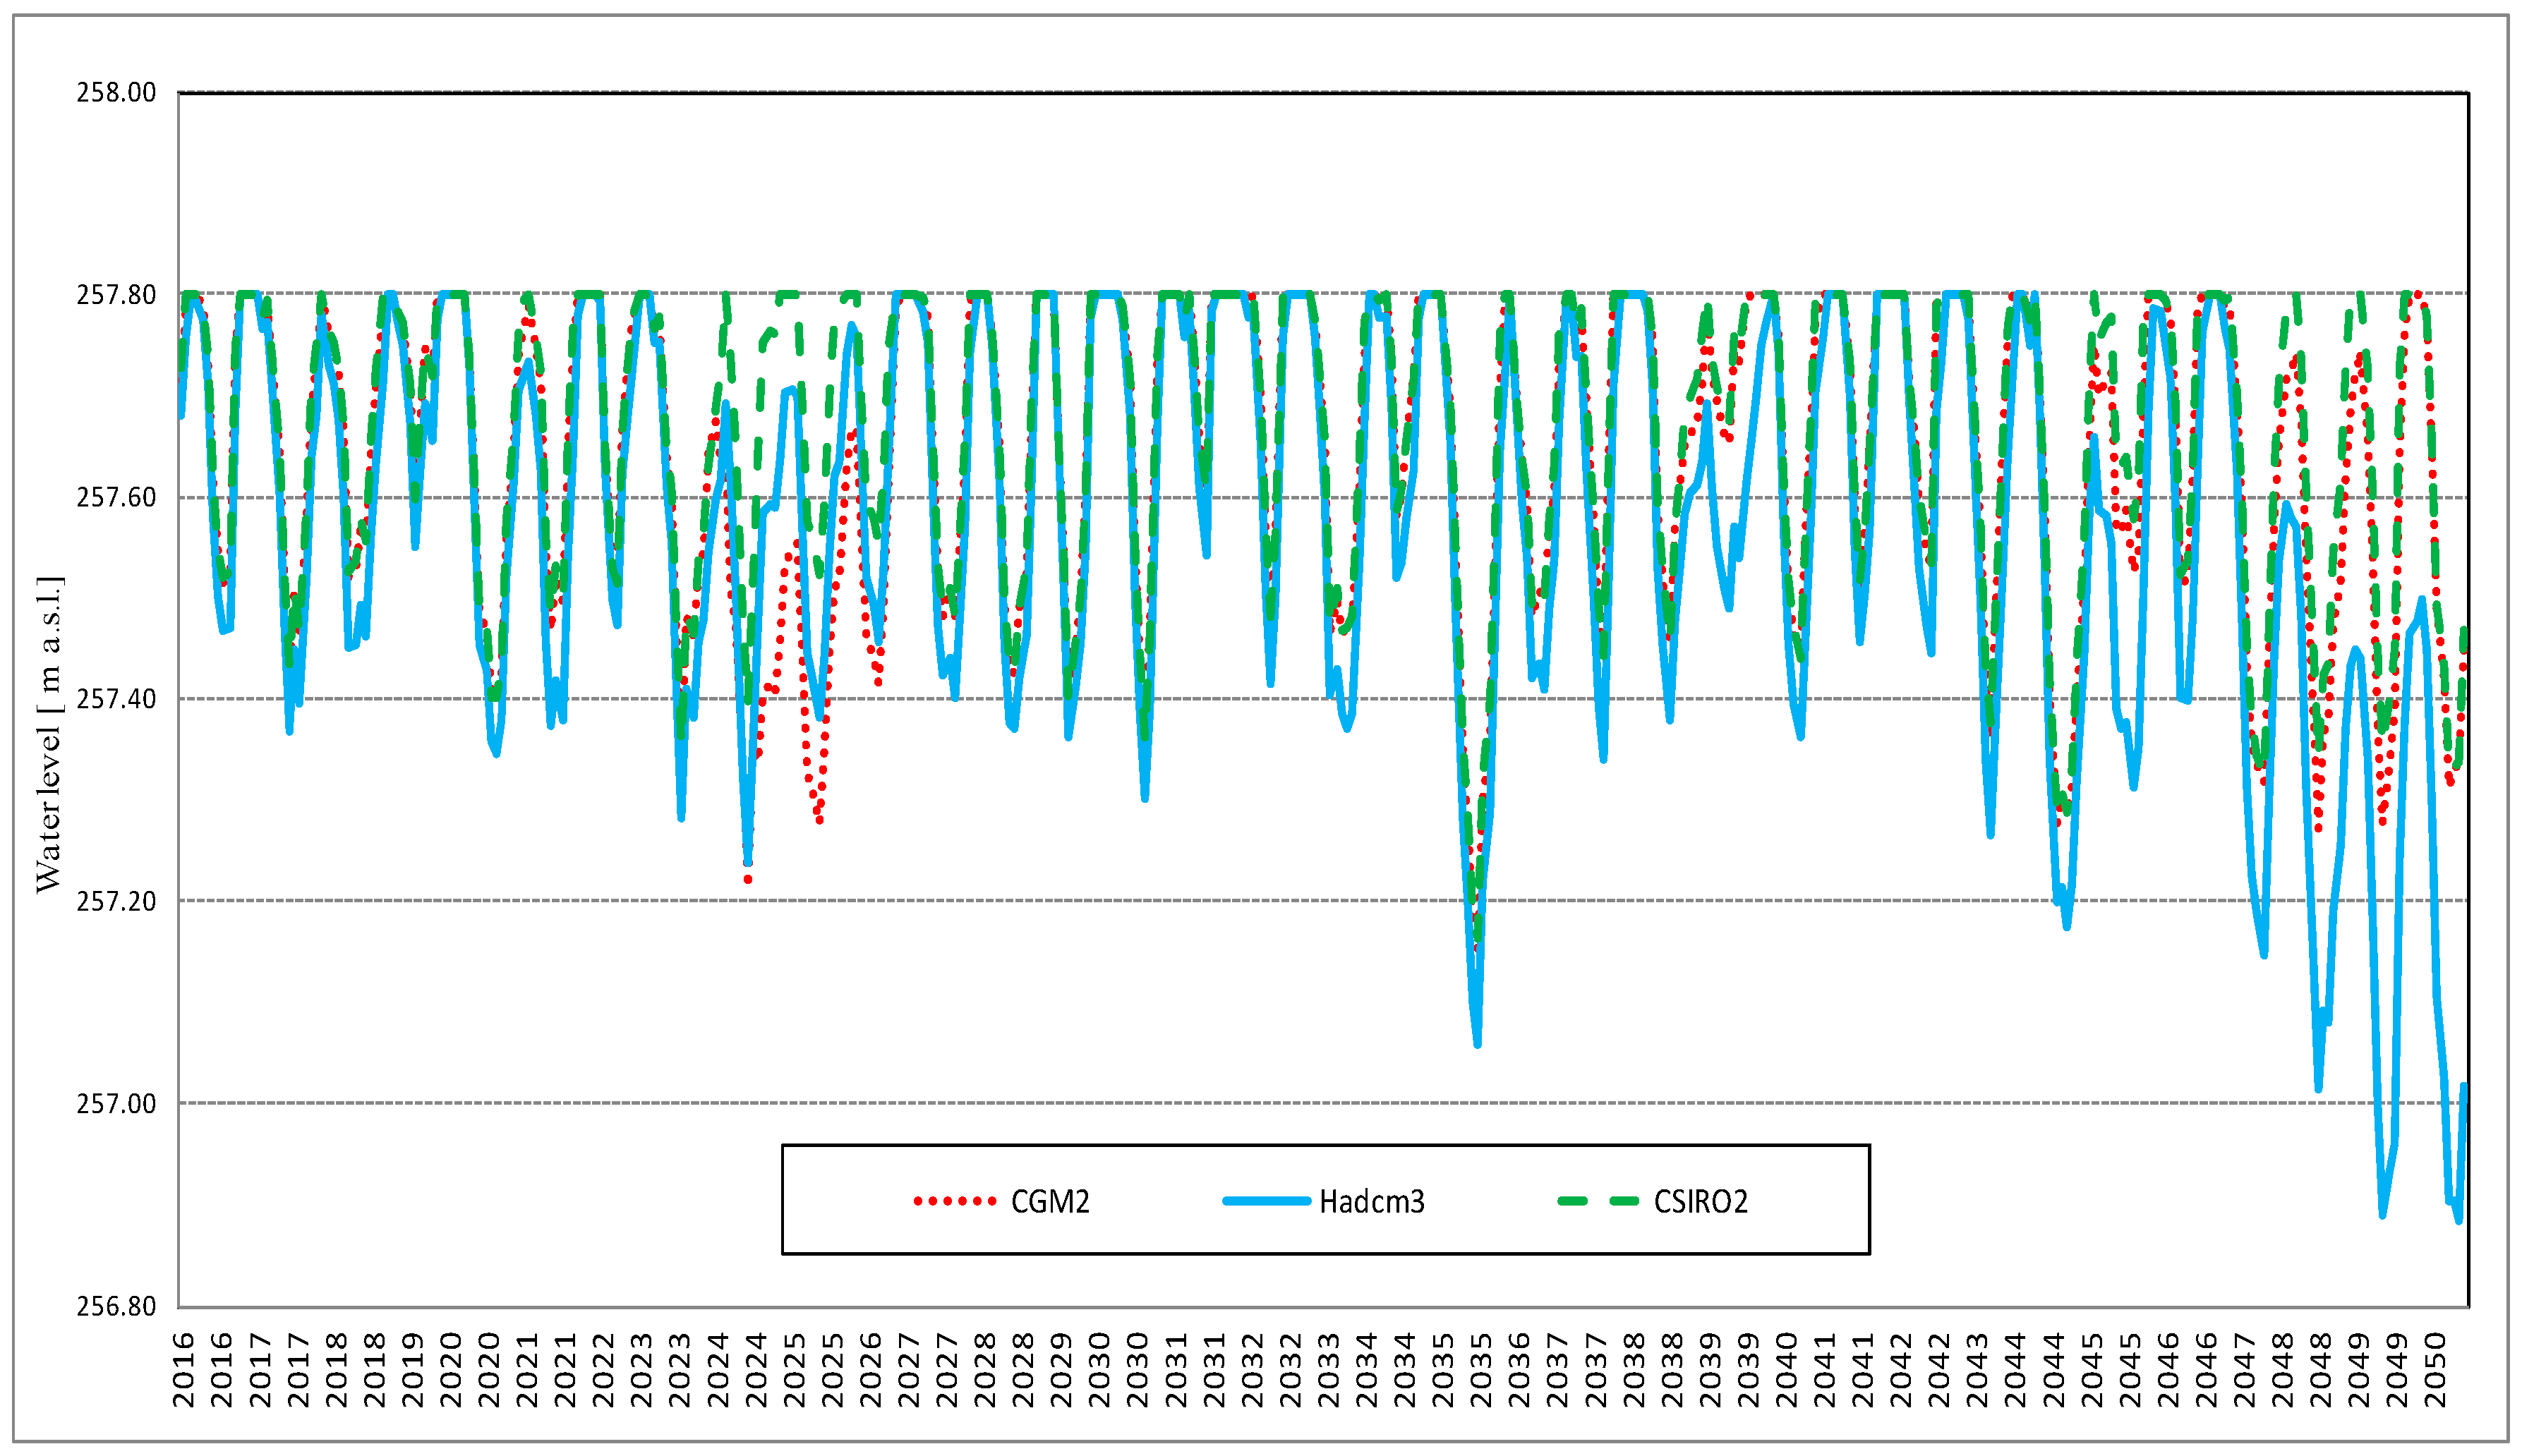
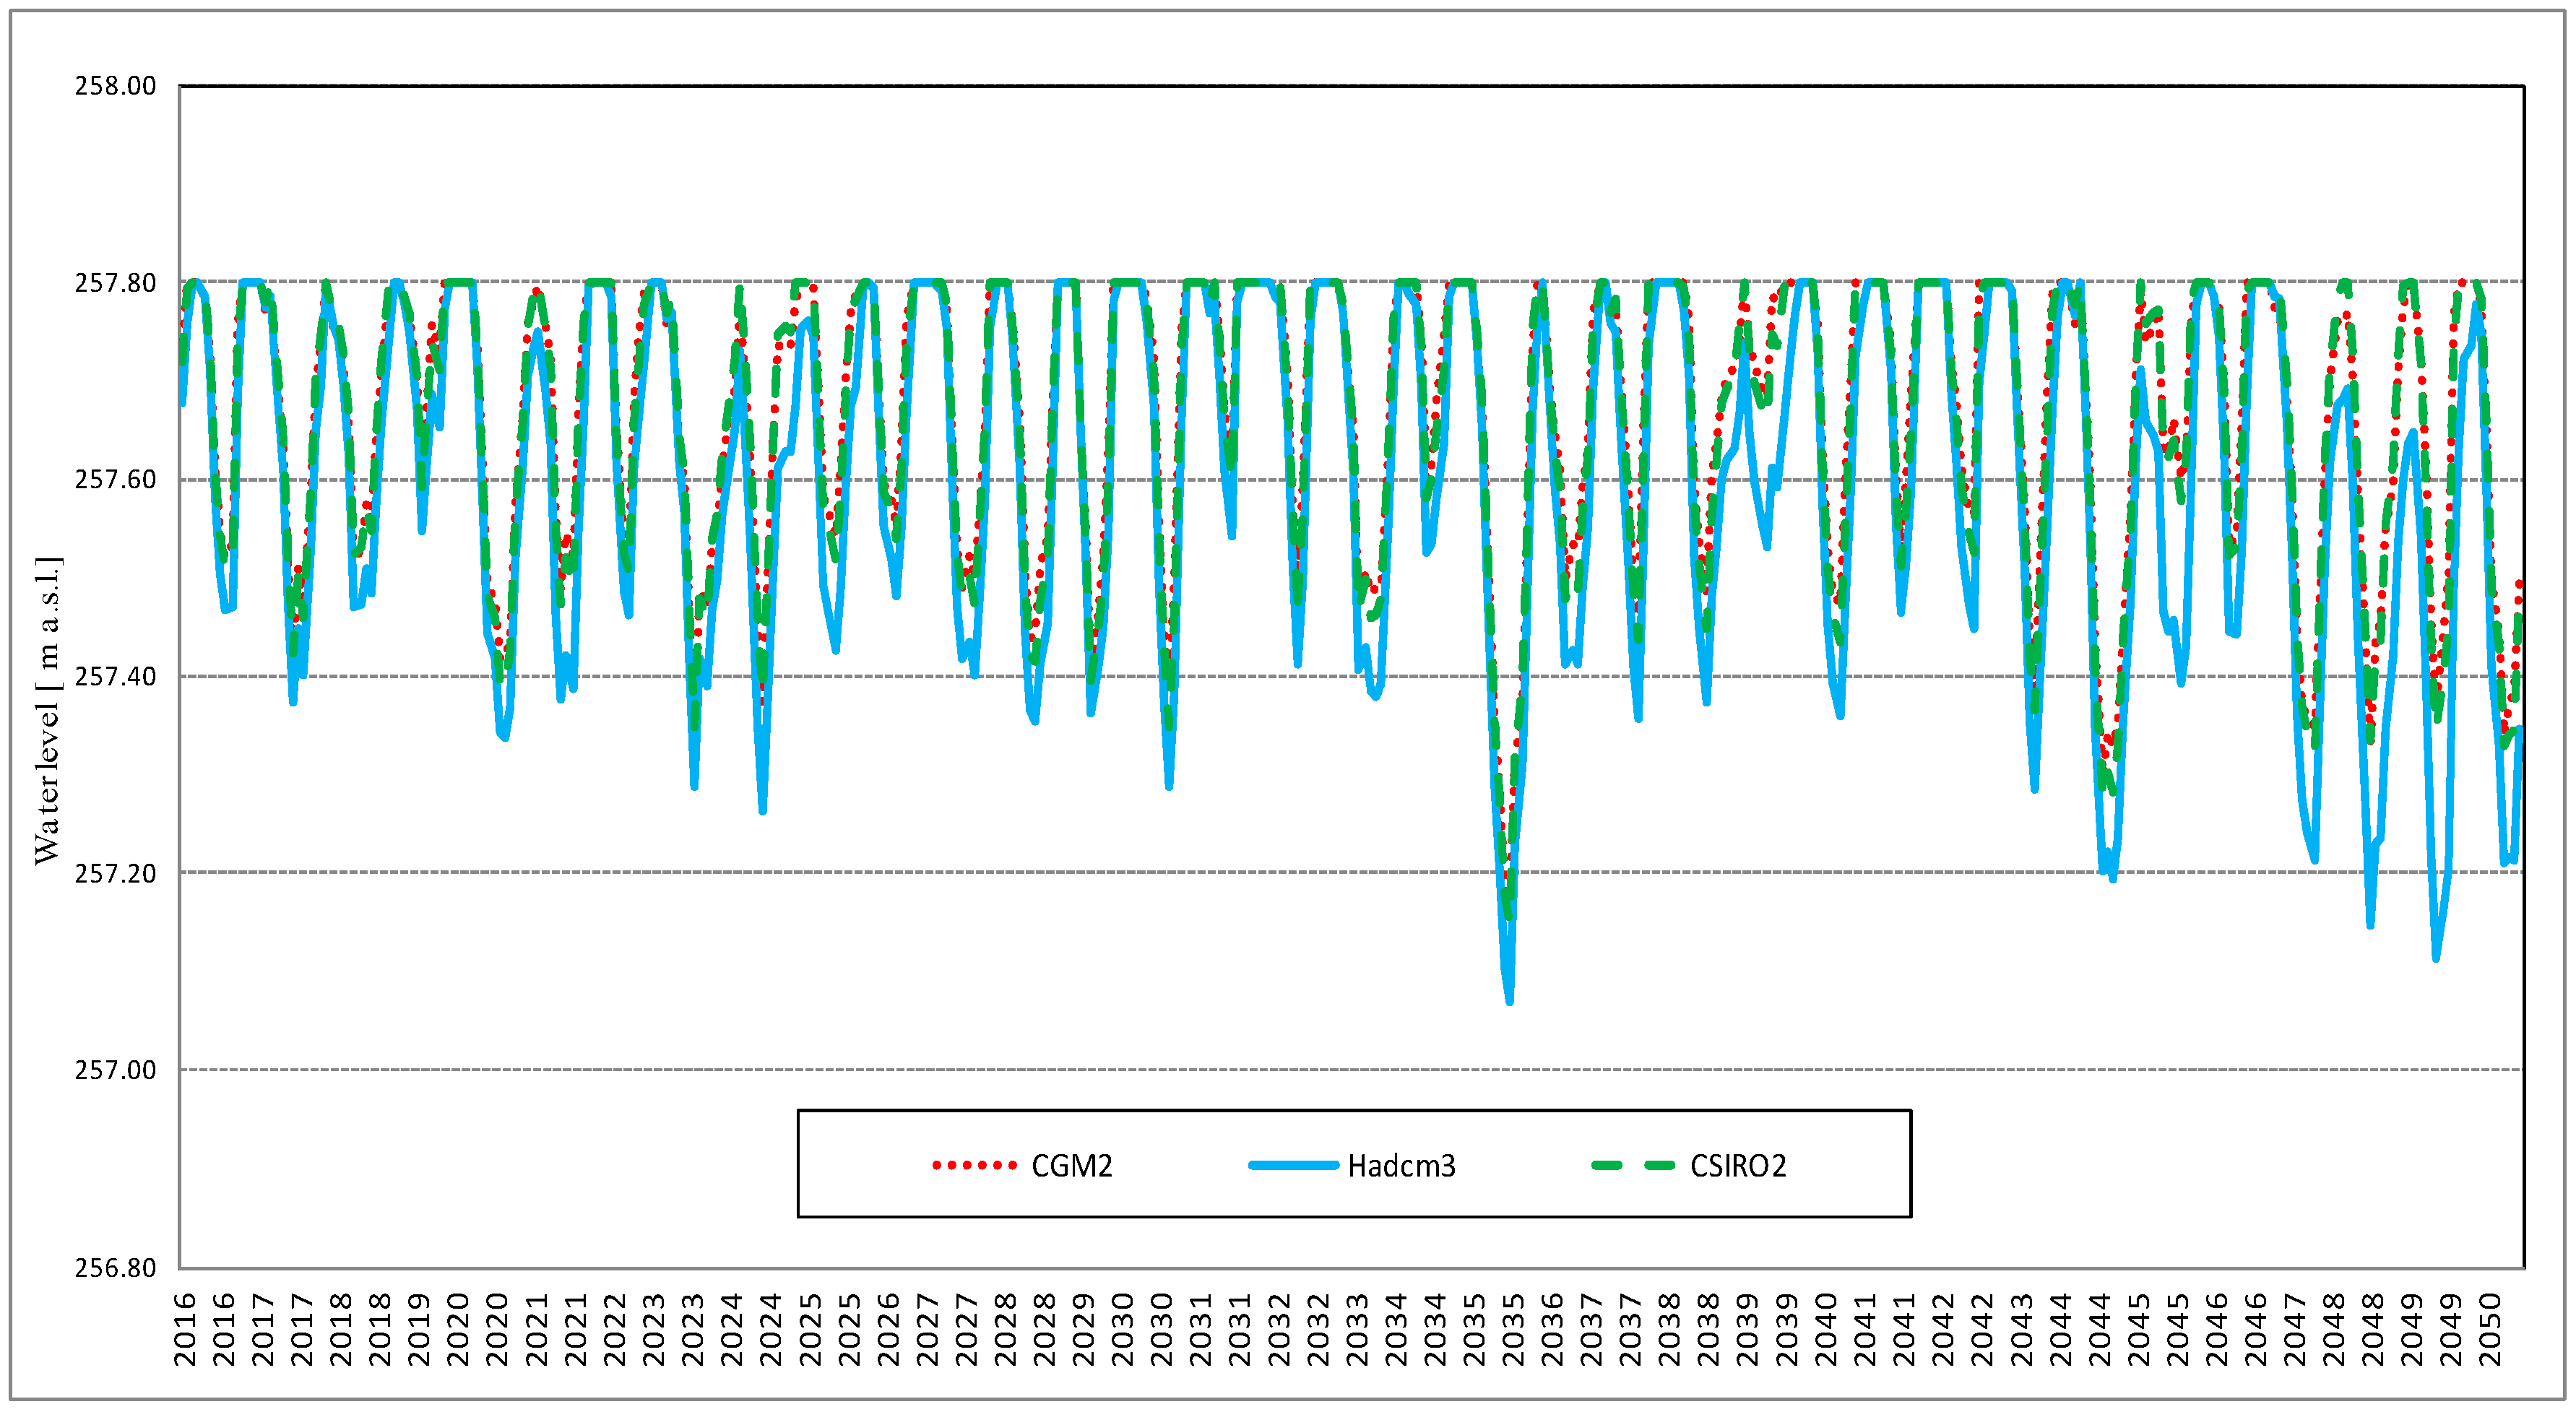
3.2. Lake Trasimeno Levels

The monthly lake levels were calibrated with good accuracy (1963–1999) using Equation (3). The mean error was 1.3%, and only in 3% of cases did the error exceeded 5%, as can also be seen in Figure 9, where observed and estimated water levels are compared. The mean error is lower than the instrumental uncertainty associated with the measurements of the water level. In the validation period (2000–2010), the estimates closely match the observed data, except in the years 2002–2005. This may be due to two specific anomalous weather events: the very dry summer of 2002 and flood events in November–December 2005. During these events, the calibrated average runoff coefficients were inadequate to quantify the water inflow from the watershed. However, the effect of these anomalies turned out to be compensated for at the end of the validation period (2006–2010), thus supporting the reliability of the model in long-term simulations.
For the aim of this study, the simulations carried out took into consideration the same period with the hypothesis about the water release for Lake Trasimeno restoration, which ranged from 10 to 15 Mm3.
The effects of this hypothesis are pointed out in Figure 10, and they can be summarized in a different trend during dry periods with a reduction in the oscillation level range, and an increase in the minimum level of the lake estimated at about 90–110 cm at the end of the time series. These effects can also be translated in a marked increase of the operating period of the lake outlet (Figure 11), which brings a significant increase in water change and a possible better situation in quantitatively and qualitatively.

3.2.1. Climate Change and the Effects on Lake Trasimeno Levels

The importance of the results obtained in the previous sections is supported by the possible future effects of climate change on Lake Trasimeno levels, in particular due to a temperature increasing trend. Previous studies provide a framework for future and more focused investigation [3,42,43]. In this section these assessments were conducted on the basis of climate change scenarios derived from different general circulation models (GCMs).
A set of data processed by the Tyndall Center and stored in a database [44] were used for water level simulations. In particular the data used are a complete set of rainfall and temperature data in a high resolution spatial grids of climate data. Whit this method Equation (3) can be used with terms Pb, Ps and E according to the climate change scenario. The simulations take into account some of the various GCMs and global development scenarios present in the Fourth IPCC Report on Global Climate Change (AR4) [45].
Taking into account the extreme emission scenarios (A1F1 fossil intensive growth, environmental sustainability B2), in Figure 12 and Figure 13 an initial comparison between the observed and simulated lake water levels for the test period (December 2013–August 2015) is shown. The set of CGMs evaluated are Hadcm3, PCM, CGM2 and CSIRO2.
These results already show a good fit to the observed data and the simulated extreme level values, in particular for the Hadcm3, CGM2 and CSIRO2 models. For these models the simulation period was extended to the years 2016–2050.
The predicted patterns of water level changes are shown in Figure 14 and Figure 15. All scenarios show that the water level is expected to fluctuate within the range of the previous years. Only at the end of the simulation period does the trend show a critical condition, more evident in the emission scenario A1F1.
This result must be verified in the next years with the future climate change scenarios, but precaution suggests emphasizing prevention, thus highlighting the importance of the study conducted on the integrated water resources management in this lake system.

4. Conclusions

The present paper describes the results of decision support systems in the management of water resources for complex systems at the basin scale. The philosophy of approach to this problem is that all the administrative and regulatory aspects must be evaluated on the basis of scenarios, and outcomes brought to the attention of several stakeholders. This methodology is particularly important during the increasingly frequent periods of drought, when there is great conflict between the traditional uses of the water resources (industrial, irrigation, hydropower) and the need to protec the lacustrine and fluvial environment.
The case study has highlighted this issue, analyzing the exchange of water between two artificial reservoirs for civil and irrigation use, and the natural basin of Lake Trasimeno, which presents significant environmental problems related to periods of low water levels.
Particular attention should be paid to water availability in each reservoir, to positive increase in Lake Trasimeno levels and related possible negative effects for water users in the hydraulic system of Figure 3. The results obtained from this study show the possibility of calibrating the artificial water transfers in order to reach a sustainable solution to the problem, according to civil and irrigation water uses and the environmental use of water.
The set of simulations shows that it is possible to transfer about 10–15 Mm3/years of water from the Casanova Reservoir to Lake Trasimeno. This strategic solution is also a precautionary solution awaiting possible effects on Lake Trasimeno levels due to climate change scenarios.
From a methodological point of view, this study shows that SimBaT is a very useful DSS tool for highlighting management issues and pointing out their solutions in a dynamic and user friendly way, with the goal of obtaining a water allocation strategy where the conditions of each user cannot be improved if it makes the situation of another user worse. This is very important because many scenarios present very fast evolutionary trends, due to hypotheses concerning climate change or economic trends. However these hypotheses can be easily implemented and quickly evaluated by the DSS tool so that answers can be provided to all the stakeholders.
This principle of sharing of the water resources management approach is a key element in the proposed DSS, which finds its application in the definition of the parameters in “balanced priority”. This “balanced priority” is the main feature of Simbat in the context of the simulation models.
Further developments will be oriented at extending the quantitative approach to a qualitative one in water resources management. For example it will be necessary to test the impact of water inflow on the chemistry of Lake Trasimeno, according to the characteristics of this shallow lake and the characteristics of other linked lakes not belonging to the same basin.
Finally, although the platform is tailor-built for the Tiber River Basin and Lake Trasimeno, it is easy to apply to other basins by using a different layout of the hydraulic system. The goal will always be oriented to a scientific approach for understanding the causes of water resources crises and to give significant information for water resources management under the influence of human activities and possible climate change.

Acknowledgments

We would like to thank the Umbria Region, the Province of Perugia, the Tiber River Basin Authority and the Umbro-Tuscan Authority for Water for their technical support, and the hydro-meteorological data that they provided.

Author Contributions

The authors collaborated in this research project as follows: Stefano Casadei coordinated the research group and contributed to designing, developing and testing all the models. Michele Bellezza and Arnaldo Pierleoni developed the SimBaT Decision Support System and simulated scenarios. All authors discussed the structure and comments on the manuscript at all stages.

Conflicts of Interest

The authors declare no conflict of interest.

References

  1. Deffenu, L.; Dragoni, W. Idrogeologia del lago Trasimeno. Geol. Appl. Idrogeol. 1978, 13, 11–67. (In Italian) [Google Scholar]
  2. Pezzutto, D. Leonardo’s Val di Chiana Map in the Mona Lisa. Cartographica 2011, 46, 149–159. [Google Scholar] [CrossRef]
  3. Ludovisi, A.; Gaino, E.; Bellezza, M.; Casadei, S. Impact of climate change on the hydrology of shallow Lake Trasimeno (Umbria, Italy): History, forecasting and management. Aquat. Ecosyst. Health Manag. 2013, 16, 190–197. [Google Scholar]
  4. Ludovisi, A.; Gaino, E. Meteorological and water quality changes in Lake Trasimeno (Umbria, Italy) during the last fifty years. J. Limnol. 2010, 69, 174–188. [Google Scholar] [CrossRef]
  5. Ubertini, L.; Manciola, P.; Casadei, S. Evaluation of the minimum instream flow of the Tiber River Basin. Environ. Monit. Assess. 1996, 41, 125–136. [Google Scholar] [CrossRef] [PubMed]
  6. Pierleoni, A.; Bellezza, M.; Casadei, S.; Manciola, P. Multipurpose water use in a system of reservoirs. In Changes in Water Resources Systems: Methodologies to Maintain Water Security and Ensure Integrated Management; International Association of Hydrological Sciences: Wallingford, UK, 2007; Volume 315, pp. 107–116. [Google Scholar]
  7. Huang, Y.; Solomatine, D.P.; Velickov, S.; Abbott, M.B. Distributed environmental impact assessment using Internet. J. Hydroinform. 1999, 1, 59–70. [Google Scholar]
  8. Sanches Fernandes, L.F.; Santos, C.M.M.; Pereira, A.P.; Moura, J.P. Model of management and decision support systems in the distribution of water for consumption—Case study in North Portugal. Eur. J. Environ. Civ. Eng. 2011, 15, 411–426. [Google Scholar]
  9. Stefanovic, N.; Radojevic, I.; Ostojic, A.; Comic, L.; Topuzovic, M. Composite Web Information System for Management of Water Resources. Water Resour. Manag. 2015, 29, 2285–2301. [Google Scholar] [CrossRef]
  10. Zhang, D.; Chen, X.; Yao, H. Development of a Prototype Web-Based Decision Support System for Watershed Management. Water 2015, 7, 780–793. [Google Scholar] [CrossRef]
  11. Sridhar, P.S.; Jowhar, T.N.; Garg, A.B.; Kedareswarudu, U. A Framework of Information Technology for Water Resources Management. Int. J. Comput. Appl. 2011, 30, 21–25. [Google Scholar] [CrossRef]
  12. Fedra, K.; Harmancioglu, N.B. A web-based water resources simulation and optimization system. In CCWI 2005 on Water Management for the 21st Century; Savic, D., Walters, G., King, R., Khu, A.T., Eds.; Center of Water Systems, University of Exeter: Exeter, UK, 2005; Volume II, pp. 167–172. [Google Scholar]
  13. Li, C.; Zhou, J.; Ouyang, S.; Wang, C.; Liu, Y. Water Resources Optimal Allocation Based on Large-scale Reservoirs in the Upper Reaches of Yangtze River. Water Resour. Manag. 2015, 29, 2171–2187. [Google Scholar] [CrossRef]
  14. Ahmad, A.; El-Shafie, A.; Razali, S.F.M.; Mohamad, Z.S. Reservoir Optimization in Water Resources: A Review. Water Resour. Manag. 2014, 28, 3391–3405. [Google Scholar] [CrossRef]
  15. Afshar, A.; Shafii, M.; Haddad, O.B. Optimizing multi-reservoir operation rules: An improved HBMO approach. J. Hydroinform. 2011, 13, 121–139. [Google Scholar] [CrossRef]
  16. Yang, J.; Li, G.; Wang, L.; Zhou, J. An Integrated Model for Simulating Water Resources Management at Regional Scale. Water Resour. Manag. 2015, 29, 1607–1622. [Google Scholar] [CrossRef]
  17. Matrosov, E.S.; Harou, J.J.; Loucks, D.P. A computationally efficient open-source water resource system simulator—Application to London and the Thames Basin. Environ. Model. Softw. 2011, 26, 1599–1610. [Google Scholar] [CrossRef]
  18. Kakahaji, H.; Banadaki, H.D.; Kakahaji, A.; Kakahaji, A. Prediction of Urmia Lake Water-Level Fluctuations by Using Analytical, Linear Statistic and Intelligent Methods. Water Resour. Manag. 2013, 27, 4469–4492. [Google Scholar] [CrossRef]
  19. Manos, B.; Bournaris, T.; Silleos, N.; Antonopoulos, V.; Papathanasiou, J. A decision support system approach for rivers monitoring and sustainable management. Environ. Monit. Assess. 2004, 96, 85–98. [Google Scholar] [CrossRef] [PubMed]
  20. Manos, B.; Papathanasiou, J.; Bournaris, T.; Voudouris, K. A DSS for Sustainable Development and Environmental Protection of Agricultural Regions. Environ. Monit. Assess. 2010, 164, 43–52. [Google Scholar] [CrossRef] [PubMed]
  21. Manos, B.; Ciani, A.; Bournaris, T.; Vassiliadou, I.; Papathanasiou, J. A taxonomy survey of decision support systems in agriculture. Agric. Econ. Rev. 2004, 5, 80–94. [Google Scholar]
  22. Sanches Fernandes, L.F.; Marques, M.J.; Oliveira, P.C.; Moura, J. Decision Support Systems in Water Resources in the Demarcated Region of Douro—Case study in Pinhão River Basin, Portugal. Water Environ. J. 2014, 28, 350–357. [Google Scholar] [CrossRef]
  23. Sanches Fernandes, L.F.; Seixas, F.; Oliveira, P.C.; Leitao, S.; Moura, J. Climate-Change impacts on nitrogen in a hydrographical basin in the northeast of Portugal. Fresenius Environ. Bull. 2012, 21, 3643–3650. [Google Scholar]
  24. Niswonger, R.G.; Allander, K.K.; Jeton, A.E. Collaborative modelling and integrated decision support system analysis of a developed terminal lake basin. J. Hydrol. 2014, 517, 521–537. [Google Scholar] [CrossRef]
  25. Altunkaynak, A. Predicting Water Level Fluctuations in Lake Michigan-Huron Using Wavelet-Expert System Methods. Water Resour. Manag. 2014, 28, 2293–2314. [Google Scholar] [CrossRef]
  26. Altunkaynak, A. Forecasting surface water level fluctuations of Lake Van by artificial neural networks. Water Resour. Manag. 2017, 21, 339–408. [Google Scholar] [CrossRef]
  27. Sewagudde, S. Lake Victoria’s Water Budget and the Potential Effects of Climate Change in the 21st Century. Afr. J. Trop. Hydrobiol. Fish. 2009, 12, 22–30. [Google Scholar] [CrossRef]
  28. Di Francesco, S.; Biscarini, C.; Montesarchio, V.; Manciola, P. On the role of hydrological processes on the water balance of Lake Bolsena, Italy. Lakes Reserv. Res. Manag. 2016, 21, 45–55. [Google Scholar] [CrossRef]
  29. Ma, J.; Hipel, K.W.; De, M. Devils lake emergency outlet diversion conflict. J. Environ. Manag. 2011, 92, 437–447. [Google Scholar] [CrossRef] [PubMed]
  30. Grigg, N.S. Integrated water resources management: Balancing views and improving practice. Water Int. 2008, 33, 279–292. [Google Scholar] [CrossRef]
  31. Rossi, G.; Castiglione, L.; Bonaccorso, B. Guidelines for planning and implementing drought mitigation measures. In Methods and Tools for Drought Analysis and Management; Rossi, G., Vega, T., Bonaccorso, B., Eds.; Water Science and Technology Library; Springer: Dordrecht, The Netherlands, 2007; Volume 62, pp. 325–347. [Google Scholar]
  32. O’Reilly, C.M.; Sharma, S.; Gray, D.K.; Hampton, S.E.; Read, J.S.; Rowley, R.J.; Schneider, P.; Lenters, J.D.; McIntyre, P.B.; Kraemer, B.M.; et al. Rapid and highly variable warming of lake surface waters around the globe. Geophys. Res. Lett. 2015, 42. [Google Scholar] [CrossRef]
  33. Arnell, N.W.; Delaney, E.K. Adapting to climate change: Public water supply in England and Wales. Clim. Chang. 2006, 78, 227–255. [Google Scholar] [CrossRef]
  34. Steidl, J.; Schuler, J.; Schubert, U.; Dietrich, O.; Zander, P. Expansion of an Existing Water Management Model for the Analysis of Opportunities and Impacts of Agricultural Irrigation under Climate Change Conditions. Water 2015, 7, 6351–6377. [Google Scholar] [CrossRef]
  35. Simonovic, S.P. Tools for water management—One view of the future. Water Int. 2000, 25, 76–88. [Google Scholar] [CrossRef]
  36. Georgiou, P.E.; Papamichail, D.M.; Vougioukas, S.G. Optimal irrigation reservoir operation and simultaneous multi-crop cultivation area selection using simulated annealing. Irrig. Drain. 2006, 55, 29–144. [Google Scholar] [CrossRef]
  37. Bellezza, M.; Casadei, S.; Manciola, P.; Pierleoni, A. Mathematical model for multipurpose water resource management. In Proceedings of the 22nd European Regional Conference ICID-CIID ERWG, Water Resources Management and Irrigation and Drainage Systems Development in the European Environment, Pavia, Italy, 2–6 September 2007; pp. 1–12.
  38. Dragoni, W.; Valigi, D. Contributo alla stima dell’evaporazione dalle superfici liquide nell’Italia Centrale. Geol. Romana 1994, 30, 151–158. (In Italian) [Google Scholar]
  39. Pierleoni, A.; Camici, S.; Brocca, L.; Moramarco, T.; Casadei, S. Climate change and decision support systems for water resource management. Procedia Eng. 2014, 70, 1324–1333. [Google Scholar] [CrossRef]
  40. Todisco, F.; Vergni, L. Climatic changes in Central Italy and their potential effects on corn water consumption. Agric. For. Meteorol. 2008, 148, 1–11. [Google Scholar] [CrossRef]
  41. Dragoni, W. The Lake Trasimeno and the Climatic Changes, 1st ed.; Provincia di Perugia Servizio Gestione e Difesa Idraulica: Perugia, Italy, 2004. [Google Scholar]
  42. Valigi, D.; Luque-Espinar, J.A.; Di Matteo, L.; Cambi, C.; Pardo-Igúzquiza, E.; Rossi, M. Analysis of drought conditions and their effects on Lake Trasimeno (Central Italy) levels. Acque Sotter. Ital. J. Groundw. 2016, 5, 1–17. [Google Scholar] [CrossRef]
  43. Peppoloni, F.; Bellezza, M.; Casadei, S. The Hydrology of Lake Trasimeno and Climate Change: Simulation scenario and real data. In Proceedings of the Giornate Dell’idrologia (Hydrology Days), Perugia, Italy, 6–8 October 2015; pp. 1–3.
  44. Mitchell, T.D.; Carter, T.R.; Jones, P.D.; Hulme, M.; New, M. A Comprehensive Set of High-Resolution Grids of Monthly Climate for Europe and the Globe: The Observed Record (1901–2000) and 16 Scenarios (2001–2100); Tyndall Centre for Climate Change Research, University of East Anglia: Norwich, UK, 2004. [Google Scholar]
  45. Intergovernmental Panel on Climate Change (IPCC). Climate Change 2007: The Physical Science Basis; Contribution of Working Group I to the Fourth Assessment Report of the Intergovernmental Panel on Climate Change; Solomon, S., Qin, D., Manning, M., Chen, Z., Marquis, M., Averyt, K.B., Tignor, M., Miller, H.L., Eds.; Cambridge University Press: Cambridge, UK; New York, NY, USA, 2007; p. 996. [Google Scholar]
Figure 1. The water crises in 1958 (photographic archive of the “Provincia di Perugia”).
Water 08 00570 g001
Figure 2. Scheme of the water management system (Google image 2010).
Water 08 00570 g002
Figure 3. Sketch of the hydraulic system—Montedoglio—Casanova—Trasimeno.
Water 08 00570 g003
Figure 4. (a) Montedoglio Reservoir, volume stored and spills; (b) Casanova Reservoir, volume stored and spills.
Water 08 00570 g004
Figure 5. Deficit SAT (municipal) and CDC north (irrigation), in scenario n.1.
Water 08 00570 g005
Figure 6. S. Lucia control node, discharge and MIF in scenario n.1.
Water 08 00570 g006
Figure 7. Comparison between the stored water and the spills for the Casanova reservoir with and without releases for Lake Trasimeno (10 Mm3/year).
Water 08 00570 g007
Figure 8. Detail of the stored volumes during the most critical period (1970–1977), with and without releases for Lake Trasimeno restoration.
Water 08 00570 g008
Figure 9. Estimated and observed Lake Trasimeno levels during the calibration phase (1963–1999) and the validation phase (2000–2010).
Water 08 00570 g009
Figure 10. Lake Trasimeno levels observed and with additional water input of 10 and 15 Mm3.
Water 08 00570 g010
Figure 11. Lake Trasimeno water spill frequency.
Water 08 00570 g011
Figure 12. Lake Trasimeno levels observed and simulated in scenario A1F1, test period.
Water 08 00570 g012
Figure 13. Lake Trasimeno levels observed and simulated in scenario B2, test period.
Water 08 00570 g013
Figure 14. Predicted trends of Lake Trasimeno levels in the period 2016–2050, scenario A1F1.
Water 08 00570 g014
Figure 15. Predicted trends of Lake Trasimeno levels in the period 2016–2050, scenario B2.
Water 08 00570 g015

