1. Introduction
Most surveys conducted for global water, sanitation and hygiene (WaSH) research neglect aspects of household water management that are widespread and essential in many developing country settings. Notable among these is the exclusive focus of household surveys on the “primary” source of water for drinking and cooking [
1]. This has led to underrepresentation of multiple water source use in household (HH) water management and its relevance for important and timely issues in global WaSH including hygiene, household water quantity needs, and adaptation of water practices by season and climate resilience. A recent review of on-plot drinking water supplies and health found only five studies that investigated the use of multiple water sources [
2]. Furthermore, none of the five articles cited present data on how multiple water sources are managed within the home.
The importance of multiple household water sources in many developing country settings and the associated gaps in knowledge have been acknowledged recently by WaSH researchers (e.g., [
3,
4]). However, research on and monitoring of multiple water source use is often perceived as too difficult and time-consuming and there have been few efforts to address these issues or to introduce tools that enable research on multiple sources [
2]. This study reports on the potential of a computer-assisted personal interview (CAPI) to conduct fast and accurate research on multiple water sources; and on the application of the instrument in Pacific Island Countries (PICs).
It has been well-documented that some households depend on more than one water source for their domestic water needs [
5,
6]; however, the concept of multiple sources and uses remains poorly understood. One of the earliest explorations of alternative water supplies appeared in
Drawers of Water I [
7], and discussed a range of available water sources in three East African countries, as well as the utility of alterative water sources in households with unreliable piped water supplies. Thirty years later, in
Drawers of Water II, the reported rate of multiple sources was higher, and it was found that water source selection was largely dependent on the intended use, with unimproved sources commonly reserved for non-consumptive purposes [
8]. This association of water sources and uses has been referred to as the “rationality factor”, to describe the value- and preference-driven selection of a particular water supply for a given domestic function [
9]. Multiple water sources are commonly employed in settings without affordable access to a single continuous source of high-quality water; however the complex behaviour of how this is managed has not received adequate attention [
3]. The type and perceived quality of a given water source dictates how it is used by the household, with the highest quality source commonly reserved for drinking and cooking [
9,
10,
11]. However, the academic literature on this topic is surprisingly limited. In rural Vietnam, rainwater was found to be the most common water source for a variety of uses, but during the dry season it was reserved for high-value consumptive needs [
11]. In Cambodia, certain households appear to value the quality of rainwater more highly than water piped to their homes, and resort to purchasing untreated river water from tanker trucks when more preferred sources are unavailable [
4]. The number and acceptability of available water sources drives a complex behavioural pattern for managing water within the home, made even more complicated by seasonal differences, extreme weather events, and increasingly pronounced climate variability. Unfortunately, most conventional WaSH surveys are ill-equipped to explore these multiple water sources and their uses.
A small number of academic papers have explored the phenomenon of multiple water sources and the way that they are managed at the household level. Howard et al. (2002), pioneered a novel study that characterized different water sources and uses within the homes of low-income communities in Uganda, as well as factors that influenced source selection [
12]. In 2013 a report was published that highlighted the critical role of multiple sources in providing sufficient volumes of water to communities in South Africa, Ghana and Vietnam [
3]. The report included the location of water use, a technique that more accurately measures the quantity of water consumed and characterizes off-site use, but the authors did not report on the effect of seasonal change on the availability of water and the impact this has on household water management. In light of the findings of our survey administered in the Solomon Islands and the Republic of the Marshall Islands, there is evidence to suggest that seasonal change plays a significant role in the selection and application of different household water sources [
13]. Other authors have impressed how household management of multiple sources is strongly linked to patterns of water quality and availability that are governed by seasonal change [
11,
14]. A survey instrument developed by Whittington (2000), enabled data collection on multiple water sources and uses by providing an instrument for data collection on the interconnectedness of dynamic household water sourcing and seasonal variability [
15]. While the data generated by this survey is considered the gold-standard in the differentiation of multiple water sources and uses, it has not been widely adopted [
2]. It is considered too time consuming and difficult to implement because of its intricate grid-pattern framework, numerous skip sequences and extensive length.
CAPI approaches using handheld tablets or rugged laptop computers to facilitate survey delivery by enumerators, have been widely applied in other fields [
16,
17,
18] and are becoming more common in WaSH research, but the majority of studies are still performed using paper-based surveys, or pen and paper interviewing (PAPI). No studies were found that employed CAPI to investigate household water management. As survey instruments grow in complexity to include new parameters such as multiple water sources, they become cumbersome and difficult to use, especially for enumerators with limited training. Skip patterns and conditional logic statements, where new questions arise or are removed from the survey on the basis of respondent responses, create confusion when enumerators are required to navigate the survey using the kind of post-script instructions belonging to PAPI methods. In contrast logic statements are algorithms built into the CAPI framework that can be used to limit numerical data entry to valid ranges only, bypass questions not relevant to the respondent, and ensure responses to mandatory fields. In CAPI, skip patterns are automated—enumerators are not required to navigate the survey themselves—and this not only simplifies survey progress, but it also reduces data entry errors and missing responses [
19]. This simplification and increased efficiency is believed to increase the speed at which surveys can be administered [
20,
21], without compromising data collection accuracy [
22]. While some studies have reported that CAPI surveys take longer to complete [
23] it has been posited that this is a function of survey design and study methodology [
20], which have greatly improved over time through technology development [
21]. These advancements of CAPI methods and digital survey platforms, such as SurveyCTO, have made it possible to develop and implement complex WaSH surveys that were previously believed to be too time consuming and too complex to be practical using PAPI methods.
This paper reports on a novel approach to the investigation of multiple water sources using a complex household survey administered using CAPI. Our research objectives were: (a) to determine whether the transition from paper-based to tablet-based surveys led to improved time-efficiency; (b) to determine whether the time per survey continued to decline as enumerators become more proficient with the tablet-based survey; and (c) to evaluate whether the tablet-based survey delivered better quality data. Critically, this study highlights the need for novel instrumentation to resolve the global deficiency of information on multiple water sources and the complex behavioural patterns associated with household water management.
2. Materials and Methods
The original PAPI survey used in this study evolved from a questionnaire designed to investigate multiple water sources and uses within households [
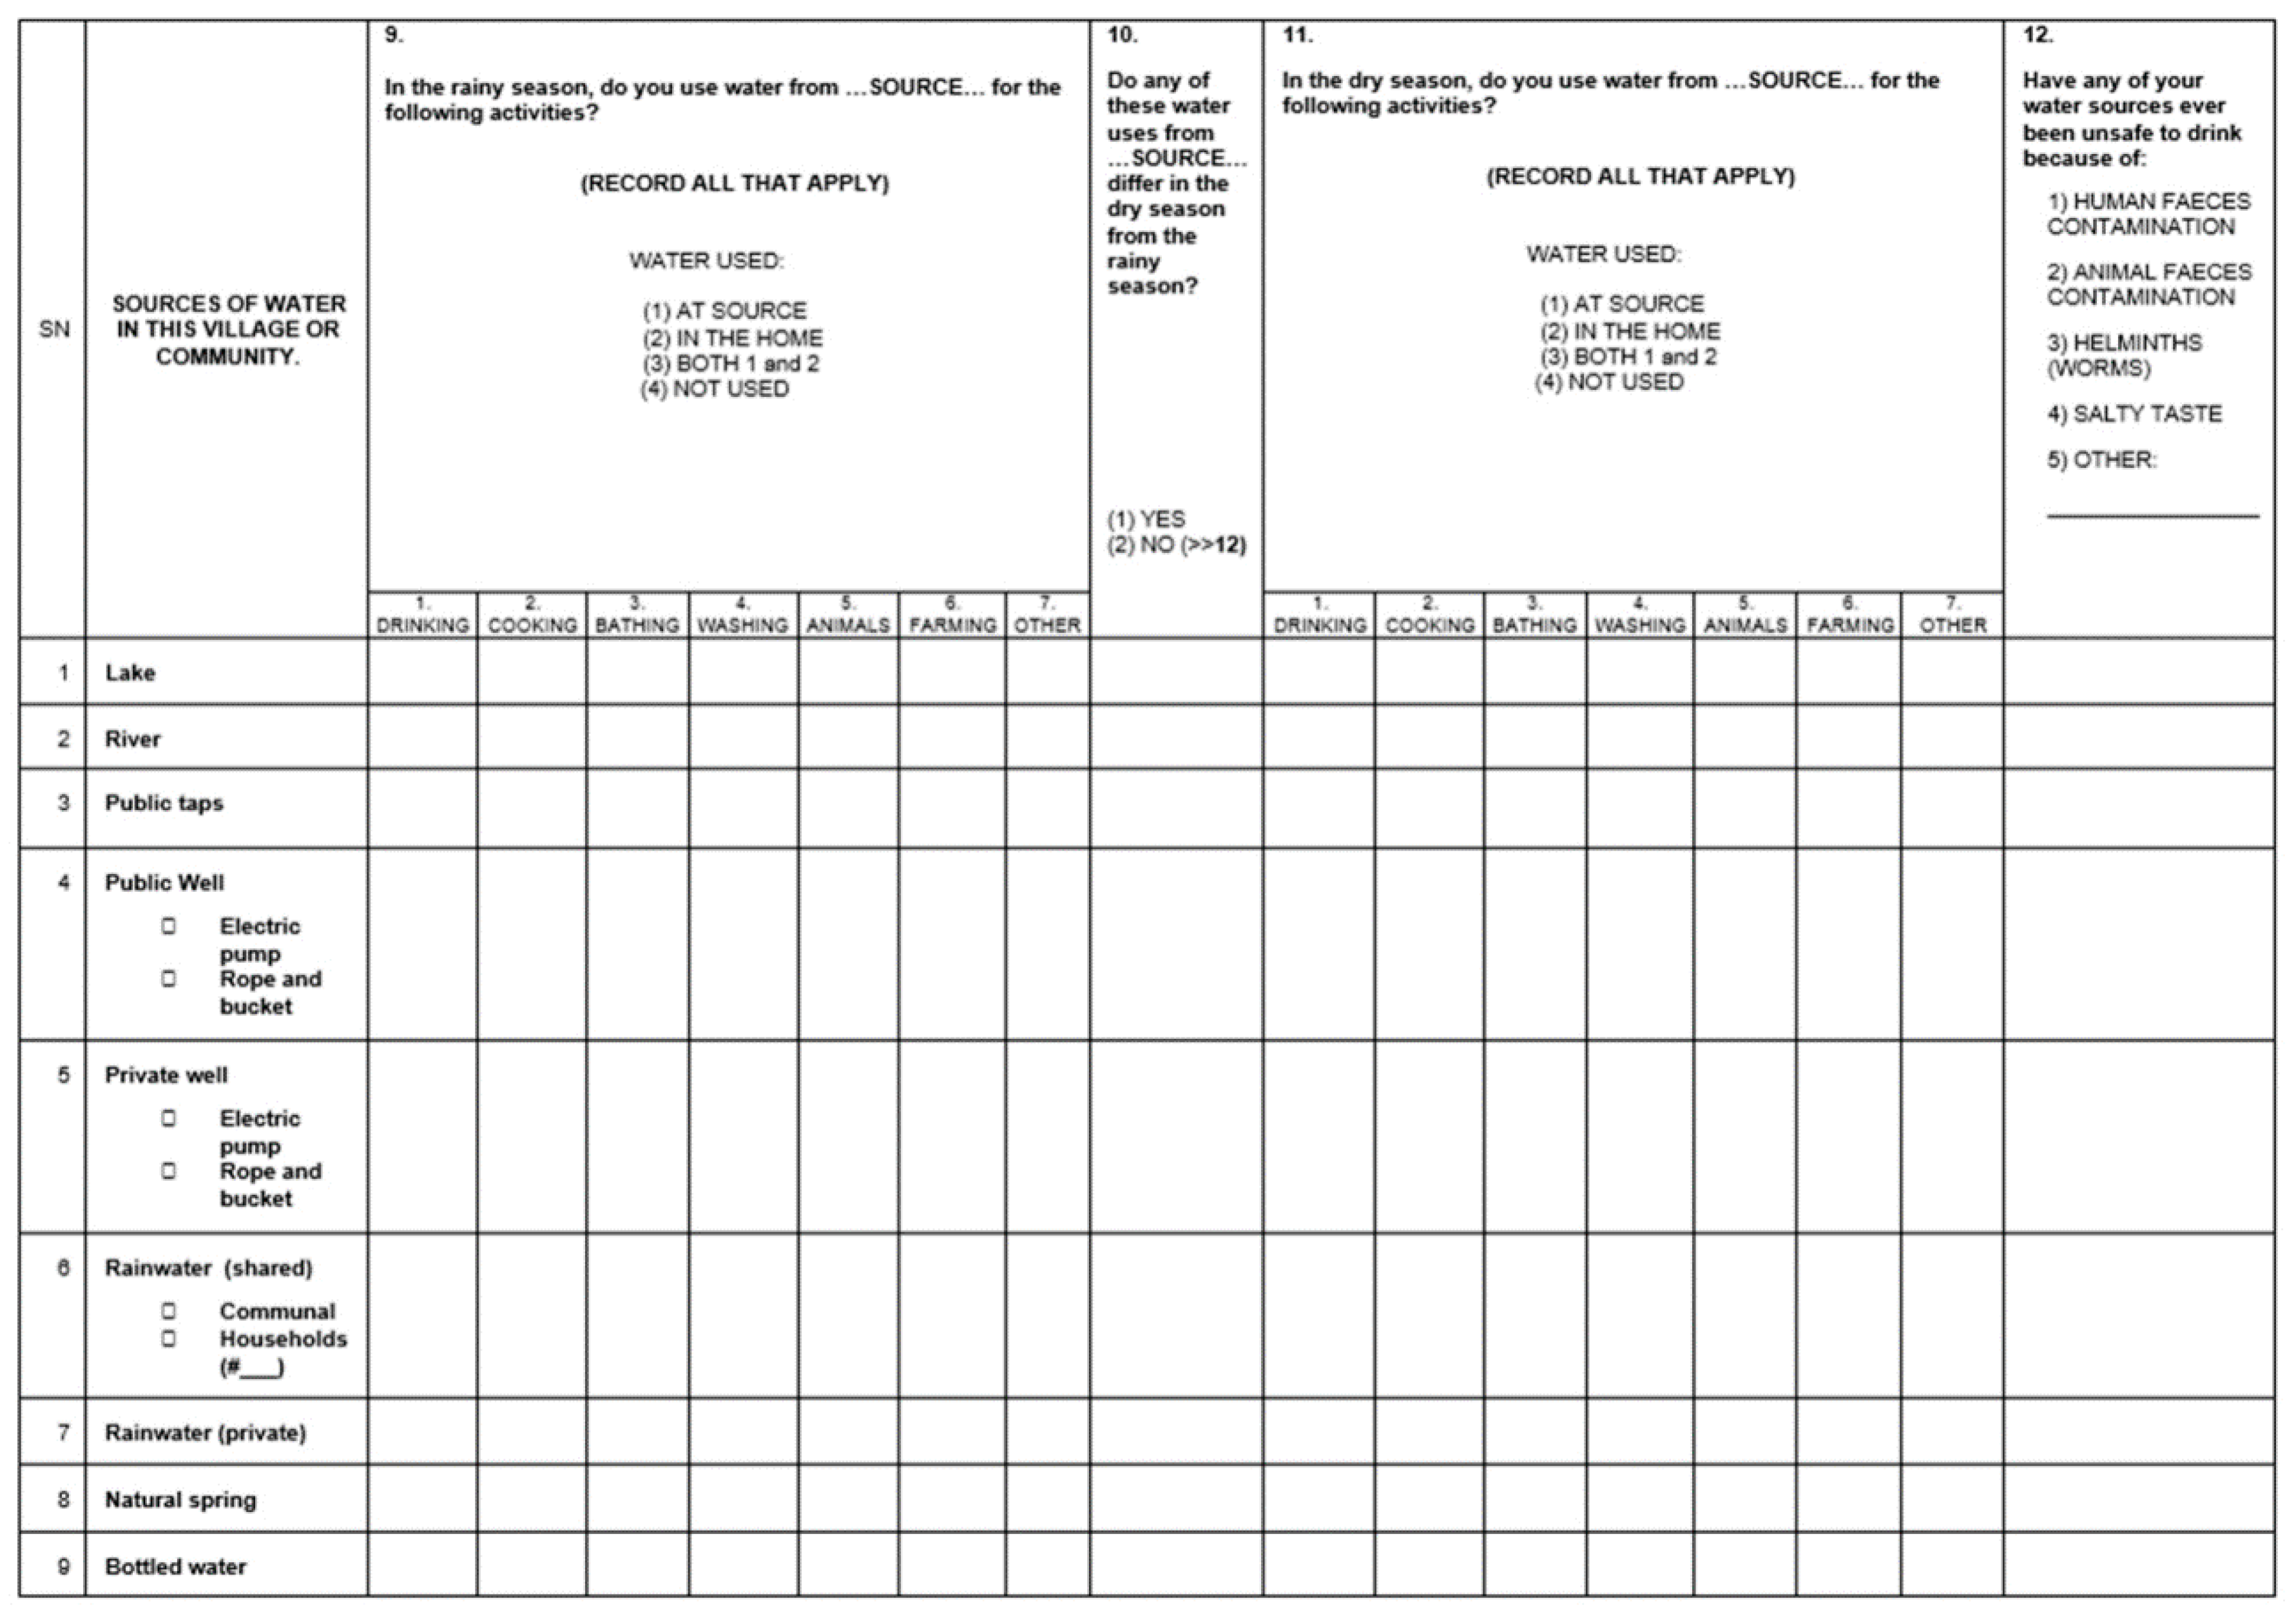
15]. We expanded the survey from 44 questions and 11 pages to incorporate elements on location of use, and the impact of extreme events such as flood, drought and cyclones on household water management. These changes substantially increased the length and complexity of the PAPI version, adding 52 questions and 3 pages (
Figure 1). Seven pages of the PAPI survey had 10 rows and between 12 and 18 columns, requiring the enumerator to enter information directly into the grid format, whilst also recognizing and adhering to the survey’s 70 skip patterns and 7 nested loops of questions to be repeated for each viable household water source. The CAPI survey was developed with SurveyCTO technology based on open data kit platforms (
https://opendatakit.org), and administered using a Samsung Galaxy Note Tab 3 Lite. It was designed to mimic the protocol of the paper-based survey, such as the question grid pattern, and provide the same kind of flexibility afforded by PAPI, including providing options for adding clarifying comments.
The CAPI survey was designed to increase the quality of data collection, and facilitate its ease of use by local research staff. In order to reduce the number of data entry errors, the CAPI used embedded skip patterns that automatically triggered questions contingent on earlier responses. Dropdown lists and closed-ended questions were employed to avoid spelling ambiguities and reduce the frequency of unclear responses, and unique identifier numbers and temporal information on survey start and finish times were automated to increase efficiency. The initial investment required to construct the CAPI should not be underestimated; however, the open data kit platform employed by SurveyCTO uses a streamlined Microsoft Excel interface that reduces barriers and increases accessibility relative to other CAPI programming interfaces [
20].
Six local enumerators, three in the Solomon Islands (SI) and three in the Republic of the Marshall Islands (RMI), attended three full days of detailed instruction and practical exercises. Information sessions on the importance of informed consent, operational definitions, question understanding, and survey structure formed the bulk of the training. Enumerators with less computer experience required more time to familiarize themselves with the CAPI survey. However, SurveyCTO runs on Android OS, the dominant operating system for smart phones and tablets in developing countries, and most enumerators had prior experience with the operating system. Critically, the CAPI survey reduced the need for explanation of rules around skip patterns and nested loop questions. The need to recruit enumerators fluent in multiple local dialects proved to be more important than previous computer or tablet experience. After training and prior to data collection, the PAPI survey was field tested in Nomoliki, a peri-urban community of Honiara (SI), and the CAPI survey was field tested in Jenrok, an urban community of Majuro (RMI). Adjustments were made to improve question clarity, facilitate delivery, and troubleshoot any technical issues with the CAPI.
The survey was conducted in five communities in SI and eight communities in RMI between August 2014 and November 2015. The CAPI version was implemented in three communities in SI (households n = 56) and eight communities in RMI (households n = 235). Two communities in SI received the PAPI version (households n = 44) before the study transitioned to CAPI. Only one of three enumerators from SI conducted household interviews with both PAPI and CAPI surveys. Enumerators from RMI used the CAPI survey exclusively because they were faster and easier to use and our opportunity for data collection in RMI was time-sensitive.
2.1. Analysis
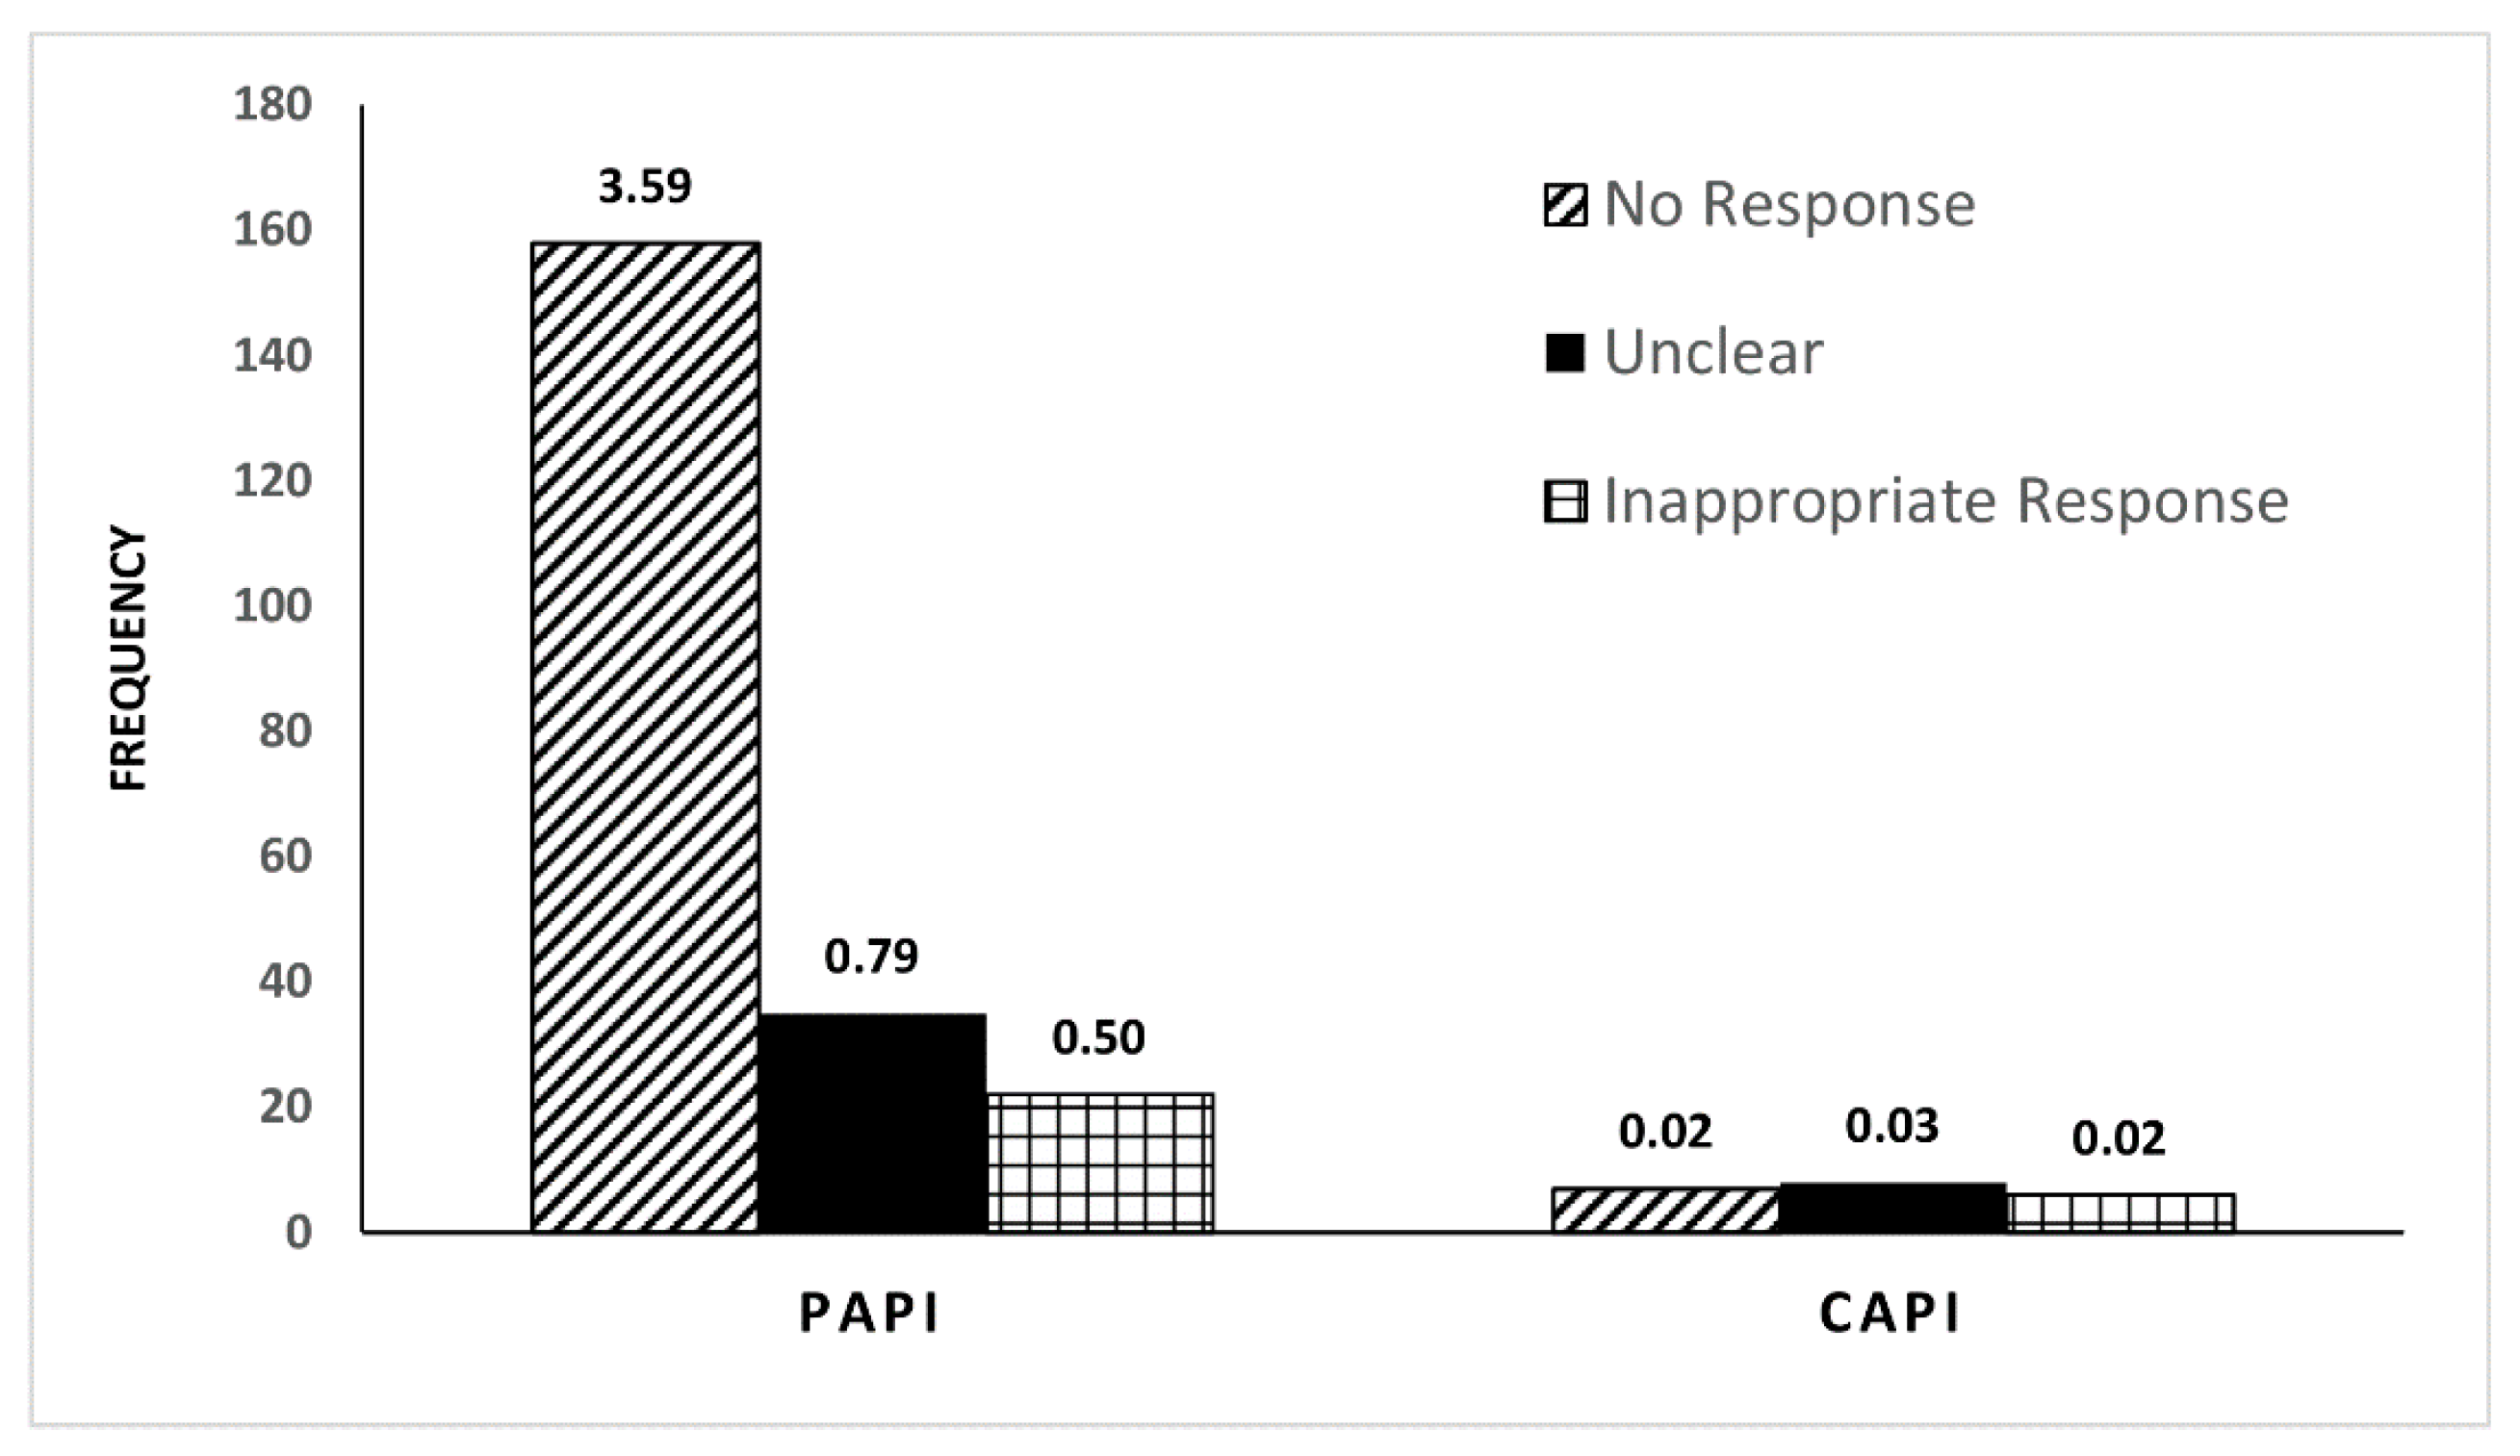
Survey duration was automatically captured in the CAPI version, but start and finish times were not recorded as part of the PAPI protocol. Therefore, we use field notes and dated surveys to compare the mean of surveys performed per hour as a proxy measure of time-efficiency. Erroneous data points for survey duration had to be removed from the dataset for situations in which the two enumerators were working in different areas and only one global positioning system (GPS) was available. In these cases the GPS coordinates could not be collected until later in the day, generating a false result for survey duration. Data quality is assessed by the number and type of data entry errors made by enumerators, including: (a) missing responses, such as unanswered questions and incorrect navigation of skip patterns; (b) unclear responses, in which notes made by the enumerators are illegible or the language used is ambiguous; and (c) inappropriate responses, where the recorded response does not reflect the question for which it is intended.
Out of range responses, numerical entries that exceeded the range of the response field, were also classified as inappropriate responses. This is not to be confused with data outliers, which were not assessed or removed from the data set. The three error types discussed in this paper represent unusable data points that were identifiable as mistakes made by enumerators during survey administration. We had no way of verifying the legitimacy of values entered that fell within the range of the data entry field. Therefore, data entry errors that were not missing responses, unclear, or exceeding the numerical range of the response field went undetected and were not included in our analysis. Additionally, field notes entered by enumerators at the beginning and the end of the CAPI survey are used to identify points of confusion or difficulties with the survey.
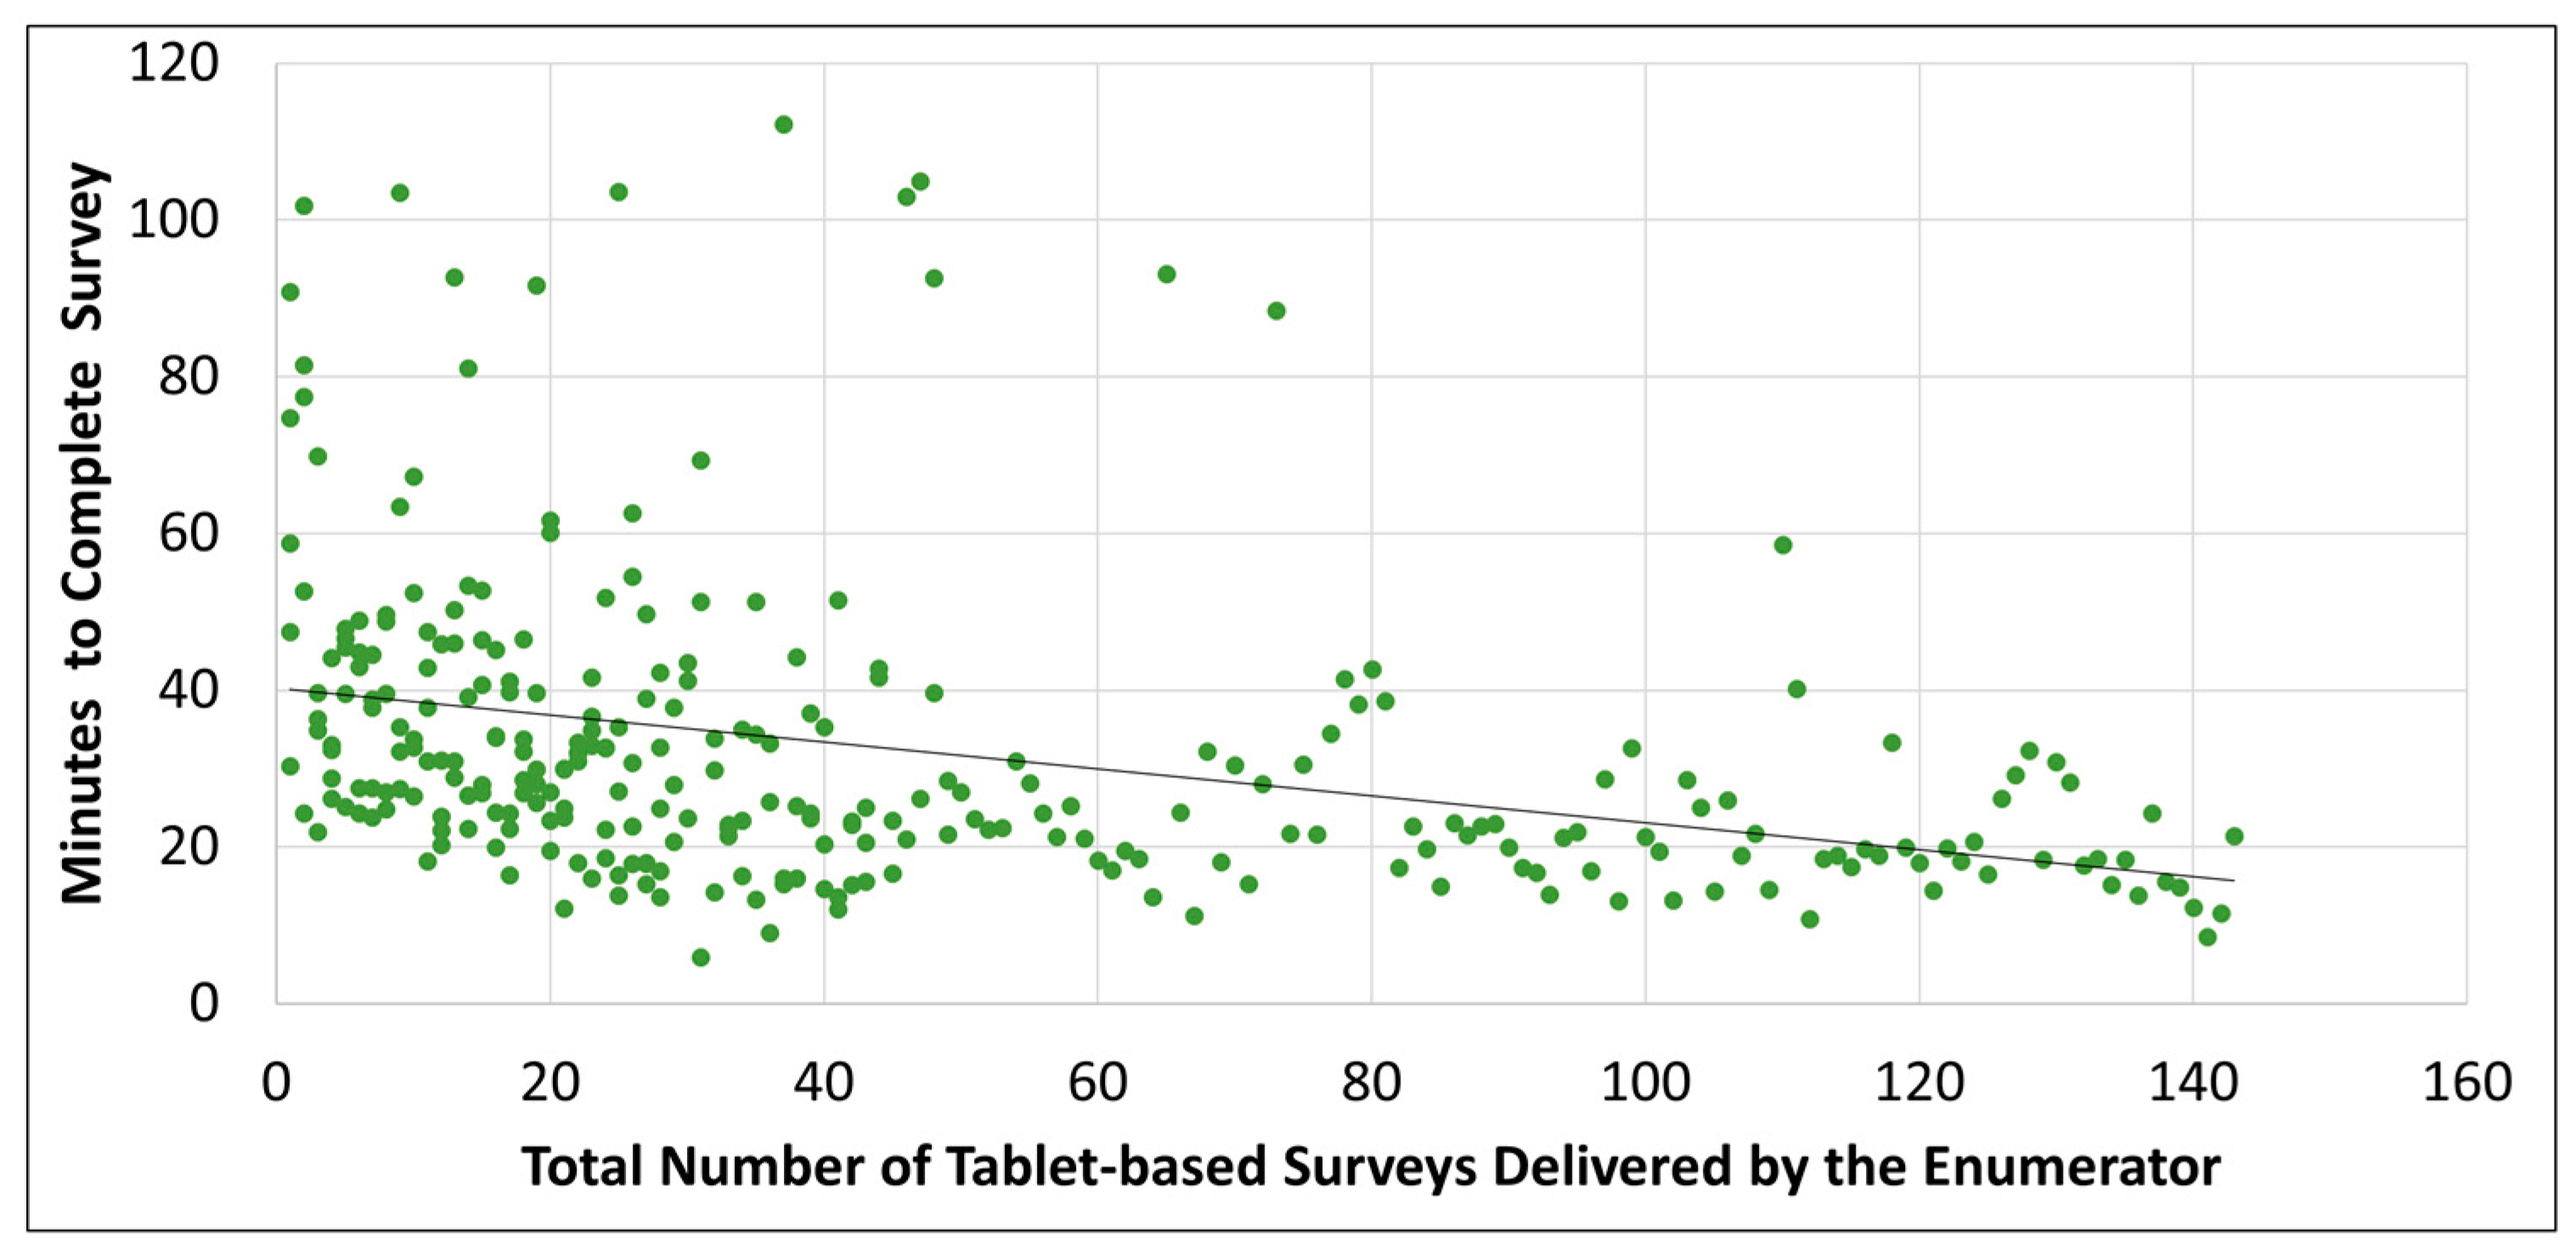
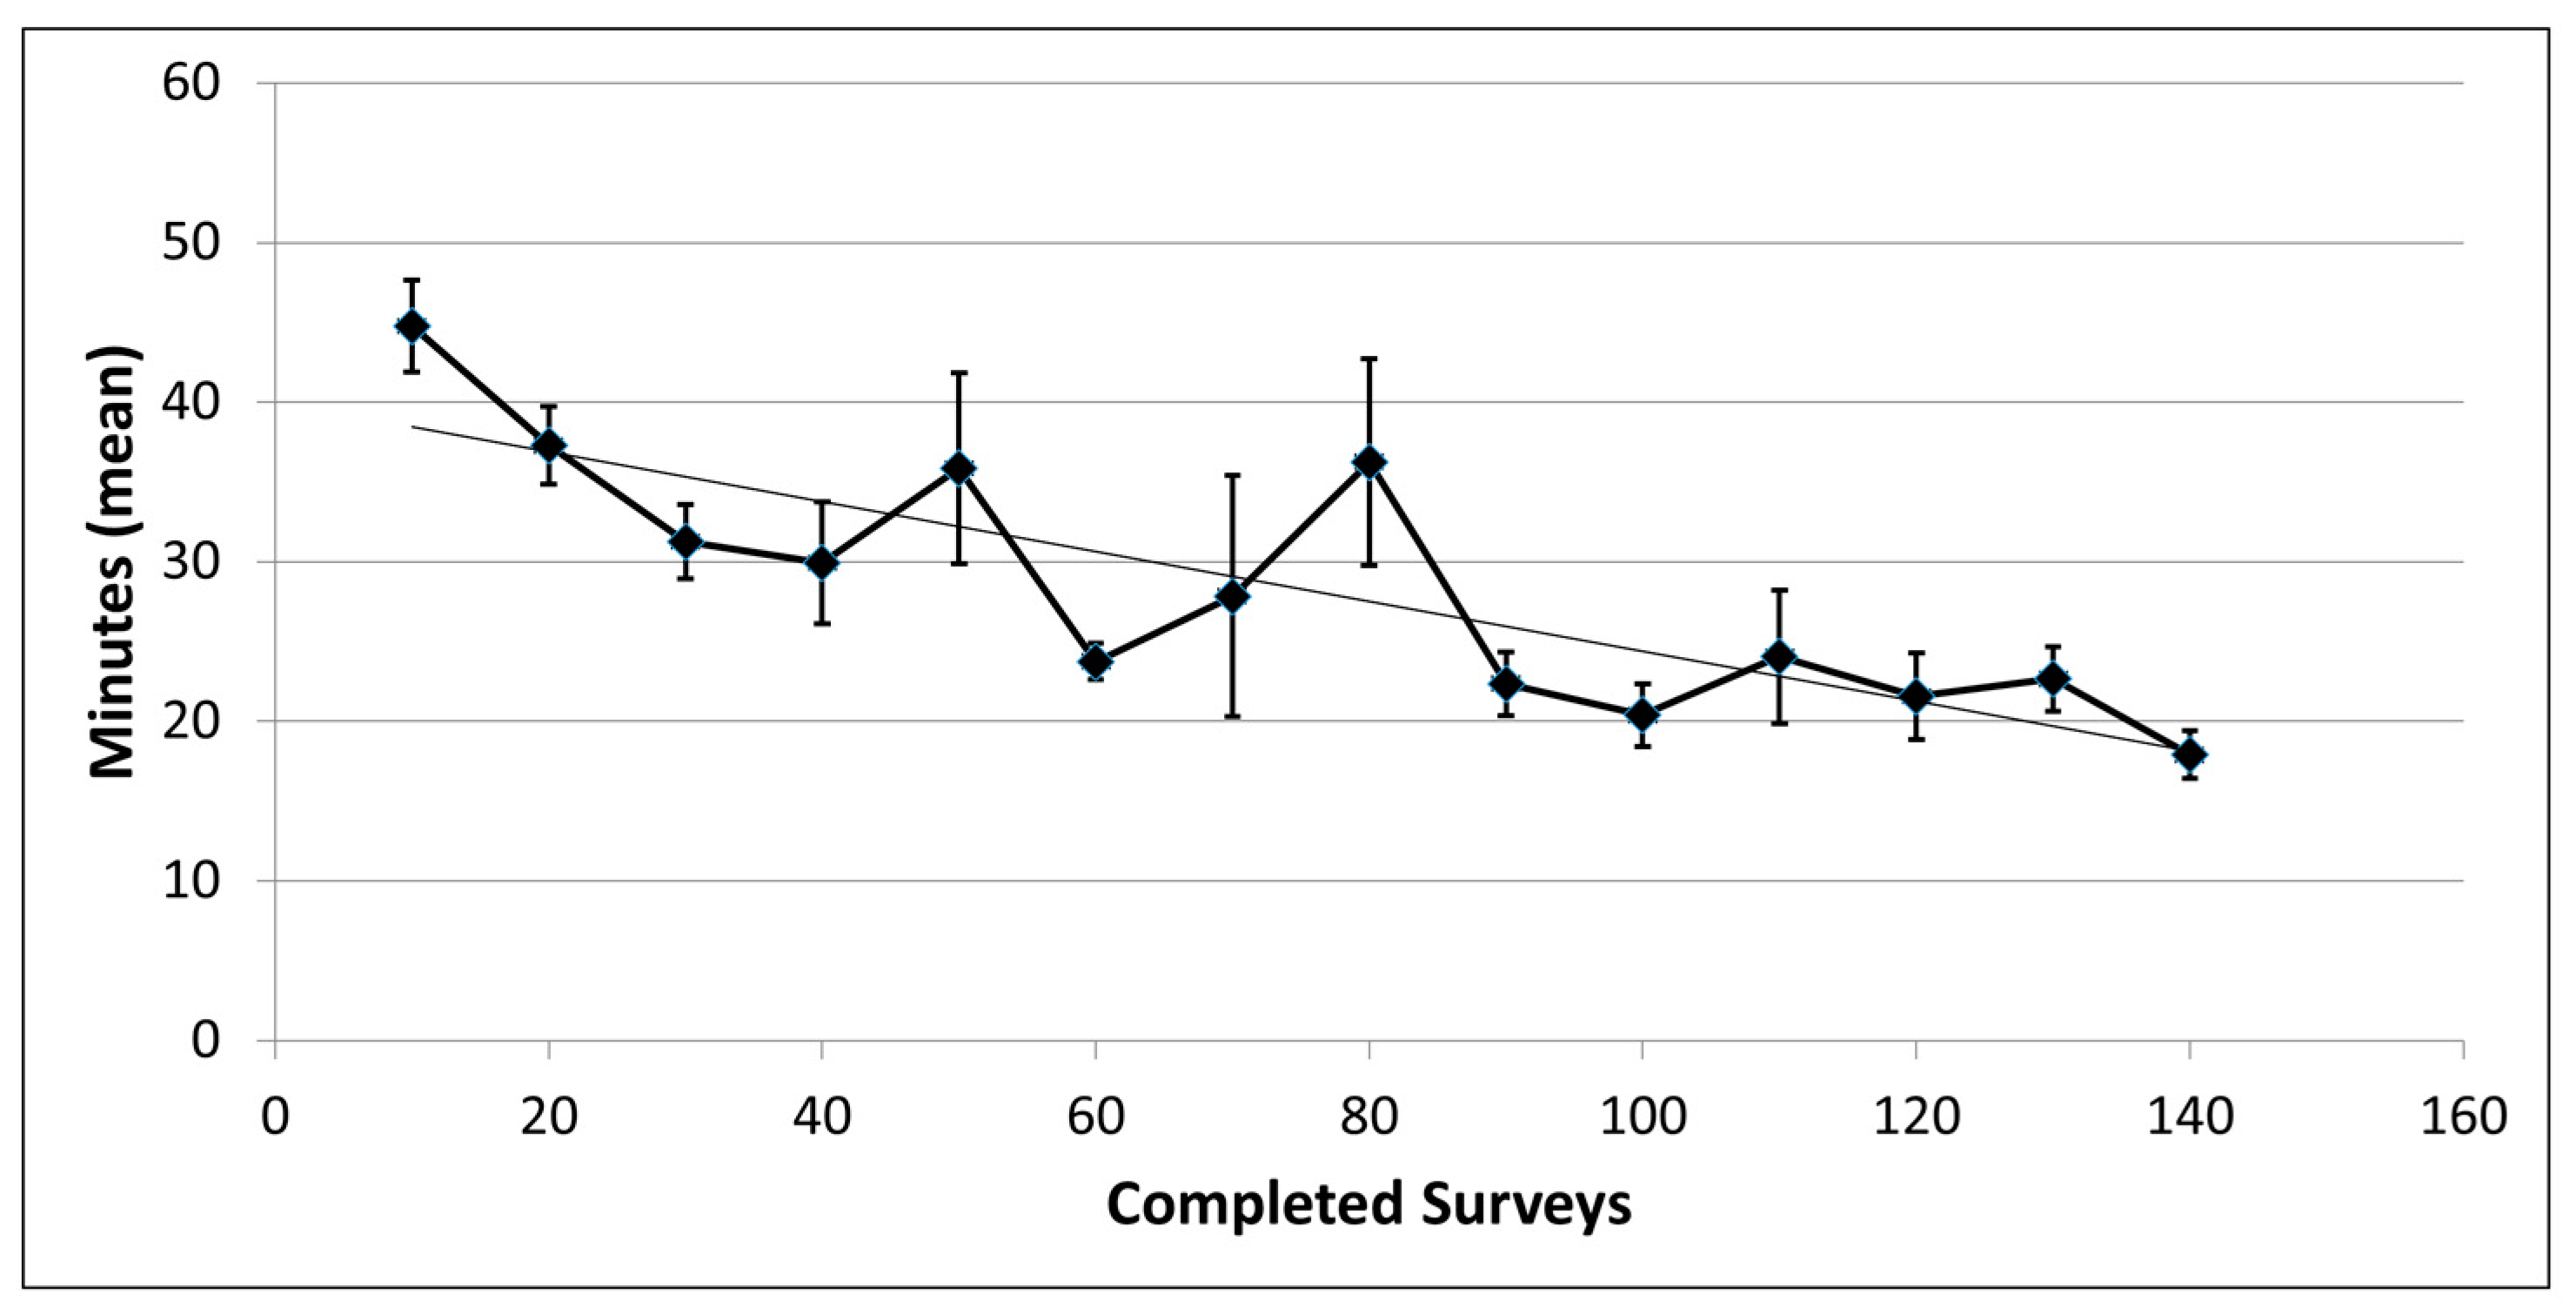
Survey durations were strongly positively skewed and the Kolmogorov-Smirnov (KS) Test confirmed that they were not normally distributed. Therefore, survey duration in minutes was log-transformed and confirmed to be normally distributed by the KS Test. The “regression” function in the Microsoft Excel Data Analysis ToolPak was used to evaluate the log-transformed trend in survey duration versus the number of surveys delivered by each individual enumerator. The data for all enumerators were also pooled and the same analysis was performed. The difference in data entry error rates between CAPI and PAPI was assessed using an independent t-test in the Microsoft Excel Data Analysis ToolPak. All reported p-values are for two-tailed tests.
The number of questions in the CAPI survey varies based on certain subject responses. Most notably, the length of the survey increases with an increased number of daily household water sources and with the types of extreme events (i.e., flood, drought, cyclone) that the subject reports having experienced. Therefore, it was necessary to validate the decline in interview duration with number of surveys an enumerator delivered (see Results section) to ensure that it was not an artifact of the variability in water sources or extreme events reported. To this end, we used the “regression” function in the Microsoft Excel Data Analysis ToolPak to evaluate the trend in both number of water sources reported and number of extreme event types reported with enumerator surveys delivered.
2.2. Ethics Statement
The study reported here was designed to investigate the use of multiple water sources in the Solomon Islands (SI) and the Republic of the Marshall Islands (RMI), for the impact of extreme weather events on household water management. It was approved by the human research ethics committee of Griffith University (ENV/47/13/HREC.), the University of Alabama (14-OR-425) and by the Historic Preservation Office of the Republic of the Marshall Islands (2014-01) and the National Health Research and Ethics Committee of the Solomon Islands (HRC 14/29).
4. Discussion
This paper provides evidence of the utility of CAPI to advance the understanding of multiple water sources and uses in developing country settings. For our study of rural and remote communities in two PICs, CAPI was both faster and easier to use, and led to fewer data entry errors and skipped questions. Lightweight and transportable in the field, CAPI surveys were easier to use than PAPI surveys, and had the added benefit of creating interest amongst interviewees with the use of a tablet. Time required to complete each CAPI survey decreased as a function of the number of surveys performed, with mean durations consistently less than 70% of initial survey times. CAPI, also eliminated the need for parallel data entry, a costly and time-consuming process, and avoided paper-based surveys that can be heavy and difficult to transport, as well as make field research dependent on the availability of a high-quality printer. With CAPI, completed surveys were stored in a digital file format (CSV is common) and uploaded to a secure server, ensuring data safety and making it almost instantaneously available with internet access [
26].
Computer size and weight have been cited as limiting factors for survey delivery in remote fieldwork [
20]; however, a 17.8 cm high-definition screen made visualization possible even in direct sunlight, and the 317.5 g tablet was easy to carry, less than the weight of ten paper surveys. Aside from being easier to carry, the CAPI offered greater data security by storing completed surveys on a web-based server, when Internet was available. Alternatively, data was stored on the tablets and backed-up daily with a laptop maintained by the field supervisor. Access to a reliable power source was difficult. The enclosed lithium-ion battery was capable of up to ten hours of fieldwork, but required periodic recharging. In remote and isolated communities throughout the Pacific, our battery charging arrangement varied according to local circumstances, and included solar panels, diesel generators, and vehicle power supplies.
CAPI can also be designed with quality control measures, such as real-time data monitoring and visualization, and logical checks. In this study, logic statements and embedded answer constraints were used in order to ensure logical data entry. Also, household interviews were monitored by an in-field supervisor to guide and facilitate remote fieldwork activities and to ensure high-quality data collection. Despite this level of supervision, there was some initial concern that enumerators could have entered responses to manipulate skip patterns, thereby reducing the length of the delivered survey. However, our results indicate that CAPI durations were not an artifact of shorter surveys, with non-significant differences between completion times of surveys that incorporated additional questions for ‘extreme event’ modules and those that didn’t (p = 0.561). These tests validate the reported effect of diminishing CAPI duration with increasing enumerator experience, and further reinforce the notion that CAPI is an accurate and effective tool for conducting complicated WaSH surveys.
We hope that the findings of this study will help to evolve WaSH research and monitoring by stimulating more research on multiple water source management within the home. While appropriate for many high income countries, the concept of a single water source is inadequate and unrealistic in the majority of countries, including many PICs [
27]. Although knowledge gaps have been recently acknowledged by WaSH researchers [
3,
4], there has been little effort to address them. Complicated and time-consuming surveys have discouraged the kind of large-scale investigation of water source selection, preference, budgeting and seasonal cycling that is widespread in lower and middle income countries. The CAPI survey employed in this study provides WaSH researchers with a quick and effective tool to address this knowledge gap; for which the SurveyCTO code is available in the
Supplementary Materials (Table S1: MacDonald_SurveyCTO_program).
We are aware of limitations to this study and offer them for discussion. First, the sample size is somewhat small and unbalanced between CAPI and PAPI datasets. The original study design was not intended to assess the value of one survey method over the other, but to advance the understanding of multiple water sources and uses in PICs, and the changes caused by seasonality and extreme weather events. For this reason, the number of surveys performed with each method is unbalanced, but the data still enabled an evidence-based discussion of the improvements in convenience and quality of CAPI over conventional PAPI methods. Our findings concerning diminishing survey durations and the appropriateness of CAPI for multiple water source research are unaffected by the imbalance between groups. Future studies will be better equipped to confirm some of our findings by employing more enumerators and increasing the sample size. Increasing the number of surveys performed by each enumerator will also assist in the identification of an efficiency plateau, beyond which greater experience with the CAPI survey would not result in decreased survey duration. Second, with the exception of two surveys for which we had exact times, PAPI duration was reconstructed using research notes and dated questionnaires. This prohibited a direct comparison of the two survey methods, requiring the use of the mean number of surveys performed per hour in order to draw limited conclusions. However, this simple comparison revealed that PAPI duration did not decrease as a function of the number of surveys performed, as it did with CAPI. Third, because record keeping of survey duration was automated with CAPI, we cannot account for time spent on unrelated events, such as interruptions by the interviewee’s children. Still, it can be assumed that the same or similar issues affected the delivery of PAPI surveys.


 ,
, 


