Article

Impact of Climate Change on Drought in the Upstream Yangtze River Region

1
College of Hydrology and Water Resources, Hohai University, Nanjing 210098, China
2
Department of International Cooperation and Science and Technology, Ministry of Water Resources, Beijing 100035, China
3
Yellow River Institute of Science, North China University of Water Resources and Electric Power, Zhengzhou 450045, China
*
Authors to whom correspondence should be addressed.
Water 2016, 8(12), 576; https://doi.org/10.3390/w8120576
Submission received: 10 August 2016 / Revised: 30 November 2016 / Accepted: 1 December 2016 / Published: 7 December 2016
(This article belongs to the Special Issue Water-Soil-Vegetation Dynamic Interactions in Changing Climate)

Abstract

:
Based on Coupled Model Intercomparison Project Phase 5 (CMIP5) dataset and a variable infiltration capacity (VIC) hydrological model, this study assesses the possible influence of climate change in the upstream region of the Yangtze River on droughts in the future 30 years. Long-term daily soil moisture content were simulated by VIC model at a 50 km × 50 km resolution from 1951 to 2013. Regional historical drought events were then recognized based on soil moisture anomaly percentage index and validated with field data. Five relatively independent representative global circulation models were selected and the outputs of them were downscaled temporally and spatially as the inputs of VIC model for daily soil moisture content simulations both in the period of 1971–2000 for the present-day climate and in the period of 2021–2050 for the future. The results show that the projected annual mean temperature is likely to increase from 1.4 °C to 1.8 °C. The projected change in mean annual precipitation could be increased slightly by 0.6% to 1.3%, but the trend of precipitation change in summer and autumn might be opposite of that. Comparing the drought characteristics values recognized in 1971–2000, seven to eight additional regional drought events are likely to happen in 2021–2050. Drought duration and drought intensity are also likely to extend for 18 d to 25 d and increase by 1.2% to 6.2%, respectively. But, drought area could decrease slightly by 1.3% to 2.7% on average. These changes in drought characteristics values suggest that regional drought could become more severely prolonged and frequent in future.

1. Introduction

Drought is one of the major natural disasters of the world. According to the statistics from 1995 to 2014, there were up to 327 global large-scale droughts, with an average of about 5.4 million people affected annually, and about USD 430 million in economic losses. Compared with the values from 1961 to 1980, these are 2.6, 2.6, and 9.6 times greater, respectively [1]. Future global climate change may lead to frequent occurrences of extreme climate and weather events [2]. Climate change is projected to alter the frequency and magnitude of droughts and, in some seasons and regions, drought intensity may be further strengthened [3].
Drought occurrence and the severity of droughts are often determined by the drought index. The condition of the soil moisture content over a large area is the key to drought development, and studies have shown that a drought index based on soil moisture content can effectively reflect the changes in drought development [4,5,6]. With the advance in terrestrial hydrological models and the use of long-term hydrological measurement data as constraints, the simulation of the soil moisture content has become one of the effective ways in establishing extensive long-term soil moisture content databases [7,8]. A variable infiltration capacity (VIC) model [9,10] is a gridded large-scale semi-distributed land surface hydrological model widely employed in drought research. For example, Andreadis et al. [11] reconstructed the drought history over the North American continent, and Wu et al. [12] reconstructed and analyzed the temporal and spatial variations and characteristics of historical droughts from 1951 to 2009 in China. Since this method considers the integrated effects of infiltration, evaporation, vegetation, and soil properties on droughts and is capable of producing a drought index on a daily basis through the continuous simulation of daily soil moisture content, it can accurately reflect the progress and extent of drought development through relatively strict physical constraints [13].
With the data from future climate change scenarios as input, future soil moisture content data can be obtained by using hydrological models and the variation in future droughts can be studied. The climate models are the key tools for climate change projections, and the simulation results from more than 40 climate models were used in the recent IPCC AR5. However, by far the largest contribution to uncertainty in future projections stems from the fact that climate models are imperfect and therefore their projections are uncertain [14]. In some applications, the use of multiple models has been shown to provide predictions superior to those of a single model [15,16]. Nevertheless, studies demonstrated that in many models, the calculations of temperature and precipitation are not independent; that is, they share the same formula, parameterization processes, or methods in some cases [17,18,19]. The fact that parameterization processes in many models are identical or belong to the same category highlights the concern about the dependence and relevance among the models, leading to the problem of the simulation results of some scenarios being similar and the credibility of the conclusions being affected by the number of consistent prediction results [20]. Therefore, when multiple models are applied, the effects of model similarity on the results should be considered.
The upstream Yangtze River region is located in China’s eastern and western political, economic, and cultural transition and convergence zone. Observational data from this region in recent years indicate a significant decrease in the autumn precipitation and runoff in Yichang at the watershed outlet and frequently recurring droughts [21]. To date, there are few studies on droughts in the upstream region of the Yangtze River. Most of these employed the regional precipitation and runoff data to consider meteorological drought [22] and hydrological drought [23] problems and seldom considered the soil moisture variations. Xu [24] combined the results, such as the runoff depth in the drainage basins, actual evaporation, and surface soil moisture content simulated by a distributed hydrological model, with the Palmer drought severity index (PDSI) drought mode to construct a gridded biweekly drought assessment and forecast model, the application of which achieved a good result.
By simulating soil moisture content, this study assesses the impact of climate change on regional droughts over the upstream Yangtze River region for the future 30 years. The main study includes four steps: (1) with a large-scale hydrological simulation system in a VIC hydrological model based on the precipitation and temperature data measured at selected sites, a long-term regional soil moisture content database was simulated and established; (2) based on the simulated soil moisture content, the drought index was formulated and the historical drought events were recognized and verified with the measured data; (3) considering similarities in precipitation simulation using the climate models, several independent and representative models were selected and downscaled temporally and spatially to build future regional climate change scenarios; and (4) using the regional climate change scenarios, the VIC model was run to simulate future soil moisture content and to quantitatively assess the impact of climate change on the temporal and spatial distribution of drought characteristics, such as the number of occurrences, duration, areal extent, and intensity of drought events in the upstream Yangtze River.

2. Materials and Methods
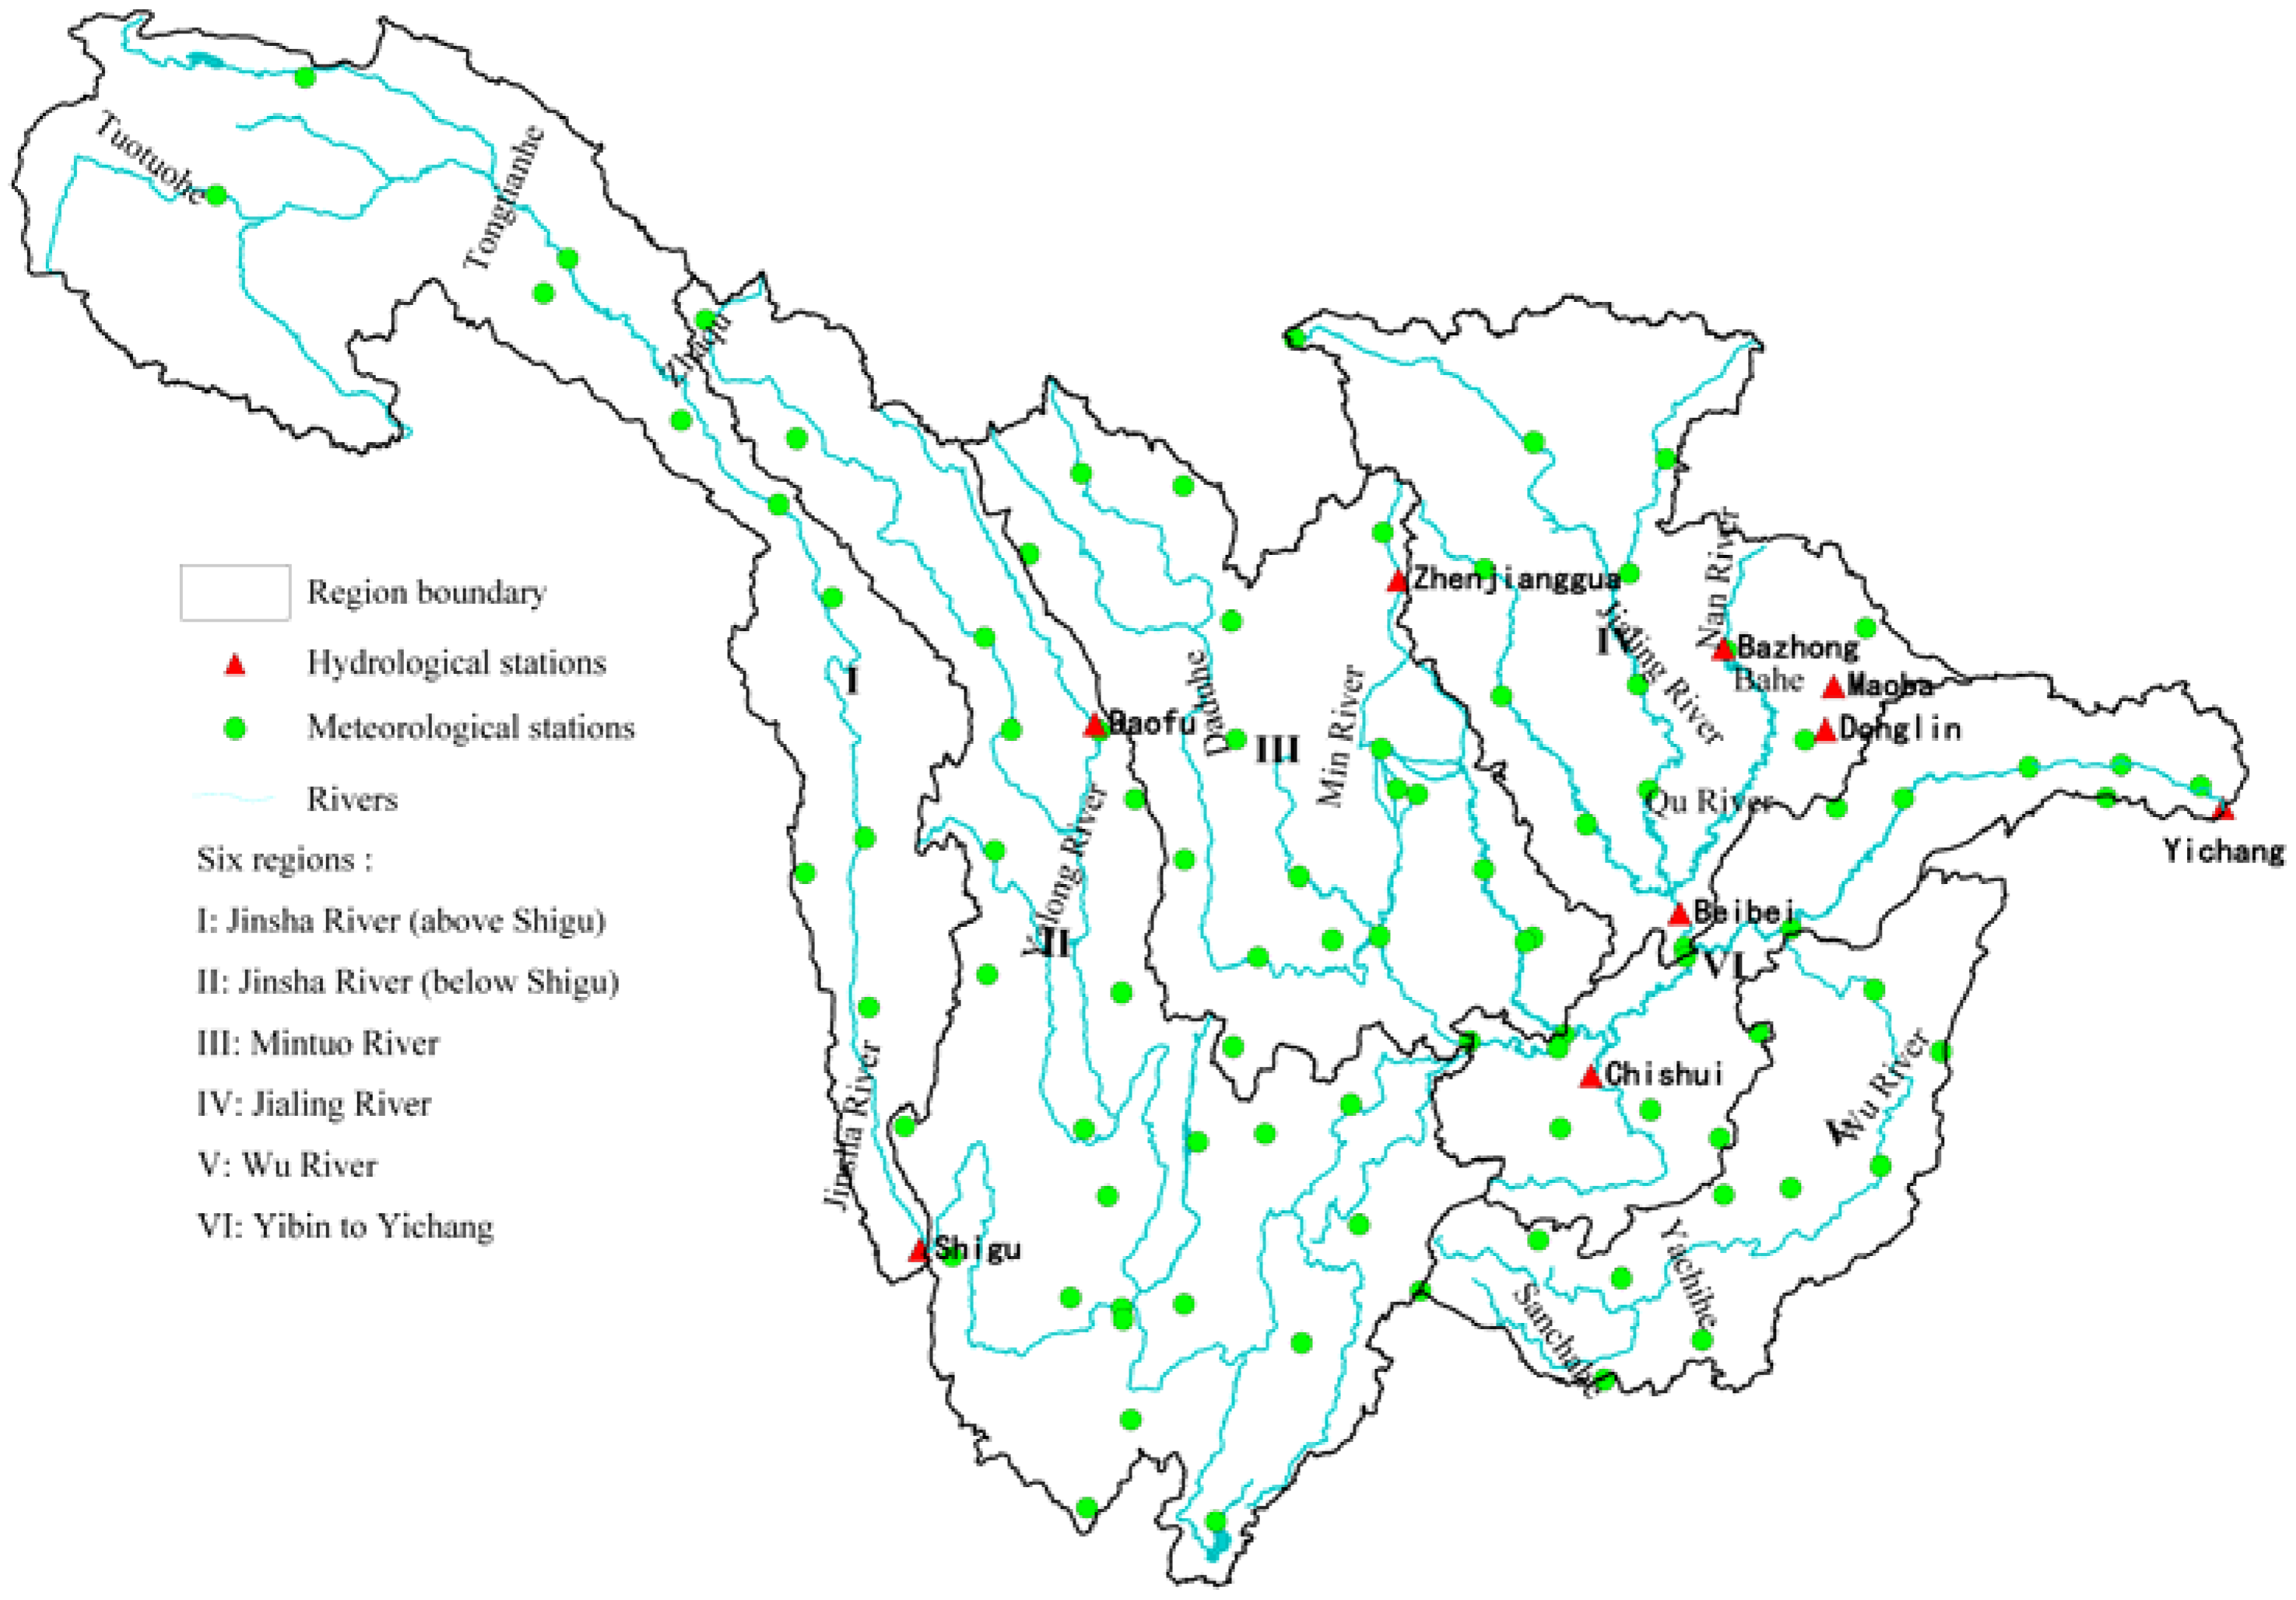
2.1. Study Area

In this study, the upstream Yangtze River region refers to the area from the river mouth to Yichang in the Hubei Province (Figure 1), an area of about one million km2. In this study, based on the classification and division as a Class II water resource, the study area is divided into six subregions: Region I Jinsha River (above Shigu), Region II Jinsha River (below Shigu), Region III Mintuo River, Region IV Jialing River, Region V Wu River, and Region VI Yibin to Yichang.

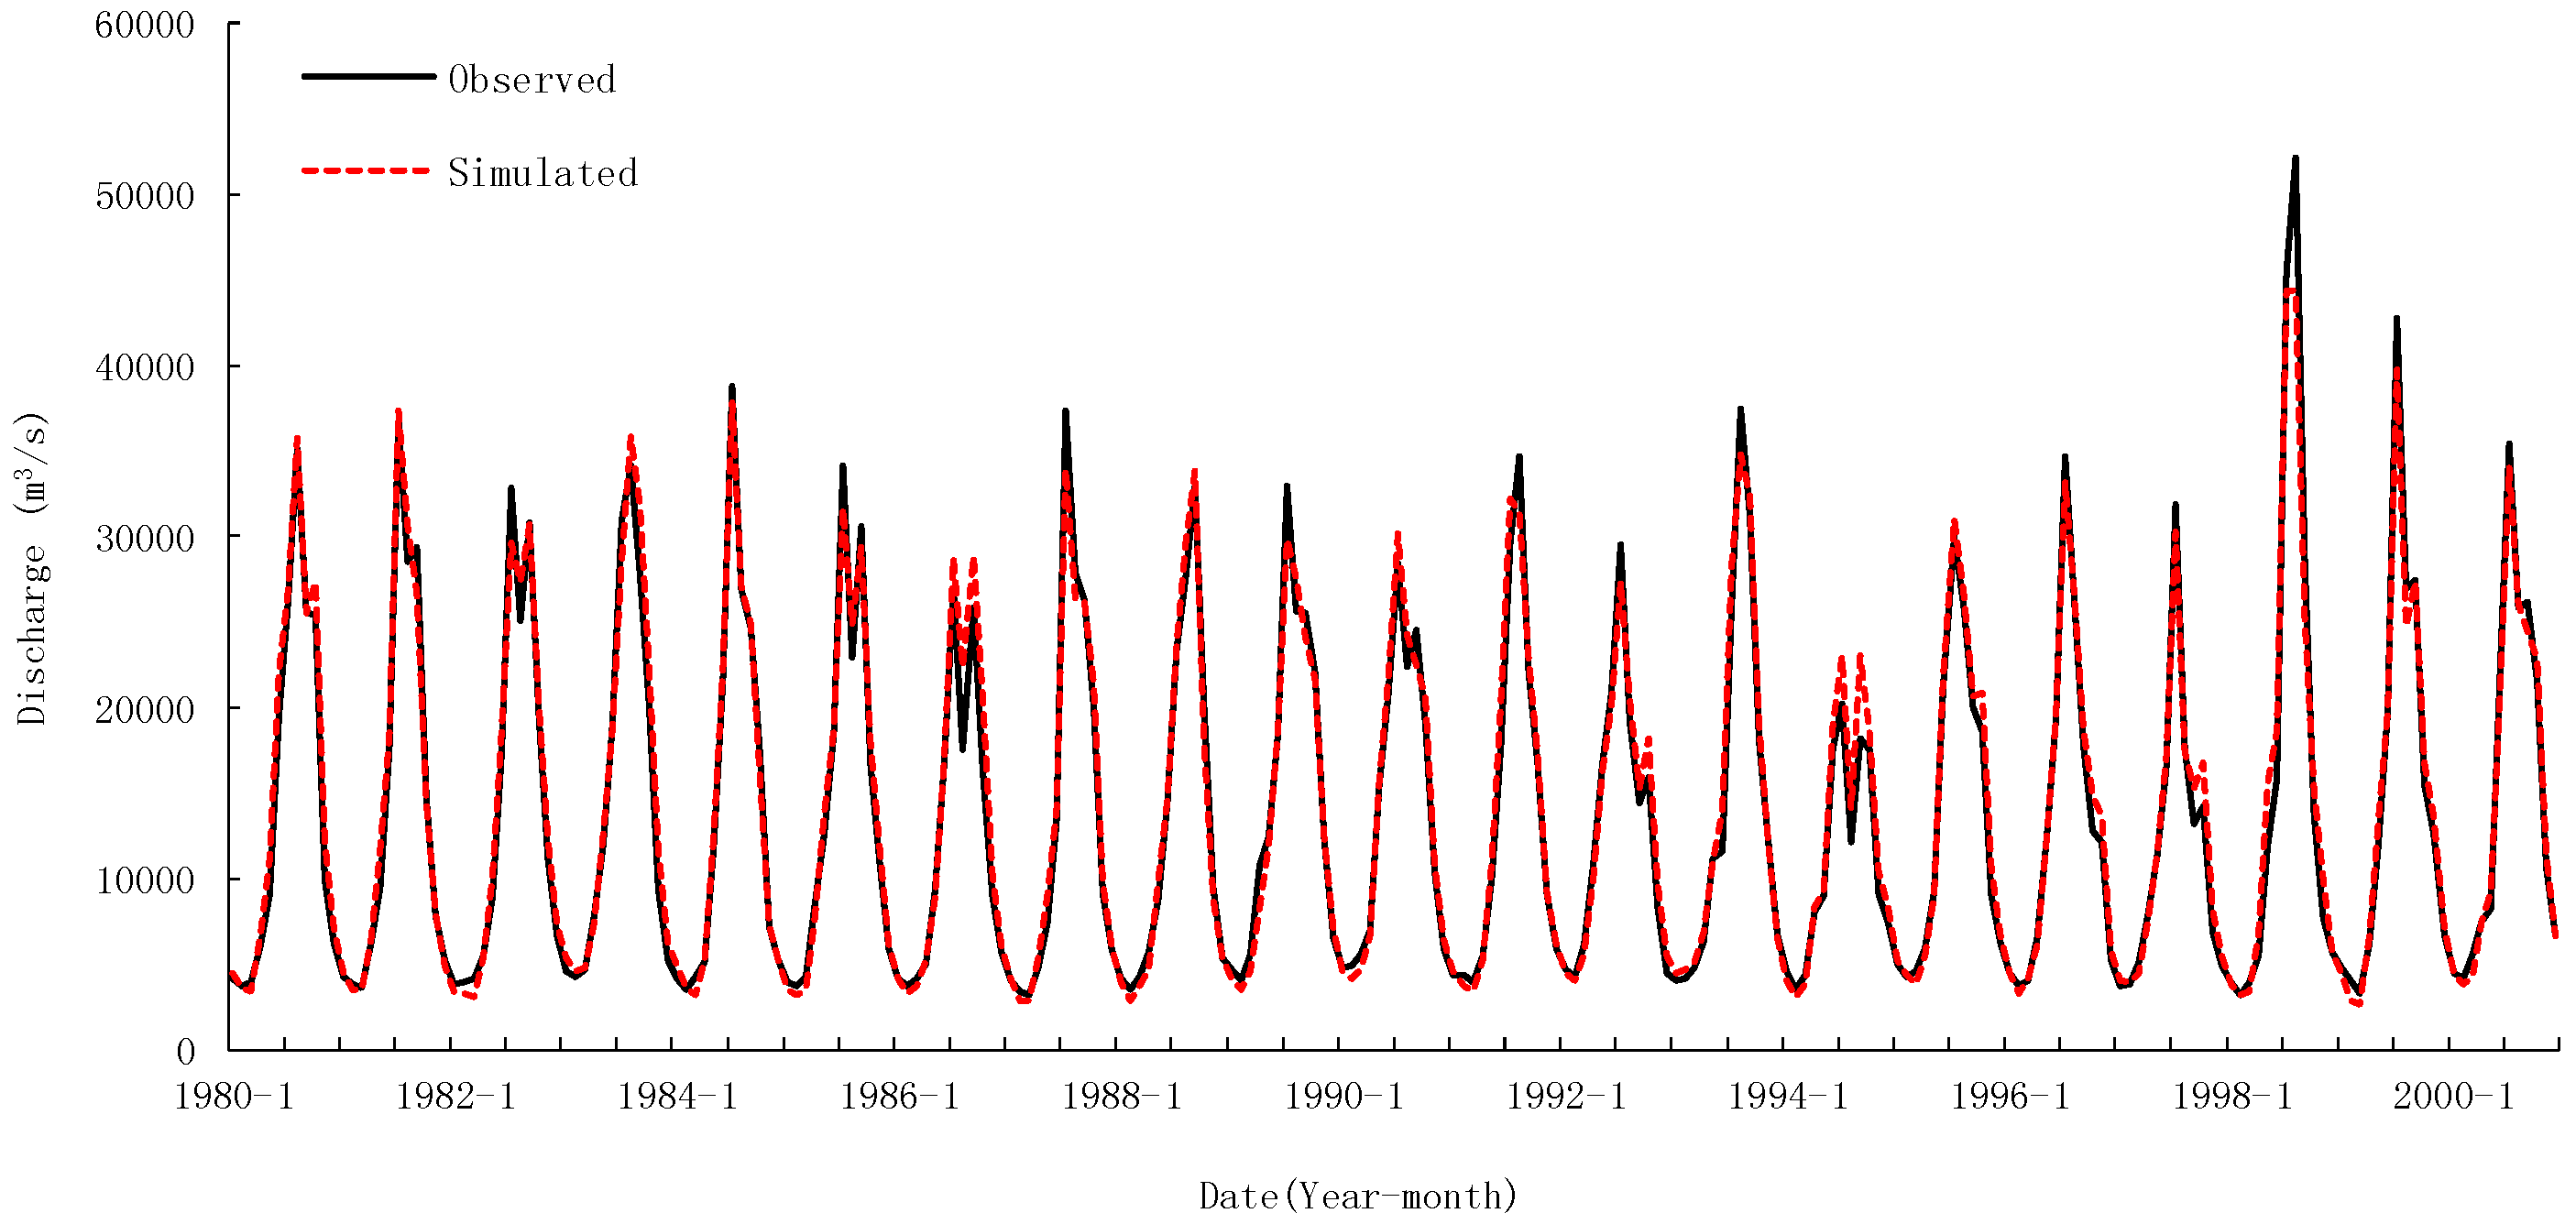
2.2. Soil Moisture Content Simulation

This study employed a VIC model to simulate and establish the daily soil moisture content. The fundamental principles of the VIC model are referred to in the literature (http://www.hydro.washington.edu/Lettenmaier/Models/VIC/index.shtml). Nine typical hydrographs covering the upstream Yangtze River region were selected to evaluate the applicability of the VIC model. The data series lasted for 7 to 21 years. The basic information on the catchment and control stations are shown in Table 1.
At a 50 km × 50 km resolution, the upstream Yangtze River region was divided into 502 grid cells. For each grid, the meteorological data required for the model input were obtained by inverse distance interpolation, and vegetation and soil parameters were set according to the global land vegetation cover database at a 1 km × 1 km resolution [25] and the global soil database at a 10 km × 10 km resolution [26], respectively.
Based on the method that integrated the Rosenbrock algorithm [27] and manual intervention, the hydrological parameters were optimized and determined. Figure 2 shows the observed and simulated monthly hydrograph at the Yichang station covering 1980–2000. As observed in Figure 2, the VIC model can simulate the hydrograph relatively well. From the calibration results through the nine typical hydrographs (Table 1), the relative error for the simulated flow is between −16.2% and 21.7%, the daily flow efficiency index is between 0.60 and 0.94, and the monthly average flow efficiency index is between 0.79 and 0.97 with an average of 0.87. In general, the VIC model is capable of better simulating the watershed runoff process.

2.3. Drought Event Recognition Based on SMAPI

2.3.1. Soil Moisture Anomaly Percentage Index (SMAPI)

The soil moisture anomaly percentage index (SMAPI) is able to describe large-scale drought characteristics [12]. SMAPI is calculated as the difference between the actual soil moisture content and the corresponding long-term moisture content at a specific time divided by the corresponding long-term content. Its expression is as follows:
SMAPI = θ θ ¯ θ ¯ × 100 %
The parameters θ and θ ¯ denote the present soil moisture content and the appropriate soil moisture content for the climate under concern at that period, respectively; and, therefore, θ ¯ can be viewed as the mathematically expected value from the time series of the soil moisture content.
The soil moisture classifications based on SMAPI are shown in Table 2.

2.3.2. Drought Event Recognition

The drought events are described by their duration, intensity, severity, and the affected areal extent. For model grids, the drought duration is defined as the number of successive days when SMAPI values are 5% below the drought threshold, the intensity is the average SMAPI value during the drought, and a drought duration of 60 days is given as the threshold for one drought event to be recognized [12].
In regional terms, the areal extent is an important characteristic in large-scale drought event recognition, and it is defined as the percentage of grids where SMAPI values are 5% below the drought threshold over the region. The drought intensity is the average SMAPI of those grids where SMAPI values are 5% below the threshold. Regional drought duration is different from that of a grid and is defined as the number of successive days when the daily drought areal extent is greater than 30%. The severity is defined the same way as that for a grid. A regional drought duration of 60 days is defined as the threshold for one regional drought event to be recognized.

2.4. Regional Climate Change Scenarios

This study applied three emissions scenarios from the representative concentration pathways (RCPs) 2011 scenario series: the low emission scenario (RCP2.6), medium emission scenario (RCP4.5), and high emission scenario (RCP8.5). The monthly mean temperature and precipitation outputs from 47 global circulation models (GCMs; see Table 3) within Coupled Model Intercomparison Project Phase 5 (CMIP5) are used in this study. We selected the baseline period of 1971–2000 as the present-day climate and the period of 2021–2050 (2030s) as the future.
The multi-model ensemble approach is used in this study in an effort to reduce the uncertainty from the internal variability and inter-model difference. Previous work [14] suggests that the behavior of the CMIP3 multi-model ensemble maybe similar to a set of probably only five to ten independent models. Considering model independence in multi-model ensemble projection, we classified CMIP5 models based on their simulation values—the amount by which models differ in some outputs in the same set of conditions reflects the level of their independence [19].
In this study, we examine the present-day climate simulations in precipitation for model independence. The main calculating procedures are as follows [28]:
(1)
Normalizing the differences between simulated (f) and observational (o) data based on the observed standard deviation ( σ n ), which are expressed for model m, grid-point n:
e n , m = ( f n , m o n ) / σ n
For model m, the errors in (2) form spatial patterns expressed as vector:
e m = ( e 1 , m , e 2 , m , , e N , m )
where N is the number of grid-points in the regional domain.
(2)
Calculating the multi-model error pattern e ¯ :
e ¯ = 1 M m = 1 M e m
where M is the number of models.
(3)
Removing the effect of e ¯ and calculate the error vector d m :
d m = e m r e ¯
where ( ) indicates statistical standardization, and r is the correlation between the mth model’s error filed and the e ¯ . After the removal of e ¯ , the correlation between model m error pattern and e ¯ becomes zero.
(4)
Calculating the correlation coefficient matrix r i , j :
r i , j = c o r r ( d i , d j )
Following the above procedures, the average correlation coefficient matrix ri,j for precipitation in the four seasons was obtained. Based on a weighted pair-wise average distance algorithm developed for the Interactive Data Language (IDL), the hierarchical clustering analysis was carried out, and the results are shown in Figure 3.
According to the results from the model hierarchical clustering analysis (Figure 3), the 47 CMIP5 models were divided into five groups. In each group, we selected the model with the best precipitation simulation results in the present-day period and that with the projected data in the future period available under each of the RCP scenarios. In addition, if the precipitation simulation results from the models do not differ significantly, the results of the temperature simulations and the previous application of models in the study area were considered as model selection criteria.
Based on the above selection method and criteria, BCC-CSM1.1(m) (China), GISS-E2-R (USA), HadGEM2-ES (UK), IPSL-CM5A-LR (France), and MPI-ESM-MR (Germany) were chosen as the five representative models for analysis. It is assumed that these relatively independent representative models reflect the simulation quality of the study area precipitation in different model groups.
In order to solve the scale compatibility problem between the output of GCMs and the input of the VIC model, the output of the five GCMs were statistically downscaled both temporally and spatially. The detailed procedures are as follows.
The climate model output data was subjected to inverse distance interpolation so that they could fit into 50 km × 50 km grids. Temperature and precipitation data were then corrected by using a linear-scaling approach at a monthly scale [29].
Firstly, the mean monthly values of the observed ( x o b s , i ¯ ) and present-day simulated ( x GCMs _ c , i ¯ ) data at month i (i = 1, 2, …, 12) were calculated in the baseline period, respectively. Then, using Equation (7), the ratio ( λ GCMs ) between the observed and simulated values was calculated to be the revised coefficient. Finally, with Equation (8), the future simulated monthly value x GCMs _ f , i for the future period of 2021–2050 was multiplied by the correction coefficient to obtain the corrected simulated value x GCMs _ f , i .
λ GCMs = x o b s , i ¯ / x GCMs _ c , i ¯
x GCMs _ f , i = λ GCMs , i × x GCMs _ f , i
Temperature correction is similar to the correction for precipitation. The revised coefficient was the ratio between the observed and simulated monthly values over the years in the baseline period. The corrected simulated values were the product of the simulated monthly values and the correction coefficient.
Temporal disaggregation is adopted from the earlier work of Wood et al. [30] and Raff et al. [31]. We assumed that, a month into the future, the daily variations of the climatic parameters are the same as the time distribution in a month randomly selected from the past, allowing temperature and precipitation data series in the past to be divided monthly into four classes: “hot and wet”, “cold and wet”, “hot and dry” and “cold and dry”. Based on the future climate change forecast data, the time solution was solved for the class that was randomly sampled from the corresponding climate class (with a random simulation of 10 times).

3. Results

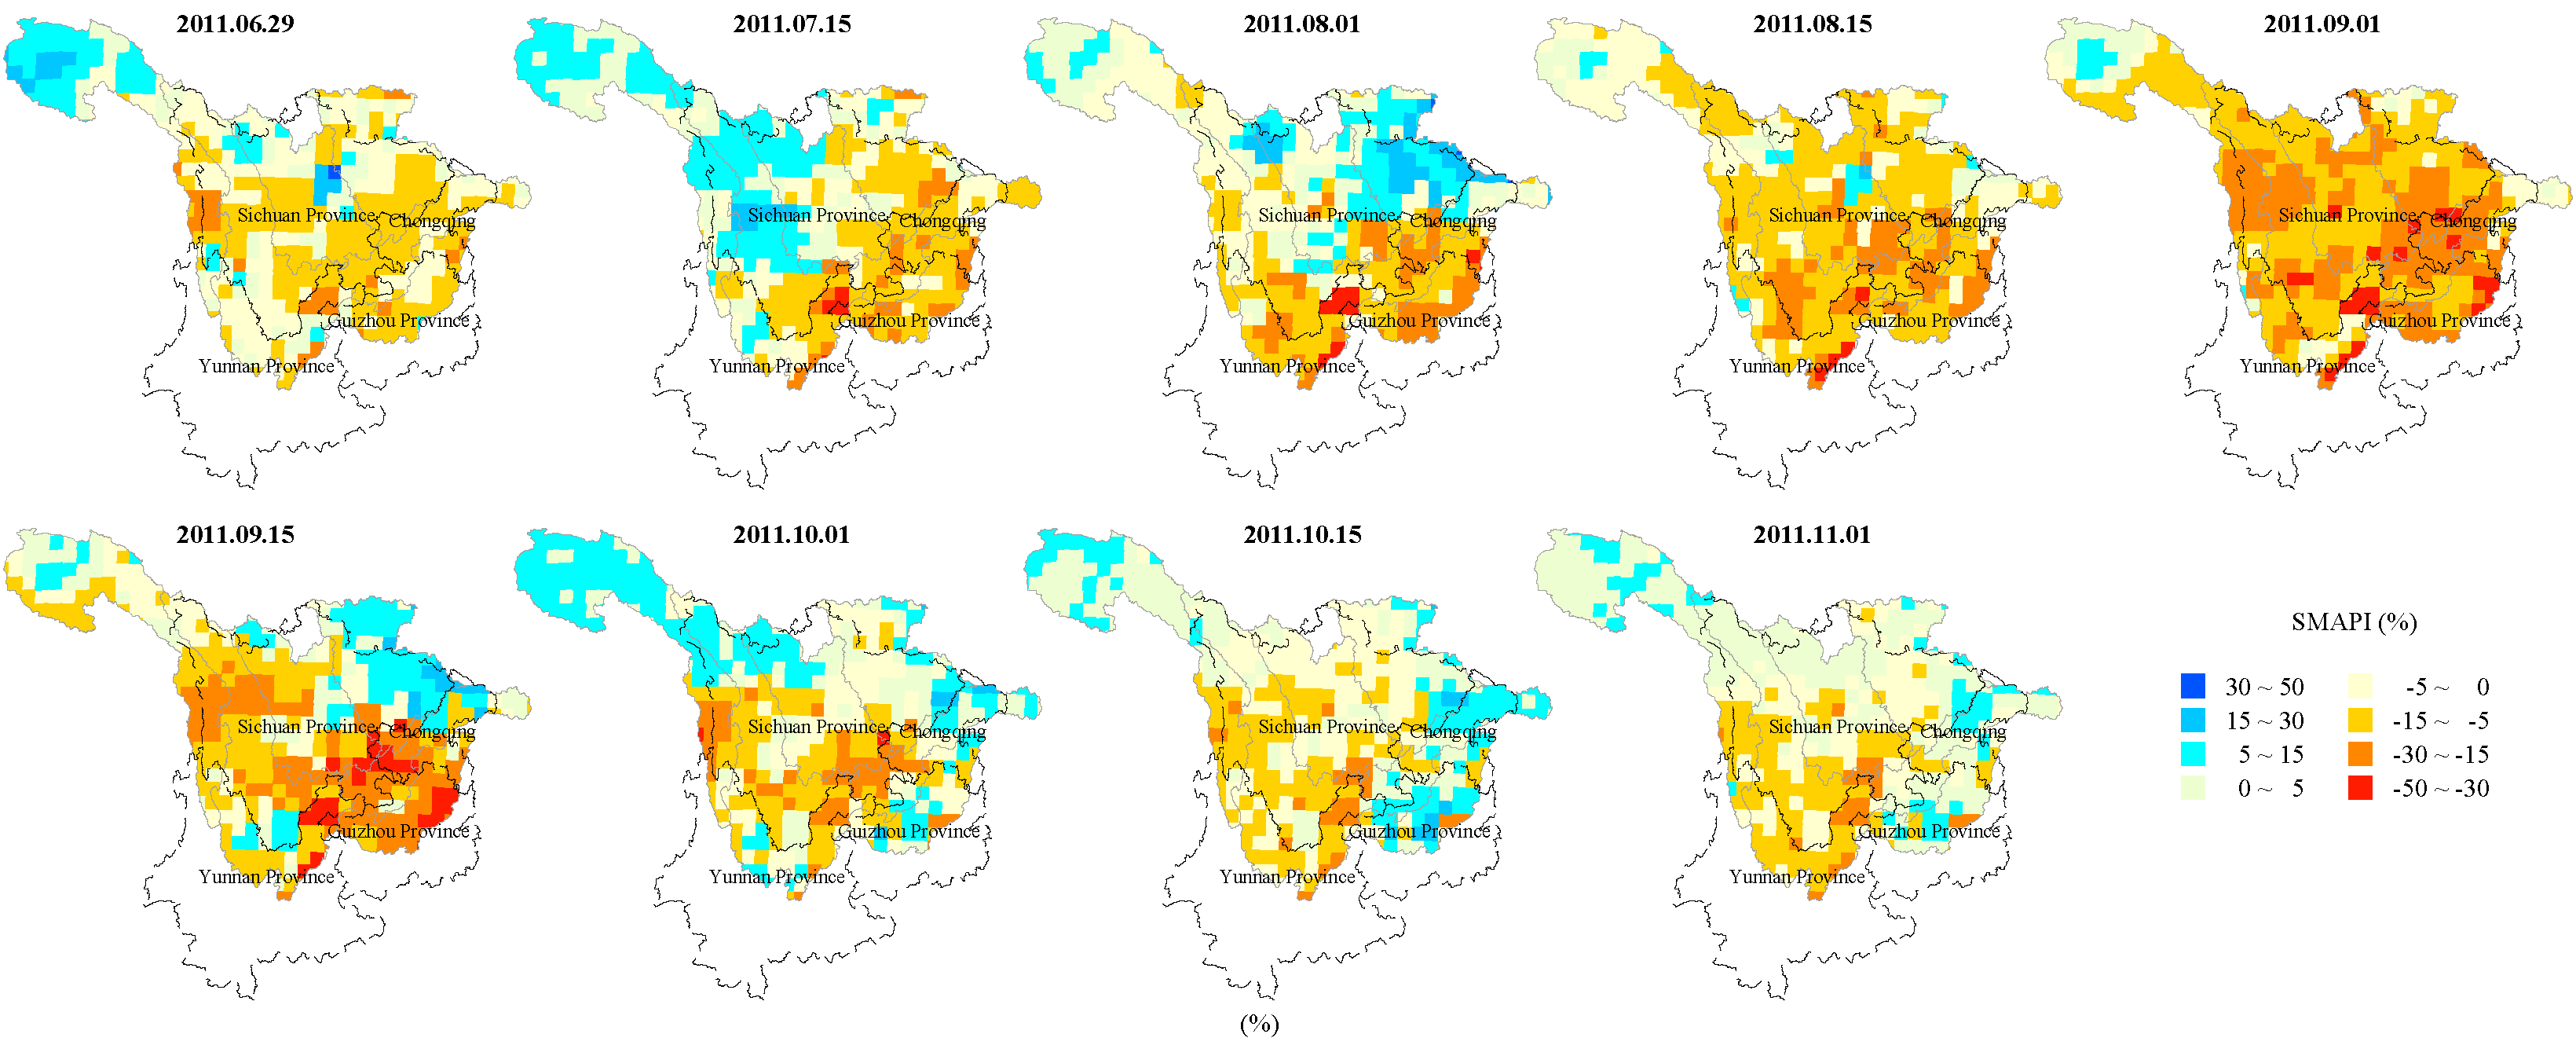
3.1. Past Drought Event Recognition

From 1953–2013, 12 regional drought events were recognized in the upstream Yangtze River region. Table 4 shows the drought events in the subregions in the study area, including the number of total events, the beginning and ending dates T1/T2, duration D (d), and areal extent A (%) for the top three most severe drought events. The longest duration was 124 d (about 4.1 months), while the shortest was 111 d (about 3.7 months). The areal extent was between about 42% and 51%.
Since droughts are processes that require a relatively long time to develop, they differ from other natural hazards, such as floods or earthquakes, in that the latter have well-defined and obvious beginning and ending times. Therefore, this study only recognized typical regional drought events and compared these events with actual historical drought information and relevant records in order to verify whether the recognition results were reasonable. The actual information was adopted from the study by Wang et al. [32], which summarized, organized, and analyzed all droughts in China in 2011. From 29 June 2011 to 1 November 2011, the second ranking event of Region VI and the third recognition ranking event of Region III were compared with actual drought information for verification.
Figure 4 shows the variation of the geographic distribution of SMAPI. To facilitate the comparison with the data from Wang et al. [32], the boundaries of the provincial administrative districts in southwestern China were added in Figure 4. For the second ranking event of Region VI, the drought started on 29 June. As shown in Figure 4, in July, more than 70% area of Region VI suffered from mild drought. In early August, the drought area extent was decreased, but the drought intensity grew in the southern part of Region VI. From the middle of August to early September, the drought intensity and area grew gradually and severe drought occurred in some parts of Region VI. In the middle of September, although the drought area was decreased, severe droughts still occurred in the southern part of Region VI. In September, the affected population reached 925,000 and the direct economic losses equaled 1.03 billion Yuan in Chongqing. On 1 November, the regional drought event ended. For the third ranking event of Region III, the drought started on 8 August. From the middle of August to the beginning of September, the drought area expanded and the subregional areas that suffered from moderate drought grew. From the middle of September, the drought intensity weakened and the drought area diminished gradually. On 1 November, the regional drought event ended. In general, the beginning and ending dates, the variations in drought intensity, and the areal extent recognized in this study agree well with the actual information.
Due to factors such as the drought definition, data coverage duration, and survey units, there is little information on verifying drought event recognition over the upstream Yangtze River region. However, through the above comparison and analysis for a typical drought event, the drought event recognition method based on SMAPI can reconstruct the situation during historic droughts relatively well, and the recognized grid results and regional drought events can be applied in analyzing temporal and spatial variation trends of drought characteristics.

3.2. Future Climate Change Assessment

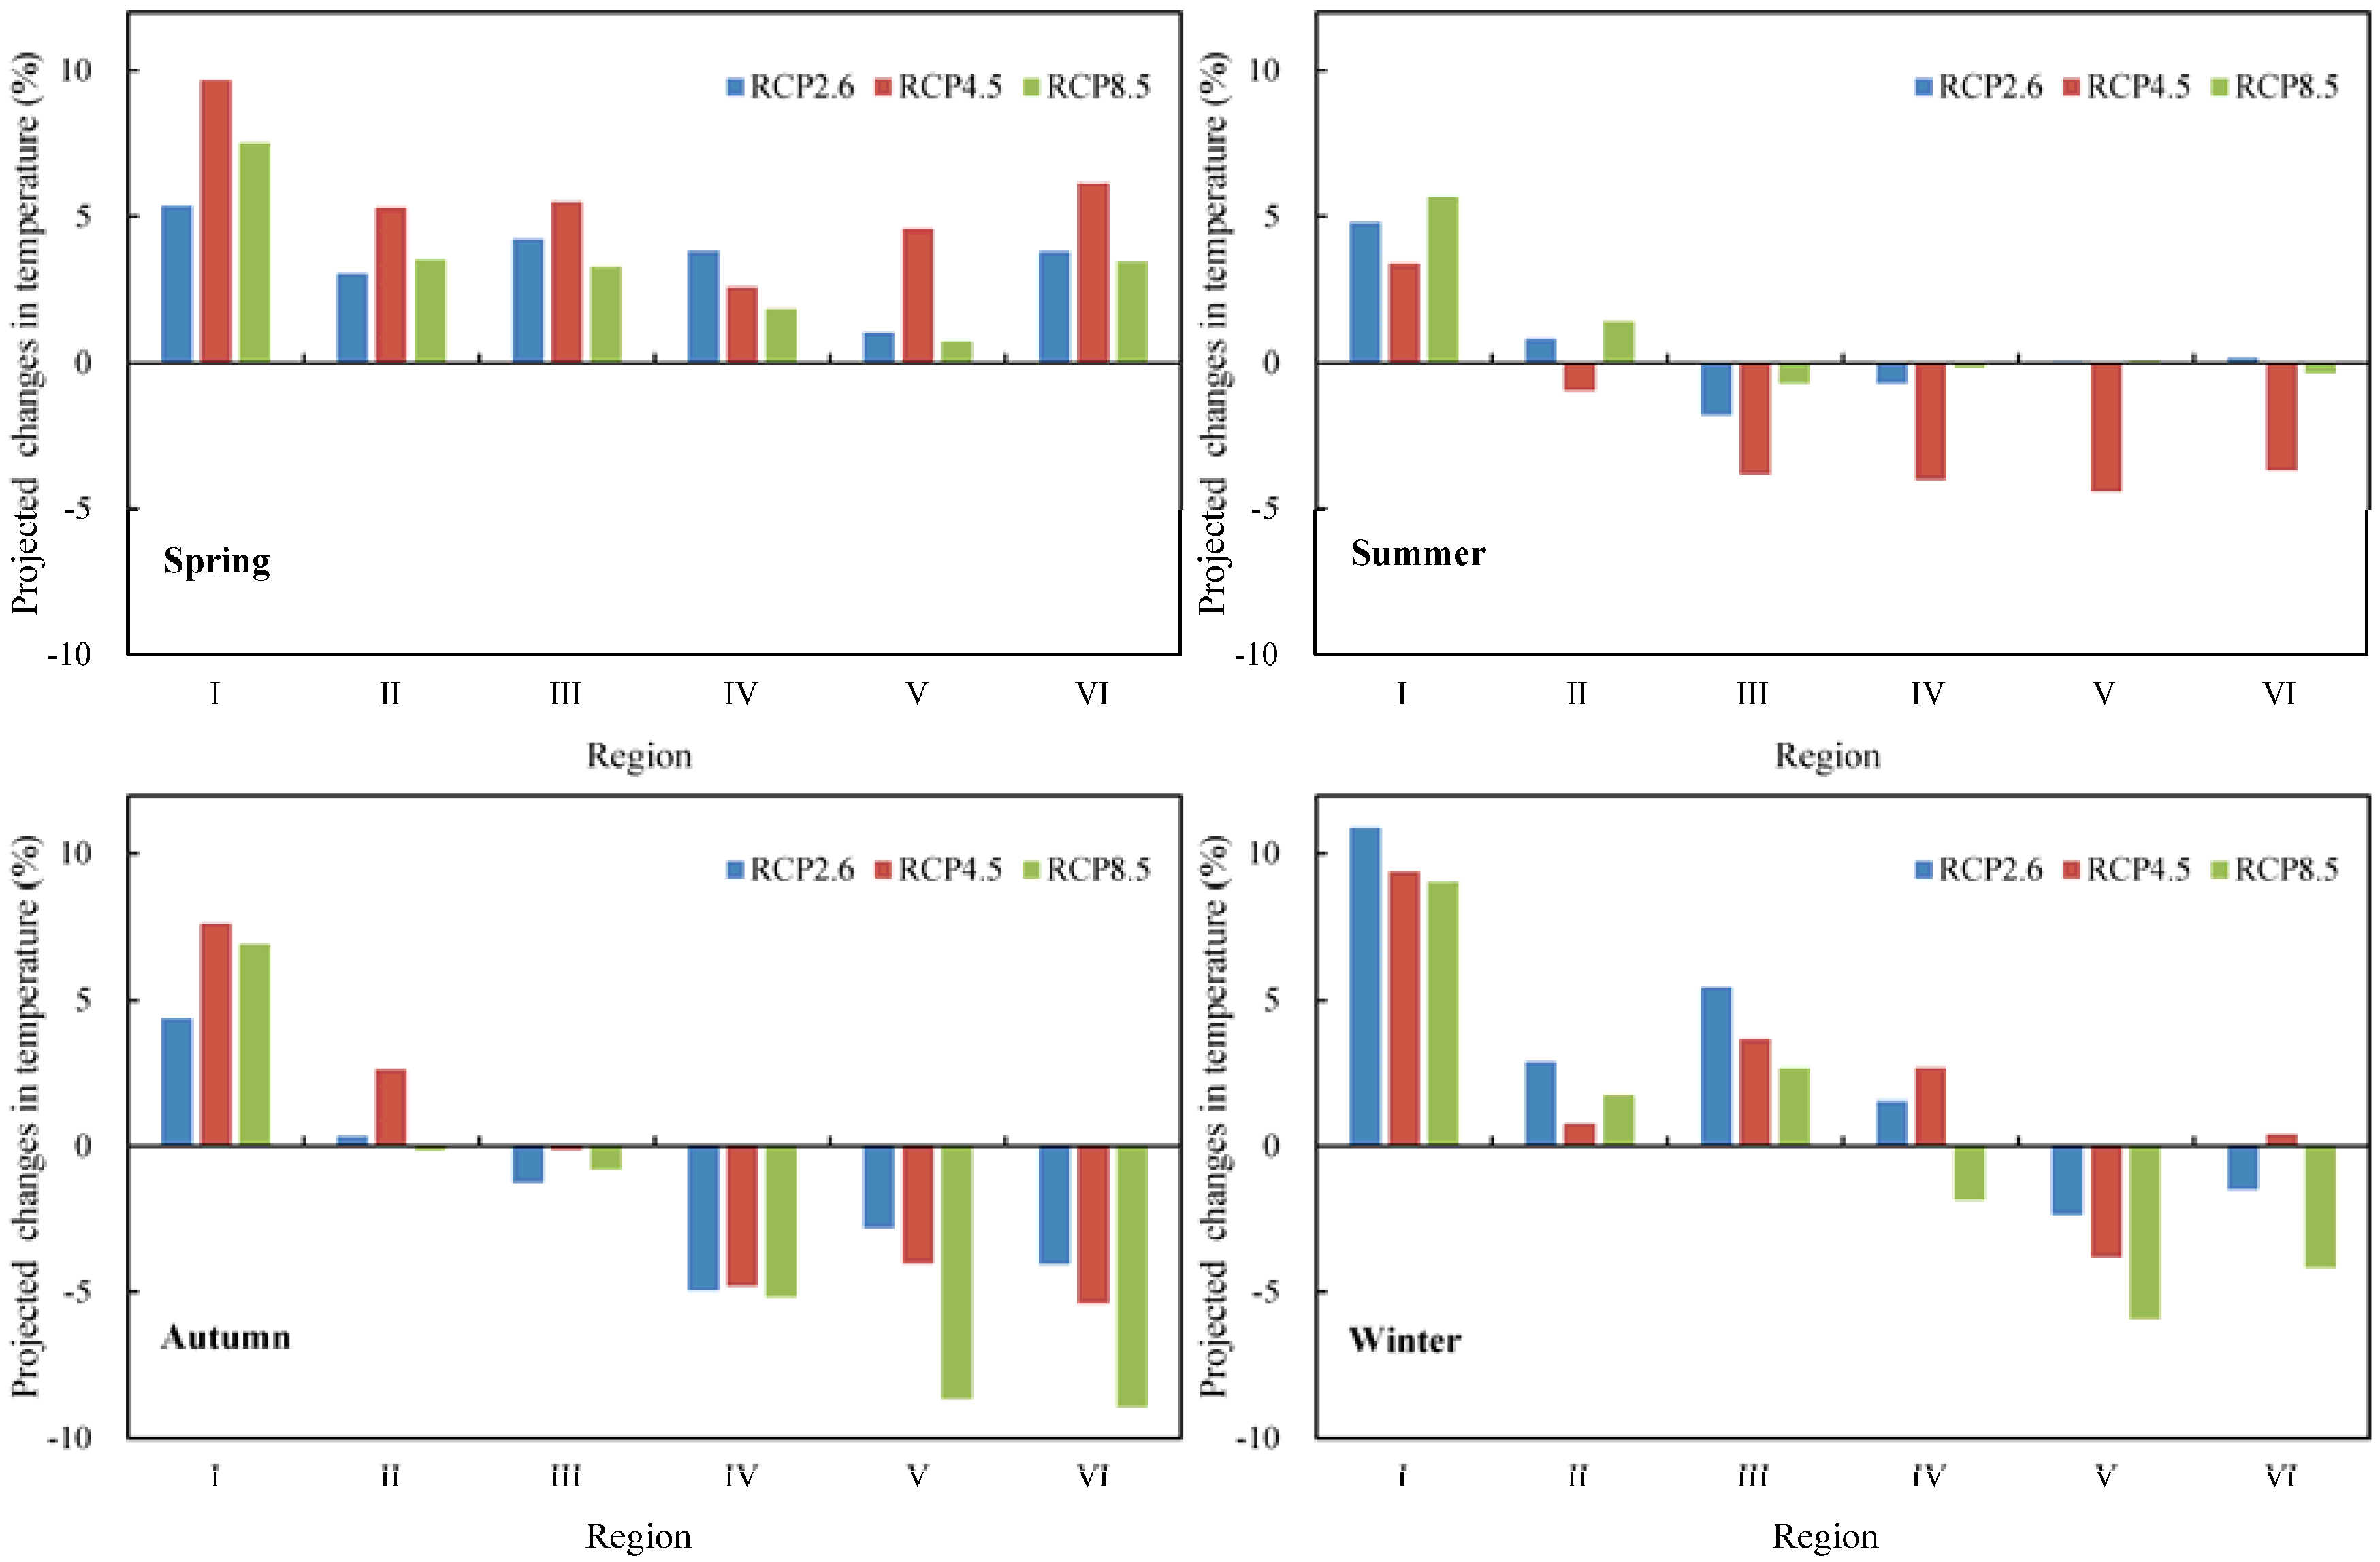
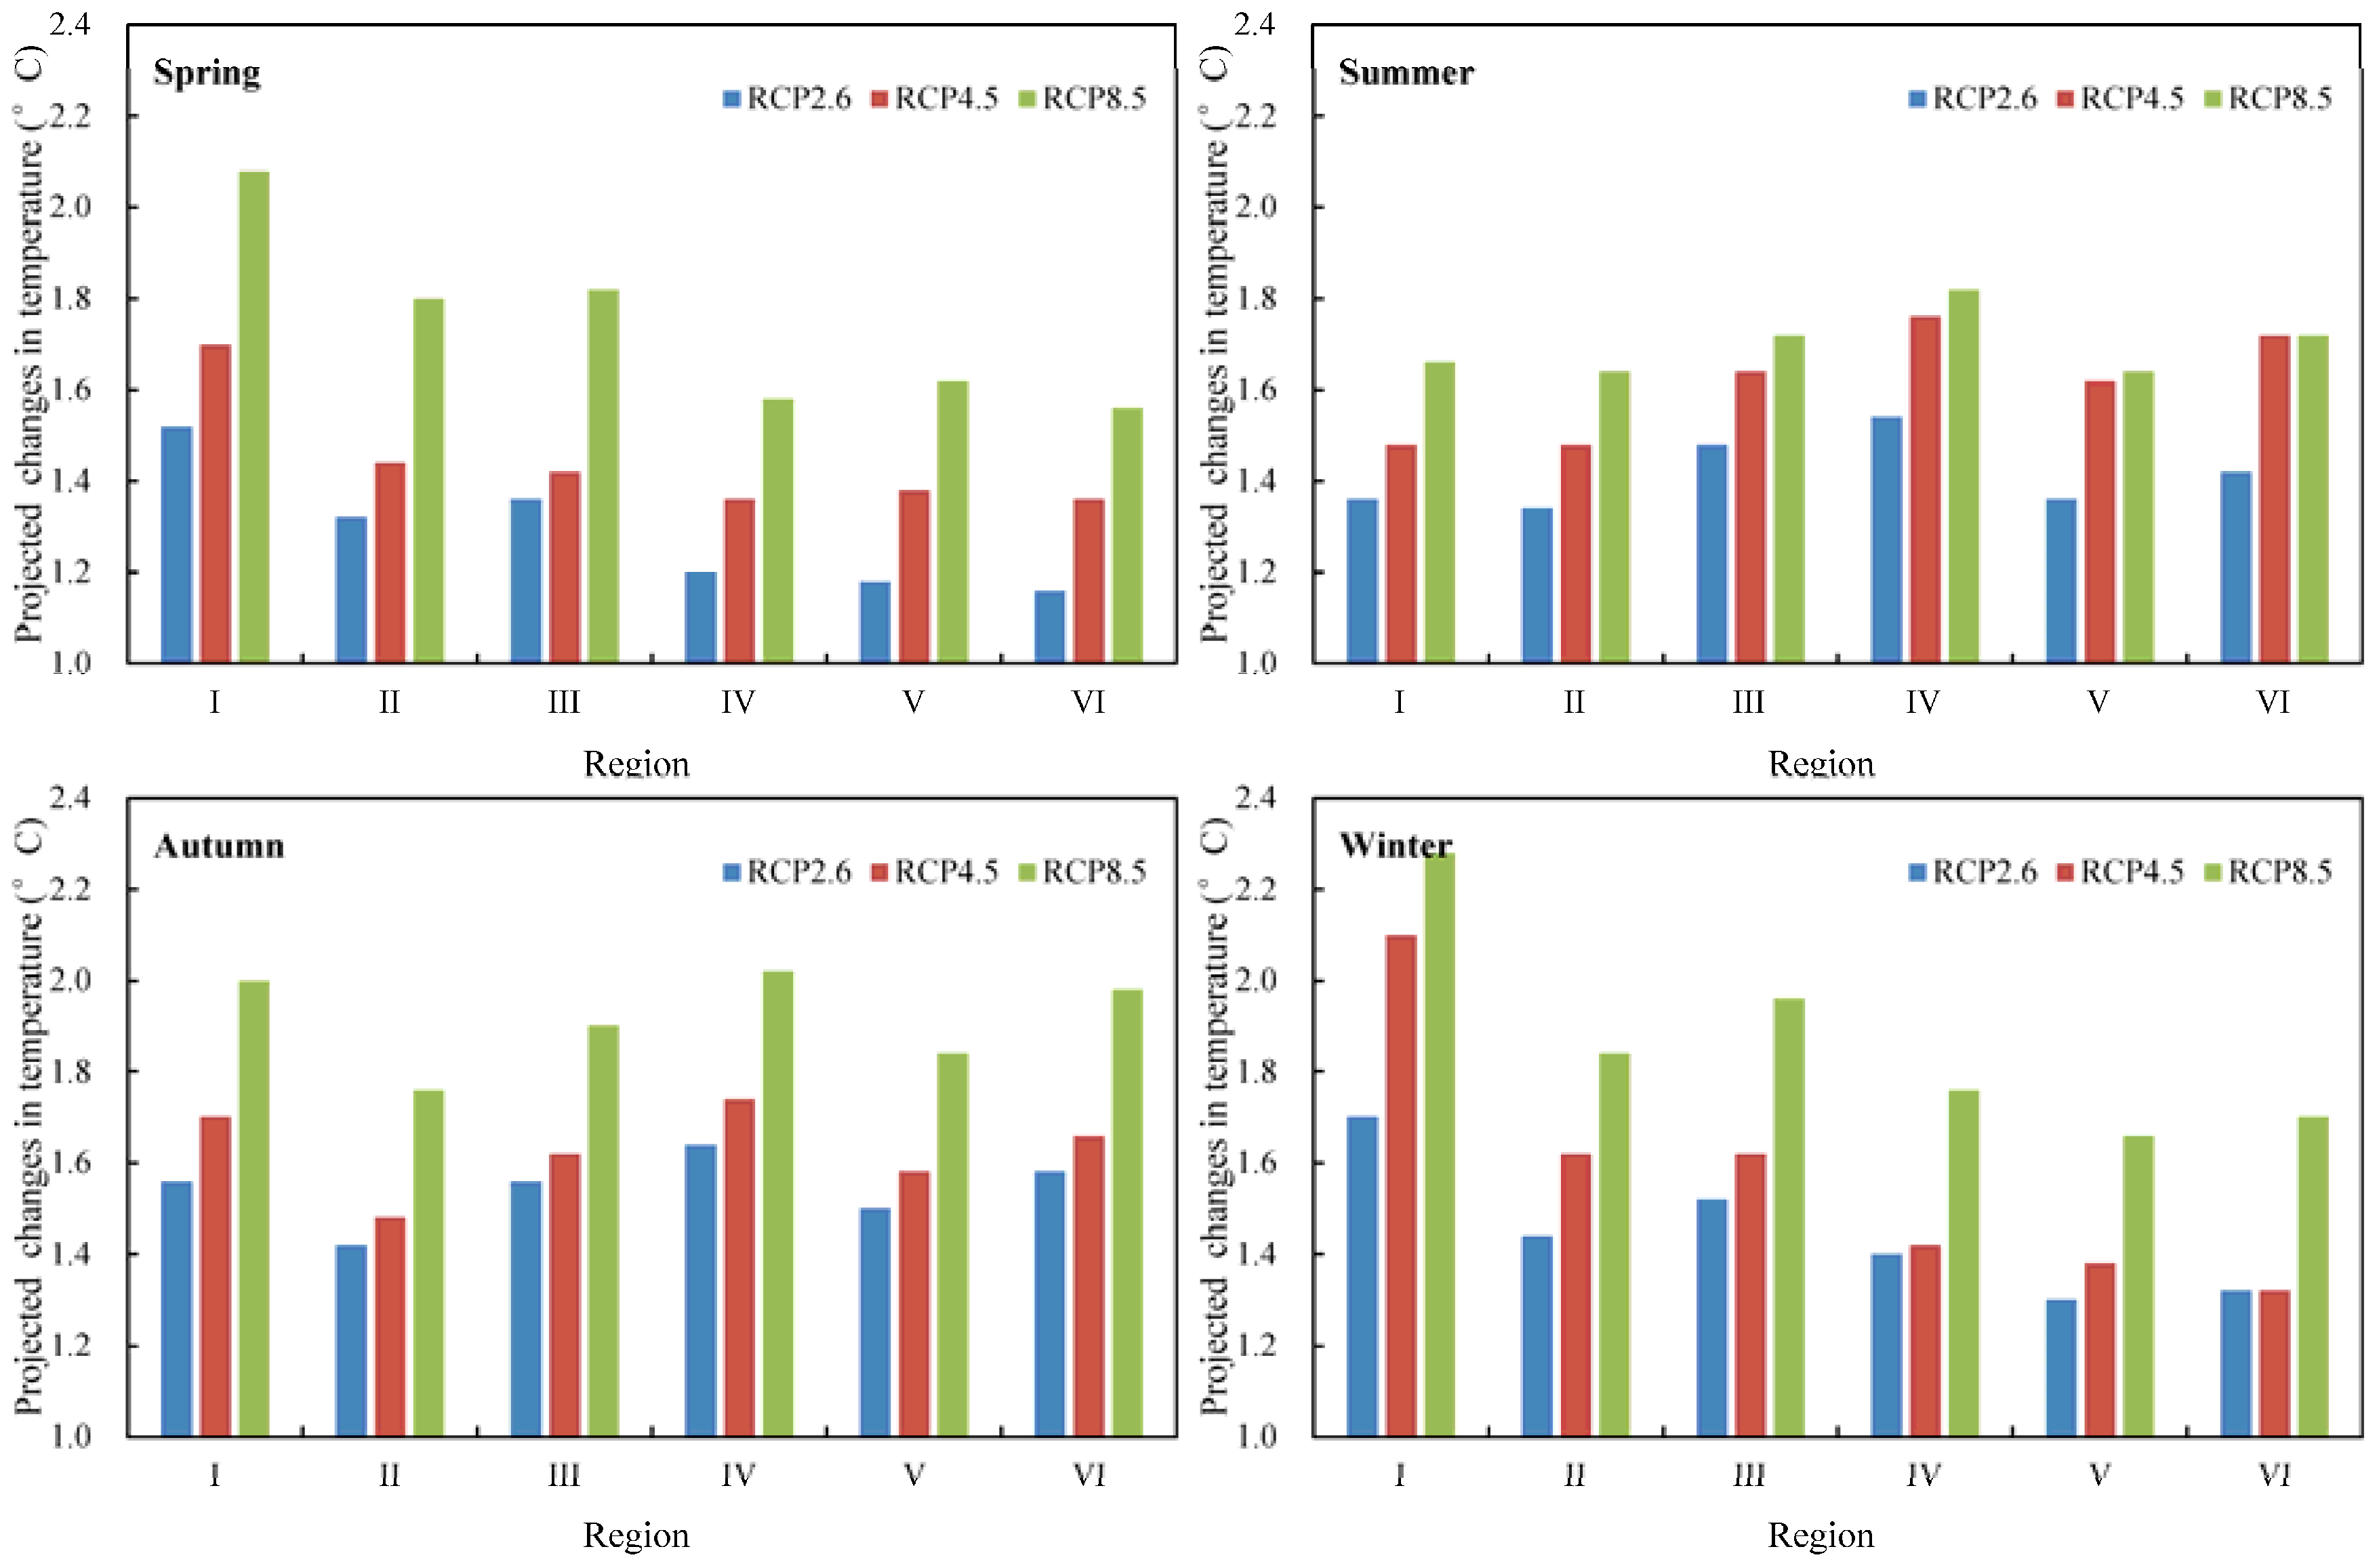
3.2.1. Projected Changes in Temperature

All five representative models project increases in temperature by the 2030s and show a good agreement (Table 5). Changes in mean annual temperature are 1.4 °C (1.0 °C to 2.0 °C) in RCP2.6, 1.6 °C (1.2 °C to 1.8 °C) in RCP4.5, and 1.8 °C (1.6 °C to 2.2 °C) in RCP8.5, respectively. For the seasonal mean temperature, the increases in autumn and winter are more significant and about 0.1 °C higher than the increase in annual average, while the increases in the spring and summer are less.
In terms of projected changes in temperature in each subregion (Figure 5), the degree of temperature rise varies. Regions I, II, and III experience a considerable temperature increase in spring and winter, while Regions IV, V, and VI have a smaller increase. In particular, the increase in Region I is the most prominent. In summer and autumn, the changes in all subregions are similar, with a slightly greater increase in Region IV.

3.2.2. Precipitation Changes

Table 6 shows the projected changes in mean annual and seasonal precipitation by the 2030s. The mean annual precipitation increases by 1.3% (−0.9% to 3.4%) in RCP2.6, 0.6% (−1.3% to 3.5%) in RCP4.5, and 1.3% (−0.2% to 2.9%) in RCP8.5. In terms of mean seasonal precipitation, the projected precipitation in spring is likely to increase by 3.8% (1.2% to 7.5%) in RCP2.6, 5.9% (1.7% to 12.4%) in RCP4.5, and 3.9% (1.2% to 6.0%) in RCP8.5. In winter, precipitation increases by 4.1% (3.1% to 6.1%) in RCP2.6, 3.1% (−6.7% to 13.0%) in RCP4.5, and 1.7% (−2.3% to 5.3%) in RCP8.5 The projected precipitation in summer increases by 1.0% (−1.0% to 3.2%) and 1.5% (−0.3% to 4.7%) under the RCP2.6 and RCP8.5 scenarios, respectively, but decreases by 1.4% (−3.9% to −0.1%) under the RCP4.5 scenario. In autumn, precipitation is less likely to increase as only RCP2.5 shows an increase by 0.8% (−3.0% to 6.3%). Under the RCP2.6 and RCP8.5 scenarios, the projected precipitation in autumn decreases by 0.5% (−7.0% to 8.3%) and 1.1% (−3.5% to 4.1%), respectively.
For the projected precipitation change in each subregion (Figure 6), the percentage increase in spring varies, but is always less than 10%. Moreover, the precipitation in Region I increases for all four seasons. In this region, there is a greater increase of approximately 10% in winter but a smaller increase of approximately 5% in summer. The precipitation in Region II also increases slightly. For Regions III, IV, V, and VI, summer and autumn precipitation decrease. In particular, Regions IV, V, and VI experience a more significant decrease in autumn precipitation. Under the RCP8.5 scenario, the decrease is more than 5%. In winter, Regions III and IV are more likely to receive more precipitation, while Regions V and VI receive less.

3.3. Analysis on Drought Variation Characteristics under Future Climate Change

3.3.1. Projected Changes in Numbers of Drought Events

Table 7 shows the projected changes in number of drought events by the 2030s. Under RCP2.6, RCP4.5 and RCP8.5, the number of events increases by 8 (5 to 11) in RCP2.6, 8 (6 to 9) in RCP4.5, and 7 events (5 to 9) in RCP8.5. The increase in each subregion varies. Under the RCP2.6 scenario, Region IV experiences a larger increase with 6 events (1 to 12), whereas, Region V has the least growth with 3 events (1 to 7). Under the RCP4.5 scenario, Region I experiences a smaller increase of 2 events (−5 to 6); while the other subregions have approximately 5 events. Similarly, under the RCP8.5 scenario, Region I has a slight increase of only 3 events (−2 to 7), but the number increases by at least 5 events for the other subregions. In particular, the increase in Region II is more than 8 events (4 to 14).

3.3.2. Projected Changes in Drought Duration

As shown in Table 8, the regional drought duration is likely to increase by the 2030s. The projected duration increases by 21 d (3 d to 58 d) in RCP2.6, 18 d (12 d to 26 d) in RCP4.5, and 25 d (13 d to 63 d) in RCP8.5. Each subregion increases by a different degree. Among them, Region V has the most considerable increase of 24 d (−5 d to 47 d) in RCP2.6, 17 d (5 d to 40 d) in RCP4.5, and 21 d (10 d to 33 d) in RCP8.5. The increase in Region I is the smallest, being 1 d (−25 d to 26 d) in RCP2.6, 1 d (−28 d to 30 d) in RCP4.5, and 2 d (−33 d to 28 d) in RCP8.5. Although a few models project a decrease in drought duration in some subregions, the projection results from multiple-model mean still indicate a significant increase in drought duration.
From grid drought duration, under the RCP2.6 scenario (the first row in Figure 7), the duration increase varies for regional droughts, and the areas with longer lasting droughts occupy 80% of the drainage area under study. About 52% of the area experiences an increase within 15 d. Greater increases are found in downstream Region II and Regions IV and V, and upstream Region VI. At some localities, the increase exceeds 30 d. The areas with reduced duration are concentrated in Region IV with a drop within 15 d. Compared with the results under the RCP2.6 scenario, the results under the RCP4.5 scenario indicate fewer areas with extended drought durations. The areas with longer drought duration occupy about 74% of the drainage area. Most areas experience a duration increase of 15 d, which accounts for 44% of the entire drainage area. Downstream Region II, part of Regions IV, Region V, and upstream Region VI have larger increases, with an increase over 30 d at some localities. The areas with reduced duration are concentrated in Region I, upstream Region II, midstream and upstream Region IV, and midstream and downstream Region VI, with an increase often within 15 d. under the RCP8.5 scenario, the area with extended drought duration accounts for about 81% of the drainage area. Most of the regions have a duration increase within 15 d, occupying about 53% of the drainage area. Region I, downstream Region II, Regions V and upstream Region VI have a greater increase, some of which experience an increase of over 30 d. The areas with shorter droughts are clustered in upstream Region I and midstream Region IV, with a drop within 15 d.

3.3.3. Projected Changes in Drought Areal Extent

The projected changes in drought areal extent (Table 9) is likely to decrease by 1.5% (−11.1% to 3.9%) in RCP2.6, 1.3% (−10.7% to 9.2%) in RCP4.5, and 2.7% (−10.0% to 7.1%) in RCP8.5. Region IV shows a decreasing trend. In this region, the drought area decreases by 5.8% (−15.3% to 1.4%) in RCP2.6, 1.0% (−9.3% to 10.5%) in RCP4.5, and 2.1% (−10.5% to 5.7%) in RCP8.5. However, other subregions demonstrate an increasing trend, with an increase within 10%. Among them, Region III shows the greatest increase of 6.9% (−7.2% to 31.2%) under the RCP2.6 scenario, whereas, Region V has the greatest increase of 7.1% (0.7% to 11.8%) under the RCP4.5 scenario. Under the RCP8.5 scenario, Regions III and VI experience the most significant increase of 9.7% (−10.4% to 17.0% and 0.6% to 33.2%, respectively).

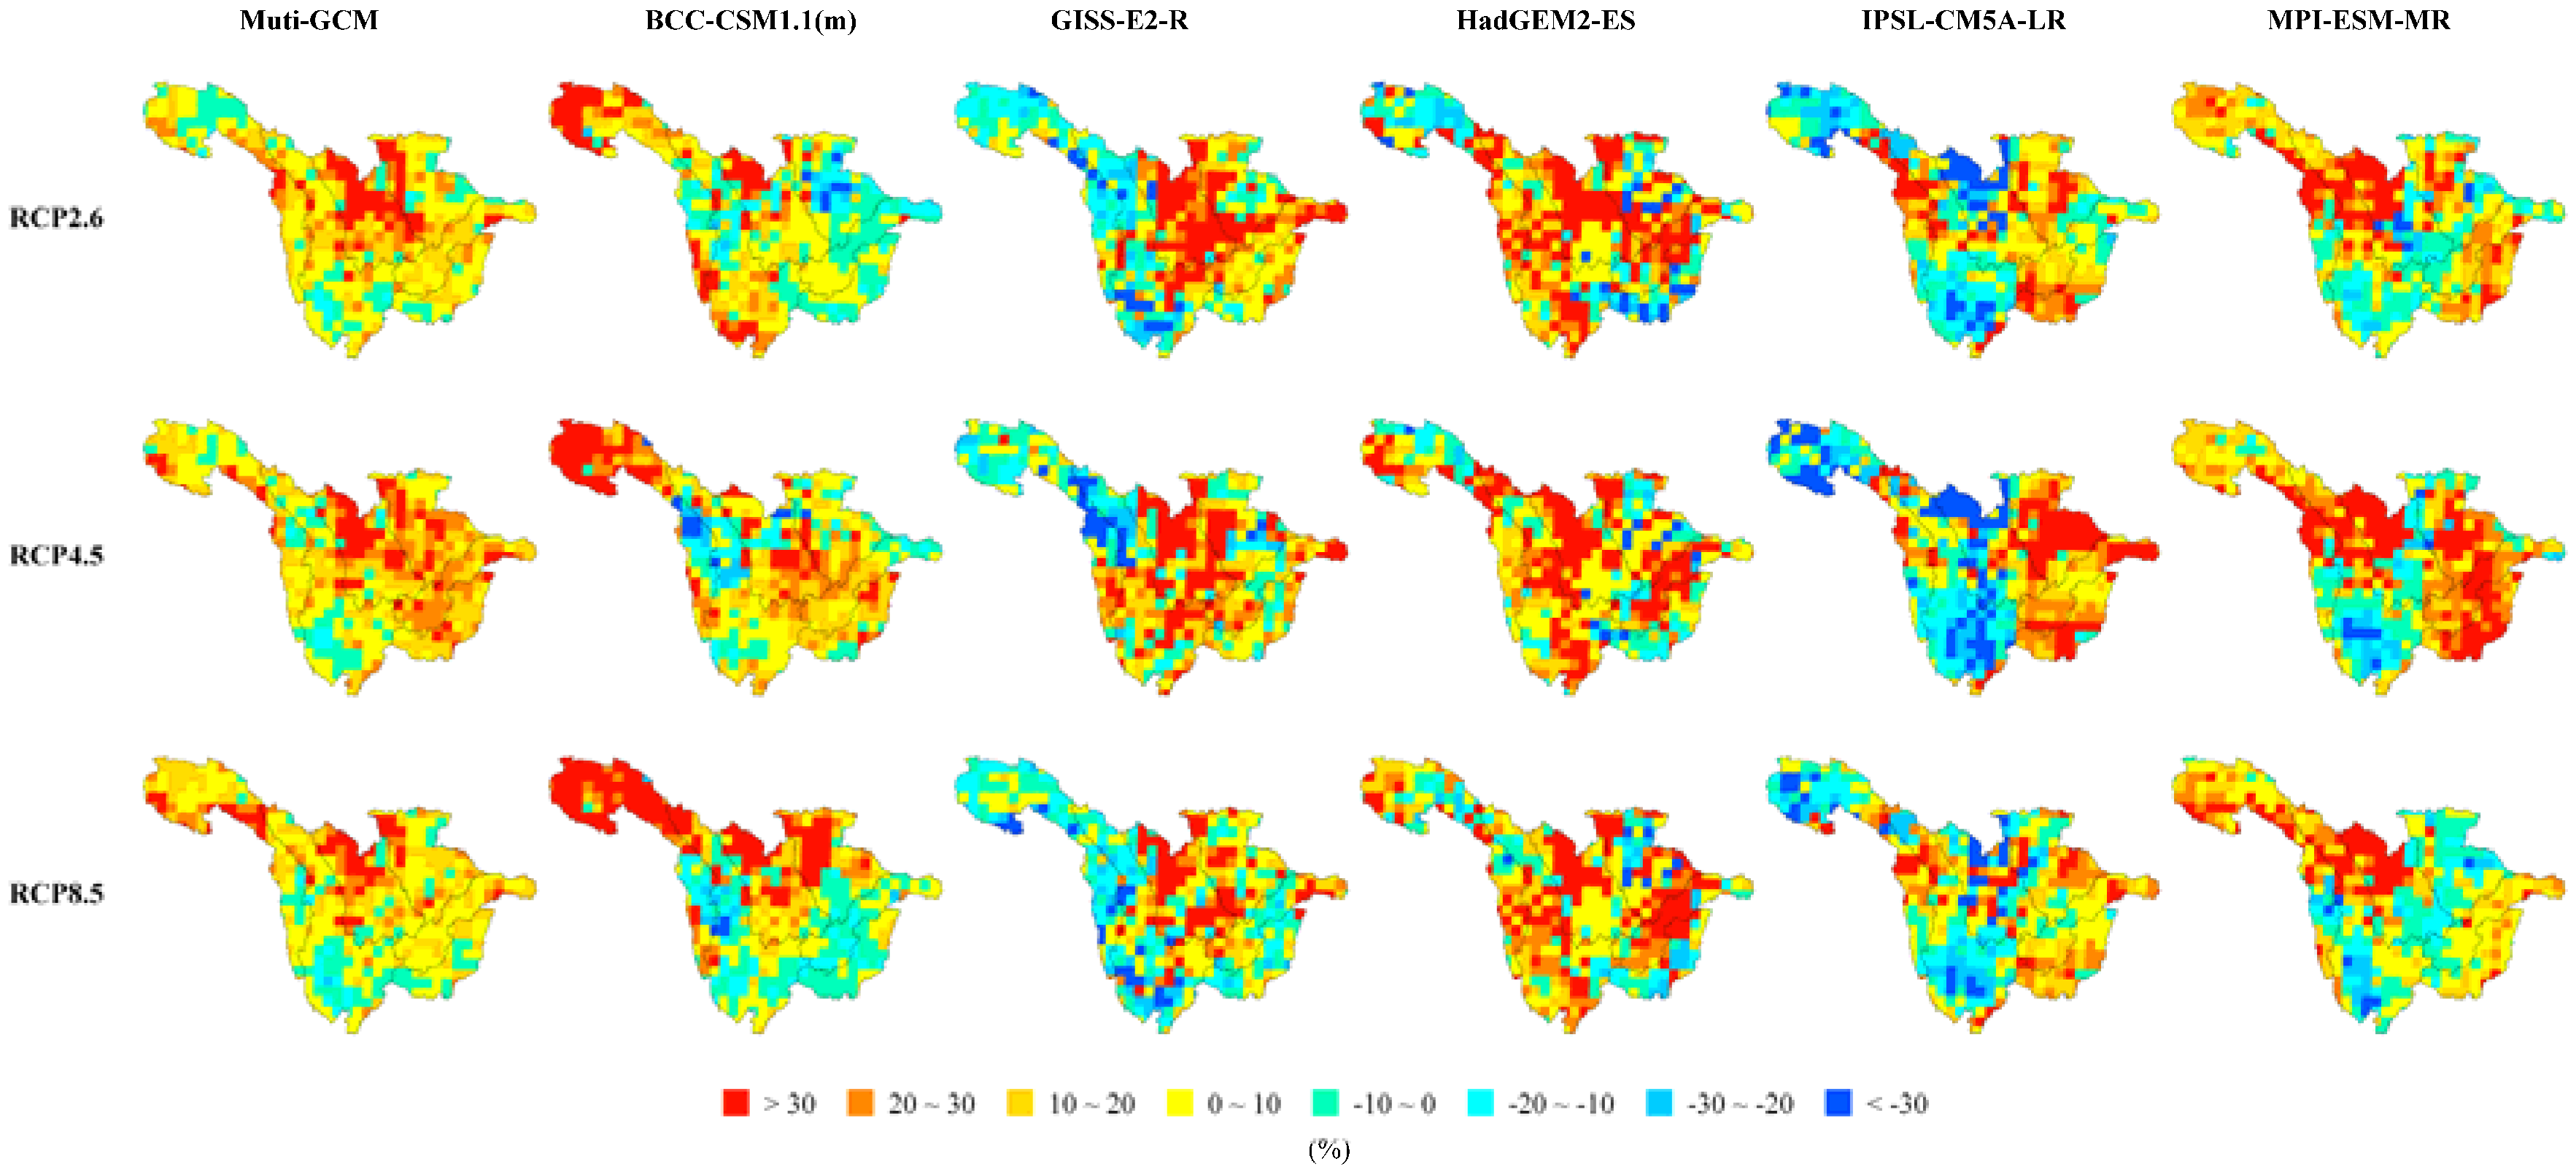
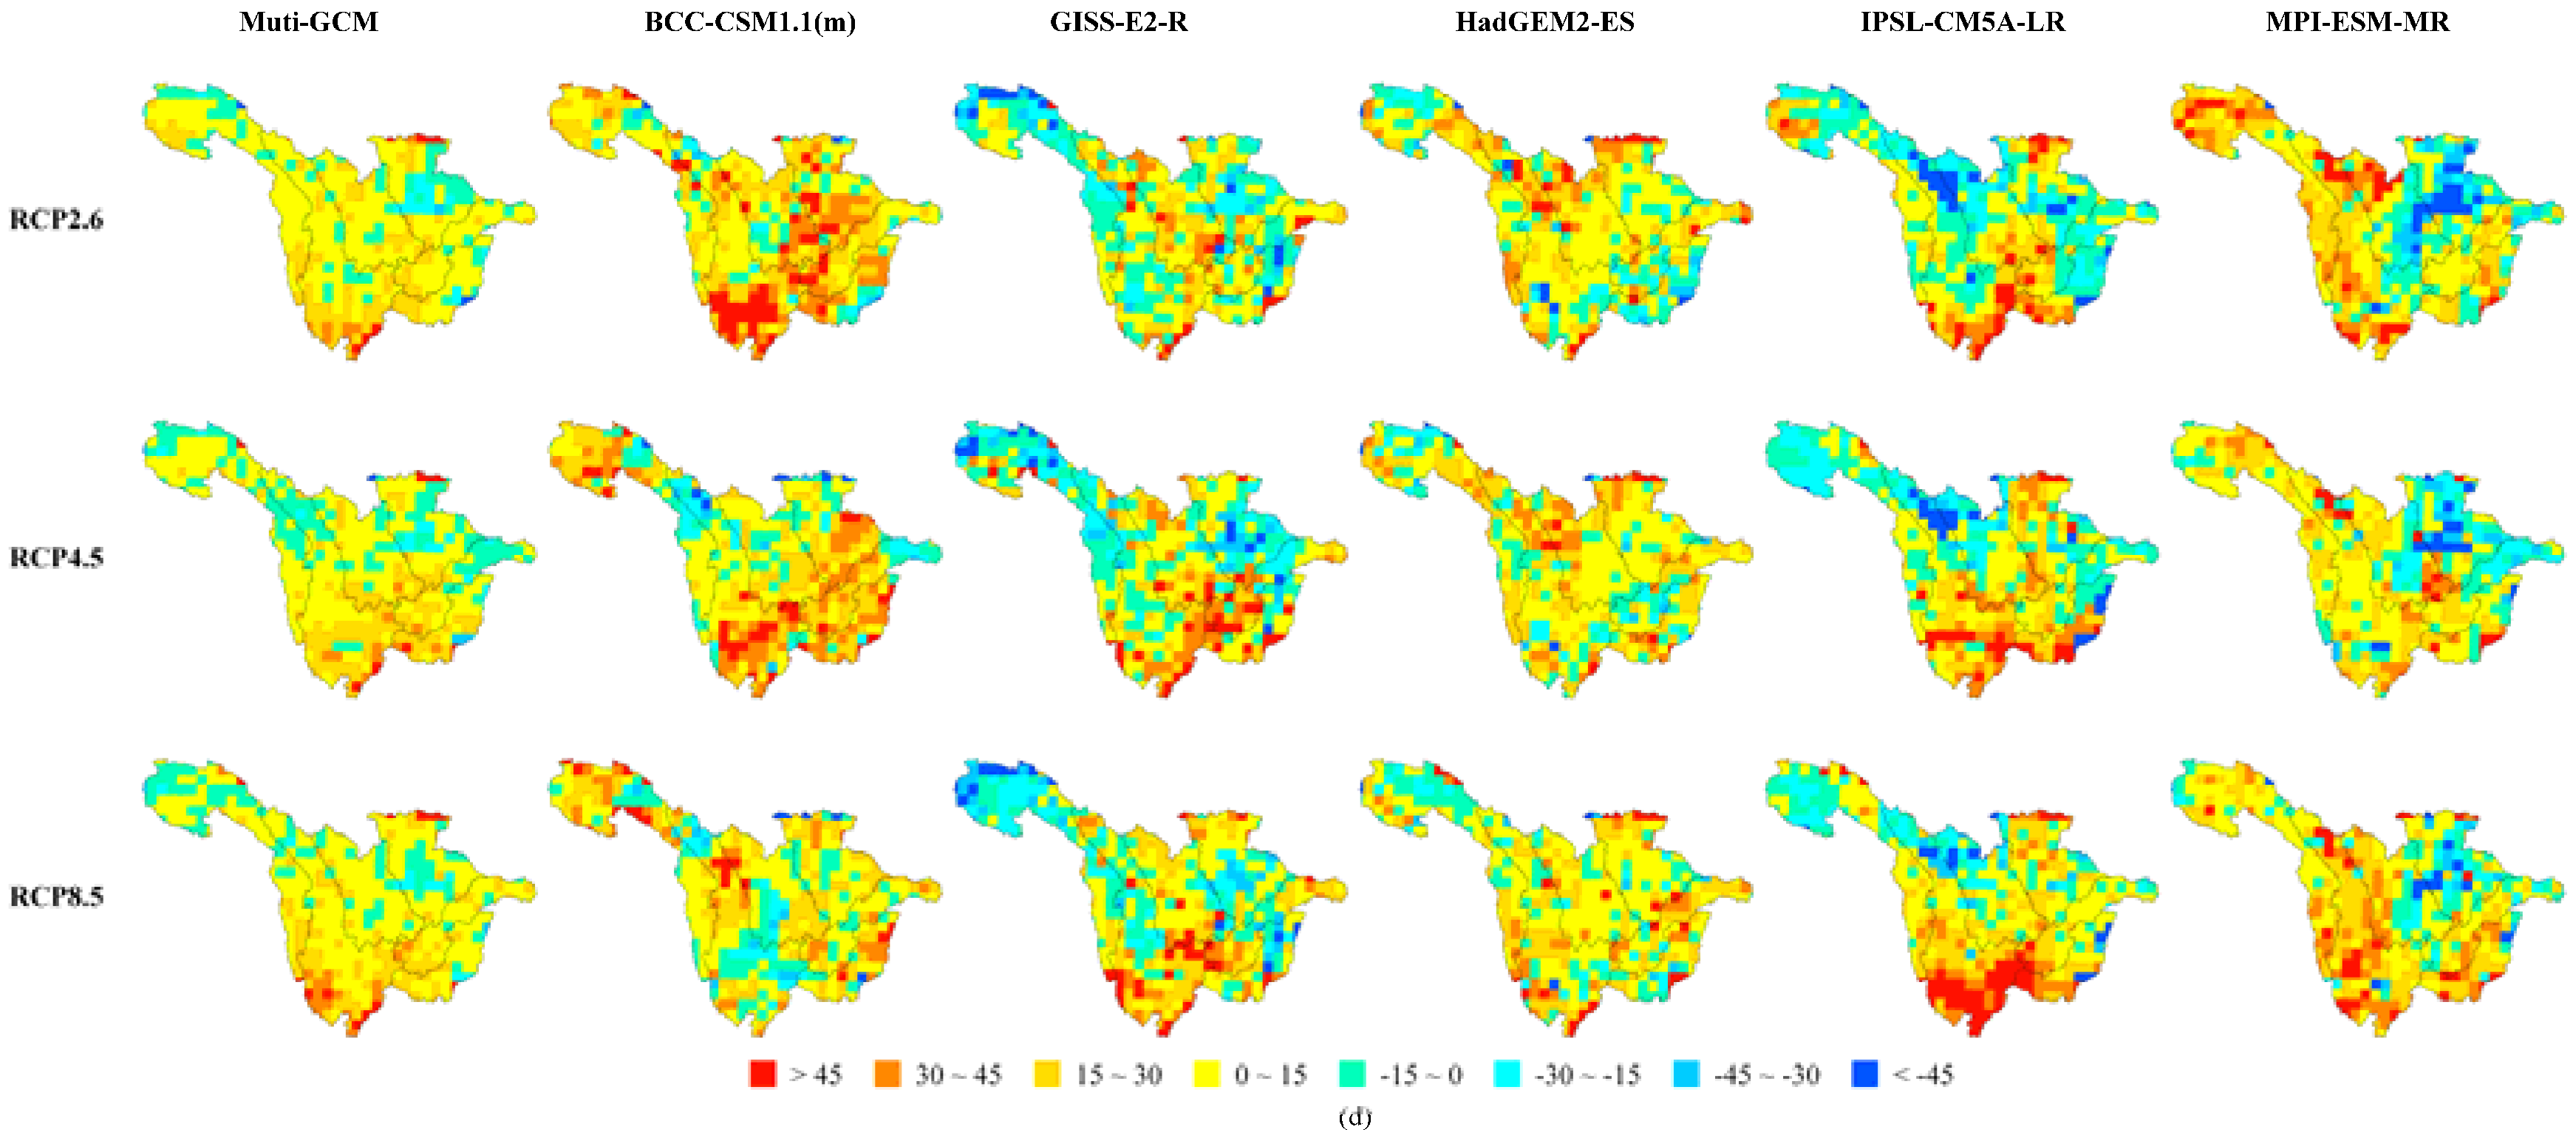
3.3.4. Projected Changes in Drought Intensity

The intensity of the regional drought is likely to increase over the upstream Yangtze River region (Table 10). The intensity increases by 2.6% (−11.2% to 1.2%) in RCP2.6, 6.2% (0.6% to 12.5%) in RCP4.5, and 1.2% (−3.9% to 5.0%) in RCP8.5, respectively. In each subregion, strengthened droughts are also noted. Among them, Region IV has the greatest intensity increase, which is 13.4% (1.4% to 43.0%) in RCP2.6, 19.4% (8.3% to 44.6%) in RCP4.5, and 14.0% (−2.0% to 43.1%) in RCP8.5. In all scenarios, the increase in Region IV exceeds 10%. Region II experiences the smallest increase. Under the RCP8.5 scenario, the rise in Region II is just 0.3% (−3.7% to 12.4%).
For the variations of grid drought intensity (Figure 8) under the RCP2.6 scenario, the area with stronger drought occupies 82% of the drainage area, but the intensity increase differs. Region II demonstrates a greater increase, with an average over 30%. The areas with less intensive droughts are mostly located in upstream Region I and midstream and downstream of Region II, with a decrease within 10%. Compared with that under the RCP2.6 scenario, the output under the RCP4.5 scenario shows more areas with stronger droughts, accounting for 89% of the drainage area under study. The increase in Regions III, IV, V, and VI often exceeds 20%. The areas with reduced drought intensity are concentrated midstream and downstream of Region II, with a drop within 10% under the RCP8.5 scenario; the areas with increased intensity account for 83% of the entire drainage area, which agrees with that under the RCP2.6 scenario. The difference between the results in RCP8.5 and RCP2.6 show that the intensity increases in upstream Region I but decreases in some areas in Region V under the RCP8.5 scenario. The areas with a greater increase are mainly located in Region I and upstream Region III, while those with decreased intensity are concentrated in the midstream and downstream areas of Region II, with a reduction falling within 10%.

4. Discussion

Although the soil moisture content would increase with an increase of 0.6%–1.3% in precipitation, that could be not enough to offset the impacts derived from temperature increases (1.4–1.8 °C), which would lead to higher evaporation rates. For a better understanding of VIC model sensitivities to changes in temperature and precipitation, a series of hypothetical climate scenarios are constructed through altering the baseline temperature and precipitation data, e.g., temperature changes of ∆T = 0.0 °C, 1.4 °C, 1.8 °C with precipitation changes of ∆P = 0.0%, 0.6%, 1.3%. Comparing with the baseline soil moisture content, if the precipitation remained unchanged and the temperature rose from 1 °C to 2 °C, then the soil moisture content changes would decrease from −0.8% to −1.5%. Meanwhile, a precipitation increase of 0.6%–1.3% combined with unchanged temperatures are likely to result in soil moisture content merely changing from 0.1% to 0.2%. The results indicate that the drought is more sensitive to the variation of temperature than to the precipitation under the future climate scenarios.
Changes in drought frequency, duration, areal extent, and intensity suggest that regional drought would become more severely prolonged and frequent in the future. The trends of projected changes of drought characteristics agree well with the findings by Leng et al. [33]. However, there is still a large uncertainty in the quantitative drought assessment on the impact of climate change. Some previous studies indicate that the largest uncertainty sources may arise from GCM structure [23,34,35]. In this study, the similarity in precipitation simulation between climate models was considered for GCM selections, which could reduce the uncertainty from GCM structure to a certain extent by using multi-model ensembles. However, it should be noted that no general all-purpose metric satisfactorily utilizes the various outputs of GCMs to the present. In addition, based on current study, the correlations among drought characteristics are needed for future study.

5. Conclusions

This study evaluated the effects of climate change on the temporal and spatial distribution of drought characteristics, such as the number of drought events, drought duration, drought area, and drought intensity in the upstream Yangtze River region for the next 30 years. The main results are summarized as follows:
(1)
The simulated soil moisture content based on variable infiltration capacity (VIC) model was applied to construct a recognition system for historical drought events. This can better reconstruct the occurrence, development, and termination processes for typical historical drought events in order to analyze the temporal and spatial variation patterns of drought events.
(2)
Compared with the baseline period, the projected changes in temperature are likely to increase from 1.4 °C to 1.8 °C by the 2030s, with a more significant increase in autumn and winter. The mean annual precipitation is likely to increase slightly by 0.6% to 1.3%. However, the seasonal mean precipitation would only increase under the RCP4.5 scenario by merely 0.8% in autumn. In spring, the mean seasonal precipitation increase differs in the subregions. In Regions III, IV, V, and VI, the precipitation is likely to decrease in summer and autumn. In Regions V and VI, the precipitation in winter could also be decreased.
(3)
The projected changes in drought frequency, duration, areal extent, intensity suggest that regional drought would become more severely prolonged and frequent by the 2030s. Seven to eight additional regional drought events are likely to happen and the drought duration could extend for 18 d to 25 d. The areas with shorter droughts often have a duration drop within 15 d. The drought area decreases by 1.3% to 2.7% on average. The regional drought intensity increases by 1.2% to 6.2%, with the greatest increase of over 10% in Region IV. The drought intensity increases for more than 80% of the study area, and the increase is over 30% in some localities.

Acknowledgments

This work is supported by the National Natural Science Foundation of China (Grant No. 51579065), the Special Public Sector Research Program of Ministry of Water Resources (Grants No. 201301040 and No. 201401008), the Scientific Research Foundation of the Higher Education Institutions of Henan Province (16A570003) and the Fundamental Research Funds for the Central Universities (No. 2015B20414). The authors thank the WCRP Coupled Model Working Group (WGCM) organization PCMDI for collecting and categorizing the CMIP5 climate forecast data. We also thank each model group for providing the raw data for the global climate model projections.

Author Contributions

Guihua Lu and Zhiyong Wu conceived and designed the study; Hongwei Wu performed the data analysis; Hongwei Wu and Heng Xiao wrote the paper, and Hai He read and polished the manuscript.

Conflicts of Interest

The authors declare no conflict of interest.

References

  1. EM-DAT. “Disaster Profiles”. Available online: http://www.emdat.be/disaster_profiles/index.html (accessed on 1 September 2015).
  2. The Intergovernmental Panel on Climate Change (IPCC). Climate Change 2013: The Physical Science Basis; Fifth Assessment Report of the Intergovernmental Panel on Climate Change; Cambridge University Press: Cambridge, UK, 2013. [Google Scholar]
  3. The Intergovernmental Panel on Climate Change (IPCC). Climate Change 2014: Impacts, Adaptation, and Vulnerability; Fifth Assessment Report of the Intergovernmental Panel on Climate Change; Cambridge University Press: Cambridge, UK, 2014. [Google Scholar]
  4. Dai, A. Drought under global warming: A review. WIREs Clim. Chang. 2010, 2, 45–65. [Google Scholar] [CrossRef]
  5. Wang, A.; Lettenmaier, D.P.; Sheffield, J. Soil moisture drought in China, 1950–2006. J. Clim. 2011, 24, 3257–3271. [Google Scholar] [CrossRef]
  6. Wang, H.S.; Rogers, J.C.; Munroe, D.K. Commonly used drought indices as indicators of soil moisture in China. J. Hydrometeorol. 2015, 16, 1397–1408. [Google Scholar] [CrossRef]
  7. Wu, Z.Y.; Lu, G.H.; Wen, L.; Lin, C.A.; Zhang, J.Y.; Yang, Y. Thirty-five year (1971–2005) simulation of daily soil moisture using the variable infiltration capacity model over China. Atmos. Ocean 2007, 45, 37–45. [Google Scholar] [CrossRef]
  8. Wen, L.; Lin, C.A.; Wu, Z.Y.; Lu, G.H.; Pomeroy, J.; Zhu, Y.F. Reconstructing sixty year (1950–2009) daily soil moisture over the Canadian Prairies using the Variable Infiltration Capacity model. Can. Water Resour. J. 2011, 36, 83–102. [Google Scholar] [CrossRef]
  9. Liang, X.; Lettenmaier, D.P.; Wood, E.F.; Burges, S.J. A simple hydrologically based model of land surface water and energy fluxes for general circulation models. J. Geophys. Res. 1994, 99, 415–428. [Google Scholar] [CrossRef]
  10. Liang, X.; Wood, E.F.; Lettenmaier, D.P. Surface soil moisture parameterization of the VIC-2L model: Evaluation and modification. Glob. Planet. Chang. 1996, 13, 195–206. [Google Scholar] [CrossRef]
  11. Andreadis, K.M.; Clark, E.A.; Wood, A.W.; Hamlet, A.F.; Lettenmaier, D.P. Twentieth-century drought in the conterminous United States. J. Hydrometeorol. 2005, 6, 985–1001. [Google Scholar] [CrossRef]
  12. Wu, Z.Y.; Lu, G.H.; Wen, L.; Lin, C.A. Reconstructing and analyzing China’s fifty-nine year (1951–2009) drought history using hydrological model simulation. Hydrol. Earth Syst. Sci. 2011, 15, 2881–2894. [Google Scholar] [CrossRef] [Green Version]
  13. Byun, H.R.; Wilhite, D.A. Objective quantification of drought severity and duration. J. Clim. 1999, 12, 2747–2756. [Google Scholar] [CrossRef]
  14. Knutti, R.; Furrer, R.; Tebaldi, C.; Cermak, J.; Meehl, G.A. Challenges in combining projections from multiple models. J. Clim. 2010, 23, 2739–2758. [Google Scholar] [CrossRef]
  15. Doblas-Reyes, F.J.; Pavan, V.; Stephenson, D.B. The skill of multi-model seasonal forecasts of the wintertime North Atlantic Oscillation. Clim. Dyn. 2003, 21, 501–514. [Google Scholar] [CrossRef]
  16. Thomson, M.C.; Doblas-Reyes, F.J.; Mason, S.J.; Hagedorn, R.; Connor, S.J.; Phindela, T.; Morse, A.P.; Palmer, T.N. Malaria early warnings based on seasonal climate forecasts from multi-model ensembles. Nature 2006, 439, 576–579. [Google Scholar] [CrossRef] [PubMed]
  17. Knutti, R.; Masson, D.; Gettelman, A. Climate model genealogy: Generation CMIP5 and how we got there. Geophys. Res. Lett. 2013, 40, 1194–1199. [Google Scholar] [CrossRef]
  18. Masson, D.; Knutti, R. Climate model genealogy. Geophys. Res. Lett. 2011, 38, 167–177. [Google Scholar] [CrossRef]
  19. Abramowitz, G. Model independence in multi-model ensemble prediction. Aust. Meteorol. Ocean. 2010, 59, 3–6. [Google Scholar]
  20. Feng, Y.W.; Ren, G.Y.; Liu, Z.Y.; Wu, J.D.; Zhang, L. Rainfall and runoff trends in upper Yangtze River. Res. Sci. 2013, 37, 63–67. (In Chinese) [Google Scholar]
  21. Zhao, Z.C.; Luo, Y.; Huang, J.B. A review on evaluation of climate modeling. Adv. Clim. Chang. Res. 2013, 9, 1–8. (In Chinese) [Google Scholar]
  22. Zhang, N.; Xia, Z.Q.; Zhang, S.F.; Jiang, H. Temporal and spatial characteristics of precipitation and droughts in the upper reaches of the Yangtze River basin (China) in recent five decades. J. Hydroinform. 2012, 14, 221–235. [Google Scholar] [CrossRef]
  23. Hong, X.; Guo, S.; Zhou, Y.; Xiong, L.H. Uncertainties in assessing hydrological drought using streamflow drought index for the upper Yangtze River basin. Stoch. Environ. Res. Risk Assess. 2015, 29, 1235–1247. [Google Scholar] [CrossRef]
  24. Xu, J.J.; Yang, D.W. New model for drought estimation and prediction based on distributed hydrological simulation. J. Hydraul. Eng. 2010, 41, 739–747. (In Chinese) [Google Scholar]
  25. Hansen, M.C.; Defries, R.S.; Townshend, J.R.G.; Sohlberg, R. Global land cover classification at 1 km spatial resolution using a classification tree approach. Int. J. Remote Sens. 2000, 21, 1331–1364. [Google Scholar] [CrossRef]
  26. Reynolds, C.A.; Jackson, T.J.; Rawls, W.J. Estimating soil water-holding capacities by linking the Food and Agriculture Organization Soil map of the world with global pedon databases and continuous pedotransfer functions. Water Resour. Res. 2000, 36, 3653–3662. [Google Scholar] [CrossRef]
  27. Rosenbrock, H.H. An automatic method for finding the greater or least value of a function. Comput. J. 1960, 3, 175–184. [Google Scholar] [CrossRef]
  28. Pennell, C.; Reichler, T. On the effective number of climate models. J. Clim. 2011, 24, 2358–2367. [Google Scholar] [CrossRef]
  29. Lenderink, G.; Buishand, A.; Wvan, D. Estimates of future discharges of the river Rhine using two scenario methodologies: Direct versus delta approach. Hydrol. Earth Syst. Sci. 2007, 11, 1145–1159. [Google Scholar] [CrossRef]
  30. Wood, A.W.; Maurer, E.P.; Kumar, A.; Lettenmaier, D.P. Long-range experimental hydrologic forecasting for the eastern United States. J. Geophys. Res. 2002, 107, 4429. [Google Scholar] [CrossRef]
  31. Raff, D.A.; Pruitt, T.; Brekke, L.D. A framework for assessing flood frequency based on climate projection information. Hydrol. Earth Syst. Sci. 2009, 13, 2119–2136. [Google Scholar] [CrossRef]
  32. Wang, S.P.; Duan, H.X.; Feng, J.Y. China drought effect and causes analysis in 2011. J. Arid Meteorol. 2012, 30, 136–147. (In Chinese) [Google Scholar]
  33. Leng, G.; Tang, Q.; Rayburg, S. Climate change impacts on meteorological, agricultural and hydrological droughts in China. Glob. Planet. Chang. 2015, 126, 23–34. [Google Scholar] [CrossRef]
  34. Kay, A.L.; Davies, H.N.; Bell, V.A.; Jones, R.G. Comparison of uncertainty sources for climate change impacts: Flood frequency in England. Clim. Chang. 2009, 92, 41–63. [Google Scholar] [CrossRef] [Green Version]
  35. Seo, S.B.; Kim, Y.O.; Kim, C.R. A new way for incorporating GCM information into water shortage projections. Water 2015, 7, 2435–2450. [Google Scholar] [CrossRef]
Figure 1. Location of the study area and locations of the hydrological and meteorological stations.
Water 08 00576 g001
Figure 2. Observed and simulated monthly hydrograph at the Yichang station.
Water 08 00576 g002
Figure 3. Hierarchical cluster of the 47 Coupled Model Intercomparison Project Phase 5 (CMIP5) models for the precipitation based on the model error correlation for the upstream Yangtze River region.
Water 08 00576 g003
Figure 4. The geographic distribution of the Soil Moisture Anomaly Percentage Index (SMAPI) values from 29 June 2011 to 1 November 2011.
Water 08 00576 g004
Figure 5. Projected changes in mean seasonal temperature by the 2030s relative to the baseline period.
Water 08 00576 g005
Figure 6. Projected changes in mean seasonal precipitation by the 2030s relative to the baseline period.
Water 08 00576 g006
Figure 7. The geographic distribution of projected changes in drought duration by the 2030s relative to the baseline period.
Water 08 00576 g007
Figure 8. The geographic distribution of projected changes in drought intensity by the 2030s relative to the baseline period.
Water 08 00576 g008
Table 1. Description of calibration catchment characteristics and results of calibration.
StationRiverDrainage Area (km2)LongitudeLatitudePeriod (Year)Re (%)R2D R2M
ShiguJinsha River232,65199°56′26°54′1980–2000−6.00.840.89
DaofuYalong River14,465101°04′31°02′1998–2007−2.00.820.87
ZhenjiangguanMintuo River4486103°44′32°18′1980–2000−13.00.730.79
BeibeiJialing River156,142106°25′29°51′1994–200021.70.790.90
BazhongQu River2732106°44′31°53′1980–19938.00.600.83
MaobaQu River1428107°45′31°37′1980–2000−16.20.730.89
DonglinQu River6462107°41′31°17′1980–2000−9.00.630.86
ChishuiYangtze River16,622105°41′28°35′1997–2008−6.00.640.82
YichangYangtze River1,005,501111°17′30°42′1980–2000−6.10.940.97
Table 2. Soil moisture classifications based on the SMAPI (Soil Moisture Anomaly Percentage Index).
CategorySMAPIAverage Frequency
extreme drought≤−50%0.005
severe drought−50% to −30%0.020
moderate drought−30% to −15%0.100
mild drought−15% to −5%0.200
near normal−5% to 5%0.350
slightly wet5% to 15%0.200
moderately wet15% to 30%0.100
very wet30% to 50%0.020
extremely wet>50%0.005
Table 3. Description of 47 global circulation models from the CMIP5 models used in this study.
NumberOrganizationClimate ModelResolution
A1Commonwealth Scientific and Industrial Research Organization (CSIRO) and Bureau of Meteorology (BOM), AustraliaACCESS1.0192 × 145
A2ACCESS1.3192 × 145
B1Beijing Climate Center, China Meteorological Administration, ChinaBCC-CSM1.1128 × 64
B2BCC-CSM1.1(m)320 × 160
CCollege of Global Change and Earth System Science, Beijing Normal University, ChinaBNU-ESM128 × 64
D1Canadian Centre for Climate Modelling and Analysis, CanadaCanESM2128 × 64
D2CanCM4128 × 64
ENational Center for Atmospheric Research, USACCSM4288 × 192
F1Community Earth System Model Contributors, USACESM1(BGC)288 × 192
F2CESM1(CAM5)288 × 192
F3CESM1(FASTCHEM)288 × 192
F4CESM1(WACCM)144 × 96
G1Centro Euro-Mediterraneo per I Cambiamenti Climatici, ItalyCMCC-CESM96 × 48
G2CMCC-CM480 × 240
G3CMCC-CMS192 × 96
HCentre National de Recherches Météorologiques/Centre Européen de Recherche et Formation Avancée en Calcul Scientifique, FranceCNRM-CM5256 × 128
ICommonwealth Scientific and Industrial Research Organization in collaboration with Queensland Climate Change Centre of Excellence, AustraliaCSIRO-Mk3.6.0192 × 96
JEC-EARTH consortiumEC-EARTH320 × 160
KLASG, Institute of Atmospheric Physics, Chinese Academy of Sciences and CESS, Tsinghua University, ChinaFGOALS-g2128 × 60
LLASG, Institute of Atmospheric Physics, Chinese Academy of Sciences, China FGOALS-s2128 × 108
MThe First Institute of Oceanography, SOA, ChinaFIO-ESM128 × 64
N1NOAA Geophysical Fluid Dynamics Laboratory, USAGFDL-CM2p1144 × 90
N2GFDL-CM3144 × 90
N3GFDL-ESM2G144 × 90
N4GFDL-ESM2M144 × 90
O1NASA Goddard Institute for Space Studies, USAGISS-E2-H144 × 90
O2GISS-E2-H-CC144 × 90
O3GISS-E2-R144 × 90
O4GISS-E2-R-CC144 × 90
PNational Institute of Meteorological Research/Korea Meteorological Administration, South KoreaHadGEM2-AO192 × 145
Q1Met Office Hadley Centre (additional HadGEM2-ES realizations contributed by Instituto Nacional de Pesquisas Espaciais), UKHadCM396 × 73
Q2HadGEM2-CC192 × 145
Q3HadGEM2-ES192 × 145
RInstitute for Numerical Mathematics, RussiaINM-CM4180 × 120
S1Institut Pierre-Simon Laplace, FranceIPSL-CM5A-LR96 × 96
S2IPSL-CM5A-MR144 × 143
S3IPSL-CM5B-LR96 × 96
T1Japan Agency for Marine-Earth Science and Technology, Atmosphere and Ocean Research Institute (The University of Tokyo), and National Institute for Environmental Studies, JapanMIROC-ESM128 × 64
T2MIROC-ESM-CHEM128 × 64
U1Atmosphere and Ocean Research Institute (The University of Tokyo), National Institute for Environmental Studies, and Japan Agency for Marine-Earth Science and Technology, JapanMIROC4h640 × 320
U2MIROC5256 × 128
V1Max-Planck-Institut für Meteorologie (Max Planck Institute for Meteorology), GermanyMPI-ESM-MR192 × 96
V2MPI-ESM-LR192 × 96
V3MPI-ESM-P192 × 96
WMeteorological Research Institute, JapanMRI-CGCM3320 × 160
X1Norwegian Climate Centre, NorwayNorESM1-M144 × 96
X2NorESM1-ME144 × 96
Table 4. The list of the total regional drought events in the upstream Yangtze River region identified by the SMAPI-based procedure during the period 1953 to 2013, with the top three most severe drought events. The regional drought events are sorted according to their severity. The beginning and ending dates (T1/T2) of a drought event are given, as well as the duration (D), and the drought areal extent (A).
RegionsTotal Drought EventsFirst RankingSecond RankingThird Ranking
T1/T2D (d)A (%)T1/T2D (d)A (%)T1/T2D (d)A (%)
I1209/07/199414159.111/08/198412366.229/04/19669765.0
21/11/199411/12/198403/08/1966
II1907/12/200926454.628/10/201217150.217/02/196914567.3
27/06/201016/04/201311/07/1969
III919/08/199710555.606/03/196910166.608/08/20118655.1
01/12/199714/06/196901/11/2011
IV1820/07/199716170.130/05/200612467.208/08/195710963.6
27/12/199730/09/200624/11/1957
V2116/08/200929068.001/08/200312871.527/10/198812064.3
01/06/201006/12/200323/02/1989
VI2005/07/200110765.829/06/20119569.109/08/19979570.0
19/10/200101/10/201111/11/1997
Areal1204/03/196912451.323/07/199711350.601/09/200911142.3
05/07/196912/11/199720/12/2009
Table 5. Projected changes (°C) in mean annual and seasonal temperature by the 2030s relative to the baseline period.
Emission ScenarioClimate ModelAnnualSpringSummerAutumnWinter
RCP2.6BCC-CSM1.1(m)1.31.31.41.41.1
GISS-E2-R1.01.10.91.10.9
HadGEM2-ES2.01.81.92.12.2
IPSL-CM5A-LR1.61.31.51.91.8
MPI-ESM-MR1.31.11.31.21.5
RCP4.5BCC-CSM1.1(m)1.61.91.71.51.3
GISS-E2-R1.21.21.21.11.4
HadGEM2-ES1.81.61.72.02.0
IPSL-CM5A-LR1.71.31.72.01.9
MPI-ESM-MR1.51.31.51.61.6
RCP8.5BCC-CSM1.1(m)1.61.91.61.61.4
GISS-E2-R1.61.41.41.61.8
HadGEM2-ES2.01.92.02.21.9
IPSL-CM5A-LR2.22.11.92.42.5
MPI-ESM-MR1.71.71.51.71.9
Table 6. Projected changes (%) in mean annual and seasonal precipitation by the 2030s relative to the baseline period.
Emission ScenarioClimate ModelAnnualSpringSummerAutumnWinter
RCP2.6BCC-CSM1.1(m)0.87.52.1−7.03.1
GISS-E2-R−0.91.2−1.0−3.14.2
HadGEM2-ES2.93.13.22.03.5
IPSL-CM5A-LR3.44.80.08.36.1
MPI-ESM-MR0.12.30.7−2.63.4
RCP4.5BCC-CSM1.1(m)−1.31.7−3.92.4−6.7
GISS-E2-R−0.34.7−2.10.11.8
HadGEM2-ES0.12.4−0.1−1.83.8
IPSL-CM5A-LR3.58.2−0.56.313.0
MPI-ESM-MR1.212.4−0.4−3.03.4
RCP8.5BCC-CSM1.1(m)0.61.22.0−1.5−2.3
GISS-E2-R0.35.3−0.1−3.55.3
HadGEM2-ES−0.22.4−0.3−1.90.7
IPSL-CM5A-LR2.94.61.24.13.5
MPI-ESM-MR2.96.04.7−2.61.4
Table 7. Projected changes in total drought events by the 2030s relative to the baseline period.
Emission ScenarioRegionsBCC-CSM1.1(m)GISS-E2-RHadGEM2-ESIPSL-CM5A-LRMPI-ESM-MR
RCP2.6I726−39
II−101179
III973−22
IV512681
V27115
VI49253
Areal5119107
RCP4.5I6−16−56
II049010
III75715
IV95450
V597−15
VI55453
Areal99769
RCP8.5I726−24
II441497
III76343
IV454121
V5116112
VI108392
Areal89596
Table 8. Projected changes (d) in drought duration by the 2030s relative to the baseline period.
Emission ScenarioRegionsBCC-CSM1.1(m)GISS-E2-RHadGEM2-ESIPSL-CM5A-LRMPI-ESM-MR
RCP2.6I11−1−25−726
II50−1114−2
III19223939−14
IV430−5−16−18
V4724−53418
VI3512−13413
Areal58169173
RCP4.5I21−3−28−1730
II33101032−5
III22422115
IV13−15262
V4027557
VI2333-12-98
Areal2026122015
RCP8.5I22−23−321628
II21113420
III41722234
IV187−242
V3328121021
VI52015417
Areal1323146314
Table 9. Projected changes (%) in drought area by the 2030s relative to the baseline period.
Emission ScenarioRegionsBCC-CSM1.1(m)GISS-E2-RHadGEM2-ESIPSL-CM5A-LRMPI-ESM-MR
RCP2.6I1.6−3.23.02.614.1
II4.812.85.6−3.7−6.1
III−7.24.131.2−11.317.6
IV−15.3−3.5−11.0−0.41.4
V8.5−2.11.02.3−3.6
VI7.55.48.32.02.9
Areal0.8−11.13.2−4.43.9
RCP4.5I−0.62.13.55.318.8
II2.911.18.9−5.0−4.9
III7.45.722.5−15.110.3
IV−4.0−3.6−9.310.51.6
V6.50.711.89.07.4
VI1.43.4−0.90.57.8
Areal4.2−10.7−0.4−9.09.2
RCP8.5I2.4−10.33.11.318.3
II1.17.02.9−2.2−6.6
III3.16.732.4−10.417.0
IV−7.72.0−10.55.70.0
V1.7−9.221.07.14.0
VI1.10.633.29.24.3
Areal3.6−10.0−9.7−4.47.1
Table 10. Projected changes (%) in drought intensity by the 2030s relative to the baseline period.
Emission ScenarioRegionsBCC-CSM1.1(m)GISS-E2-RHadGEM2-ESIPSL-CM5A-LRMPI-ESM-MR
RCP2.6I12.3−3.9−3.015.49.3
II8.7−1.517.2−8.3−1.2
III2.9−0.813.112.3−4.0
IV−8.57.7−3.73.15.5
V4.34.6−8.118.710.4
VI2.510.643.09.81.4
Areal1.60.411.20.9−1.2
RCP4.5I26.24.9−0.2−2.18.5
II2.115.39.5−8.70.1
III17.21.26.27.26.5
IV4.38.4−5.322.520.8
V14.16.5−5.721.526.1
VI8.68.344.615.520.0
Areal9.76.112.50.62.3
RCP8.5I13.7−4.2−2.210.210.7
II−3.70.412.4-6.6−0.8
III7.5−4.64.72.4−6.1
IV3.115.3−1.02.1−3.8
V−1.1−7.24.015.67.9
VI−2.08.043.19.911.3
Areal1.23.05.00.7−3.9

