Article

Performance and N2O Formation of the Deammonification Process by Suspended Sludge and Biofilm Systems—A Pilot-Scale Study

1
Chair of Urban Water Systems Engineering, Technical University of Munich, Am Coulombwall 3, 85748 Garching, Germany
2
Abwasserverband Kempten (Allgäu), Griesösch 1, 87493 Lauben, Germany
*
Author to whom correspondence should be addressed.
Water 2016, 8(12), 578; https://doi.org/10.3390/w8120578
Submission received: 8 July 2016 / Revised: 24 November 2016 / Accepted: 29 November 2016 / Published: 6 December 2016

Abstract

:
A two-stage deammonification pilot plant with two different second-stage reactors, namely a sequencing batch reactor (SBR) with suspended sludge and a moving bed biofilm reactor (MBBR) with biofilm carriers, was investigated over a 1.5-year period to compare reactor performances. Additionally, dissolved nitrous oxide (N2O) was measured to determine the reactors’ N2O formation potential. Although the nitritation performance was moderate (NO2-N/NH4-N effluent ratio of 0.32 ± 0.15 in combination with SBR and 0.25 ± 0.14 with MBBR), nitrogen turnover and degradation rates exceeding 500 g N/(m3∙day) and 80%, respectively, were achieved in both second stages, yet requiring additional aeration. The SBR’s average nitrogen removal was 19% higher than the MBBR’s; however, the SBR’s nitrite influent concentration was comparably elevated. Concerning N2O formation, the nitritation reactor exhibited the lowest N2O concentrations, while the buffer tank, interconnecting the first and second stages, exhibited the highest N2O concentrations of all reactors. Given these high concentrations, a transfer of N2O into the second stage was observed, where anoxic phases enabled N2O reduction. Frequent biomass removal and a decreased hydraulic retention time in the buffer tank would likely minimize N2O formation. For the second stage, enabling anoxic periods in the intermittent aeration cycles right after feeding to support N2O reduction and thus minimize the stripping effects or the implementation of a complete anoxic ammonium oxidation will mitigate N2O emissions.

1. Introduction

One of the key objectives of the biological nutrient removal processes is to remove nitrogen from wastewater effluents in order to achieve load reductions for receiving water bodies. Increasingly strict legal requirements for effluent threshold concentrations are one reason that many wastewater treatment plants (WWTP) must increase their nitrogen removal capacity. A possible method of decreasing the nitrogen load during conventional mainstream biological wastewater treatment is to establish an additional side-stream treatment step for ammonium-rich process water from onsite anaerobically digested sludge treatment. During this deammonification process, ammonium is partly oxidized to nitrite by ammonium-oxidizing bacteria (AOBs). This nitritation step is followed by anoxic ammonium oxidation (anammox), in which autotrophic anoxic ammonium-oxidizing bacteria (AnAOBs) convert ammonium and nitrite to gaseous nitrogen [1]. Therefore, the deammonification process can be considered an energy- and resource-saving strategy in comparison to conventional nitrification/denitrification because the oxygen supply is decreased and no additional carbon source is needed [2]. Here, we adopt the term anoxic instead of anaerobic ammonium oxidation/oxidizing bacteria following the new standardized nomenclature for biological nitrogen removal processes proposed by Weißbach et al. [3].
A crucial requirement to establish a stable deammonification process is to provide conditions that favor both partial nitritation and anammox. These two subprocesses can be implemented in either single- or two-stage systems using, for instance, suspended sludge, granules, or biofilm carriers [4]. However, a two-stage deammonification is advantageous over the single-stage process in terms of operational stability because the strategies for the suppression of undesired side processes can be implemented more easily in independent reactors [4]. As AnAOBs and nitrite-oxidizing bacteria (NOBs) compete for the substrate nitrite, the suppression of NOBs is desired to prevent further oxidation to nitrate after partial nitritation. Favorable conditions for AOBs versus NOBs were reported for frequently alternating aerobic and anoxic conditions, causing a lag phase for NOBs [5], and low dissolved oxygen (DO) concentrations due to the lower oxygen affinity constant of AOBs relative to NOBs [6]. Additionally, an appropriate sludge retention time (SRT) of 1.0–1.5 days [7] and elevated temperatures (≥30 °C) [8] were reported to favor the wash-out of NOBs. Both NOBs and AOBs are inhibited by free ammonia (NH3), which positively correlates with an increasing pH value and ammonium concentrations. NOBs are already inhibited by low NH3 concentrations, whereas AOBs endure higher NH3 concentrations [9]. Unlike nitritation, the anammox process requires strictly anoxic conditions; however, AnAOBs are reversibly inhibited by oxygen [10,11]. Although nitrite serves as a substrate for AnAOBs, it can also have inhibitory effects. A large range of 5 mg NO2-N/L up to 750 mg NO2-N/L has been reported to decrease the anammox activity [12,13]. Even though the second stage of the two-stage deammonification process is commonly fed with high nitrite concentrations, the anammox process is feasible anyway because the influent is diluted by the reactor content generating lower nitrite concentrations. Additionally, AnAOBs tend to grow in aggregates, thus the inner layers are more protected from potential inhibitors due to diffusive limitation [14].
On the downside, biological nitrogen removal processes have been reported to emit N2O, albeit over a wide range of concentrations. Kampschreur et al. reported 0%–95% of the nitrogen load being emitted as N2O in laboratory-scale studies and 0%–15% in full-scale studies [15]. The Intergovernmental Panel on Climate Change (IPCC) estimated the N2O emissions from WWTPs to account for about 2.8% of the total estimated anthropogenic N2O emissions [16]. At the United Nations Conference on Climate Change in Paris in December 2015, the participating parties agreed on a common goal of limiting the temperature increase to 1.5 °C above pre-industrial levels by equalizing the anthropogenic emissions and sinks in the second half of the 21st century [17]. However, no explicit limit for nitrous oxide emissions was set during the Paris summit, even though it is presently the most heavily emitted ozone-depleting substance in the world and is expected to remain so for the remainder of this century [18]. N2O causes stratospheric ozone depletion and has a global warming potential that is 298 times higher than that of carbon dioxide based on a 100-year time horizon [16]; thus, nitrous oxide severely affects the climate. Therefore, a minimization of N2O emissions is necessary to mitigate its negative effects on the environment. Numerous N2O production pathways have been identified, two of which occur during nitritation due to the oxidation of hydroxylamine and reduction of nitrite to N2O in the so-called nitrifier denitrification performed by AOBs [15]. Furthermore, N2O is an obligatory intermediate of the catabolic respiratory pathway of heterotrophic denitrification [19]. Although process water contains little readily degradable organic matter, denitrifiers are still abundant in deammonifying systems and can therefore also contribute to N2O production or reduction [20]. Due to non-stringent nomenclature for biological nitrogen removal processes, the new terms “aerobic nitrous denitritation” instead of nitrifier denitrification and “anoxic nitrous denitritation” for the reduction of nitrite to N2O during denitrification were recently proposed [3]. Nevertheless, the established terms are going to be applied throughout this manuscript due to their deep-rooted connections to these described processes. In contrast to AOBs, no production of N2O is attributed to the metabolic pathway of AnAOBs [21]. The main factors influencing N2O production have been identified as low DO concentrations (mainly due to nitrifier denitrification but also due to inhibition of nitrous oxide reductase during denitrification), high nitrite concentrations, and highly dynamic process conditions, such as ammonia shock loads [15]. Other important factors include toxic compounds, low temperatures, and high salinity, among others [15]. The N2O produced during wastewater treatment is not necessarily emitted into the atmosphere; it can also be further reduced to gaseous nitrogen during denitrification if a carbon source is available. Generally, N2O emissions are enhanced by stripping during phases of active aeration, while emissions during non-aerated phases are limited due to the high solubility of N2O (having a Henry’s law constant Hcp of 1.8 × 10⁻⁴ to 2.5 × 10⁻⁴ mol/(m3∙Pa) at 298.15 K) [22]. A more accurate assessment of the emitted N2O is possible on the basis of gaseous measurements. The detection of dissolved N2O by online sensors can be helpful for identifying conditions favorable for the production and reduction of N2O to develop mitigation strategies.
This study was designed to evaluate and compare two two-stage deammonification processes at pilot-scale at the Kempten WWTP (Germany), employing a suspended sludge as well as a biofilm system in the second stage. In order to derive recommendations for a stable and optimized full-scale process, the performance across the entire deammonification plant was assessed during the period from February to December 2014 using suspended sludge in the second stage (excluding 2.5 months beginning in August 2014 due to whey tests, leading to a total of 308 days) and from January to June 2015 for the system employing biofilm carriers (in total 148 days). An additional objective of this study was to quantify the N2O formation potentials of the reactors and develop mitigation strategies based on these results. To achieve this goal, the pilot-scale plant was investigated from July to August 2015 to determine reactor-specific dissolved N2O concentrations using an online sensor (in total 29 days).

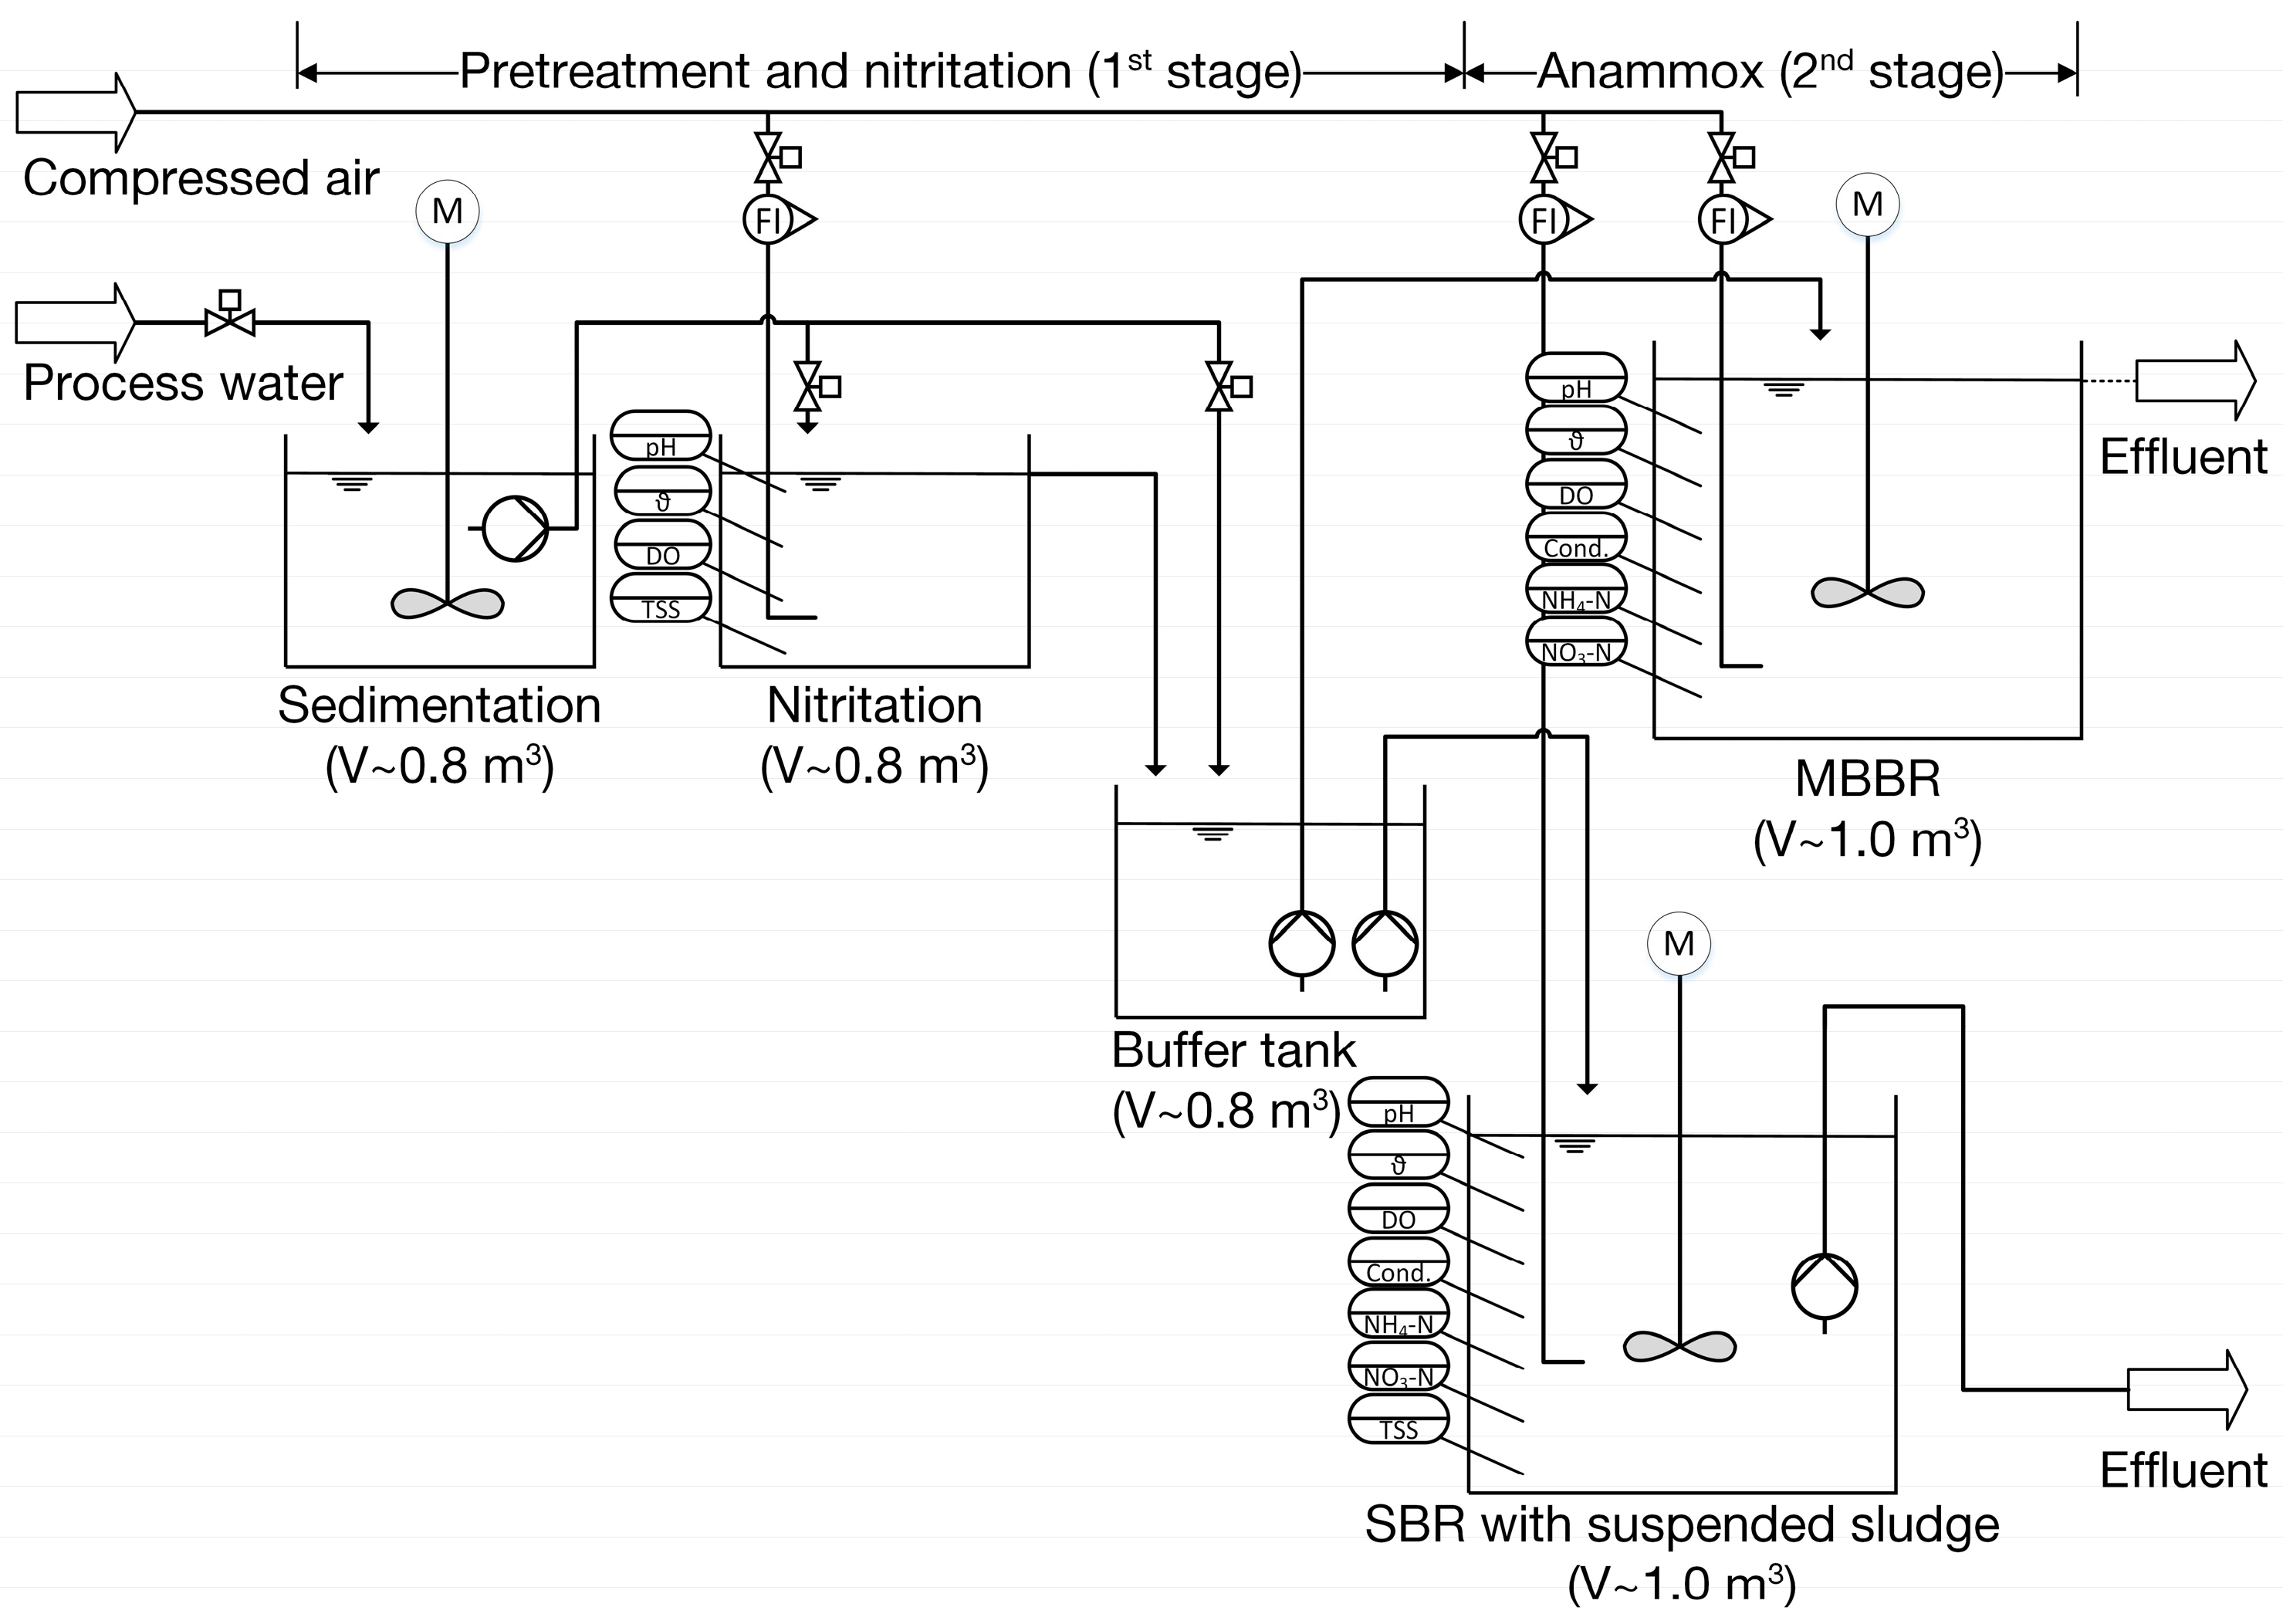
2. Materials and Methods

The wastewater treatment plant in Kempten was put into operation in 1986 with a capacity of 250,000 population equivalents (PE). With an increasing influent load, the WWTP was expanded several times, after which a two-stage deammonification process was implemented as a side-stream treatment of process water. This deammonification process further increased the WWTP’s capacity to 465,000 PE and the full-scale process was put into operation in November 2015.
Prior to full-scale implementation, a pilot-scale facility with a volumetric dimension of 0.1% of the full-scale plant was built and put into operation at the end of 2013. The pilot plant was implemented for two reasons. Firstly, WWTP operators were keen in obtaining knowledge regarding the stable operation of the deammonification process with respect to the specific process water of the WWTP, which is strongly influenced by the local dairy industry providing wastewater high in ammonium and calcium carbonate concentrations. Secondly, WWTP operators wanted to determine whether a suspended sludge or biofilm system process configuration was more favorable for full-scale implementation. Therefore, the pilot plant employed a split into two second stages, one reactor equipped with suspended sludge and the other one equipped with biofilm carriers. Both second stages were initially inoculated with concentrated sludge from a full-scale single-stage deammonification plant at the WWTP Ingolstadt, Germany. A high abundance of AOBs as well as AnAOBs has been detected for these biofilm carriers in our previous study [23], providing evidence for deammonification being the main underlying process. Due to the identical inoculation as well as a comparable startup and operation regime for both second stages, results from this predominant nitrogen removal process are also applicable to the reactor with suspended sludge.
The pilot plant consisted of five reactors in total: one for sedimentation, one for nitritation, an intermediate buffer tank, and two reactors for the anammox process in the second stage (Figure 1). The anammox reactor with suspended sludge was employed as a sequencing batch reactor (SBR), whereas a moving bed biofilm reactor (MBBR) utilized biofilm carriers. Therefore, in the following we refer to these reactors as SBR and MBBR depending on the process configuration of the second stage. An impression of the plant and the reactor with suspended sludge and fixed biofilm is provided in the Supplementary Materials (Figure S1). All reactors except for the sedimentation tank were thermally insulated to minimize temperature losses.
The sedimentation, nitritation, and buffer tank pre-treatment was the same for both SBR and MBBR. As previous studies have demonstrated that shock loads of total suspended solids (TSS) can negatively influence deammonification performance [4], process water was pre-treated in a 0.8 m3 sedimentation tank. In this way, the transfer of elevated concentrations of solids into the subsequent biological system was significantly decreased. The subsequent 0.8 m3 nitritation tank was continuously fed. The effluent was withdrawn by an overflow pipe installed at the water surface without biomass retention. The nitritation tank was initially inoculated with mixed liquor from a trickling filter previously used for nitrification treatment of the process water. To promote the activity of AOBs, the reactor temperature was maintained at approximately 31 °C with a heat exchanger. Various aeration systems (Oxyflex®-OM and Oxyflex®F650, SUPRATEC Gesellschaft für Umwelt-und Verfahrenstechnik mbH, Simmern, Germany; MESSNER Aeration Panel®, RMU Rudolf Messner Umwelttechnik AG, Adelsdorf, Germany) were tested in the nitritation tank because process water high in calcium carbonate led to rapid clogging of the aeration membranes due to calcification (Figure S2). Beginning in October 2014, the aeration systems were occasionally flushed with acetic and formic acid to counteract calcification and improve their lifetime. The aeration could be manually adjusted using a flow meter but was maintained at 2000 L/h. The reactor was equipped with a vertical stirrer and online sensors for dissolved oxygen, temperature, pH, and turbidity (Hach Lange GmbH, Düsseldorf, Germany). However, the pH and dissolved oxygen concentrations were not used for evaluation of the process, as the results were non-representative due to a calcium layer constantly present on the sensors interfering with the measurements. The effluent of the nitritation tank was diverted and stored in a 0.8 m3 buffer tank before entering either the SBR or MBBR, both of which had a working volume of 1.0 m3. The buffer tank with a hydraulic retention time (HRT) of approximately one day was insulated, but not heated, aerated, or stirred. As this tank only served as a buffer interconnecting the nitritation and the two second stages, it was not equipped with any online sensors. Nevertheless, it was assumed that the wastewater characteristics did not change severely in this reactor in comparison to the nitritation effluent.
The SBR utilizing suspended sludge was fed intermittently (2.4 ± 0.5 h) and was time-controlled to establish aerated/unstirred and unaerated/stirred phases, with the aeration phases comprising 44%–78% of the total reaction time during the observation period in 2014 and varying cycle durations of 7.5 ± 1.1 h in total including feeding, reaction, and decant phase. Generally, an aeration of the second-stage anammox process is uncommon. However, due to a rather low performance of the nitritation step, the WWTP operator decided to implement an aeration option in this original anammox reactor to enable an additional single-stage deammonification side-process as a countermeasure and thus, to improve the overall process performance. The reactor was equipped with a vertical mixer and online sensors for ammonium, nitrate, pH, temperature, conductivity, oxygen, turbidity, and filling level (Hach Lange GmbH, Düsseldorf, Germany). Additionally, the stainless-steel tank was temperature-controlled. After a settling step (~0.5 h), the effluent was removed via a submersible pump at the medium height of the filling level.
The MBBR was also fed intermittently with 40%–78% of the entire time being intermittently aerated during the observation period in 2015, which was very similar to the SBR. Again, the supplementary aeration in second stage was implemented to compensate for the rather low performance of the nitritation step. The effluent was released by an overflow without a settling phase, creating a constant volume of 961 L. This reactor was equipped with a vertical mixer, the same heating system as used for the SBR, and online sensors for ammonium, nitrate, pH, temperature, conductivity, and dissolved oxygen. The MBBR utilized uncolonized AnoxKaldnes™ K2 carriers (Veolia Water Technologies AB—AnoxKaldnes, Lund, Sweden) at the startup of the reactor with a filling ratio of 40% of the total volume. One-third of the carriers were initially distributed over a trickling filter treating process water with recirculation to accelerate biofilm growth by fast-growing AOBs, providing a biofilm basis for the subsequent attachment of AnAOBs. Subsequently, these carriers were combined with the rest of the carriers in the MBBR. During the startup phase, the nitrite concentration was kept at 20–30 mg/L to supply AnAOBs with sufficient nitrite and prevent substrate limitation. A thin biofilm layer could be observed after approximately three to four months and grew over time.
The deammonification system was operated via a FlowChief process control system (FlowChief GmbH, Fürth, Germany) combined with a PLC Simatic S7 Modular Controller (Siemens GmbH, Munich, Germany). Therefore, the data were automatically recorded and available for analysis. The dissolved concentrations of ammonium, nitrite, and nitrate were additionally analyzed using photochemical testing kits (Hach Lange GmbH, Düsseldorf, Germany). TSS was analyzed according to standard methods [24]. For the online measurement of dissolved N2O, an additional Clark-type sensor (Unisense Environment A/S, Aarhus, Denmark) was installed in the bulk phase of the various reactors.

3. Results and Discussion

3.1. Reactor Performance

The performance results of the two two-stage deammonification systems operated with suspended sludge as SBR and as a MBBR with biofilm carriers in the second stage are summarized in Table 1.
While these two studies with the SBR and MBBR in the second stage were conducted sequentially, the ammonium concentration of the process water remained almost constant in 2014 and 2015 and is depicted in Figures S3 and S4 in the Supplementary Materials.

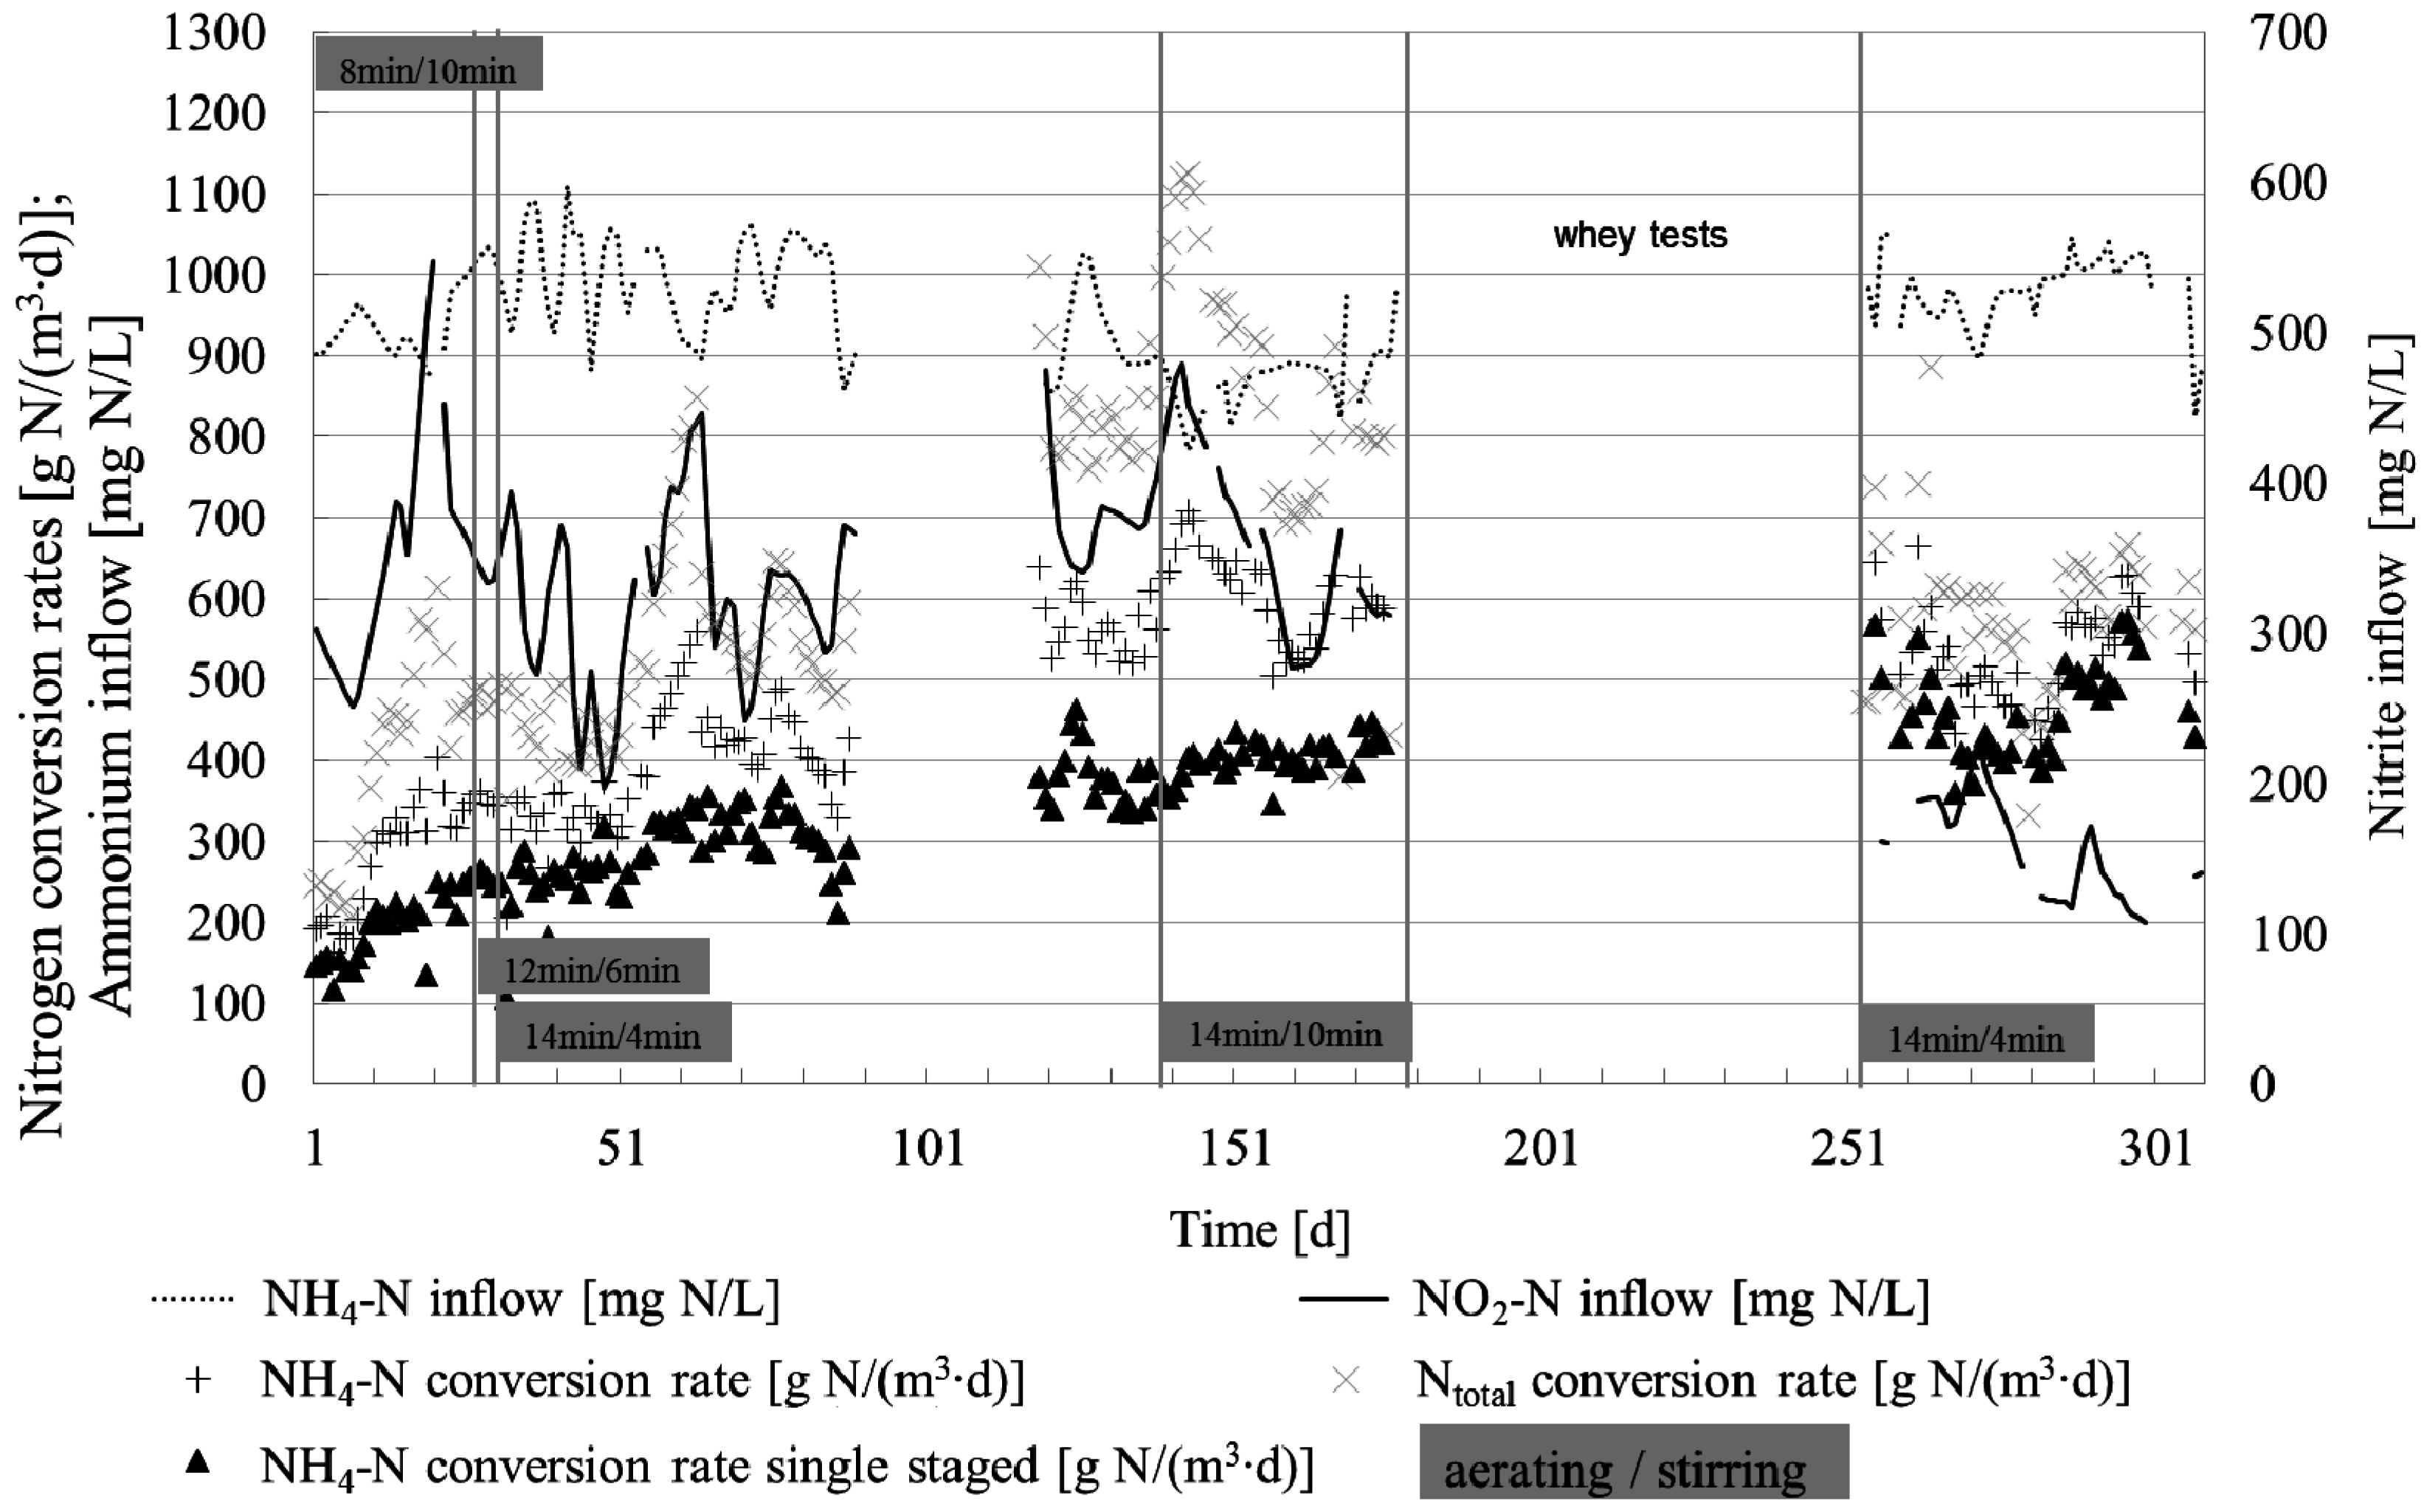
3.1.1. Performance of Nitritation Reactor

As the first step of the deammonification process, nitritation provides the substrate of nitrite and ammonium necessary for the anoxic ammonium oxidation in the second stage [1]. Although the average temperature for the nitritation in 2014 was lower than that in 2015, a higher NO2-N/NH4-N ratio and ammonium degradation were achieved in 2014. Specifically, the effluent of the nitritation reactor was composed of 955 ± 91 mg NH4-N/L and 291 ± 117 mg NO2-N/L in 2014 and 1028 ± 107 mg NH4-N/L and 242 ± 112 mg NO2-N/L in 2015. These results reveal that the performance of the partial nitritation was moderate and well below other nitritation processes reported with a NO2-N/NH4-N ratio up to one [4]. The development of the nitrogen concentrations over the study period is displayed in Figures S3 and S4 in the Supplementary Materials. The hydraulic retention time (HRT) remained stable at approximately 1.3 days and thus could not be held responsible for the enhanced conversion of ammonium to nitrite in 2014 even though prolonging the HRT has been shown to positively influence nitritation [25]. Although a positive correlation between TSS and nitrite concentrations would have been expected, this impact could not be conclusively clarified due to missing TSS values for 2015. However, the different aeration systems installed in the nitritation reactor might have had an influence on the NO2-N/NH4-N ratio. The installation of new aeration systems increased the performance of nitritation immediately after installation (Figures S3 and S4); however, the turnover rates decreased over time. This change could be due to calcification of the aeration membranes, which resulted in larger air bubbles and thereby decreased the oxygen transfer into the water. Recurrent acidification of the membranes could mitigate this effect and improve their lifespan. Although the oxygen transfer coefficients of all aeration systems given by the manufacturers were in a comparable range of ~25 g O2/(mn3∙mdepth), the higher values observed in practice and a triple replacement of the aeration systems in 2014 most likely positively influenced the nitritation, leading to higher nitrite effluent concentrations than in 2015. The nitrate effluent concentration was low for both systems over the entire study period (77 ± 30 mg NO3-N/L in 2014 and 60 ± 27 mg NO3-N/L in 2015), suggesting adequate conditions for the suppression of NOBs. However, this also indicates that the aeration intensity and the HRT should be prolonged to potentially improve the nitritation performance.
Although nitritation cannot remove nitrogen, positive values for the conversion rate of total nitrogen (Ntotal) could be observed, and these values were higher in 2014 than in 2015. Additionally, the nitritation effluent had a higher NO2-N/NH4-N ratio than the second-stage influent. These findings might generally be explained by the production and emission of N2O and ammonia gas due to a shift of ammonium ion to ammonia gas with increasing pH. However, this correlation could not be conclusively proved because of the lack of measurements of these gases and inadequate pH measurements. Nonetheless, the formation of N2O in solution could be verified using an online sensor.

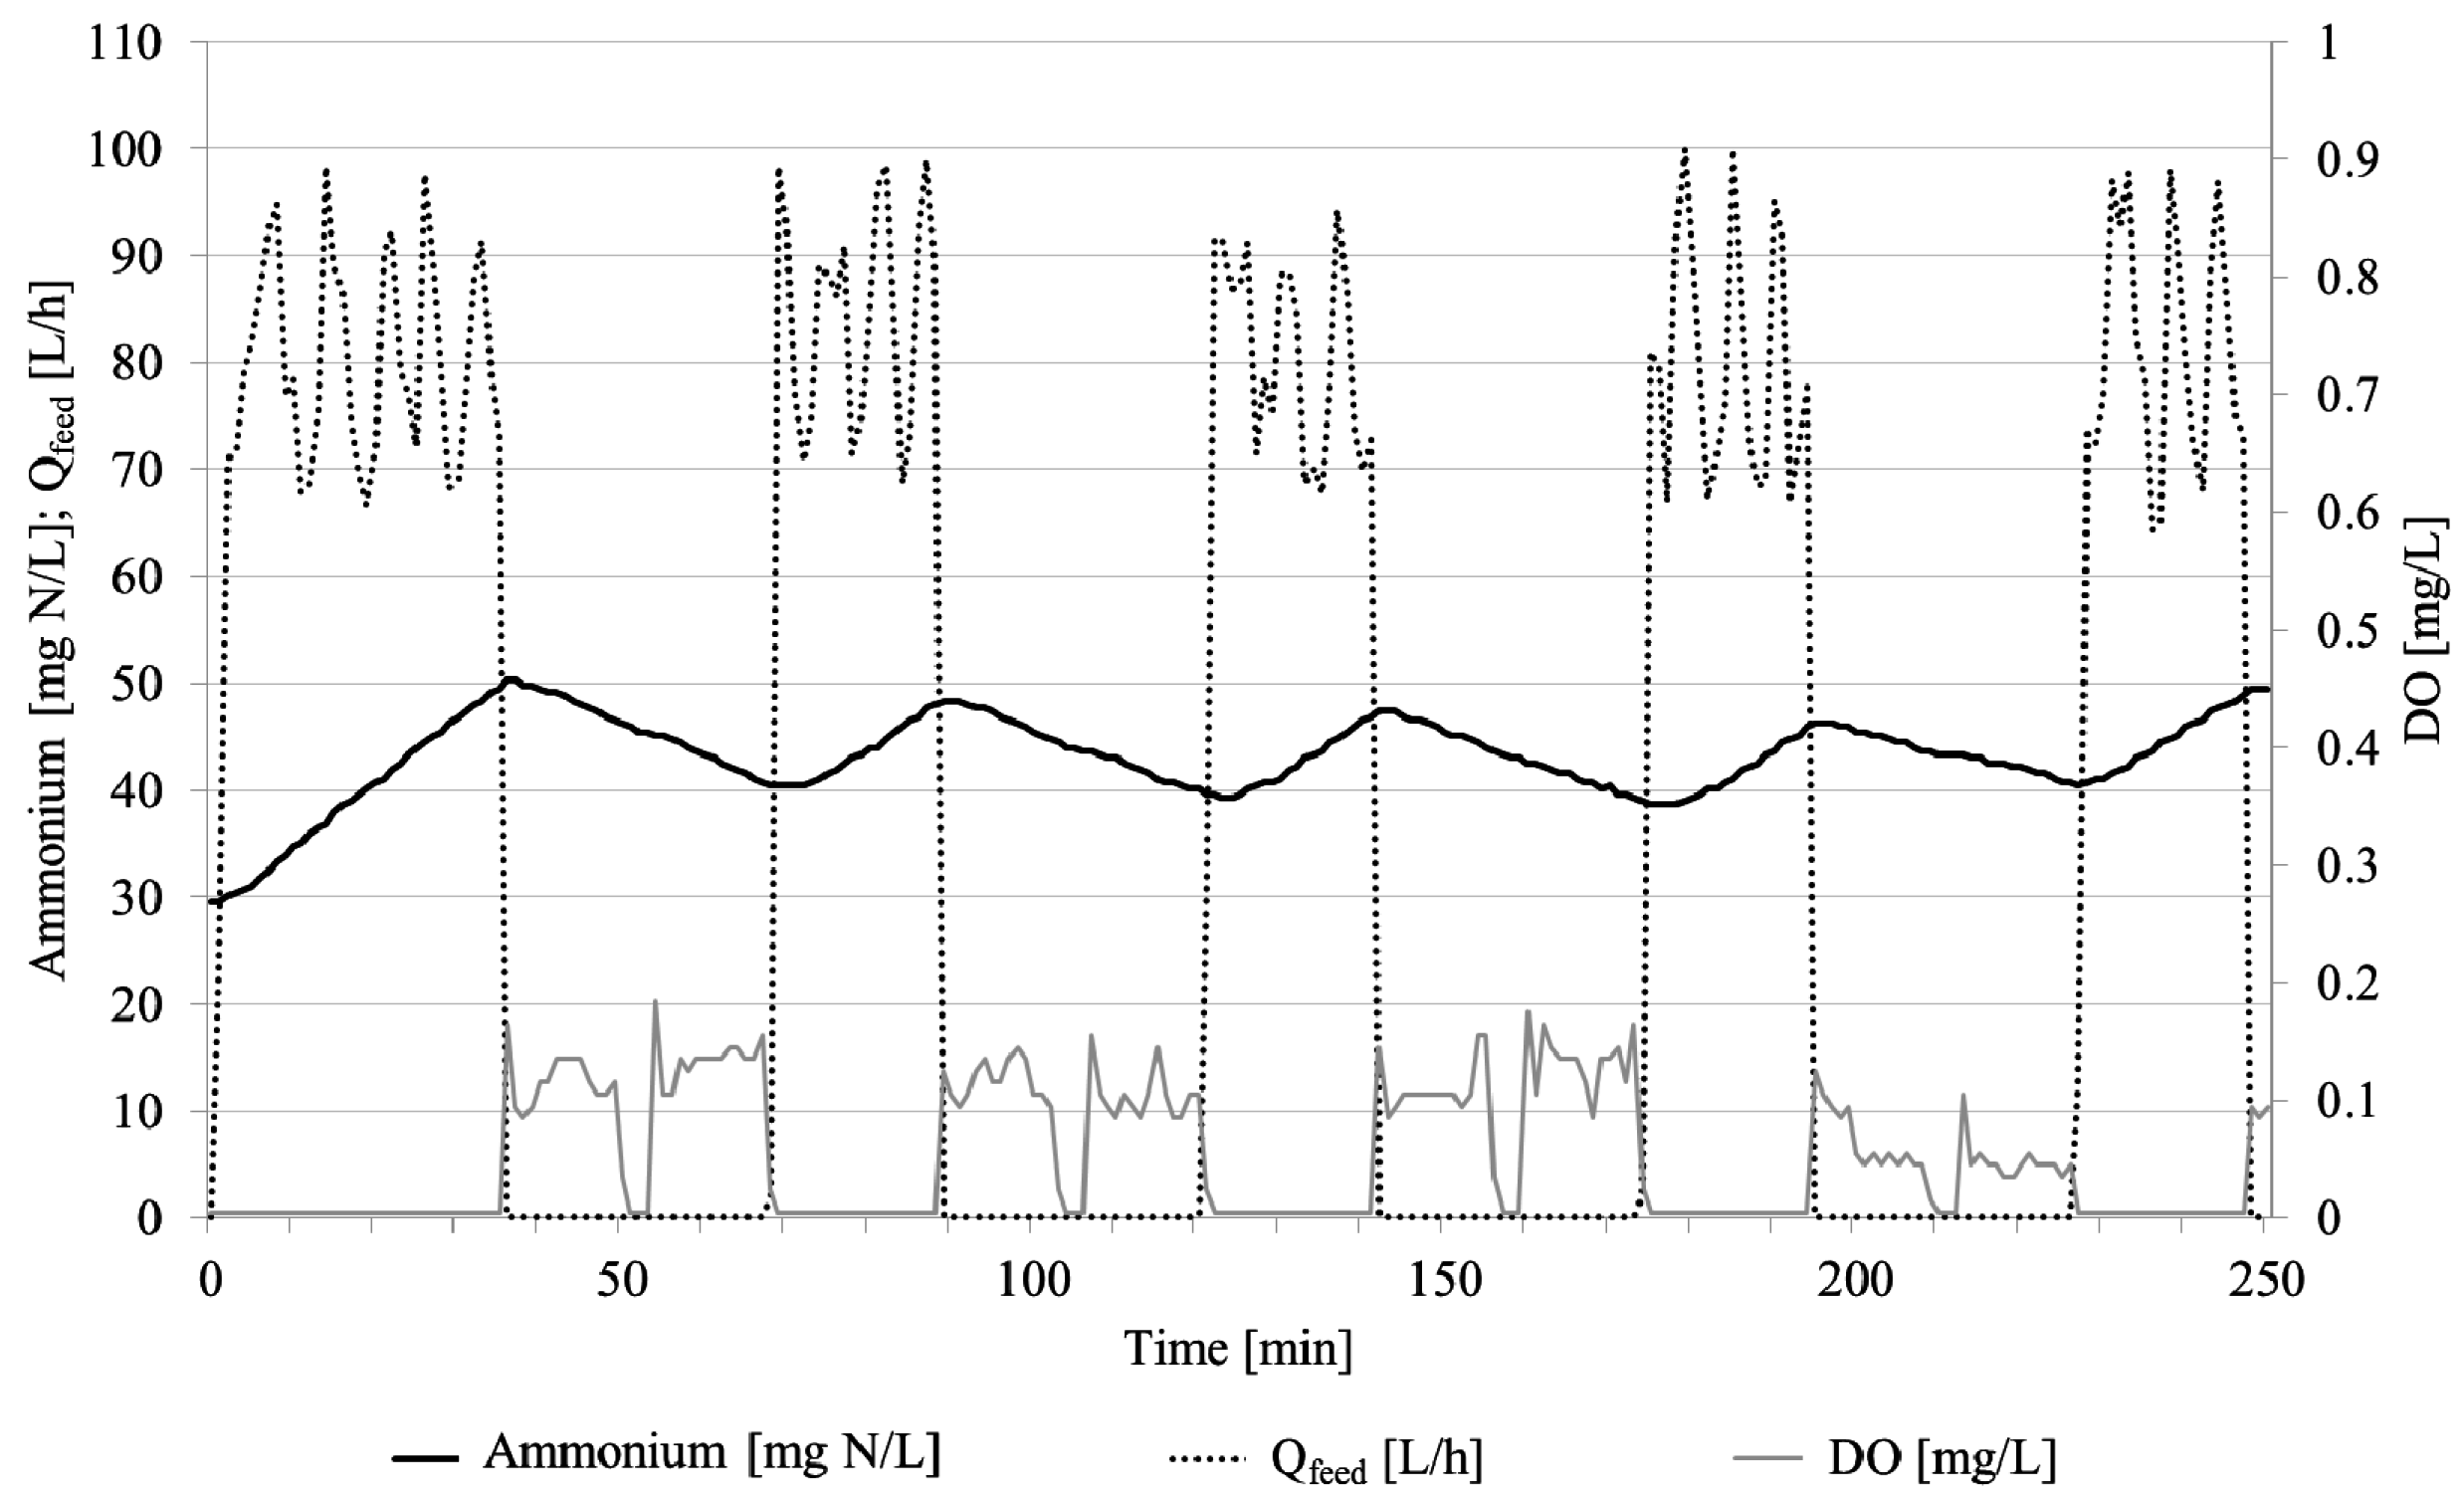
3.1.2. SBR Performance

For the second stage, a total nitrogen conversion rate of 16 mg N/(L∙h) or 384 g N/(m3∙day) was set as a minimum by the WWTP operator. Both the suspended sludge and the biofilm carrier systems could fulfill this requirement on average. The SBR almost constantly exceeded this value after a short startup phase (Figure 2). Additionally, a positive correlation between the development of the nitrogen conversion rate and the nitrite influent concentration is apparent. However, as per the reaction stoichiometry, 1 mol of ammonium and 1.32 mol of nitrite are necessary for a complete anammox process [1]. This condition was not fulfilled using a NO2-N/NH4-N influent ratio of 0.32 ± 0.11, but the average nitrogen degradation was still 90.1% ± 2.6%. With the aeration phases being longer than the non-aerated phases starting after approx. 25 days in the second stage, SBR was assumed to simultaneously perform a partial nitritation during the oxic periods, besides the anammox process. To confirm this hypothesis, the required single-stage ammonium conversion rate performed by the second stage was calculated to achieve total nitrogen conversion after the consumption of inflowing nitrite (Table 1). On average, 74% of the entire ammonium conversion of the SBR and 87% of the MBBR could be accounted for by this process. These results suggest that the second stage partly acted as a single-stage deammonification process with an increasing trend over the study period despite its original function as an anammox reactor without aeration. This is also the reason for the high performance at the end of 2014 despite the fact that the nitrite influent concentrations had been rather low (Figure 2). Beyond these calculations, high AOB and low NOB activities of the suspended sludge with an ex-situ conversion rate of 330 g N/(kg VSS·day) and 72 g N/(kg VSS·day), respectively, could be experimentally proven in controlled lab-scale respiratory batch tests (Table S1).
Additionally, online data suggested an oxidation of ammonium during the aerated phases of SBR operation (Figure 3 and Figure 6). This correlation is depicted by the decline of the ammonium-signal not only during unaerated phases, when the anammox process took place, but also during the aeration. The pH decline in Figure 6 during aeration is likely caused by nitritation. These findings are yet another piece of evidence that the second stage partly acted as a single-stage deammonification reactor.

3.1.3. MBBR Performance

After a startup phase lasting several months to achieve suitable biofilm thickness on the carriers, the MBBR was also able to perform above the demanded conversion threshold of 384 g N/(m3·day) at almost all times in 2015 (Figure 4). Higher nitrite concentrations in the effluent of the MBBR than in the influent were responsible for the higher ammonium conversion rates in comparison to the overall nitrogen degradation in April 2015. This finding implies that the biofilm was likewise able to perform partial nitritation besides the anammox process due to the extensive aeration. Nitrite accumulation indicates insufficient anoxic phases even in the deep layers of the biofilm, as also indicated by the average DO concentration of 1.5 ± 1.3 mg/L in the bulk phase. The ammonium conversion rate was comparable for both the suspended sludge and the biofilm carriers. However, the calculated single-stage ammonium conversion rate for the MBBR exceeded that of the SBR and could therefore moderately compensate for the lower NO2-N/NH4-N inflow ratio. Still, the SBR performed better in terms of overall conversion rate and nitrogen degradation, presumably due to the higher nitrite influent concentration and longer HRT, respectively. Finally, the Kempten WWTP decided to implement a full-scale two-stage deammonification facility with suspended sludge due to its high performance and shorter startup phase of several weeks using inoculum from other deammonification plants in contrast to the time-consuming biofilm formation within a MBBR [26].
Interestingly, AnAOBs seemed to accumulate preferably at locations with a calcified layer. Thus, the high concentrations of calcium carbonate present in process water were hypothesized to be favorable for biofilm formation, possibly serving as a substrate or a primary, rough surface for enhanced biofilm attachment. This biological or physical correlation could not be proven, as it was beyond the scope of this study. However, the artificial calcification of carriers prior to inoculation is hypothesized to accelerate biofilm growth and could be an interesting topic for further research. These assumptions are supported by a previous study that has investigated a positive correlation between calcium concentrations and biofilm thickness and density and therefore, an enhancement of biofilm accumulation [27].

3.1.4. Operational Assessment

The results demonstrate that the observed degradation rates would not have been possible without the uncommon aeration in the second stage causing an additional single-stage deammonification process in this stage that was originally designed as an anammox reactor. Thus, a well-balanced mixture of ammonium and nitrite in a molar ratio as close as possible to 1:1.32 in the nitritation effluent is essential for the implementation of a second stage as a pure anammox process without aeration. Therefore, the dimensions as well as the physical parameters regarding aeration intensity, oxygen transfer coefficients, HRT, temperature, and pH of the nitritation reactor must be properly designed to stimulate the activity of AOBs while suppressing the growth of NOBs. In this way, appropriate conditions within both reactors of the two-stage deammonification process can be guaranteed, enabling the development of two distinct microbial communities in each reactor and permanently preventing the growth of undesired microorganisms. This advantage is not attained when the second stage must partly act as a single-stage deammonification process to achieve high degradation rates for the overall process. Although AnAOBs recover from oxic phases [10,11], a process adjustment with fully anoxic conditions in the second stage of the deammonification process is assumed to favor the anammox process and thus further increase and stabilize the plant performance.
In general, the deammonification process with suspended sludge is advantageous to a biofilm-based system with respect to the duration of the startup phase, as the biofilm growth process is time-consuming if pre-colonized biofilm carriers from an already established system are not available. Moreover, no additional investment for carriers is needed. Apart from that, the operator of the deammonification plant reported a lower workload for the MBBR as a positive aspect. With microorganisms being fixed in the biofilm, wash-out of the bacteria is easily prevented. This is especially crucial for slow-growing AnAOBs [1]. Their predominant clustering in biofilms [23] is advantageous for their stable abundance in the system, while poor settling of the suspended sludge is often the reason for loss of biomass. Additionally, no settling phase is needed for biofilm carriers, elongating the reaction phase in the MBBR. In the case of an unintended transfer of microorganisms from the first stage into the second stage or the growth of undesired microorganisms present as flocs in the suspension, such as NOBs, due to intensive aeration, the fluid matrix could be easily discarded and replaced in MBBRs. This would enable a fast startup of the second stage even after such an incident. As a disadvantage, completely overgrown biofilm carriers exhibit a lower specific surface area, thus decreasing diffusive processes, which can decrease the turnover rates. However, thick biofilm rather provides permanent anoxic conditions for AnAOBs, even during aeration, which is why numerous geometries of biofilm carriers with different specific surface areas are used for various applications [28]. Considering the several advantages and disadvantages of the reactor systems with either utilizing suspended sludge or immobilized biofilms, the optimal decision is generally plant-specific.

3.2. Nitrous Oxide Formation

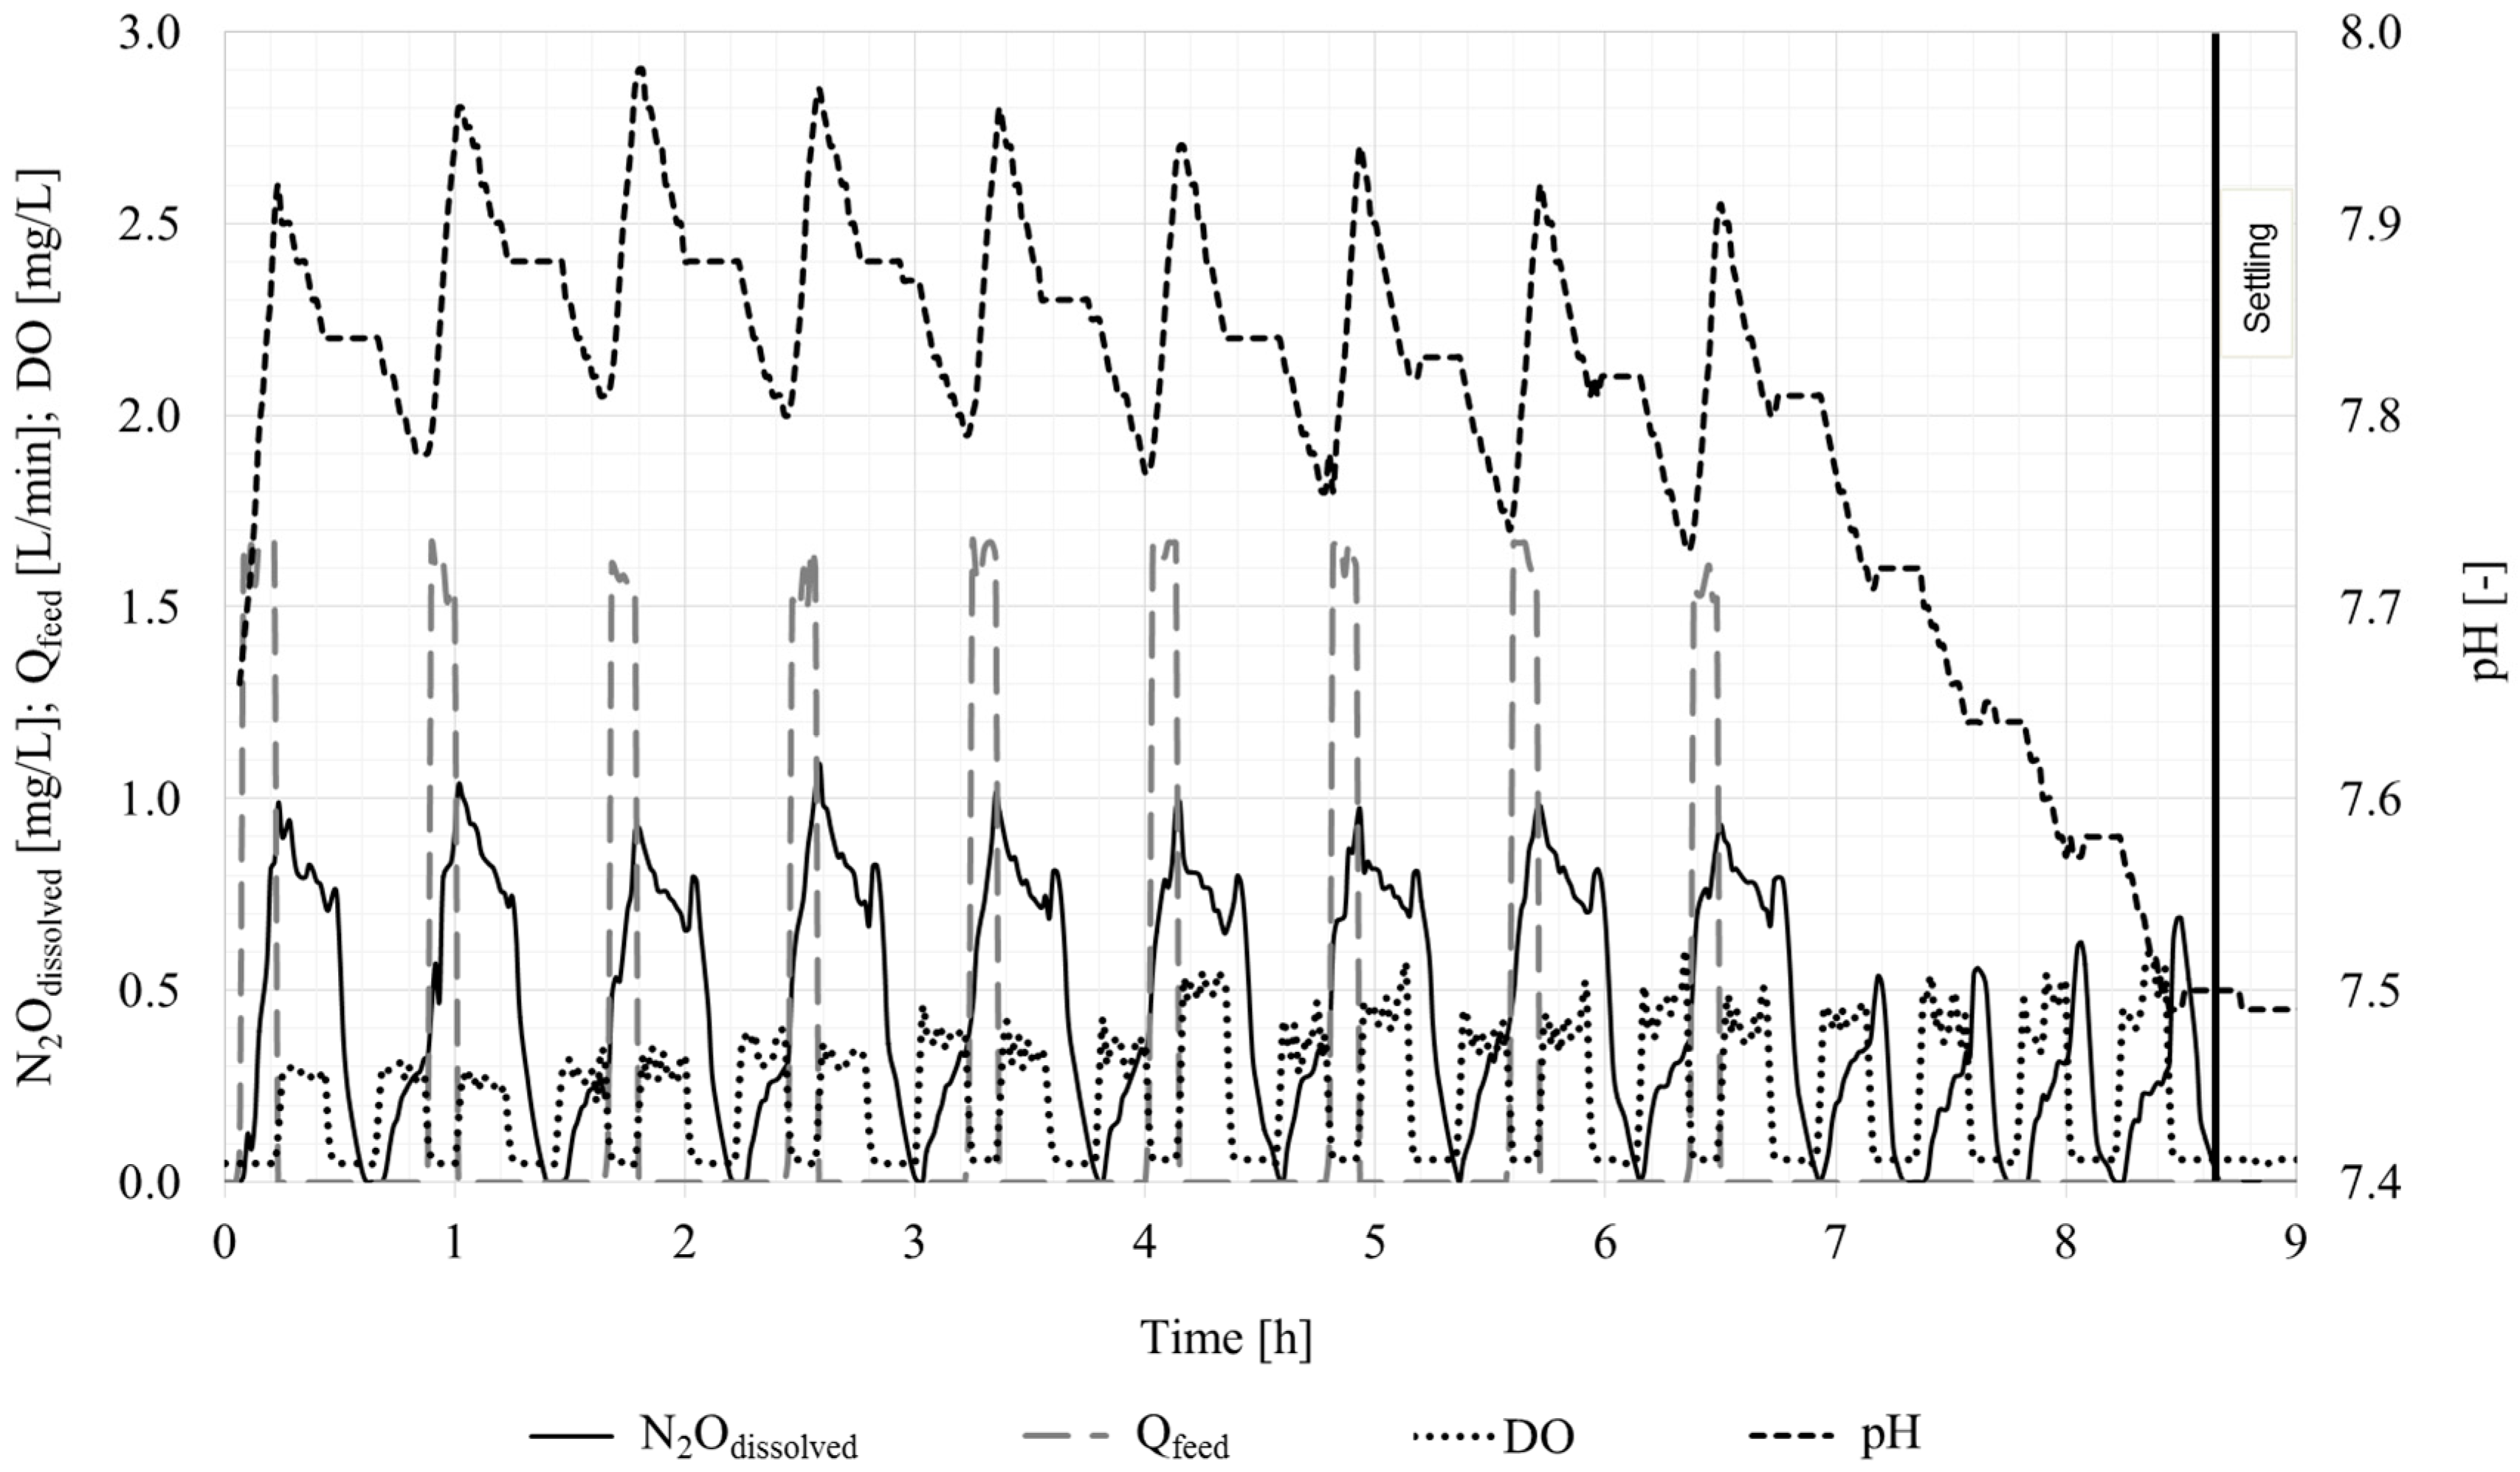
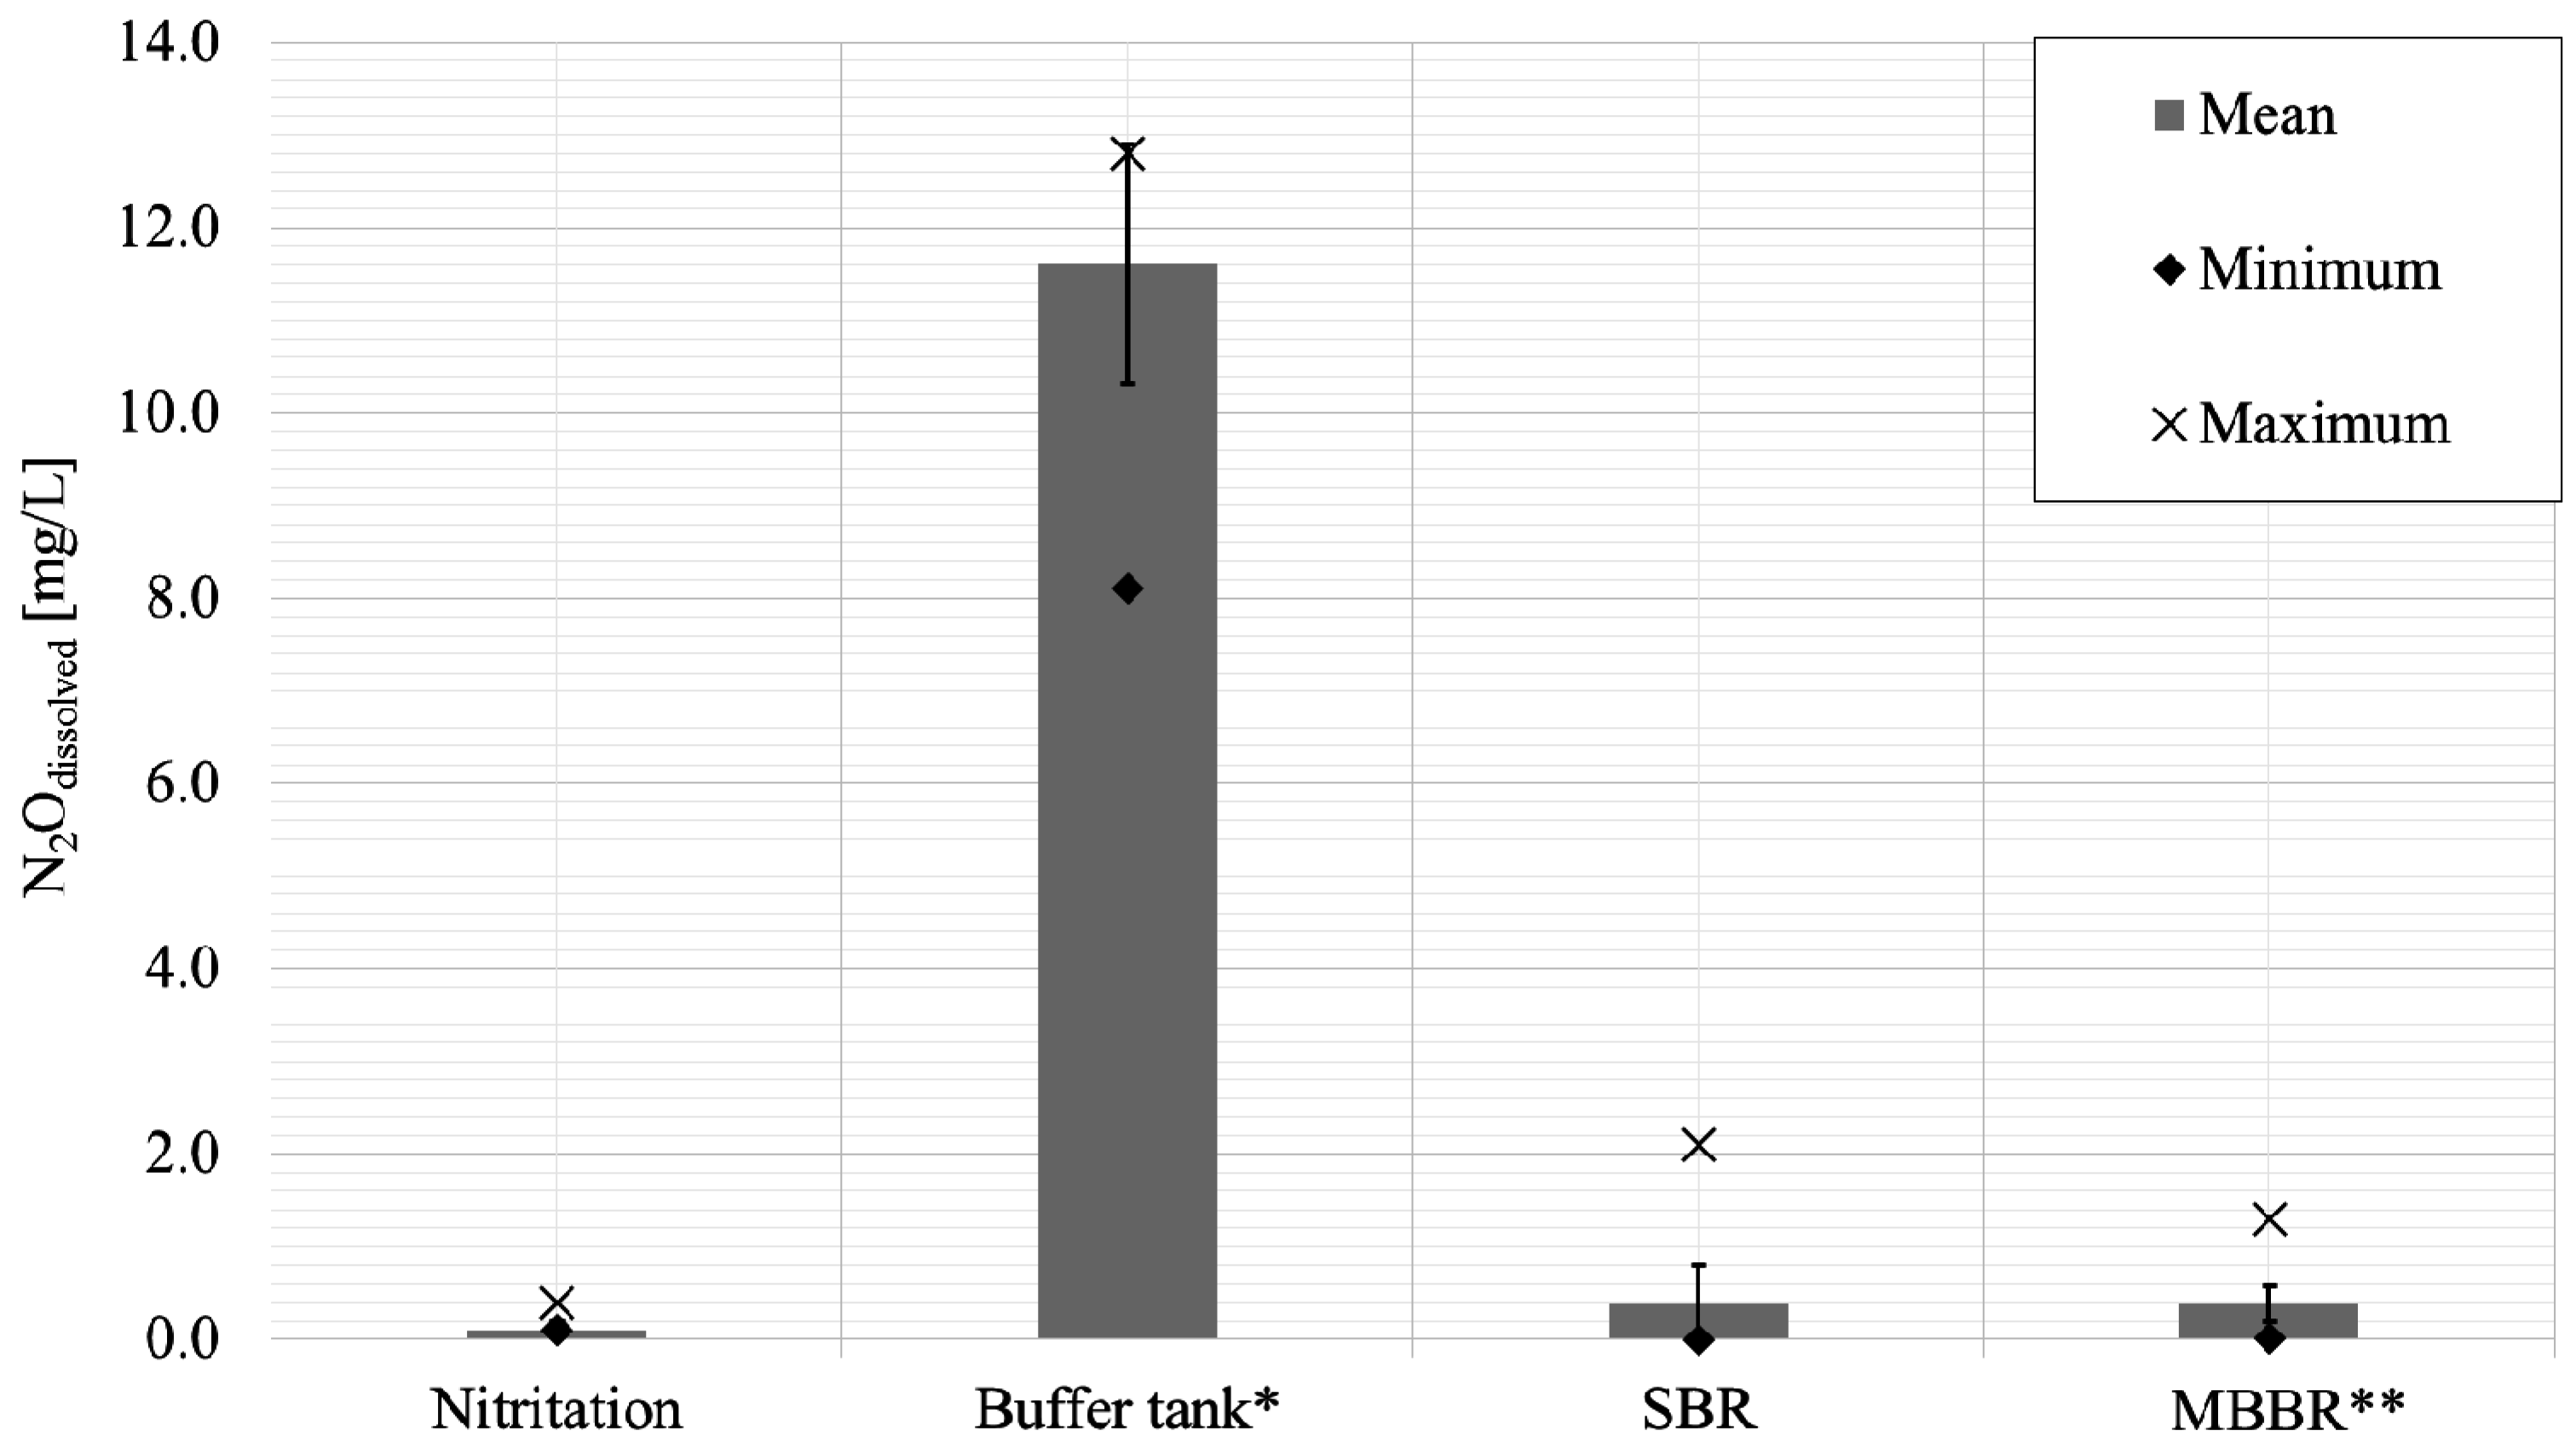
3.2.1. Measurements and Possible Production Pathways

The dissolved N2O concentrations were measured online in the nitritation reactor, buffer tank, SBR, and MBBR to identify their potential for N2O formation related to their specific operational conditions. The results are summarized in Figure 5, and further information regarding the development of the dissolved N2O concentrations in the reactors over the entire monitoring period is provided in Figures S5–S8 in the Supplementary Materials. As the MBBR has been operated as a single-stage deammonification process when the monitoring campaign for dissolved N2O was conducted, the results are hardly directly comparable with the SBR performing as the second stage of the deammonification process. However, results are also discussed and presented in Figure 5 for completeness.
The average dissolved N2O concentration of the nitritation tank (0.1 ± 0.1 mg/L; translates to 0.02% ± 0.01% relative to NH4-Noxidized as the total N2O emission potential in theory; however, this does not necessarily mean that it was emitted entirely) was lower than that of the other two reactors. Although nitrite serving as a substrate for (nitrifier) denitrification was constantly available, continuous aeration at the supplied aeration intensity seemed to produce a DO concentration that was sufficiently high to avoid conditions favorable for significant N2O production. In comparative point measurements with a thoroughly decalcified sensor, the DO concentration reached 3 mg/L, which prohibited transient oxygen conditions that would have favored N2O production via nitrifier denitrification. The measured dissolved N2O concentrations are in good agreement with the observations by Gabarró et al. [29], who reported comparable concentrations during the aerated phases of nitritation; however, they also observed that anoxic phases promoted N2O production. Therefore, continuous aeration is assumed to be advantageous over intermittent aeration during nitritation with respect to the mitigation of N2O production. Nevertheless, aeration results in stripping of N2O, which directly influences the dissolved N2O concentration. Additionally, the measured dissolved N2O concentrations were constantly above the concentrations that would naturally be present when being in equilibrium with the atmospheric N2O concentration. Thus, constant diffusion and stripping of N2O into the atmosphere is expected to occur during this nitritation step, negatively influencing the carbon footprint of the overall plant. However, without simultaneous off-gas measurements, an evaluation regarding the effect of diffusion and stripping leading to N2O emissions and therefore a decrease of the dissolved N2O concentration could not be verified.
The buffer tank exhibited the highest N2O concentrations of all reactors, due to a high N2O formation. However, the mean and maximal values represent an underestimation of the real concentrations, as the detection limit of the sensor (12.8 mg/L) was exceeded many times. The high production rates of N2O in the buffer tank could be identified to be partially associated with nitrifier denitrification by AOBs, as no aeration was supplied to the buffer tank, whereas microorganisms and effluent from the nitritation tank were provided constantly. Transient changes in the DO concentration resulting in anoxic conditions combined with high concentrations of nitrite and ammonium serving as electron acceptor had been previously reported to favor this formation pathway [15]. Additionally, incomplete heterotrophic denitrification is also believed of being a potential source for the production of N2O in the buffer tank due to carbon limiting conditions [15] or electron competition among the reduction steps of denitrification [30]. To the best of our knowledge, the N2O concentrations have never been monitored before in an intermediate buffer tank of a two-stage system; nonetheless, the predominant conditions could be compared to those during the settling phase of a nitritation reactor. During the settling phase, an accumulation of dissolved N2O was observed [29,31], but at a concentration several magnitudes lower as observed in this study. A significantly longer reaction phase for the metabolic N2O production pathway in the buffer tank with an HRT of approximately one day and an infinite SRT was assumed to be responsible for the higher accumulation of N2O.
As the SBR was intermittently fed with the effluent of the buffer tank, a transfer of dissolved N2O into the second stage was observed, leading to average N2O concentrations of 0.4 ± 0.4 mg/L (translates to 0.01% ± 0.01% relative to Nremoved as the theoretical N2O emission potential). This correlation is depicted in detail for one cycle of SBR in Figure 6. With the influent (Qfeed) coming from the buffer tank, the N2O concentration increased to its maximum in the SBR, while the N2O concentrations decreased slightly during the first aeration cycle of every batch interval. This is most probably due to the stripping rate of N2O into the atmosphere exceeding the N2O formation rate. During the stirred, non-aerated phases, a steep decline of N2O concentrations was detectable, which could be attributed to denitrifying bacteria reducing N2O to molecular nitrogen. In comparison to the buffer tank, a higher decay of biomass due to a higher TSS concentration is supposed to have provided an additional, readily degradable carbon source enabling denitrification. In the second aeration per interval, the N2O concentrations increased again in contrast to the first aeration. As AnAOBs are not known to produce N2O [21], this N2O formation is expected to result from the activity of AOBs, which were abundant in the second stage, as indicated by the previous observations of a partial nitritation. This increase in N2O during the second aeration interval of the SBR batch is assumed to be caused by the production rate of N2O due to both nitrifier denitrification activity as well as inhibition of the nitrous oxide reductase of denitrifiers with the transition from anoxic to oxic conditions, being higher than the stripping rate. As this second stage of the deammonification process served not only as a pure anammox reaction but also as nitritation and was additionally fed with dissolved N2O from the buffer tank, these results can hardly be compared to other studies due to the differing conditions. Nevertheless, the observed consumption of N2O during unaerated phases attributed to heterotrophic denitrification is supported by previous investigations [32].
Even though a direct comparison of the SBR operated as the second stage of the deammonification and the MBBR operated as single-stage deammonification regarding the dissolved N2O concentrations is difficult, certain similarities due to the supplementary aeration causing additional single-stage deammonification in the SBR are obvious. Considering the fact that the SBR was fed with high concentrations of dissolved N2O from the buffer tank, it is not surprising that the maximal dissolved N2O concentrations exceeded those of the MBBR, also causing a slightly higher average concentration and standard deviation. In addition, dissolved N2O concentrations exhibited a comparable range, which is why neither the MBBR with biofilm carriers nor the SBR with suspended sludge seemed to have a clear advantage regarding a lower N2O formation.

3.2.2. Mitigation Strategies

Considering the highly deleterious impact of N2O on the environment, establishing efficient strategies to decrease biological N2O formation and potential N2O emissions into the atmosphere are crucial.
The buffer tank had a high N2O formation potential, thus conditions should be adapted in such a way that N2O formation is limited, restricting its diffusion into the atmosphere and transfer into subsequent reactors. Hence, one potential countermeasure is the use of a decreased HRT in the buffer tank to shorten the reaction time for both the proposed nitrifier denitrification and the incomplete heterotrophic denitrification pathway. Additionally, frequent removal of the biomass in the buffer tank is recommended to keep the abundance as low as possible. This could be implemented easily by an inlet and outlet installed close to the surface of the reactor enabling a gentle influent and effluent and therefore, a simultaneous sedimentation and withdrawal of the biomass at the bottom of the tank. Keeping the abundance of biomass as low as possible would be advantageous in various ways: the microbiologically produced dissolved N2O could be decreased in this stage, leading to a lower diffusion into the atmosphere and a mitigated transfer of dissolved N2O into the subsequent stage where it could potentially be emitted, e.g., due to aeration. Thus, this approach would definitely reduce the carbon footprint of the whole deammonification plant. With this removed biomass being further processed in the digester under anaerobic conditions, dissolved N2O would be reduced to ammonium, thus N2O emission from this system is rather unlikely. However, even if N2O were to be emitted, it would be captured in the gastight digester and incinerated together with the produced biogas.
Generally, an incineration of N2O does not only render it to non-hazardous N2, thus being no longer harmful to the environment, but it also increases the energy yield by 37% in comparison to combustion with oxygen [33]. Such an approach could be transferred to any deammonification plant or—in a broader context—to any reactor of biological wastewater treatment plant emitting N2O. Deammonification reactors are often already covered to minimize temperature losses and therefore could be easily modified as gastight reactors. This amendment would enable capturing the total off-gas and its use as a supplement for ambient air when incinerating the biogas. Even though this is an end-of-pipe solution, it would eliminate safely any uncontrolled N2O emission from deammonification processes.
For unaerated reactors, the N2O emission is only driven by diffusion at the liquid–gas interface due to the gradient between the dissolved and gaseous concentrations, which was the case for the buffer tank. However, this advantage does not apply for aerated reactors, such as the nitritation step and the SBR, because the aeration increases the flux of N2O into the atmosphere due to stripping effects. If anoxic phases proved to enable the reduction of dissolved N2O concentrations, which was the case for the SBR, it is recommended to not interrupt these stages by aeration if possible to reduce these stripping effects. Thus, a rearrangement of the aeration strategy of SBR could mitigate N2O emissions. After the intermittent feeding, which increased the dissolved N2O concentration, an initial anoxic mixing phase instead of an initial aeration phase after feeding is highly recommended to enable the reduction of N2O during anoxic phases and thereby decrease the possibility of stripping during subsequent aeration.

4. Conclusions

  • A high nitritation performance in the first stage providing an effluent ratio of as close as 1 mol of ammonium to 1.32 mol of nitrite is crucial for a fully anoxic ammonium oxidation in the second stage and high overall degradation rates. If this ratio cannot be achieved, a prolonged HRT, elevation of the temperature above 30 °C, and increased aeration intensity are suggested to improve the nitritation under the countermeasures necessary to suppress NOB growth.
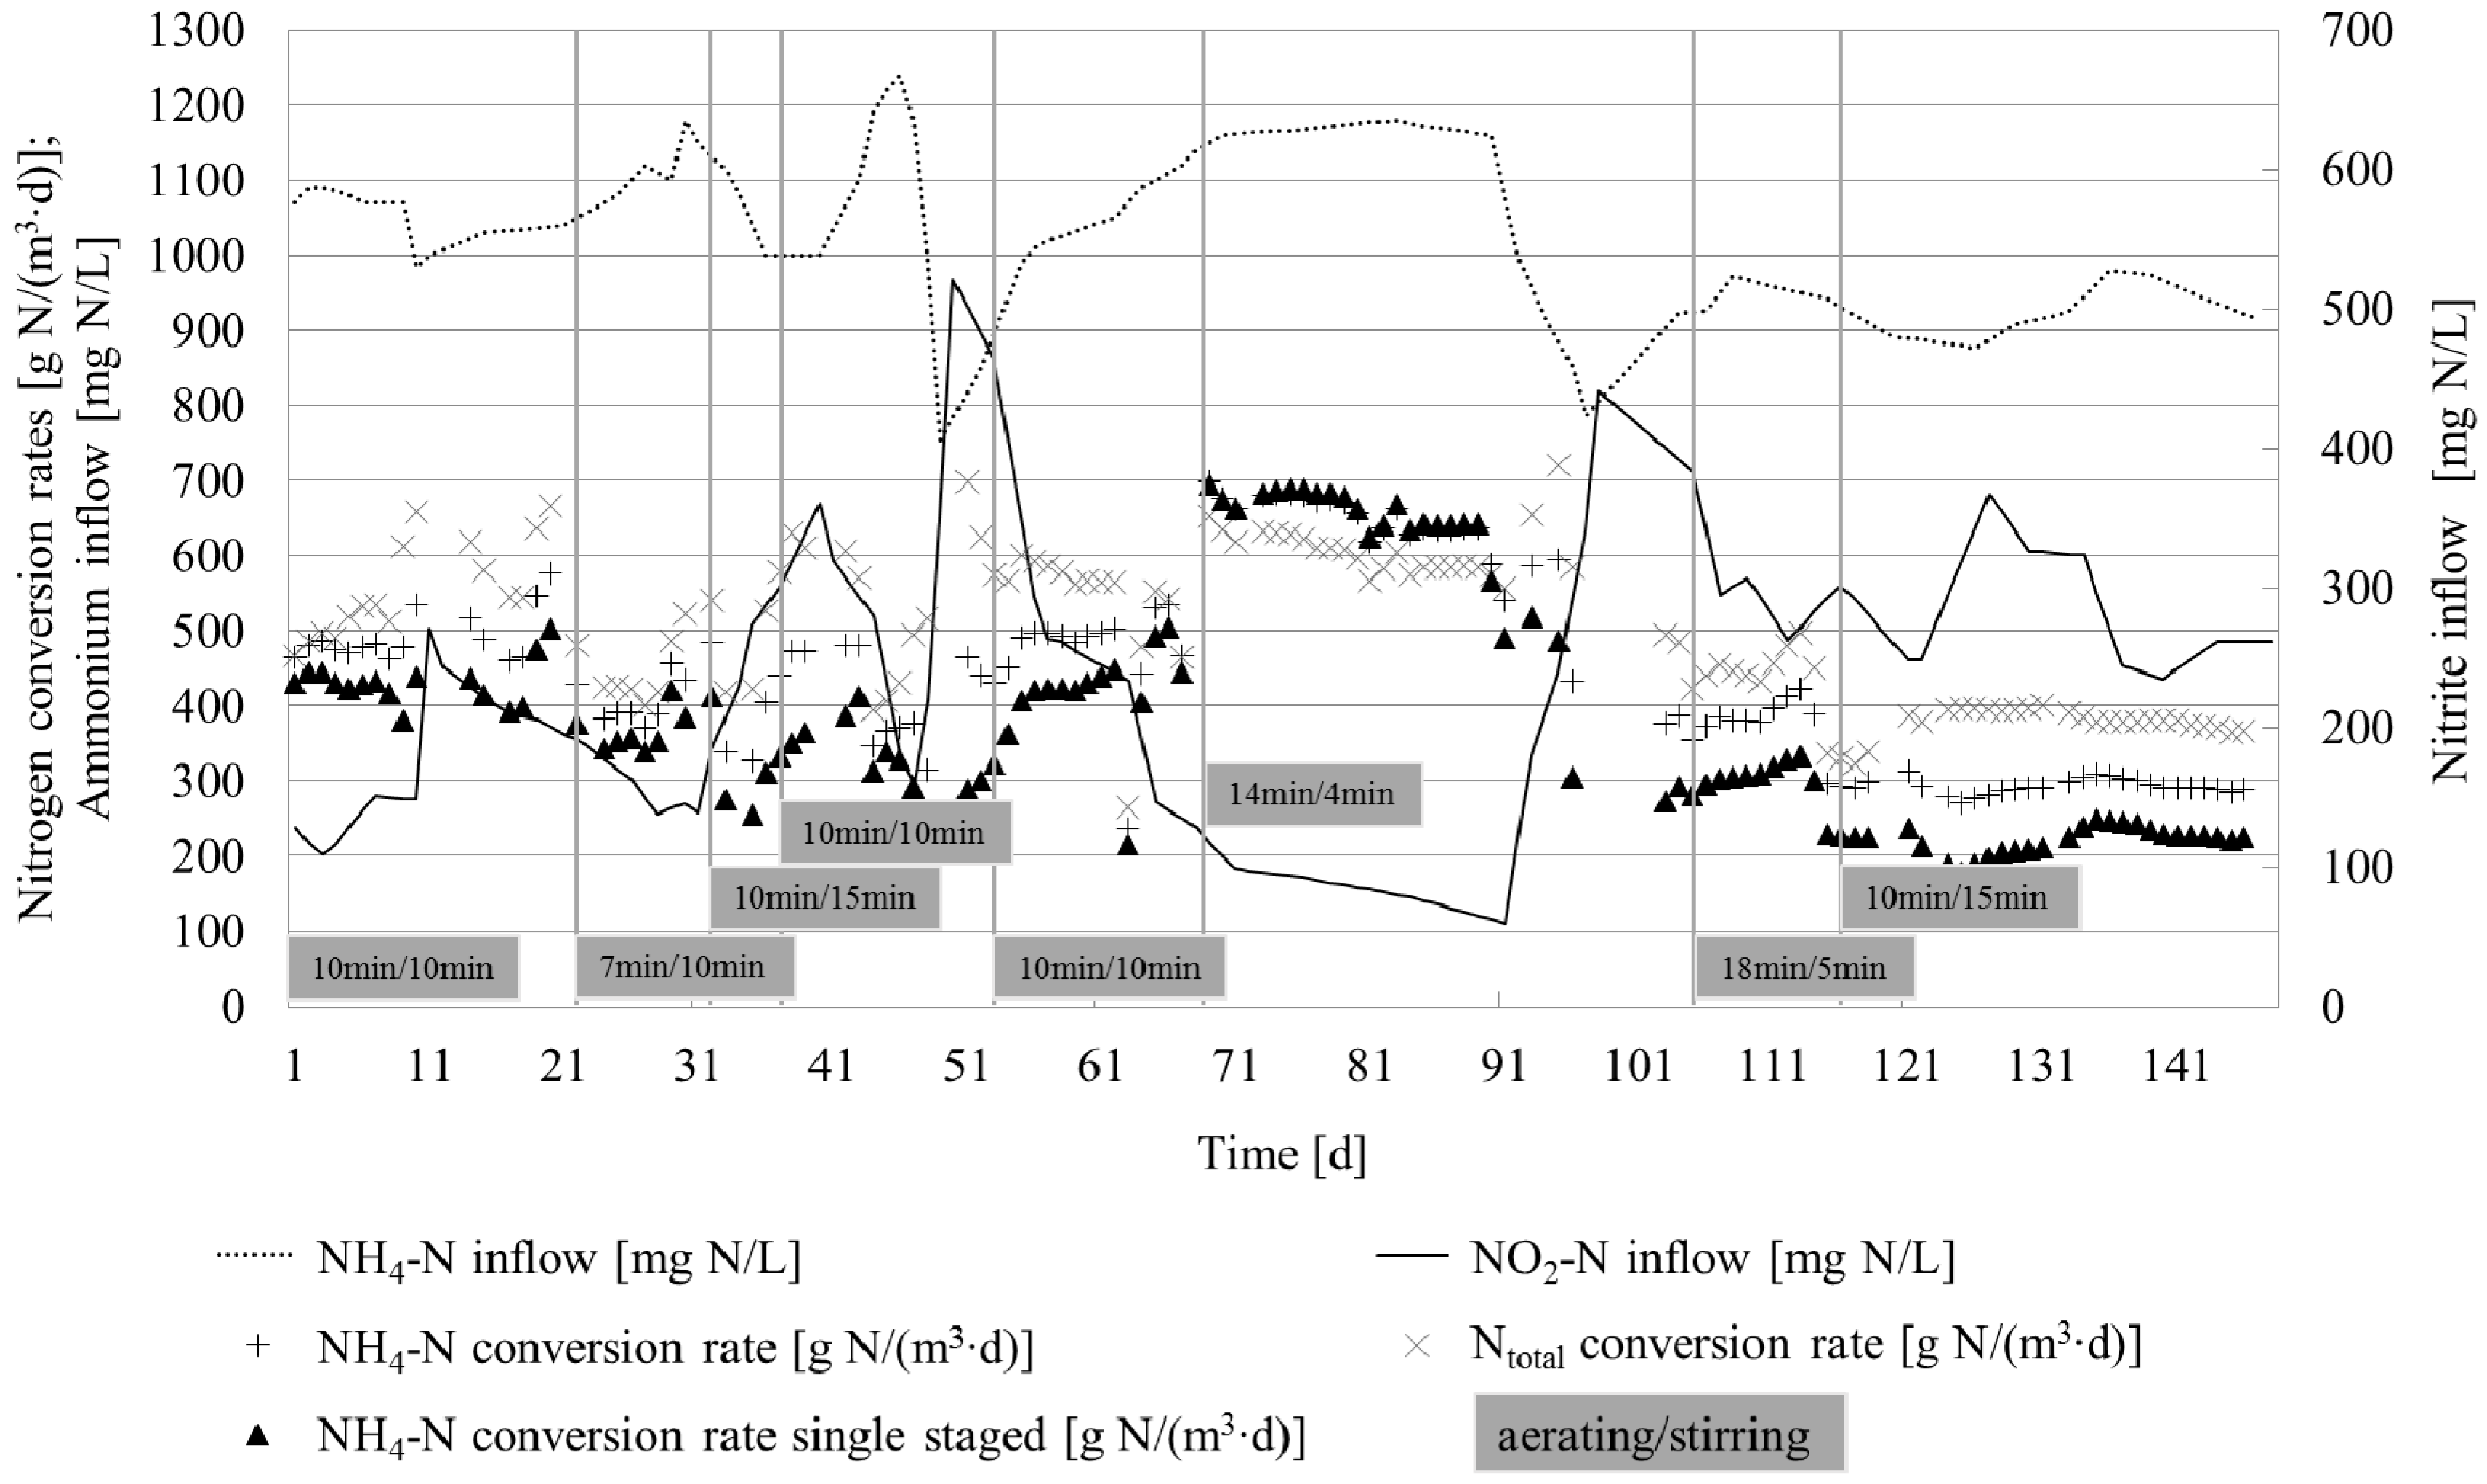
  • Although the nitritation effluent did not meet the required ammonium-to-nitrite ratio during the study periods, both the SBR and MBBR in the second stage were able to achieve nitrogen turnover rates and degradation rates above 500 g N/(m3∙day) and 80%, respectively. This was only possible because both second stages acted partially as single-stage deammonification processes due to supplementary aeration, which is highly uncommon for the second stage of the deammonification process.
  • Comparing MBBR and SBR performances, the latter achieved higher nitrogen removal and degradation, attributed to the higher inflow NO2-N/NH4-N ratio and longer HRT in the SBR, respectively. In contrast, the calculated single-stage ammonium conversion rate of the MBBR was found to be higher, enabling moderate compensation of the smaller nitrite inflow concentrations.
  • The intermediate buffer tank exhibited the highest dissolved N2O concentrations of all reactors. Prevalent anoxic conditions, high nitrite and ammonium concentrations, an HRT of approximately one day, and abundant biomass introduced from the nitritation reactor into the non-mixed and non-aerated buffer tank with an infinite SRT has been identified to provide favourable conditions for N2O production.
  • Nitritation with continuous aeration and the SBR in the second stage had lower dissolved N2O concentrations in comparison to the buffer tank. A transfer of dissolved N2O from the buffer tank into the SBR could be observed. The nitritation step and the SBR contributed to the emission of N2O due to the aeration; however, the specific amount could not be quantified due to missing off-gas measurements.
  • N2O mitigation strategies were identified, including the use of a decreased HRT in the buffer tank to shorten the reaction time for N2O production and frequent removal of settled biomass. In the second stage, stripping effects could be limited by a rearrangement of the aeration phases with anoxic periods after feeding the SBR to allow for a reduction of N2O or implementation of a complete anammox process without aeration.
  • To avoid uncontrolled N2O emissions from deammonification processes, the total off-gas could be collected by use of gastight reactors and then be applied as oxidant during the combustion of biogas, representing an end-of-pipe solution. Even if the proportion of N2O to the total amount of the off-gas would be low, this approach would not only ensure an environmentally friendly solution as the N2O is converted to inert N2 when incinerated, but would also make use of the 37% higher energy yield of the oxidant N2O in comparison to oxygen.

Supplementary Materials

The following are available online at www.mdpi.com/2073-4441/8/12/578/s1, Figure S1: Two-stage deammonification pilot plant in Kempten (Allgäu), Figure S2: Pictures of aeration elements, Figure S3: Performance of nitritation in combination with downstream SBR in 2014, Figure S4: Performance of nitritation in combination with downstream MBBR in 2015, Figure S5: Dissolved nitrous oxide concentration in the nitritation, Figure S6: Dissolved nitrous oxide concentration in the buffer tank, Figure S7: Dissolved nitrous oxide, dissolved oxygen, ammonium, and nitrate concentrations in the SBR, Figure S8: Dissolved nitrous oxide, dissolved oxygen, ammonium, and nitrate concentrations in the MBBR operated as single-stage deammonification process, Table S1: Respiratory AOB and NOB activity tests of SBR.

Acknowledgments

The International Graduate School of Science and Engineering (IGSSE) of TUM is gratefully acknowledged for providing financial support (Project Water 06, PANOWA). This work was supported by the German Research Foundation (DFG) and the Technical University of Munich (TUM) in the framework of the Open Access Publishing Program.

Author Contributions

Carmen Leix and the WWTP Kempten (Allgäu) conceived and designed the experiments. The team of the WWTP Kempten ran the pilot plant including data acquisition and chemical analysis. Carmen Leix and Rebecca Hartl were responsible for the dissolved N2O measurements and analyzed all data. Carmen Leix wrote the paper. Jörg E. Drewes and Konrad Koch supervised this study and reviewed the manuscript. The final version was approved by all authors.

Conflicts of Interest

The authors declare no conflict of interest. The founding sponsors had no role in the design of the study, in the collection, analyses, or interpretation of data, in the writing of the manuscript, and in the decision to publish the results.

References

  1. Strous, M.; Heijnen, J.J.; Kuenen, J.G.; Jetten, M.S.M. The sequencing batch reactor as a powerful tool for the study of slowly growing anaerobic ammonium oxidizing microorganisms. Appl. Microbiol. Biotechnol. 1998, 50, 589–596. [Google Scholar] [CrossRef]
  2. Van Loosdrecht, M.C.M. Innovative nitrogen removal. In Biological Wastewater Treatment: Principles, Modelling and Design; Henze, M., van Loosdrecht, M.C.M., Ekama, G.A., Brdjanovoic, D., Eds.; IWA Publishing: London, UK, 2008; pp. 139–154. [Google Scholar]
  3. Weißbach, M.; Criddle, C.S.; Drewes, J.E.; Koch, K. A proposed nomenclature for biological processes that remove nitrogen. Environ. Sci. Water Res. Technol. 2016. [Google Scholar] [CrossRef]
  4. Lackner, S.; Gilbert, E.M.; Vlaeminck, S.E.; Joss, A.; Horn, H.; van Loosdrecht, M.C.M. Full-scale partial nitritation/anammox experiences—An application survey. Water Res. 2014, 55, 292–303. [Google Scholar] [CrossRef] [PubMed]
  5. Yoo, H.; Ahn, K.-H.; Lee, H.-J.; Lee, K.-H.; Kwak, Y.-J.; Song, K.-G. Nitrogen removal from synthetic wastewater by simultaneous nitrification and denitrification (SND) via nitrite in an intermittently-aerated reactor. Water Res. 1999, 33, 145–154. [Google Scholar] [CrossRef]
  6. Ciudad, G.; Werner, A.; Bornhardt, C.; Muñoz, C.; Antileo, C. Differential kinetics of ammonia- and nitrite-oxidizing bacteria: A simple kinetic study based on oxygen affinity and proton release during nitrification. Process Biochem. 2006, 41, 1764–1772. [Google Scholar] [CrossRef]
  7. Van Hulle, S.W.; Vandeweyer, H.J.; Meesschaert, B.D.; Vanrolleghem, P.A.; Dejans, P.; Dumoulin, A. Engineering aspects and practical application of autotrophic nitrogen removal from nitrogen rich streams. Chem. Eng. J. 2010, 162, 1–20. [Google Scholar] [CrossRef]
  8. Hellinga, C.; Schellen, A.A.J.C.; Mulder, A.J.; van Loosdrecht, M.C.M.; Heijnen, J.J. The SHARON process: An innovative method for nitrogen removal from ammonium-rich waste water. Water Sci. Technol. 1998, 37, 135–142. [Google Scholar] [CrossRef]
  9. Anthonisen, A.C.; Loehr, R.C.; Prakasam, T.B.S.; Srinath, E.G. Inhibition of Nitrification by Ammonia and Nitrous Acid. J. Water Pollut. Control Fed. 1976, 48, 835–852. [Google Scholar] [PubMed]
  10. Strous, M.; van Gerven, E.; Kuenen, G.J.; Jetten, M. Effects of aerobic and microaerobic conditions on anaerobic ammonium-oxidizing (anammox) sludge. Appl. Environ. Microbiol. 1997, 63, 2446–2448. [Google Scholar] [PubMed]
  11. Lotti, T.; van der Star, W.R.L.; Kleerebezem, R.; Lubello, C.; van Loosdrecht, M.C.M. The effect of nitrite inhibition on the anammox process. Water Res. 2012, 46, 2559–2569. [Google Scholar] [CrossRef] [PubMed]
  12. Wett, B.; Murthy, S.; Takács, I.; Hell, M.; Bowden, G.; Deur, A.; O’Shaughnessy, M. Key Parameters for Control of DEMON Deammonification Process. Water Pract. 2007, 1, 1–11. [Google Scholar] [CrossRef]
  13. Kimura, Y.; Isaka, K.; Kazama, F.; Sumino, T. Effects of nitrite inhibition on anaerobic ammonium oxidation. Appl. Microbiol. Biotechnol. 2010, 86, 359–365. [Google Scholar] [CrossRef] [PubMed]
  14. Trigo, C.; Campos, J.L.; Garrido, J.M.; Mendez, R. Start-up of the Anammox process in a membrane bioreactor. J. Biotechnol. 2006, 126, 475–487. [Google Scholar] [CrossRef] [PubMed]
  15. Kampschreur, M.J.; Temmink, H.; Kleerebezem, R.; Jetten, M.S.M.; van Loosdrecht, M.C.M. Nitrous oxide emission during wastewater treatment. Water Res. 2009, 43, 4093–4103. [Google Scholar] [CrossRef] [PubMed]
  16. Intergovernmental Panel on Climate Change. Climate Change 2007: The Physical Science Basis. Contribution of Working Group I to the Fourth Assessment Report of the Intergovernmental Panel on Climate Change; Cambridge University Press: Cambridge, UK; New York, NY, USA, 2007. [Google Scholar]
  17. United Nations Framework Convention on Climate Change. Outcomes of the U.N. Climate change conference in Paris. In Proceedings of the 21st Session of the Conference of the Parties to the United Nations Framework Convention on Climate Change, Paris, France, 30 November–12 December 2015.
  18. Ravishankara, A.R.; Daniel, J.S.; Portmann, R.W. Nitrous Oxide (N2O): The Dominant Ozone-Depleting Substance Emitted in the 21st Century. Science 2009, 326, 123–125. [Google Scholar] [CrossRef] [PubMed]
  19. Firestone, M.K.; Firestone, R.B.; Tiedje, J.M. Nitric oxide as an intermediate in denitrification: Evidence from nitrogen-13 isotope exchange. Biochem. Biophys. Res. Commun. 1979, 91, 10–16. [Google Scholar] [CrossRef]
  20. Kampschreur, M.J.; van der Star, W.R.; Wielders, H.A.; Mulder, J.W.; Jetten, M.S.; van Loosdrecht, M.C.M. Dynamics of nitric oxide and nitrous oxide emission during full-scale reject water treatment. Water Res. 2008, 42, 812–826. [Google Scholar] [CrossRef] [PubMed]
  21. Kartal, B.; Kuypers, M.M.M.; Lavik, G.; Schalk, J.; Op den Camp, H.J.M.; Jetten, M.S.; Strous, M. Anammox bacteria disguised as denitrifiers: Nitrate reduction to dinitrogen gas via nitrite and ammonium. Environ. Microbiol. 2007, 9, 635–642. [Google Scholar] [CrossRef] [PubMed]
  22. Sander, R. Compilation of Henry’s law constants (version 4.0) for water as solvent. Atmos. Chem. Phys. 2015, 15, 4399–4981. [Google Scholar] [CrossRef]
  23. Leix, C.; Drewes, J.E.; Koch, K. The role of residual quantities of suspended sludge on nitrogen removal efficiency in a deammonifying moving bed biofilm reactor. Bioresour. Technol. 2016, 219, 212–218. [Google Scholar] [CrossRef] [PubMed]
  24. American Public Health Association. Standard Methods for the Examination of Water and Wastewater, 22nd ed.; American Public Health Association (APHA): Washington, DC, USA, 2012. [Google Scholar]
  25. Rodriguez-Sanchez, A.; Gonzalez-Martinez, A.; Martinez-Toledo, M.; Garcia-Ruiz, M.; Osorio, F.; Gonzalez-Lopez, J. The Effect of Influent Characteristics and Operational Conditions over the Performance and Microbial Community Structure of Partial Nitritation Reactors. Water 2014, 6, 1905–1924. [Google Scholar] [CrossRef]
  26. Gustavsson, D.J.I. Biological sludge liquor treatment at municipal wastewater treatment plants—A review. Vatten 2010, 66, 179–192. [Google Scholar]
  27. Goode, C.; Allen, D.G. Effect of Calcium on Moving-Bed Biofilm Reactor Biofilms. Water Environ. Res. 2011, 83, 220–232. [Google Scholar] [CrossRef] [PubMed]
  28. Gilbert, E.M.; Agrawal, S.; Schwartz, T.; Horn, H.; Lackner, S. Comparing different reactor configurations for Partial Nitritation/Anammox at low temperatures. Water Res. 2015, 81, 92–100. [Google Scholar] [CrossRef] [PubMed]
  29. Gabarró, J.; González-Cárcamo, P.; Ruscalleda, M.; Ganigué, R.; Gich, F.; Balaguer, M.D.; Colprim, J. Anoxic phases are the main N2O contributor in partial nitritation reactors treating high nitrogen loads with alternate aeration. Bioresour. Technol. 2014, 163, 92–99. [Google Scholar] [CrossRef] [PubMed]
  30. Pan, Y.; Ni, B.-J.; Bond, P.L.; Ye, L.; Yuan, Z. Electron competition among nitrogen oxides reduction during methanol-utilizing denitrification in wastewater treatment. Water Res. 2013, 47, 3273–3281. [Google Scholar] [CrossRef] [PubMed]
  31. Ju, K.; Wang, L.; Lv, Y.; Zhang, X.; Miao, R.; Wang, X. Nitrous oxide emission in autotrophic partial nitritation system: Macro- and microanalyses. J. Biosci. Bioeng. 2015, 120, 419–425. [Google Scholar] [CrossRef] [PubMed]
  32. Domingo-Félez, C.; Mutlu, A.G.; Jensen, M.M.; Smets, B.F. Aeration strategies to mitigate nitrous oxide emissions from single-stage nitritation/anammox reactors. Environ. Sci. Technol. 2014, 48, 8679–8687. [Google Scholar] [CrossRef] [PubMed]
  33. Scherson, Y.D.; Wells, G.F.; Woo, S.-G.; Lee, J.; Park, J.; Cantwell, B.J.; Criddle, C.S. Nitrogen removal with energy recovery through N2O decomposition. Energy Environ. Sci. 2013, 6, 241–248. [Google Scholar] [CrossRef]
Figure 1. Piping and instrumentation diagram (P & ID) of the deammonification pilot plant.
Water 08 00578 g001
Figure 2. SBR conversion rates related to inflowing ammonium and nitrite concentrations (shaded boxes indicate duration of aerated/stirred phases).
Water 08 00578 g002
Figure 3. Online data for the second stage of the deammonification process by suspended sludge with intermittent feeding (Qfeed) and aeration.
Water 08 00578 g003
Figure 4. MBBR conversion rates related to inflowing ammonium and nitrite concentrations (shaded boxes indicate duration of aerated/stirred phases).
Water 08 00578 g004
Figure 5. Mean, minimal, and maximal dissolved N2O concentrations including standard deviations as error bars in the nitritation, buffer tank, SBR, and MBBR (* N2O concentrations measured in the buffer tank exceeded the detection limit of the sensor many times, likely resulting in an underestimation of the mean and maximal N2O concentrations reported (n = 3980); ** Dissolved N2O concentrations in the MBBR operated as single-stage deammonification).
Water 08 00578 g005
Figure 6. Development of dissolved N2O, dissolved oxygen, and pH concentrations in SBR for one cycle (18 July 2015).
Water 08 00578 g006
Table 1. Reactor performance of two two-stage deammonification systems with suspended sludge (SBR) and biofilm carriers (MBBR) in the second stage.
ParameterUnitNitritationSBRNitritationMBBR
(2014)(2015)
HRT 1[day]~1.32.3 ± 1.1~1.32.2 ± 0.5
Temperature[°C]31.0 ± 0.331.2 ± 0.732.4 ± 0.432.0 ± 0.9
pH-Invalid 27.84 ± 0.15Invalid 27.60 ± 0.26
DO[mg/L]Invalid 20.10 ± 0.02Invalid 21.5 ± 1.3
TSS[g/L]0.2 ± 0.12.2 ± 0.7n/an/a
NO2-N/NH4-N 3-0.32 ± 0.150.32 ± 0.110.25 ± 0.140.23 ± 0.12
NH4-N conversion rate[g N/(m3∙day)]447.5 ± 154.9448.9 ± 134.4234.3 ± 82.7445.8 ± 126.2
332.5 ± 109.6 4388.5 ± 150.8 4
Ntotal conversion rate[g N/(m3∙day)]95.9 ± 135.8598.2 ± 200.812.8 ± 43.6501.2 ± 100.0
Ntotal effluent[mg N/L]1321 ± 118142 ± 331327 ± 61234 ± 66
Degradation 5[%]31.6 ± 6.590.1 ± 2.623.4 ± 9.281.9 ± 5.4
Notes: 1 Hydraulic retention time; 2 Measured pH and dissolved oxygen (DO) concentrations were invalid due to a calcium layer constantly present on the sensors; 3 In the nitritation effluent and in the second-stage influent; 4 Calculated as single-stage deammonification process; 5 NH4-N oxidation for nitritation and Ntotal degradation for the second stage.

