Article

Efficiency Criteria as a Solution to the Uncertainty in the Choice of Population Size in Population-Based Algorithms Applied to Water Network Optimization

by
Daniel Mora-Melià
1,*,
Jimmy H. Gutiérrez-Bahamondes
1,
Pedro L. Iglesias-Rey
2 and
F. Javier Martínez-Solano
2
1
Departamento de Ingeniería y Gestión de la Construcción, Facultad de Ingeniería, Universidad de Talca, Talca 3340000, Chile
2
Departamento de Ingeniería Hidráulica y Medio Ambiente, Universitat Politècnica de Valencia, Valencia 46022, Spain
*
Author to whom correspondence should be addressed.
Water 2016, 8(12), 583; https://doi.org/10.3390/w8120583
Submission received: 4 September 2016 / Revised: 28 October 2016 / Accepted: 2 December 2016 / Published: 7 December 2016

Abstract

:
Different Population-based Algorithms (PbAs) have been used in recent years to solve all types of optimization problems related to water resource issues. However, the performances of these techniques depend heavily on correctly setting some specific parameters that guide the search for solutions. The initial random population size P is the only parameter common to all PbAs, but this parameter has received little attention from researchers. This paper explores P behaviour in a pipe-sizing problem considering both quality and speed criteria. To relate both concepts, this study applies a method based on an efficiency ratio E. First, specific parameters in each algorithm are calibrated with a fixed P. Second, specific parameters remain fixed, and the initial population size P is modified. After more than 600,000 simulations, the influence of P on obtaining successful solutions is statistically analysed. The proposed methodology is applied to four well-known benchmark networks and four different algorithms. The main conclusion of this study is that using a small population size is more efficient above a certain minimum size. Moreover, the results ensure optimal parameter calibration in each algorithm, and they can be used to select the most appropriate algorithm depending on the complexity of the problem and the goal of optimization.

1. Introduction

A water distribution network (WDN) is a system of different elements, such as tanks, pipes, pumps, different types of valves, etc., connected to bring water resources to end users. It is a vital component of urban infrastructure and requires significant financial investment by governments and businesses.
Optimization of WDN includes several important factors, such as pipe sizing, distribution demands, pressure uniformity, water quality, improvements in network efficiency by district metering areas (DMAs), etc. All these variables are important in the planning, design and operation of the system. Performing a complete list of all variables, where each possible solution is evaluated, becomes infeasible as the network grows in size. Consequently, efficient guided search methods should be used.
Although these problems are not independent, it is possible to formulate and solve them independently. In this regard, from an economic point of view, pipes are the central elements of study because they represent the highest economic costs in WDN projects. Therefore, this study focuses on WDN design, specifically the optimal sizing of pipes, ensuring that requirements regarding demands, pressures at nodes and velocities in lines are met.
Optimal sizing of pipes includes nonlinear equations between flow losses and head, as well as discrete variables such as pipe diameter. Thus, the selected problem is a non-linear integer problem, where a set of solutions is selected among a discrete set of feasible diameters, i.e., a combinatorial optimization problem. Therefore, this problem can be interpreted as an NP-hard type problem [1], i.e., it cannot be solved using known methods in a deterministic polynomial manner. Previously, researchers developed optimization methods to solve this problem, including approaches that reduce the complexity of the original non-linear problem. In this sense, deterministic optimization techniques such as linear programming [2] and non-linear programming [3] were used to optimally design water distribution networks. Unfortunately, these methods have limitations. On one hand, linear programming simplifications assumed that all functions are linear. However, these simplifications reduce the accuracy of the final solution. On the other hand, nonlinear programming typically falls into local minima of the objective function, which depends on the starting point of convergence. To overcome these disadvantages new techniques were needed.
More recently, stochastic optimization techniques, such as meta-heuristic algorithms, have been applied in the field of water resources. In this way, they have been used for a variety of purposes, as model calibration [4], optimal planning, design and operation of water systems [5,6], best management practice (BMP) models [7], etc. These algorithms allow full consideration of system’s nonlinearity and widely explore the search space to obtain a good solution in a reasonable time, minimizing or maximizing an objective function and trying to avoid being trapped at local minima or maxima. Consequently, the application of these techniques extends the field search and the capacity to obtain better solutions. In addition, meta-heuristic algorithms require relatively little knowledge about the problem to solve, that is to say, they can be considered as problem-independent techniques [8,9,10]. For these reasons, meta-heuristic techniques are often used as alternatives to traditional optimization methods.
Meta-heuristics can be divided into two groups: single point methods and population based-algorithms. Single point methods try to improve upon a specific solution by exploring its neighbourhood. Some examples of this class are Simulated Annealing [11] or Tabu Search [12].
Population-based methods combine a number of solutions to generate new solutions better than the previous ones. These algorithms have shown satisfactory capabilities to solve NP-hard optimization problems and they are the most well-established class of meta-heuristics for solving hydraulic engineering problems. Specifically, Population-based algorithms such as Genetic Algorithms (GA) [13,14], Memetic Algorithms [15], Harmony Search [16,17], Shuffled Frog Leaping Algorithms (SFLA) [18] and even hybrid techniques [19], have been successfully applied to the optimal sizing of pipes problem.
Generally, all these algorithms share some basic principles. They use operators to calculate neighbour solutions that improve the quality of the initial solution, which is usually generated randomly. These selection mechanisms are guided by several specific parameters in each technique, and proper calibration of these parameters is essential for good algorithm performance, in terms of finding the best solution [20,21]. However, researchers have concluded that there are no universally accepted values for the “best” algorithm parameter setting, since the behaviour of each algorithm also depends on the optimization problem and the computational effort invested in solving the problem. In this sense, Maier et al. [22] made a thorough study about what is the current situation and future challenges in the implementation of Population-based algorithms to solve problems related to water resources. Among the research challenges, the development of knowledge about what is the impact of algorithm operators on searching behaviour is highlighted.
Among all the parameters specified before starting a PbA, population size is likely the calibration parameter that has received the least attention from researchers. However, this choice is one of the most important faced by any PbA user, and it may be critical in many optimization problems. In addition, this parameter is likely the only issue that is shared by all optimization algorithms.
All Population-based algorithms base the search process on two steps: exploration of the search space and exploitation of information acquired during the search process. The performance of a PbA is directly related to the balance of these two processes, and the initial population has a considerable influence on this equilibrium. When the exploitation process is dominant compared to exploration, the population of the algorithm loses diversity too early, and the algorithm prematurely converges to local minima. Traditionally, researchers relate small population size to premature convergence and, therefore, poor solutions.
However, when exploration is dominant, the algorithm wastes considerable time exploring regions of the search space that are not interesting. Therefore, the algorithm increases the convergence time. Population sizes that are too large can result in a slow optimization process.
Therefore, a population size should be chosen that represents a trade-off between solution quality and search time, but little research has been conducted regarding this topic. Some researchers have addressed the problem by trying to control the diversity of the population [23,24], while others have tried to directly find the relationship between population and convergence time [25,26]. Additionally, some approaches divide the main population into two populations, in which some individuals evolve as usual and others are used as memory to store past good solutions [27,28]. However, no studies have directly related the influence of population size to several optimization objectives. The first contribution of this paper is in this area.
Furthermore, Wolpert and Macready [29] claim that there is an optimization method that works best for each type of optimization problem, but there is no single method that is best for all optimization problems (No free Lunch theorem). For this reason, Maier et al. [22] also highlight, as a research challenge, the development of methodologies to calculate the performance of the algorithm.
Generally, researchers consider two components to evaluate the performance of an algorithm: how close the found solutions are to the known, global, lower cost solution and how quickly this solution is found [8]. It is important to consider that Population-based algorithms identify different solutions each time they are run and some authors [30,31] emphasize the need to develop objective methods for comparing algorithms. In this regard, Marchi et al [31] warn that it is not sufficient to consider only the best result and the minimum number of function evaluations in a run, because the neutrality of the evaluation may be compromised. Although the need for neutral comparison methodologies is clear, there are only a few attempts in the literature to date [32]. The second contribution of this paper is in this area.
This paper proposes a method to determine the most efficient initial size of the random population P in optimization algorithms for the WDN pipe-sizing problem, relating the quality of the solutions and the required computational effort. This study uses a novel approach [32] based on an efficiency rate (E) that was applied to the results obtained by four different PbAs in four benchmark networks.
This study shows that proper calibration of PbAs improves performance by increasing the probability of finding low/good cost solutions. In this regard, the results identify the most efficient population size for each algorithm and show that small populations are generally more efficient than large populations. In addition, the paper compares the performances of selected algorithms in different benchmark networks. The results can be used to determine the best algorithm depending on the complexity of the problem and the optimization goals.
The remainder of the paper is organised as follows. In Section 2, the proposed optimization models, the programming environment and methods are presented. Section 3 illustrates the selected case studies and analyses the complexity of each benchmark network. The results of the computational experiments are analysed in Section 4. Finally, Section 5 presents our conclusions and suggestions for future work.

2. Materials and Methods

2.1. Problem Formulation and Selected Algorithms

The mathematical formulation of the optimal sizing problem has been established in many previous studies [33,34], in which the objective was to minimize the investment cost of a given pipe network. The layouts and demands are known, but the problem is constrained by minimum pressure requirements and minimum/maximum flow velocities. Therefore, the objective function (OF) is calculated as the sum of the cost of the pipes and some penalty functions that account for the constraints of the Problem (1).
F( X i )= j=1 N HD F e,j H D,j ( X i ) Q D,j ( X i )+ F a j=1 N VD C j ( X j i )· L j + λ 1 s=1 N S k=1 N R δ k,s ·( H min,k H k,s ) + λ 2 s=1 N S k=1 N R δ k,s ·( V max,k V k,s )+ λ 3 s=1 N S k=1 N R δ k,s ·( V min,k V k,s )
In the first term of the equation, the pressure head HD,j(Xi) and the flow of each pump QD,j(Xi) (if it exists on the network) are represented. Fe,j is the energy cost in each of these points. The capital cost of the pipes is represented in the second term of the equation, where Cj is the unit cost of the decision variable contained in link j of solution i, and Lj is the length of pipe j. The last three terms in the equation represent the constraints of the problem, related with minimum pressure height in each node (Hmin,k), maximum velocity (Vmax,k) and minimum velocity (Vmin,k).
These imposed constraints must achieve the possible solutions of the problem and have been included as a penalty in the total cost of the solution that subsequently affects the aptitude of the solution. In our model, pressure and velocity are considered hard constraints. For this reason, the weight functions λi are large enough (107) to reject all solutions that violate the constraints. More details about the methodology, the objective function and the penalty terms can be found in [20].
There are numerous methodologies based on meta-heuristics that can be applied to minimize this OF. Traditionally, heuristic and/or Population-based algorithms are stochastic search methods, and the inevitable randomness of this type of technique is controlled by general rules that govern the optimization process.
Many available algorithms can be adapted to solve the optimal pipe size problem and the fact is that the choice of techniques for comparison is subjective. After conducting a literature review, the main criteria considered for selection of algorithms was that all of them have already been successfully applied to various problems related to the WDN design in the original form of the algorithm. Actually, choosing the original form of the logarithm is just the first step, since there are many alternatives within each algorithm. In this case, the meta-heuristic algorithms chosen are as follows: the Pseudo-Genetic Algorithm (PGA), the Harmony Search Optimization Algorithm (HS), the modified Particle Swarm Algorithm (PSO) and the modified Shuffled Frog Leaping Algorithm (SFLA).
All of these techniques have received considerable attention in the literature. Genetic Algorithms were one of the first meta-heuristic algorithms applied to water resources and a general description of the technique can be found in [33]. The evolution of an initial population is based on three main processes: reproduction, crossover and mutation. Many options are available in literature for these processes that are controlled by three calibration parameters: Population size (P), Crossover frequency (Pc) and Mutation frequency (Pm). This work uses a modified version of classical GA, PGA, whose complete description can be found in [20]
The HS algorithm was originally inspired by the improvisation process of Jazz musicians and a complete description of this methodology can be found in [17]. Like other methodologies, HS contains some parameters to guide the optimization process, including harmony memory size (P), harmony memory considering rate (HMCR) and pitch adjusting rate (PAR). The version of HS utilized in this work is the original from Geem [17], because it was successfully tested on the problem of optimal pipe-sizing.
PSO was developed by Kennedy and Eberhart [35] and is inspired by the flocking and schooling patterns of birds. Each particle contains a solution and moves in the decision space with a velocity vector from a position that is initially selected at random. The PSO concept consists of changing the velocity of each particle toward better locations and is controlled by several parameters: Population size (P), velocity limit of birds (Vlim) and the learning factors C1 and C2. The original PSO algorithm is often trapped into local optima, causing early convergences. Therefore, the authors include a new parameter, creating a modified version of the algorithm. This parameter, named Confusion Probability (Pc), determines the number of particles that do not follow the social behavior in each iteration [32].
The technique of SFLA performs a meta-heuristic search based on the evolution of particles called memes, trying to imitate the search for food by a group of frogs that exchange information among themselves. The original SFLA was developed by Eusuff and Lansey [18] but the version of SFLA utilized in this work is from Elbeltagi et al. [36], because their modifications lead to better results for pipe-sizing problem [37]. The global exchange of information in this modified version of SFLA is controlled by five parameters: the number of memeplexes (m), the number of frogs per memeplex (n), the fraction of frogs in the memeplex that will evolve (q), the number of memetic evolutions or evolutionary steps (Ns) and a search acceleration factor (C).
More details about the model and the particularities of each algorithm can be found in [32,37].

2.2. Specific Operators and Calibration

The relative simplicity of Population-based algorithms has favoured their application in a wide variety of disciplines and engineering problems. However, to function properly, certain control parameters must be set for a new problem. This study divides the different parameters into two groups: specific parameters in each algorithm and common parameters in all algorithms. Specifically, the only parameter common to all PbAs is the initial size of the random population P, and it must be sufficient to guarantee the diversity of solutions.
Regarding the calibration, parameters can be optimized in two ways [38]: parameter tuning and parameter control. In parameter tuning, the parameters remain fixed and the PbAs are run for different values of these parameters, analysing the impact of the chosen values on the algorithm performance. It is the traditional method of testing and comparing parameters, but it usually requires considerable time to achieve acceptable performance.
One alternative to tuning parameters by hand is to rely on mathematical analysis or parameter control. In this case, the algorithms adapt these parameter settings on-line during the actual run using feedback from the search process. Although parameter control has obvious advantages, the required computational overhead, the need for initial parameter values and restricted domains decrease the efficiency for some problems.
Of the many approaches to algorithmic parameter tuning, this study partially adopts the methodology proposed by McClymont [33]. It begins with the selection of the problem. Next, several trial runs are applied, and parameters are tuned. Finally, the results are statistically analysed to ensure the best configuration based on the quality of the solution.
This study considers only the analysis of P, whereas the remaining parameters are fixed in each algorithm. The constant values of the remaining parameters were obtained from previous studies [20,32,37,39] and correspond to the best combination in each of the algorithms based on the solution quality. Table 1 summarizes the specific parameters considered and the optimal parameter calibration for each of the techniques, which is adopted as a fixed value in this study.
This preliminary work involves more than 700,000 simulations, and not all the operators have the same importance in the performance of the search process. Thereby, the performance of the algorithm is extremely sensitive to some parameters, while other parameters have little influence on maximizing the possibility of obtaining successful solutions.
According to the calibration protocol, 300 simulations were performed for each P considered, and all remaining specific parameters were fixed. In this study, the smallest population size was 25 individuals, and the largest was 225 individuals. This calibration protocol has been applied to all PbAs considered in this study.

2.3. Efficiency Criteria

After the simulations, a methodology was used to measure the efficiency (E) of the algorithm. First, a statistical analysis was performed based on the quality of the obtained solution and the convergence time required to reach the solution. Then, both concepts are related. In this sense, E is an original concept proposed by the authors [32]. It represents an objective approach to comparing different algorithms applied to the same problem according to Equations (2) and (3):
η q u a l i t y   =   N s u c c e s s f u l N s i m
E   =   η q u a l i t y η c o n v e r g e n c e
where ηquality is associated with the quality of the simulations, representing the number of successful solutions Nsuccessful divided by the total number of simulations performed Nsim. Note that Nsuccessful is the number of “known global lowest cost” or the number of “good” solutions, depending on the optimization objective, i.e., this rate can be defined according to the requirement of the solutions. For example, sometimes it may be preferable to find a set of solutions close to the lowest cost but that can be obtained with a smaller computational effort. In this study, a “good solution” can be defined as a solution with a fitness function that does not exceed a certain threshold above the known global lowest cost.
The term ηconvergence is related to the computational effort required by the algorithm to reach the final solution. ηconvergence refers to the number of objective function evaluations performed by the algorithm before finding the final solution to the problem. An evaluation of the OF represents a call to the hydraulic solver, so that only the chains that changed from the previous generation are re-evaluated. Therefore, the number of calls to a hydraulic package does not necessarily have to match the number of generations in the algorithm multiplied by the population size P. Optimization software was programmed to compute this data, which is obtained directly in each simulation.
Finally, the ratio of both defines E (Equation (3)), giving an idea of the performance of the algorithm. E reports the number of “successful” evaluations obtained per call of the OF. Similarly, 1/E represents the number of evaluations of the OF required to find a successful solution to the sizing problem. In this study, E is used to determine the most efficient P in each algorithm and problem considering both quality and speed criteria.

2.4. Programming Environment

The calibration of operators in a meta-heuristic algorithm requires many simulations with reliable results. In this study, a new computer programme called HAWaNet (Heuristic Algorithms Water Networks) has been developed to optimize the design and operation of water networks. The HAWaNet programme includes several meta-heuristic techniques, including those mentioned above (see Section 2.1). The software can conduct massive simulations in parallel, and it is integrated with the network hydraulic solver EPANET (version 2.00.12) using the programmer’s toolkit [40].
Note that not all of the hydraulic solvers use the same hydraulic parameters in the energy conservation equation. Therefore, the results can vary slightly, changing the low-cost solution. It is important to consider that these small differences between different hydraulic solvers may be the reason that a solution complies or not with the constraints. For example, one of the most well-known formulas for head-losses is the Hazen–Williams equation, which has different versions depending on certain numeric conversion constants. A more detailed mathematical explanation can be found in [34]. Accordingly, this paper uses EPANET as hydraulic solver because of its extensive use in this field.

3. Test Problems and Results

Most studies in the literature approach algorithm comparison in a similar way, using a set of benchmark problems to test the algorithms. In this sense, Wang et al. [41] categorized benchmark design problems into four groups: small, medium, intermediate and large.
Under this classification, this study considers two small and three medium-sized benchmark networks to evaluate the performance of the methods described above from the standpoint of efficiency: the Two Loop network, the BakRyan network, the Hanoi network [42], the New York tunnel network [43] and the GoYang network [44]. These networks are well-known benchmark problems that are commonly used to evaluate meta-heuristic algorithms. Consequently, many different solutions are available in the literature, but they are small problems compared to a real water distribution system. Therefore, another simplified real network is presented, called the R-9 Joao Pessoa network [45]. This network is also medium size, but it is closer to the intermediate category. This network was included to study a more hydraulically complex network that could limit the conclusions of this study, since this network has 11 loops.
Table 2 summarizes the most relevant information regarding these networks, including the number of decision variables (pipes), number of diameters used to solve the optimization problem, search space size, minimum pressure requirements at the nodes and best known solution to date, according to the chosen hydraulic solver EPANET (version 2.00.12). Besides, this table includes the number of different final solutions (local minima) obtained by all the algorithms, as a measure of the solutions dispersion. This is a key point to understand the complexity of the problem, along with the size of the search space.
After the simulations, all PbAs implemented reached the lowest cost solution currently available in the literature. The total number of simulations, including previous study-specific parameter calibration and the analysis of the influence of the initial population size P, was more than 700,000. First, the difficulty of different pipe-sizing problems was analysed. An overview of the results can be used to classify benchmark networks depending on their complexity.
There are different ways to measure the complexity of these problems, but generally, some researchers only associate the complexity of the pipe-sizing problem with the search space. Obviously, as the number of decision variables (pipes) and choices (diameters) increases, so does the size of the search space and finding (near) global optimum solutions becomes more difficult.
However, the size of the search space may not be the only criterion to consider in determining the complexity of each network. For example, if medium-sized problems are considered, the Hanoi network is of great interest because only a small percentage on the total search space is feasible. This feature complicates the search and tests the ability of the algorithm to find good feasible solutions in a largely unfeasible space, increasing the complexity of this problem against others with a greater search space.
Thus, the search for a known global minimum becomes more complex as the number of local minima near the optimum solution increases. In this sense, the last column in Table 2 shows the number of different solutions recorded by the four algorithms implemented as a final solution. As shown, the smaller problems have low solution dispersion with only 10 different solutions for all runs in the BakRyan network and 60 in the Two Loops network. Obviously, the BakRyan network is the simplest of the analysed cases.
Within medium-sized networks, GoYang has low solution dispersion, with only 303 different solutions for all runs. Moreover, 99% of simulations in this network have overruns within 0.3% of the low-cost solution. Therefore, the GoYang network is the simplest of this group.
By contrast, the dispersion of results was highest for the Joao Pessoa network, with 16,101 different solutions found, and algorithms can yield final solutions with up to a 20% overrun of the global known minimum solution. The Joao Pessoa network is the most complex case among those analysed in this study. More details regarding the complexity of the pipe-sizing problem can be found in [32,37].

4. Analysis of Results

The calibration protocol presented in Section 2.2 involves performing at least 300 simulations for each initial population size P considered, keeping all remaining specific parameters fixed. This calibration protocol has been applied to the four PbAs studied in this analysis (PGA, PSO, HS and SFLA). Regarding fixed parameters, optimum calibration of each specific parameter considering the efficiency of the algorithm was performed in a previous study [32] of each algorithm and network.
After the simulations, test runs were classified depending on P and their success rate. The success rate is the ratio of the number of times a minimum/good solution was achieved to the total number of simulations performed. Although all algorithms implemented reached the low-cost solution available in the literature (see Table 2), the low-cost solution of the Joao Pessoa case lacks sufficient replication due to the complexity of the network. Thus, solutions with costs that did not exceed 1% of the global minimum in the literature were considered successful.
A statistical analysis of the results based on initial population size was conducted for each algorithm and network. This analysis considers the quality of the obtained solution ηquality, the speed of convergence ηconvergence of the algorithm and the relationship between the previous two, which is defined as the efficiency E of the algorithm.
Figure 1 shows the success rate considering the probability of finding the global known minimum in each network according to the initial population size. It is important to highlight the importance of pre-calibrating the specific parameters in each algorithm, thereby increasing the number of successful solutions.
The repeatability of obtaining low-cost solutions is related to ηquality in Equation (3). Considering the overall performance of each algorithm in obtaining low-cost solutions, the results clearly show that the SFL algorithm is the most powerful of those tested because it produces more successful solutions in all networks. Conversely, the HS algorithm has great difficulty finding low-cost solutions, except in the small problems and in the New York network, which are problems with less complexity.
Regarding the analysis of initial population size P, the number of low-cost solutions is generally larger for larger populations. Note that the improvement in the number of low-cost solutions for larger populations is not linear, and all algorithms reach a certain P at which no improvement occurs or improvement is very small.
For example, in the case of the SFL algorithm, this “stable” P is directly dependent on the complexity of the network. Thus, for the Hanoi, New York networks and the Two Loops networks, no significant improvements are obtained at P > 75. For the Joao Pessoa network, which is more complex and has a larger search space, the algorithm gradually improved to P = 150 individuals. It then stabilized or worsened depending on P. Finally, for the BakRyan and GoYang networks, all tested populations yielded similar results because these networks represent simple cases based on the number of local minima. Therefore, the probability of obtaining the low-cost solution was approximately 95% and 60% respectively, defining the limit of the algorithm for these networks.
In the case of the PGA, the algorithm follows the general trend of obtaining the most successful solutions for larger populations. However, in the cases of the small networks and GoYang networks, no improvements are obtained at P > 100 due to its simplicity. The behaviours of the PSO and HS algorithms are similar to that of the SFL algorithm, with the existence of limit populations at which no significant improvements are produced based on minimum solutions.
Different aspects of each algorithm must be considered when assessing convergence speed (ηconvergence). Thus, the previous calibration of specific parameters and the differences in the search processes of each algorithm play key roles in the speed of convergence [32]. Figure 2 shows the average number of OF evaluations required to reach the final solution at each tested population size and for each algorithm and network.
According to the results, the differences in the convergence speeds of different networks and algorithms are large. As expected, the larger the population size is, the greater the number of OF evaluations. The number of OF evaluations was highest in the Hanoi and Joao Pessoa networks because they have larger search spaces and more local minima, i.e., these networks are more complex. Conversely, for small problems, Two-Loops and Bak-Ryan are the simplest cases, and they converge faster. These general trends occur in all algorithms.
Additionally, the optimization process of each algorithm is an important differentiating factor in the degree of convergence. Therefore, the HS algorithm generally requires fewer evaluations to reach the final solution in all analysed networks. Moreover, among all tested algorithms, it exhibits the smallest difference between small and large initial populations, considering only the speed of convergence.
By contrast, the SFL algorithm requires many OF evaluations to reach the final solution, i.e., the algorithm spends more time looking if it has not found a successful solution. Based on the average number of OF evaluations, the performances of the PGA and PSO algorithms were between those of the HS and SFLA for all cases except the New York network.
Finally, if the number of OF evaluations is analysed considering the initial size of the population, the conclusions are the same for the PGA, PSO and SFLA. For all these algorithms, the number of OF evaluations increases almost linearly with increasing initial population size, as shown in Figure 2.
The general concepts of solution quality and computational effort are related by the efficiency E, which is defined as the ratio between ηquality and ηconvergence, according to Equation (3). As noted above, E describes the performance of each algorithm while considering both the ability to obtain the desired solution and the computational effort required to reach this solution. This paper analyses E for all algorithms, considering both the possibility of obtaining the global minimum and obtaining a “good solution” to the problem (3% above the minimum). Thereby, the efficiency E of obtaining low-cost solutions for all tested networks is given in Figure 3.
Comparing the performance of different algorithms and considering the more complex networks (Hanoi and Joao Pessoa), the PGA and SFLA are far superior to the PSO and HS algorithms. Numerically, the E of the PGA for the best population size (P = 50 individuals) in the Hanoi network is 1.47, 5.33 and 5.64 times larger than those of the SFLA, PSO and HS, respectively. This suggests that for every global minimum obtained by the HS algorithm, the PGA obtained more than 5. These differences are even greater for the Joao Pessoa network, for which the efficiency of the PGA is 1.16, 6.54 and 18.16 times higher than those of the SFLA, PSO and HS algorithms, respectively.
Based on these results, the PGA and SFLA are the most efficient algorithms for solving more complex networks, i.e., problems that have larger search spaces and great dispersion of local minima near the low-cost solution. Regarding HS and PSO, these two algorithms are heavily penalized in such networks based on efficiency because they have great difficulty finding successful (low cost) solutions, as shown in Figure 1.
However, the performances of the HS and PSO algorithms improve considerably for the simplest networks, especially for the New York network, which is an exception to the general behaviour. Because of their simplicity, all the algorithms are able to find low-cost solutions more easily in this network, and the speed of convergence becomes more important. In this network, HS is the most efficient technique, but it has E values very similar to those of the SFLA and PSO, while PGA is the least efficient. Specifically, the E value of the optimally calibrated HS (P = 125 individuals) was 1.06, 1.51 and 3.52 times higher than those of the optimally calibrated SFL, PSO and PG algorithms, respectively, in the New York case.
Finally, the GoYang network exhibits the same trends as the most complex networks because the PGA and SFL algorithms are far superior to the other algorithms. In this case, the PGA is 1.17, 3.5 and 5.95 times more efficient than the SFLA, PSO and HS algorithms, respectively.
Analysing the six networks together, the PGA can be considered most robust when the goal is to obtain the global known minimum (low-cost solution), since all networks have E values very close to the highest. Similarly, the SFL algorithm is efficient when networks are complex, but it makes no sense to use it in simple networks with few local minima, since its performance is low in this type of problem considering E.
However, some analyses seek to obtain a set of near optimal solutions that approximate the global minimum. In this sense, Section 2.3 defines a good solution as a solution with a final cost that does not exceed a certain threshold above the known global lowest cost. Figure 4 shows the efficiency E when the goal is to obtain a “good solution”, which is defined in this study as a solution with a cost that does not exceed 3% of the global known minimum.
If the objective is to obtain a set of “good solutions” close to the global optimum, the results show significant variations from those of the previous analysis. The PGA is still the most efficient algorithm in four of the six networks analysed. However, the SFL algorithm significantly reduces E values because it performs more OF evaluations to find the final solution.
Additionally, the HS algorithm had trouble finding the global known minimum, but it can obtain many “good solutions” without much computational effort. Therefore, the E values are much higher, and it is the second most efficient algorithm in the BakRyan, Hanoi and GoYang networks. Moreover, it is the most efficient algorithm in the Two Loops and New York networks. The exception to this trend is the Joao Pessoa network, which represents the most complex network. In this case, the HS algorithm is not able to find many solutions near the low-cost solution.
Finally, if the individual results of each algorithm based on the initial population P are analysed, it is obvious that large populations are not the most efficient resource in most cases. Additionally, the correct choice of P depends heavily on the complexity of the problem and the problem goals.
For example, treating the global known minimum as the optimization goal and the Two Loops, the BakRyan and the GoYang networks as the simplest cases tested, Figure 3 shows that smaller populations are the most efficient in the PGA and SFLA. In addition, if we expand the optimization goal to obtain a set of “good solutions” close to the global minimum (3% above), the hypothesis is confirmed, and Figure 4 shows that smaller population sizes are the most efficient in five of the six networks for all algorithms tested.
However, the general trend when obtaining the global low-cost solution as the optimization goal is that E improves with increasing initial population until a limit is reached, at which point the performance no longer improves or worsens. For example, the results of the SFL algorithm show that E increases to a certain population in the New York, Hanoi and Joao Pessoa networks. For P > 75, P > 100 and P > 150 respectively no significant differences are observed between the tested population sizes. According to Figure 3 and Figure 4, the key to evaluating the population size is to study when increasing P does not improve E, or improving imperceptibly. Table 3 summarizes the analysis of P based on the efficiency of each algorithm in all networks, resulting in an initial random population size limit beyond which no improvements occur in terms of E.
As shown, the population limit that lowers the efficiency is generally related to the complexity of the optimization problem. Thus, the more complex the network is, the greater the population size that marks the efficiency limit.

5. Conclusions

Solving optimization problems using Population-based algorithms is of great interest because these algorithms can search beyond the local minimum of the objective function. Many of these methodologies have been successfully applied to the WDN problem, however, knowledge regarding appropriately setting the parameters that govern the search process is lacking. The initial random population size is one of these parameters, and it considerably influences algorithm performance based on the solution quality and speed of convergence.
This paper applies a methodology based on an efficiency ratio that relates the size of the initial random population to the quality of the solution and the computational effort required to achieve it. It also allows comparison of the performances of different algorithms in an objective manner, providing a tool for researchers to choose the most appropriate algorithms depending on their goals.
This methodology was assessed using four Population-based algorithms and six benchmark networks. Based on a statistical analysis of the results, the conclusions of the study are presented as follows:
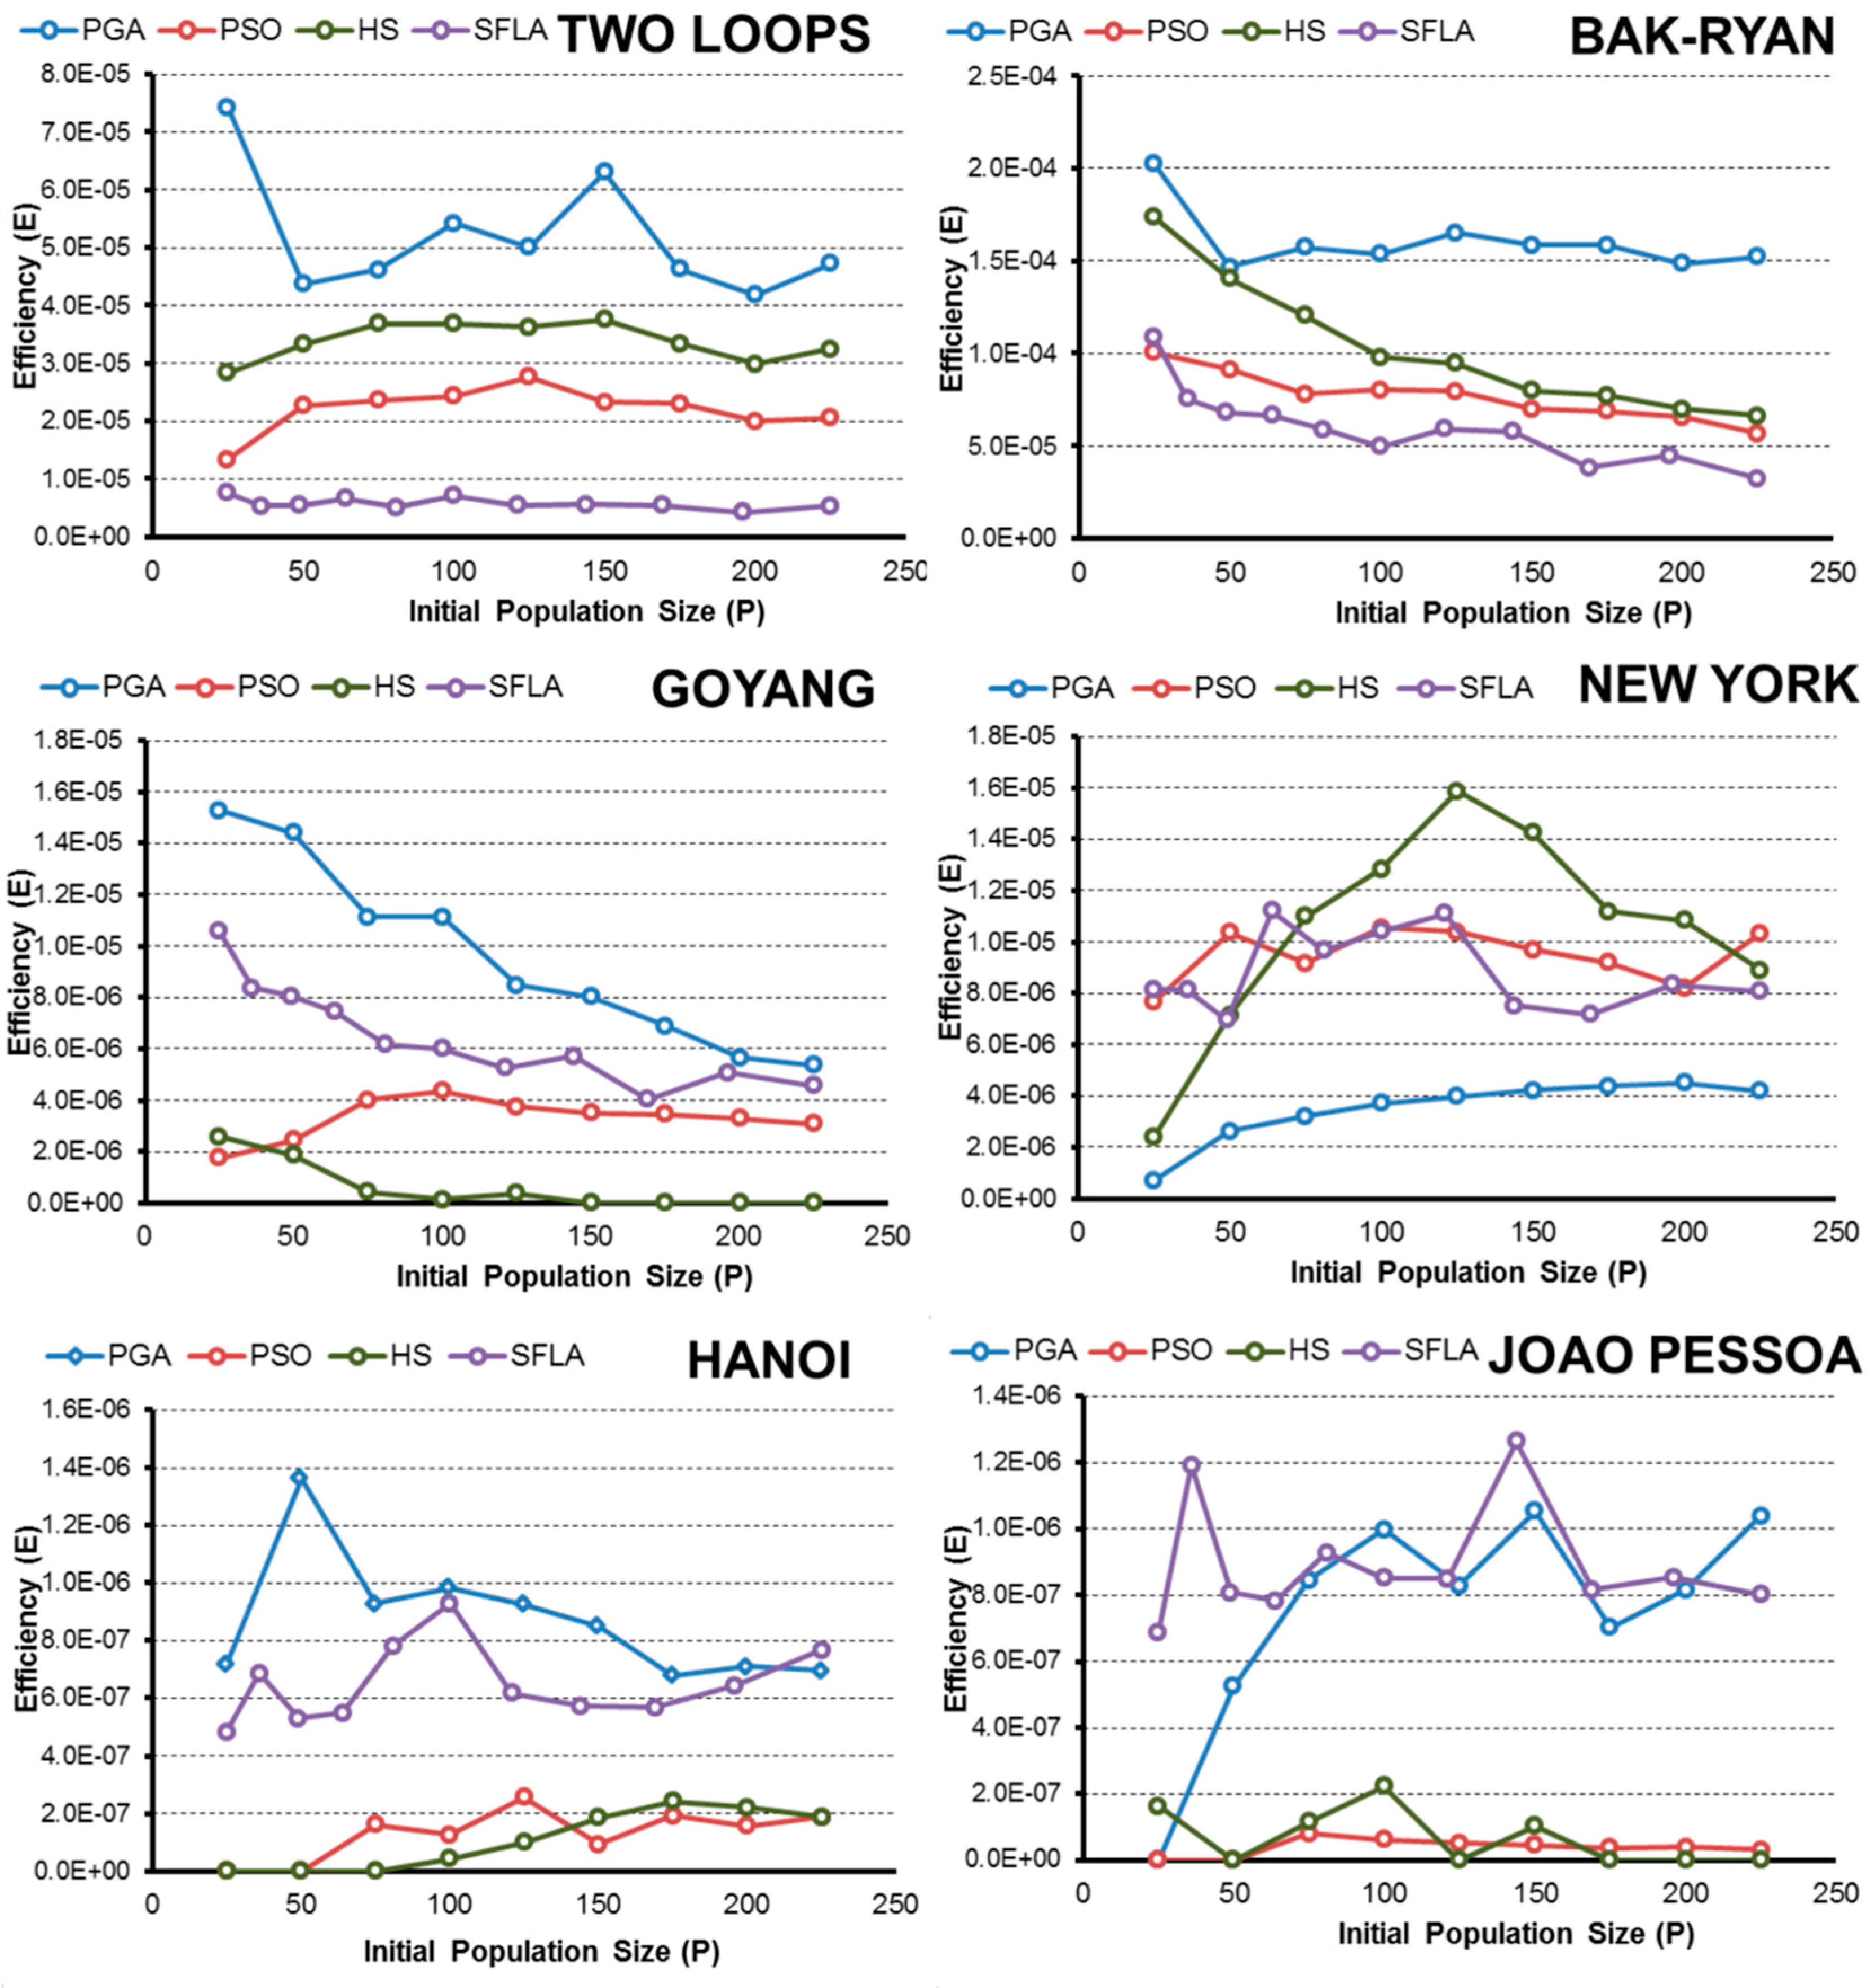
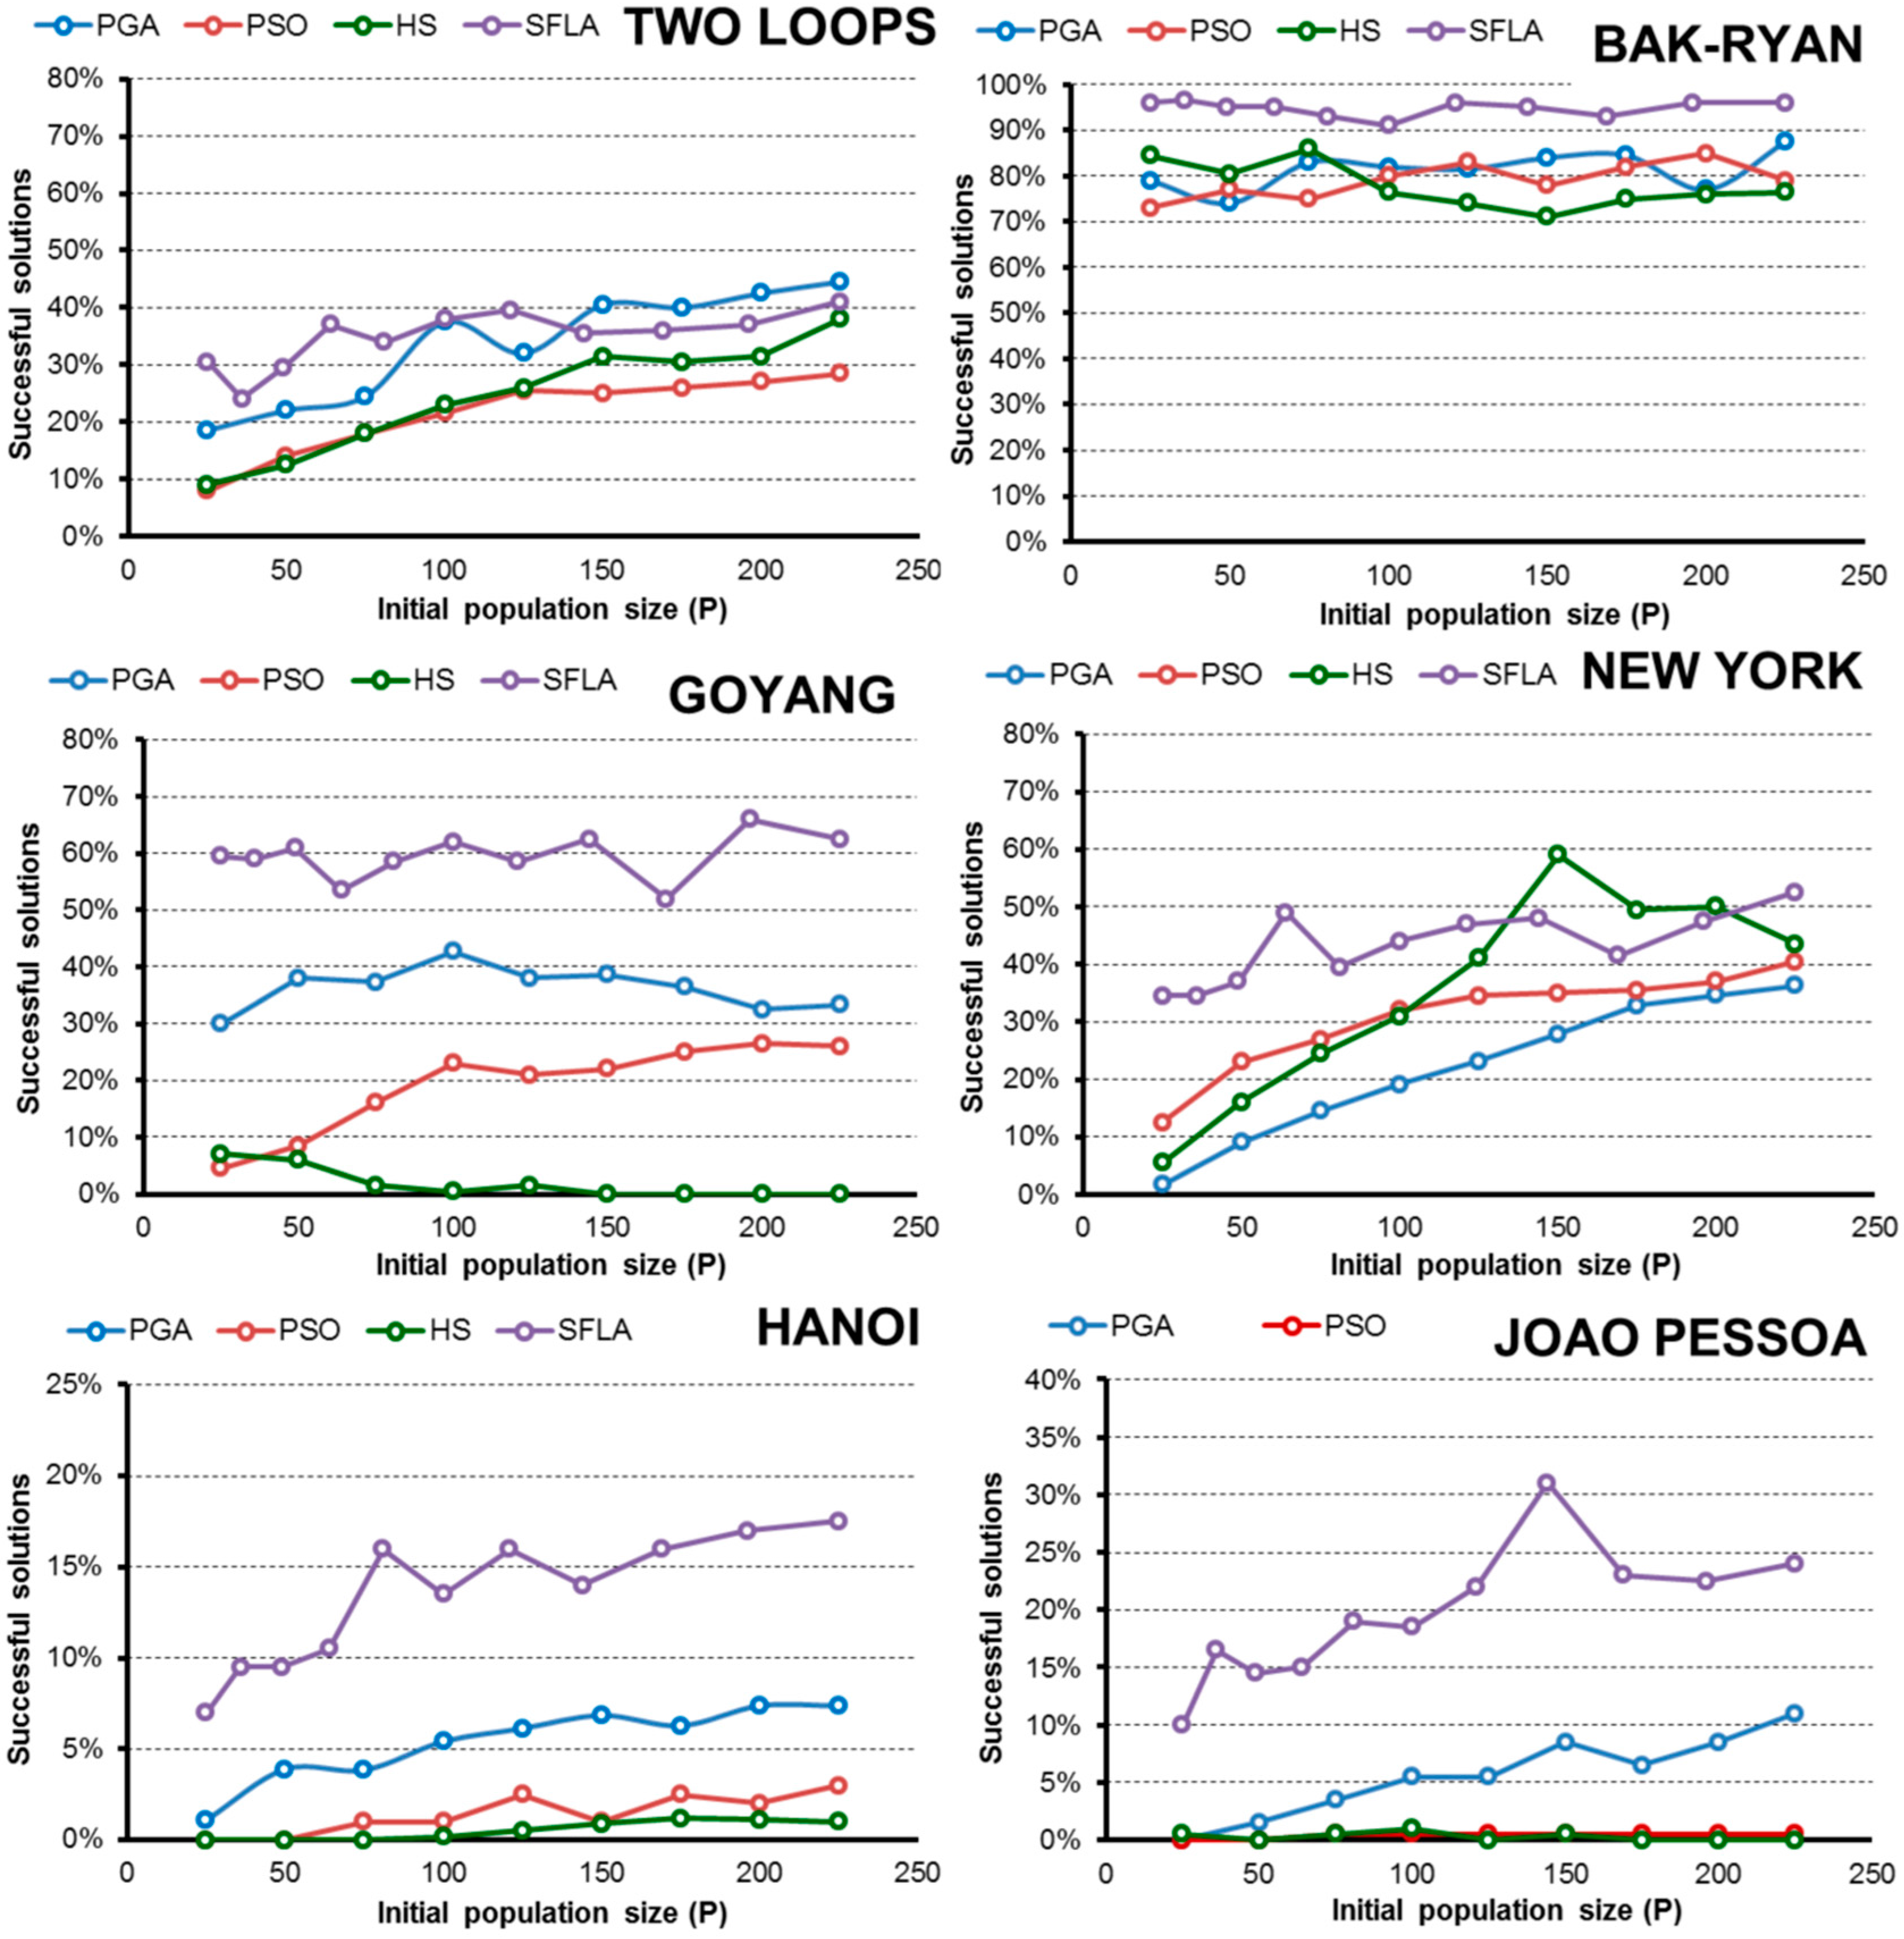
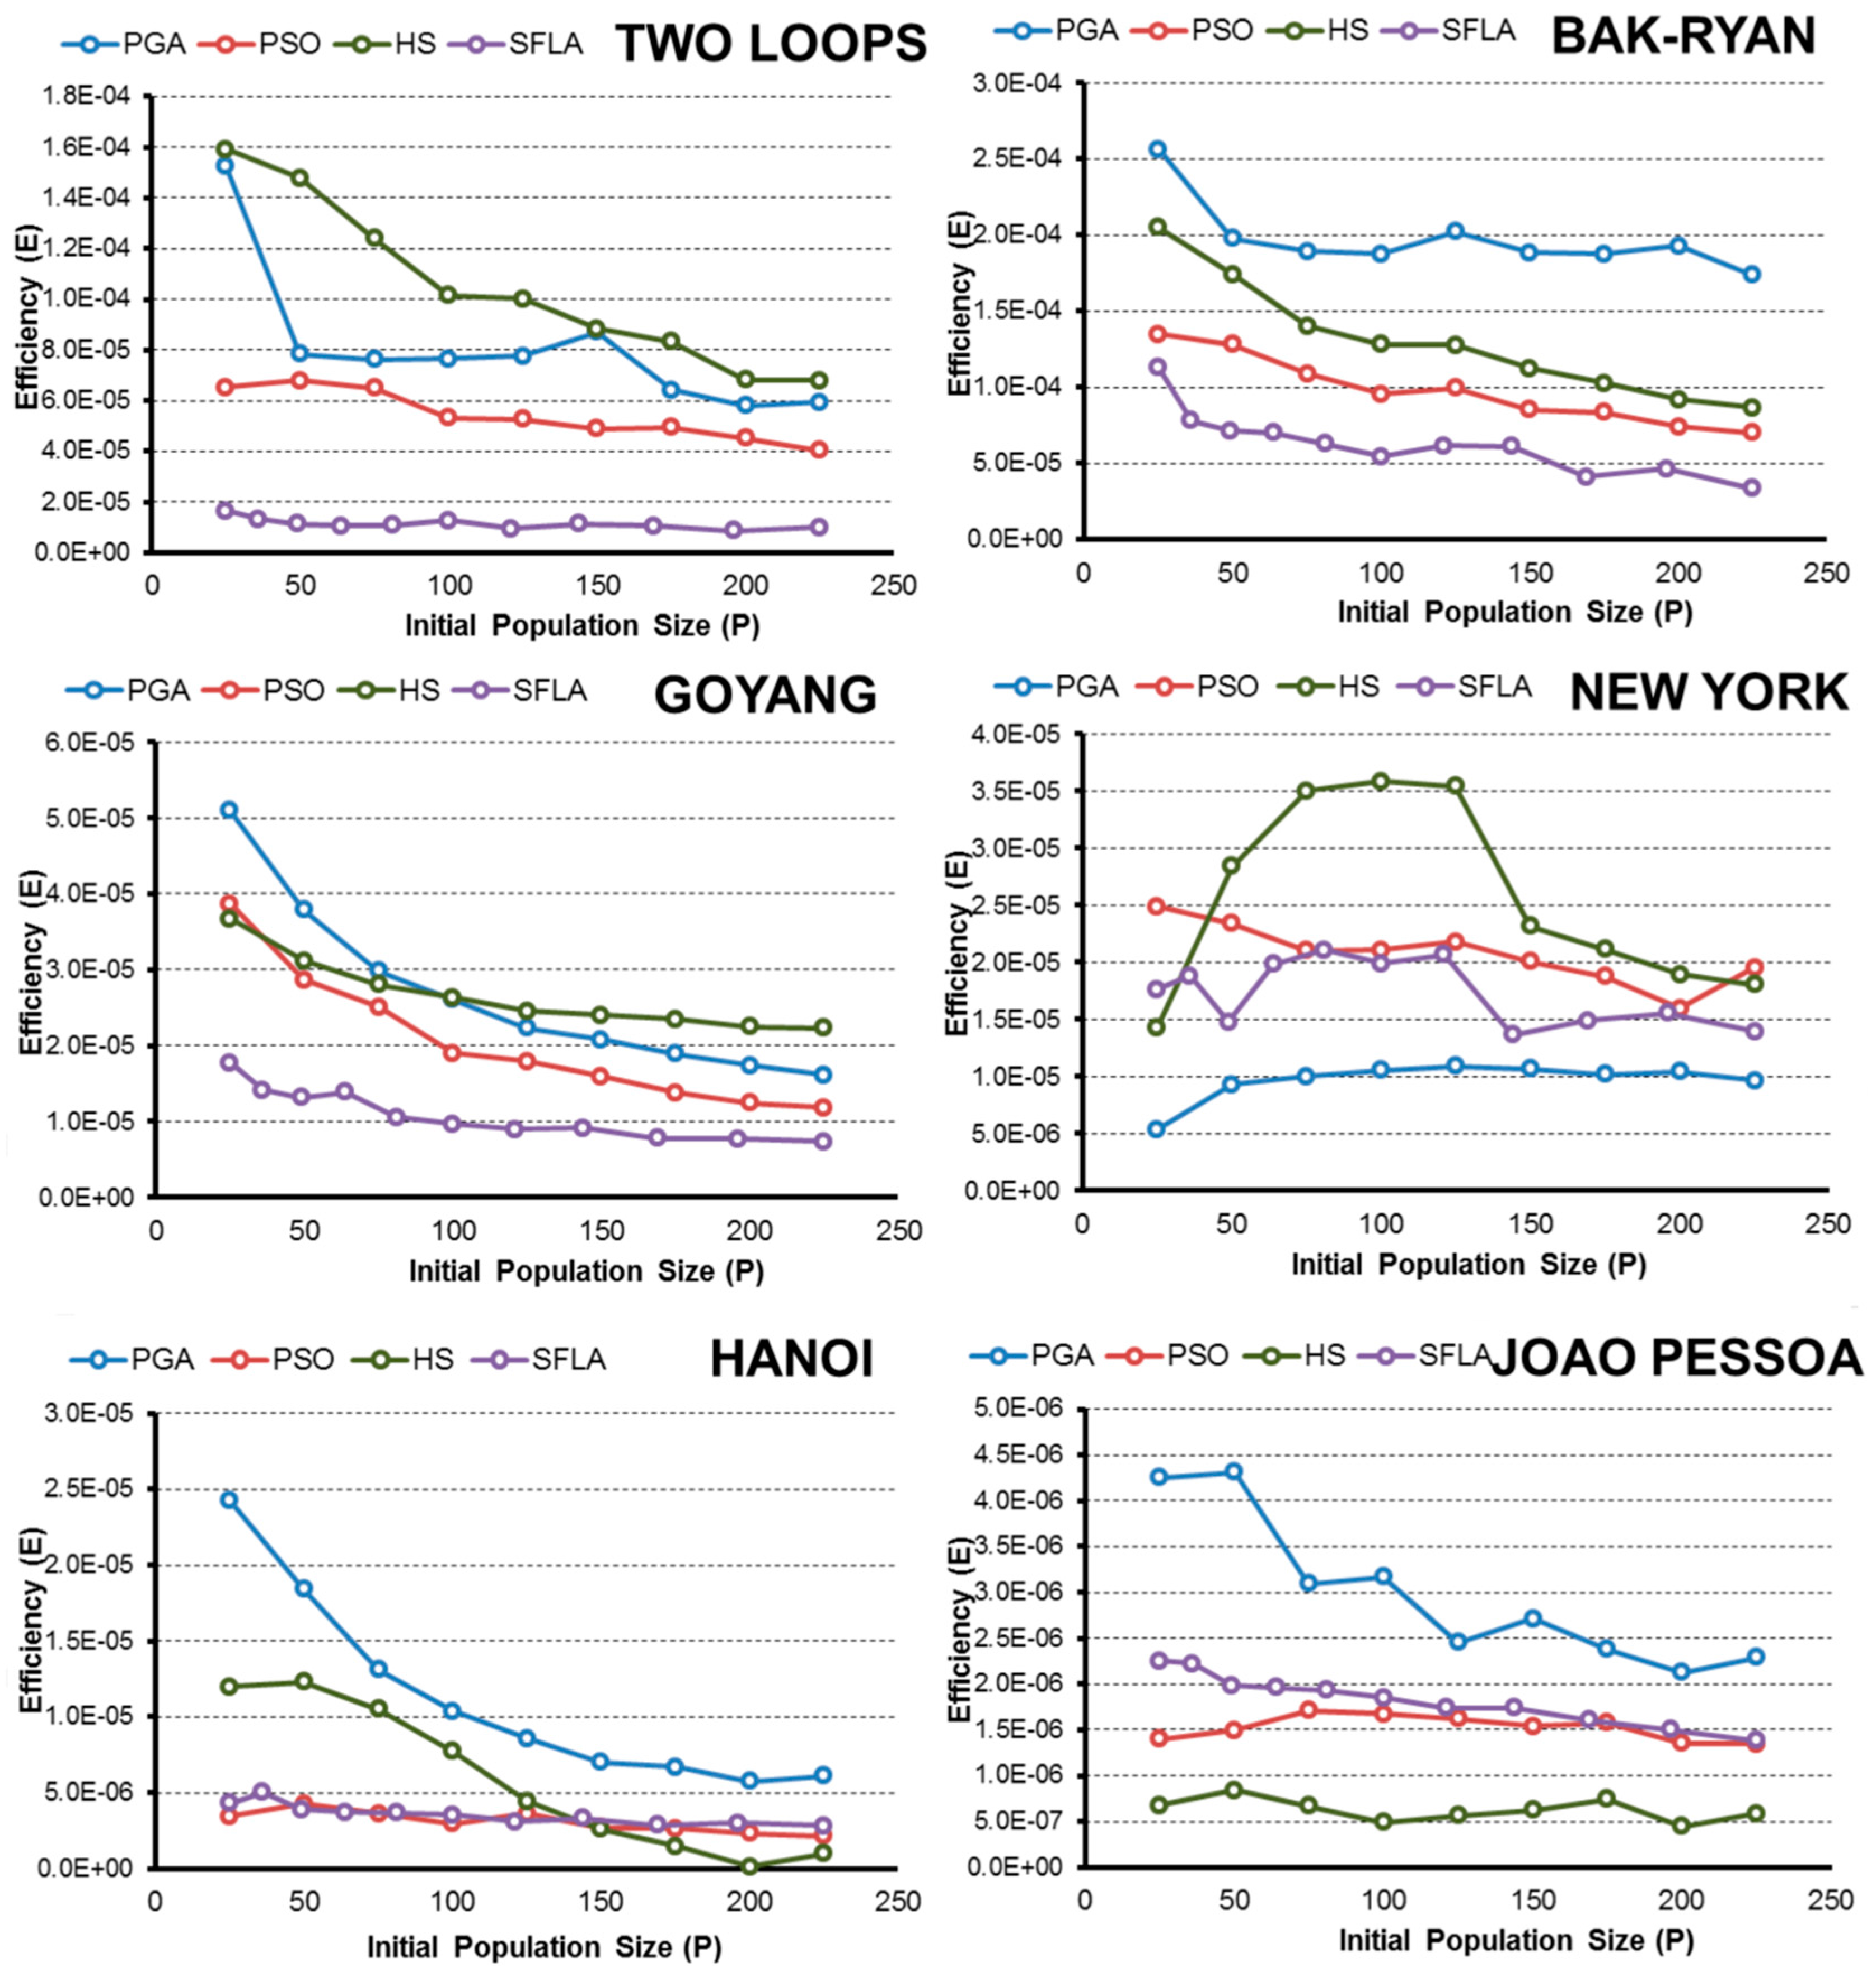
  • In terms of efficiency E and considering the complexity of the pipe-sizing problem, the PGA and SFLA are better for complex networks, such as Hanoi or Joao Pessoa, when the goal is to obtain the global minimum. These algorithms are more likely to identify the lowest-cost solution. Meanwhile, the HS and PSO algorithms hardly found global minimums, which severely decrease their efficiency.
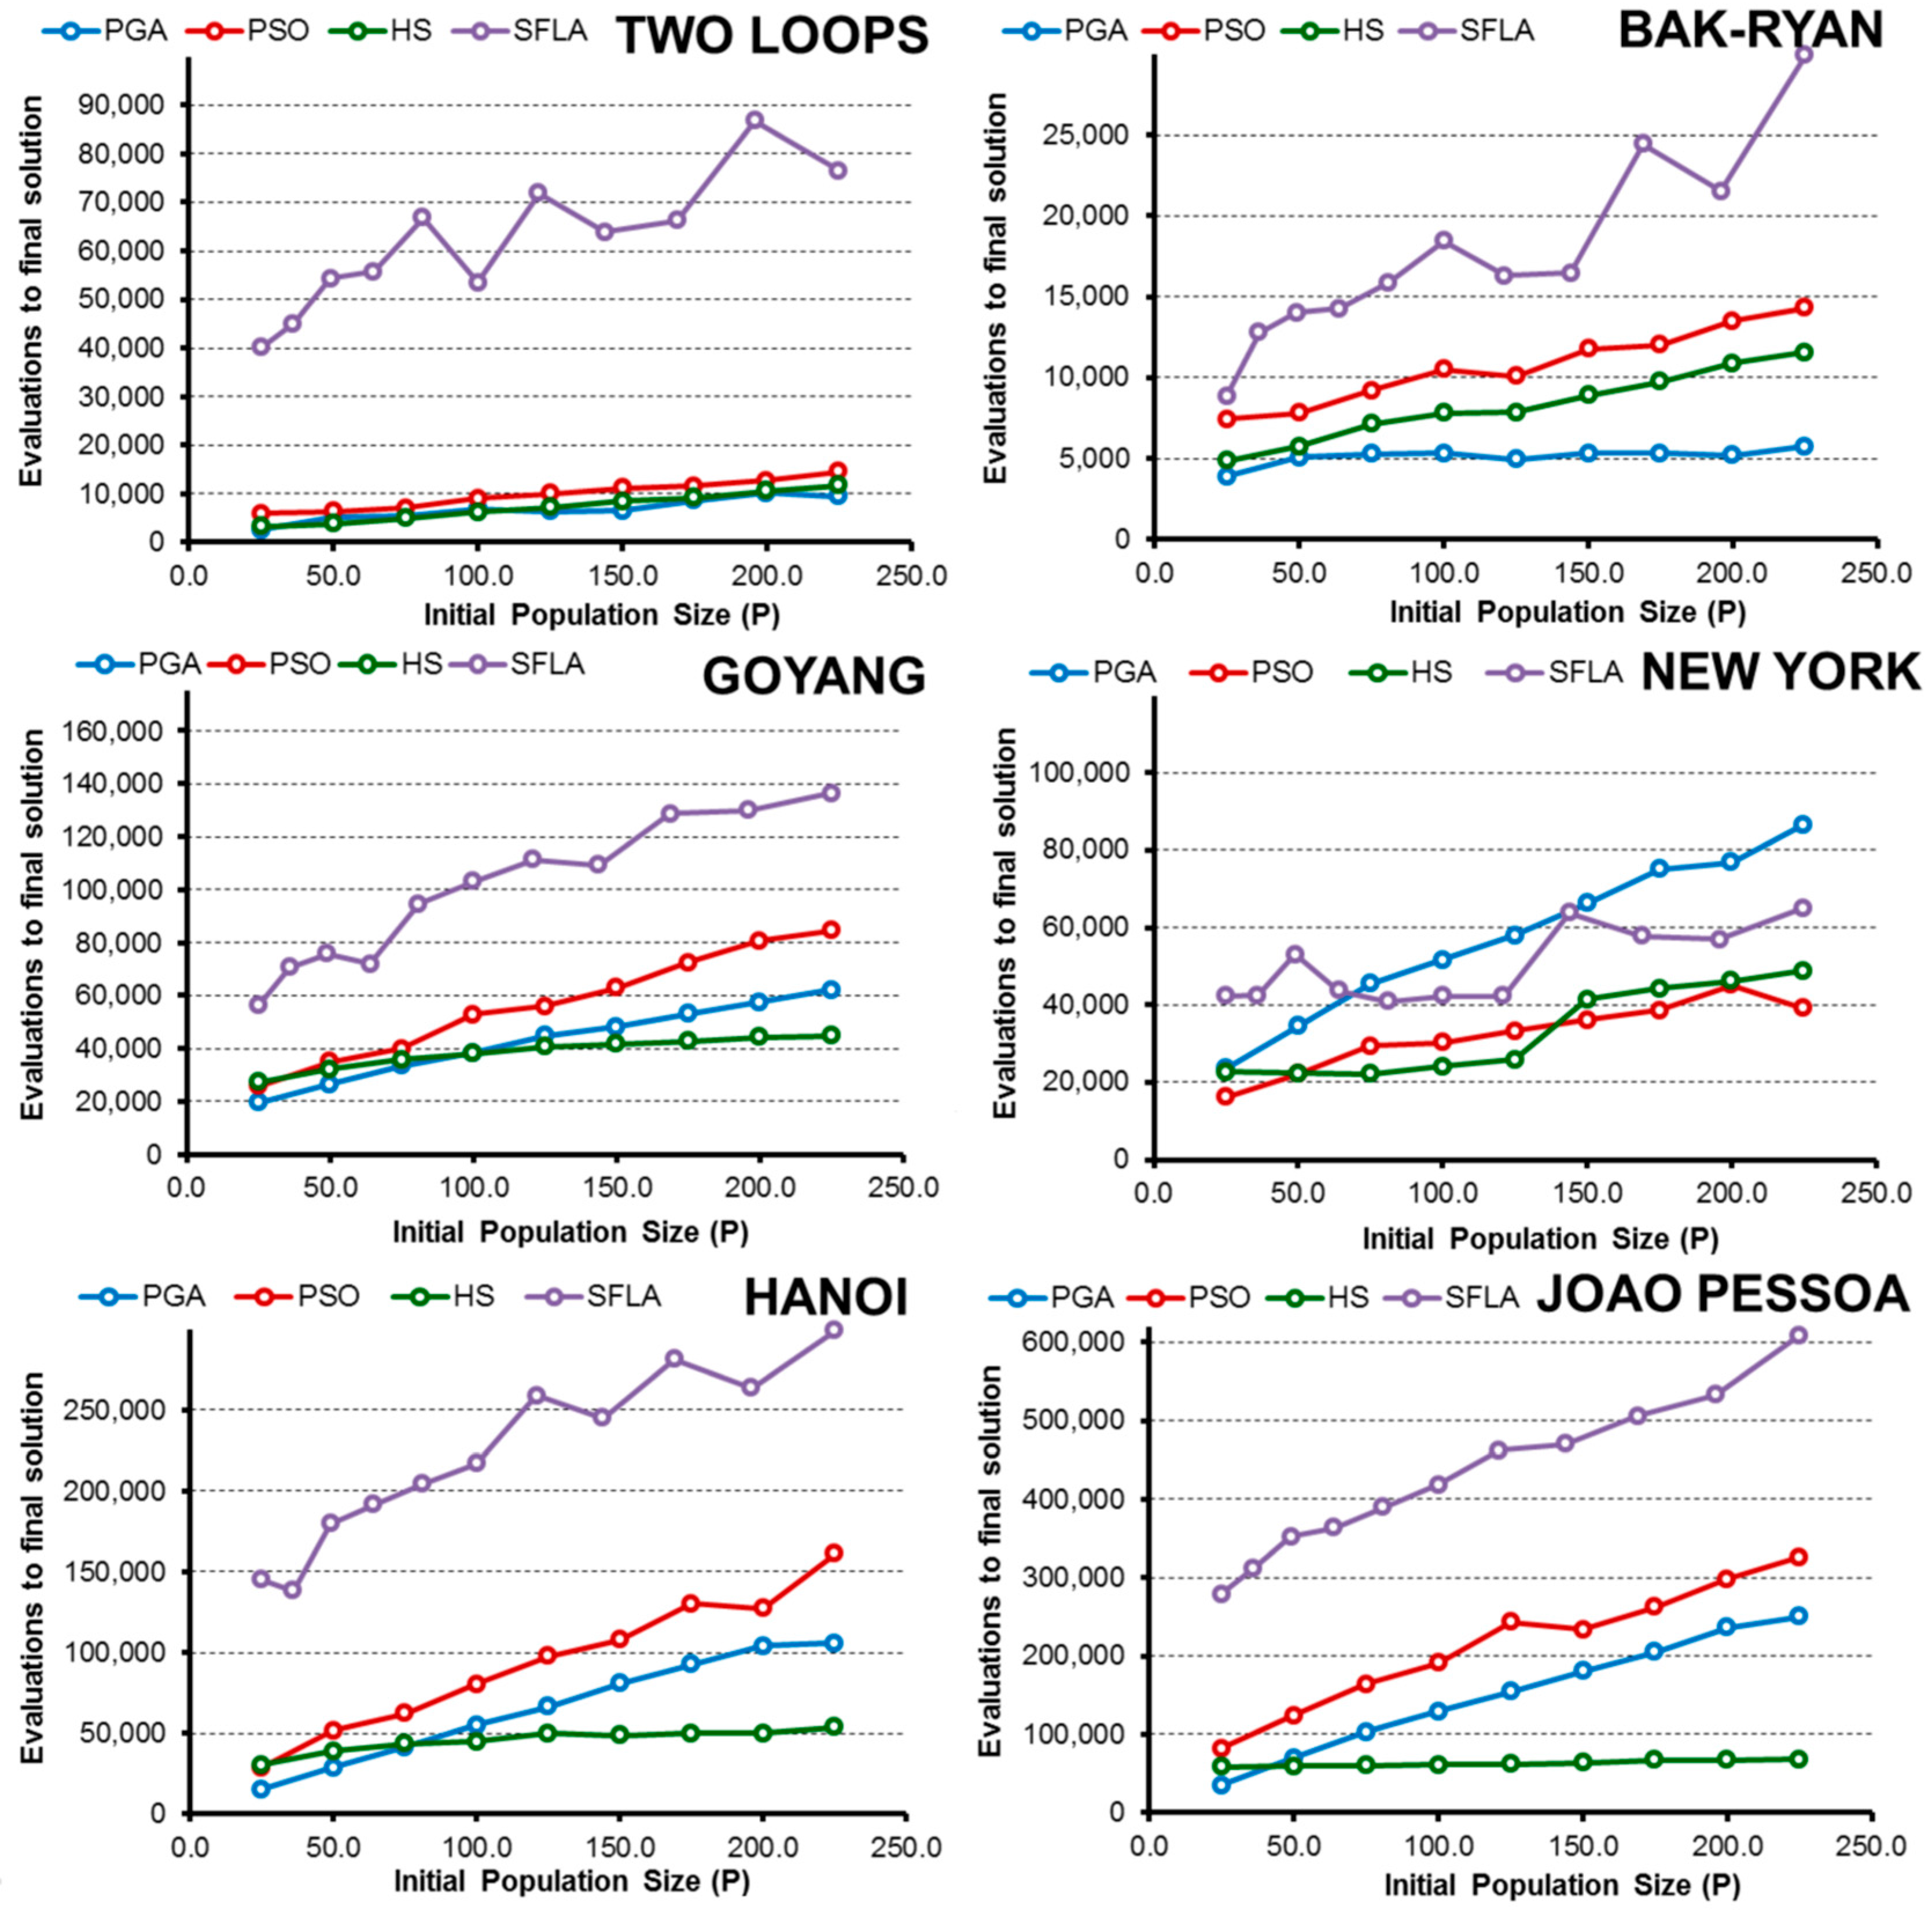
  • The HS algorithm exhibited improved performance in less complex water networks such as small problems, in which all algorithms are able to find minimal solutions easily. In addition, if we extend the range of solutions that is considered successful to include good solutions (3% above the global minimum), the HS algorithm is the best in the New York network and the second most efficient for the rest of networks (except in the Joao Pessoa network). In this case, the algorithms that require fewer OF evaluations to reach the final solution benefit, and HS is the fastest algorithm.
  • The PGA is the most robust technique for finding low-cost solutions because it has a high value of E in all networks, which is similar to the values obtained by the best algorithm in each case.
  • SFL algorithm efficiency E is close to the PGA in complex networks (Hanoi and Joao Pessoa) when the goal is to obtain the low-cost solution. However, if the optimization goal is based on obtaining “good solutions”, other techniques are better because the algorithm SFL is penalized due to the high number of evaluations of the objective function performed in the optimization process.
  • Regarding the initial random population size, normally the efficiency improves as P increases to a certain limit, beyond which the performance no longer improves or worsens. This size “limit” depends on the complexity of the problem and the problem goal, but larger populations are generally less efficient than small populations when finding a global known.
  • In addition, expanding the optimization goal to include a set of “good solutions” close to the global minimum (3% above) confirms the hypothesis, and in the range considered, the smallest population is the most efficient in almost all algorithms and networks.
  • Numerically, all algorithms exhibit their highest values of E when finding good solutions near the minimum for 25 < P < 50. To obtain low-cost solutions, the tested algorithms need larger populations (except in the simplest problems), with the highest values of E observed for approximately 75 < P < 125. These values vary slightly for each algorithm and network, but they are a good starting point, regardless of the complexity of the network in the studied cases.
Finally, the methodology proposed in this paper is simple and easily reproducible by other researchers who seek to relate the solution quality and computational effort. The results are applicable to various scenarios and allow the selection of an appropriate population size, optimizing the efficiency of the algorithm.

Acknowledgments

This study was supported by the Program Initiation into research (Project 11140128) of the Comisión Nacional de Investigación Científica y Tecnológica (Conicyt), Chile.

Author Contributions

All authors contributed extensively to the work presented in this paper. Daniel Mora-Melià contributed to the research, modelling, data analysis and manuscript writing. Jimmy H. Gutiérrez-Bahamondes contributed to the literature review and the manuscript review. Pedro L. Iglesias-Rey and F. Javier Martínez-Solano contributed to the research, modelling and manuscript review.

Conflicts of Interest

The authors declare no conflict of interest.

Abbreviations

The following abbreviations are used in this manuscript:
PbAPopulation-based algorithm
WDNwater distribution network
OFObjective Function
PGAPseudo-Genetic Algorithm
PSOParticle Swarm Optimization
SFLAShuffled Frog Leaping Algorithm
HSHarmony Search
HAWaNetHeuristic Algorithms Water Networks
NPNondeterministic, polynomial time
BMPBest Management Practice
GAGenetic Algorithm

References

  1. Yates, D.F.; Templeman, A.B.; Boffey, T.B. The computational complexity of the problem of determining least capital cost designs for water supply networks. Eng. Optim. 1984, 7, 143–155. [Google Scholar] [CrossRef]
  2. Alperovits, E.; Shamir, U. Design of optimal water distribution systems. Water Resour. Res. 1977, 13, 885–900. [Google Scholar] [CrossRef]
  3. Su, Y.; Mays, L.W.; Duan, N.; Lansey, K.E. Reliability-Based Optimization Model for Water Distribution Systems. J. Hydraul. Eng. 1987, 113, 1539–1556. [Google Scholar] [CrossRef]
  4. Haddad, O.B.; Tabari, M.M.R.; Fallah-Mehdipour, E.; Mariño, M.A. Groundwater Model Calibration by Meta-Heuristic Algorithms. Water Resour. Manag. 2013, 27, 2515–2529. [Google Scholar] [CrossRef]
  5. Ostadrahimi, L.; Mariño, M.A.; Afshar, A. Multi-reservoir Operation Rules: Multi-swarm PSO-based Optimization Approach. Water Resour. Manag. 2011, 26, 407–427. [Google Scholar] [CrossRef]
  6. Afshar, A.; Massoumi, F.; Afshar, A.; Mariño, M.A. State of the Art Review of Ant Colony Optimization Applications in Water Resource Management. Water Resour. Manag. 2015, 29, 3891–3904. [Google Scholar] [CrossRef]
  7. Artita, K.S.; Kaini, P.; Nicklow, J.W. Examining the Possibilities: Generating Alternative Watershed-Scale BMP Designs with Evolutionary Algorithms. Water Resour. Manag. 2013, 27, 3849–3863. [Google Scholar] [CrossRef]
  8. Silver, E.A. An overview of heuristic solution methods. J. Oper. Res. Soc. 2004, 55, 936–956. [Google Scholar] [CrossRef]
  9. Bäck, T.; Fogel, D.B.; Michalewics, Z. Handbook of Evolutionary Computation; Oxford University Press: Oxford, UK, 1997. [Google Scholar]
  10. Goldberg, D.E. Genetic Algorithms in Search, Optimization, and Machine Learning; Addison-Wesley Longman Publishing Co., Inc.: Boston, MA, USA, 1989. [Google Scholar]
  11. Kirkpatrick, S.; Gelatt, C.D.; Vecchi, M.P. Optimization by Simulated Annealing. Science 1983, 220, 671–680. [Google Scholar] [CrossRef] [PubMed]
  12. Glover, F. Tabu Search—Part I. ORSA J. Comput. 1989, 1, 190–206. [Google Scholar] [CrossRef]
  13. Iglesias, P.; Mora, D.; Martinez, F.; Fuertes, V.S. Study of sensitivity of the parameters of a genetic algorithm for design of water distribution networks. J. Urban Environ. Eng. 2007, 1, 61–69. [Google Scholar] [CrossRef] [Green Version]
  14. Reca, J.; Martínez, J. Genetic algorithms for the design of looped irrigation water distribution networks. Water Resour. Res. 2006, 42. [Google Scholar] [CrossRef]
  15. Baños, R.; Gil, C.; Agulleiro, J.I.; Reca, J. A Memetic Algorithm for Water Distribution Network Design. In Soft Computing in Industrial Applications; Saad, A., Dahal, K., Sarfaz, M., Roy, R., Eds.; Springer: Berlin/Heidelberg, Germany, 2007; pp. 279–289. [Google Scholar]
  16. Geem, Z. Multiobjective Optimization of Water Distribution Networks Using Fuzzy Theory and Harmony Search. Water 2015, 7, 3613–3625. [Google Scholar] [CrossRef]
  17. Geem, Z.W. Optimal cost design of water distribution networks using harmony search. Eng. Optim. 2006, 38, 259–277. [Google Scholar] [CrossRef]
  18. Eusuff, M.M.; Lansey, K.E. Optimization of Water Distribution Network Design Using the Shuffled Frog Leaping Algorithm. J. Water Resour. Plan. Manag. 2003, 129, 210–225. [Google Scholar] [CrossRef]
  19. Geem, Z.W. Particle-swarm harmony search for water network design. Eng. Optim. 2009, 41, 297–311. [Google Scholar] [CrossRef]
  20. Mora-Melia, D.; Iglesias-Rey, P.L.; Martinez-Solano, F.J.; Fuertes-Miquel, V.S. Design of Water Distribution Networks using a Pseudo-Genetic Algorithm and Sensitivity of Genetic Operators. Water Resour. Manag. 2013, 27, 4149–4162. [Google Scholar] [CrossRef]
  21. Mora-Melia, D.; Iglesias-Rey, P.; Fuertes-Miquel, V.; Martinez-Solano, F. Application of the Harmony Search Algorithm to Water Distribution Networks Design. In Proceeedings of the International Workshop on Environmental Hydraulics, IWEH09, Valencia, Spain, 29–30 October 2009; Lopez-Jimenez, P., Fuertes-Miquel, V., Iglesias-Rey, P., Lopez Patiño, G., Martinez-Solano, F., Palau-Salvador, G., Eds.; Taylor & Francis Group: Abingdon, UK, 2010. [Google Scholar]
  22. Maier, H.R.; Kapelan, Z.; Kasprzyk, J.; Kollat, J.; Matott, L.S.; Cunha, M.C.; Dandy, G.C.; Gibbs, M.S.; Keedwell, E.; Marchi, A.; et al. Evolutionary algorithms and other metaheuristics in water resources: Current status, research challenges and future directions. Environ. Model. Softw. 2014, 62, 271–299. [Google Scholar] [CrossRef] [Green Version]
  23. Zhu, K.Q.; Liu, Z. Population Diversity in Permutation-Based Genetic Algorithm; Springer: Berlin/Heidelberg, Germany, 2004; pp. 537–547. [Google Scholar]
  24. Liu, W.; Yan, F. On the population diversity control of evolutionary algorithms for production scheduling problems. In Proceedings of the IEEE Fifth International Conference on Advanced Computational Intelligence (ICACI), Nanjing, China, 18–20 October 2012; pp. 468–473.
  25. Witt, C. Population size versus runtime of a simple evolutionary algorithm. Theor. Comput. Sci. 2008, 403, 104–120. [Google Scholar] [CrossRef]
  26. Schonemann, L. The impact of population sizes and diversity on the adaptability of evolution strategies in dynamic environments. In Proceedings of the 2004 Congress on Evolutionary Computation (IEEE Cat. No.04TH8753), Portland, OR, USA, 19–23 June 2004; pp. 1270–1277.
  27. Simões, A.; Costa, E. The Influence of Population and Memory Sizes on the Evolutionary Algorithm’s Performance for Dynamic Environments; Springer: Berlin/Heidelberg, Germany, 2009; pp. 705–714. [Google Scholar]
  28. Richter, H.; Yang, S. Memory Based on Abstraction for Dynamic Fitness Functions; Springer: Berlin/Heidelberg, Germany, 2008; pp. 596–605. [Google Scholar]
  29. Wolpert, D.H.; Macready, W.G. No free lunch theorems for optimization. IEEE Trans. Evol. Comput. 1997, 1, 67–82. [Google Scholar] [CrossRef]
  30. Dandy, G.; Wilkins, A.; Rohrlach, H. A Methodology for Comparing Evolutionary Algorithms for Optimising Water Distribution Systems. In Water Distribution Systems Analysis 2010; American Society of Civil Engineers: Reston, VA, USA, 2011; pp. 786–798. [Google Scholar]
  31. Marchi, A.; Dandy, G.; Wilkins, A.; Rohrlach, H. Methodology for Comparing Evolutionary Algorithms for Optimization of Water Distribution Systems. J. Water Resour. Plan. Manag. 2014, 140, 22–31. [Google Scholar] [CrossRef]
  32. Mora-Melia, D.; Iglesias-Rey, P.L.; Martinez-Solano, F.J.; Ballesteros-Pérez, P. Efficiency of Evolutionary Algorithms in Water Network Pipe Sizing. Water Resour. Manag. 2015, 29, 4817–4831. [Google Scholar] [CrossRef]
  33. McClymont, K.; Keedwell, E.; Savic, D. An analysis of the interface between evolutionary algorithm operators and problem features for water resources problems. A case study in water distribution network design. Environ. Model. Softw. 2015, 69, 414–424. [Google Scholar] [CrossRef] [Green Version]
  34. Savic, D.A.; Walters, G.A. Genetic Algorithms for Least-Cost Design of Water Distribution Networks. J. Water Resour. Plan. Manag. 1997, 123, 67–77. [Google Scholar] [CrossRef]
  35. Kennedy, J.; Eberhart, R. Particle swarm optimization. In Proceedings of the ICNN’95—International Conference on Neural Networks, Perth, Australia, 21 November–1 December 1995; Volume 4, pp. 1942–1948.
  36. Elbeltagi, E.; Hegazy, T.; Grierson, D. A modified shuffled frog-leaping optimization algorithm: Applications to project management. Struct. Infrastruct. Eng. 2007, 3, 53–60. [Google Scholar] [CrossRef]
  37. Mora-Melia, D.; Iglesias-Rey, P.; Martínez-Solano, F.; Muñoz-Velasco, P. The Efficiency of Setting Parameters in a Modified Shuffled Frog Leaping Algorithm Applied to Optimizing Water Distribution Networks. Water 2016, 8, 182. [Google Scholar] [CrossRef]
  38. Eiben, A.E.; Hinterding, R.; Michalewicz, Z. Parameter control in evolutionary algorithms. IEEE Trans. Evol. Comput. 1999, 3, 124–141. [Google Scholar] [CrossRef]
  39. Mora-Melia, D.; Iglesias-Rey, P.; Fuertes-Miquel, V.; Martinez-Solano, F. Comparison of Evolutionary Algorithms for Design of Sewer Systems; Lopez-Jimenez, P., Fuertes-Miquel, V., Iglesias-Rey, P., Lopez Patiño, G., Martinez-Solano, F., Palau-Salvador, G., Eds.; Taylor & Francis Group: Abingdon, UK, 2010; Volume 1. [Google Scholar]
  40. Rossman, L.A. EPANET 2.0 User’s Manual; EPA/600/R-00/057, Water Supply and Water Resources Div.; National Risk Management Research Laboratory: Cincinnatti, OH, USA, 2000. [Google Scholar]
  41. Wang, Q.; Guidolin, M.; Savic, D.; Kapelan, Z. Two-Objective Design of Benchmark Problems of a Water Distribution System via MOEAs: Towards the Best-Known Approximation of the True Pareto Front. J. Water Resour. Plan. Manag. 2015, 141, 04014060. [Google Scholar] [CrossRef] [Green Version]
  42. Fujiwara, O.; Khang, D.B. A two-phase decomposition method for optimal design of looped water distribution networks. Water Resour. Res. 1990, 26, 539–549. [Google Scholar] [CrossRef]
  43. Schaake, J.; Lai, F.H. Linear Programming and Dynamic Programming Application to Water Distribution Network Design; M.I.T. Hydrodynamics Laboratory, Ed.; M.I.T. Hydrodynamics Laboratory: Cambridge, MA, USA, 1969. [Google Scholar]
  44. Kim, J.H.; Kim, T.G.; Kim, J.H.; Yoon, Y.N. A study on the pipe network system design using non-linear programming. J. Korean Water Resour. Assoc. 1994, 27, 59–67. [Google Scholar]
  45. Gomes, H.; de Tarso Marques Bezerra, S.; de Carvalho, P.S.O.; Salvino, M.M. Optimal dimensioning model of water distribution systems. Water SA 2009, 35, 421–431. [Google Scholar] [CrossRef]
Figure 1. Low-cost solution rate of each network and algorithm based on initial population size P.
Water 08 00583 g001
Figure 2. Number of Objective Function evaluations based on initial population size P.
Water 08 00583 g002
Figure 3. Efficiency of Population-based algorithms in obtaining low-cost solutions in the four selected networks.
Water 08 00583 g003
Figure 4. Efficiency of Population-based algorithms in obtaining “good solutions” for the four selected networks.
Water 08 00583 g004
Table 1. Optimal specific parameter calibration for the considered networks.
Algorithm/NetworkTwo LoopsBak-RyanHanoiJoao PessoaNew YorkGoYang
PGA
Pc10%–90%10%–90%10%–90%10%–90%>60%10%–90%
* Pm4%3%3%2%4%3%
PSO
* Vlim10%10%20%20%30%10%
* Pconf10%–20%10%–20%10%–20%10%–20%10%10%–20%
C1222222
C2222222
HS
* HMCR90%90%95%95%90%90%
* PAR15%15%10%10%15%15%
SFLA
* C222221.5
Q50%50%50%50%50%50%
Ns303030303030
Notes: * More sensitive specific parameters that affect algorithm performance.
Table 2. Main characteristics of selected benchmark problems and solution dispersion.
NetworkNumber of PipesNumber of Possible DiametersSearch SpaceMinimum Pressure Requirements (mca)Best Known Solution ($)Number of Different Solutions
Two Loops8141.48 × 10930419,00060
BakRyan9112.36 × 10915903,62010
New York21161.93 × 10253038.642 × 1062163
GoYang3081.24 × 102715177.010 × 106 a303
Hanoi34142.87 × 1026306.081 × 1065553
Joao Pessoa72101 × 107215192.366 × 10616,101
Note: a Cost in won (1,000 won ≈ 1 US$).
Table 3. Optimal initial random population size P calibration for the considered networks.
Algorithm/NetworkTwo LoopsBakRyanHanoiJoao PessoaNew YorkGoYang
Pseudo-Genetic algorithm (PGA)
Low cost solution2525P = 50P = 100P = 100P = 25
Good solution (3% above)2525P = 25P = 25–50P = 50P = 25
Particle Swarm Optimization algorithm (PSO)
Low cost solution12525P = 125P = 75P = 50P = 75
Good solution (3% above)2525P = 50P = 75P = 25P = 25
Harmony Search algorithm (HS)
Low cost solution7525P = 175P = 100P = 125P = 25
Good solution (3% above)2525P = 25–50P = 50P = 75P = 25
Shuffled Frog Leaping algorithm (SFLA)
Low cost solution2525P = 100P = 150P = 75P = 25
Good solution (3% above)2525P = 25P = 25P = 75P = 25

