1. Introduction
In several countries, statistical evidence shows a decline in the quantity and quality of water resources in recent years, accompanied by increasing concern for future availability [
1,
2,
3,
4,
5]. Adverse climate change impacts, population growth, and increased food demands are causing tensions and competition for water resources. These pressures on water resources are leading many countries to (re)think their water policies in order to improve water use efficiency [
4,
6,
7,
8,
9,
10,
11].
To achieve water efficiency in the agricultural sector, new technologies and best practices need to be adopted [
12,
13,
14]. The reform of water pricing policy is considered to be one of the relevant instruments available for the improvement of water use efficiency. In many countries, pricing systems for irrigation water have been improved in recent years, as new water contracts have replaced older tariff systems that were designed at a time when water was less scarce, or when there was lower awareness of the issue of water conservation. Yet, there are noteworthy disparities among and within countries with regard to irrigation water prices and pricing systems, and consequently in the ways in which irrigation water is used [
15,
16].
In the European Water Framework Directive 2000/60/EC (WFD), the main reference framework for water management in the European Union (EU), the use of water pricing as an instrument for reducing water use and water pollution is strongly recommended, and volumetric pricing is suggested to provide incentives for the proper use of water. Furthermore, WFD encourages pricing policies as an effective device for water demand management [
5,
11,
14,
15,
17,
18,
19]. In addition, the European Commission’s Blueprint highlights the role of water pricing and continuing enforcement actions to ensure compliance with Article 9 and to improve water efficiency in Europe [
20].
Water policy also involves the creation, operation, and maintenance of infrastructures and the implementation of water services. Related water charging must meet economic, environmental, and social objectives. A major challenge, therefore, is designing pricing mechanisms that reflect an appropriate balance among competing objectives, taking into account at the same time the cost and demand structure [
9,
21].
Water pricing design for irrigation constitutes a unique challenge for the scientific community, and in recent decades numerous studies have been conducted worldwide to analyse pricing policies for this sector. The pricing methods used for irrigation water are: volumetric pricing, non-volumetric pricing, and market based pricing [
6,
9,
11,
15,
22,
23]. For each of these groups a variety of specific mechanisms can be used in practice. For example, volumetric prices may be designed as either linear or block tariffs. Non-volumetric pricing, largely relying on area-based tariffs, is by far the most widely used in agriculture. Yet combinations are also frequent, for example, area-based combined with volumetric pricing components.
The need for water pricing reforms is greater in countries that have recently witnessed stronger institutional change and major regulatory instability, such as Albania. Albania is a country of contrasts in terms of water issues. It is blessed with plentiful water resources, but due to the lack of maintenance and poor management of irrigation infrastructure, and lack of an appropriate monitoring system, the needs for irrigation are currently not met in time and quantity. As a result, the efficiency of water use for agriculture, industry, and public use remains low. In particular, the country is affected by end-of-pipe water scarcity due to an obsolete distribution system, significant water loss, and poor water use efficiency [
24,
25].
In this context, compliance with EU legislation and the WFD is becoming a major concern, as it constitutes an important condition for Albania’s accession to the EU. Compliance with the WFD has not yet been met and efforts are needed in this direction in the near future [
16].
With regard to the water-using sectors in Albania, in recent decades the country has experienced a decline in the irrigation sector due to unfavourable socio-economic conditions and stagnating agricultural markets. At present, the actual state of irrigation is difficult to assess due to data limitations. Findings show, for example, that the irrigated area is higher than the area reported. In addition, Water User Associations (WUAs) must mediate between dealing with cost recovery issues and providing a more equitable and efficient distribution of available irrigation water [
25].
As it is the case in many countries, the key issue in reforming water pricing in Albania is the fact that most water used is unmetered.
The objective of this study is to design an efficient (social welfare maximizing) pricing scheme in conditions of unmetered water, using empirical information from a region in Albania. This objective was reached by using a mechanism design approach that makes it possible to identify a menu of contracts discriminating among farmers and is implemented assuming that the WUA seeks to motivate farmers to use the optimal amount of water in a context of asymmetric information.
The main originality of the study rests in combining a rather recent and unexplored field of investigation (asymmetric information in water pricing) and a context (Albania) in which water use is still insufficiently investigated. As such, the study is intended to be exploratory in nature, and hence suitable to prepare the background for further applications and improved modelling approaches in other areas with similar conditions.
The paper is divided into six sections.
Section 2 describes the approach and method used, as well as the selected model.
Section 3 outlines the case study and presents an overview of the current situation with regard to irrigation in a selected area of Albania and the country as a whole.
Section 4 presents the implementation of the model, data analysis, and the identification of a menu of contracts under asymmetric information.
Section 5 provides the results, and
Section 6 offers both a discussion and conclusions highlighting how contract theory provides meaningful guidelines for reforming the water charging system.
2. Materials and Methods
This research considers a menu of contracts for water charging in an irrigated area. The menu of contracts was compared with flat rate payments, since the flat rate payment is, at present, the only scheme being implemented in the case study area. The menu of contracts is described in the form of a first and a second best solution, in order to consider both the best feasible case (second best) and the best theoretical solution in case of perfect information. The method is based on the application of a menu of contracts as an instrument for the assessment of possible improvements in water pricing in conditions of asymmetric information regarding water use by farmers, and follows the method implemented by a recent paper [
19].
In order to identify the optimal contract scheme, a mechanism design approach was implemented. The purpose of this approach was to identify the appropriate design for a menu of contracts identified by a payment
and a share of irrigated area
(related to water use) that is able to provide incentives towards (more) efficient water use. On the contrary, in the flat rate case, the payment is determined by the irrigable area and the farmer decides how much land to irrigate independent from the payment [
19].
Though rather simplified in this application, the model represents, in essence, a theoretical approach to understanding contractual relationships between the principal and the agent in the case of water resources. The principal is the person who delegates tasks or the party who offers the contract to the agent. The agent is the person who can either take the contract, to perform a task on behalf of the principal or having implications for the principal’s objective function, or leave it.
In our context, asymmetric information is a situation in which different knowledge related to water consumption could favour one party as opposed to another. Under perfect information, the regulator knows all the needed information and can set the optimal water quota for each farmer (and set the related price individually). Under asymmetric information, the regulator does not have all of the required information about the farm that would allow this [
7,
10,
13,
19,
21,
26].
Asymmetric information can appear in three forms: as moral hazard, when the agent can take an action unobserved by the principal; adverse selection when the agent has some private knowledge about his cost and/or benefit that is unknown to the principal; and no verifiability, which occurs when the principal and agent share, ex post, the same information, but by law no third party can observe this information [
27,
28]. In the case studied in this paper, asymmetric information is considered in the form of adverse selection only.
A menu of contracts is created as the combination of a payment with respect to allowed share of irrigated area qi. By setting the menu, the regulator has the objective to maximize the social benefit z(qi) represented by the sum over i farm’s profit minus the cost of water provision as defined in Equation (1), and with i = 1, … n representing the different farm types. Without loss of generality, it is assumed a Leontief technology for all the production factors concurring in generating the farms profit and this is expressed as a function of the share of irrigated area qi for each farm type i. A farms’ profits are calculated considering all costs except for the payment for irrigation water. The cost is given by . is the farm’s water use function and c is the unit cost of water given in €/m3 and assumed as not changing with the amount of water used. The total cost of water is dependent on the estimated amount of water demand by each farm type (m3/ha) and is given in unitary terms €/ha.
The regulator is also assumed to have the obligation of cost recovery, which means that the payments (either
p or
pi) need to cover the cost of water provision. Cost recovery can be achieved by individual farms in the case of full information (first best), while it can be achieved only on the aggregate in case of asymmetric information. The concept of full cost recovery in its wider form is better tackled by [
29,
30].
The farm’s net profit is achieved as the difference between the farm’s profit and the associated payment (pi) for water provision. The payment can, in fact, be either a flat rate, homogenous across farms (p), or differentiated by farm (pi). We assume homogenous farm size equal to 1, for simplification and without loss of generality.
Assuming the first best conditions (full information), the water regulator seeks to set the water price in such a way as to maximize social benefit (as given in Equation (1) below), subject to the cost recovery constraints provided in Equation (2).
The best result from a social point of view is achieved where the conditions of Equation (3) are met:
This is the first best solution corresponding to the level of the share of irrigated area for which the marginal profit equalizes the marginal cost of water for society. Equation (2) specifies that the full cost recovery principle of the WFD must be met by society as a whole and also by individual farms. In the problem, Equation (2) is satisfied with strict equality as there is no reason to increase the price of water above the supply costs for society. Equation (3) defines the optimal share of irrigated area for each farm type .
It is worth noting that if metering had been possible, the same result would have been achieved by imposing a volumetric charge equal to
c and this would have corresponded to the marginal profit of water use (expressing both water and profit as a function of the share of irrigated area being irrigated):
The opposite situation is given by the flat rate payment, in which the regulator cannot impose the share of irrigated area, but only ask for a flat payment
p per unit of irrigable area. Each farmer contributing for the provision of water with a flat rate payment will choose to irrigate a share of area that will allow him to maximize profits:
The maximization problem of Equation (5) with respect to the share of irrigated area
leads to the optimal level of irrigated area, which is the level for which marginal profits equal zero:
The level of the flat rate payment does not affect farm choices, as farmers irrigate the same share of irrigated area regardless of the level of the tariff. On the other hand, the optimal share of irrigated area is different across farms depending on the farm’s i profit function.
The level of social benefits achieved will be given by Equation (1), with
, while the optimal level of the payment will be derived by the total cost:
If the price of water is greater than zero, , then, the share of irrigated area under the flat rate scenario will be greater than the share of irrigated area under the first best pricing scenario (i.e., for all farms). The total social benefit will be lower than in the first best scenario, as the share of irrigated area will be higher than the social optimum. The total amount of payments, on the contrary, will be higher, as the overall amount of water used is higher. The payment for individual farmers may be lower or higher than in the first best scenario depending on whether the individual farm is below or above the average water consumption.
We now turn to the third option, which assumes that the water provider does not have complete information about each farm type. More specifically, the provider knows the existing farm types, but is unable to observe each farm type, which could give an incentive for farmers to misrepresent themselves. Under these conditions, the principal cannot assign the optimal contract type to each farm. However, it can still design a menu of contracts that would induce farmers to reveal their type through the choice of the contract. This, however, can entail an information rent for some farmers.
The problem can be now represented as a maximization of Equation (1), subject to the following constraints:
The participation constraint PCi guarantees that it is not possible to ask farmers for more money than the profit generated from the water provided. The incentive constraint ICi guarantees that each farmer will have an incentive to choose the type of contract that is designed for him when profit minus cost of water for farm type i is higher than the profit of farm type which uses the share of irrigated area and pays the price for water as another farm type that is different from i, (i.e., ). Finally, the Full Cost Recovery FCRi constraint guarantees that the cost of water provision is completely paid by each farm type, since the price of water for farm type i should be higher or equal to the cost of water used, taking into account the water use expressed as a function of . Full cost recovery in this paper assumes that the WUA is seeking to recover operation and maintenance costs for supplying water to the irrigation network. The total cost of water is dependent on the estimated amount of water demand for each farm type (m3/ha). Typical operation and maintenance (O&M) costs in the region include payment to water masters to clean and maintain the secondary canals, as well as the managing and distribution of water to tertiary canals to facilitate the withdrawal by farmers. The cost of investment and the primary canals to divert water are not under the WUA responsibility and are not considered in this paper. The state provides assistance to cover the investment and maintenance of primary canals and the diverting water from reservoir to irrigation network.
The maximization problem above, expressing the formulation of the menu of contracts under asymmetric information, does not imply a consistent theoretical solution unless rather restrictive hypotheses are imposed. In our case, we leave to the empirical application to identify the numerical solution able to modulate the payment and share of irrigated area in such a way as to render the farmer indifferent to his or her contract type and to mimicking others. Further illustration is provided in the results section. The above-illustrated models were implemented using GAMS (General Algebraic Modelling System), well know optimization software.
3. The Case Study
Community irrigation management has a long tradition in Albania. Yet during the centralized socialist system from 1945 to 1990, everything formally belonged to the state. It is worth noting that during this period the country invested heavily in irrigation, drainage, reclamation, and land improvement projects, hence increasing the irrigated area to about 50% of the total agricultural land. The post-communist period was characterised by the dismantlement of the previous system and an increase in farmers’ distrust toward the central government. At this time, land privatization started rapidly in Albania; the result of which was the creation of more than 400,000 small farms with an average size of about 1.4 ha [
24].
After 1991 the irrigation network was shattered almost everywhere in the country, and a huge share of firmly irrigated land became non-irrigated due to the destruction of many channels and water distribution systems. The small private farms with insufficient land in many cases have fundamentally changed the character of agriculture, and the role of irrigation and their needs with respect to irrigation have not been clearly communicated. Therefore, the Water Enterprises were not able to better classify irrigated and non-irrigated area and likely failed to distribute water to a relevant share of small farms. The Government of Albania adopted the policy to transfer the operational responsibilities of secondary irrigation canals to water users through Water Users Associations (WUAs), with the operation and maintenance of the primary canals and irrigation reservoirs under the responsibility of the state-owned Water Enterprises.
The establishment of WUAs was in accordance with Law No. 9860 of 2008, later amended and supplemented by Law No. 8518 of 1999 regulating irrigation and drainage. This law establishes a legal framework for creating and operating associations of water users. Moreover, the law defines the structure and organisation of these associations.
The WUA are unions of farmers, operating and maintaining the irrigation distribution facilities transferred to them for this use, and were expected to improve the cost recovery process and develop a more effective water payment system in the long run. The WUAs are responsible for distributing water among their members and collecting water charges; farmers in the area pay for irrigation water provided by a WUA.
The WUA of Çukas, located in the Commune of Lushnja, in central Albania, was selected for the case study and is used as a prototype to discuss the operational methods for improving the performance of irrigation water charges throughout the country. The WUA covers a total area of 5630 ha, out of which the irrigated area accounts for 4405 ha and there are 3218 farmers. The main cultivated crops are: winter wheat, maize, alfalfa, vegetables, beans, greenhouse vegetables, and grapes. The area has an abundance of water, most of which is from open canals, while in recent years additional infrastructures have begun to use pressurized pipes. Even though the water regimes differ, the entire area is characterised by a flat rate pricing system.
The application of water tariffs is uncomplicated, but collection and water management is not without challenges. The water payments are based on the area of land irrigated, independent of the amount of water used, and are set as a flat rate water tariff in ALL/ha (ALL is Albanian currency, which in Albanian is called LEK), (i.e., farmers also pay a yearly fee independent from irrigated area for maintenance of irrigation and the drainage system). Payments are usually made in advance such that water provider can estimate the overall irrigated area as farmers pay and subscribe for irrigated hectare (there are cases in which they do not pay, but irrigate during the season, this could constitute another topic for research and discussion). Accordingly, by receiving payments in advance they are not able to link the water payments with demand and cannot modulate advance payments with water consumption in the season. Water providers estimate only the irrigated hectares and know the crop cultivation in area during the irrigation season. Moreover, there is a conflict between upstream and downstream irrigators in the region, and for this reason, downstream farmers may lack water for irrigation in the peak period.
Given this situation, and knowing that water is unmetered in the case study, for simplicity, we considered the payment method as a fixed payment (flat rate) for the irrigated area. In such circumstances, it was not possible to suggest water payments based on water metering. Accordingly, we propose a scheme based on a menu of contracts so as to link the water payments with corresponding water consumed for the share of irrigated area.
4. Model Implementation
The implementation of the above-mentioned models require several different farm types to be taken into consideration. In
Table 1 we present four farm types and illustrate the category that each type belongs to in terms of total land for each type, number of farmers in each type, available land, agricultural land, and the average farm size. According to the data collected through interviews with members of the WUA, we were able to identify the number of different cultivated crops in very fragmented plots, provided as a percentage with respect to the overall cultivated area within the type. Moreover, the level of water consumption of specific cultivated crops was identified for each type and the agricultural production value of each crop for each farm type (quantity produced multiplied by the market price of the product). The farms’ profits shown in the table represent the difference of the profit under an irrigation regime with non-irrigation. In addition, the table highlights that farm types 1 and 2 have mixed cultivated crops with the highest level of water consumption, in total, per hectare compared with types 3 and 4, which gives them in return the highest level of yield. Furthermore, the size of the cultivated area of the same crop over types is different and sometimes with different levels of production values, even though farmers are approximately applying the same amount of water. This is plausible as in the region irrigation practices are quite standardized for crop typologies, while other factors, such as land quality, might differ considerably within the region.
Table 2 illustrates the profit function and the water cost function according to each farm type. The profits function of each farm type
, is obtained by regressing the differences of the profit obtained for each irrigated crop and the profit obtained for not irrigated crops with respect to the share of irrigated area. The profit function is concave and the quadratic function is taken to better adapt the shape of the empirical water production functions that are used in many cases in the field of agricultural economics.
represents the profit of the farm based on the observed crop mix, with respect to the share of irrigated area on total, and for each farm type. The (
a,
b) coefficients are the coefficients obtained by regressing the achieved profit with respect to the share of irrigated area. It is worth noting that the profit function is taken as a farm’s revenue from cultivation minus expenses for seed or plants, fertilizer, pesticides, and tilling, while costs such as labour are not subtracted.
Based on estimated crop water consumption and unit water cost with respect to each farm type, we estimate the cost of water for each crop, which leads to an estimation of the total cost of water for irrigation to the overall area cultivated and irrigated for each specific farm type. The computation of the cost function is made based on a consideration of the unit cost of 0.06 €/m3. This represents the operation and maintenance (O&M) costs. The O&M costs are associated with the supply system from the secondary canals into the farm. Typical O&M costs, in the region, include payment to water masters to clean and maintain the secondary canals, as well as the managing and distributing of water to tertiary canals to facilitate the withdrawal by farmers. A negative cost function is achieved due to the fact that, as following the sequence of crops, their shape is an empirical issue and does not represent the theoretical increasing marginal function.
Incorporating in the model the profit and cost function taken from
Table 2, we were able to calibrate the models presented in
Section 2 with the actual data of the area.
5. Results
The results of the simulation for the three different pricing schemes are reported in
Table 3. Results are expressed in terms of policy parameters (payments and share of irrigated area), profits, net profits, and social net benefit.
The flat rate option shows a social benefit . is inferior compared with both first and second best options, while the farm’s profit is higher. The net benefit of farm type 1 is higher in the flat rate case. This happens because the farmer may cultivate high water consumption crops and benefit from the fact that payments are set equally among types. This mechanism would favour some farmers that cultivate high water consumption crops and penalize others that consume water in smaller amounts but are forced to pay the same amount as the others. Nevertheless, the overall water payments are higher on average in the flat rate case (as they have higher irrigation shares), compared with first best option.
Looking carefully at the mechanisms behind the results of the second best menu of contracts, it appears that the participation constraints are never binding, the cost recovery constraints are binding for farm types 1, 3, and 4, while the incentive constraint is binding for farm type 1 only. This means that in the second best menu of contracts, the water regulator can adopt a strategy that offers farmers the opportunity to irrigate the optimal share of irrigated area. This indeed happens for farm types 2, 3, and 4, all of which will opt for the contract targeted to their type. The opposite holds for farm type 1, which has the highest water payment, and who would try to misrepresent himself by mimicking farm type 2. Therefore, to make farm type 1 indifferent to the contract that belongs to him and the contract designed for another farm type, an increase in the water payment for farm type 2 is made, which is illustrated in
Table 3, second best solution. Other farmers, namely types 1, 3, and 4 pay equal as in the first best solution (considering other options, the range of farmers that cheat during the contract selection may change (i.e., for different profits and costs)). The solution reached shows that all farm types still irrigate up to the level that marginal profit equalizes the marginal cost of supplying water (as seen in Equation (3)), which means that there are no additional supply water costs for the water provider and the same water cost level is incurred. However, the water payment differs at least for farm type 2. This increase in farm type 2’s water payment does not affect the social benefit, which will be the same as in the first best solution. Nevertheless, this causes a decrease in his net profit, which is lower compared with first best solution
(the
and
. indicate the farm type 2’s net profit in the first and second best menu of contracts). This result is connected to the assumption that the higher payment in itself has no additional social cost; otherwise a need for additional incentive payments would also be accompanied by a change in optimal share of irrigated areas.
A sensitivity analysis is carried out to evaluate the farm’s behaviour under an increase in water costs (
Table 4 and
Figure 1,
Figure 2,
Figure 3 and
Figure 4). We assume water cost levels from 0.00 €/m
3 to 1.20 €/m
3, in spite of the fact that the upper levels are rather unrealistic in the area. In this way we show potential real life results in the range below 0.50 €/m
3 (considering a potential future increase of water costs also in a context of climate change and higher probability of water shortages even in water-rich areas), while the water cost levels above 0.50 €/m
3, rather far from real-life values, are used as a more academic exercise in order to better show the functionality of the models proposed and to highlight the role of asymmetric information, as well as to clearly show the difference between the first best and second best option. As expected, the increasing level of water costs results in an increase in water payments for farmers and a decrease in the farm’s net profit.
Under a flat rate scheme, where this higher cost is not transferred to farmers, the demand for irrigation water remains at the optimal level when the water costs increase, but there is an increase in water payments for farmers.
Under the menu of contracts option, the regulator responds to the higher water costs by reducing the share of irrigated area allowed in the contracts, which leads to a reduction in water use. Also under the menu of contracts, the water payment increases as the water cost increases, but shrinking the share of irrigated area is associated with diminishing compensation payment (which is reasonably associated to a decreased irrigation share).
Table 4 illustrates the corresponding social benefit for each pricing scheme for different water cost levels. Over the variation of water cost levels, the total social benefit decreases. With water costs equal to zero, the three pricing schemes are equivalent. By increasing water costs, a difference becomes evident between flat rate and the other two options, and this difference becomes greater as the water cost increases. This is because the flat rate option does not transfer the costs to the farmers.
.
Concerning now the difference of social benefit between the first best and second best, this occurred due to the fact that for some water cost levels, in the second best solution, farmers decrease the share of irrigated area more than in the first best, which corresponds to a lower level of social benefit. In addition, for water cost level above 0.60 €/m3, the difference becomes more evident.
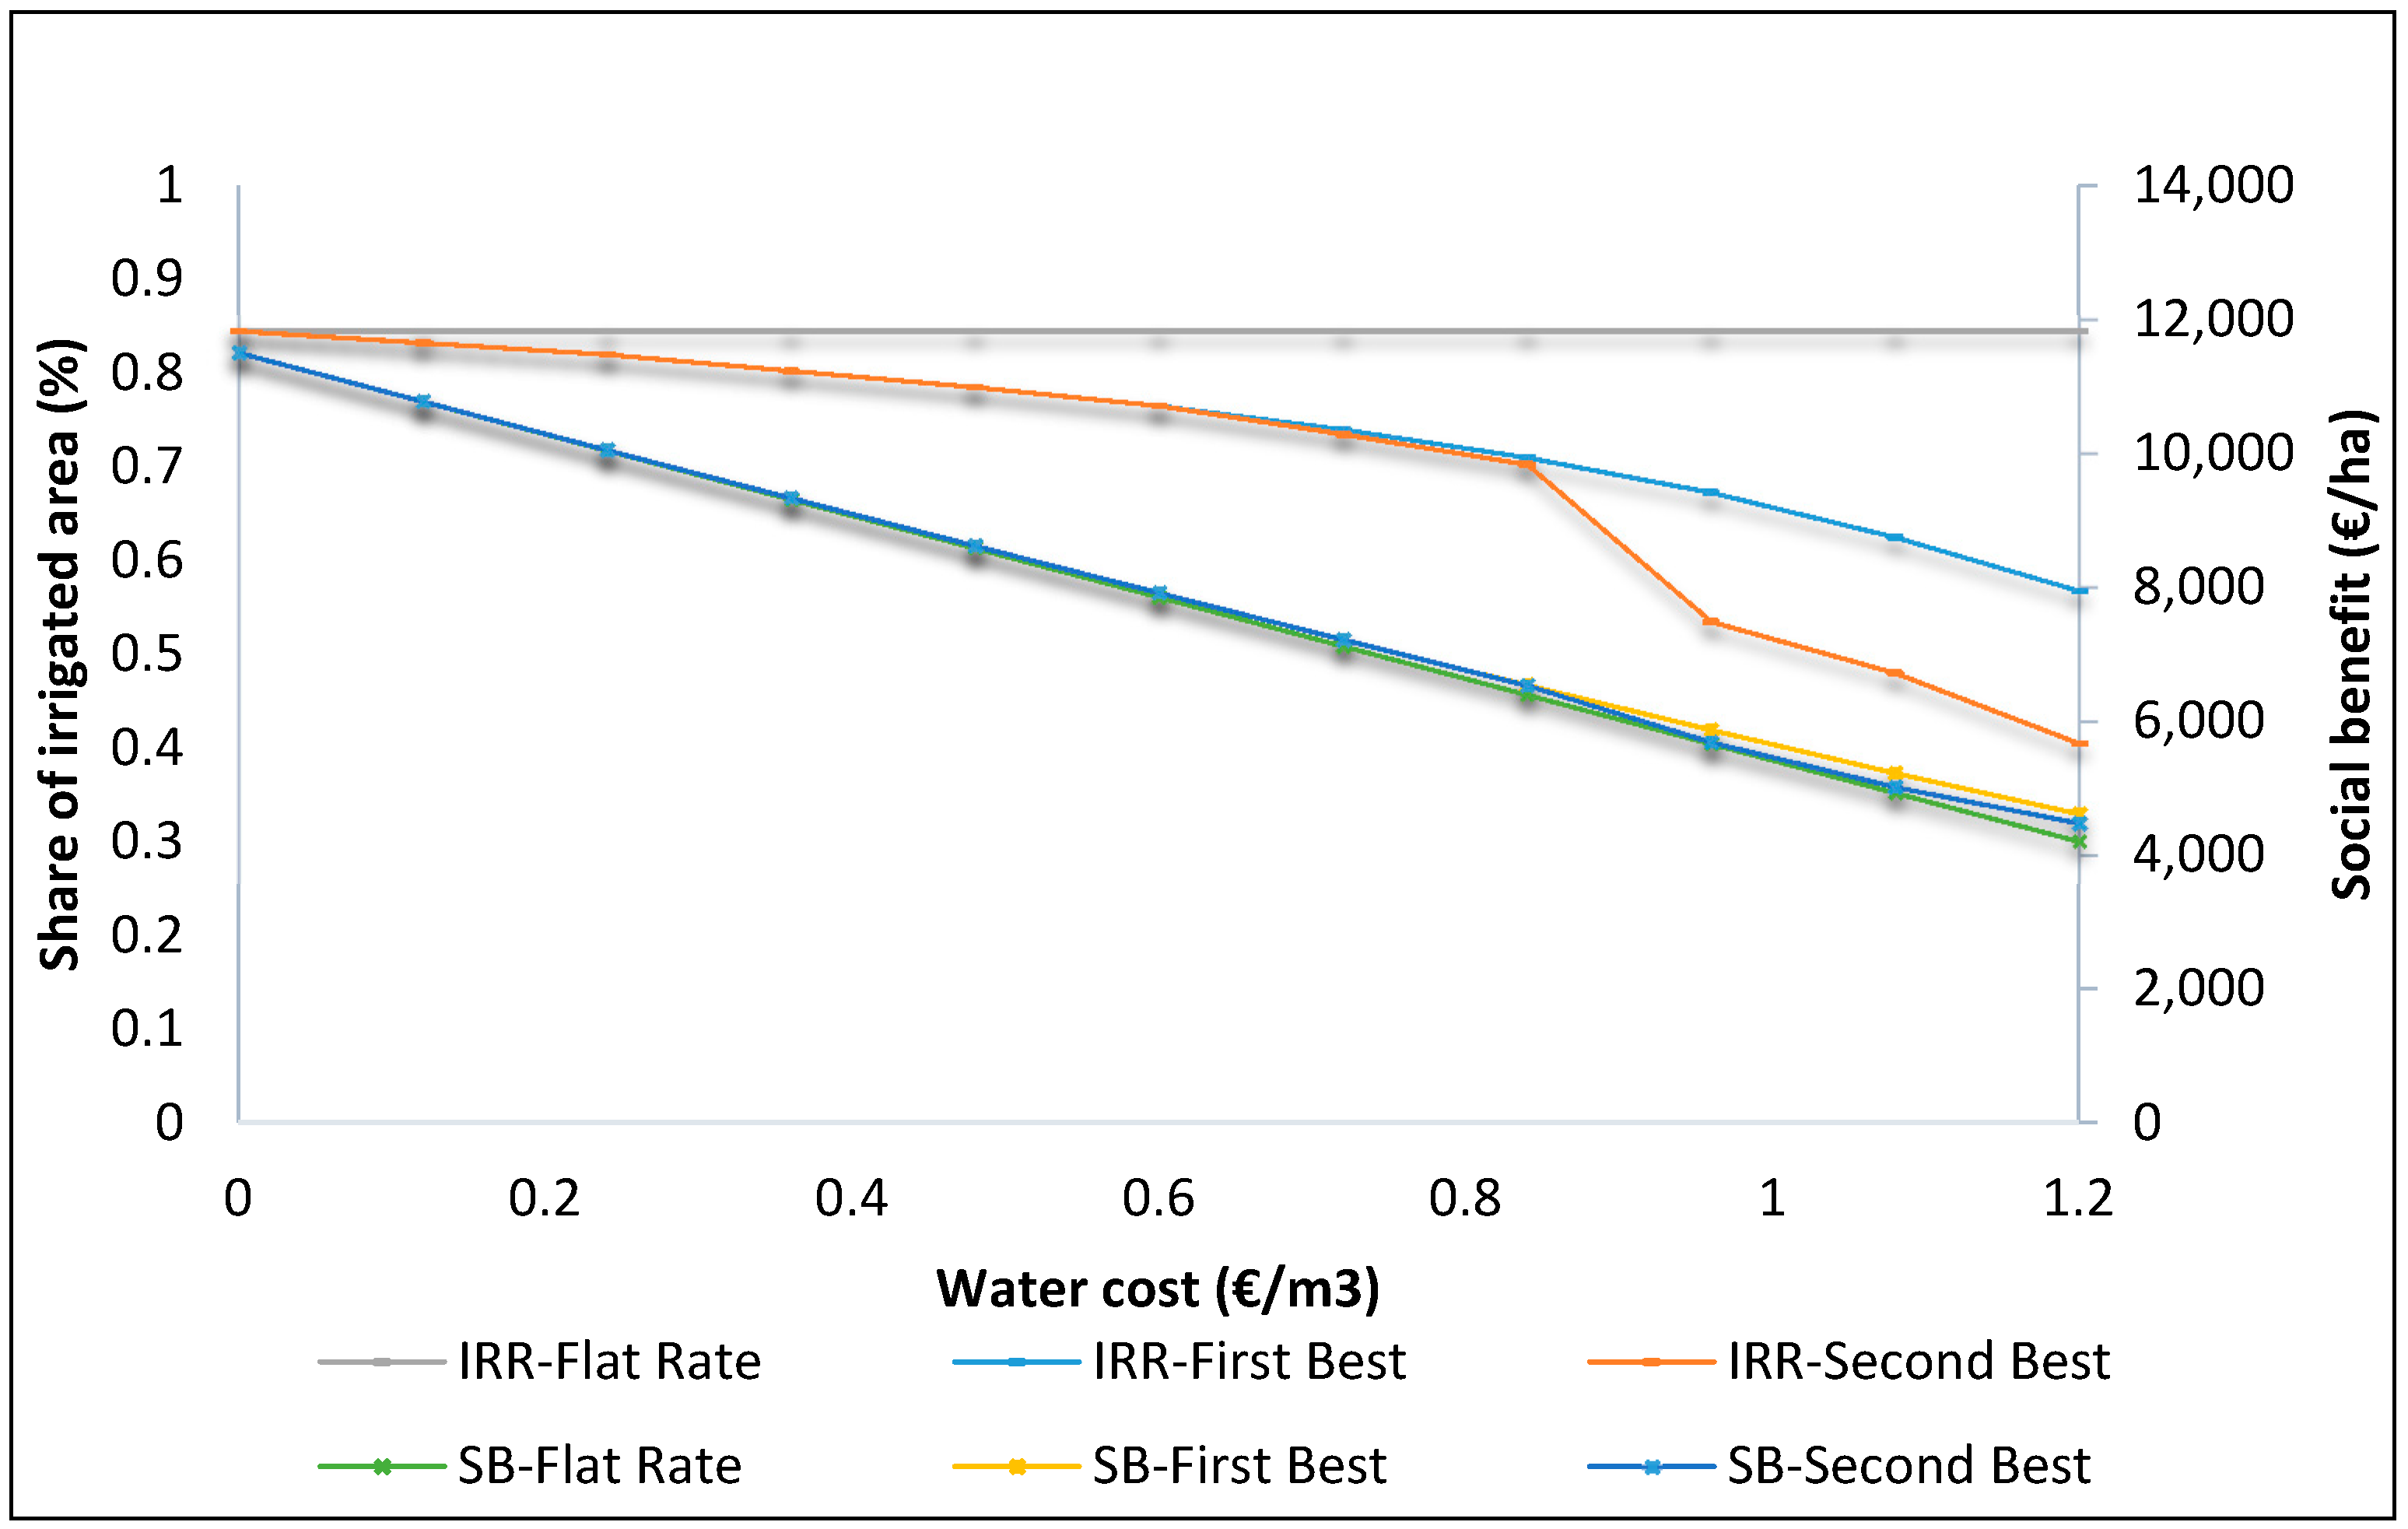
Figure 1, given below, illustrates the range of the share of the irrigated area as the water cost increases on the primary axes, and the trend of the social benefit on the secondary axes for each pricing option. The term IRR (i.e., IRR-Flat Rate) on the table stands for the irrigated share provided as averages across farms, and SB stands for social benefit. Under flat rate of water pricing option (green line), farmers do not decrease the share of irrigated area for the fact that their payments are not directly linked with the amount of water used. Under the menu of contracts, this is different: farmers decrease the share of irrigated area as the water cost increases. Under the first best option, the decrease of the irrigated share varies in the range 0%–15% while, under second best, farmers decrease the irrigated share even more, in the range 0%–52%. The decrease of the share of the irrigated area is associated with decreases of the farms’ profits.
Figure 1 also provides the trend of the social benefit under different water pricing options; as expected, the social benefit decreases as the water cost increases in all cases. However, in the first part up to 0.6 €/m
3, the range of decrease of the social benefit appears to be in the same portion for all pricing options (actually, it differs by a very small amount); above 0.60 €/m
3 the change starts to be more evident. This occurs due to the fact that up to a water cost level of 0.60 €/m
3 farmers do not decrease the irrigated share as much, which does not reflect the decrease of the social benefit; above 0.60 €/m
3 the differences in decreasing the social benefit become more distinguishable.
A graphical illustration is provided in
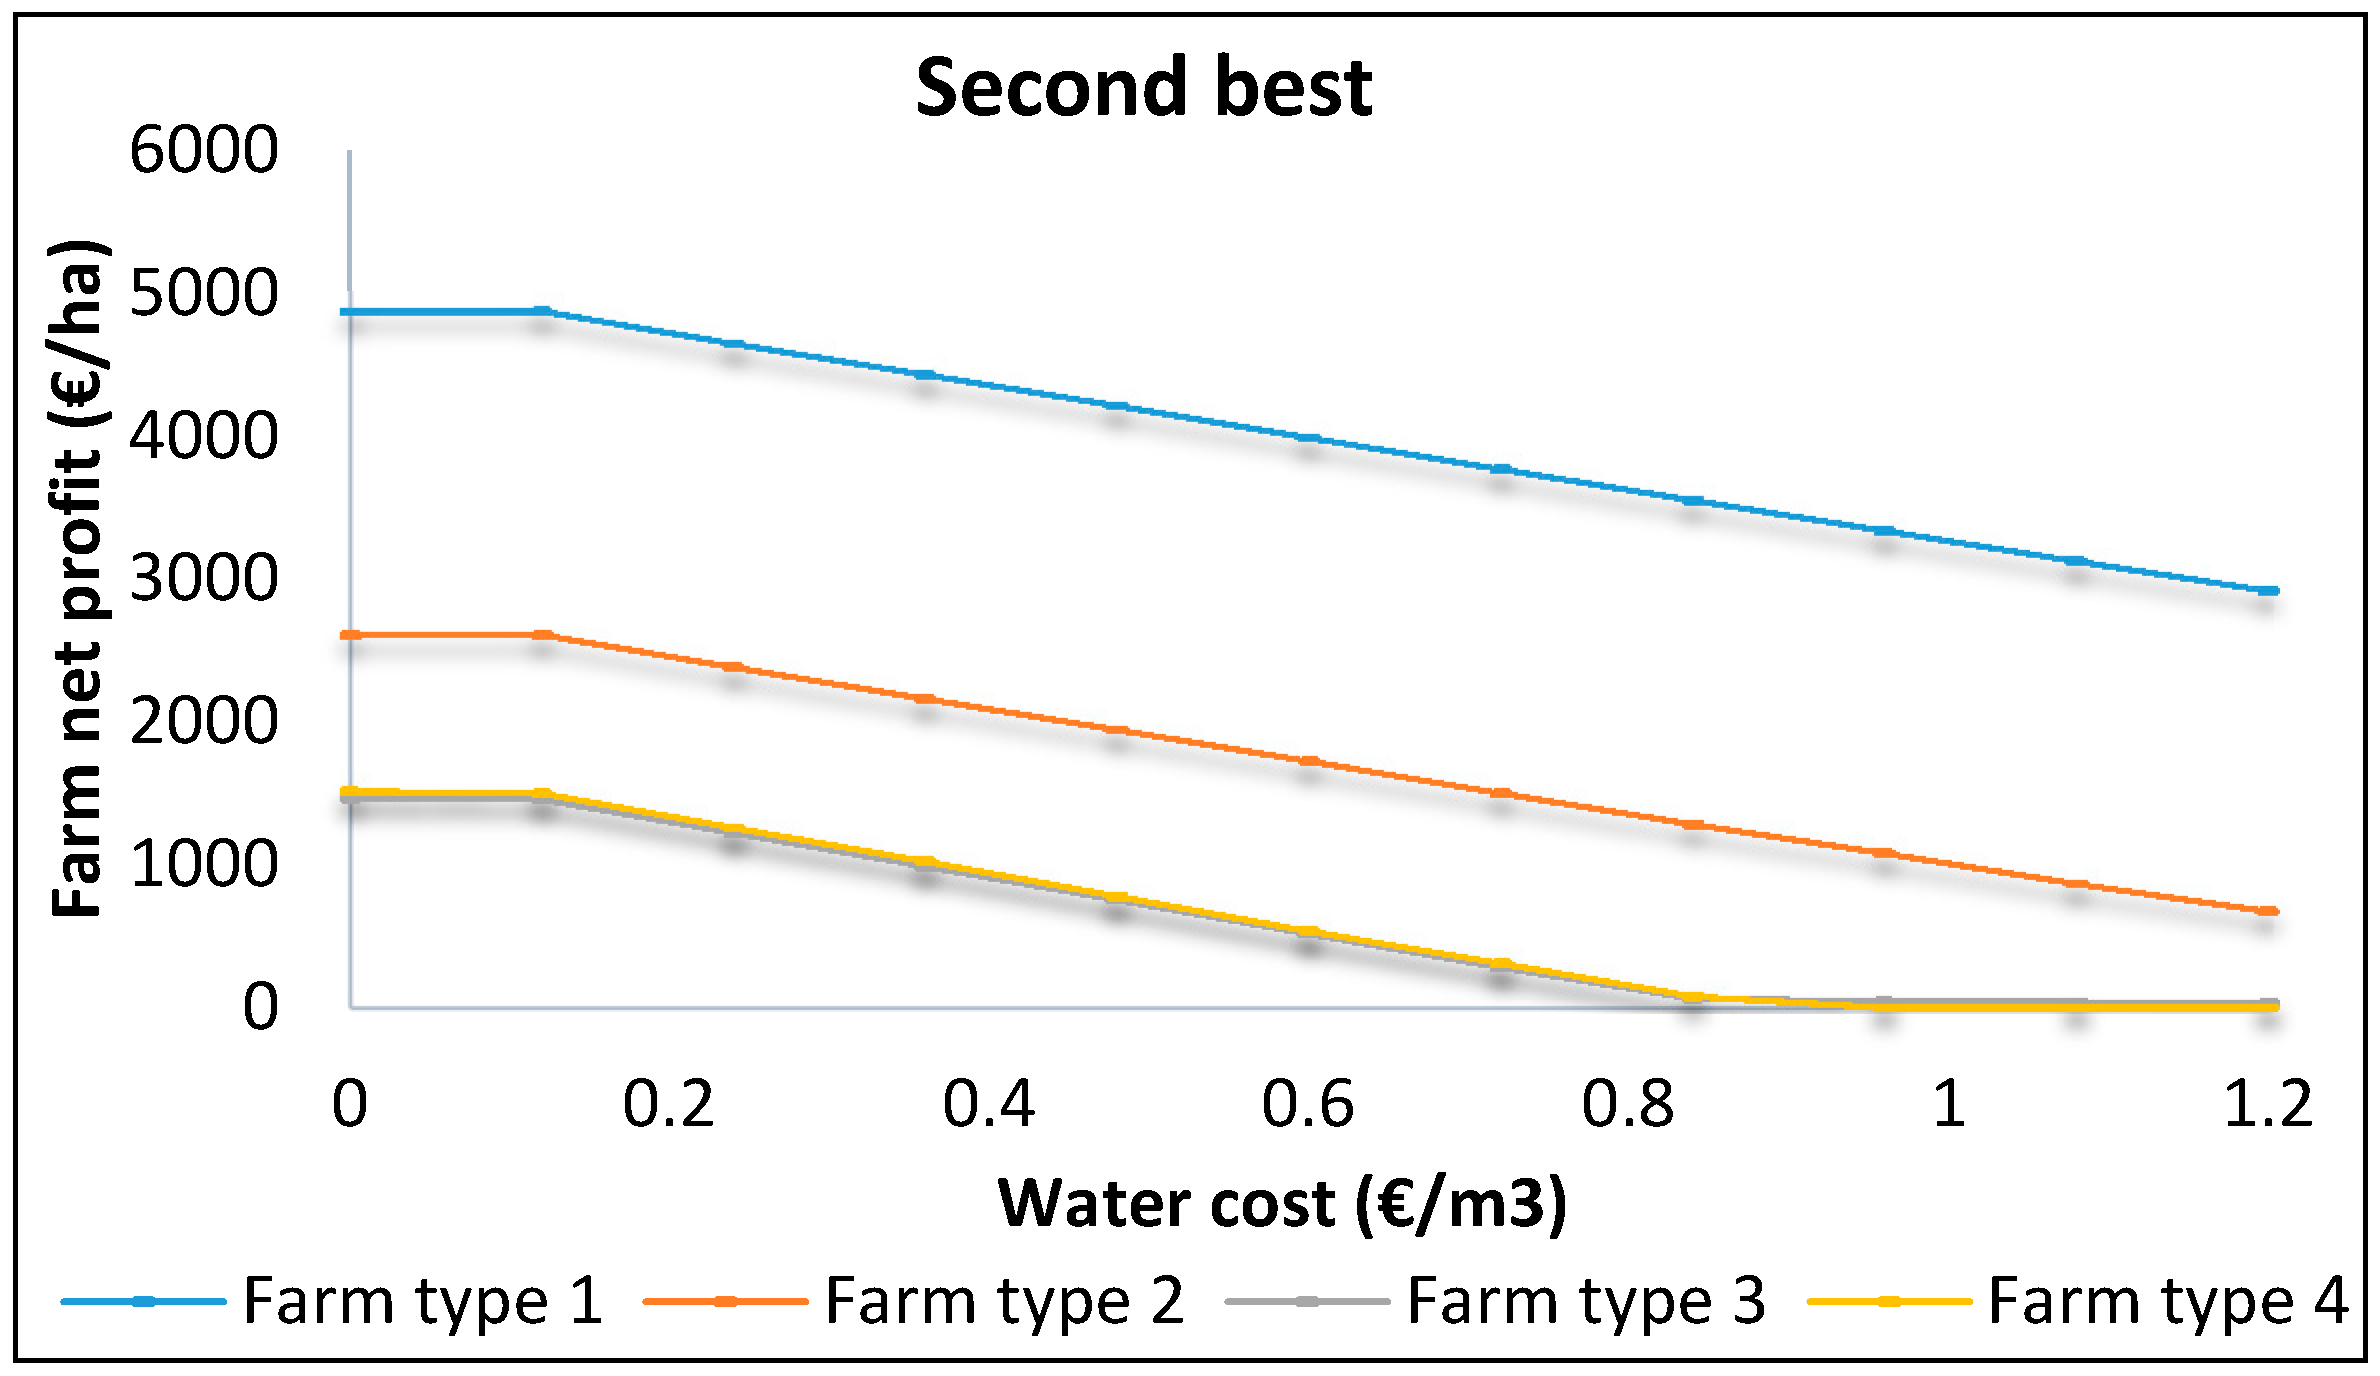
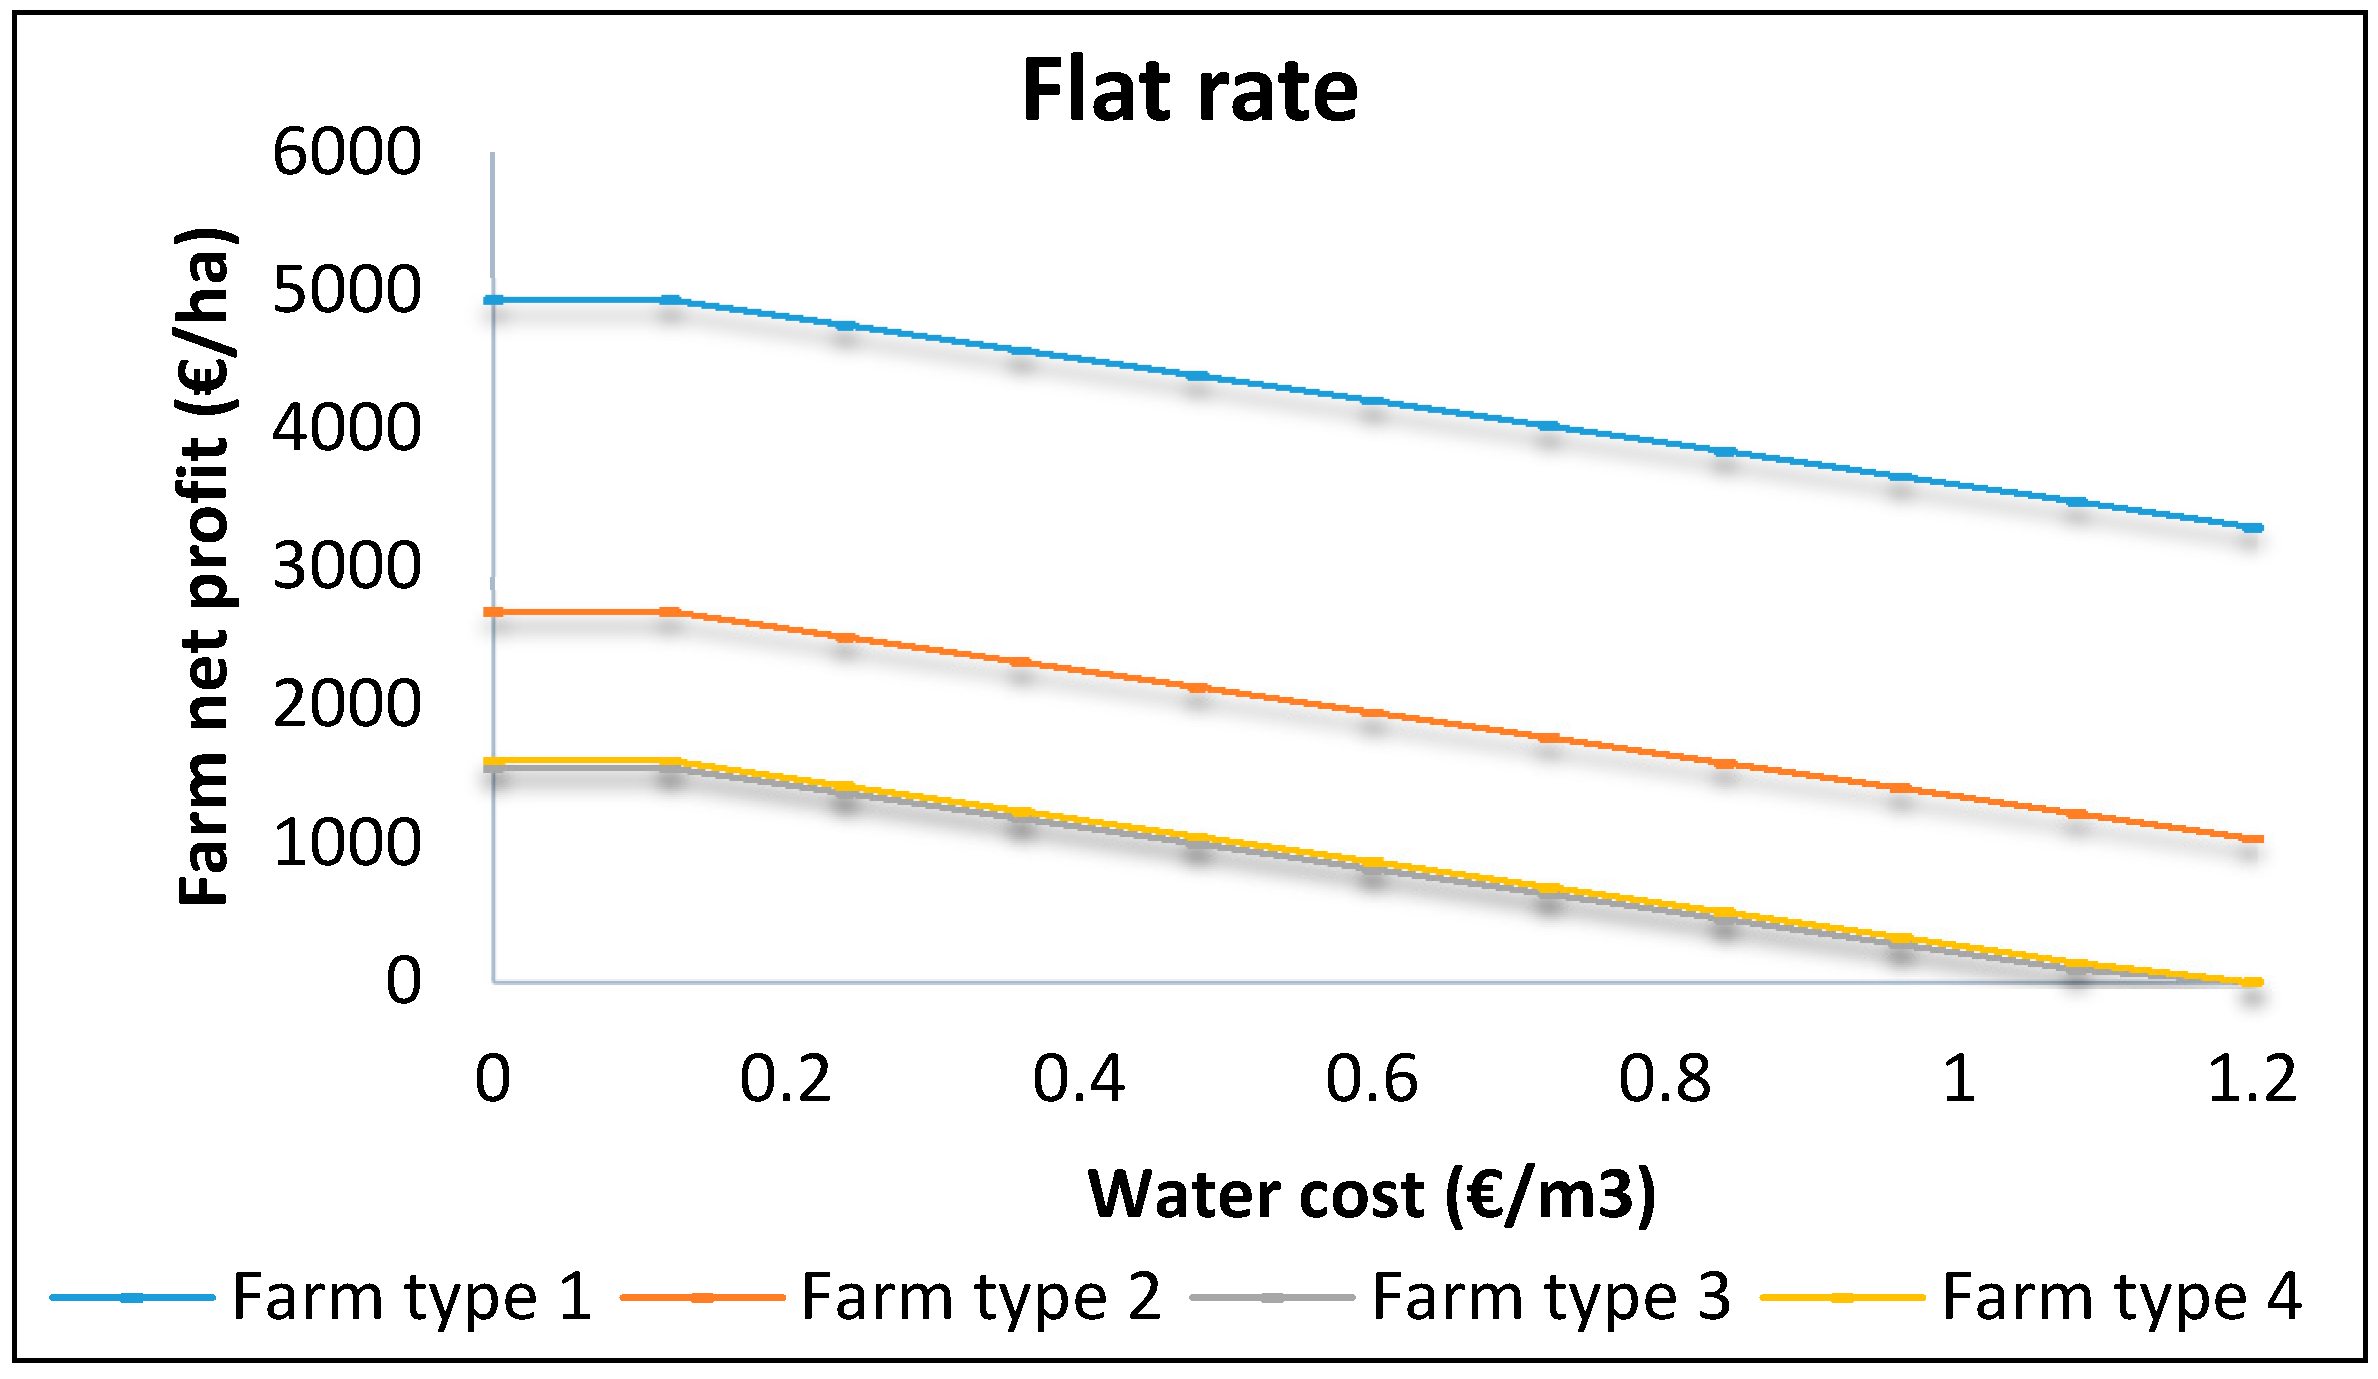
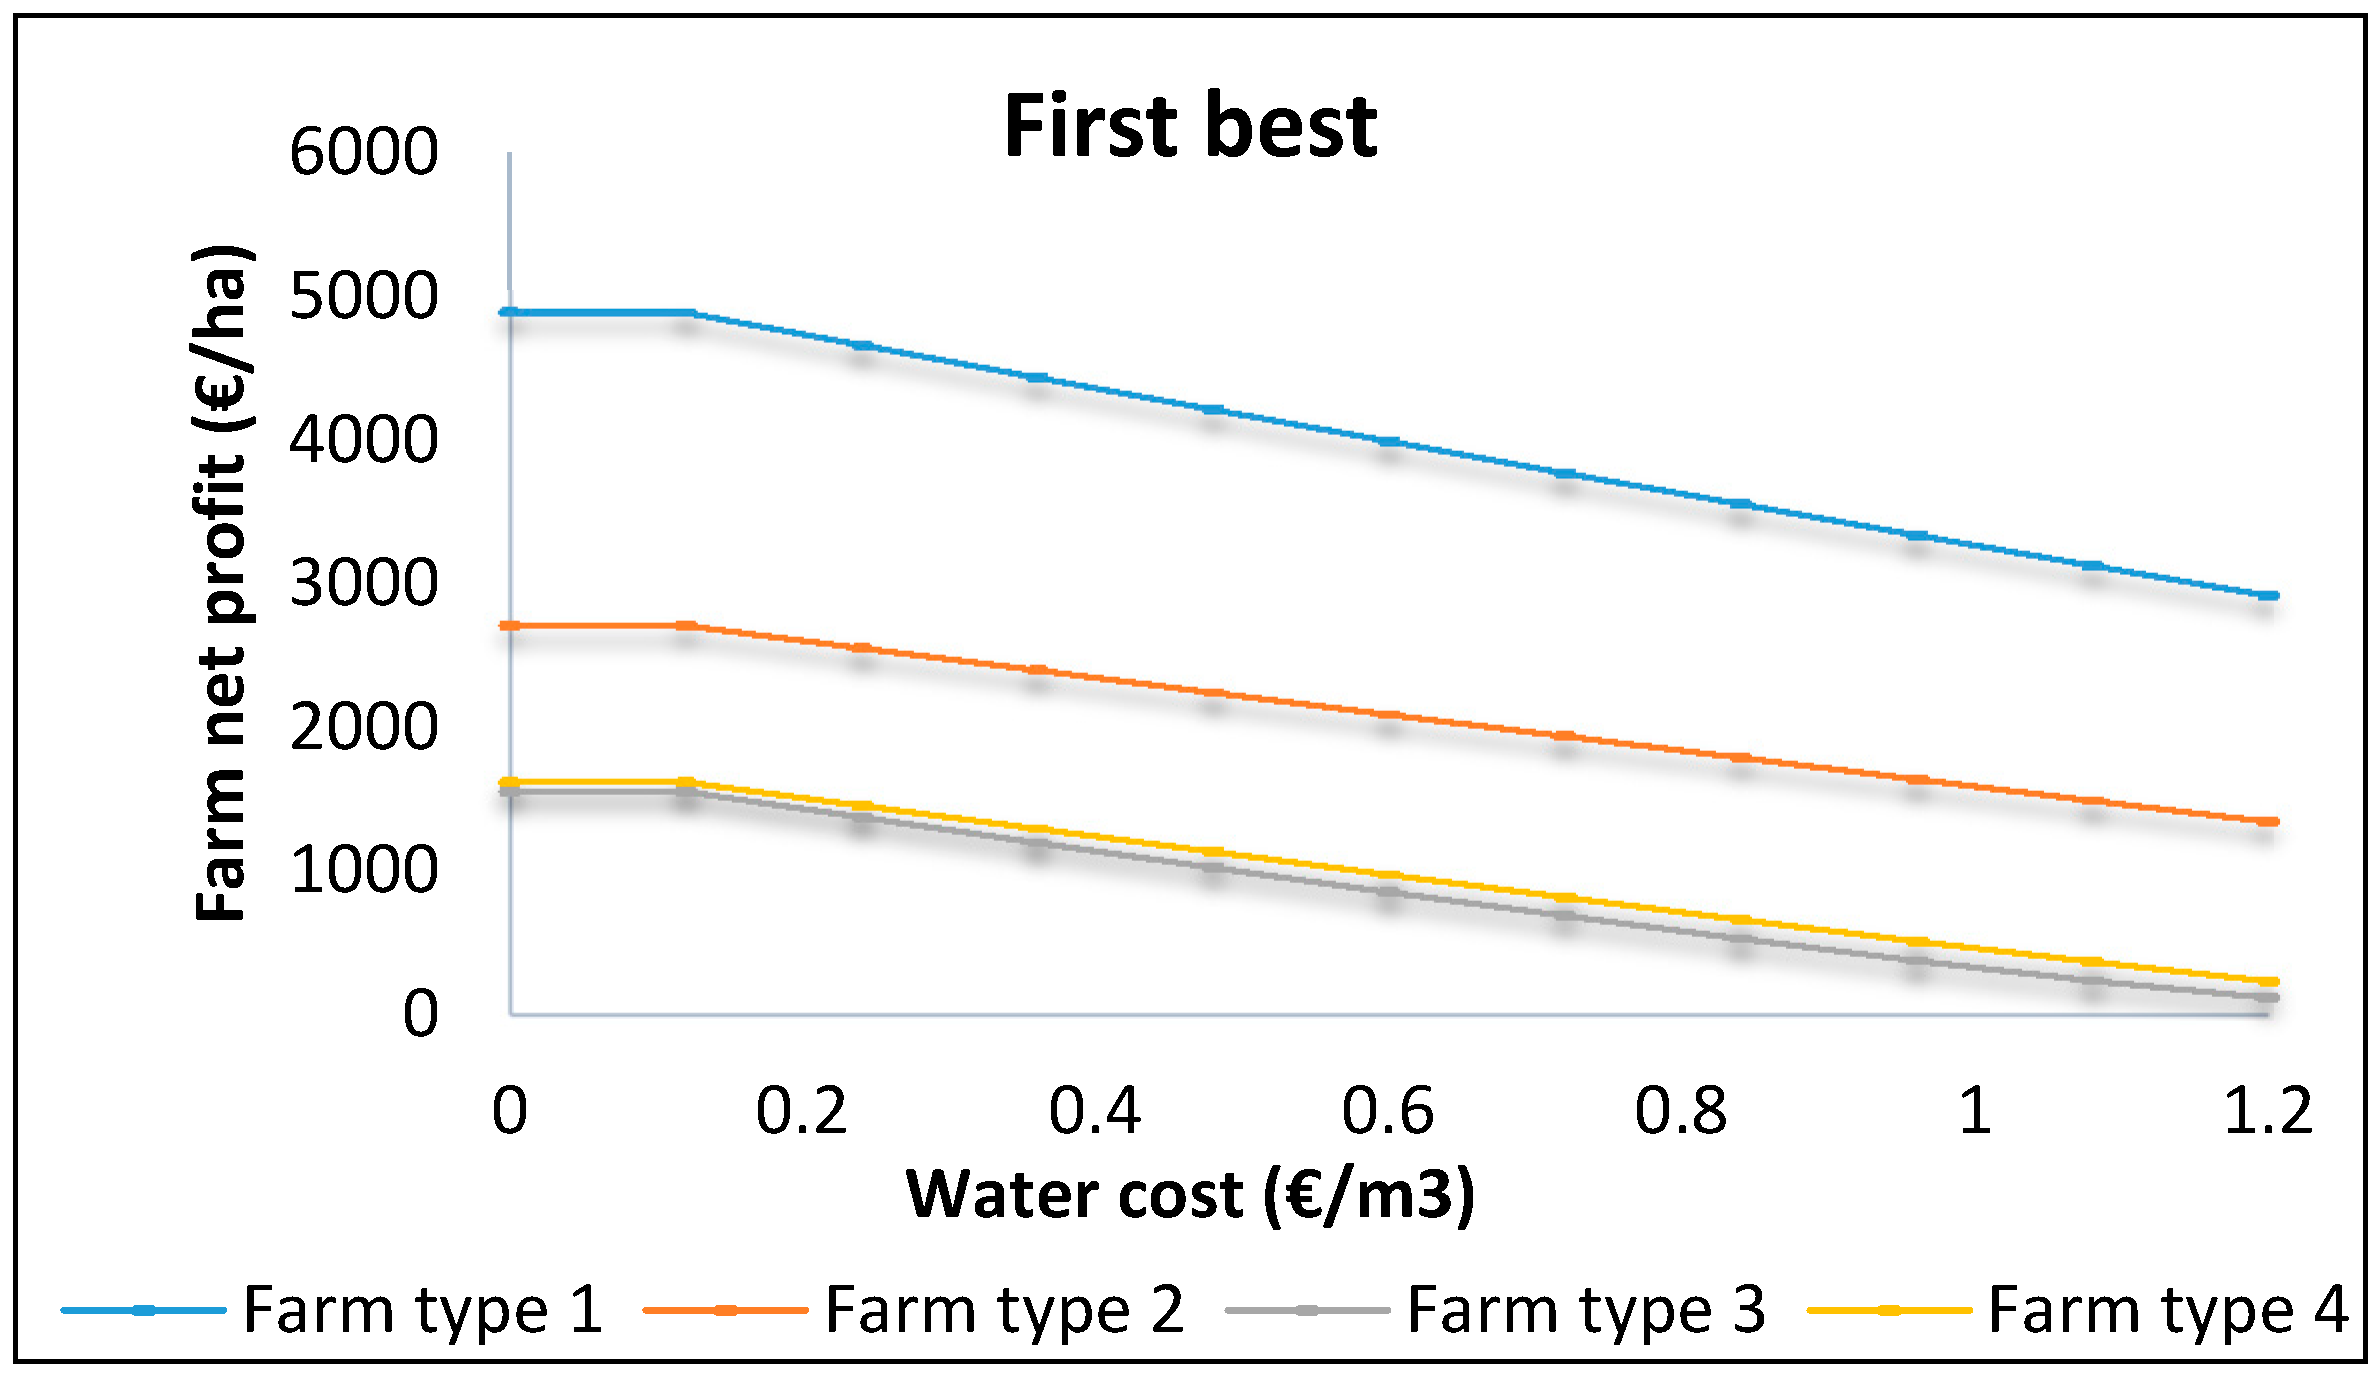
Figure 2,
Figure 3 and
Figure 4 to show the trend of a farm type’s net profit under different water cost levels with respect to different water payment options.
In all water pricing options, the increase in the water cost would reduce the farm’s net profit. Regarding the flat rate water pricing scheme,
Figure 2 shows that the percentage decrease goes up to 38% for farm type 1 and 100% for farm types 3 and 4, which means that farm types 3 and 4 stop irrigation at some levels of water cost increase.
Under the first best (
Figure 3) and the second best menu of contracts (
Figure 4), the increase of water costs decreases a farm’s net profit, as in the flat rate case. In the first best option, the range of percentage decrease goes up to 40% for farm type 1 and the highest level of a net profit decrease occurs to farm type 3, with a decrease up to 92%. In the second best option, the percentage of decrease of the farms’ net profit is even greater for some farmers, for farm type 1 the net profit decreases up to 40%, as in first best option, and farm type 4 experienced the highest level, with a decrease up to 100%.
6. Discussion and Conclusions
This paper discusses the option of applying a menu of contracts in Çukas (the case study area in Albania) for irrigation water pricing. The aim of the study was to define an efficient price scheme under asymmetric information using a principal-agent model. In particular, we considered the potential of the menu of contracts by using a mechanism design approach which thereby made it possible to identify a menu of contracts discriminating among farmers and to implement it in such a way as to assume that the WUA seeks to motivate farmers to use the optimal amount of water in a context of asymmetric information, and to compare it with the flat rate water pricing scheme currently applied in region. Few scholars have focused on the theory of water pricing through the principal-agent model. This paper follows a method proposed by recent studies, notably [
7,
19].
We acknowledge the weaknesses of this approach and the limitations in proposing straightforward applications of the results to real life pricing. The quality of policy design is generally dependent on the data available and the tools used. A significant limitation encountered was that the respective offices in the case study area were not able to provide the full information required for the study with regard to irrigation water (for example, more accurate information regarding costs and benefits of farmers in order to better define the profit and cost function with respect to each farm type). An additional limitation is that the demand functions were obtained by considering revenue with and without irrigation for the same crop rather than proper demand functions based on water production functions and the crop mix. These simplifications significantly affected both the design of the menu of contracts and the results.
Despite these limitations, the method may hint at ways of mitigating the problem of asymmetric information, even in cases of unmetered irrigation water, since the price discrimination provides incentives for farmers to choose among contracts. Nevertheless, the results show that using a menu of contracts (i.e., second best) characterised by variability of water payments to different farm types, may improve the overall social welfare derived from irrigation water use. On the other hand, the flat rate scheme only provides a water payment to recover costs, thereby providing no incentives for efficient water use and conservation. Moreover, the menu of contracts provides a useful framework to study the problem of water pricing in cases of unmetered water.
In practice, however, it may be difficult to propose a menu of contracts to water users in Cukas (Albania) because of the novelty of this approach compared with the traditional method. Even if we are aware of the difficulties inherent in this methodology in terms of application and implementation, our intention was to provide a useful method for the creation of mechanism design through contract theory. Furthermore, the theory of menu of contracts could encourage policy makers to consider this new pricing strategy as an option and to use insights derived from this approach in improving the irrigation system.
The application of this method and the realisation of tangible outcomes can be reached by implementing it with a better endowment of data. Moreover, the method used can be improved in the near future by estimating more reliable demand functions. In addition, further research could be undertaken by theoretically developing the framework for designing payments under asymmetric information. This would go a long way towards analysing the feasibility of the model in real life conditions and towards evaluating its effectiveness.


