Article

Generation of a Design Flood-Event Scenario for a Mountain River with Intense Sediment Transport

Department of Civil and Environmental Engineering, Politecnico di Milano, 20133 Milano, Italy
*
Author to whom correspondence should be addressed.
Water 2016, 8(12), 597; https://doi.org/10.3390/w8120597
Submission received: 13 October 2016 / Revised: 14 November 2016 / Accepted: 12 December 2016 / Published: 16 December 2016
(This article belongs to the Special Issue Stream Channel Stability, Assessment, Modeling, and Mitigation)

Abstract

:
International directives encourage the incorporation of sediment transport analyses into flood risk assessment, in recognition of the significant role played by sediment in flood hazard. However, examples of risk analysis frameworks incorporating the effect of sediment transport are still not widespread in the literature, resulting in a lack of clear guidelines. This manuscript considers a study site in the Italian Alps and presents a hydro-morphologic model for generation of flood scenarios towards hazard assessment. The analysis is concentrated on a design flood event with 100-year return period, for which an outflowing discharge is computed as a result of the river modeling. However, it is also argued how suitable model input parameter values can be obtained from analyses of river flows in a yearly duration curve. Modeling tools are discussed with respect to their capabilities and limitations. The results of the analysis are site-specific, but the proposed methodology can be exported to other hydro-graphic basins.

1. Introduction

In recent years, several studies have demonstrated a major role of sediment in fluvial floods. It has been argued, for example, that stream morphological changes taking place over long periods may significantly change the river response to high flows, e.g., [1,2,3]. In addition, it has been shown that, sometimes and particularly in mountainous regions, the temporal scales of flow variation and morphological change can be equivalent to each other, resulting in a coupled process, e.g., [4,5]. Thus, a sudden increase of river bed elevation would significantly facilitate stream outflow. Similar arguments have been taken into account by international guidelines. For example, the European Floods Directive [6] mentions that flood risk maps resulting from calamitous scenarios should include information about “areas where floods with a high content of transported sediments and debris floods can occur”.
Hydro-morphologic models are effective tools for studying the sediment transport in a river. These models are mostly based on shallow-water equations for one-dimensional and two-dimensional frameworks, with the former (e.g., [7,8,9]) mostly used for mountain environments. Hazard assessment can be thus performed accounting for the presence and transport of sediment. The results may however suffer from significant uncertainties due to the complexity of the involved processes. Uncertainty analysis can be included by accounting for the variability resulting from different parameterizations of the scenarios, but examples of such approaches are still limited (e.g., [10]).
All of the above considerations are particularly relevant for the Italian Alps. This paper addresses the case-study of the Valmalenco catchments, where the main water course is the Mallero River. The site was chosen because several data are available from studies (e.g., [11,12,13,14]) performed after a significant flood event of 1987 and, furthermore, the public protection tools presently available to local authorities do not adequately account for an expected effect of sediment on the flood risk (e.g., [15]). The objective of the work is to assess the capabilities and discuss the limitations of hydro-morphologic modeling towards the assessment of hazard levels for the main town situated close to the downstream section of the basin. Therefore, the modeling sequence proposed in this work comprises (i) the short-term hydro-morphologic evolution of the downstream reach of the river consequent to the propagation of a flood wave (the short term is here intended in an engineering sense and is therefore on the order of hours/days) and (ii) the quantification of an expected outflow into the town. The distinctive feature of the present work compared to several others performed by the authors on the same case-study [16,17,18,19,20] is the introduction of a design flood scenario rather than the consideration of a previous flood in a back analysis.
The present study meets a local societal thrust and is also relevant in light of the existing literature. Even though some consolidated mathematical/numerical tools are employed for the hydro-morphologic analyses, the novelty of the study lies in the two-way link of (i) a risk-oriented interpretation of the modeling results, that is not present in works where the modeling tools are developed (e.g., [7,8,9]) and (ii) an appropriate account of sediment in the hazard assessment. For example, [21], presented a similar modeling sequence spanning from water discharge to flood damages, but did not consider the contribution of sediment. The study [10] lacked quantification of a sediment supply into the modeled river reach and considered random values for the sediment volume, albeit acknowledging a crucial need for an appropriate “yield function”. Here the issue of the sediment supply is discussed in light of the earlier results for few case-studies and of new sensitivity analyses.
The manuscript is organized as follows: first, the case-study is presented; second, hydro-morphologic evaluations are performed with reference to flows in a yearly duration curve to obtain parameter values to be used in short-term modeling; third, a flood scenario corresponding to a hydrograph with a 100-year return period (henceforth indicated as the ‘design’ scenario) is simulated resulting in the estimation of a flooding hydrograph for the town; fourth, the results are discussed in terms of feasibility and limitations of modeling and of directions for future research, and the main conclusions are summarized.

2. The Valmalenco Catchments and the Mallero River

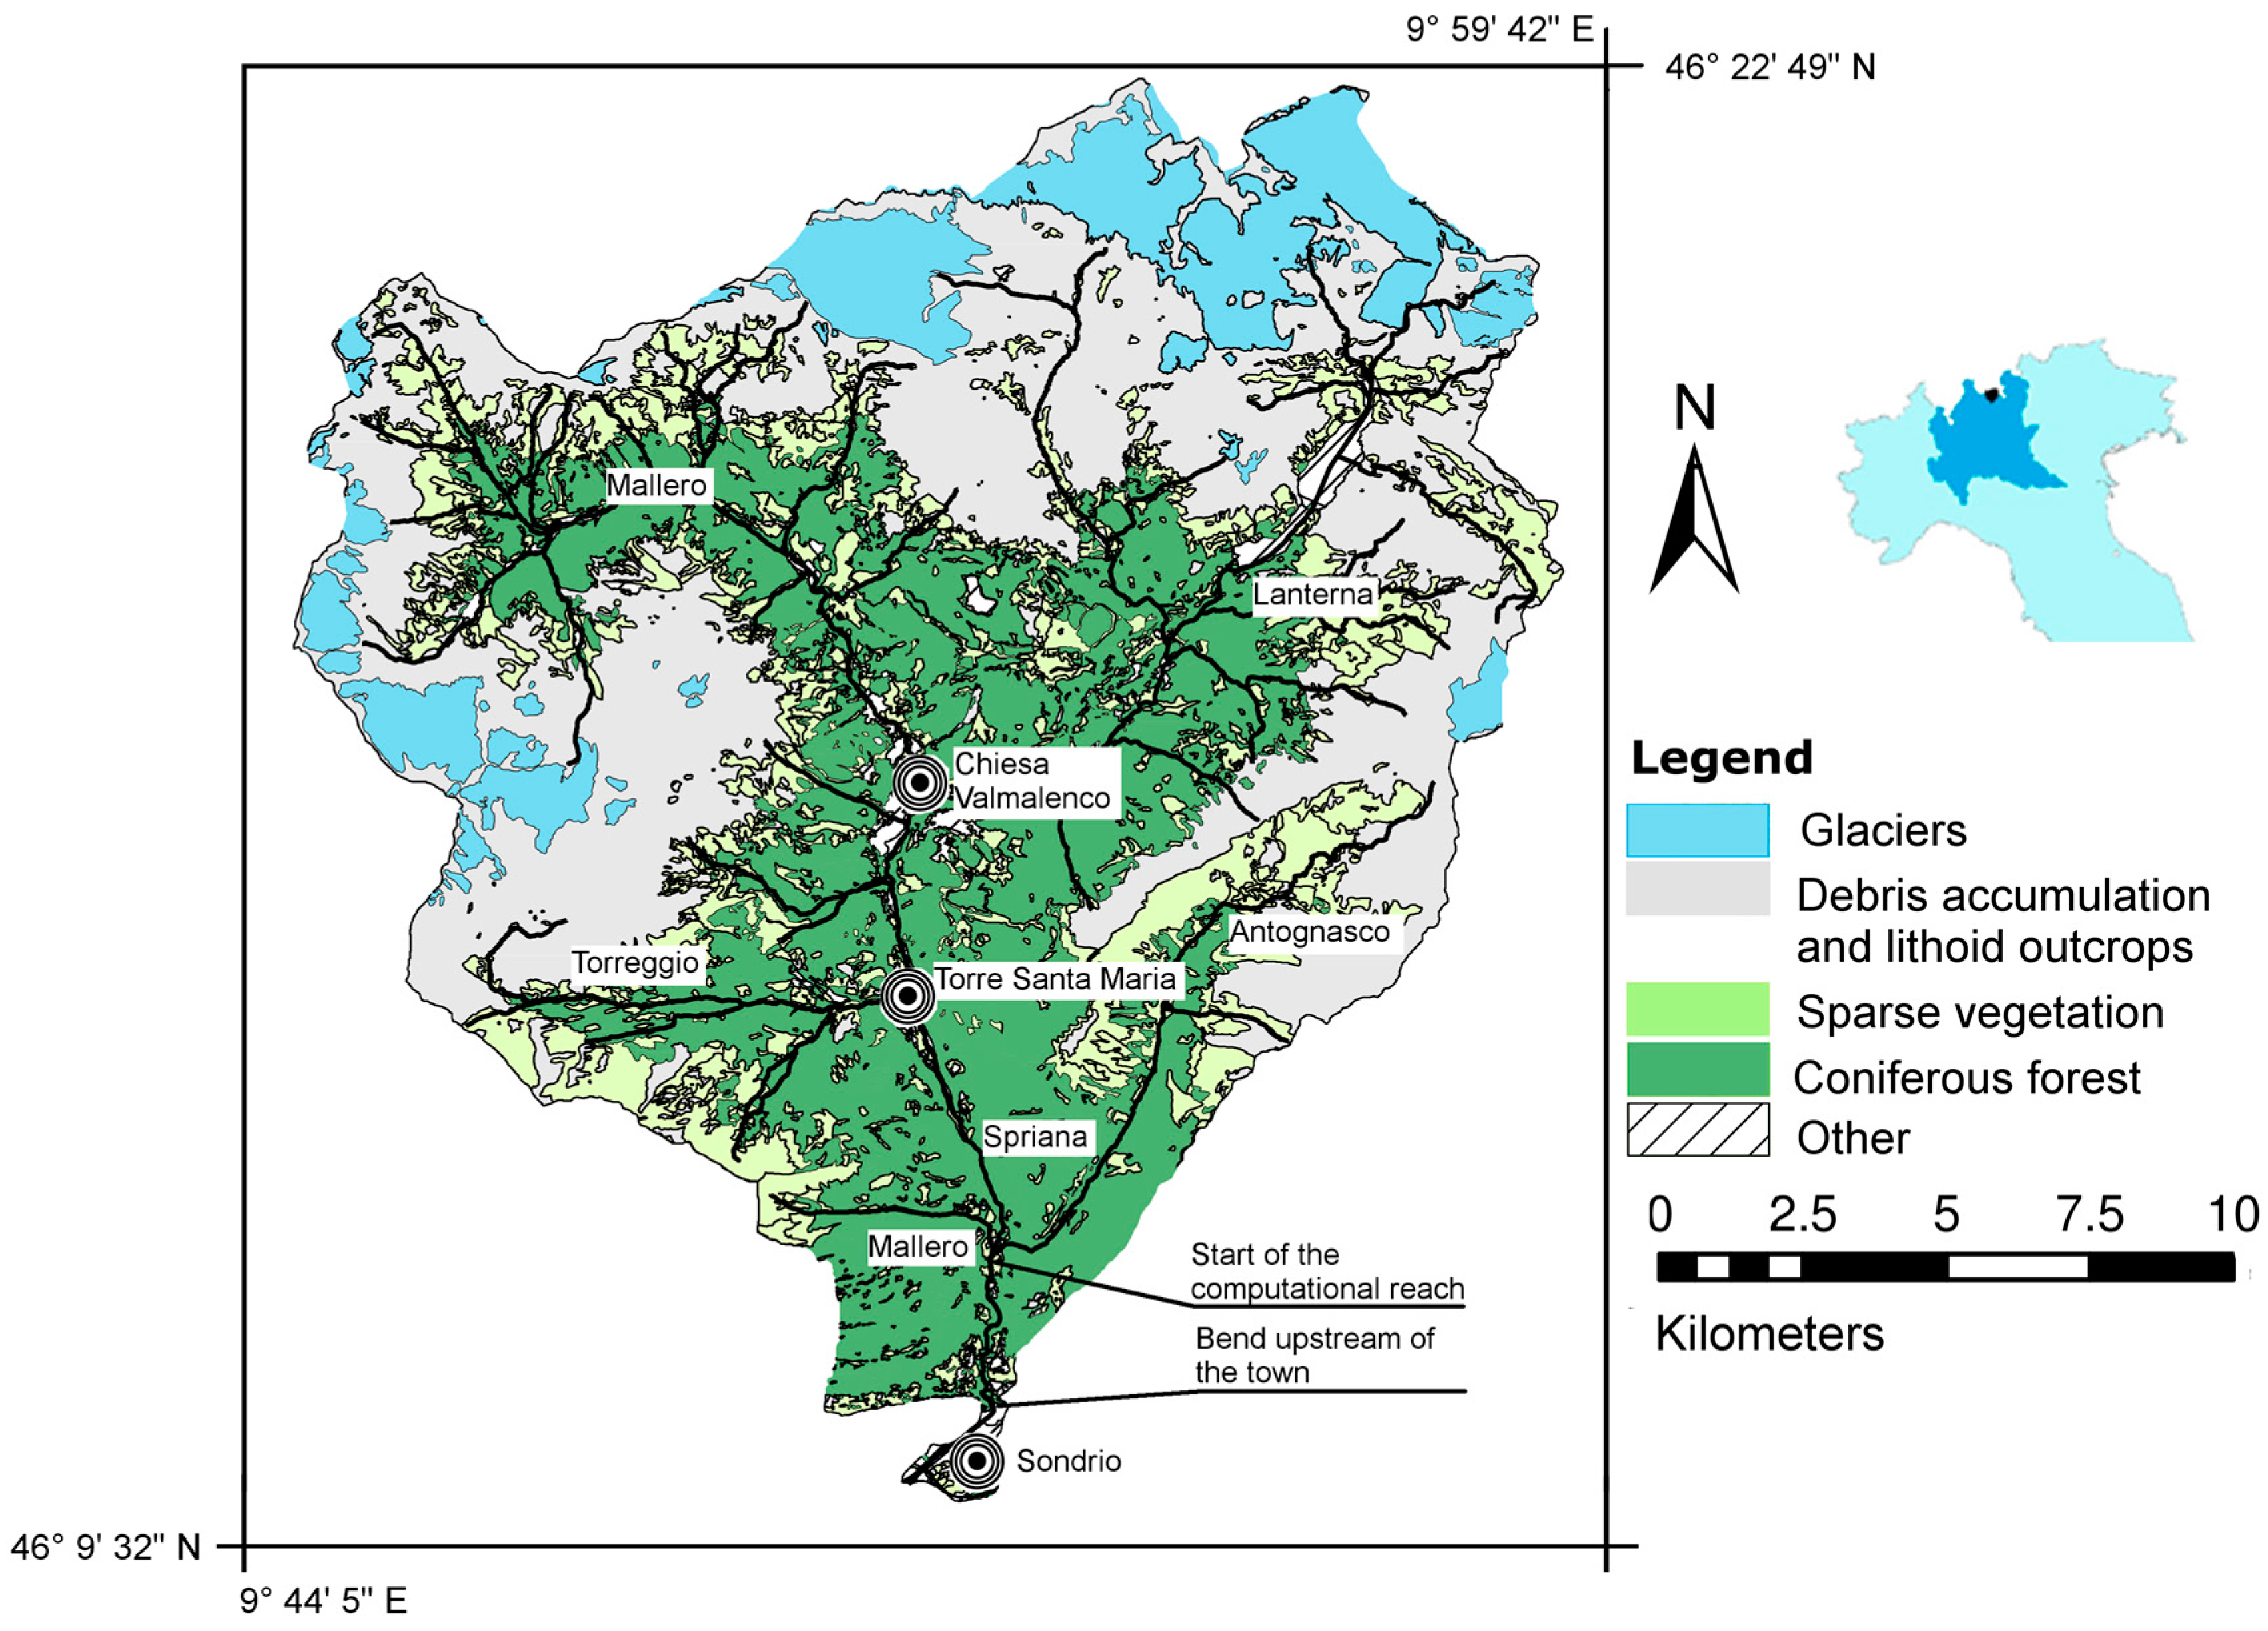
2.1. The Hydro-Graphic Basin
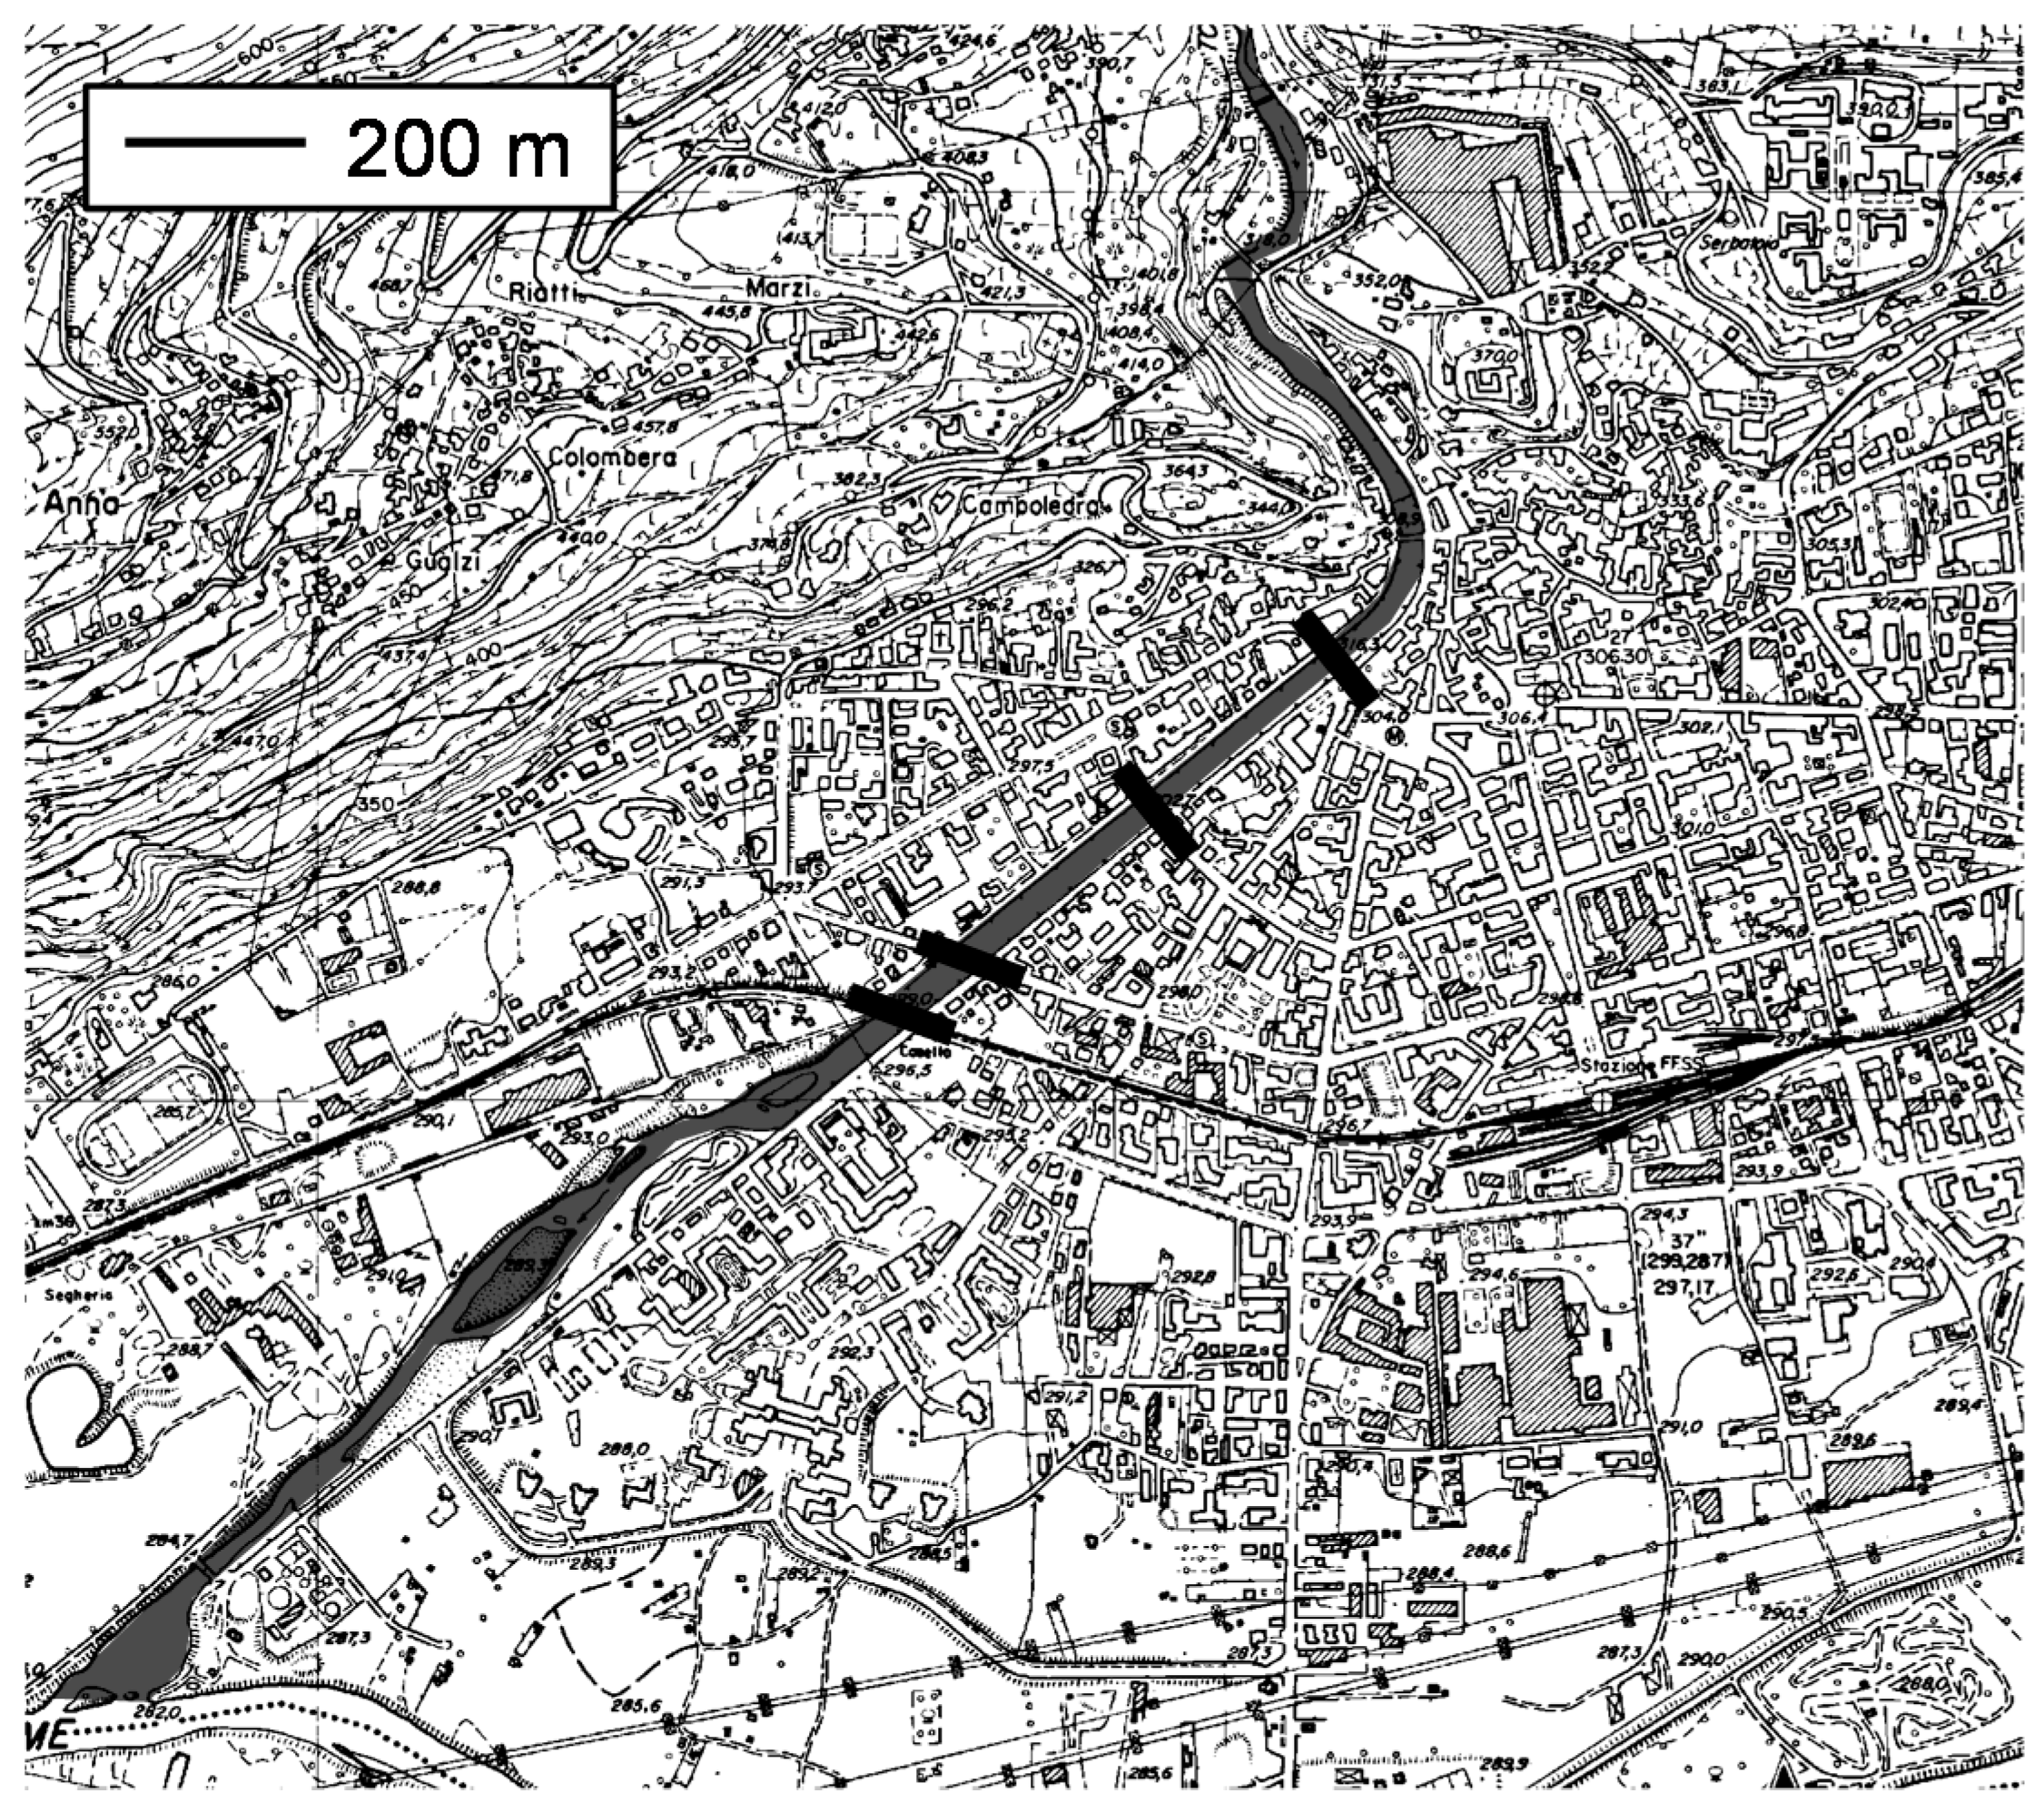
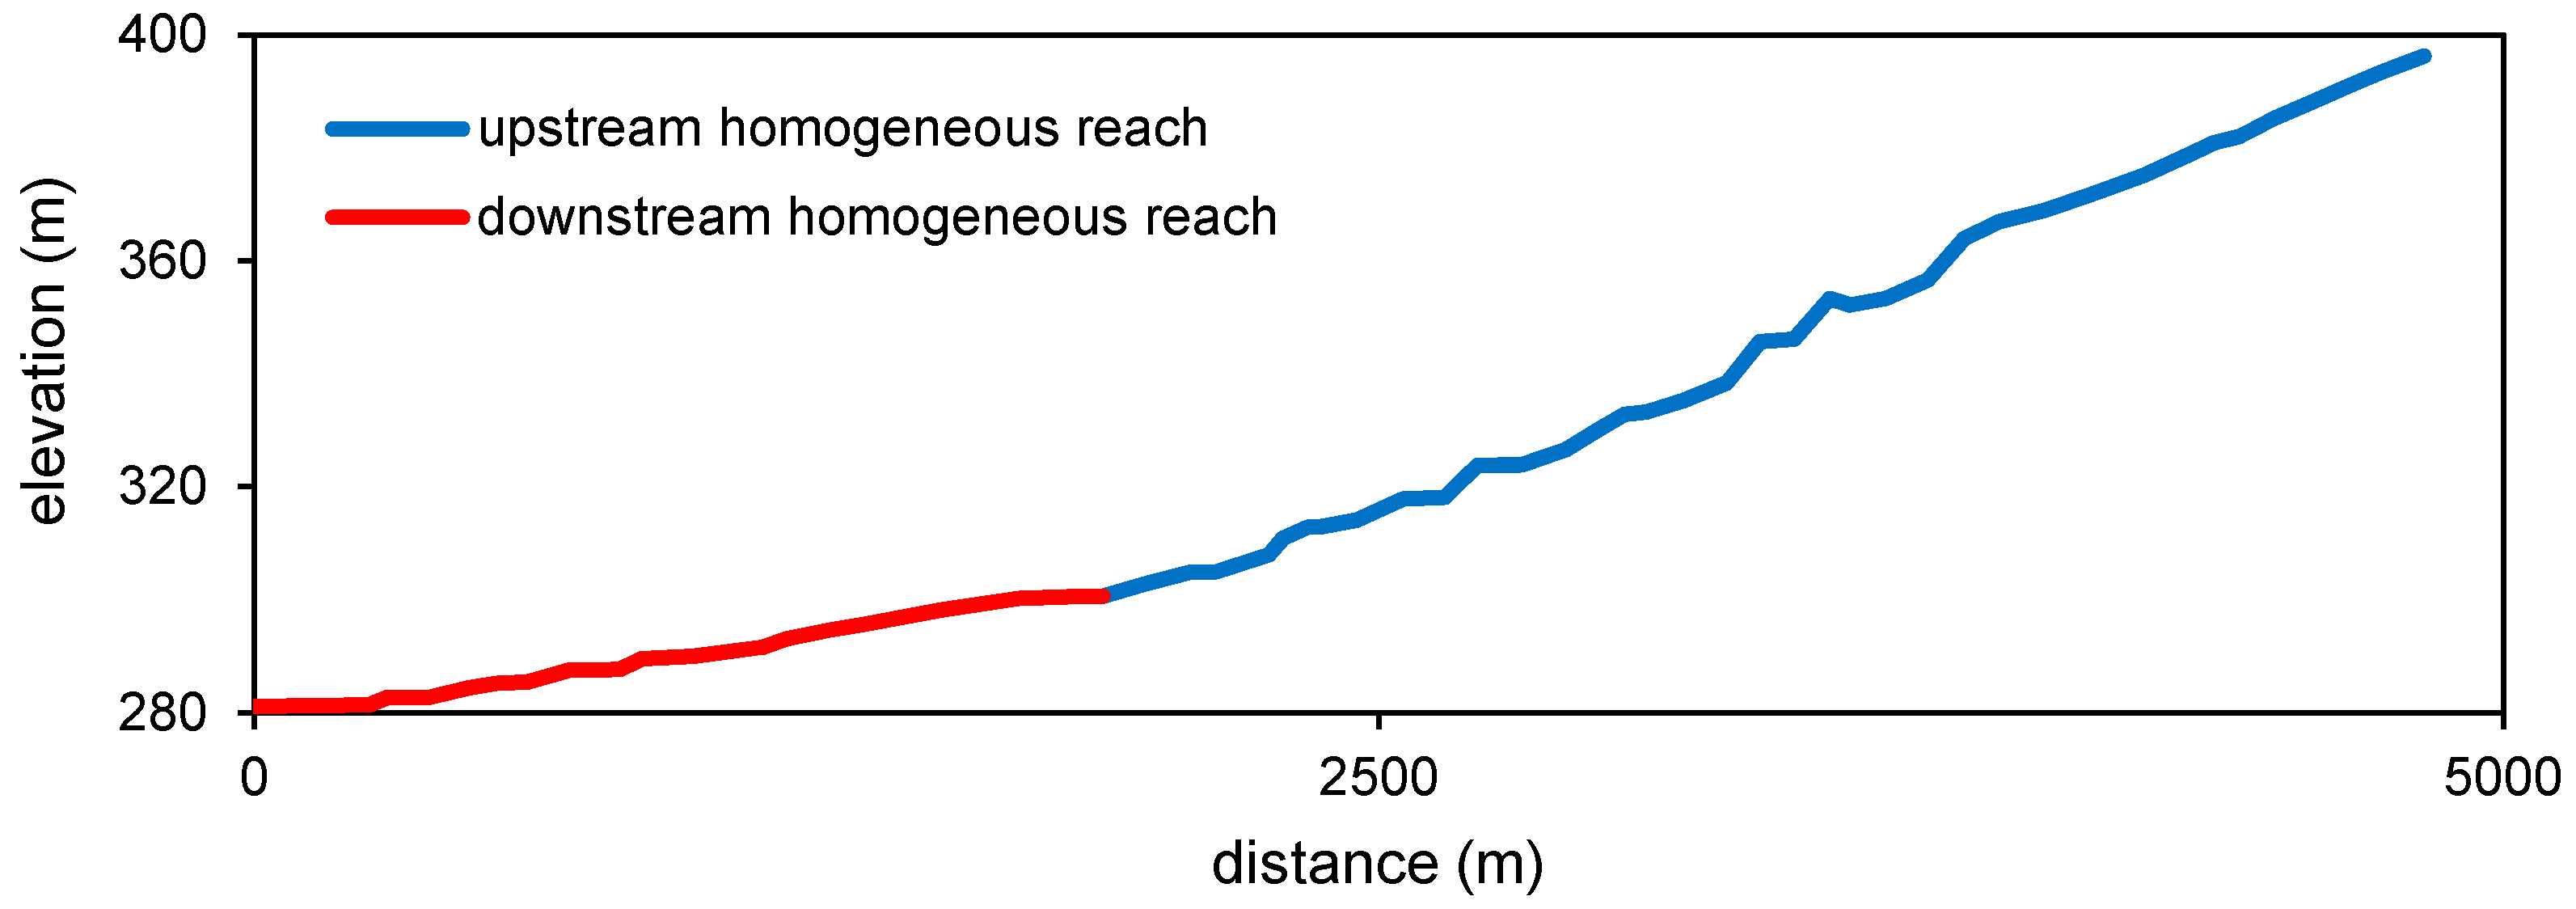
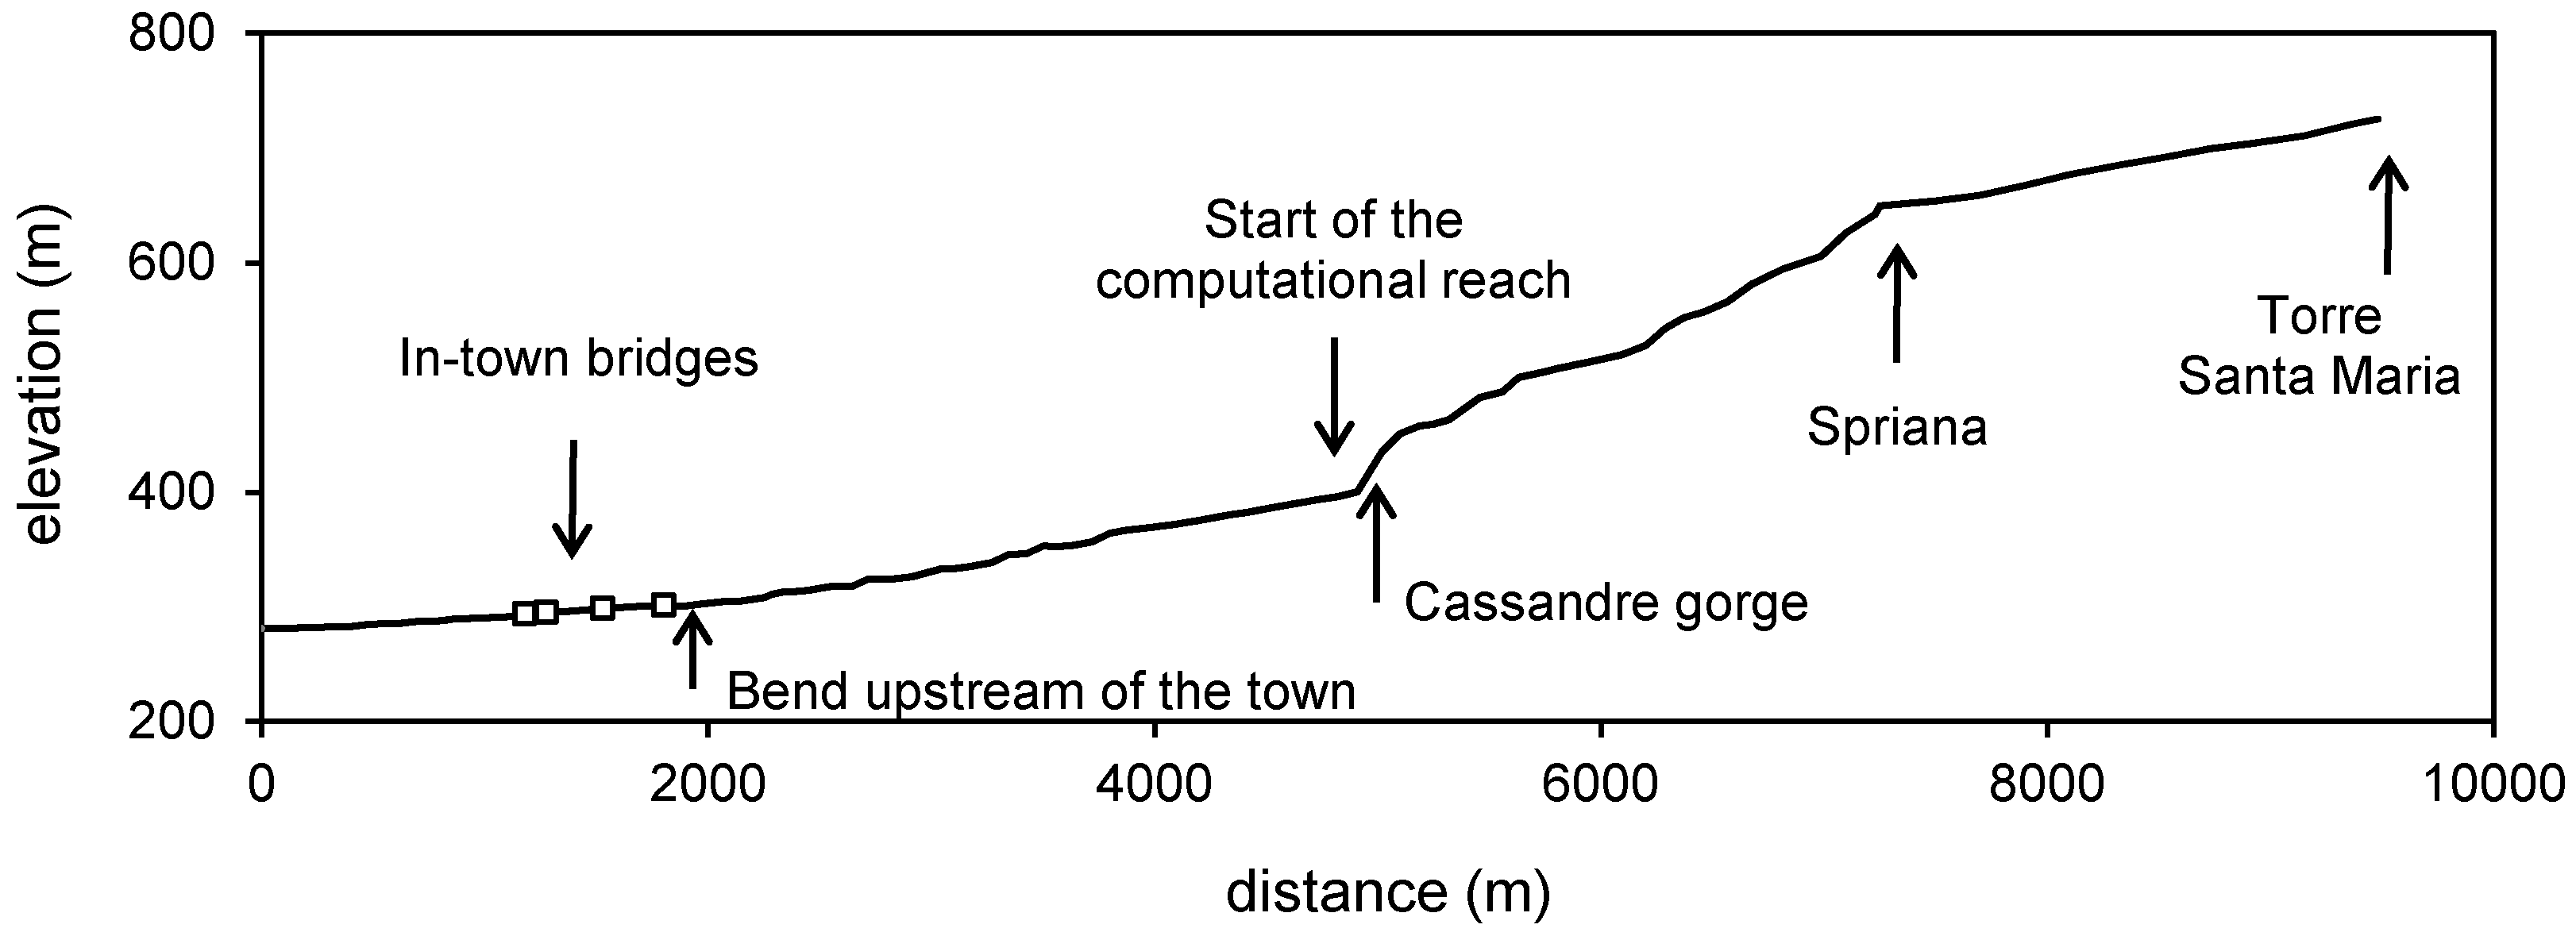
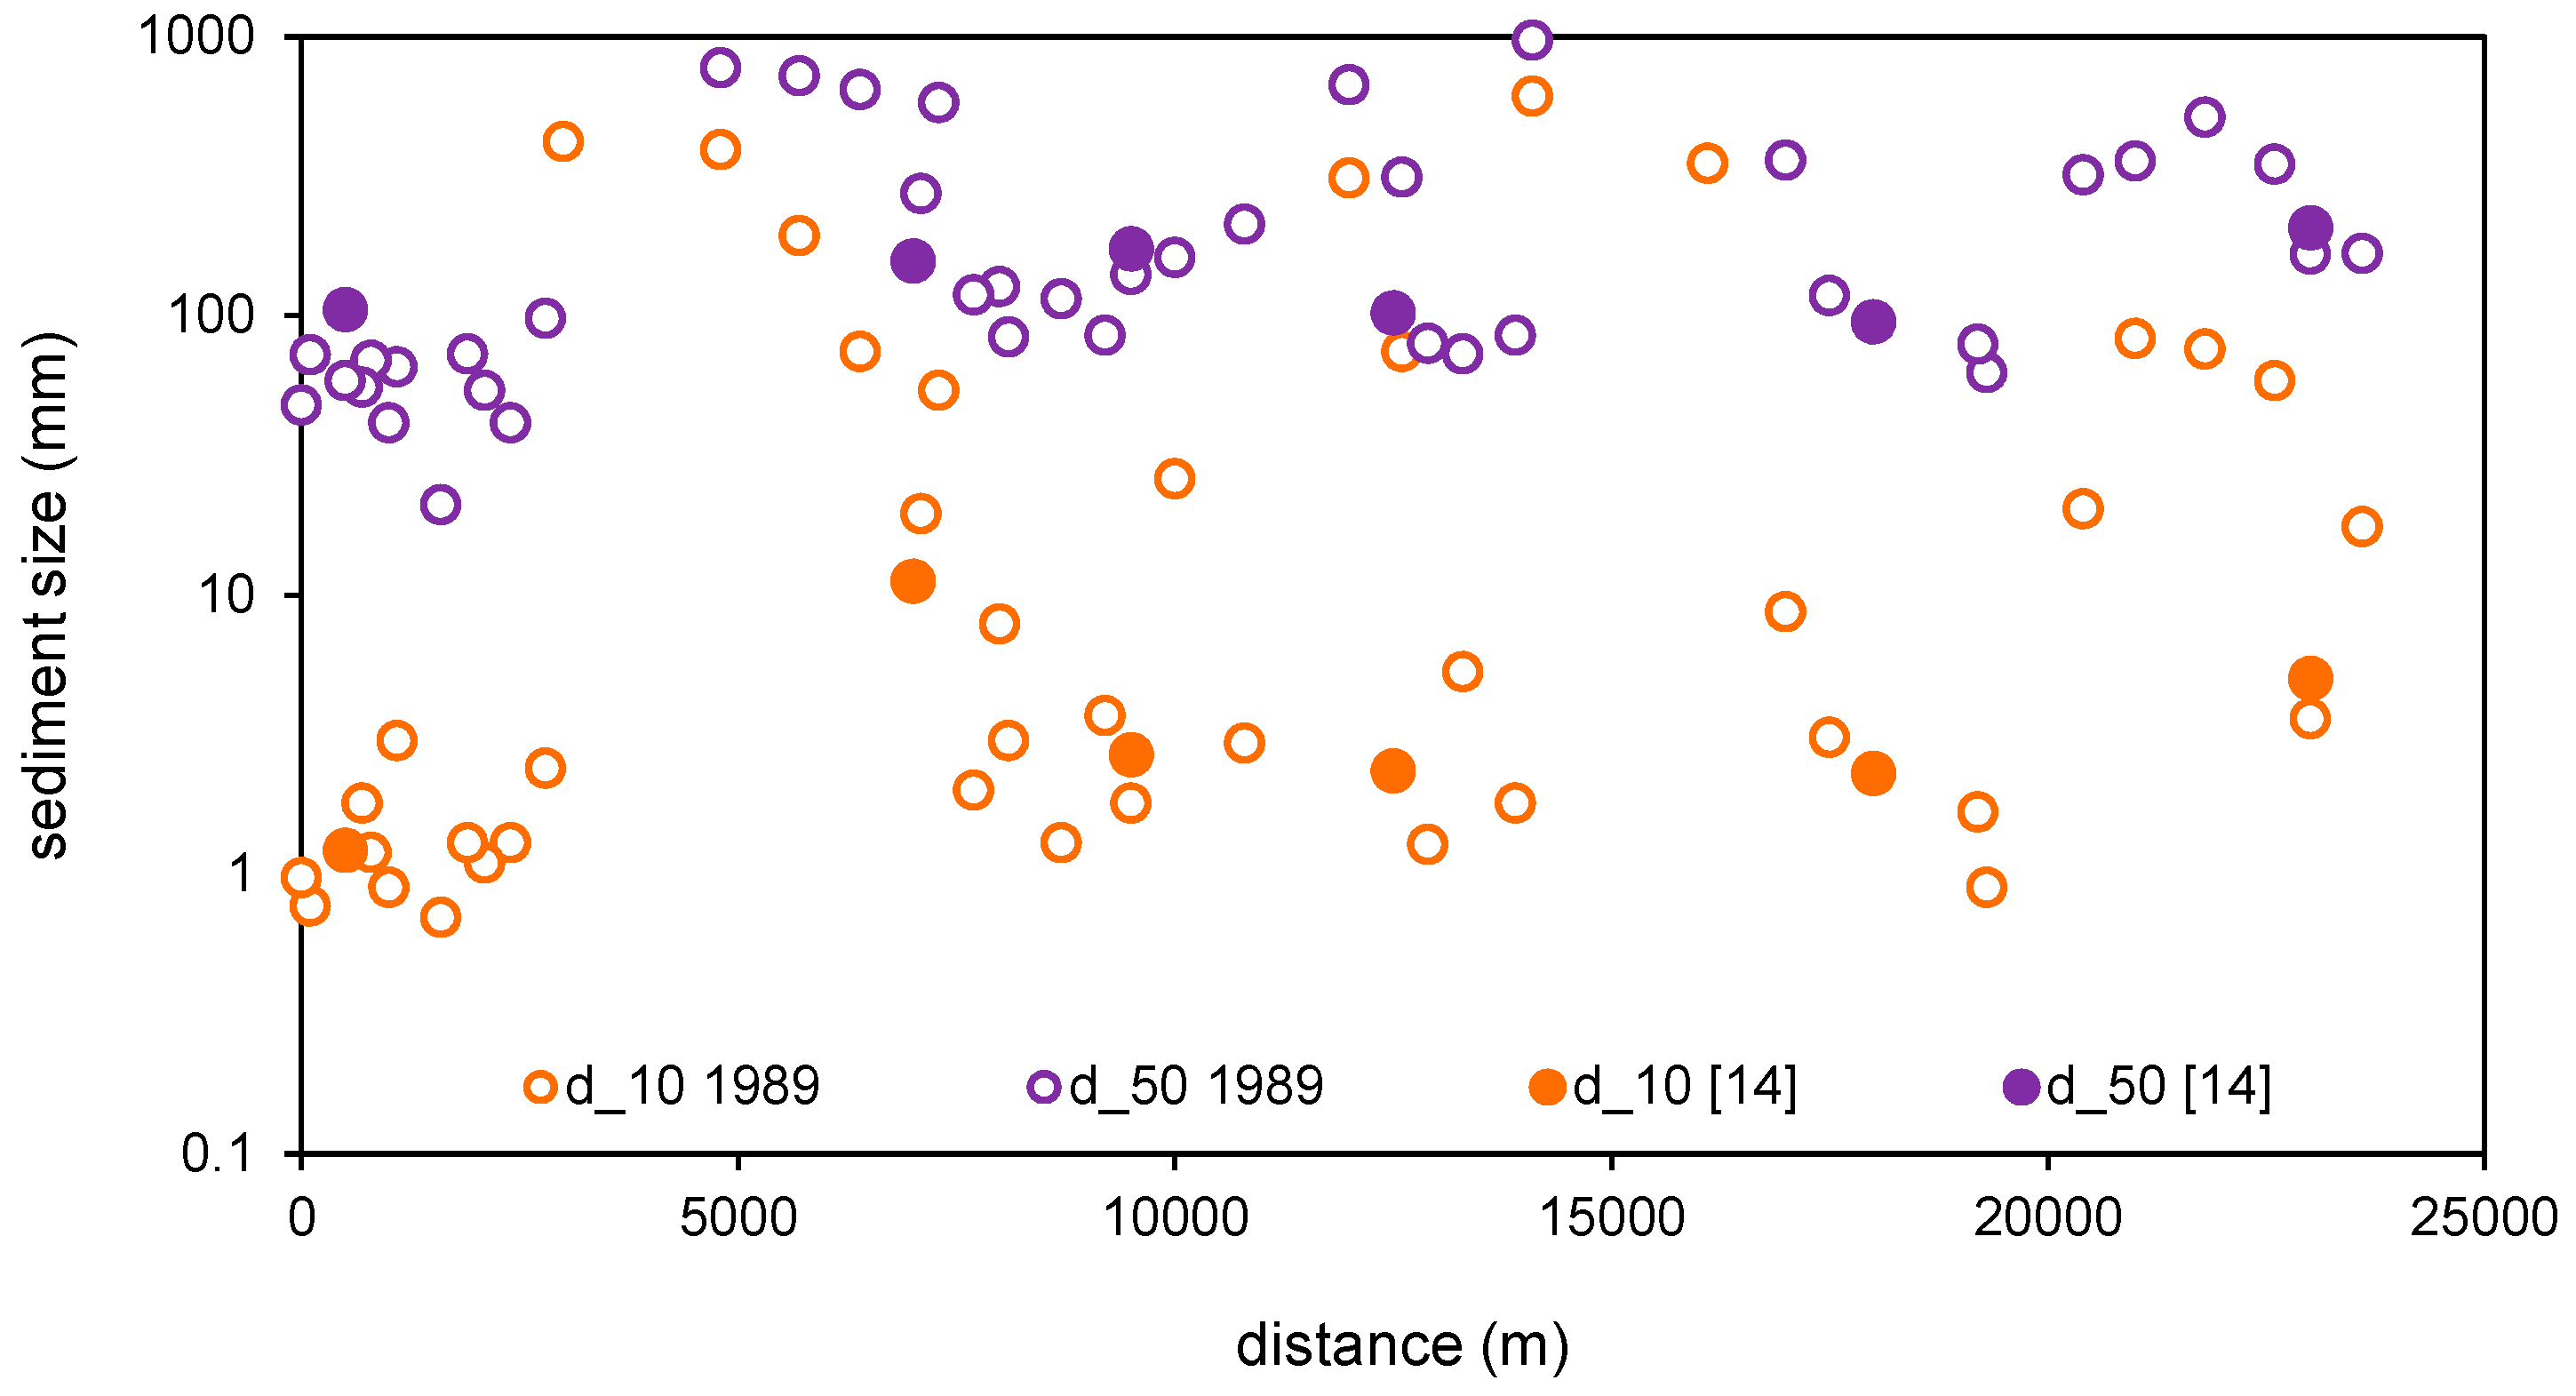
The river basin considered in this study is located in Northern Italy (Figure 1), with an area of around 320 km2 and altitude ranging from 280 to 4050 m a.s.l. Average precipitation is between 1000 and 1500 mm/year, with higher values generally corresponding to higher elevations. From a geological point of view, significant lithological heterogeneity is documented, including various metamorphic and sedimentary rocks. At the highest elevations, outcropping metamorphic and magmatic formations with local debris cover are present. Glacial deposits cover a wide surface of steep slopes at altitudes between 2100 and 2400 m a.s.l., whereas at higher altitude only localized glacial deposits can be found. The lower part of the valley is covered with glacial and colluvial deposits of variable thickness [22]. The soil cover (see Figure 1) is mostly associated with debris accumulations and lithoid outcrops deprived of vegetation (37% of the total area), coniferous forests of medium and high density (20%), sparse vegetation (10%), and glaciers and permanent snowfields (8%). Several landslides are present along the upper course of the Torreggio River and a large rock landslide is located near the village of Spriana.
The sediment supply in the basin is the result of diverse geomorphic processes, corresponding to different geological and geomorphological characteristics of the areas where they develop. The active phenomena generating sediment supply into the river course have been defined by [14] as basal erosion limited to short reaches of the riverbed, diffuse bank erosion, unstable slopes scattered throughout the entire basin (whose activity can be increased by thawing), and widespread hillslope erosion (including the action of runoff water on moraine deposits that are present in the higher zones of the basin).
Inhabited areas correspond to 1% of the total surface of the watershed. The most populated town of the valley (Sondrio, with around 22,000 inhabitants) is located close to the downstream section.

2.2. The River

The 25-km long Mallero River is the major water stream of the basin (Figure 1). The springs of the river are located at an altitude of 1650 m a.s.l., while the downstream section of the watershed coincides with the inflow of the Mallero into the Adda River that is the main water course of the Valtellina valley. The most important tributaries are the Lanterna, Torreggio, and Antognasco. The Mallero is characterized by a highly variable slope, the latter ranging from 4% to 40% in the high course and decreasing to less than 1% in the last 2 km before the confluence (see the bed profile for the last 9.5 km in Figure 2). The bed granulometry according to two surveys from 1989 and 1990 [14] is presented in Figure 3. For the survey from 1989, longitudinal variability was given for d10 and d50 (with d as the sediment size and a subscript as the percentage in the granulometric distribution). Complete granulometric curves were given by [14] for some locations; characteristic sediment sizes could be extracted from these curves and data for d10 and d50 were also included in the plot. The river presents the typical variability of a mountain water course, with the median sediment size ranging from a few cm to more than 1 m. Sediment sizes are typically larger in the upstream portion and decrease towards the river outlet. Two regions with the largest sediment sizes are recognizable at around 5000 m and 15,000 m, the former corresponding to the Cassandre gorge in Figure 2.
The river flows through Sondrio just downstream of a sharp bend (Figure 4), with a transverse section that in this reach is approximately rectangular and has a width of around 40 m. Four bridges (also shown in Figure 2) are present in the in-town reach. The flow duration curve at Sondrio was estimated based on records taken during the 1990s and ranges from a few m3/s to around 150 m3/s, the 182-day discharge being around 7 m3/s (Figure 5).

2.3. Past Events

Several flash floods occurred in the past: events have been reported for 1817, 1834, 1885, 1911, 1927, and 1987. According to, for example, [14], the majority of the high-flow events have been recorded during the summer and autumn seasons, and thus could be attributed to precipitation only. Events of particular intensity have not been recorded during spring and, therefore, the contribution of snowmelt to the discharge of Mallero can be considered negligible. The existing documentation highlights that flood hazard for Sondrio is mostly represented by sediment depositing in the in-town reach and reducing the section conveyance. A flood in July 1987 (for a return period of 50–60 years) was relatively well documented by some post-event studies (e.g., [11,12,13,14]). The peak water discharge was 500 m3/s, to be compared with an estimated value of 640 m3/s for a return period of 100 years; the total sediment volume mobilized throughout the catchments was 3 × 10⁶ m3; sediment sources were mostly represented by distributed erosion (contributing for ~40%), landslides along the Torreggio tributary (~30%), bank erosion (~15%), and remobilization (~15%), frequently associated to structure collapse; the sediment yield into the river 5 km upstream of the confluence was 7 × 10⁵ m3 (with no further significant yield from the valley slopes downstream of that location); around 2.2 × 10⁵ m3 were deposited in the in-town reach, with aggradation depths up to 5 m that represented a very significant fraction of the total bank height (ranging from 5 to 8 m in the in-town reach). As discussed by [17], among others, the bank-full discharge in the in-town reach is around 700 m3/s considering a non-aggraded bed, whilst it decreases to 150 m3/s considering the aggradation that occurred during the flood of 1987. During this event, however, the town was not flooded. This was later explained considering that as confirmed by numerical simulations (e.g., [17]), most of the aggradation took place during the tail of the event where the discharge was already much lower than the peak value.

3. Design Flood Scenario Modeling

Historical records demonstrate that the town of Sondrio is prone to flash-floods, whose danger can be significantly exacerbated by high sediment transport causing aggradation of the river bed in the in-town reach. Therefore, any design scenario developed for risk assessment shall account for the described dynamics.
Sediment may be supplied by different sources, which may contribute to the total yield of the basin (e.g., [23]). Hillslope erosion [24], bank erosion [25], and concentrated sources [26] are the main contributors. This study conceptually considered the contribution of distributed erosion and scattered, local sediment sources. By contrast, the sediment that could be supplied by large landslides such as the one of Spriana was not taken into account. Such a landslide is in fact characterized by an extremely large estimated volume (more than 20 Mm3 as reported by [27,28]) and its collapse would thus lead to a dam-break wave rather than a flash flood (e.g., [18]).
The river reach considered for the assessment corresponded to the last 5 km before the confluence with the Adda (see again Figure 1 and Figure 2), whereas the in-town reach corresponded to the last 2 km. The choice to model this reach followed the will to reduce the effect of any sediment supply condition at the upstream boundary. Previous investigations [16,17] demonstrated that considering the typical duration of an event, the results of hydro-morphologic models were very sensitive to the upstream boundary condition in the upper portion of the modeled reach, but practically insensitive in the in-town reach.
In this work, a 100-year return period was considered for the river flood. Using a 100-year return period (or 200-year for larger rivers) is a standard practice in Italy. However, since initial conditions can influence the dynamics of a river reach (see, for example, [29], who also studied the Mallero River), the sediment transport was also preliminarily investigated for flows in the yearly duration curve in order to characterize the river behaviour over a longer term.

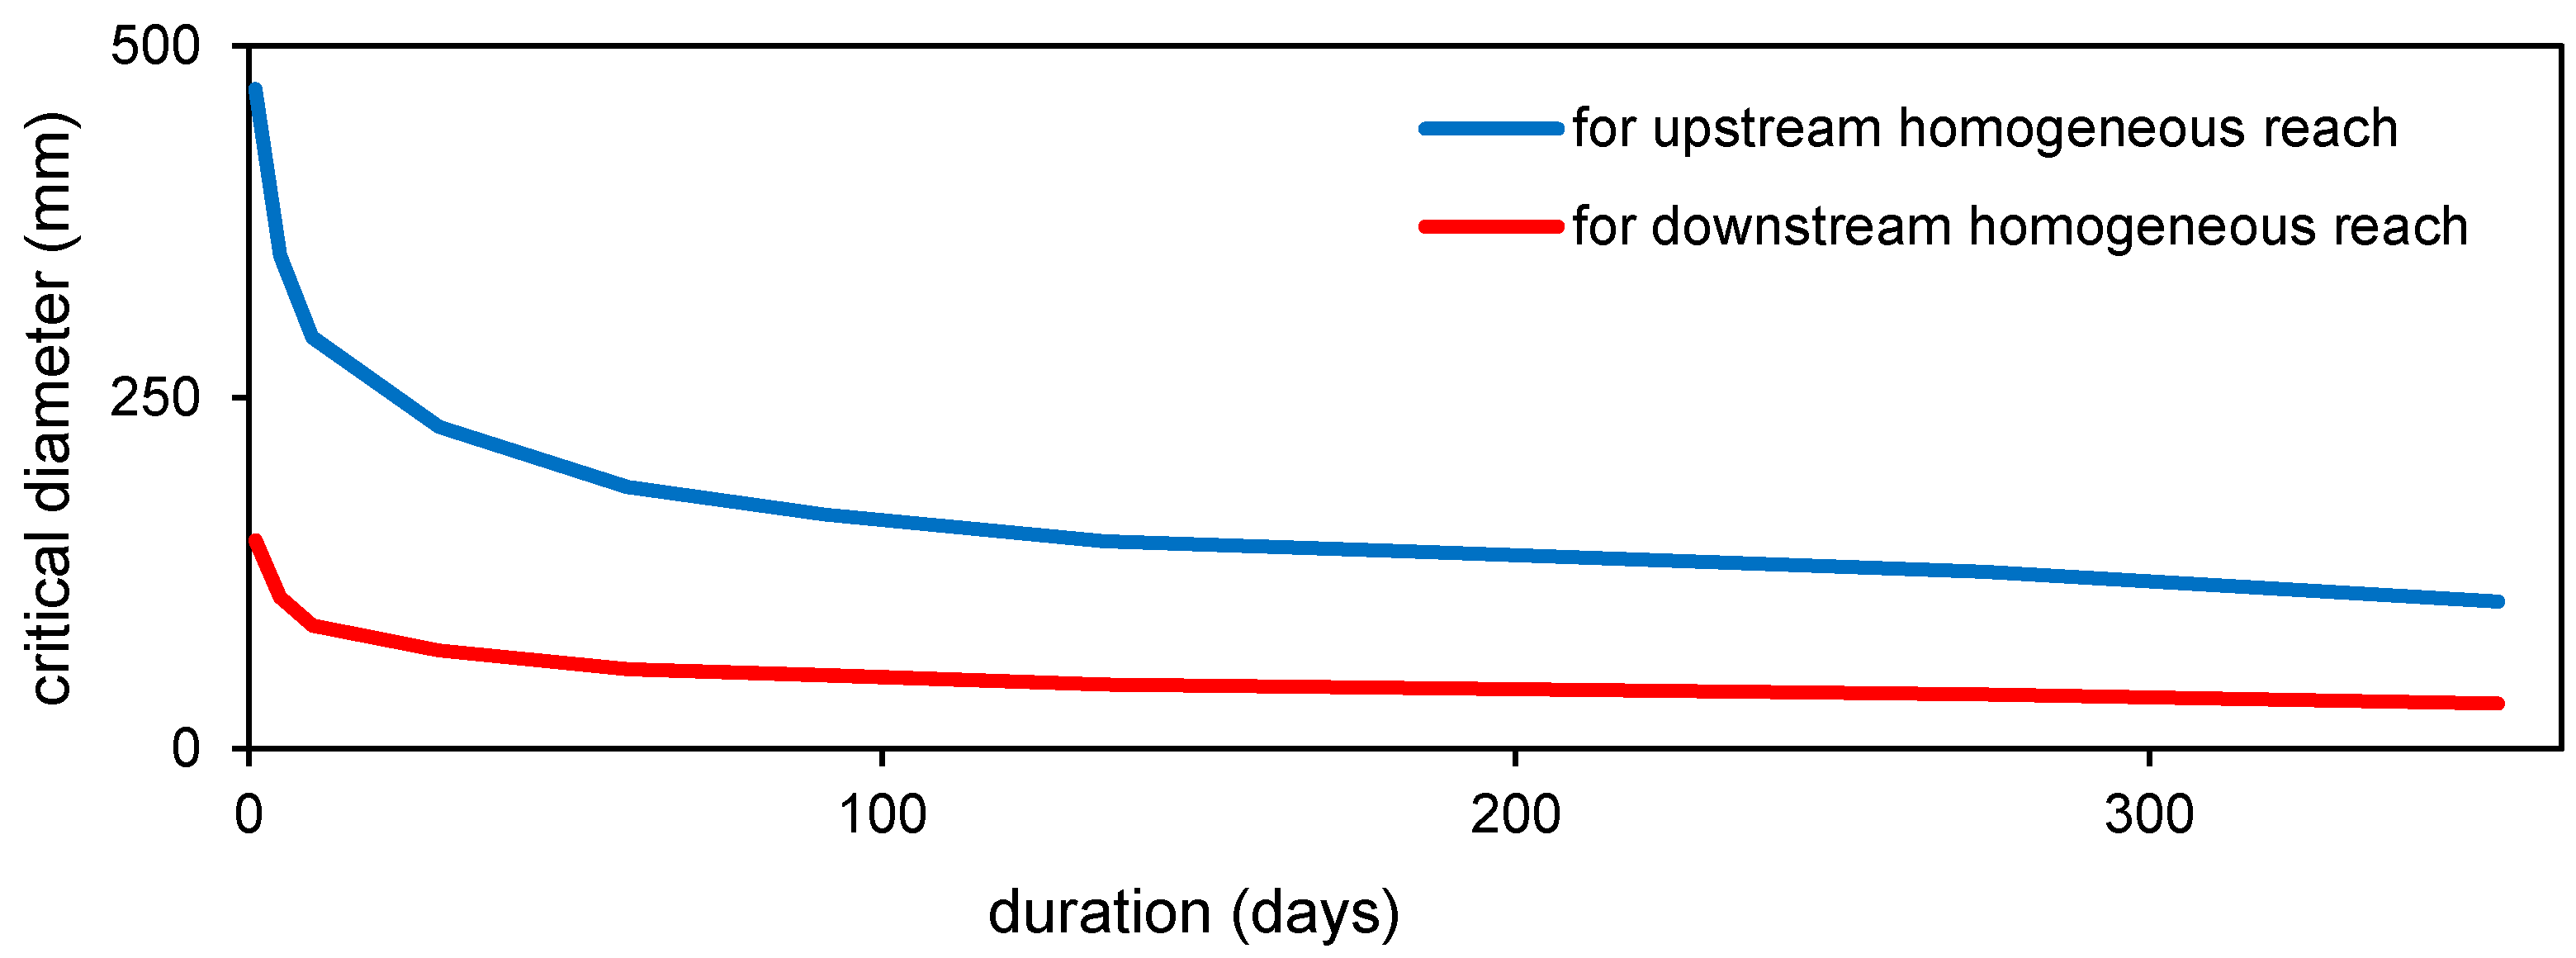
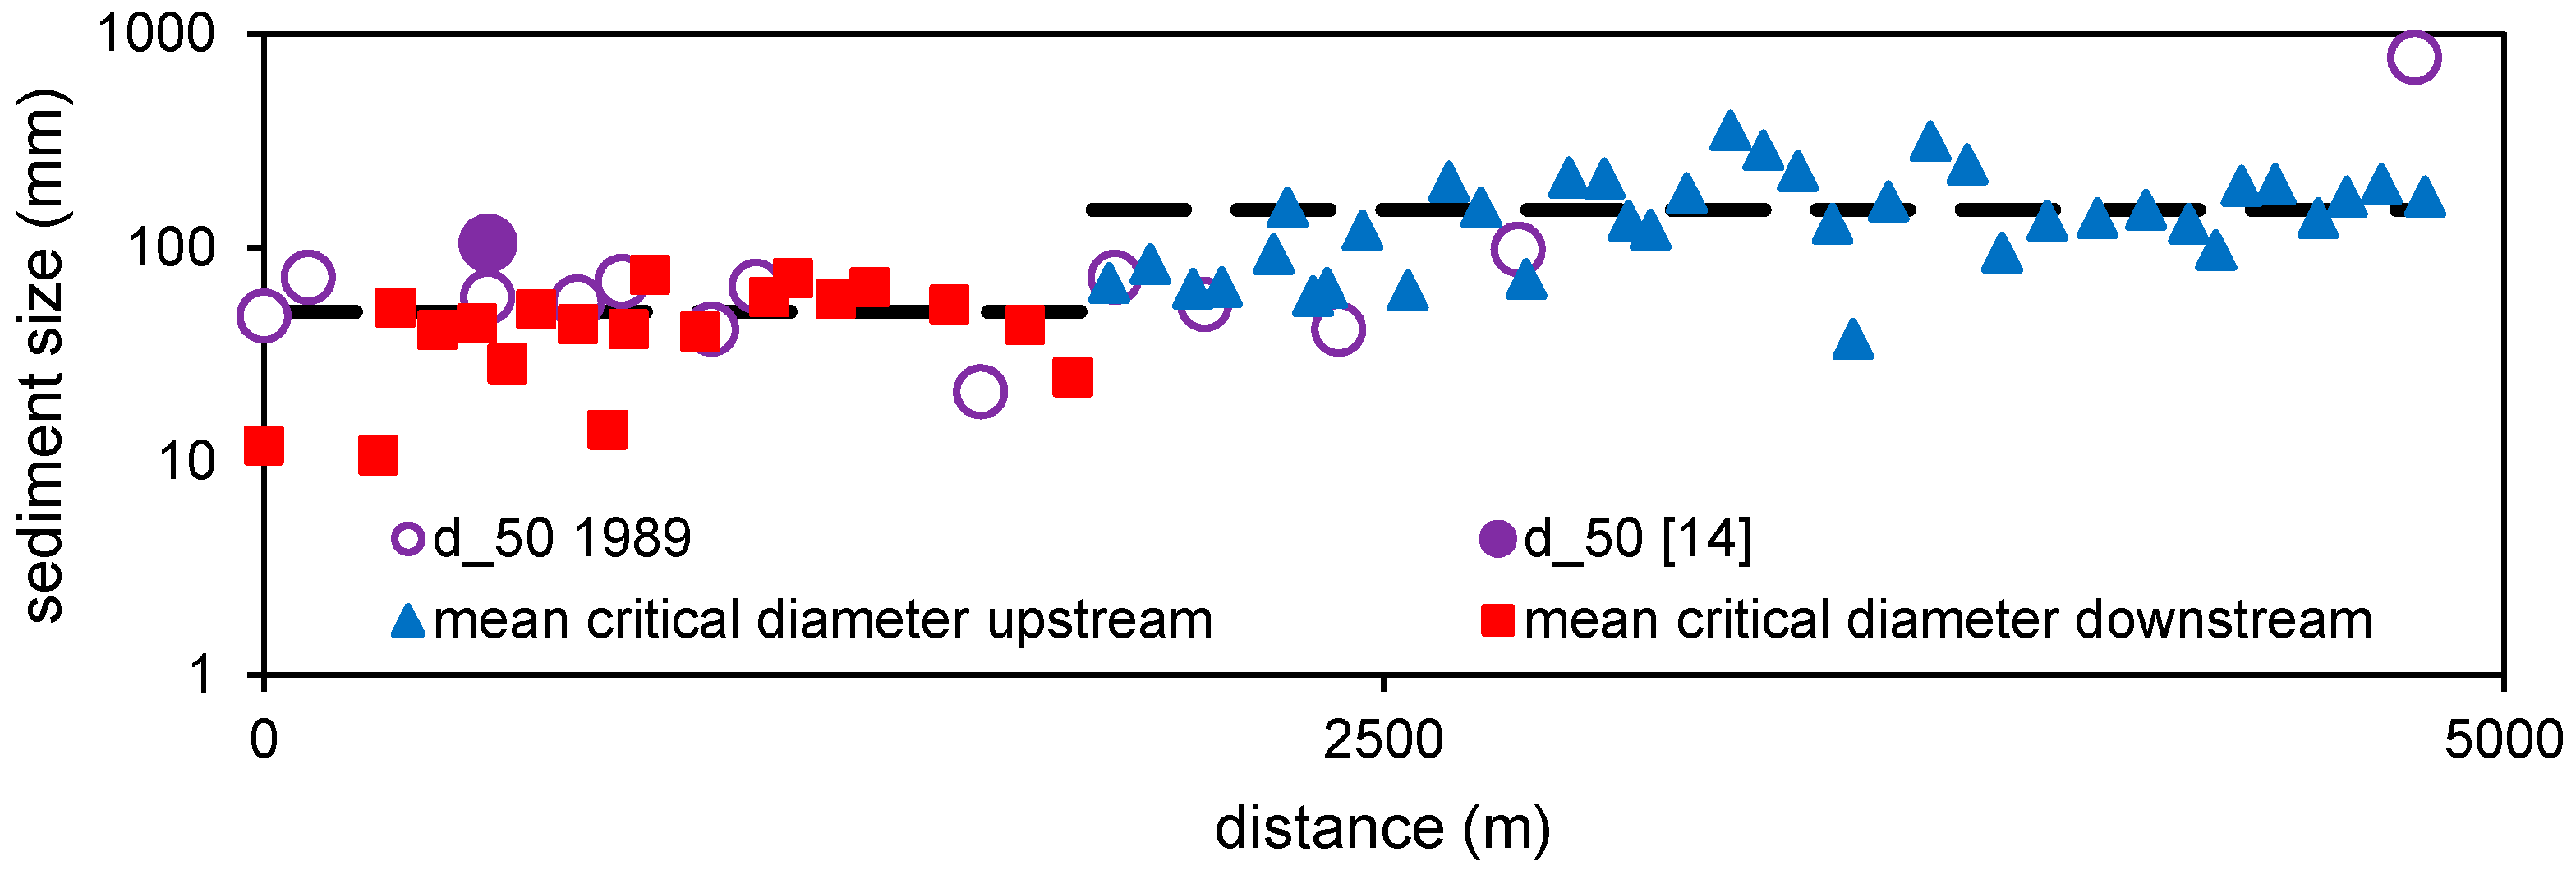
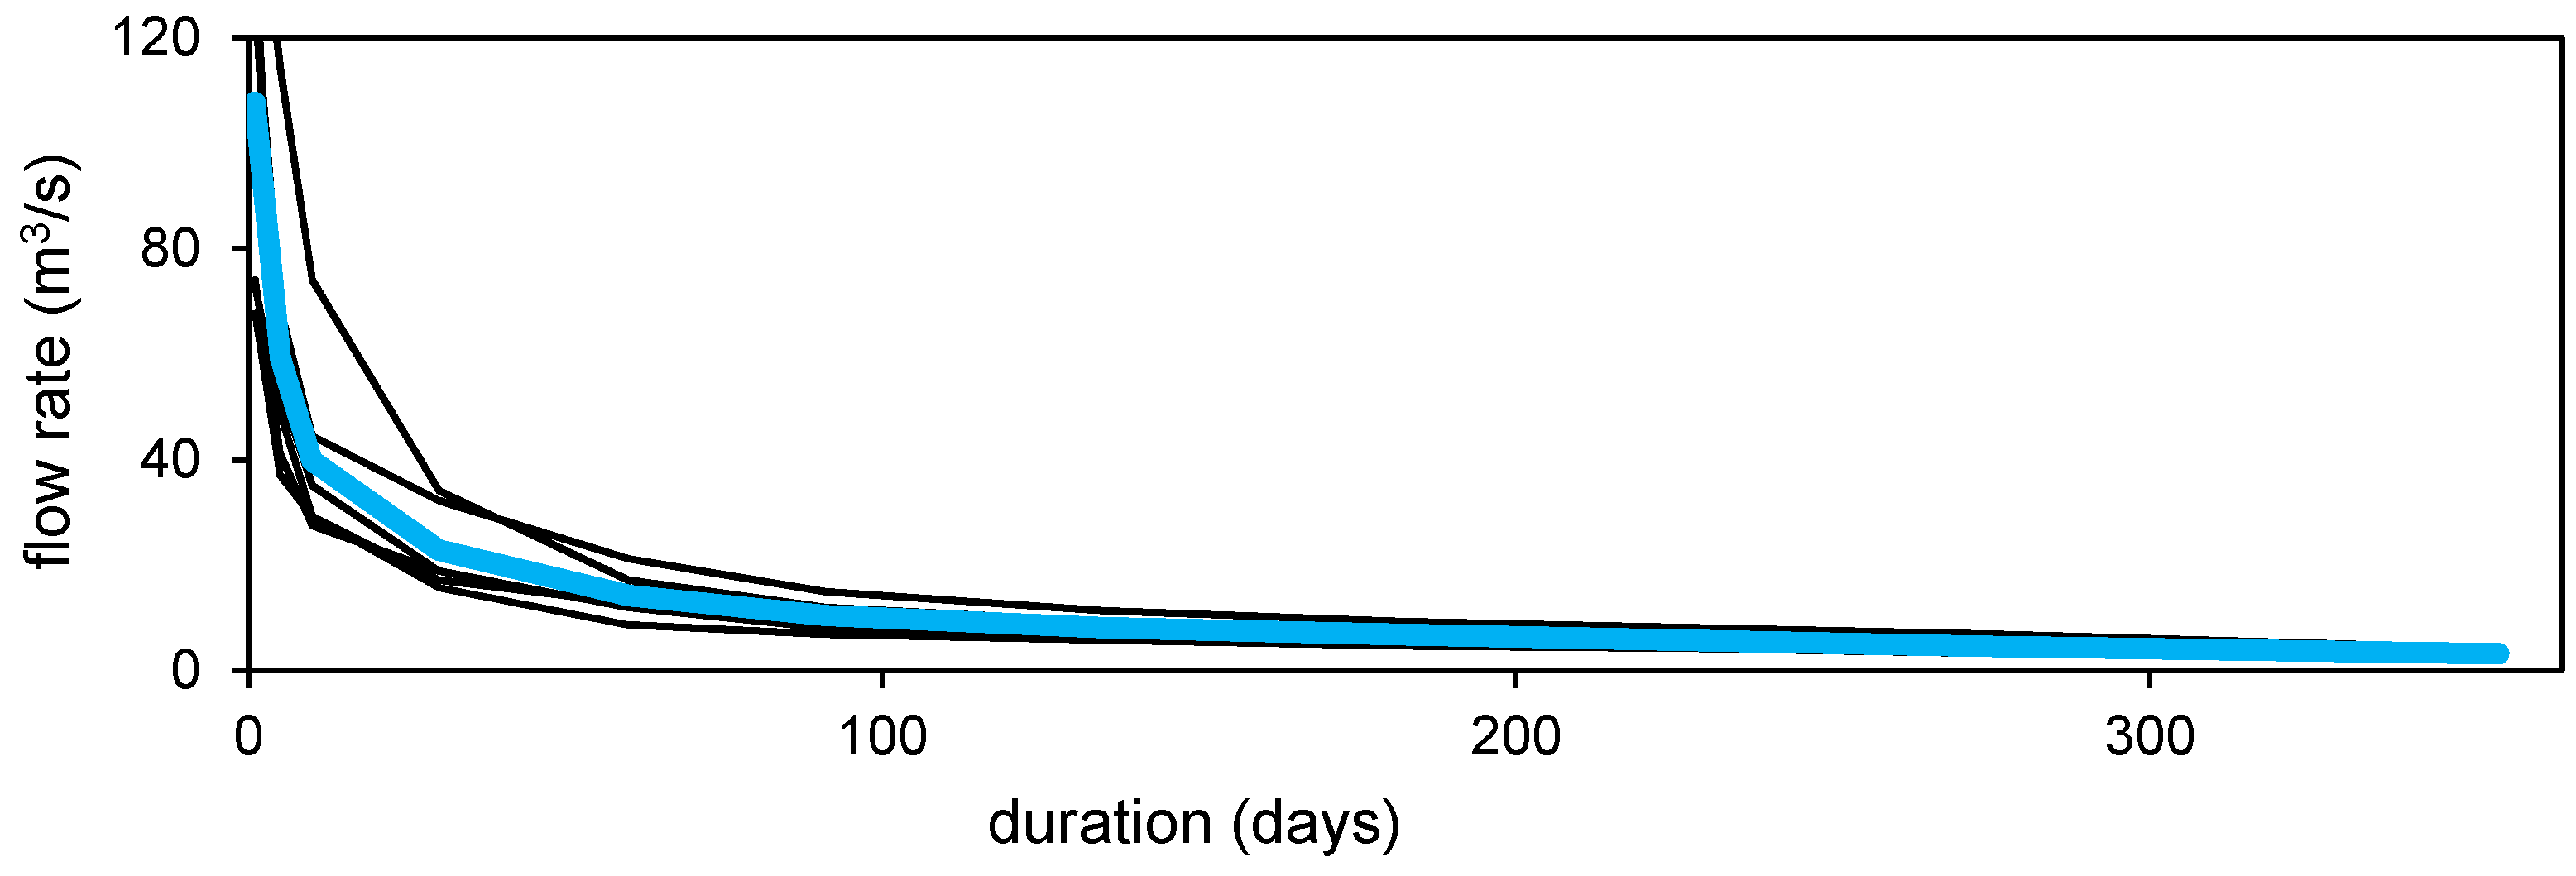
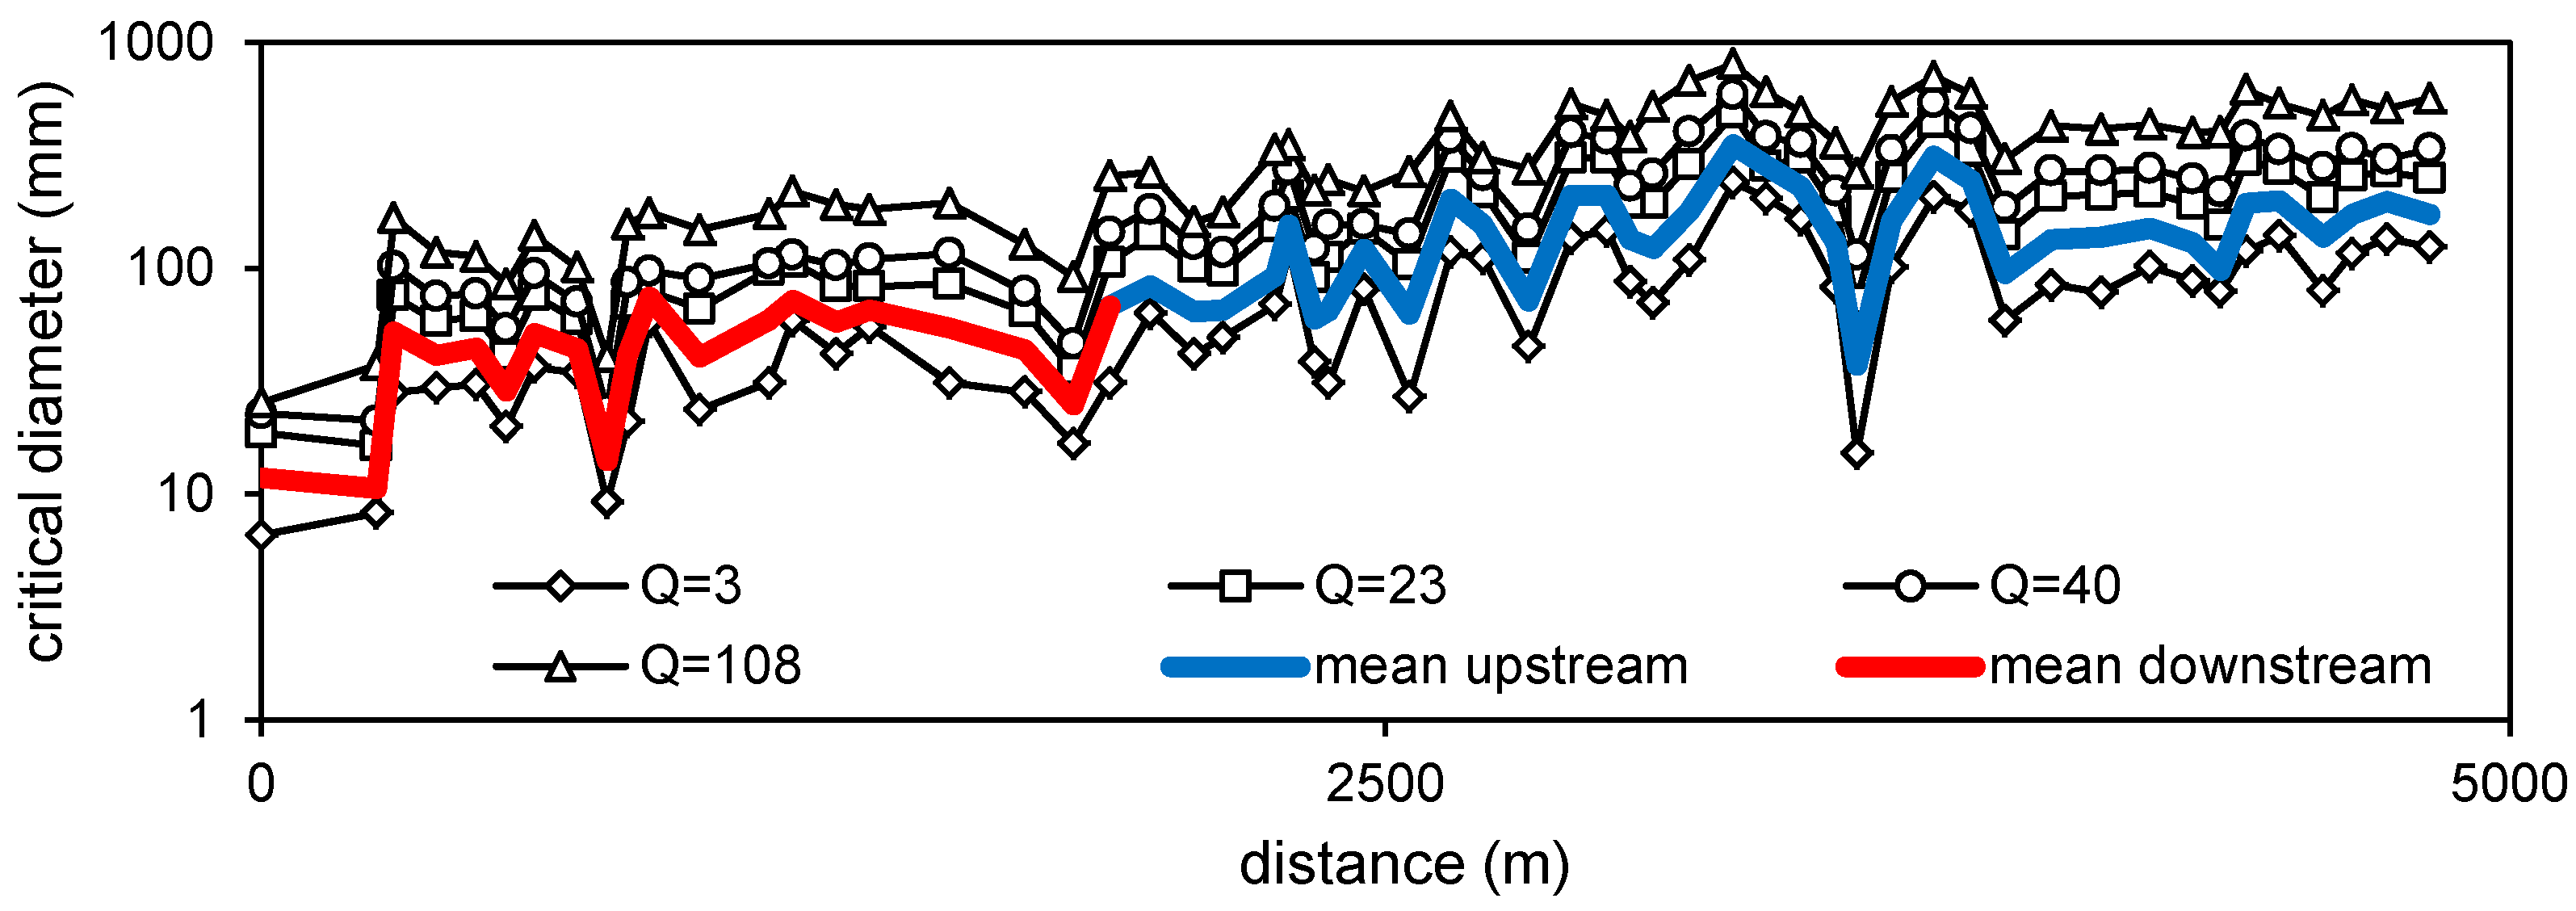
4. Hydro-Morphologic Analysis for Flows in the Yearly Duration Curve

Several computations were performed for a series of flow rates in the average duration curve (Table 1). The objective of these computations was to calculate the critical sediment size, intended as the size of the largest sediment particle that can be transported by the flow at a certain section. A threshold value of the Shields [30] number of 0.05 was assumed as a reference. Local bed shear stresses were determined by clear-water hydraulic computations performed with the assumption of a fixed bed. Figure 6 presents a stream-wise evolution of the critical sediment size for a variety of flow rates (only some of those listed in Table 1 are depicted for the sake of plot readability), together with an average critical size whose computation took into account the durations corresponding to each value of the discharge and, in turn, of the critical diameter. For interpretative purposes, the continuous variability of the river properties was divided into two homogeneous reaches based on the mean value of the critical size. The two reaches corresponded well with the different slopes in the river reach under consideration (Figure 7). A duration curve for the mean critical diameter of each reach could be built accordingly (Figure 8).
The duration-averaged values of the critical diameters reasonably matched the surveyed sediment sizes (Figure 9). This was interpreted as an indication of stability of the river profile for ordinary flows. In turn, it was assumed that using the computed sediment sizes in the river would correspond to a good initial condition for a short-term hydro-morphologic model that shall be described below. Reach-averaged sediment sizes (dashed lines in Figure 9) were 50 and 150 mm in the downstream and upstream homogeneous reaches, respectively. An abrupt transition in sediment size was thus introduced at 1.8 km from the end of the river, analogous to the gravel-sand transition described for courses with lower slope (e.g., [31]). Converting a continuous variability into a sharp transition was in part an arbitrary operation. In the following sections, sensitivity analyses will be presented for the chosen location of the transition.
The sediment transport capacity of the river was also investigated for these flow conditions, as computed by the Meyer-Peter and Muller formula [32]. The yearly sediment volume transported in the downstream reach is 6 × 10⁵ m3, and the volume for the upstream reach is 3 × 10⁶ m3. Such volumes should be ensured by the sediment productivity of the catchments. Several models are available for estimation of these volumes (see, for review, [33,34]). The study from [20] applied the Erosion Potential Method (described in [20,34]) finding yearly sediment yields on the order of 105, in agreement with present computations, but suggesting a transport-limited and supply-limited behaviour of the downstream and upstream reaches, respectively.

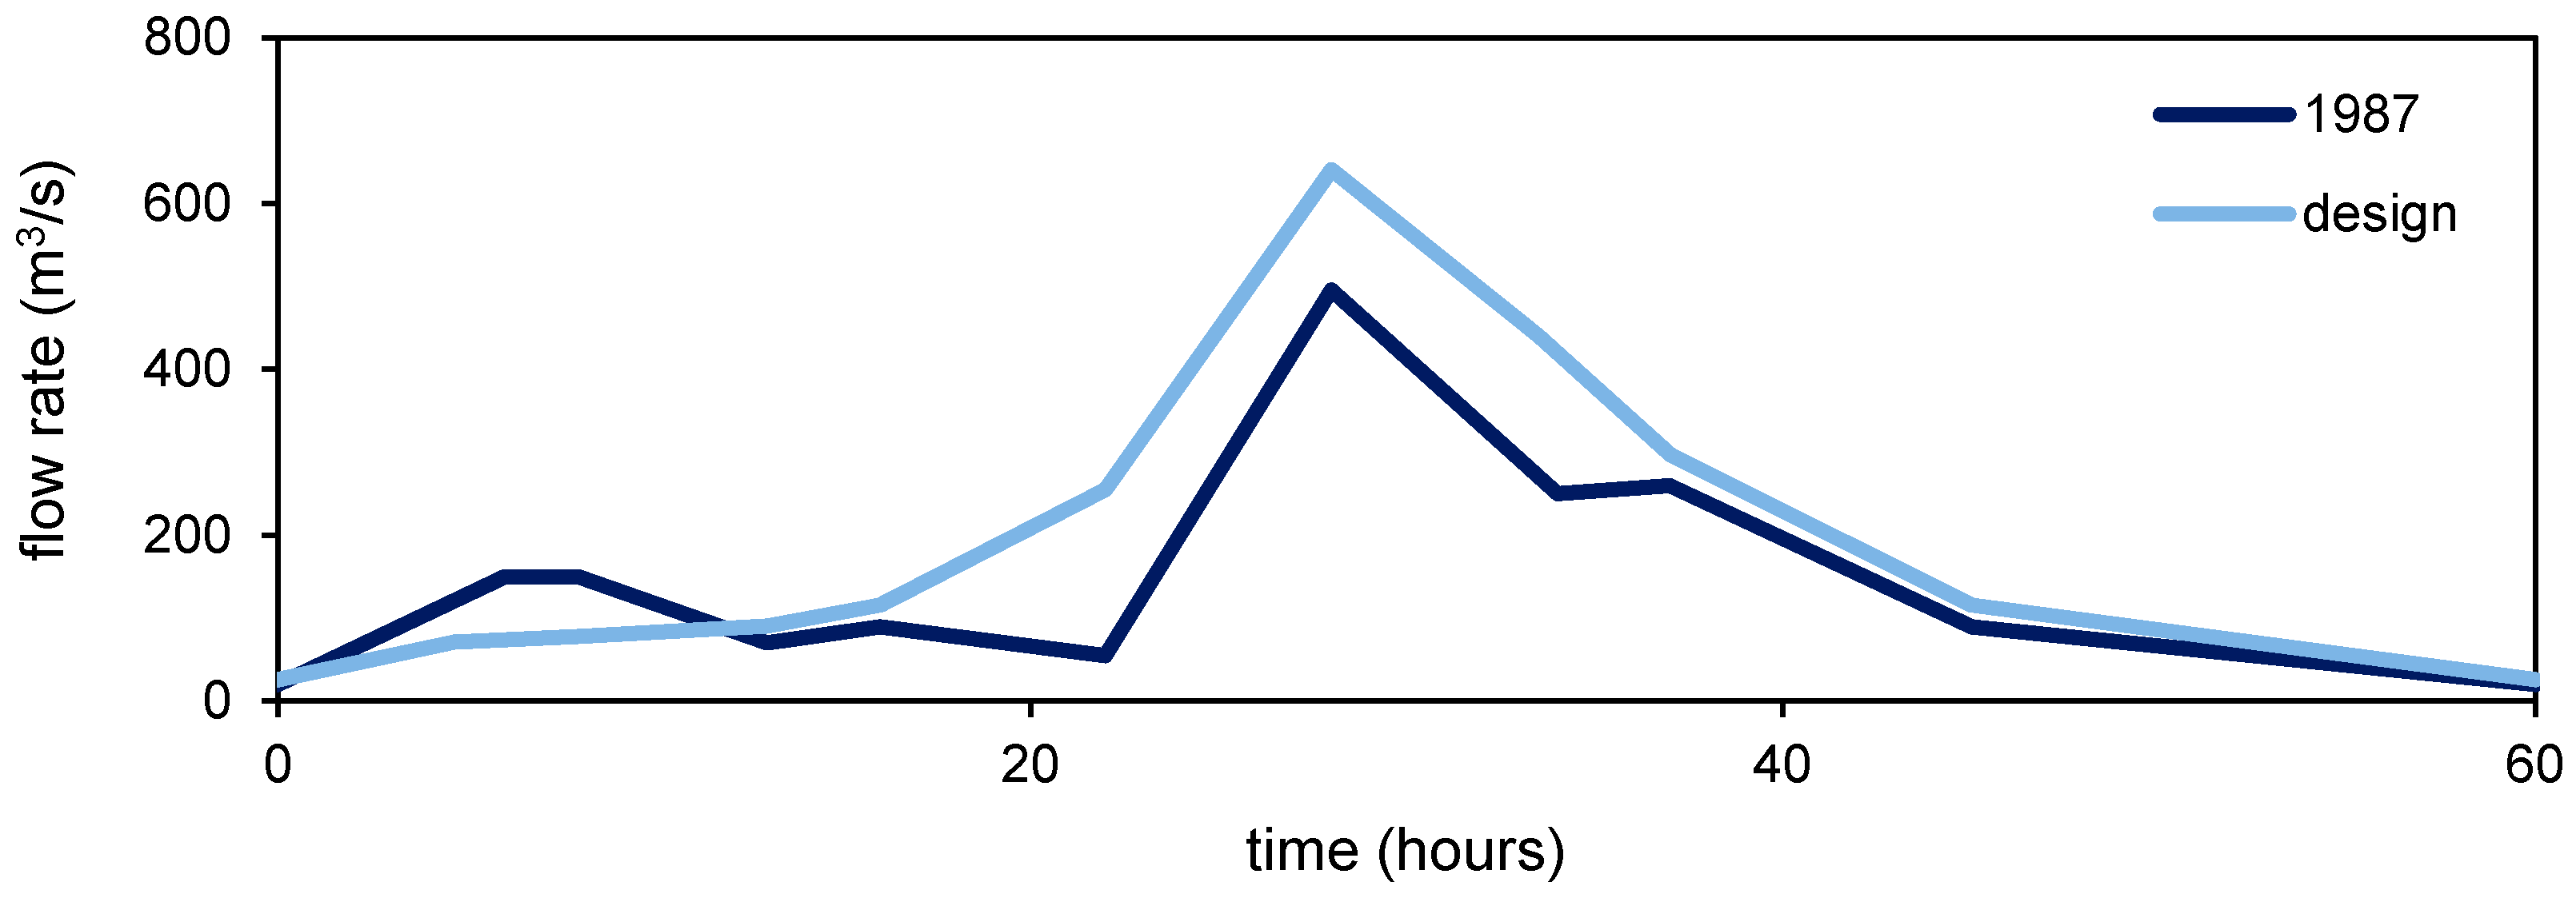
5. Hydro-Morphologic Analysis for Peak Flow

The propagation of the flood wave and the resulting morphologic evolution of the river bed were modeled using the one-dimensional Saint-Venant equations (stating the conservation of mass and momentum for the flow) and the Exner equation (stating the conservation of mass for the sediment). The numerical solver used was implemented in the Basement software [35] provided by ETH Zurich. The model assumes immediate adaptation of the sediment transport rate to the local hydro-dynamic conditions. The bed-load solid discharge was computed using the equation by Meyer-Peter and Muller [32] which, according to [5], is suitable for bed slopes lower than 5% (the slope values in the Mallero reach used for the computations respect such a limitation). The sediment transport formula by [36] was also used for comparison.
The geometric model included 57 cross sections (see Figure 7). The spacing between neighboring sections ranged between 31 and 116 m, apart from four instances of 154, 169, 177, and 256 m. The temporal step of the computation was dominated by the shortest spacing, as it was computed based on a Courant number of 0.9.

5.1. Model Parameterization/Validation

The model was used to simulate the flood event of 1987, for which [12,14] provided data representing the post-event profile of the bed elevation. These data were used as benchmarks for the simulation. In this way, an attempt was made to overcome the lack of field validation that is frequently a shortcoming in similar studies (e.g., [37,38]).
The model input parameters were (i) a flow hydrograph; (ii) the bed roughness; (iii) the sediment size and (iv) a sediment supply at the upstream computational boundary. The flow hydrograph provided by [14] among others was used (Figure 10), with a duration of 60 h and a peak discharge of 495 m3/s. The sediment sizes obtained from the computations for flows in the duration curve were implemented, thus 50 mm in the downstream reach and 150 mm in the upstream reach (Figure 9). Corresponding roughness coefficients were computed as 26/d1/6 (with d as the sediment size expressed in m) and were equal to 36 and 43 s/m1/3, respectively. An equilibrium condition for sediment transport was used at the upstream boundary. This is indeed a condition of frequent use in similar studies (e.g., [39,40]).
The result of a hydro-morphologic model can be sensitive to the values used for parameterization. Results for the Mallero river were presented by [17] in terms of a sensitivity analysis of the back simulation of the 1987 event to the sediment size, for which values from 1 to 10 cm were used. In that study, a limited sensitivity was found that was attributed to an equal-mobility condition associated with high bed shear stresses that are typical of high flows. Such a condition also favors the use of a single sediment size mimicking a granulometric distribution. Furthermore, the studies of [16,17,37] demonstrated (in the former case, for the same river considered here) that aggradation patterns in a downstream portion of a computational reach were almost independent of the sediment supply, provided that the duration of the modeled event was short. This piece of information was used to choose the extent of the computational domain, as already mentioned in Section 3. Additional issues of the location of a transition for sediment size and of the transport formula used in the computation will be addressed in the following.
The result of the hydro-morphologic model for the full computational reach is presented in Figure 11. The temporal evolution of the aggradation process showed a dispersive behaviour of the sediment, as also found in several other studies (e.g., [41,42]), with the solid material accumulating in the intermediate portion of the reach, where initial slopes were lower. As seen, the river sections are quite high for distances larger than 2500 m. Therefore, in the following, attention will be focused on the last 2.5 km that moreover correspond to the in-town reach where population and property are exposed to the flood hazard. Results for the in-town reach are depicted in Figure 12 including additional sensitivity analyses to those presented by [16,17]. Neither the sediment transport formula nor the location of a transition for sediment size significantly influenced the river profile computed at the end of the event. The comparison between the modeling results and the post-event surveys is also included in Figure 12. The field data were reproduced well in the upstream portion of the in-town reach, whilst the computed bed elevations were significantly lower than the surveyed ones in the downstream portion. This could be due to the fact that the survey was not performed just after the flood and additional morphologic processes could have taken place. Since the flood happened almost 30 years ago, it was very difficult to find information in that respect. However, the agreement between the model and the survey in the upstream portion was considered more important than the agreement in the downstream portion as the former was the place where the outflow would take place in the design scenario (see the following section).

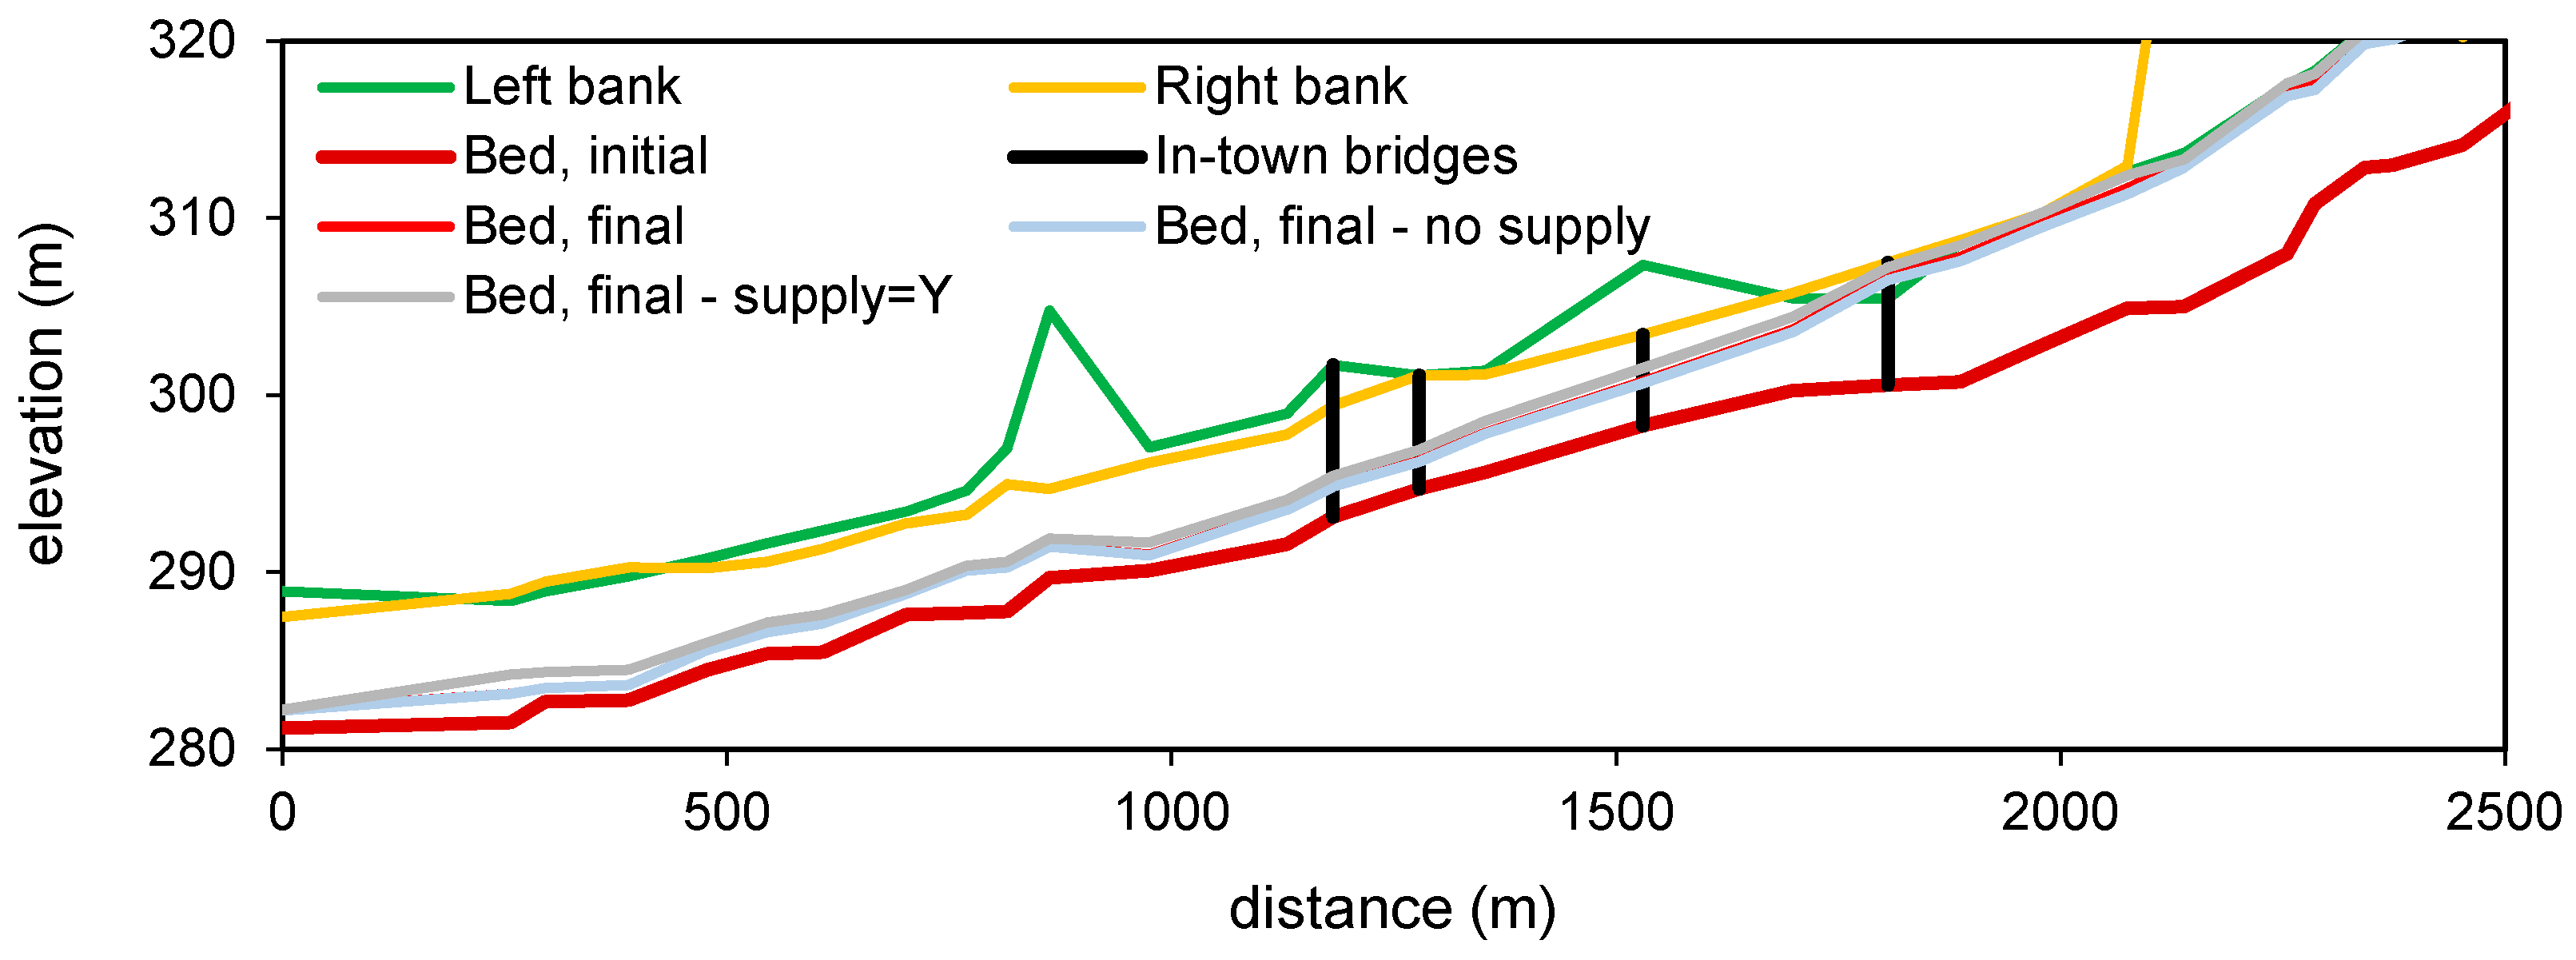
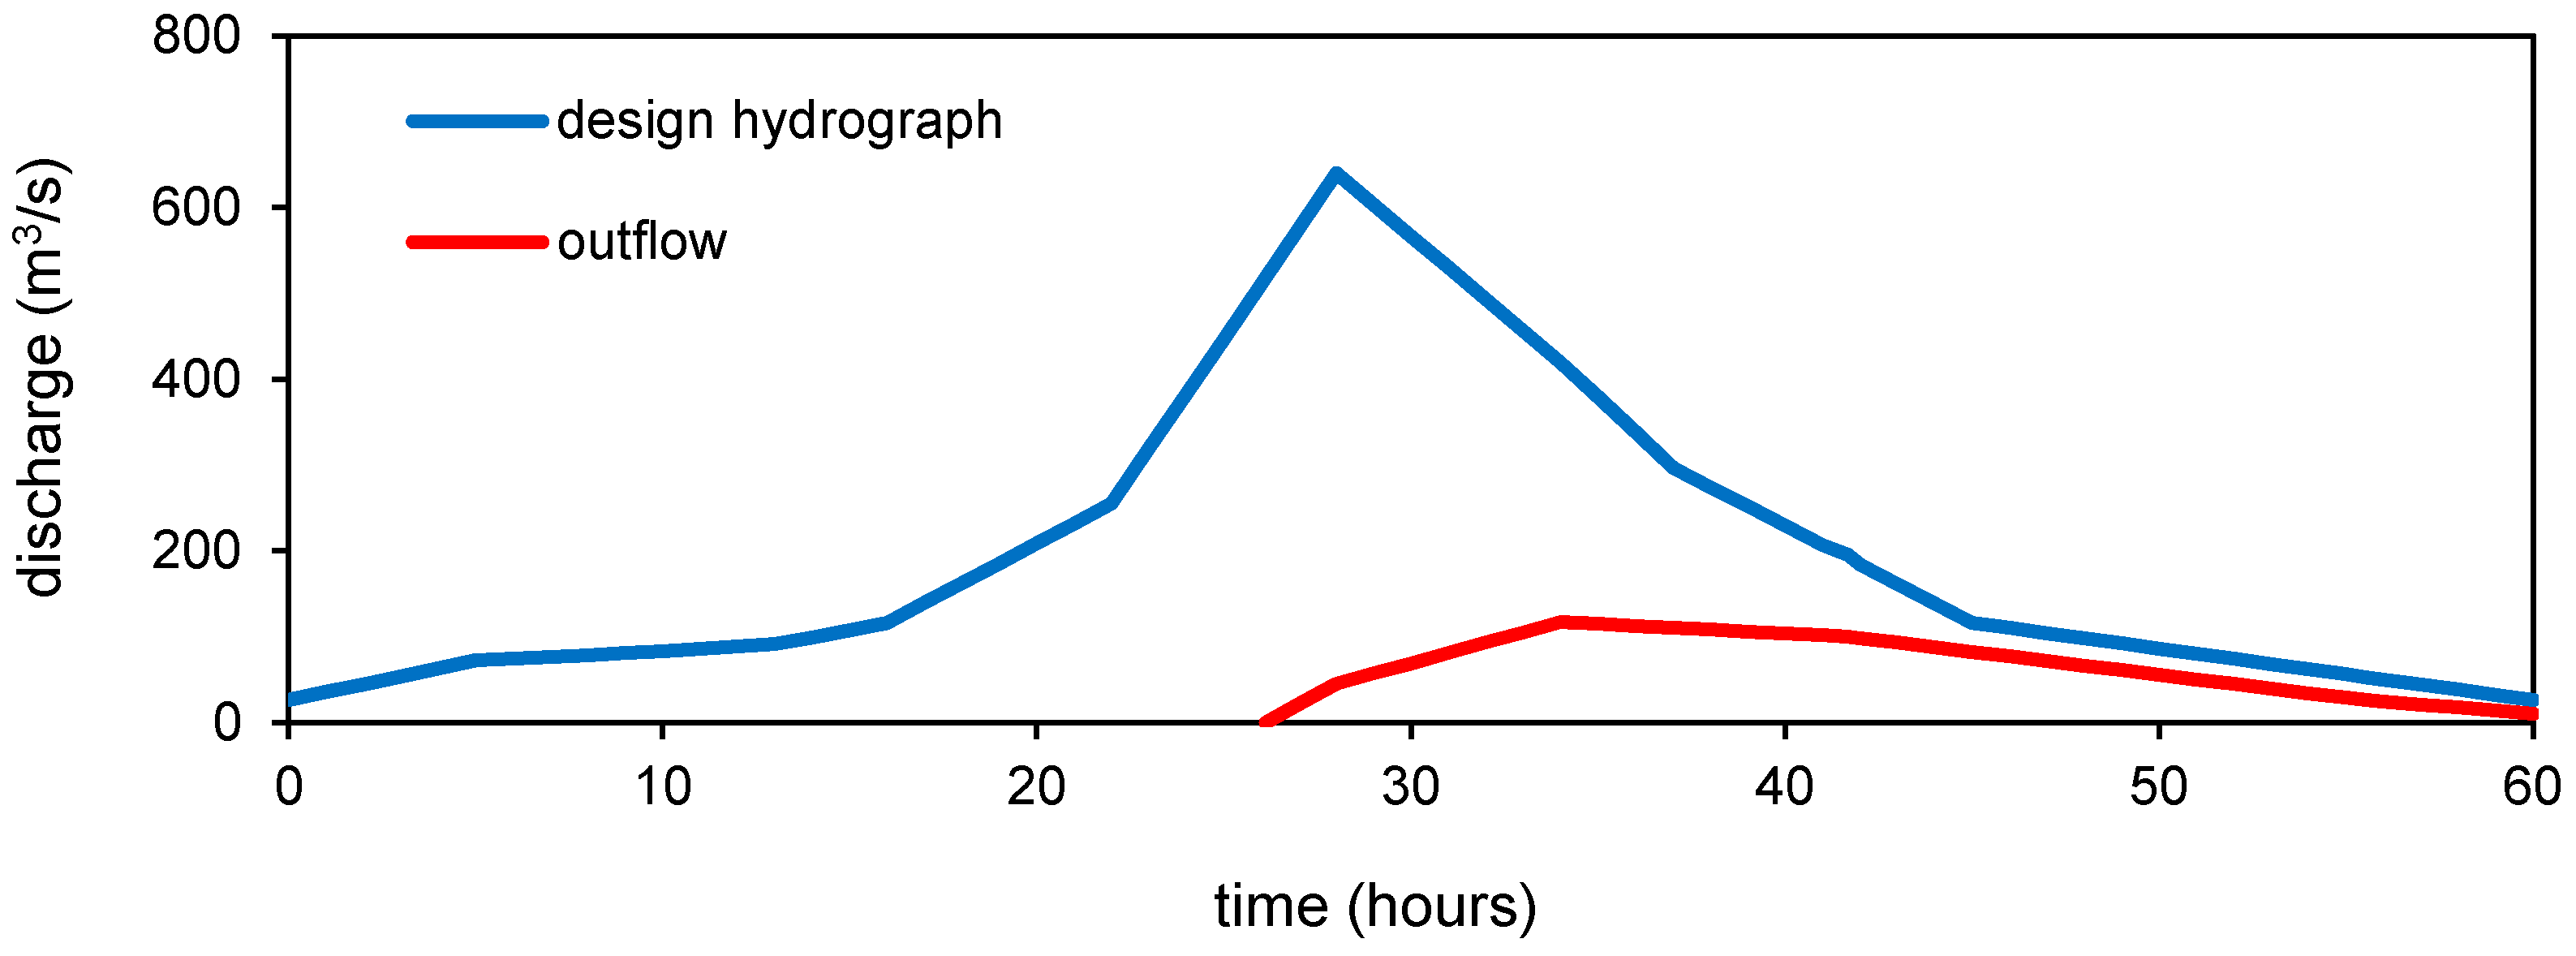
5.2. Design Flood Event

A discharge hydrograph corresponding to a return period of 100 years was computed by [14] using a Nash model. The hydrograph had a duration of 60 h and a peak discharge of 640 m3/s (Figure 10). It is acknowledged here that the estimation of a flood hydrograph for a relatively high return period may be not fully supported by the length of available rainfall records (that were limited to several years). However, in the absence of different evaluations, the available hydrograph was used here as an upstream boundary condition for the hydro-morphologic model. Other parameters of the model (sediment sizes, roughness coefficients, and upstream sediment supply) were the same as those previously used for the simulation of the 1987 flood.
The result obtained from the hydro-morphologic modeling of the design scenario is depicted in Figure 13. The reliability of this result was tested by a series of analyses where the sensitivity of the final bed profile to different parameters was demonstrated. Considered items were the sediment size, the location of a transition in sediment size, the sediment supply at the upstream boundary, and the sediment transport equation. Results are depicted in Figure 14, Figure 15, Figure 16 and Figure 17. The only parameter with a marked influence on the results was the sediment size, that was however determined based on the analysis of the flows in the duration curve (Section 4). The stability of the presented results is therefore considered satisfactory.
The maximum elevation reached by water was higher than the left bank close to the Garibaldi bridge, indicating that the town would be flooded by an event analogous to the scenario under consideration (see Figure 4 for the location at which inundation would be expected to start). Present results also confirm a major importance of accounting for the sediment transport in the hazard assessment, if one considers that the same discharge hydrograph would correspond to a freeboard of 1.9 m at the Garibaldi bridge in a clear-water hydraulic model. For the present scenario, the outflowing discharge was estimated in an uncoupled way with respect to the hydro-morphologic model. At some selected times along the process, the instantaneous profile of the free surface was used to compute the outflowing discharge by treating the left bank of the river as a succession of lateral weirs (the reader is directed to [43] for more details). An outflowing hydrograph was obtained, starting at a time of 26 h from the beginning of the event and with a peak of 117 m3/s (Figure 18).

6. Concluding Remarks

This study documented an application of a numerical model towards flood hazard assessment for a mountain river with intense sediment aggradation increasing the expected water levels for any flow rate. The importance of appropriately accounting for sediment transport was proven by comparing the maximum elevation of the free surface for a clear-water and a hydro-morphologic modeling approach. It was demonstrated that even though the hazard perspective was related to a design flood event, insight into the appropriate model parameterization could be obtained from analyses of the hydro-morphologic behaviour of the river over a longer term considering flow rates in the yearly duration curve. These ordinary conditions represent initial conditions for the unsteady process of the flood wave propagation and all of its consequences. The model parameterization obtained from the preliminary analysis was first validated against the records of a past event and then exploited for the simulation of a design flood scenario with a 100-year return period. Using such a return period is a standard practice in Italy. Investigating the effect of flow rates with different probability would also be an interesting topic, that shall be accounted for in follow-up work but that does not alter the modeling procedure proposed in this study.
The sediment supply into the river reach used in the computations was modeled assuming a dynamic equilibrium at the upstream boundary. Previous studies and appropriate sensitivity analyses performed in this work demonstrated that the sediment aggradation depth in the in-town reach of the river was however independent of the sediment supply at the upstream boundary, provided that the length of the computational reach was enough in light of the duration of the event. Under such a condition, the event dynamics is characterized by a redistribution of sediment already present in the water course before the event rather than on migration of the sediment supplied upstream. From a modeling point of view, a low sensitivity to the values of yielded sediment volume would significantly reduce the uncertainty related with short-term modeling. On the other hand, a major role of antecedent conditions would be consequently inferred. This part of the process, however, still needs further research. The issue of sediment connectivity has indeed received particular attention in recent years (e.g., [44,45,46]) and it might be worth recalling here that a similar behaviour has been also argued for water, as measurements showed that the water reaching a downstream section is present in the basin substrate before an event rather than the water arriving during the event (e.g., [47,48]). Modeling the undergoing processes at a greater spatial resolution (i.e., raster cell) over long time spans could thus also support the assessment of suitable initial states.
The sensitivity of the modeling results to several parameters was assessed, resulting in a satisfactory reliability of the procedure. The sediment size can have a major influence on the simulated hydro-morphologic behaviour of the river. In the present case, a parameterization of the sediment size based on the analysis of the yearly sediment transport was proposed.
The modeling approach was here applied to a design event for a 100-year flow hydrograph, but the sequence could be equally conditioned with forecasted flow rates in a warning system (e.g., [49]). According to [15], two major drawbacks of forecasting and warning tools currently used in the study site are that (i) discharge forecasts are not connected with inundation models and (ii) sediment aggradation is not considered. The modeling sequence presented in this study can effectively connect discharge forecasting and inundation models accounting for sediment transport and aggradation of the river bed, thus meeting a significant public demand. Further research on urban inundation (using a two-dimensional, unsteady hydraulic model) and damage modeling (using a model recently proposed by [50]) is presently in progress as a follow-up step of a simulation sequence. Such pieces of information shall support design of risk mitigation (i.e., damage reduction) strategies by authorities in charge.
A most important shortcoming of the approach documented here is its deterministic nature, with a consequent lack of consideration for uncertainty issues. On the one hand, for the present study site the hydro-morphologic model took advantage of existing data and was calibrated based on the latter, thus mitigating the effects of uncertainty. On the other hand, uncertainty issues shall be key topics for follow-up research. In this respect, one can first consider that analyses dealing with non-gauged case studies would suffer from a much larger uncertainty in the hydraulic modeling. Second, the correspondence between water discharges/volumes and sediment transport volumes is far from being deterministic (e.g., [5,51,52]). Examples of probabilistic treatment of sediment supply are appearing (e.g., [53]), which can be further exploited as a step forward for an appropriate treatment of uncertainty.

Acknowledgments

The open-access publication fee was covered thanks to liberal funding from the Comune di Lecco, Italy.

Author Contributions

Alessio Radice, Laura Longoni and Monica Papini conceived and designed the study; Laura Longoni, Monica Papini and Davide Brambilla collected the relevant data for the hydro-graphic catchments; Alessio Radice and Vladislav Ivov Ivanov performed the hydro-morphologic modeling for the flows in the duration curve and for the flood events, respectively; Alessio Radice wrote the paper.

Conflicts of Interest

The authors declare no conflict of interest.

References

  1. Sear, D.A.; Newson, M.D.; Brookes, A. Sediment-related river maintenance: The role of fluvial geomorphology. Earth Surf. Process. Landf. 1995, 20, 629–647. [Google Scholar] [CrossRef]
  2. Stover, S.C.; Montgomery, D.R. Channel change and flooding, Skokomish River, Washington. J. Hydrol. 2001, 243, 272–286. [Google Scholar] [CrossRef]
  3. Lane, S.N.; Tayefi, V.; Reid, S.C.; Yu, D.; Hardy, R.J. Interactions between sediment delivery, channel change, climate change and flood risk in a temperate upland environment. Earth Surf. Process. Landf. 2007, 32, 429–446. [Google Scholar] [CrossRef]
  4. Jaeggi, M. Some aspects of the sediment transport during the 2005 floods in Switzerland. Ann. Wars. Univ. Life Sci. SGGW Land Reclam. 2008, 39, 33–48. [Google Scholar] [CrossRef]
  5. Rickenmann, D.; Koschni, A. Sediment loads due to fluvial transport and debris flows during the 2005 flood events in Switzerland. Hydrol. Process. 2010, 24, 993–1007. [Google Scholar] [CrossRef]
  6. Directive 2007/60/EC of the European Parliament and of the Council of 23 October 2007 on the Assessment and Management of Flood Risks. Available online: http://ec.europa.eu/environment/water/flood_risk/ (accessed on 15 December 2016).
  7. Papanicolaou, A.N.; Bdour, A.; Wicklein, E. One-dimensional hydrodynamic/sediment transport model applicable to steep mountain streams. J. Hydraul. Res. 2004, 42, 357–375. [Google Scholar] [CrossRef]
  8. Chiari, M.; Friedl, K.; Rickenmann, D. A one-dimensional bedload transport model for steep slopes. J. Hydraul. Res. 2010, 48, 152–160. [Google Scholar] [CrossRef]
  9. Rosatti, G.; Bonaventura, L.; Deponti, A.; Garegnani, G. An accurate and efficient semi-implicit method for section-averaged free-surface flow modeling. Int. J. Numer. Metheds Fluids 2011, 65, 448–473. [Google Scholar] [CrossRef]
  10. Neuhold, C.; Stanzel, P.; Nachtnebel, H.P. Incorporating river morphological changes to flood risk assessment: Uncertainties, methodology and application. Nat. Hazards Earth Syst. 2009, 9, 789–799. [Google Scholar] [CrossRef]
  11. ISMES; CAE. Lineamenti per un Piano di Intervento per la Protezione Della Citta di Sondrio; Report of Temporary Firm Syndicate within “Piani di Allarme Connessi alla Situazione di Rischio Idrometeorologico Nella Val Malenco”; ISMES: Bergamo, Italy, 1988. (In Italian) [Google Scholar]
  12. ISMES; CAE. Modello di Simulazione Dell’inondazione in Sondrio; Report of Temporary Firm Syndicate within “Piani di Allarme per Situazioni di Rischio Idrometeorologico del Torrente Mallero”; ISMES: Bergamo, Italy, 1988. (In Italian) [Google Scholar]
  13. ITALTEKNA; BONIFICA; SPEA; LOMBARDIA RISORSE. Stima delle Portate di Piena Centenarie, Bacino del Torrente Mallero; Report of Temporary Firm Syndicate within “Piano Programma di Ricostruzione e Sviluppo della Valtellina e delle Zone Adiacenti delle Provincie di Como, Bergamo e Brescia Colpite dalle Avversita Atmosferiche dei Mesi di Luglio e Agosto 1987”; ISMES: Bergamo, Italy, 1989. (In Italian) [Google Scholar]
  14. ITALTEKNA; BONIFICA; SPEA; LOMBARDIA RISORSE. Aspetti Idraulici ed Idrologici, Studi Idraulici e sul Trasporto Solido; Report of Temporary Firm Syndicate within “Piano Programma di Ricostruzione e Sviluppo della Valtellina e delle Zone Adiacenti delle Provincie di Como, Bergamo e Brescia Colpite dalle Avversita Atmosferiche dei Mesi di Luglio e Agosto 1987”; ISMES: Bergamo, Italy, 1990. (In Italian) [Google Scholar]
  15. Menoni, S.; Molinari, D.; Parker, D.; Ballio, F.; Tapsell, S. Assessing multifaceted vulnerability and resilience in order to design risk-mitigation strategies. Nat. Hazards 2012, 64, 2057–2082. [Google Scholar] [CrossRef]
  16. Radice, A.; Rosatti, G. Sulla modellazione idraulico-morfologica dei corsi d’acqua: Il torrente Mallero e la propagazione dell’incertezza legata all’alimentazione solida. In Proceedings of the XXXIII Convegno di Idraulica e Costruzioni Idrauliche, Brescia, Italy, 10–14 September 2012. (In Italian)
  17. Radice, A.; Rosatti, G.; Ballio, F.; Franzetti, S.; Mauri, M.; Spagnolatti, M.; Garegnani, G. Management of flood hazard via hydro-morphological river modeling. The case of the Mallero in Italian Alps. J. Flood Risk Manag. 2013, 6, 197–209. [Google Scholar] [CrossRef]
  18. Radice, A.; Elsayed, S.M. Hydro-morphologic modeling for different calamitous scenarios in a mountain stream. In Proceedings of the River Flow 2014, Lausanne, Switzerland, 3–5 September 2014.
  19. Longoni, L.; Papini, M.; Arosio, D.; Zanzi, L.; Brambilla, D. A new geological model for Spriana landslide. Bull. Eng. Geol. Environ. 2014, 73, 959–970. [Google Scholar] [CrossRef]
  20. Longoni, L.; Ivanov, V.I.; Brambilla, D.; Radice, A.; Papini, M. Analysis of the temporal and spatial scales of soil erosion and transport in a mountain basin. Ital. J. Eng. Geol. Environ. 2016. under review. [Google Scholar]
  21. Apel, H.; Thieken, A.H.; Merz, B.; Bloschl, G. A probabilistic modeling system for assessing flood risks. Nat. Hazards 2006, 38, 79–100. [Google Scholar] [CrossRef]
  22. Crosta, G.B.; Dal Negro, P.; Frattini, P. Soil slips and debris flows on terraced slopes. Nat. Hazards Earth Syst. 2003, 3, 31–42. [Google Scholar] [CrossRef]
  23. Brambilla, D.; Longoni, L.; Papini, M.; Giorgetti, E.; Radice, A. On analysis of sediment sources toward proper characterization of hydro-geological hazard for mountain environments. Int. J. Saf. Secur. Eng. 2011, 1, 423–437. [Google Scholar] [CrossRef]
  24. Wischmeier, W.H.; Smith, D.D. Predicting rainfall erosion losses—A guide to conservation planning. In Agriculture Handbook No. 537; U.S. Department of Agriculture: Washington, DC, USA, 1978. [Google Scholar]
  25. Longoni, L.; Papini, M.; Brambilla, D.; Barazzetti, L.; Roncoroni, F.; Scaioni, M.; Ivanov, V.I. Monitoring riverbank erosion in mountain catchments using terrestrial laser scanning. Remote Sens. 2016, 8, 241. [Google Scholar] [CrossRef] [Green Version]
  26. Borselli, L.; Salvador Sanchis, P.; Bartolini, D.; Cassi, P.; Lollino, P. PESERA L Model: An Addendum to the PESERA Model for Sediment Yield Due to Shallow Mass Movement in a Watershed; Report. n. 82. Scientific Report Deliverable 5.2.1, DESIRE Project; CNR-IRPI: Quattromiglia, Italy, 2011; p. 28. [Google Scholar]
  27. ISMES. Frana di Spriana: Modelli di Comportamento Frana—Modello Geomeccanico; Report of Project ASP-4914.11, Doc. REL-DGM-179; ISMES: Bergamo, Italy, 1990. (In Italian) [Google Scholar]
  28. ISMES. Frana di Spriana: Schemi Interpretativi del Rischio Geologico e Idrogeologico, Definizione dei Livelli di Soglia e Delle Procedure di Analisi dei dati Strumentali, Nell’area Della Frana di Spriana; Report of Project ASP-4914, Doc. RTF-DMM-228; ISMES: Bergamo, Italy, 1990. (In Italian) [Google Scholar]
  29. Di Silvio, G.; Peviani, M. Modeling short-term and long-term evolution of mountain rivers: An application to the torrent Mallero (Italy). Lect. Notes Earth Sci. 1991, 37, 293–315. [Google Scholar]
  30. Shields, A. Anwendung der Aehnlichkeitsmechanik und der Turbulenz Forschung auf die Geschiebebewegung; Mitt. der Preussische Versuchanstalt fur Wasserbau und Schiffbau: Berlin, Germany, 1936; Volume 26. (In German) [Google Scholar]
  31. Ferguson, R.I.; Bloomer, D.J.; Church, M. Evolution of an advancing gravel front: Observations from Vedder Canal, British Columbia. Earth Surf. Process. Landf. 2011, 36, 1172–1182. [Google Scholar] [CrossRef]
  32. Meyer-Peter, E.; Muller, R. Formulas for bed-load transport. In Proceedings of the II Meeting of IAHR, Stockholm, Sweden, 7–9 June 1948.
  33. Aksoy, H.; Kavvas, M.L. A review of hillslope and watershed scale erosion and sediment transport models. Catena 2005, 64, 247–271. [Google Scholar] [CrossRef]
  34. De Vente, J.; Poesen, J. Predicting soil erosion and sediment yield at the basin scale: Scale issues and semi-quantitative models. Earth Sci. Rev. 2005, 71, 95–125. [Google Scholar] [CrossRef]
  35. Vetsch, D.; Siviglia, A.; Ehrbar, D.; Facchini, M.; Gerber, M.; Kammerer, S.; Peter, S.; Vanzo, D.; Vonwiller, L.; Volz, C.; et al. System Manuals of BASEMENT. Laboratory of Hydraulics, Glaciology and Hydrology (VAW), ETH Zurich, 2016. Available online: http://www.basement.ethz.ch (accessed on 15 October 2016).
  36. Smart, G.M.; Jaeggi, M.N.R. Sediment Transport on Steep Slopes. Laboratory of Hydraulics, Glaciology and Hydrology (VAW); ETH Zurich: Zurich, Switzerland, 1983. [Google Scholar]
  37. Radice, A.; Giorgetti, E.; Brambilla, D.; Longoni, L.; Papini, M. On integrated sediment transport modeling for flash events in mountain environments. Acta Geophys. 2012, 60, 191–213. [Google Scholar] [CrossRef]
  38. Heimann, F.U.M.; Rickenmann, D.; Bockli, M.; Turowski, J.M.; Kirchner, J.W. Calculation of bedload transport in Swiss mountain rivers using the model SedFlow: Proof of concept. Earth Surf. Dyn. 2015, 3, 35–54. [Google Scholar] [CrossRef]
  39. Verhaar, P.M.; Biron, P.M.; Ferguson, R.I.; Hoey, T.B. Implications of climate change in the twenty-first century for simulated magnitude and frequency of bed-material transport in tributaries of the Saint-Lawrence River. Hydrol. Process. 2011, 25, 1558–1573. [Google Scholar] [CrossRef]
  40. Pender, D.; Patidar, S.; Hassan, K.; Haynes, H. Method for incorporating morphological sensitivity into flood inundation modeling. J. Hydraul. Eng. 2016, 142. [Google Scholar] [CrossRef]
  41. Madej, M.A.; Ozaki, V. Channel response to sediment wave propagation and movement, Redwood Creek, California, USA. Earth Surf. Process. Landf. 1996, 21, 911–927. [Google Scholar] [CrossRef]
  42. Lisle, T.E.; Cui, Y.; Parker, G.; Pizzuto, J.E.; Dodd, A.M. The dominance of dispersion in the evolution of bed material waves in gravel-bed rivers. Earth Surf. Process. Landf. 2001, 26, 1409–1420. [Google Scholar] [CrossRef]
  43. Ivanov, V.I. Hydro-Geological Process Chain for Building a Flood Scenario. Master’s Thesis, Politecnico di Milano, Milano, Italy, 2014. [Google Scholar]
  44. Reid, S.C.; Lane, S.N.; Montgomery, D.R.; Brookes, C.J. Does hydrological connectivity improve modeling of coarse sediment delivery in upland environments? Geomorphology 2007, 90, 263–282. [Google Scholar] [CrossRef]
  45. Fryirs, K. (Dis)Connectivity in catchment sediment cascades: A fresh look at the sediment delivery problem. Earth Surf. Process. Landf. 2013, 38, 30–46. [Google Scholar] [CrossRef]
  46. Bracken, L.J.; Turnbull, L.; Wainwright, J.; Bogaart, P. Sediment connectivity: A framework for understanding sediment transfer at multiple scales. Earth Surf. Process. Landf. 2015, 40, 177–188. [Google Scholar] [CrossRef] [Green Version]
  47. Kirchner, J.W. A double paradox in catchment hydrology and geochemistry. Hydrol. Process. 2003, 17, 871–874. [Google Scholar] [CrossRef]
  48. McGuire, K.J.; McDonnell, J.J. Hydrological connectivity of hillslopes and streams: Characteristic time scales and nonlinearities. Water Resour. Res. 2010, 46, 1–17. [Google Scholar] [CrossRef]
  49. Molinari, D.; Ballio, F.; Menoni, S. Modeling the benefits of flood emergency management measures in reducing damages: A case study on Sondrio, Italy. Nat. Hazards Earth Syst. 2013, 13, 1913–1927. [Google Scholar] [CrossRef]
  50. Dottori, F.; Figueiredo, R.; Martina, M.; Molinari, D.; Scorzini, A.R. INSYDE: A synthetic, probabilistic flood damage model based on explicit costa analysis. Nat. Hazards Earth Syst. Sci. Discuss. 2016, 16, 2577–2591. [Google Scholar] [CrossRef]
  51. Turowski, J.M.; Yager, E.Y.; Badoux, A.; Rickenmann, D.; Molnar, P. The impact of exceptional events on erosion, bedload transport and channel stability in a step-pool channel. Earth Surf. Process. Landf. 2009, 34, 1661–1673. [Google Scholar] [CrossRef]
  52. Turowski, J.M. Probability distributions of bed load transport rates: A new derivation and comparison with field data. Water Resour. Res. 2010, 46. [Google Scholar] [CrossRef]
  53. Bennett, G.L.; Molnar, P.; McArdell, B.W.; Burlando, P. A probabilistic sediment cascade model of sediment transfer in the Illgraben. Water Resour. Res. 2014, 50, 1225–1244. [Google Scholar] [CrossRef]
Figure 1. The Mallero catchments in Northern Italy with land cover, major streams, and towns.
Water 08 00597 g001
Figure 2. Longitudinal profile of the river bed in the last 9.5 km before the confluence, up to the town of Torre Santa Maria in Figure 1.
Water 08 00597 g002
Figure 3. Sediment size along the river course according to a survey by Techint in 1989 and [14], d_p indicating the size corresponding to p percent in the granulometric distribution.
Water 08 00597 g003
Figure 4. The Mallero River (shaded) crossing the town of Sondrio (map extracted from the Regional Technical Chart of Lombardia). The course of the Mallero is depicted in the last 2 km until the inflow into the Adda. The black thick lines represent four in-town bridges, named Garibaldi, Eiffel, Marcora, and Railway from upstream to downstream.
Water 08 00597 g004
Figure 5. Flow duration curve at Sondrio (data from 1992 to 1998 in black, average curve in blue).
Water 08 00597 g005
Figure 6. Stream-wise variability of the critical sediment size for a range of flow discharges within the yearly duration curve. Flow rates in the legend are expressed in m3/s.
Water 08 00597 g006
Figure 7. Homogeneous reaches in the longitudinal profile of the river bed.
Water 08 00597 g007
Figure 8. Duration curve of the critical diameter (averaged along homogeneous reaches).
Water 08 00597 g008
Figure 9. Computed yearly-averaged critical sediment size compared with the median sediment size in the considered reach. Dashed lines identify the reference sizes used in the following computations.
Water 08 00597 g009
Figure 10. Flow hydrographs for the 1987 flood event and the design event.
Water 08 00597 g010
Figure 11. Result of the numerical model of the 1987 flood event comparing the river profile at the beginning and at the end of the simulation.
Water 08 00597 g011
Figure 12. Comparison between the numerical simulation of the 1987 flood event and field data for the bed elevation at the end of the event, including sensitivity analyses for the transport formula (S-J = equation by [36]) and for the location of a transition in sediment size (moved from 1.8 to 2.5 km).
Water 08 00597 g012
Figure 13. Results (thalweg and free surface profiles) for the simulation of the design event.
Water 08 00597 g013
Figure 14. Model of the design flood scenario: sensitivity to the sediment size (sizes for the downstream and upstream homogeneous reaches indicated in mm in the legend), considering that the benchmark model is for 50–150 mm.
Water 08 00597 g014
Figure 15. Model of the design flood scenario: sensitivity to the location chosen for a transition in sediment size (moved from 1.8 to 2.5 km).
Water 08 00597 g015
Figure 16. Model of the design flood scenario: sensitivity to the sediment supply at the upstream boundary (equilibrium conditions for the benchmark model, no supply, Y = 2 × 10⁵ m3).
Water 08 00597 g016
Figure 17. Model of the design flood scenario: sensitivity to the sediment transport formula (S-J = equation by [36]).
Water 08 00597 g017
Figure 18. Design flood and outflow hydrographs.
Water 08 00597 g018
Table 1. Flow rates in the yearly duration curve used for the analysis of sediment transport.
Flow Rate (m3/s)10859402314118753
Duration (Days)1510306091135182274355

