1. Introduction
In South Korea, agricultural nonpoint-source (NPS) pollution has become a major issue because it contributes to the deterioration of stream water quality [
1]. In general, NPS pollution is a rainfall runoff process that is complex, non-linear, temporally variably and spatially distributed in agricultural watersheds. Rainfall runoff is the driving mechanism; however, there are further complications and spatially varying factors, such as land use, topography and soil type, that affect pathways and source areas. The origin, quantity and routes of NPS pollution from agricultural areas are difficult to trace because of the influence of random and irregular characteristics [
2]. Currently, approximately 60% of the total water pollution in South Korea entering aquatic environments through streams and reservoirs is caused by NPS pollution related to agricultural activities [
3]. In recent decades, government agencies have concentrated their wastewater treatment efforts at downstream locations instead of following pretreatment practices at upstream sources.
Best Management Practices (BMPs) are nonstructural techniques that have been applied to the control and treatment of agricultural NPS pollution. A watershed-scale identification of NPS pollution loads via watershed modeling is helpful in supporting the economic planning of BMPs at the proper time and place. Environmental hydrologic models such as the Hydrological Simulation Program–Fortran (HSPF) model and the Soil and Water Assessment Tool (SWAT), among others, can be used to effectively evaluate the impact of BMPs.
A number of studies have recently assessed the effectiveness of agricultural BMPs in reducing NPS pollution loads through watershed modeling. Rao
et al. [
4] evaluated the effectiveness of a range of BMPs, including a nutrient management plan, riparian buffers, filter strips and fencing, in reducing phosphorus loading using a watered model for New York City source watersheds. Giri
et al. [
5] evaluated the performance of different targeting methods for native grass and terraces in reducing sediment, total nitrogen and total phosphorus using the SWAT model in the Saginaw River watershed. Liu
et al. [
6] investigated the effectiveness of BMPs in terms of changes in land use, fertilizer management and tillage management measures to reduce total nitrogen and total phosphorus through analysis of several scenarios by the SWAT model in the same watershed. Dechmi and Skhiri [
7] evaluated the effects of several BMPs, considering tillage (conservation and no-tillage), fertilizer application (incorporated, recommended and reduced) and irrigation (adjusted to crop needs) on irrigation return flows, total suspended sediment, organic P, soluble P and total P, using the SWAT-IRRIG model for the Del Reguero stream watershed. Strauch
et al. [
8] assessed the impact of BMPs such as parallel terraces and small sediment basins on streamflow and sediment loads in the intensively cropped catchment of the Pipiripau River. The BMP scenarios (tillage management measures) in the above two studies [
6,
7] were applied to this study. The results indicate that the BMP scenarios showed a clear downward trend in terms of NPS pollution loads.
However, most of these previous studies focused on BMP scenario-based approaches using a watershed model; few studies have performed evaluations with watershed modeling using data obtained from an analysis of the discharge characteristics of pollutants from field-scale surveys and tests through actual application of BMPs. For example, Jung
et al. [
9], Jang
et al. [
10] and Ahn
et al. [
2] evaluated the effectiveness of BMP for rice straw mulching and no-tillage in reducing runoff, sediment, total nitrogen and total phosphorus using the SWAT and HSPF models.
In this study, the HSPF model was used to evaluate the impact of a rice straw mulching and no-tillage BMP on watershed runoff and NPS pollution loads for a 1.21 km² agricultural watershed in South Korea. Field-scale experiments under conventional, rice straw mulching and no-tillage conditions were conducted to identify the NPS pollution load reduction effects and the results were used as HSPF model parameters in upland crop areas of the watersheds. The parameters related to the physical properties of soil were adjusted in the model to evaluate the effects of the rice straw mulching and no-tillage BMP application on the stream water quality. The change scenarios of upland crop areas were applied in the model to evaluate the influence of upland crop areas on runoff and NPS pollution loads.
2. HSPF Model Description
The HSPF model is based on the original Stanford Watershed Model IV [
11] and is a consolidation of three previously developed models: (1) the Agricultural Runoff Management Model (ARM) [
12], (2) the NPS Runoff Model [
13] and (3) the Hydrological Simulation Program (HSP), which includes HSP Quality [
14,
15,
16]. Additionally, the HSPF model is embedded in the water quality assessment tool Better Assessment Science Integrating Point and Nonpoint Sources (BASINS, Lahlou
et al. [
17]), developed by the US Environmental Protection Agency. An extensive description of the HSPF model is provided in Bicknell
et al. [
18].
The HSPF model is a lumped parameter model with an organized modular structure. Pervious land segments over which an appreciable amount of water infiltrates into the ground are modeled with the PERLND module. Impervious land segments, such as paved urban surfaces, over which water infiltration is negligible, are simulated with the IMPLND module. Processes occurring in water bodies, such as streams and lakes, are treated by the RCHRES module. These modules have several components that simulate hydrological processes and processes related to water quality [
19]. HSPF applies the Chezy-Manning equation for routing overland flow, the Philip equation for infiltration and the kinematic wave method for channel routing. Erosion and sediment transport along the land surface are simulated as the wash-off of detached sediment in storage and scour of the soil matrix [
20]. Nutrients are modeled using a system of coupled mass balance equations describing each nutrient compartment and each of the following constituents: dissolved inorganic and organic nutrients, particulate organic nutrients and sediment nutrients [
21]. Detailed information on the structure of and theories behind HSPF can be found in the HSPF version 12 user’s manual [
18] and in the literature [
13,
22,
23,
24,
25].
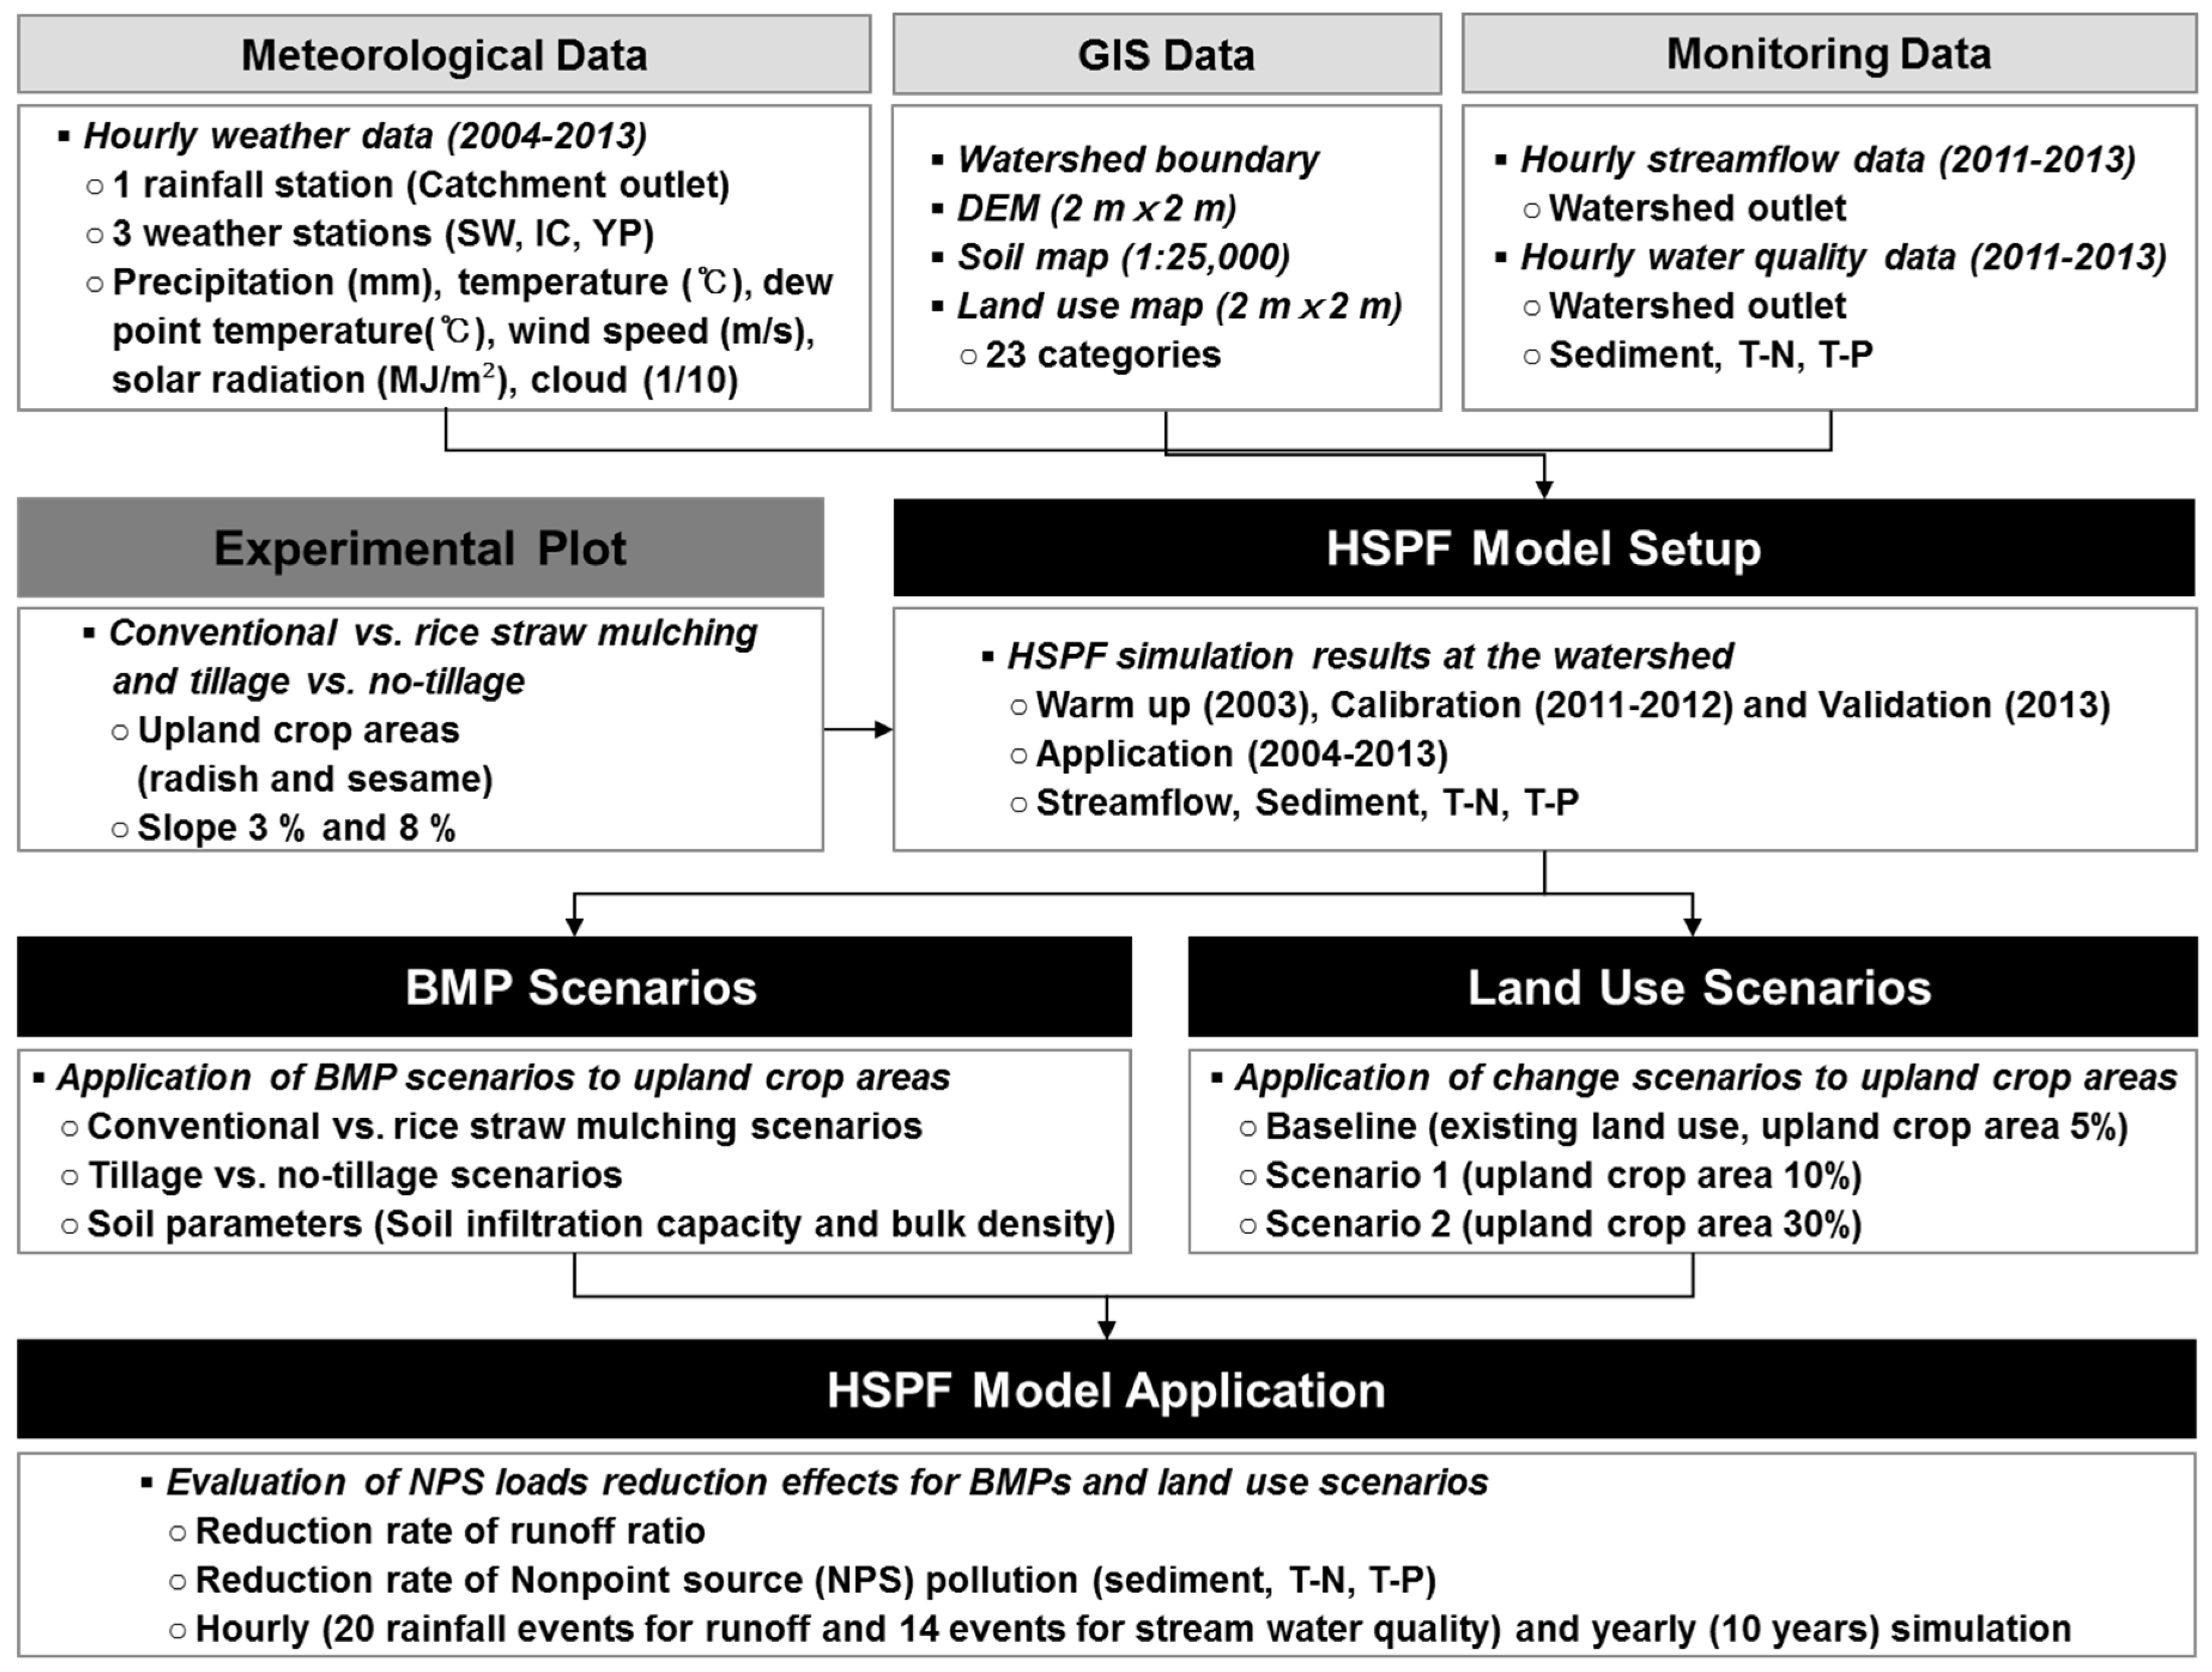
Figure 1 presents a flowchart of the modeling procedures with data for HSPF modeling. The study procedures will be discussed in greater detail in the next chapter.
3. Study Area and Data for HSPF Modeling
3.1. Study Area Description
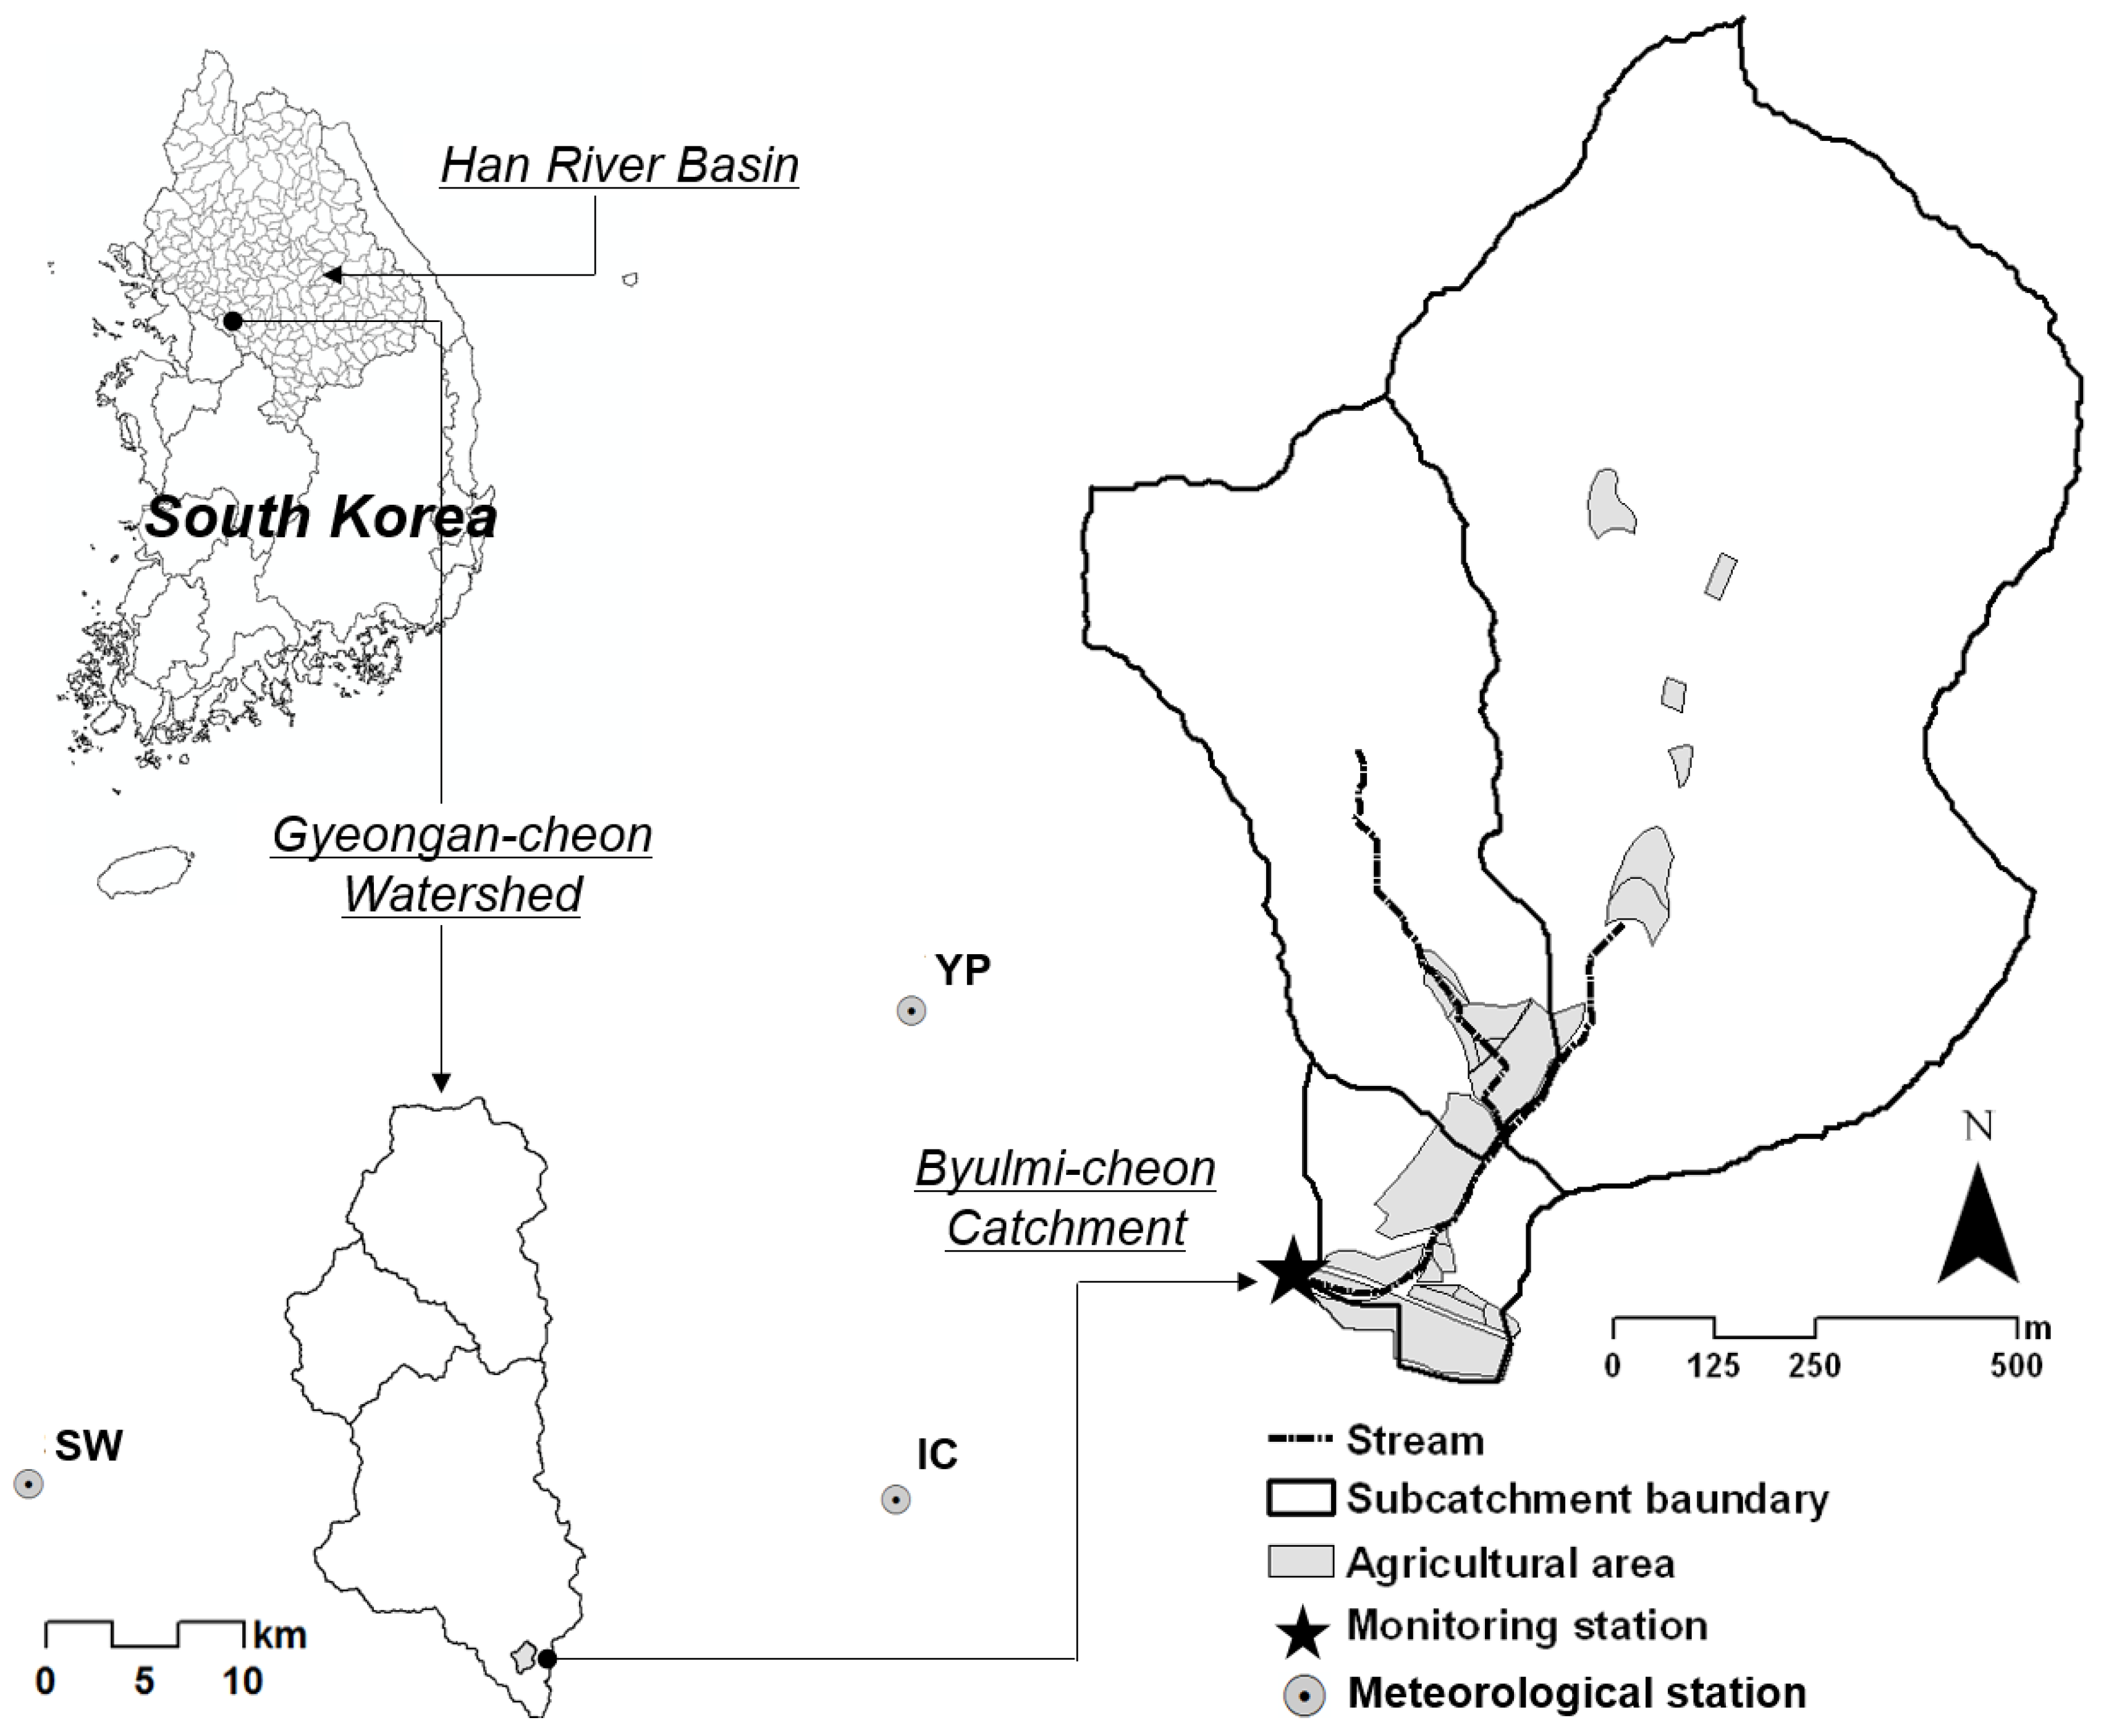
The study area was the Byulmi-cheon watershed (1.21 km²), which is located along the upstream area of the Gyeongan-cheon watershed (255.4 km²) in the northwest region of South Korea. The Gyeongan-cheon watershed stream is one of the main tributaries of the Han River basin (the largest river in South Korea), which is directly linked to the Paldang multipurpose dam. Because the pollution source of the Gyeongan-cheon watershed accounts for 16 percent of Paldang dam, whereas the quantity of water in the Gyeongan-cheon watershed only represents 1.6 percent of Paldang dam, the water quality of the Gyeongan-cheon watershed must be sustainably managed. Therefore, the Byulmi-cheon watershed, which has been used to obtain substantial observation data of water quantity and quality, was selected.
The study site lies within the latitude and longitude range of 127.16° E–127.17° E and 37.11° N–37.12° N (
Figure 2). The watershed is 75% (0.83 km²) forest area and 11% (0.12 km²) cropland in the lowland fertile areas. Rice paddies and upland crops cover 6% and 5%, respectively, of the watershed. The remaining residential areas, including roads, grasslands and bare fields, constitute 4%, 3% and 7%, respectively, of the watershed. The average annual precipitation and mean air temperature over the past 30 years (1984–2013) were 1200.5 mm and 10.5 °C, respectively.
Figure 2 shows the study area location and the distribution of agricultural areas within the watershed. The watershed was divided into three sub-watersheds for the HSPF modeling [
2].
3.2. Spatial, Meteorological and Field Data
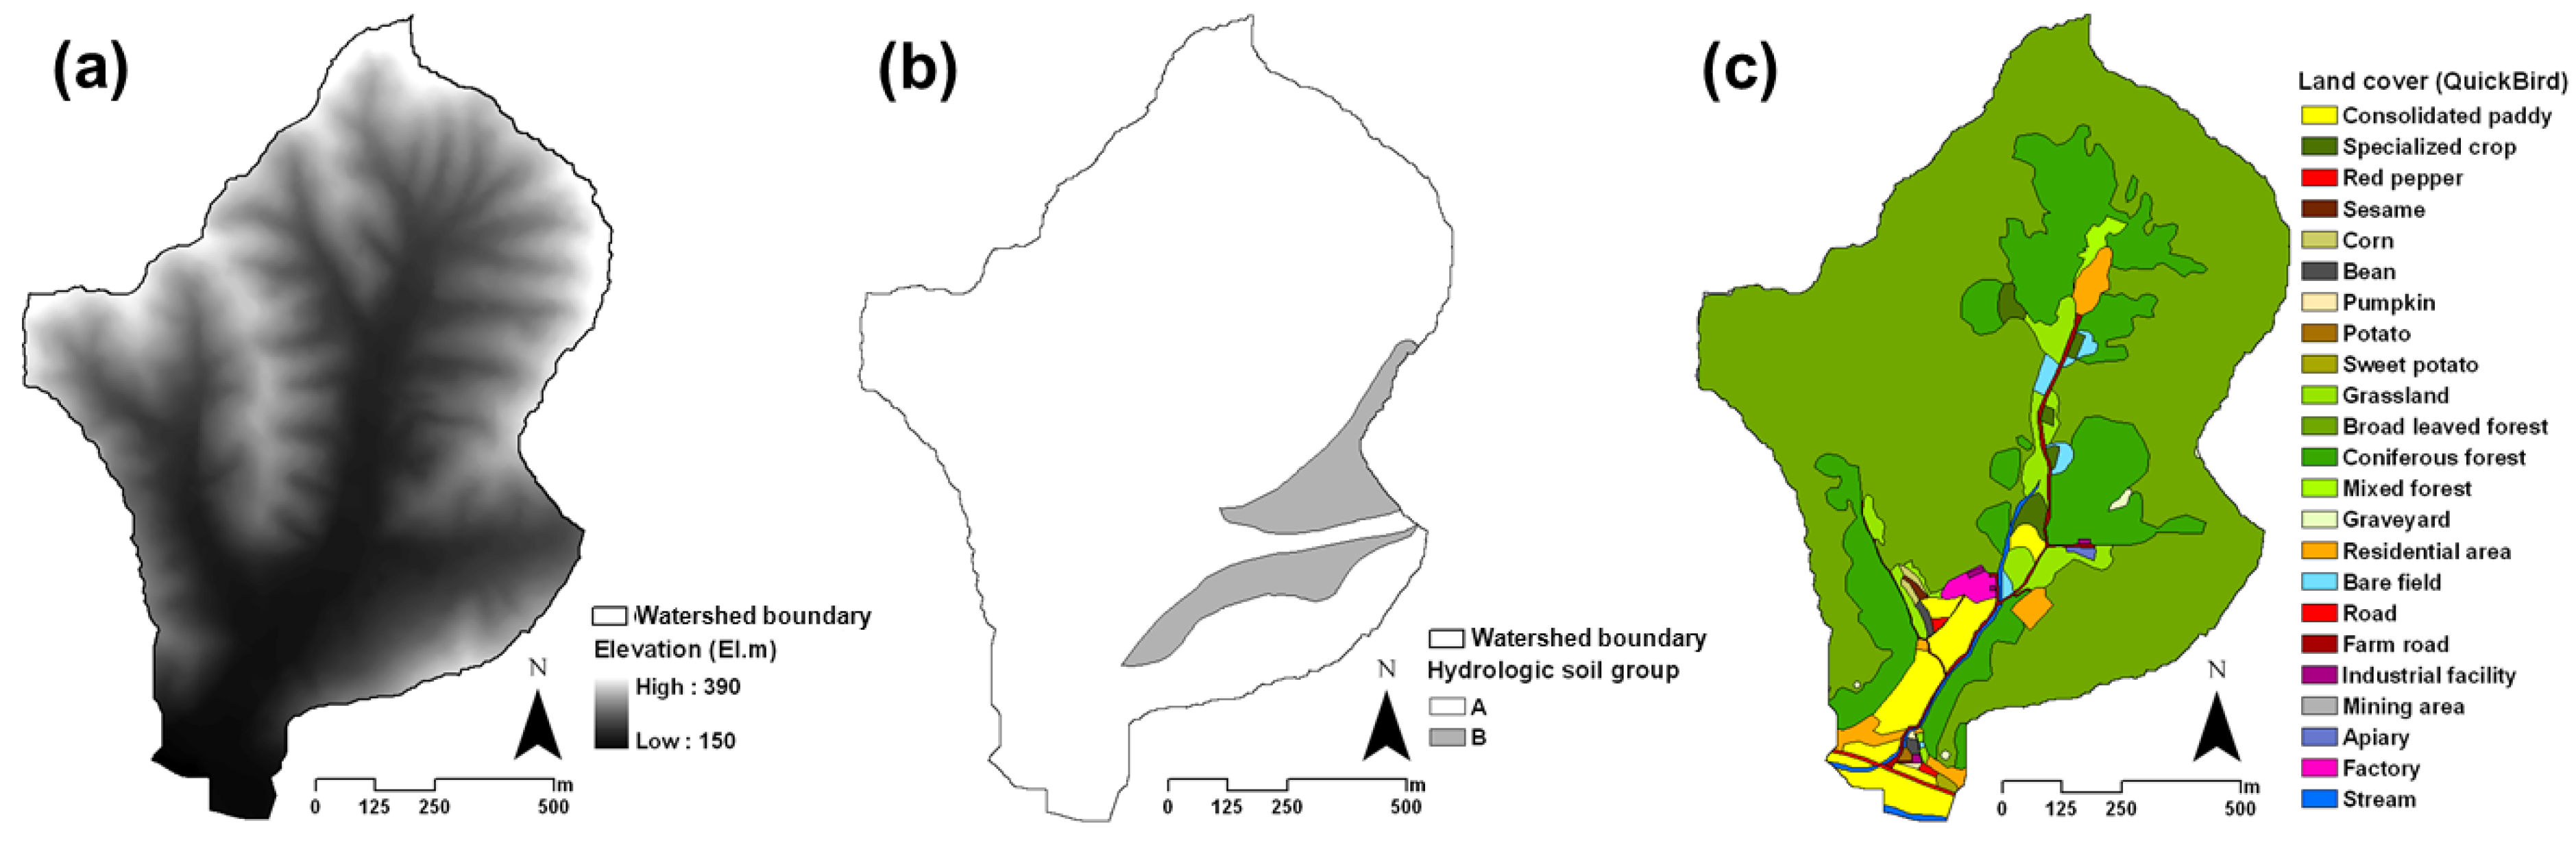
The Digital Elevation Model (DEM) was rasterized to 2-m grid cells from a 1:5000 scale vector map supplied by the Korea National Geography Institute (
Figure 3a). The layer-related contour lines and elevation points were extracted from 1:5000-scale vector digital topographic maps and converted into grid Triangulated Irregular Network (TIN) coverage using Arc GIS. The soil properties with respect to texture, depth and drainage attributes were rasterized from a 1:25,000 scale vector map supplied by the Korea Rural Development Administration (
Figure 3b). Twenty-three detailed classes of land-use data were prepared from a QuickBird satellite image captured on 1 May 2006, using on-screen digitizing with a Global Positioning System (GPS) field investigation (
Figure 3c).
To simulate the hydrological cycle, the HSPF model required the following meteorological data: cloud cover, hourly rainfall, temperature, wind speed, solar radiation and dew-point temperature. Meteorological data for the 11-year period (2003–2013) were obtained from three weather stations located within the watershed (SW, IC and YP). Data from 2003 were used for the model’s warm-up period. Data from a 10-year period (2004–2013) were used for the model application of change scenarios of upland crop areas. The hourly rainfall and stream discharge were monitored by automatic rainfall and water-level gauging stations with a Code Division Multiple Access (CDMA) wireless network system at the watershed outlet for three years (2011–2013). To facilitate the stream water quality measurements of sediment, total nitrogen (T-N) and total phosphorus (T-P), samples were collected using water quality auto samplers at the watershed outlet during rain events for three years (2011–2013).
3.3. Field Experiments for the Evaluation of Rice Straw Mulching and No-Tillage Crop Cultivation Effects
Field-scale experiments were conducted (2009–2012) to measure the runoff and water-quality reduction efficiency for radish and sesame under conventional farming, rice straw mulching and no-tillage conditions. Eight field plots 5 m in width by 30 m in length were built and operated on sandy loam soil. Four of these plots have slopes of 3% (representative of flatland), and the other four plots have slopes of 8% (representative of gentle slope land). The farming conditions were equally applied to plots under the two slope conditions for a comparison group of two conventional farming and two rice straw mulching practices for two years (2009–2010) and two conventional farming and two no-tillage practices for two years (2011–2012). Each plot was equipped with a sediment trap and flume at the end of the plots to measure runoff, sediment, T-N and T-P during rainfall events. Runoff was measured in five-minute intervals, and water sampling for sediment, T-N and T-P was conducted at one-hour intervals. The EMCs (Event Mean Concentrations) and NPS pollution loads were calculated via the official testing method with respect to water pollution processes in a laboratory. Conventional farming, rice straw mulching and no-tillage practices were repeatedly applied to plots 10 times every year.
3.4. Change Scenarios of Upland Crop Areas
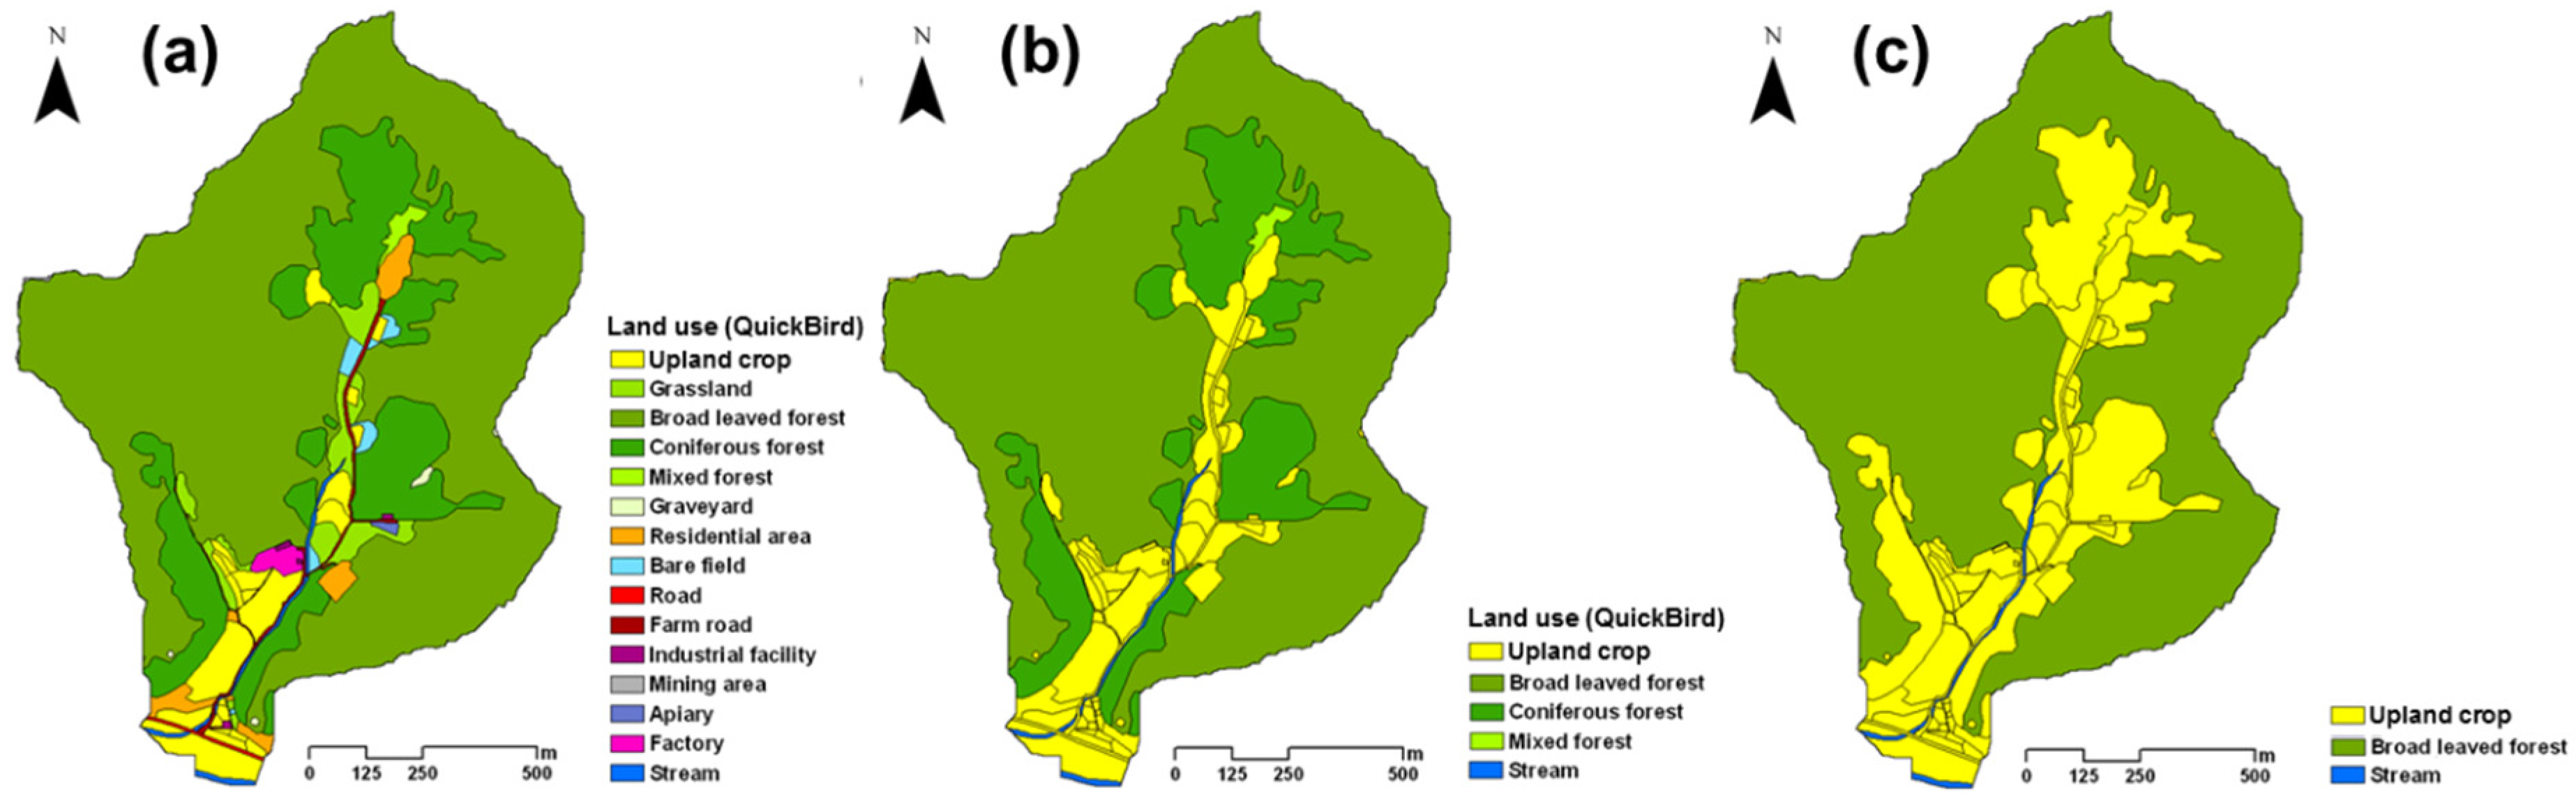
The watershed is 75% forest area and 11% (6% rice paddies and 5% upland crops) cropland in the lowland fertile areas. For the model application of changes in upland crop (potato, sweet potato, pepper, radish, sesame, corn, bean, pumpkin,
etc.) areas, land use maps of each land use type were prepared as one baseline and two scenarios: upland crop areas (1) 5% (baseline 2006, existing land use), (2) 10% (Scenario 1, all land use transforming into upland crop areas, except for forests and streams) and (3) 30% (Scenario 2, same conditions as (2) but with 20% of the forest transforming into upland crop areas).
Figure 4 shows the land use scenarios and the distribution of upland crop areas within the watershed. The change scenarios of the upland crop areas were designed to obtain as realistic as possible an application range in this watershed and changed upland crop areas close to the stream.
3.5. HSPF Model Implementation
The HSPF model under conventional conditions was calibrated and validated hourly using 20 rainfall events for runoff and 14 rainfall events for stream water quality (sediment, T-N and T-P) using three years of data (2011–2013). Rainfall events were selected based on a minimum of two-hour durations and greater than 20 mm rainfall amount. The calibration was performed in four steps: (Step 1) the physical rate of the total runoff was controlled by parameters related to streamflow, (Step 2) the parameters related to evapotranspiration and soil moisture were calibrated, (Step 3) the baseflow was calibrated using parameters related to interflow and groundwater and (Step 4) the recession curve and peak runoff were calibrated.
Based on the field experiment results, the rice straw mulching and no-tillage effects were applied to the reduction of surface runoff from agricultural areas in the study watershed. These rice straw mulching and no-tillage effects were controlled by the following parameters: the infiltration capacity (INFILT), soil bulk density (BD), wilting point (WP) and field capacity (FC).
For the influence evaluation of changes in upland crop areas on runoff and NPS pollution loads, the HSPF model was run for three years (2011–2013, hourly simulations of rainfall event average) and 10 years (2004–2013, hourly simulations of annual average).
4. Results and Discussion
4.1. HSPF Model Calibration and Validation
A total of 21 of the most influential parameters were selected for calibration. The model parameters related to streamflow (NSUR, LSUR, LZSN and UZSN), evapotranspiration and soil moisture (INFILT, LZETP and AGWETP), interflow (INTFW and IRC), groundwater (AGWRC, KVARY and DEEPER), sediment (JSER, KSER and KRER), T-N (KDSAM, KADAM and KIMNI) and T-P (KDSP, KADP and KIMP) were calibrated (
Table 1).
The results of the model calibration (2011–2012) and validation (2013) are summarized in
Table 2. Nash and Sutcliffe [
26] model efficiency (NSE) values and coefficients of determination (R²) were used to assess the model performance. R² values are defined as the square of the coefficient of correlation [
27]. The NSE ranges from −∞ to 1. A value of 1 (E = 1) corresponds to a perfect match of the modeled discharge to the observed data. A value of 0 (E = 0) indicates that the model predictions are as accurate as the mean of the observed data, whereas an efficiency of less than zero (E < 0) occurs when the observed mean is a better predictor than the model or, in other words, when the residual variance (described by the numerator in the expression above) is larger than the data variance (described by the denominator). Essentially, the closer the model efficiency is to 1, the more accurate the model is [
26]. The average NSE value for runoff was 0.64, and the average R² values for runoff, sediment, T-N, and T-P were 0.70, 0.56, 0.58 and 0.61, respectively. The average NSE values of streamflow were greater than 0.50, thereby indicating a satisfactory simulation [
28]. According to Donigan and Love [
29], the model calibration and validation could be classified as fair. The poorer model performance obtained for two events (18 June and 13 July in 2013) according to the runoff volume errors may be caused by the continuous hourly simulation during three years (2011–2013), whereas the model performance was evaluated based on rainfall events. The runoff volume errors affect the water quality errors. Hourly continuous HSPF modeling and evaluation are necessary to better understand contaminant transport during the rain events in the watershed.
4.2. HSPF Watershed-Scale Evaluation of Rice Straw Mulching and No-Tillage BMPs Based on Field-Scale Results
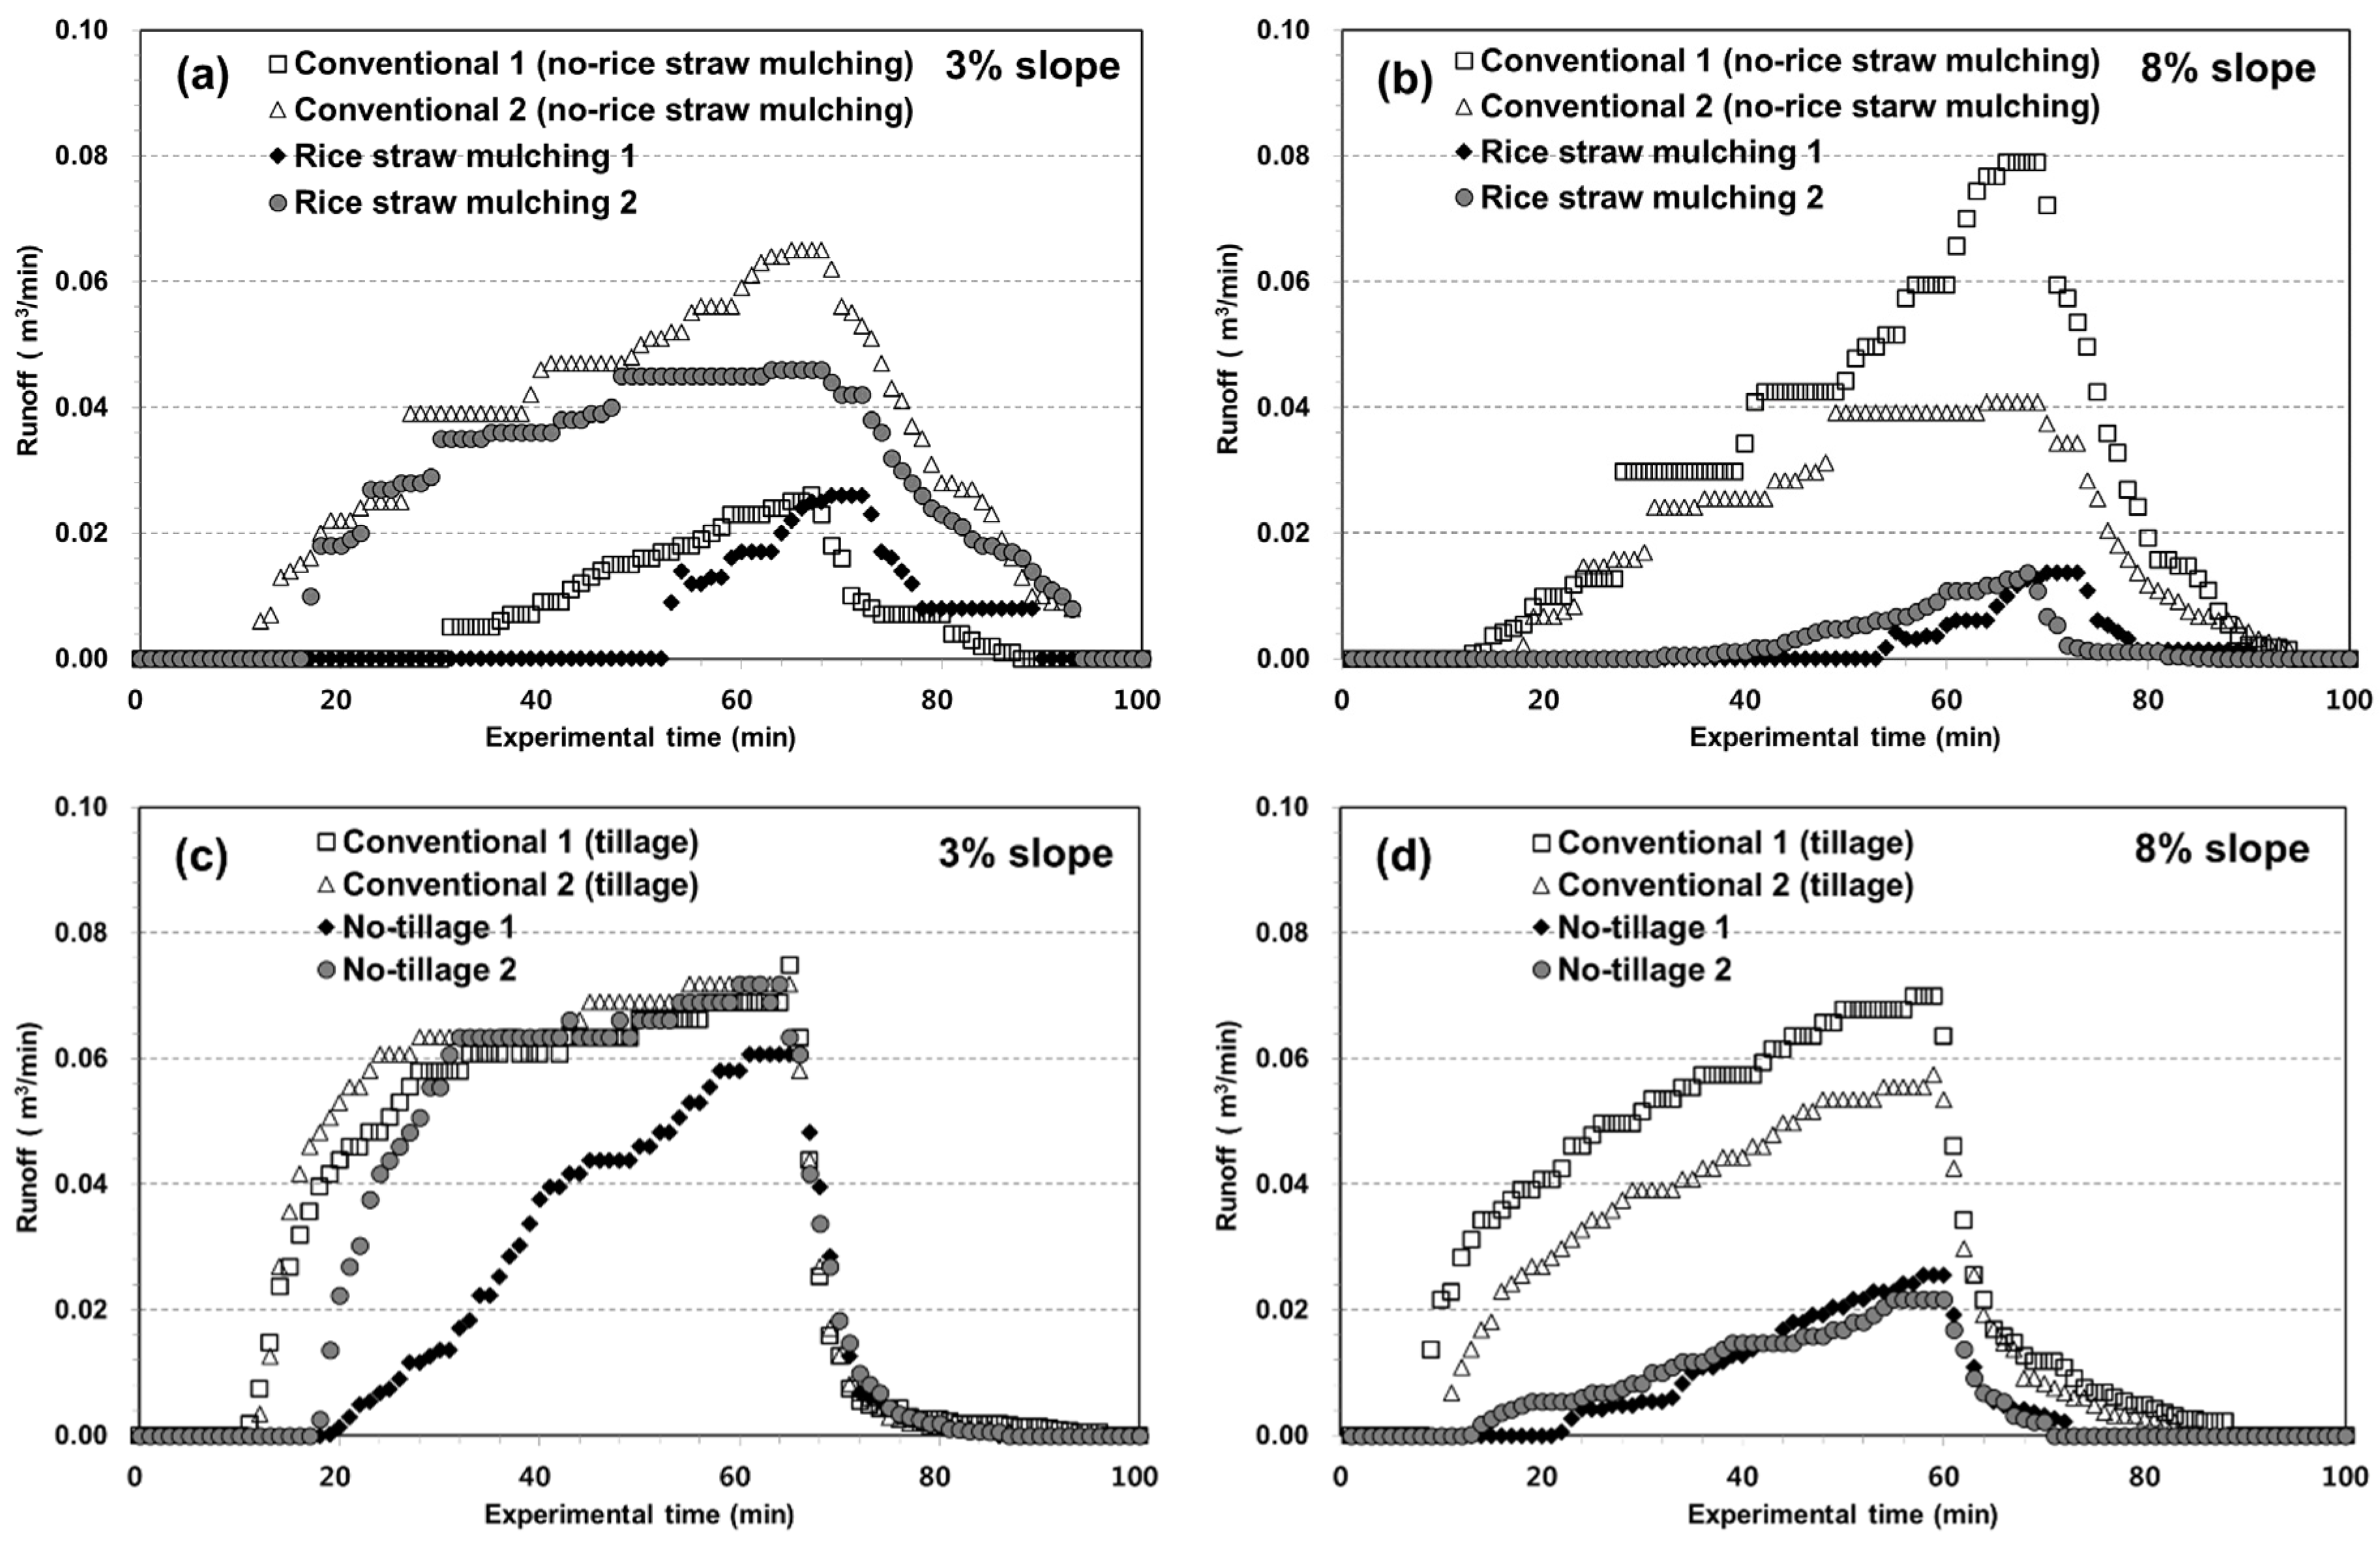
Figure 5 presents an example of field experiment results for runoff caused by a 42.5-mm rainfall for radish and sesame under rice straw mulching and no-tillage conditions compared to conventional farming (no-rice-straw mulching and tillage) with sloped plots at 3% and 8%, respectively. Compared with the conventional no-rice-straw mulching conditions, the rice straw mulching conditions reduced the runoff ratio, sediment, T-N and T-P by 9.0%, 95.9%, 32.6% and 43.5%, respectively. Compared with the conventional tillage conditions, the no-tillage conditions reduced the runoff ratio, sediment, T-N and T-P by 22.5%, 82.5%, 67.8% and 70.6%, respectively.
Table 3 shows the average reduction rates of the runoff and NPS pollution loads based on the results of the field experiment of 3% and 8%, respectively. The rice straw mulching method applied to cover the soil surface of penetration straw has been found to be effective for facilitating the soil infiltration of rainwater and for preventing soil loss by reducing surface runoff. Generally, the tillage practice disturbs the soil surface layer (to a depth of 20–30 cm), therein providing high soil porosity and infiltration capacity but compacts the underlying soil layers, thus impeding the soil water flow. The soil properties after tillage are stabilized by the rainfall energy impact and irrigation practices [
2]. The no-tillage practice maintains the natural physical soil properties of the entire soil layer, which allows microbial and biotic activities to increase the INFILT, BD, WP and FC of the soil environment. Therefore, for the conventional, rice straw mulching and no-tillage conditions of HSPF watershed modeling, the parameter values for INFILT, BD, WP and FC in the upland crop areas were selected to reproduce the runoff and nutrient discharge characteristics observed in the field results.
Based on the reductions in the runoff ratio of 9.0% and 22.5% under the rice straw mulching and no-tillage conditions observed in the average results for each field slope, the 1 parameter value (INFILT) for the rice straw mulching conditions and the 4 parameter values (INFILT, BD, WP and FC) for the no-tillage conditions were estimated by trial and error method until they achieved similar reductions in the runoff ratio (
Table 4). The HSPF simulation was conducted with the INFILT, BD, WP and FC values, and the percent changes in runoff, sediment, T-N and T-P for the applications of rice straw mulching and no-tillage BMPs are shown in
Table 5. The watershed runoff ratio, sediment, T-N and T-P values under the rice straw mulching conditions were reduced by 10.4%, 68.7%, 31.6% and 41.3%, respectively, compared with the parameters of the conventional conditions. The results for the no-tillage conditions show that the watershed runoff ratio, sediment, T-N and T-P values were reduced by 21.5%, 83.4%, 51.9% and 60.2%, respectively, compared with the parameters under the tillage conditions. The reduction in sediment was the greatest, followed by the reduction in T-P, which is closely correlated with sediment. Under runoff conditions, sediment with a high phosphate adsorption capacity can remove phosphate from the solution phase [
30]. T-N reduction within a watershed is affected by slow discharge to the baseflow and by the uncertainty of nitrogen characteristics such as volatilization into air and interactions with the soil [
2].
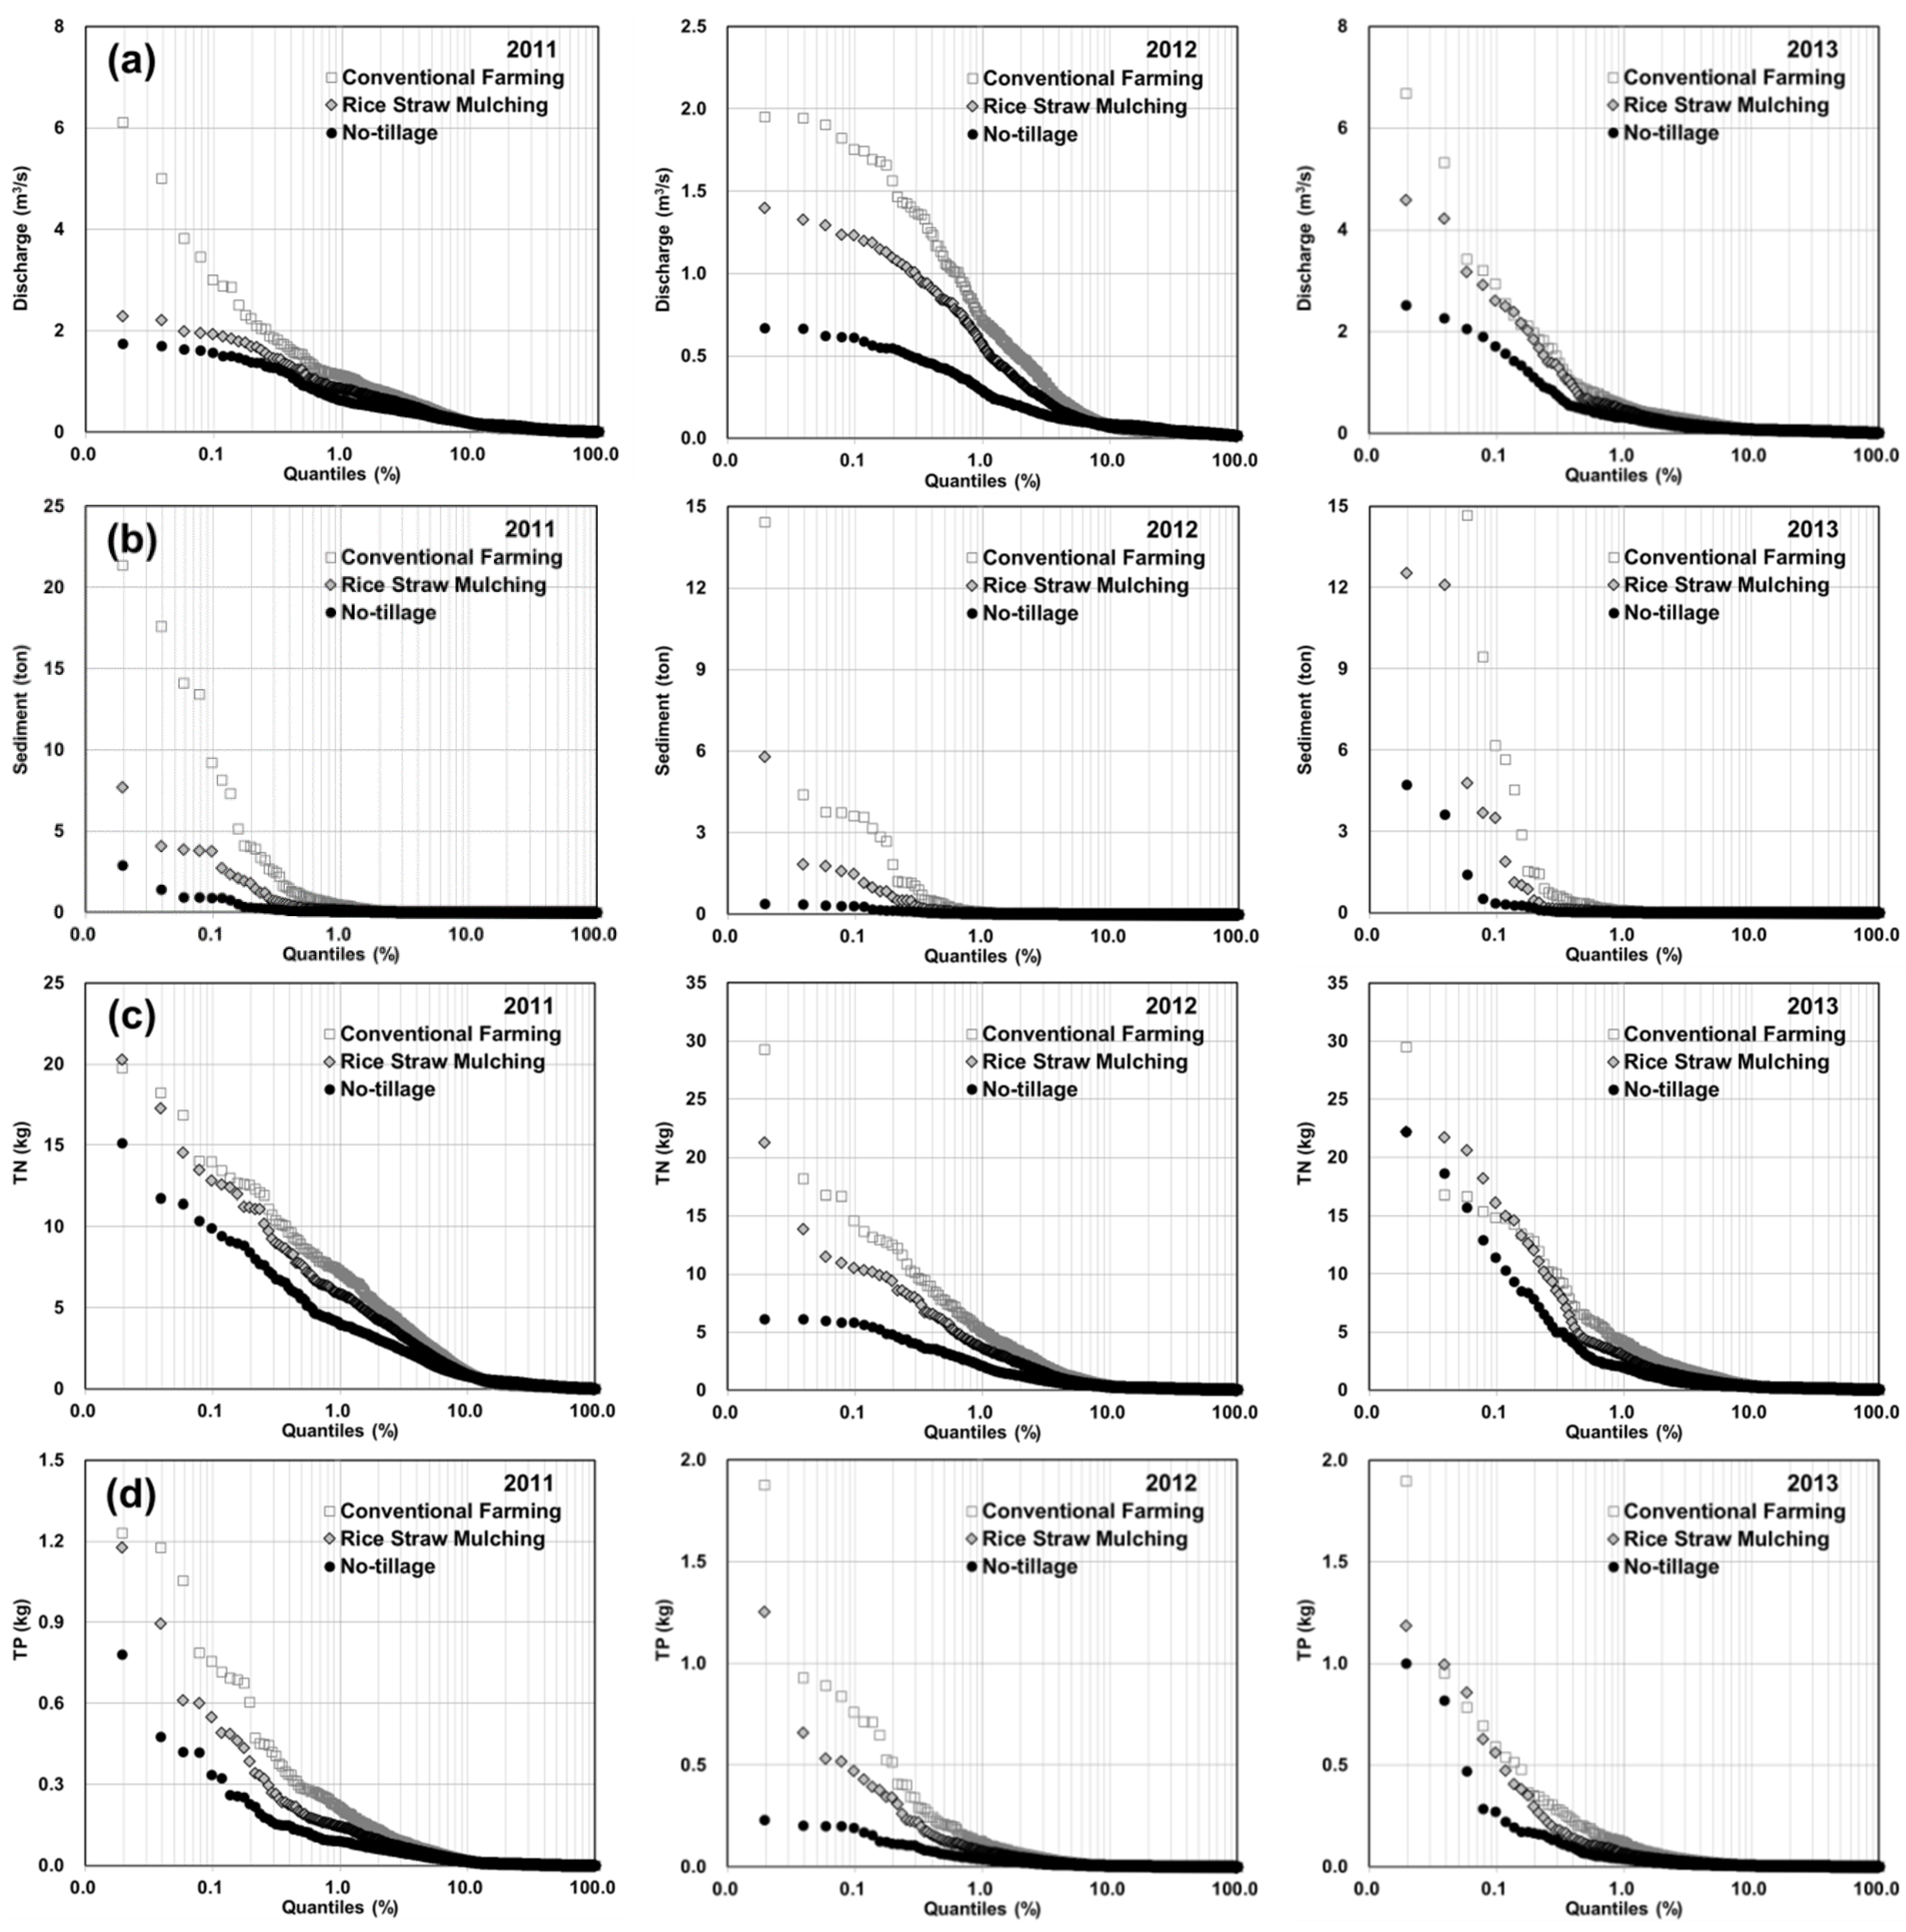
To further illustrate the reduction effect, comparisons of the quantile plots for the hourly runoff discharge, sediment T-N and T-P discharge loads under conventional, rice straw mulching and no-tillage conditions are shown for each year in
Figure 6. The reduced runoff discharge, sediment T-N and T-P discharge loads increase the no-tillage, rice straw mulching and conventional conditions in that order. The rice straw mulching and no-tillage conditions significantly reduced the discharge within the top 10% of the distribution (
Figure 6a). Significant reductions in the sediment, T-N and T-P also occurred within the top 2%, 10% and 10%, respectively, of the distribution (
Figure 6b–d).
4.3. HSPF Evaluation of Rice Straw Mulching and No-Tillage BMPs Based on Change Scenarios of Upland Crop Areas
To evaluate the influence of changes in upland crop areas on runoff and NPS pollution loads, the HSPF model was run for three years (2011–2013, hourly simulation of rainfall event average) and 10 years (2004–2013, hourly simulation of annual average) with land use data for the baseline scenario (upland crop area of 5%), Scenario 1 (upland crop area of 10%) and Scenario 2 (upland crop area of 30%). Then, the runoff and NPS pollution loads were compared to those with rice straw mulching and no-tillage BMPs.
Table 6 shows the variations of runoff and NPS pollution loads for rainfall events and annual averages using the model and land use scenarios. The hourly results for rainfall event averages show that the runoff ratio, sediment, T-N and T-P values increased by 3.2%, 15.7%, 44.5% and 22.7% in Scenario 1 and by 5.1%, 65.7%, 252.2% and 133.3% in Scenario 2 under the conventional condition. In addition, they increased by 2.7%, 16.6%, 51.1% and 28.4% in Scenario 1 and 5.0%, 87.4%, 276.8% and 161.3% Scenario 2 under the rice straw mulching condition, by 1.9%, 0.4%, 48% and 26.8% in Scenario 1, and by 4.0%, 45.1%, 262.8% and 155% in Scenario 2 under the no-tillage condition. Because the upland crop areas within the watershed increased the runoff ratio, sediment, T-N and T-P values increased. The sediment, T-N and T-P values were greatly increased compared to the runoff discharge.
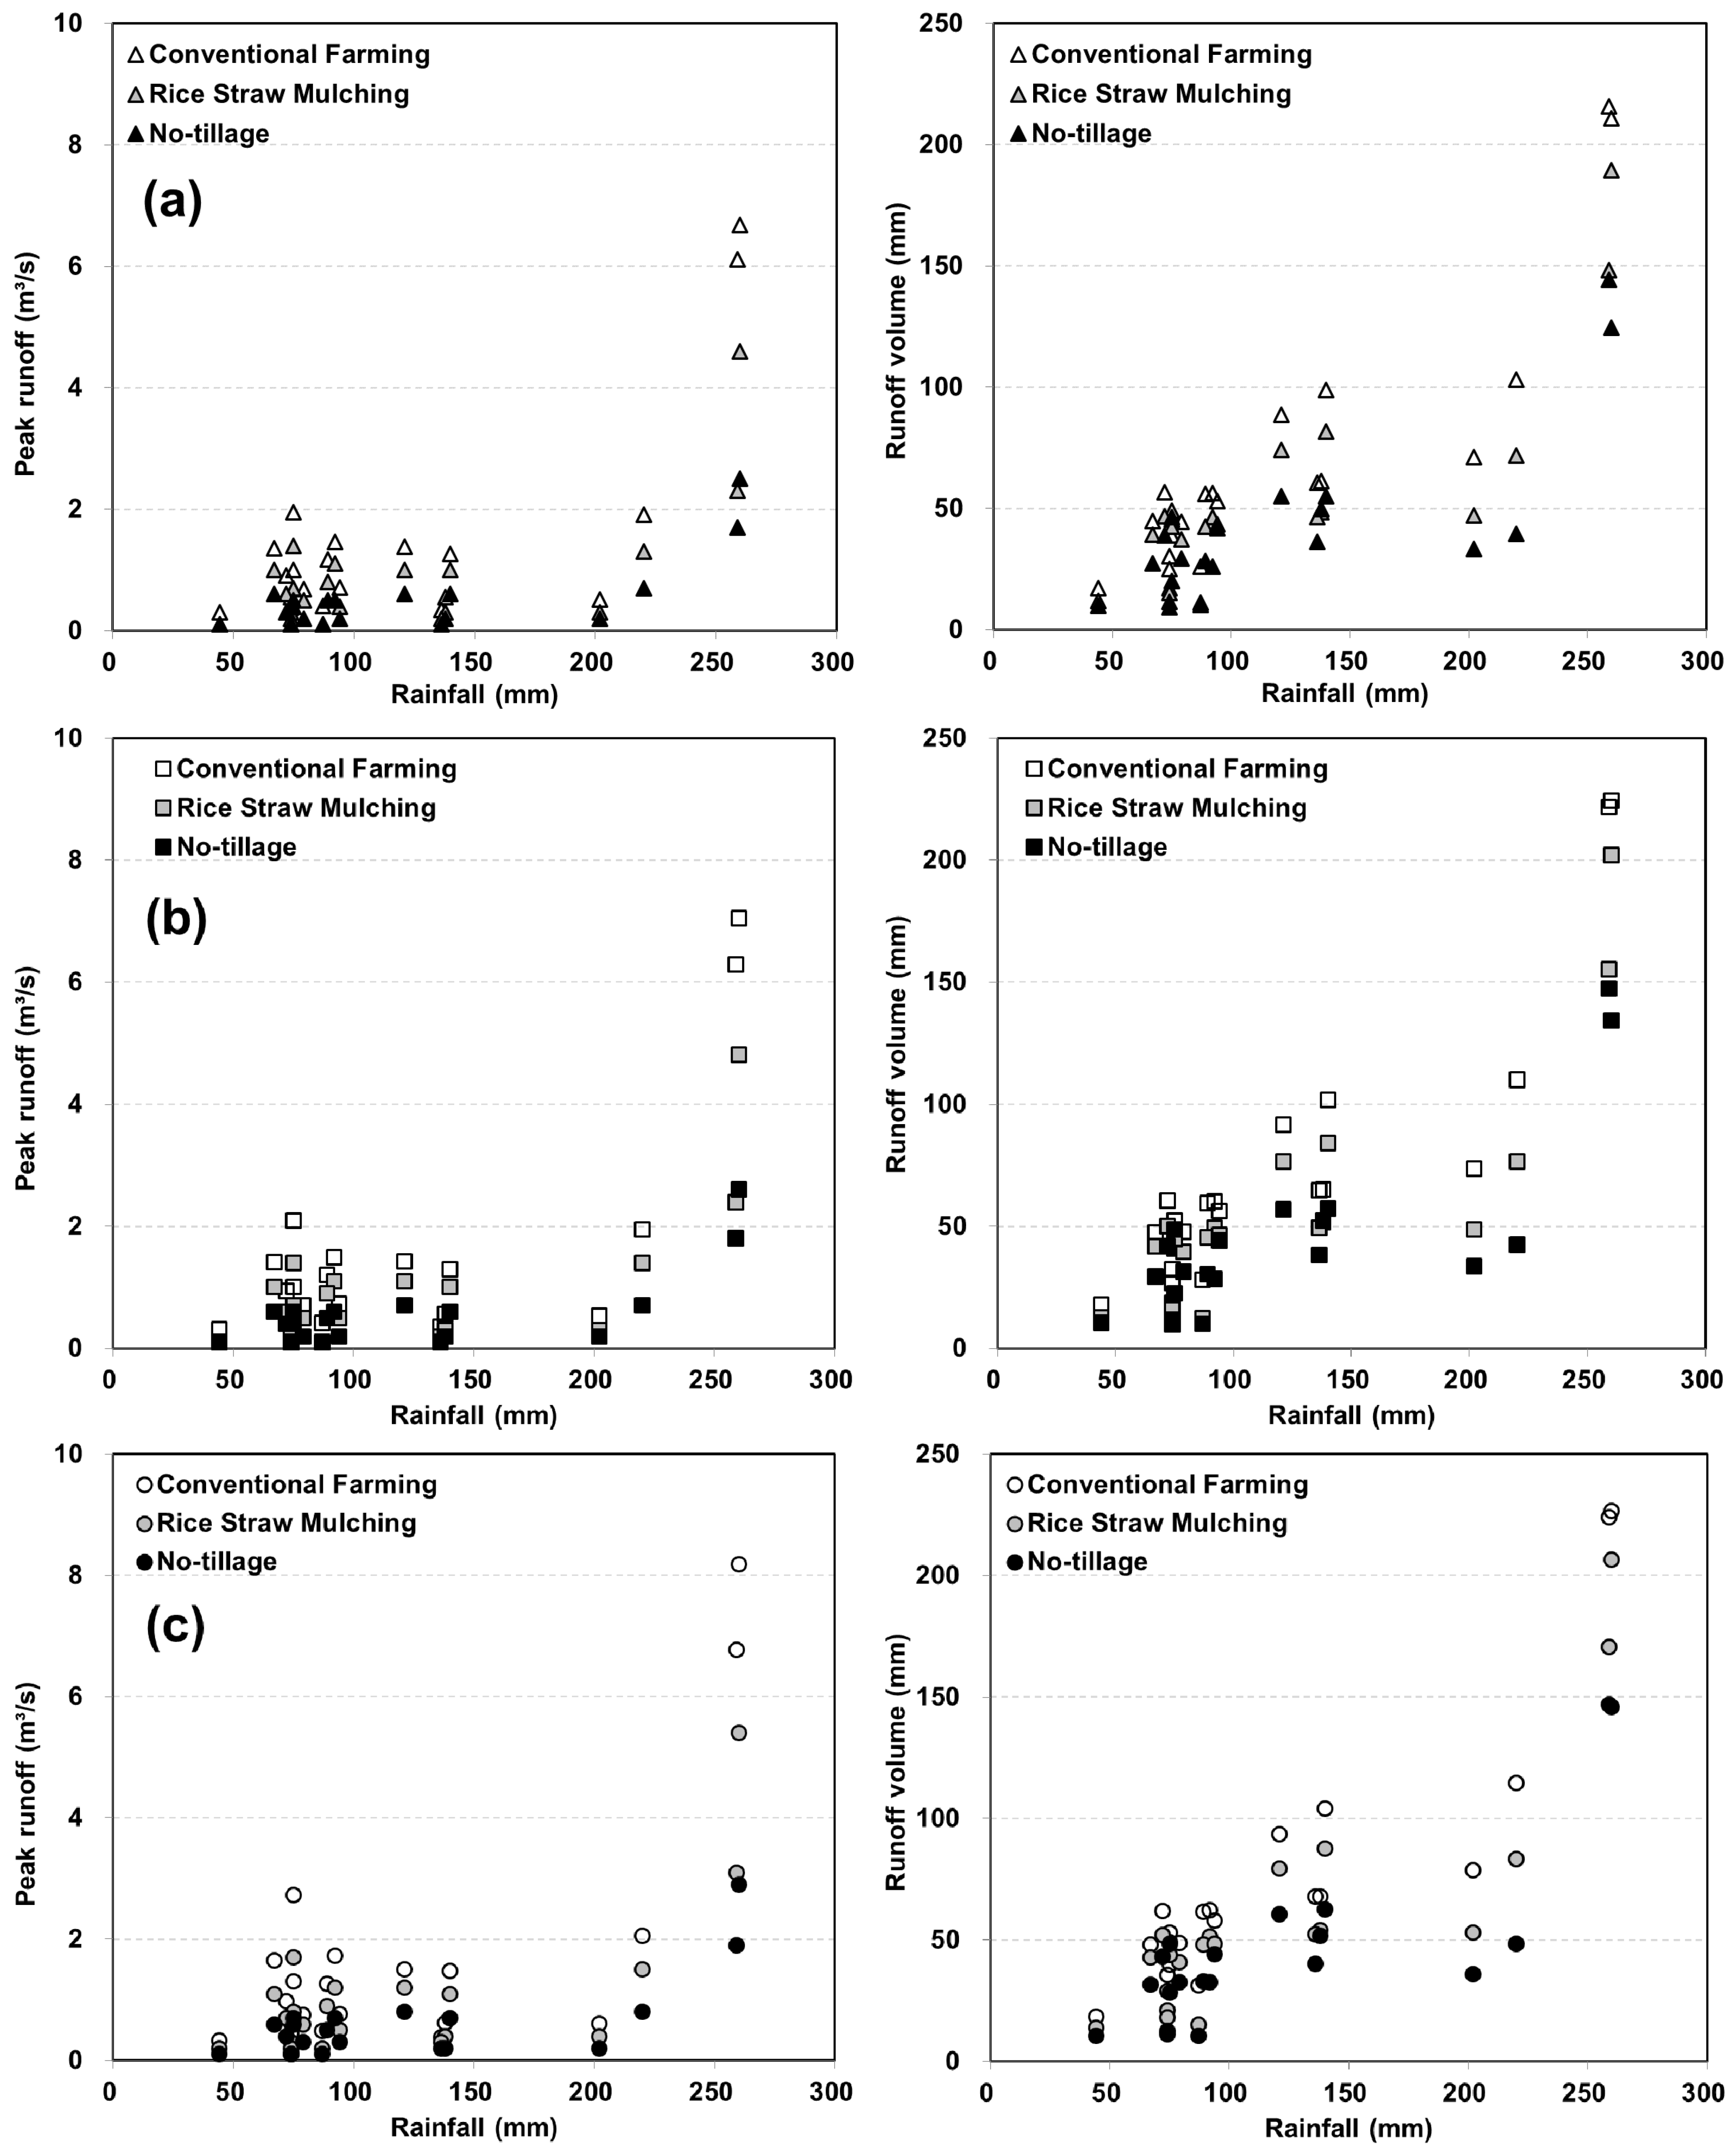
Figure 7 shows the hourly simulated peak runoff and runoff volume for rainfall events in relation to rainfall for three years (2011–2013) for the above land use scenarios. The straight line method was used for baseflow separation of the hydrograph. The results show that substantial reductions in peak runoff and runoff volume in all scenarios were found for large rainfall events. The average peak runoff and runoff volume for all scenarios father decreased by 9.2% and 6.0% under the rice straw mulching condition and by 7.3% and 11.5% under the no-tillage condition when the rainfall amount was over 200 mm when compared with rainfall events over 100 mm. Although peak runoff and runoff volume increased with increasing upland crop area, peak runoff and runoff volume can be reduced compared to conventional farming by applying rice straw mulching and no-tillage BMPs.
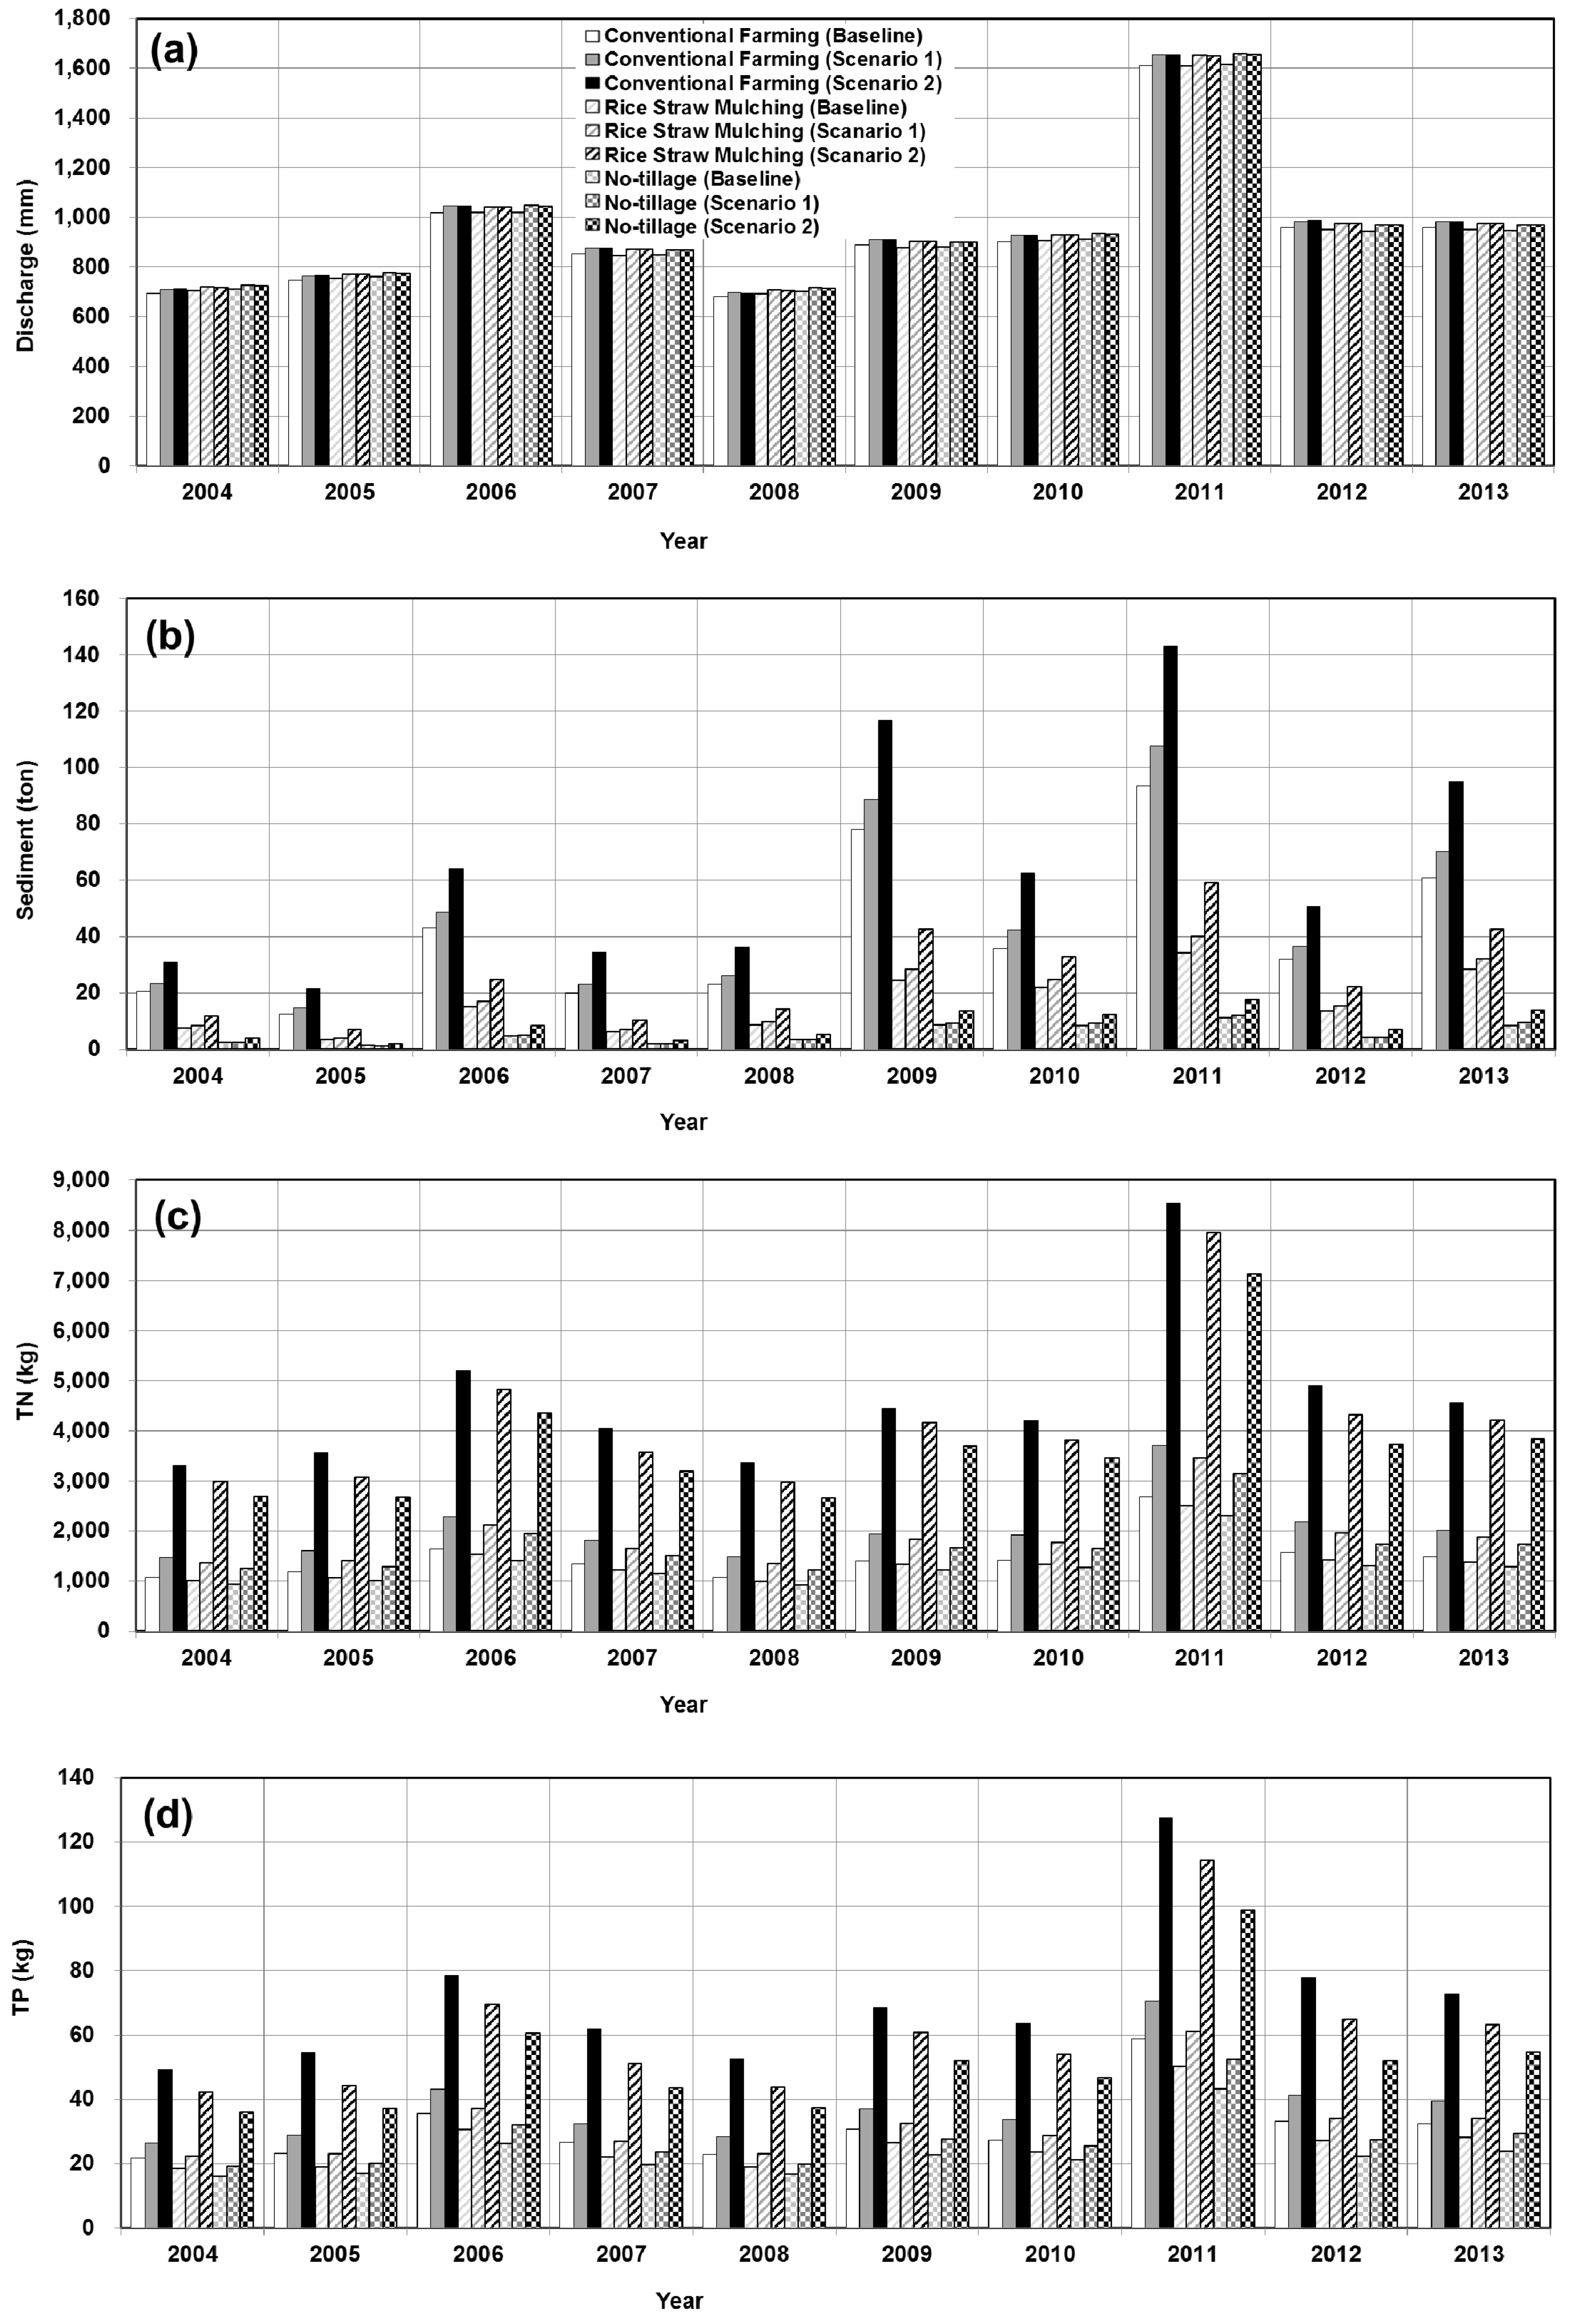
Figure 8 presents the annual change in discharge, sediment, T-N and T-P for 10 years (2004–2013) for the above land use scenarios. The discharge, sediment, T-N and T-P were more strongly affected by upland crop area within the watershed compared with BMPs. In particular, the no-tillage practice was certainly helpful for reducing NPS pollution loads (sediment, T-N and T-P) compared to using rice straw mulching. The proportion of NPS pollution loads was increased at the same ratio of increasing upland crop area (a tripling of the upland crop area corresponded to a six-fold increase in NPS pollution loads). In particular,
Table 6 and
Figure 8b show the obvious change in sediment loads by land use scenarios at the watershed outlet main channel. Based on the result of the study, rainfall−runoff can be effectively controlled by farming methods in upland areas such as rice straw mulching and no-tillage practices. In addition, as a result, sediment loads flowing into the stream are decreased.
5. Conclusions
In this study, the HSPF model was applied at a watershed scale to evaluate whether NPS pollution loads to streams are reduced by applying rice straw mulching and no-tillage BMPs in upland crop areas. Before the evaluation, the model was calibrated and validated using 20 rainfall events for runoff and 14 rainfall events for stream water quality (sediment, T-N and T-P) for a 1.21 km2 watershed with 5% upland crop areas (baseline). For the application of rice straw mulching and no-tillage BMP evaluation using the HSPF model, field-scale experiments under conventional (no-rice straw mulching or tillage), rice straw mulching and no-tillage conditions were conducted to determine the model parameters and degree to which they should be controlled. Based on results from field experiment from plots with 3% and 8% slopes under radish and sesame cultivation, the INFILT parameter under the rice straw mulching condition and the INFILT, BD, WP and FC parameters under the no-tillage condition of the HSPF model were selected to reproduce the field runoff and nutrient discharge characteristics. The HSPF evaluation based on the application of BMPs for the 1.21 km2 watershed showed that the watershed runoff ratio, sediment, T-N and T-P values were reduced by 10.4%, 68.7%, 31.6% and 41.3% under the rice straw mulching condition and 21.5%, 83.4%, 51.9% and 60.2% under the no-tillage condition compared with conventional conditions. The greatest reduction in NPS pollution loads was observed for the sediment value, followed by T-P and T-N. In addition, the land use change scenarios for the baseline (5% upland crop area), Scenario 1 (10% upland crop area) and Scenario 2 (30% upland crop area) were applied with the model for three years (2011–2013, hourly simulation for rainfall event average) and 10 years (2004–2013, hourly simulation for annual average). The hourly results for the rainfall event averages of the evaluation show that the runoff ratio, sediment, T-N and T-P values increased by 1.9%, 0.4%, 48.0% and 26.8% in Scenario 1 and by 4.0%, 45.1%, 262.8% and 155.0% in Scenario 2 under the no-tillage condition. The no-tillage practice was more effective at reducing NPS pollution loads (sediment, T-N and T-P) compared to using rice straw mulching.
The rice straw mulching and no-tillage conditions for BMPs cannot be perfectly simulated due to limited results from model parameters. However, this study attempted to combine field experiments and watershed modeling to facilitate parameter adjustment and reduce uncertainty in the model. The results of this study are useful in terms of non-structural mitigation measures in regard to how agricultural NPS pollution loads can be reduced in watersheds. The rice straw mulching and no-tillage operations can provide large reductions in NPS pollution loads and the enhancement of the ecological health of the Byulmi−cheon watershed. The BMPs recommended in this study entirely depend on farmers maintaining efforts towards rice straw mulching and no-tillage practices. However, farmers have difficulties in securing and/or managing rice straw mulching and no-tillage practices as a result of machinery work destruction and the succession of conditions to the next year. Therefore, the participation of farmers as well as institutional support are necessary for the successful enactment of non-structural mitigation measures. The lessons learned from this study will be incorporated into the TMDL (Total Maximum Daily Loads) planning and management of the local governments of the watershed to achieve the target water quality.
Acknowledgements
This research was supported by a grant (14AWMP-B082564-01) from the Advanced Water Management Research Program funded by the Ministry of Land, Infrastructure and Transport of Korean government.
Author Contributions
Seong-Joon Kim and So-Ra Ahn conceived and designed the experiments; So-Ra Ahn performed the experiments and analyzed the data; Seong-Joon Kim and So-Ra Ahn wrote the paper.
Conflicts of Interest
The authors declare no conflict of interest.
References
- Ministry of Environment. Effective Management of Main Non−Point Source Pollution; Gwacheon: Gyeonggi-do, Korea, 2015.
- Ahn, S.R.; Choi, J.D.; Kim, S.J. HSPF Evaluation of Watershed-Scale Tillage Effects on Nonpoint Source Loads from Upland Crop Areas. Irrig. Drainage 2015, in press. [Google Scholar]
- Ministry of Environment (Interagency). Non−Point Source Pollution, ’12–’20; Gwacheon: Gyeonggi-do, Korea, 2012.
- Rao, N.S.; Easton, Z.M.; Schneiderman, E.M.; Zion, M.S.; Lee, D.R.; Steenhuis, T.S. Modeling Watershed-Scale Effectiveness of Agricultural Best Management Practices to Reduce Phosphorus Loading. J. Environ. Manag. 2009, 90, 1385–1395. [Google Scholar] [CrossRef] [PubMed]
- Giri, S.; Nejadhashemi, A.P.; Woznicki, S.A. Evaluation of Targeting Methods for Implementation of Best Management Practices in the Saginaw River Watershed. J. Environ. Manag. 2012, 103, 24–40. [Google Scholar] [CrossRef] [PubMed]
- Liu, R.; Zhang, P.; Wang, X.; Chen, Y.; Shen, Z. Assessment of Effects of Best Management Practices on Agricultural Non−Point Source Pollution in Xiangxi River Watershed. Agric. Water Manag. 2013, 117, 9–18. [Google Scholar] [CrossRef]
- Dechmi, F.; Skhiri, A. Evaluation of Best Management Practices under Intensive Irrigation Using SWAT Model. Agric. Water Manag. 2013, 123, 55–64. [Google Scholar] [CrossRef] [Green Version]
- Strauch, M.; Lima, J.E.F.W.; Volk, M.; Lorz, C.; Makeschin, F. The Impact of Best Management Practices on Simulated streamflow and Sediment Load in a Central Brazilian Catchment. J. Environ. Manag. 2013, 127, S24–S36. [Google Scholar] [CrossRef] [PubMed]
- Jung, C.G.; Ahn, S.R.; Kim, S.J.; Yang, H.J.; Lee, H.J.; Park, G.A. HSPF and SWAT Modelling for Identifying Runoff Reduction Effect of Nonpoint Source Pollution by Rice Straw Mulching on Upland Crops. J. Korean Soc. Agric. Eng. 2013, 55, 47–57. [Google Scholar] [CrossRef]
- Jang, S.S.; Ahn, S.R.; Choi, J.D.; Kim, S.J. Hourly SWAT Watershed Modeling for Analyzing Reduction Effect of Nonpoint Source Pollution Discharge Loads. J. Korean Soc. Agric. Eng. 2015, 57, 89–97. [Google Scholar] [CrossRef]
- Crawford, H.H.; Linsley, R.K. Digital Simulation in Hydrology: Stanford Watershed model IV; Technical Report No. 39; Department of Civil Engineering, Stanford University: Stanford, CA, USA, 1966. [Google Scholar]
- Donigian, A.S., Jr.; Davis, H.H. User’s Manual for Agricultural Runoff Management (ARM) Model; EPA-600/3-78-080; USEPA: Athens, GA, 1978.
- Donigian, A.S., Jr.; Crawford, N.H. Modeling Nonpoint Pollution from the Land Surface; EPA-600/3-76-083; USEPA: Athens, GA, USA, 1976.
- Donigian, A.S., Jr.; Bicknell, B.R.; Imhoff, J.C. Hydrological Simulation Program—FORTRAN (HSPF). In Computer Models of Watershed Hydrology; Singh, V.P., Ed.; Water Resources Pubs: Highlands Ranch, CO, USA, 1995; pp. 395–442. [Google Scholar]
- Donigian, A.S., Jr.; Huber, W.C. Modeling of Nonpoint Source Water Quality in Urban and Non−Urban Areas; EPA-600/3-91-039; USEPA: Athens, GA, USA, 1991.
- Hydrocomp, Inc. Hydrocomp Water Quality Operations Manual; Hydrocomp, Inc: Palo Alto, CA, USA, 1977. [Google Scholar]
- Lahlou, M.; Shoemaker, L.; Choundhury, S.; Elmer, R.; Hu, A.; Manguerra, H.; Parker, A. Better Assessment Science Integrating Point and Nonpoint Sources—BASINS; EPA-823-B-98-006; USEPA: Washington, DC, USA, 1998.
- Bicknell, B.R.; Imhoff, J.C.; Kittle, J.L.; Jobes, T.H., Jr.; Donigian, A.S. Hydrological Simulation Program—FORTRAN (HSPF). User’s Manual for Release 12; EPA Environmental Research Laboratory and Office of Surface Water Geological Survey: Athens, GA, USA; Reston, VA, USA, 2001.
- Albek, M.; Bakır Öğütveren, Ü.; Albek, E. Hydrological Modeling of Seydi Suyu Watershed (Turkey) with HSPF. J. Hydrol. 2004, 285, 260–271. [Google Scholar] [CrossRef]
- Im, S.; Brannan, K.M.; Mostaghimi, S.; Kim, S.M. Comparison of HSPF and SWAT Models Performance for Runoff and Sediment Yield Prediction. J. Environ. Sci. Health Part A 2007, 42, 1561–1570. [Google Scholar] [CrossRef] [PubMed]
- Fonseca, A.; Botelho, C.; Boaventura, R.A.; Vilar, V.J. Integrated Hydrological and Water Quality Model for River Management: A Case Study on Lena River. Sci. Total Environ. 2014, 485–486, 474–489. [Google Scholar] [CrossRef] [PubMed]
- Binkley, D.; Brown, T.C. Forest Practices as Nonpoint Sources of Pollution in North America. J. Am. Water Res. Assoc. 1993, 29, 729–740. [Google Scholar] [CrossRef]
- Chen, Y.D.; Carsel, R.F.; Mccutcheon, S.C.; Nutter, W.L. Stream Temperature Simulation of Forested Riparian Areas: I. Watershed-Scale Model Development. J. Environ. Eng. 1998, 124, 304–315. [Google Scholar] [CrossRef]
- Chen, Y.D.; Mccutcheon, S.C.; Norton, D.J.; Nutter, W.L. Stream Temperature Simulation of Forested Riparian Areas: II. Model Application. J. Environ. Eng. 1998, 124, 316–328. [Google Scholar] [CrossRef]
- Donigian, A.S.; Imhoff, J.C.; Bicknell, B.R.; Kittle, J.L. Application Guide for Hydrological Simulation Program—FORTRAN (HSPF); U.S. Environmental Protection Agency: Athens, GA, USA, 1984.
- Nash, J.E.; Sutcliffe, J.V. River Flow Forecasting through Conceptual Models Part I—A Discussion of Principles. J. Hydrol. 1970, 10, 282–290. [Google Scholar] [CrossRef]
- Steel, R.G.D.; Torrie, J.H. Linear Correction. In Principles and Procedures of Statistics; Steel, R.G., Torrie, J.H., Eds.; McGraw Hill: New York, NY, USA, 1960; pp. 187–287. [Google Scholar]
- Moriasi, D.N.; Arnold, J.G.; Van Liew, M.W.; Bingner, R.L.; Harmel, R.D.; Veith, T.L. Model Evaluation Guidelines for Systematic Quantification of Accuracy in Watershed Simulations. Trans. ASABE 2007, 50, 885–900. [Google Scholar] [CrossRef]
- Donigian, A.S.; Love, J.T. Sediment Calibration Procedures and Guidelines for Watershed Modeling. In TMDL 2003 Proceedings of the WEF Specialty Conference; Water Environment Federation: Alexandria, VA, USA, 2003. [Google Scholar]
- Ghadiri, H.; Rose, C.W. Water Erosion Processes and the Enrichment of Sorbed Pesticides. Part 2. Enrichment under Rainfall Dominated Erosion Process. J. Environ. Manag. 1993, 37, 37–50. [Google Scholar] [CrossRef]
© 2016 by the authors; licensee MDPI, Basel, Switzerland. This article is an open access article distributed under the terms and conditions of the Creative Commons by Attribution (CC-BY) license (http://creativecommons.org/licenses/by/4.0/).


