Article

Bacteria Removal from Stormwater Runoff Using Tree Filters: A Comparison of a Conventional and an Innovative System

by
Laura A. Schifman
1,2,*,
Varun K. Kasaraneni
2,3,
Ryan K. Sullivan
1,
Vinka Oyanedel-Craver
2 and
Thomas B. Boving
1,2
1
Department of Geosciences, 9 E. Alumni Avenue, University of Rhode Island, Kingston, RI 02881, USA
2
Department of Civil and Environmental Engineering, 1 Lippitt Road, University of Rhode Island, Kingston, RI 02881, USA
3
Environmental Engineering and Earth Sciences, Wilkes University, Wilkes-Barre, PA 18766, USA
*
Author to whom correspondence should be addressed.
Water 2016, 8(3), 76; https://doi.org/10.3390/w8030076
Submission received: 19 January 2016 / Revised: 15 February 2016 / Accepted: 19 February 2016 / Published: 1 March 2016
(This article belongs to the Special Issue BMP Development, Implementation, and Performance)

Abstract

:
Non-point source pollution of stormwater contributes high contaminant loads into surface water bodies and poses a threat to the ecosystem, public health and economy. Although (pre)treatment standards have not been introduced at the federal level, Rhode Island (RI) has set minimal contaminant reduction standards for stormwater using structural best management practices (BMP). As BMP performance depends highly on geographical location and climate, and the Northeastern United States experiences broad ranges of temperatures throughout the year along with long intermittent periods between precipitation events, stormwater treatment can be challenging. In this field study, two tree filters were evaluated: a conventional unit (CTF) with sand/shale mix as filter media, and a modified tree filter (ITF) with an added layer of red cedar wood chips amended with 3-(trihydroxysilyl)propyldimethyloctadecyl ammonium chloride. Both BMPs were monitored for 346 days primarily for Escherichia coli and polycyclic aromatic hydrocarbons (PAH). Both tree filters met or outperformed RI’s standards for bacteria removal (60%) and TSS (85%), making them a good choice for BMP use in this climate. Total suspended solids, E. coli, PAHs, nitrate, and phosphate removal is higher in ITF. A controlled field scale tracer test using E. coli confirmed these results.

1. Introduction

Areas with shallow water tables are vulnerable to stormwater and agricultural runoff contamination, as high contaminant loads are introduced from untreated surface water runoff during storm events, resulting in water quality issues, beach closings, and impairing the economic activities of (coastal) communities [1,2,3,4,5,6]. Despite the risks associated with stormwater runoff contaminants, very few stormwater treatment regulations exist. In the United States, Rhode Island is at the forefront of stormwater regulations, requiring any new construction to include stormwater BMPs that remove at least 85% of total suspended solids (TSS), 60% of influent bacteria, and 30% of nitrogen and phosphorous [7,8].
The majority of BMP systems are not designed to treat the wide range of contaminants that are typically found in stormwater runoff, e.g., heavy metals, PAHs, and bacteria [9,10] and it is unclear how performance is influenced under varying weather conditions, such as those experienced in the Northeastern United States.
A popular type of BMPs is a stormwater retention system. While these BMPs may treat total suspended solids (TSS) effectively [11,12], few systems exist that address bacterial removal. Two of such systems are BactoLoxx (Filtrexx, Goffstown, NH), and Bacterra (Filterra Bioretention Designs, Ashland, VA, USA). These systems rely on proprietary flocculation agents that result in the settling of bacteria [10], and on physical filtration and predation from biomat formation [9], respectively. The stated bacteria removal efficiency for these two stormwater BMPs reaches up to 99%. However, recent studies on bacteria removal in a wide range of structural BMPs concluded that bacteria treatment was ineffective and unreliable, as the removal of pathogens primarily relied on attachment/collection and not inactivation [13,14]. This is because sorbed pathogens can remain viable during attachment [15,16,17] and therefore can be remobilized/detached during intermittent flow conditions. The ineffectiveness in inactivating bacteria is especially relevant in areas with shallow water tables, because not enough soil depth might be present to filter out pathogens effectively, therefore increasing the risk of bacterial contamination of groundwater [18].
While BMP manufacturers, such as Filtrexx and Filterra offer filter modules that have to be added to a BMP to treat additional contaminant categories, other multi-contaminant BMPs, such as biofiltration systems, remove 0%–80% of bacteria [19,20]. This is considered insufficient from a public health perspective [1,21,22]. Therefore, new approaches are required to enhance the inactivation of pathogenic organisms as well as the removal of other contaminants in stormwater and possibly implement these technologies in the next generation BMPs.
In addition, varying climatic conditions such as those experienced in the Northeastern United States, including cold winters, spring snowmelt, and long intermittent dry periods persist in between intense precipitation events in summer, may impact system performance. While studies have carried out BMP evaluations in regions that do not experience extreme temperature variation [19,23,24,25,26] it is imperative to evaluate BMP performance in conditions characterized by long dry periods, intense precipitation events and cold temperatures that might freeze the system.
Studies have shown that filter materials amended with antimicrobials can remove bacteria from aqueous solutions by inactivation processes that damage the cell [15,16,27,28] or permanently fixating bacteria on porous media [16]. For instance, in a previous study antimicrobially amended wood chips were tested with intentions for use in stormwater BMPs [15,29]. The laboratory derived data indicate that red cedar wood chips loaded with 6 mg/g of 3-(trihydroxysilyl)propyldimethyloctadecyl ammonium chloride (TPA) effectively removed E. coli from aqueous solution by at least two Log10 units (>99%). In addition, studies have shown that wood is capable of almost quantitatively removing aqueous phase PAH [30,31,32,33], dissolved metals and other inorganic compounds [34]. While the E. coli removal rate of the amended wood is substantially greater than required by some states, the performance of the filter material was only tested under laboratory batch conditions [15]. Additional studies are therefore needed to evaluate the performance of this promising antimicrobial treatment approach under field conditions.
The need for multi-contaminant runoff treatment systems and innovative BMP designs was addressed in this study by modifying a conventional tree filter BMP with an antimicrobial agent, TPA. A tree filter (TF) is a structural BMP that relies on filtration and bioretention in which plant, soil, and microbial activity remove pollutants through a variety of physical, chemical, and primarily aerobic biological processes. A typical TF collects runoff and entrained sand and sediment, which enters the TF via curbside openings. Depending on the manufacturer, the runoff immediately flows into an approximately 100 cm deep “pretreatment” sump (here referred to as the catch basin), located within the interior of the concrete frame of the TF structure. Heavier sediment settles out and is retained in the catch basin. As water continues to enter and fill the catch basin, the water level rises and ultimately spills over the catch basin wall to enter the main portion of the TF, which is composed of a layer of engineered mix of permeable sand and expanded shale. This matrix has a water holding capacity that supports healthy tree growth and, according to the manufacturer, has chemical and biological treatment capabilities. Finer sediments in solution, which were not captured in the catch basin, are primarily trapped and held within the pore spaces of the sand and shale matrix. Water flows downward and the “cleansed” runoff ultimately infiltrates to the groundwater zone in TF systems with open design (as used in this study). TF systems with closed box design discharge the infiltrating runoff to the public stormwater drainage system.
The objective of this study was to evaluate two TFs (1) a conventional tree filter with a sand/shale mix as a filtration matrix and (2) an innovative TF with an additional layer of red cedar wood chips amended with an antimicrobial agent, TPA, to address the removal of bacteria, nutrients, heavy metals, and PAH pollutants from stormwater runoff. We hypothesize that the new media will increase the removal of inorganic and organic pollutants and bacteria in the field when compared to the performance of a conventional TF system. The results of this study may aid stormwater and water quality managers in deciding which BMP technology to select for future projects.

2. Methods

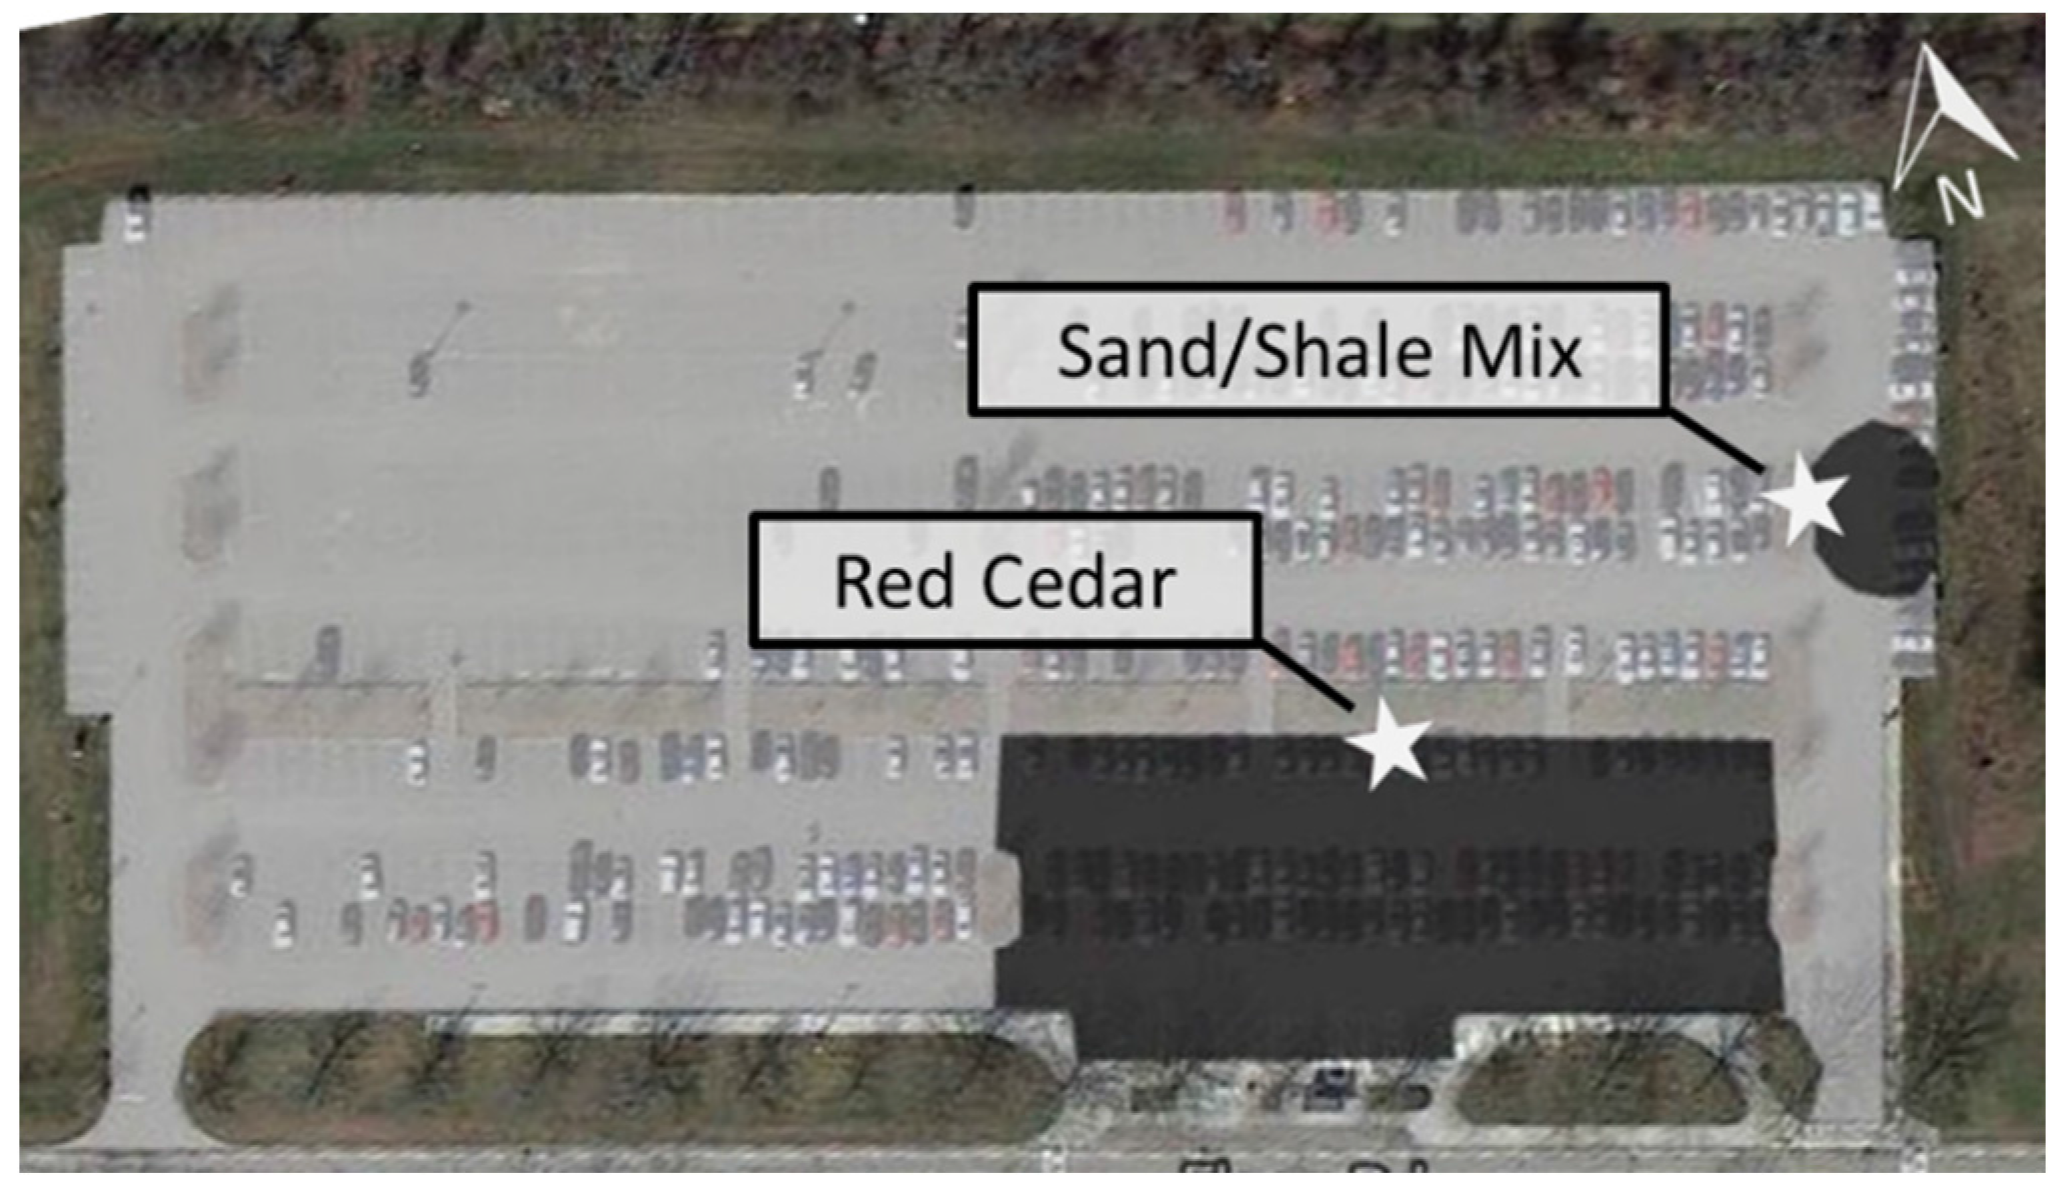
2.1. Site Description

The study site was located on a commuter parking lot on the northern end of the University of Rhode Island, Kingston campus. The dominant use of land surrounding the parking lot and the university in general is agricultural. The parking lot has a conventional asphalt cover with 458 parking spaces covering 4.9 acres (19,830 m2; Figure 1) and is part of the Rhode Island Stormwater Demonstration Facility (RISTDF) which is situated over the Chipuxet Aquifer in southern Rhode Island. The aquifer is overlain by a thin layer of loess and below it contains complexly interbedded lenses of sand and gravel with smaller contributions of silt and silty sands [35]. These glacio-fluvial deposits were deposited during the Pleistocene epoch [35]. The stratified material is approximately 60 m thick and overlies fractured granitic bedrock. The depth to groundwater at the site is approximately 7 m below ground surface (bgs) [36]. Based on a 20 year data set starting in 1994, the field site receives an average of 1202 mm precipitation per year, with an annual average of 841 mm of snow. During this period an average of 77 days per year received precipitation equal to or greater than 2.54 mm (0.1 inch), 31 days received greater than or equal to 12.7 mm (0.5 inch) of precipitation and 12 days per year received greater than or equal to 25.4 mm (1 inch) [37].
The two tree filter systems were provided by Storm-Tree Inc., Providence, RI, USA and installed on the RISTDF site, which was constructed with funding from the Rhode Island Department of Transportation and the URI Transportation Center in August 2013. The TF dimensions and their catchment areas are summarized in Table 1, with the conventional TF (CTF) being slightly smaller (0.64 m3) than the innovative TF (ITF) (1.13 m3). Both TF units contained a mixture of sand and expanded shale and 10% sphagnum peat as the filter media. The ITF unit had an approximately 8 cm (3 inch) layer of 30 kg (0.10 m3) bioactive red cedar wood chips added to the sand and expanded shale mix (1.13 m3). Both TF units are open concrete structures with a catch basin. The open structure on the bottom of the TF allowed the filtered runoff to infiltrate into the ground. The catch basin retains sediment and other debris present in runoff. However, the load of sediment captured by the TF systems was not quantified in our study. The contributing area of two filters as well as the units themselves varied slightly in size with the unit containing the amended red cedar wood chips being larger and serving a greater contributing area (Table 1). A red maple tree (Acer rubrum) was planted in the units to complete the TF system. Red maple was chosen to match the surrounding trees in the parking lot.
During installation of the TF systems, a stainless steel pan with an area 0.072 m2 was installed at the bottom of the excavation pit approximately 1.5 m (5 ft) below ground surface (bgs), i.e., 71 cm (28 inch) below the infiltration surface of each TF. The pan drained collected water through a central hole connected to a Teflon tube leading to the surface. Water collected in the pan was pumped to the surface using a peristaltic pump. In addition, soil water and temperature sensors were installed at the bottom of the filter (Decagon Devices, Pullman, WA, USA; Figure S1).
Meteorological data was obtained from a National Climatic Data Center station that is located less than 0.6 km from the experimental site.

2.2. ITF Preparation

Following the procedures described by Kasaraneni et al., the red cedar wood chips were amended with 6 mg/g 3-(trihydroxysilyl)propyldimethyloctadecyl ammonium chloride (TPA), a quaternary ammonium compound [29]. Briefly, the red cedar was soaked in frequently exchanged clean water for a minimum of 2 weeks to leach out soluble matter and remove fines. Next, a solution containing 750 mg/L TPA and wood in a ratio of 25 L to 1 kg was stirred for 9 days or until the aqueous concentration of TPA solution did not change and maximum sorption to the wood was achieved (Figure S2). The amended red cedar wood chips were dried, weighed, and stored in a dark, dry location before being added to the tree filter.

2.3. Sampling and Analysis

From November 2013 until August 2014 composite runoff in the catch basin (influent) and the stainless steel pan (effluent) were sampled weekly. The samples collected as part of this sampling effort can be described as composite samples, as the collection pan buried at the bottom of the TF collected an integrated sample of the runoff while the influent collected from the catch basin is a time-integrated composite sample. In addition, six individual rain events were sampled during this period. These samples were collected at least 30 min after the start of a rain or snow melt event and the influent was collected as a grab sample before it entered the catch basin. The effluent was collected 20–30 min after the influent sample (and after the water from the catch basin entered the infiltration area). The lag time between the sample events reflects hydraulic retention time in the BMPs. While the main focus was on changes in E. coli and fecal coliform (as fecal indicator bacteria) concentrations, all samples were analyzed for pH, specific conductance, temperature, chloride, nitrate, orthophosphate (starting in July 2014), total suspended solids (TSS), heavy metals (Cd, Cu, Ni, Pb, Zn) and polycyclic aromatic hydrocarbons (PAH). Details on the analytical techniques used can be found in the supplemental information.
Cadmium was never detected in runoff samples and therefore not further reported. The removal of copper, lead, and zinc could not be quantified because during both sampling seasons, these metals leached from the brass fitting and welds on the stainless steel sampling pan. Similar observations were reported by Schock and Neff [38].
For both seasons the long-term mass load for each constituent in the influent and effluent was calculated by first calculating the runoff volume:
V i   =   P i R i A L
where Vi is the runoff volume per sampling date, Pi is the precipitation amount (m), A is the contributing area (m3), R is the runoff coefficient (0.9 for impervious surfaces), L are losses incurred otherwise (0.5 due to losses to drains) and then multiplying it by the mass load for the influent and effluent for each event:
M i   =   V i C i
where M is the total mass of the pollutant for each event, V is the runoff volume generated by the precipitation event, and C is the concentration of the constituent measured in the discreet influent and effluent sample that was collected.
A two tailed t-test was carried out using R software version 3.0.3 with α = 0.05 to statistically compare the storm event removal percentages for TSS, nitrate, phosphate, E. coli, and PAH from the two tree filters. Metals were not statistically analyzed because metal data was inconclusive.

2.4. Controlled Field Tracer Experiments

Two separate tracer tests, using a solution containing sodium chloride (NaCl) and E. coli, were carried out within one week of each other in September 2014 under similar climatological and initial filter matrix saturation conditions (Table S1). The E. coli tracer was carried out to investigate microbial transport in the system, while the sodium chloride solution was used as a conservative tracer to estimate the hydraulic characteristics of the system. Both filters were conditioned by pumping clean non-chlorinated water directly into the TF, by-passing the catch basins, at about 3 L/min (circa 200 L) using an electric submersible pump and garden hose (Figure S3). The water flow was metered with a 2.5 m3/h ISTEC Flowmeter (Sparta, NJ, USA). After approximately 70 min of pumping clean water, the tracer solution containing NaCl and GFP E. coli was injected. The green fluorescent protein (GFP) strain of E. coli (BTF 132) (Biomérieux, Hazelwood, MO, USA) was the bacterial tracer. GFP labelled E. coli are ideal for use as a bacterial tracer [39] because bacteria colonies glow green under UV light. This allows for differentiating E. coli added as a tracer from those native to the TF system.
The GFP E. coli were cultured in LB broth (10 g/L sodium chloride, 10 g/L tryptone, and 5 g/L yeast extract; Sigma Aldrich, St. Louis, MO, USA) at 37.5 °C for 13 h. After culturing, the bacteria were removed from the LB broth, washed and stored in phosphate buffer solution (11.2 g/L K2HPO4, 4.8 g/L KH2PO4, and 20 mg/L ethylenediaminetetraacetic acid; all Sigma Aldrich; pH: 7.3).
The NaCl concentration in the tracer solution was 888 mg/L (428 L) and 969 mg/L (392 L) for the conventional and the innovative TF experiment, respectively. The initial concentration (Co) of GFP E. coli in the solution was 6.90 × 10⁵ CFU/100 mL and 8.32 × 10⁶ CFU/100 mL for the conventional and the innovative tree filter, respectively. The tracer solutions were pumped over the course of 120 min and 145 min, respectively. Afterwards, an additional 207 L of clean, non-chlorinated water was added to each of the two TF over a period of approximately 70 min.
Periodic influent samples were taken throughout the tracer test to monitor natural decay of E. coli in the tracer solution. Using a Masterflex Environmental Sampler (Vernon Hills, IL, USA), effluent was pumped constantly from the buried sampling pan inside the TF at a rate of 200 mL/min for the conventional and 225 mL/min for the innovative system (Figure S4). Every 5 min, the effluent was metered for specific conductance using a YSI Professional Plus Multimeter logger (Yellow Springs, OH, USA). Every 15 min samples were collected for bacteria analysis and immediately processed at the onsite RISTDF field laboratory. The changes in the soil moisture content and the breakthrough of the wetting front were automatically recorded by sensors buried in the TF systems (Decagon Devices, Pullman, WA, USA).

3. Results and Discussion

The winter monitoring period lasted 117 days, starting on 8 November 2013 and lasting to 15 March 2014. The end date was selected as the last snowfall occurred on 13 March 2014 and on 15 March 2014 the temperature rose to 7 °C, enough to melt the remaining snow. The duration of the following summer period for this study totaled 229 days, i.e., from 16 March until 16 November 2014.

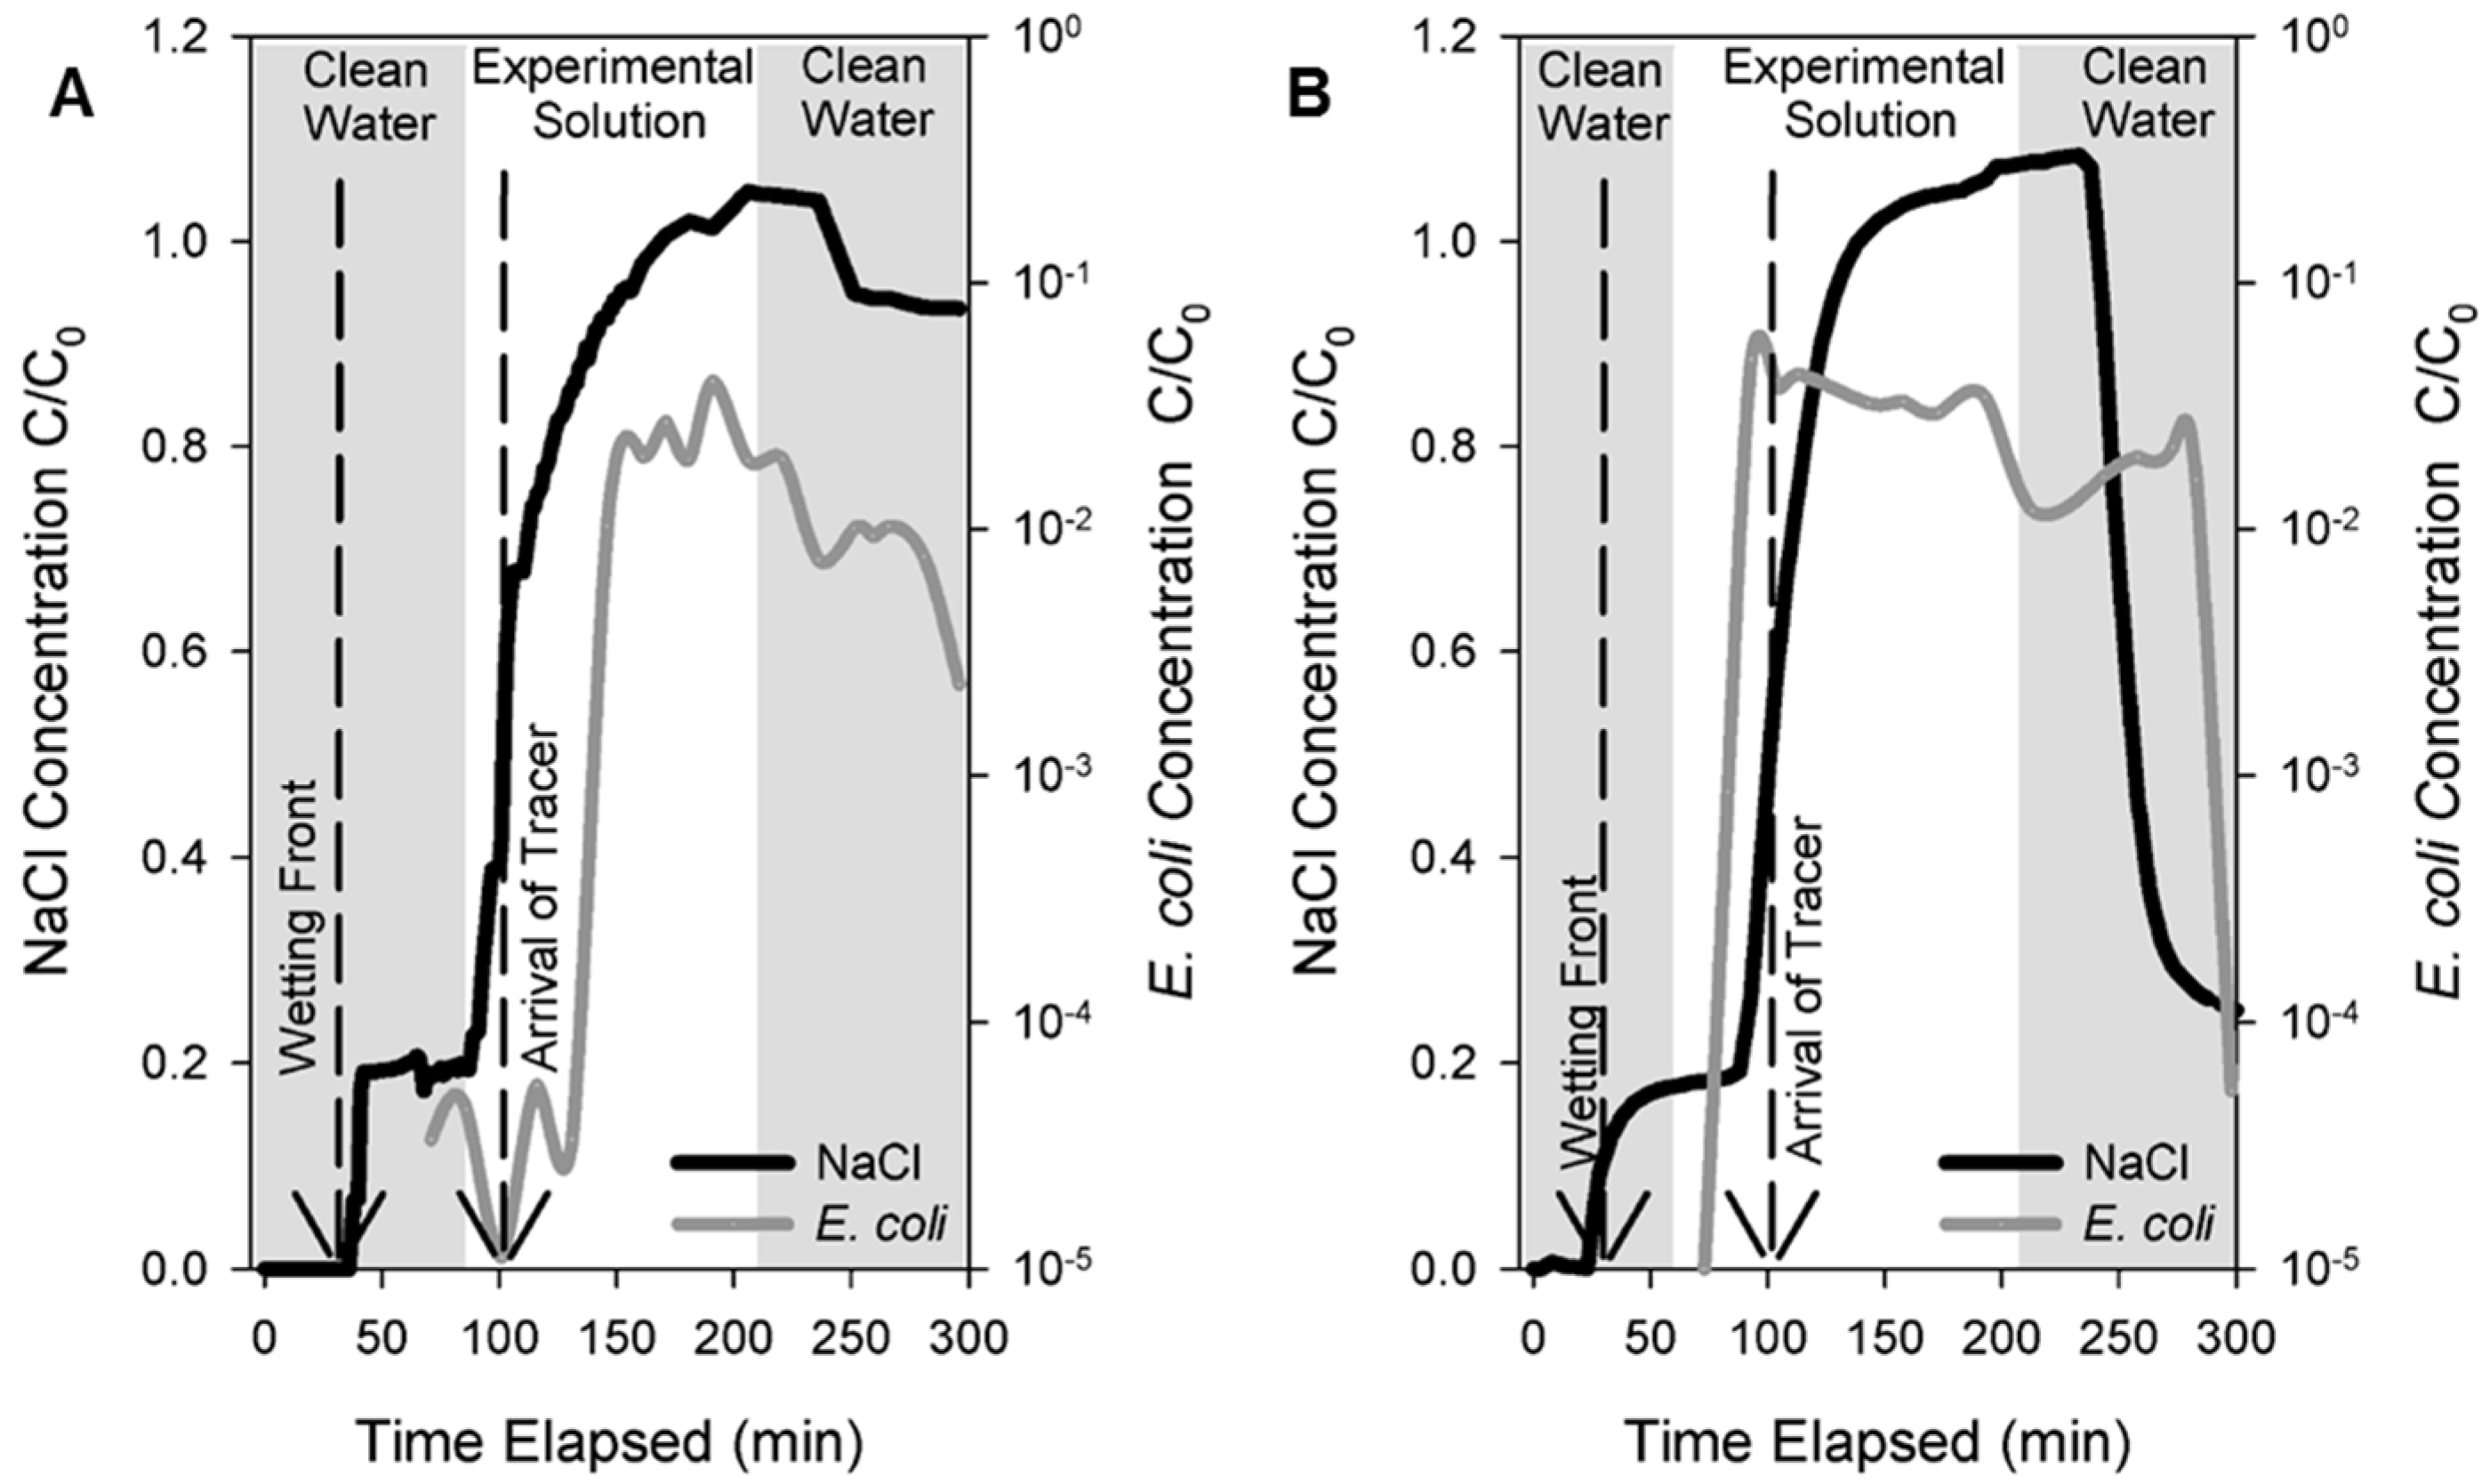
3.1. Field Tracer Experiment

Two field tracer tests were performed to directly compare the hydraulic characteristics and the E. coli removal performance of the ITF versus CTF. The comparison of the influent and effluent E. coli concentrations permitted the estimation of the two filters’ bacteria removal performances. In addition, the hydraulic characteristic of the breakthrough times and residence time of the stormwater in the filter were calculated using influent and effluent NaCl concentrations. These are important parameters for designing future tree filter systems. No major rain events were observed immediately prior to or during the tracer test period.
The soil moisture sensors buried at the bottom of the TF 1.5 m bgs registered the arrival of the wetting front of the tracer solution 30 and 23 min after injection into the CTF and ITF, respectively (Table 2). The differences in the values between the two TFs are likely related to the difference in compaction of the engineered materials during placement and the difference in the composition of the engineered material in the tree filter units, i.e., the layer of sand/shale replaced by red cedar wood chips potentially making the fill more porous and more permeable. Also, it is plausible that the root system to the tree planted inside the TF provided preferential pathways for the infiltrating solution. However, the absolute difference between the tracer front arrival times is within the range anticipated for a 1.5 m thick layer of permeable fill.
The travel time of the salt tracer front to the buried sampling pan was 26 min for the CTF and 38 min for the ITF system. The difference in arrival time reflects the difference in size of the two tree filter systems, i.e., the ITF is about 1.7 times larger. The wetting front in the CTF arrived at about the same time as the NaCl tracer. However, there was much quicker than expected arrival of the wetting front in the ITF (23 min) relative to the NaCl tracer breakthrough. The exact reason is unknown but it could be related to preferential flow towards the moisture sensor used to track the wetting front arrival. For the conventional TF, the NaCl mass recovery was 76% and 72.6% in the innovative TF (Table 2). The tracer mass not recovered is believed to be retained in the pore space of the filter matrix or escaped detection by dispersive flow around the stainless steel interceptor pan buried at the bottom of the TF system.
The results of the GFP E. coli tracer are shown in the form of a breakthrough curve in Figure 2. The E. coli removal during the field experiment was similar for both the tree filters, i.e., 99.2% and 99.1% for CTF and ITF, respectively. Although from preliminary batch tests it was expected that the ITF will have higher bacteria removal than the CTF system [29].Subsequent laboratory column experiments showed that a loading of greater than 6 mg/g of TPA to red cedar is required (i.e., 9 mg/g) to achieve measurable inactivation of bacteria under dynamic conditions [15]. Even though similar E. coli removal rates were found in the tracer experiments, the data suggest that when clean water is pumped following the tracer injection the E. coli concentration in the effluent of the ITF decreased more readily compared to CTF (Figure 2). This may indicate that E. coli are indeed inactivated by the TPA amended wood chips in the ITF, compared to the CTF where E. coli only attach to the porous media temporarily and get transported out as viable cells when clean water gets flushed through the system.
Even though E. coli removal was extensively and successfully tested in the laboratory [15,29], the laboratory results were difficult to replicate in the field. A major reason explaining the lower than expected performance of under field conditions is that not sufficient quantities of antimicrobially amended wood chips were added to the TF system. The layer only facilitated a 2 to 3 min residence time when flooded with stormwater. The contact time between the stormwater and the antimicrobially amended material was insufficient and should have been at least ten times longer (>30 min) as shown in subsequent laboratory studies [15].

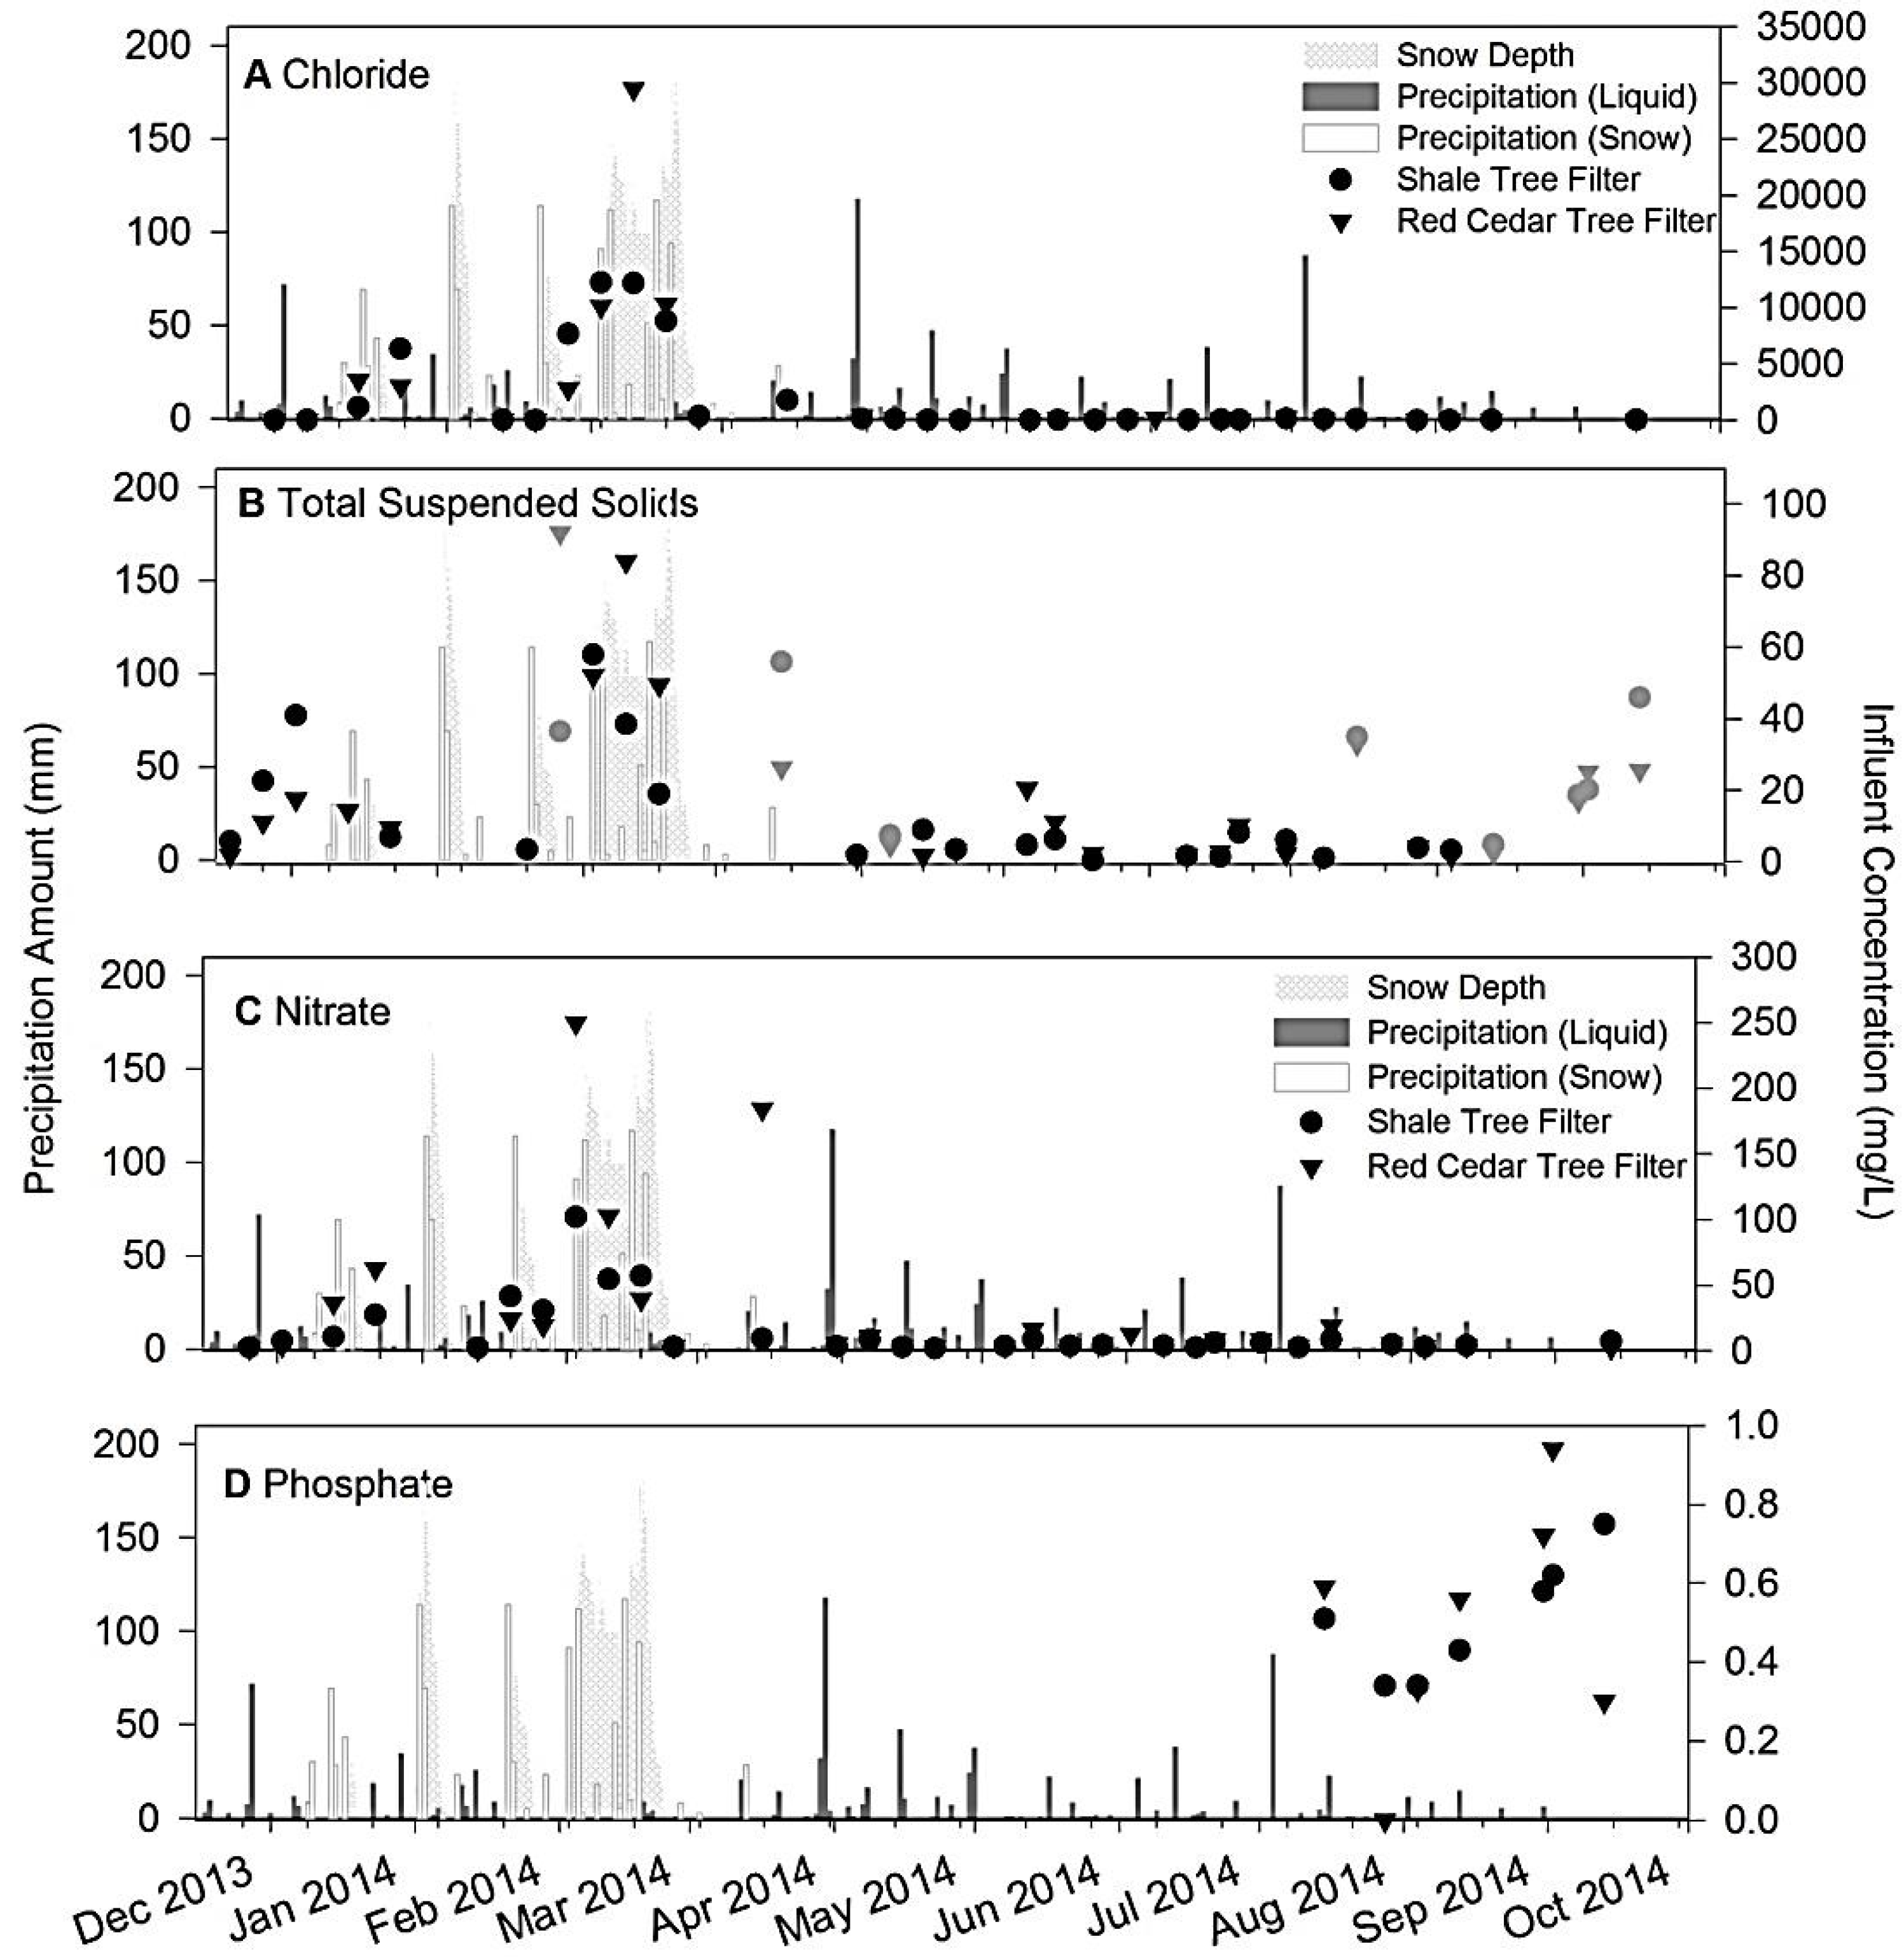
3.2. Field Monitoring Results

In general the mass loads in the influent occurred at higher concentrations during the winter months (Table 3).
When comparing the two TF systems, the influent loads of the ITF were significantly higher compared to those of the CTF, except for the E. coli influent concentrations (p-value < 0.05). The higher loads reflect the larger contributing area of the ITF. There were significantly higher loads of chloride (up to 29,480 mg/L) and TSS (up to 92 mg/L) in the winter runoff, compared to the summer, where the maximum concentration for chloride was 366.6 mg/L and 56 mg/L for TSS, respectively (Table 3).
During the year of study most of the snowfall in Rhode Island occurred in January and February. The total snowfall for the season was 110 cm (43.3 inches), which was approximately 25 cm (10 inch) above average [37]. The period during which the highest chloride concentrations were measured coincides with period of greatest snowfall, as road salt was presumably applied in higher quantities during this time (Figure 3a) Even though the concentration of TSS decreases in summer, elevated loads of TSS can still be observed in summer runoff during rain events that had longer antecedent dry periods (Figure 3b). This indicates that the atmospheric deposition of dust on the parking lot surface contributed to the overall TSS load to the TF system.

3.3. Contaminant Removal
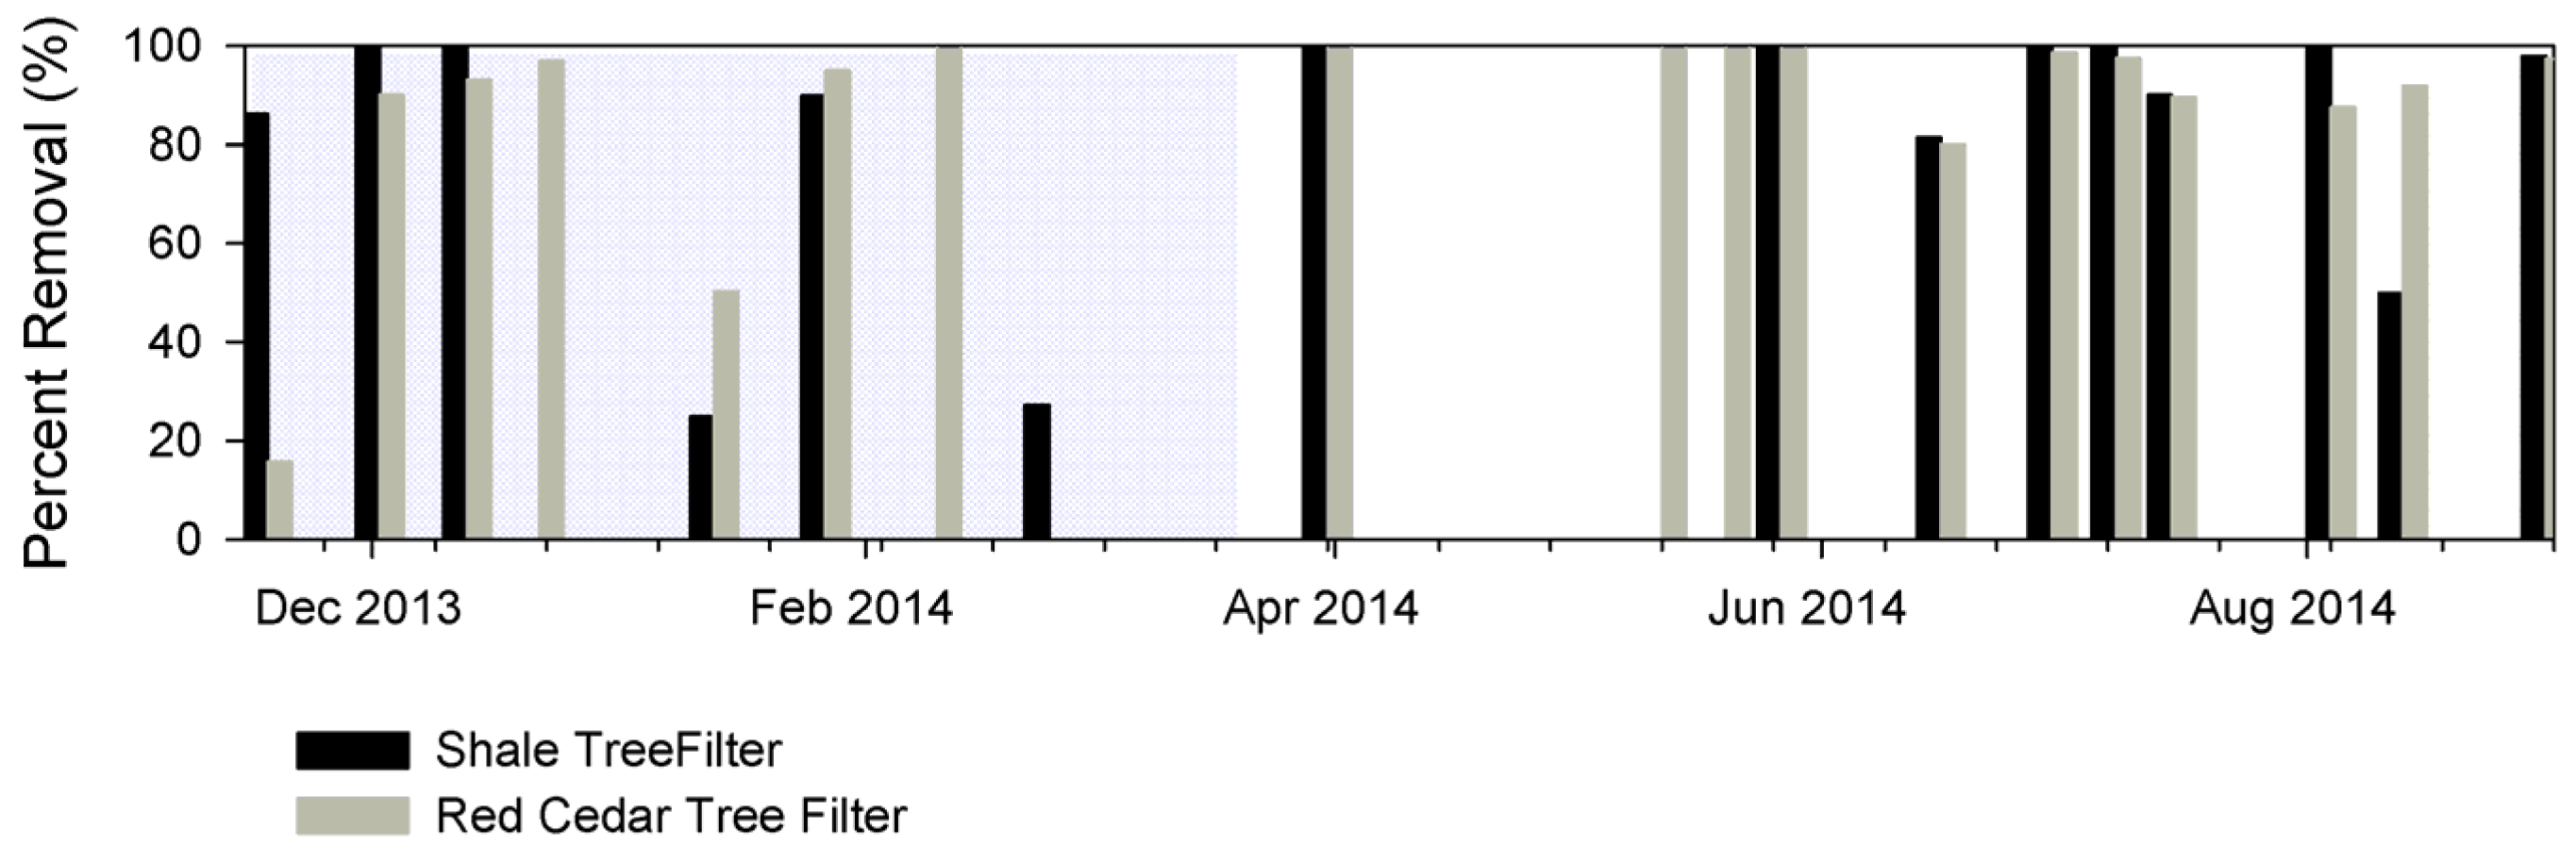
3.3.1. E. coli

Both tree filters were evaluated for their ability to treat contaminants from influent stormwater by comparing the concentrations with the TF effluent. The investigation of the possible treatment of E. coli and fecal coliform by the TF was a major driver for this study. The range of E. coli detected covered no detection to 105 CFU/100 mL in the winter, whereas concentrations in summer ranged from no detection to 104 CFU/100 mL in the summer. Overall, in summer both tree filters achieved E. coli removal that exceeded the Rhode Island stormwater treatment standard (80%, Table 4). Specifically, the CTF removed 86.3% ± 20.3% of E. coli whereas the ITF performed slightly better with a removal of 89.9% ± 14.5%. However, in winter both filters did not meet the removal standards as removal for the CTF was measured at 71.3% ± 35.5% compared to 77.3% ± 32.0% for the ITF. Similar removal capabilities have been observed in other studies that also rely on bacteria straining and removal through filtration [19,40] Comparing the E. coli removal by season, lower removal values were observed in the winter compared to the summer (Table 4, Figure 4). In both seasons the removal of E. coli is slightly higher in the ITF compared to the conventional TF (Table 4). However, statistically the two systems show no significant difference (p > 0.1). The field monitoring results are in agreement with the results from the E. coli tracer test in which no statistically different removal was found between the CTF and ITF systems. Although the TPA amended red cedar wood showed promising results in prior batch studies under laboratory conditions, the performance observed in the field likely was affected by short residence time of the stormwater in the TPA filter matrix and insufficient TPA loading of the red cedar wood chips.
With regard to the residence time, the thickness of the layer of amended red cedar wood was approximately 8 cm and represented less than 10% of the total filter medium available inside the TF. Given that the wetting front during the tracer test arrived at the bottom of the ITF within 23 min, the stormwater was in contact with the amended red cedar wood for less than three minutes only. This contact time was insufficient to make a significant difference in E. coli removal. Prior batch studies showed that TPA loading is crucial in inactivating E. coli [29] while column studies at varying flow rates demonstrated that higher contact times provide higher inactivation rates (unpublished data). Schifman et al. showed that red cedar wood loaded with 9 mg/kg TPA was 99.8% effective in deactivating E. coli bacteria compared to 6 mg/kg TPA loading, which was 77.3% effective when tested under flow-through column condition in the laboratory [15]. While the batch study results indicated that 6 mg/g TPA red cedar was sufficient for E. coli inactivation, the column study showed that dynamic conditions require a higher antimicrobial loading and contact time to achieve effective inactivation [15].

3.3.2. Polycyclic Aromatic Hydrocarbons

Polycyclic aromatic hydrocarbons were detected both in TF influent and effluent. In the winter the average dissolved PAH concentrations in the influent were 11.1 µg/L, while in summer influent concentrations averaged 5.3 µg/L. As PAHs sorb readily to organic matter, it is suspected that even higher concentrations of PAHs entered the TF systems [41]. However, the fraction of PAH sorbed to organic matter or other suspended matter was not investigated herein.
Even though ∑PAH16 is being used as a reporting tool here not all 16 target compounds were always detected. In the winter, PAHs were present in the runoff an average of ~5 compounds compared to ~10 compounds in the summer time. Commonly the compounds detected in the winter time were also limited to low molecular weight compounds (PAHs with molecular weight lower than 187 g/mol, i.e., PAHs with 3 or fewer benzene rings) that is lower than compared to the summer where a greater number of high molecular compounds were detected. This can be attributed to variable runoff composition and ambient temperatures that influence the solubility of PAHs [42].
Overall, the ITF was more effective than the CTF at removing ∑PAH16 from runoff in both seasons (Table 4, Figure 5). During winter, the ITF removed 54.7% ± 8.4% compared to 46.5% ± 5.2% for the CTF (p-value < 0.05). In summer, the ITF removed 9.1% ± 3.6% compared to 8.5% ± 2.4% removal in the CTF. However, the difference here was only marginally significant (p-value = 0.06; Table 4). The reason for lower removal in summer is likely related to the lower PAH runoff concentration observed during the summer. In the CTF the only organic carbon (OC) in the filter media is the 10% fraction of sphagnum peat, while in the ITF the presence of TPA modified wood chips about doubles the amount of OC available for PAH removal. These results confirmed the findings in prior laboratory studies of red cedar wood chips, where it was found that 6 mg/g TPA modified red cedar had a 69.8 times higher sorption capacity for Fluorene compared to the material used in the CTF [29].

3.3.3. Nutrients and TSS

Besides organic pollutants and bacterial contaminants, the removal of nutrients and inorganic contaminants (nitrate, phosphate, and chloride) was also investigated. In this study nitrate concentrations in winter runoff averaged 40.2 mg/L and 10.2 mg/L in summer. During the winter, the nitrate influent concentrations regularly exceeded the EPA MCL for nitrate (10 mg/L) (Table 4). While both filters exceeded the RI stormwater manual’s requirement removing at least 30% of nitrate, a statistical significant (p < 0.05) reduction in nitrate was observed on in the ITF during winter (62.6%). The CTF only achieved a marginally significant reduction (p-value = 0.1) in nitrate (38.6%) (Table 4). However, in summer nitrate concentrations in the effluent often exceeded those of the influent by up to 3-fold in the CTF and up to 2-fold in the ITF compared to the influent concentrations, resulting in net export of nitrate from both TFs into the groundwater. When this was the case the nitrate concentrations in the effluent were always below the EPA MCL for nitrate (10 mg/L), except for two occasions in the CTF. On an annual basis there was a net removal of nitrate observed in both TF systems, as the winter removal outweighed the summer export.
As the highest nitrate concentrations were detected in the winter and during the spring snowmelt agricultural runoff is likely not the source. The sources of the exported nitrate can include either atmospheric deposition of nitrate or dissolved organic matter from soils that accumulate in the snowpack and get flushed out during snowmelt [43,44]. Once the snow cover has melted away, the nitrate loading from stormwater runoff is reduced significantly, as is the case with chloride (Table 3, Figure 3c). However, it was not investigated why the nitrate influent concentration during the winter months were higher and why less nitrate was removed during summer.
Aside from nitrate, other organic and inorganic nitrogen species are often found in stormwater runoff [45,46,47] and could be converted to nitrate through biologically governed nitrification during dry periods [47]. When this occurs nitrate can be released from the system during the next storm event. This has been confirmed by a column laboratory study where seven materials were tested for their ability to remove nitrate [47]. It was found that effective electron donors outperformed washed sand as a filtration matrix with regard to nitrate removal during steady state and intermittent flow conditions [47]. Because the wood chips in the ITF can act as electron donors, it is possible that denitrification is more effective during the wet winter sampling months relative to the drier summer period. In addition, nitrification may decrease the pH of the solution [48] which would explain why in both TFs the pH of the effluent was lower than in the influent in summer and winter.
With regard to phosphate, the average concentration in runoff was 0.5 mg/L in summer, which was the only time when the parameter was measured (Figure 3d). During that period, the ITF achieved an average removal of 50.1% ± 26.9%, which resulted in significantly lower concentrations of phosphate in the effluent compared to the influent (p-value < 0.05). The CTF achieved a similar phosphate removal of 45.3% ± 20.5%; however, the difference between the influent and effluent concentrations was statistically insignificant (Table 4). Similar results have been reported in other studies where organic based filter media, such as biochar, peat, or mulch outperformed a sand mixture in the removal of phosphates [49,50]
Total suspended solids (TSS) is another parameter commonly used to quantify contaminant removal in BMP systems as it serves as a proxy for contaminants that are transported due to sorption to fine particles [51]. In this study the influent concentrations of TSS were higher in winter with an average of 44.9 mg/L, with a maximum concentration of 92.0 mg/L, compared to summer where the influent averaged 9.2 mg/L. TSS removal was significantly higher (p-value < 0.05) in the ITF with removal in winter at 85.7% ± 17.3% and removal in summer being 73.8% ± 10.0% compared to the removal rates of the CTF of 63.4% ± 14.3% and 59.1% ± 10.3% in winter and summer, respectively, however in all cases the decrease from the influent load to the effluent load was significantly different (p-value < 0.05 for all scenarios) While the ITF met the RISM standard in the winter, however improvements could be made to increase the performance throughout the year. In the TF the removal mechanism for TSS relies primarily on settling of the particles in the catch basin where the influent collects before spilling over into the infiltration area. However, during intense storm events the hydraulic retention time in the catch basin may not be long enough for particles to settle out. In this case the particles get transported into the infiltration area where they should accumulate within the filter media. As the removal mechanism for TSS is mostly mechanical, it is unclear why the two filters performed differently in this study.

4. Conclusions

Two filter units, one conventional with a sand/shale and peat mix and one innovative filter matrix, containing an additional layer consisting of antimicrobially amended red cedar wood chips were compared for their contaminant removal capabilities in a field pilot study. Over the course of a one year period starting in November 2013, TF influent and effluent was sampled for organic and inorganic constituents, including E. coli. Overall, the ITF exhibited higher nitrate, phosphate, TSS, E. coli and ∑PAH16, removal compared to the CTF. However, the differences in the removal rates between the two TF systems did not differ significantly when compared statistically.
While E. coli removal was higher in the ITF compared to the CTF, even higher removal was expected based on the results of previous laboratory studies [15]. However, this can be explained by the TPA loading to the red cedar wood in this field test being 6 mg/g, whereas it could have been as high as 9 mg/g, based on prior studies [15]. Second, the amended red cedar layer installed inside the TF was 8 cm (3 inch) thick and only facilitated a 2 to 3 min residence time when flooded with stormwater. The amount of contact time between the stormwater and the antimicrobially amended material was insufficient as shown in subsequent laboratory column studies [15]. Besides these system design elements, it was likely disadvantageous to have added the wood chips as a discrete layer rather than mixing them into the sand/shale matrix. A more homogenous mix could have extended the contact time of bacteria and TPA red cedar during the treatment process. Finally, whereas artificial stormwater was used to prove the concept of E. coli treatment by TPA amended wood chips in the laboratory, under actual field conditions the composition of the stormwater varied over the seasons, including high loads of dissolved salts, TSS, and other compounds that likely altered the TPA covered surface of the wood matrix. In particular, it must be assumed that fines were deposited on the wood surface and covered the bioactive TPA. In consequence, bacteria in the stormwater were less likely to come in contact with the TPA.
The next generation of the amended TF systems would likely benefit from installing the amended wood chips at the bottom of the filter unit or mixed into the sand/shale matrix rather than on the top of the TF unit, where fines are present in high concentration during infiltration events. Further tests with other pathogens aside from E. coli should be conducted to determine if the amended red cedar has the ability to remove other pathogens from stormwater runoff.
While the bacteria removal of the amended TF during the monitoring study was not as high as expected, the absolute bacteria treatment efficiencies of both TF systems, together with those for TSS and nutrients, exceeded the requirements for BMP systems in Rhode Island. Further, the evidence for inactivation of bacteria during the field tracer experiment in the ITF indicated that the addition of the amended material reduced the amount of culturable cells during pretreatment compared to the CTF. This makes TF technology competitive with other structural BMP systems currently on the market for agricultural and urban runoff treatment and highlights the importance of incorporating antimicrobial amendments into runoff BMPs.

Acknowledgments

The funding for this research was provided by the Rhode Island Department of Transportation and the University of Rhode Island Transportation Center. Storm-Tree donated the TF units to the Rhode Island Stormwater Treatment Demonstration Facility. The authors also acknowledge the following organization and individuals: Liberty Cedar in West Kingston, RI for providing red cedar wood that was chipped by Scott Ahern, URI. K. Broccolo, URI aided in the construction of the tank used for modifying the red cedar wood chips. Biosafe supplied the authors with TPA solution. B. Spirito provided assistance during the tracer experiments and J. Laso Castillo aided in creating the cross section of the tree filter unit in the supplementary information.

Author Contributions

Laura Schifman, Thomas Boving, Vinka Oyanedel-Craver, and Varun Kasaraneni designed the study and Laura Schifman, Varun Kasaraneni, and Ryan Sullivan conducted the sampling The manuscript was prepared under the direction, review, and guidance of Vinka Oyanedel-Craver and Thomas Boving.

Conflicts of Interest

The authors declare no conflict of interest.

References

  1. Ahn, J.H.; Grant, S.B.; Surbeck, C.Q.; DiGiacomo, P.M.; Nezlin, N.P.; Jiang, S. Coastal water quality impact of stormwater runoff from an urban watershed in southern California. Environ. Sci. Technol. 2005, 39, 5940–5953. [Google Scholar] [CrossRef] [PubMed]
  2. Dorfman, M.H.; Stoner, N. Testing the Waters: A Guide to Water Quality at Vacation Beaches; Natural Resources Defense Council: New York, NY, USA, 2007; pp. 1–377. [Google Scholar]
  3. Lee, C.M.; Lin, T.Y.; Lin, C.C.; Kohbodi, G.A.; Bhatt, A.; Lee, R.; Jay, J.A. Persistence of fecal indicator bacteria in Santa Monica Bay beach sediments. Water Res. 2006, 40, 2593–2602. [Google Scholar] [CrossRef] [PubMed]
  4. Mallin, M.A.; Williams, K.E.; Esham, E.C.; Lowe, R.P. Effect of human development on bacteriological water quality in coastal watersheds. Ecol. Appl. 2000, 10, 1047–1056. [Google Scholar] [CrossRef]
  5. McLellan, S.; Salmore, A. Evidence for localized bacterial loading as the cause of chronic beach closings in a freshwater marina. Water Res. 2003, 37, 2700–2708. [Google Scholar] [CrossRef]
  6. Parker, J.; McIntyre, D.; Noble, R. Characterizing fecal contamination in stormwater runoff in coastal North Carolina, USA. Water Res. 2010, 44, 4186–4194. [Google Scholar] [CrossRef] [PubMed]
  7. Environmental Protection Agency (EPA). Performance Standards for Discharges from Newly Developed and Redeveloped Sites; EPA: Washington, DC, USA, 2001.
  8. Rhode Island Department of Environmental Management (RIDEM). Rhode Island Stormwater Design and Installation Standards Manual; RIDEM: Providence, RI, USA, 2010.
  9. Coffman, L.S.; Ruby, M.; Beach, C. Bacterra by Filterra® Advanced Bioretention System: Discussion of the Benefits, Mechanisms and Efficiencies for Bacteria Removal. In Proceedings of the Low Impact Development for Urban Ecosystem and Habitat Protection, Seattle, WA, USA, 16–19 November 2008; pp. 1–13.
  10. Faucette, L.; Cardoso-Gendreau, F.; Codling, E.; Sadeghi, A.; Pachepsky, Y.; Shelton, D. Storm water pollutant removal performance of compost filter socks. J. Environ. Qual. 2009, 38, 1233–1239. [Google Scholar] [CrossRef] [PubMed]
  11. Davis, A.P.; Hunt, W.F.; Traver, R.G.; Clar, M. Bioretention Technology: Overview of Current Practice and Future Needs. J. Environ. Eng. 2009, 135, 109–117. [Google Scholar] [CrossRef]
  12. UNH Stormwater Center 2007 Annual Report; University of New Hampshire, Cooperative Institute for Coastal and Estuarine Environmental Technology: Durham, NH, USA; Available online: http://ciceet.unh.edu/unh_stormwater_report_2007/index.php (accessed on 17 April 2011).
  13. Stevik, T.K.; Aa, K.; Ausland, G.; Hanssen, J.F. Retention and removal of pathogenic bacteria in wastewater percolating through porous media: A review. Water Res. 2004, 38, 1355–1367. [Google Scholar]
  14. Zhang, X.; Lulla, M. Evaluation of pathogenic indicator bacteria in structural best management practices. J. Environ. Sci. Health Part A 2006, 41, 2483–2493. [Google Scholar] [CrossRef] [PubMed]
  15. Schifman, L.A.; Kasaraneni, V.; Sullivan, R.K.; Craver, V.O.; Boving, T.B. New antimicrobially amended media for improved non-point source bacterial pollution treatment. Environ. Sci. Technol. 2015. [Google Scholar] [CrossRef] [PubMed]
  16. Mohanty, S.K.; Torkelson, A.A.; Dodd, H.; Nelson, K.L.; Boehm, A.B. Engineering Solutions to Improve the Removal of Fecal Indicator Bacteria by Bioinfiltration Systems during Intermittent Flow of Stormwater. Environ. Sci. Technol. 2013, 47, 10791–10798. [Google Scholar] [CrossRef] [PubMed]
  17. Davies, C.M.; Bavor, H.J. The fate of stormwater-associated bacteria in constructed wetland and water pollution control pond systems. J. Appl. Microbiol. 2000, 89, 349–360. [Google Scholar] [CrossRef]
  18. Morales, I.; Atoyan, J.A.; Amador, J.A.; Boving, T. Transport of Pathogen Surrogates in Soil Treatment Units: Numerical Modeling. Water 2014, 6, 818–838. [Google Scholar] [CrossRef]
  19. Hathaway, J.; Hunt, W.; Jadlocki, S. Indicator Bacteria Removal in Storm-Water Best Management Practices in Charlotte, North Carolina. J. Environ. Eng. 2009, 135, 1275–1285. [Google Scholar] [CrossRef]
  20. Karim, M.R.; Manshadi, F.D.; Karpiscak, M.M.; Gerba, C.P. The Persistence and Removal of Enteric Pathogens in Constructed Wetlands. Water Res. 2004, 38, 1831–1837. [Google Scholar] [CrossRef] [PubMed]
  21. Schueler, T.R.; Holland, H. Microbes and Urban Watersheds: Concentrations, Sources, and Pathways. The Pract. Watershed Prot. 2000, 74–84, 554–656. [Google Scholar]
  22. United States Environmental Protection Agency (EPA). Protocol for Developing Pathogen TMDLs; Office of Water (4503F), EPA: Washington, DC, USA, 2001; p. 132.
  23. Herngren, L.; Goonetilleke, A.; Ayoko, G.A.; Mostert, M.M.M. Distribution of polycyclic aromatic hydrocarbons in urban stormwater in Queensland, Australia. Environ. Pollut. 2010, 158, 2848–2856. [Google Scholar] [CrossRef] [PubMed] [Green Version]
  24. Davis, A.P. Field performance of bioretention: Water quality. Environ. Eng. Sci. 2007, 24, 1048–1064. [Google Scholar] [CrossRef]
  25. Dunne, E.J.; Coveney, M.F.; Marzolf, E.R.; Hoge, V.R.; Conrow, R.; Naleway, R.; Lowe, E.F.; Battoe, L.E. Efficacy of a large-scale constructed wetland to remove phosphorus and suspended solids from Lake Apopka, Florida. Ecol. Eng. 2012, 42, 90–100. [Google Scholar] [CrossRef]
  26. Hatt, B.E.; Fletcher, T.D.; Deletic, A. Hydrologic and pollutant removal performance of stormwater biofiltration systems at the field scale. J. Hydrol. 2009, 365, 310–321. [Google Scholar] [CrossRef]
  27. Zhang, H.; Oyanedel-Craver, V. Comparison of the bacterial removal performance of silver nanoparticles and a polymer based quaternary amine functionalized silsesquioxane coated point-of-use ceramic water filters. J. Hazard. Mater. 2013. [Google Scholar] [CrossRef]
  28. Li, Q.; Mahendra, S.; Lyon, D.Y.; Brunet, L.; Liga, M.V.; Li, D.; Alvarez, P.J. Antimicrobial nanomaterials for water disinfection and microbial control: Potential applications and implications. Water Res. 2008, 42, 4591–4602. [Google Scholar] [CrossRef] [PubMed]
  29. Kasaraneni, V.K.; Schifman, L.A.; Boving, T.B.; Oyanedel-Craver, V. Enhancement of Surface Runoff Quality Using Modified Sorbents. ACS Sustain. Chem. Eng. 2014, 2, 1609–1615. [Google Scholar] [CrossRef]
  30. Boving, T.; Klement, J.; Rowell, R.; Xing, B. Effectiveness of wood and bark in removing organic and inorganic contaminates from aqueous solution. Mol. Cryst. Liquid Cryst. 2008, 483, 339–347. [Google Scholar] [CrossRef]
  31. Boving, T.B.; Neary, K. Attenuation of polycyclic aromatic hydrocarbons from urban stormwater runoff by wood filters. J. Contam. Hydrol. 2007, 91, 43–57. [Google Scholar] [CrossRef] [PubMed]
  32. Huang, L.; Boving, T.B.; Xing, B. Sorption of PAHs by Aspen Wood Fibers as Affected by Chemical Alterations. Environ. Sci. Technol. 2006, 40, 3279–3284. [Google Scholar] [CrossRef] [PubMed]
  33. Huang, L.; Ou, Z.; Boving, T.B.; Tyson, J.; Xing, B. Sorption of copper by chemically modified aspen wood fibers. Chemosphere 2009, 76, 1056–1061. [Google Scholar] [CrossRef] [PubMed]
  34. Boving, T.B.; Rowell, R. Environmental Applications of Lignocellolusic Filter Materials. In Sustainable Development in the Forest Products Industry; Rowell, R., Ed.; UFP Editions: Lisbon, Portugal, 2010. [Google Scholar]
  35. Dickerman, D.C. Aquifer Tests in the Stratified Drift, Chipuxet River Basin, Rhode Island; Water-Resources Investigations Report; US Geological Survey: Reston, VA, USA, 1984.
  36. Boving, T.B.; Stolt, M.H.; Augenstern, J.; Brosnan, B. Potential for localized groundwater contamination in a porous pavement parking lot setting in Rhode Island. Environ. Geol. 2008, 55, 571–582. [Google Scholar] [CrossRef]
  37. National Oceanic and Atmospheric Administration (NOAA). Annual Climatological Summary; NOAA: Providence, RI, USA, 2014.
  38. Schock, M.R.; Neff, C.H. Trace metal contamination from brass fittings. J. American Water Works Assoc. 1988, 80, 47–56. [Google Scholar]
  39. Pinheiro, L.B.; Gibbs, M.D.; Vesey, G.; Smith, J.J.; Bergquist, P. Fluorescent reference strains of bacteria by chromosomal integration of a modified green fluorescent protein gene. Appl. Microbiol. Biotechnol. 2008, 77, 1287–1295. [Google Scholar] [CrossRef] [PubMed]
  40. Chandrasena, G.I.; Deletic, A.; McCarthy, D.T. Survival of Escherichia coli in stormwater biofilters. Environ. Sci. Pollut. Res. 2013. [Google Scholar] [CrossRef]
  41. DiBlasi, C.J.; Li, H.; Davis, A.P.; Ghosh, U. Removal and Fate of Polycyclic Aromatic Hydrocarbon Pollutants in an Urban Stormwater Bioretention Facility. Environ. Sci. Technol. 2008, 43, 494–502. [Google Scholar] [CrossRef]
  42. Schwartzenbach, R.P.; Gschwend, P.M.; Imboden, D.M. Environmental Organic Chemistry; John Wiley & Sons, Inc.: Hoboken, NJ, USA, 2002. [Google Scholar]
  43. Kendall, C.; Silva, S.; Chang, C.; Burns, D.; Campbell, D.; Shanley, J. Use of the δ 18 O and δ 15 N of Nitrate to Determine Sources of Nitrate in Early Spring Runoff in Forested Catchments. In Isotopes in Water Resources Management. V. 1; International Atomic Energy Agency (IAEA): Wien, Austria, 1996. [Google Scholar]
  44. Kurian, L.M.; Lautz, L.K.; Mitchell, M.J. Winter Hydrology and NO3− Concentrations in a Forested Watershed: A Detailed Field Study in the Adirondack Mountains of New York1. JAWRA J. Am. Water Resour. Assoc. 2013, 49, 264–283. [Google Scholar] [CrossRef]
  45. Jasper, J.T.; Jones, Z.L.; Sharp, J.O.; Sedlak, D.L. Nitrate Removal in Shallow, Open-Water Treatment Wetlands. Environ. Sci. Technol. 2014, 48, 11512–11520. [Google Scholar] [CrossRef] [PubMed]
  46. Davis, A.P.; Shokouhian, M.; Sharma, H.; Minami, C. Water quality improvement through bioretention media: Nitrogen and phosphorus removal. Water Environ. Res. 2006, 78, 284–293. [Google Scholar] [CrossRef] [PubMed]
  47. Kim, H.; Seagren, E.A.; Davis, A.P. Engineered bioretention for removal of nitrate from stormwater runoff. Water Environ. Res. 2003, 75, 355–367. [Google Scholar] [CrossRef] [PubMed]
  48. Keeney, D. The nitrogen cycle in sediment-water systems. J. Environ. Qual. 1973, 2, 15–29. [Google Scholar] [CrossRef]
  49. Chang, N.; Wanielista, M.; Daranpob, A. Filter media for nutrient removal in natural systems and built environments: II—Design and application challenges. Environ. Eng. Sci. 2010, 27, 707–720. [Google Scholar] [CrossRef]
  50. Yao, Y.; Gao, B.; Inyang, M.; Zimmerman, A.R.; Cao, X.; Pullammanappallil, P.; Yang, L. Removal of phosphate from aqueous solution by biochar derived from anaerobically digested sugar beet tailings. J. Hazard. Mater. 2011, 190, 501–507. [Google Scholar] [CrossRef] [PubMed]
  51. Brown, J.N.; Peake, B.M. Sources of heavy metals and polycyclic aromatic hydrocarbons in urban stormwater runoff. Sci. Total Environ. 2006, 359, 145–155. [Google Scholar] [CrossRef] [PubMed]
Figure 1. Overview of the parking lot where the two tree filter (TF) units are installed. The stars denote the location of the tree filter. The contributing areas of both filters are outlined in dark grey; for the sand/shale mix TF the contributing area is 238 m2 or 0.06 acres and for the innovative TF (ITF) the contributing area is 2978 m2 or 0.74 acres; however, a drain exists adjacent to the tree filter, thus capturing at least half of the runoff.
Water 08 00076 g001
Figure 2. Breakthrough curves obtained during the field tracer experiment for the (A) conventional shale Tree Filter and the (B) Innovative Red Cedar Tree Filter.
Water 08 00076 g002
Figure 3. Relationship between snow depth, daily snow fall and influent concentrations of (A) Chloride and (B) total suspended solids; (C) Nitrate; and (D) Phosphate measured in both tree filters. In (B) the grey colored circles and triangles indicate the dates when TSS samples were taken during storm or intense snowmelt events.
Water 08 00076 g003
Figure 4. Comparison of E. coli removal percentages achieved by the two different filter units over the course of the sampling period. The gray area indicates the period during which snow was present and therefore the influent consisted of a combination of runoff and snowmelt.
Water 08 00076 g004
Figure 5. Comparison of polycyclic aromatic hydrocarbons (PAH) removal percentages achieved by the two different filter units over the course of the sampling period. The gray area indicates the period during which snow was present and therefore the influent consisted of a combination of runoff and snowmelt.
Water 08 00076 g005
Table 1. Measurements and descriptive information on TF units investigated in this study.
MeasureConventional Sand/Shale Tree FilterInnovative Red Cedar Tree Filter *
Catch Basin Length (m)0.450.45
Catch Basin Width (m)0.911.25
Catch Basin Volume (L)409.5542.6
Catch Basin Depth (m)1.000.97
Infiltration Area (m2)0.901.59
Engineered treatment media Volume (m3)0.641.13
Contributing Area (m2)2382978
Note: * 0.10 m3 of bioactive red cedar wood chips added.
Table 2. Summary of Field Tracer Test results and parameters tested.
ParameterConventional Sand/Shale Tree Filter (CTF)Innovative Red Cedar Tree Filter (ITF)
Wetting Front (min)3023
Travel time of tracer (min)2638
NaCl Mass Recovered76%72.6%
Log10 Removal Value (LRV)2.092.02
% Removal99.299.1
Table 3. Average winter and summer concentrations for stormwater influent with concentration ranges in parentheses along with reported literature values for the following parameters: pH, Specific Conductance (SC), Chloride, Nitrate, Phosphate, total suspended solids (TSS), Copper, Nickel, Lead, Zinc, Polycyclic Aromatic Hydrocarbons, and E. coli.
ConstituentUnitsWINTERSUMMERLiterature ValuesReference
pH-8.30 ± 1.627.69 ± 1.124.54–10.1a, b, c, l, o, s
(6.01–11.25)(6.01–9.67)
SCµs/cm4286.0 ± 5616.091.9 ± 70.525–30,800a, d, e
(20.3–20,115.0)(18.7–378.0)
Chloridemg/L4564.730.80.2–11,200a, d, e, l, s
(2.1–29,480.0)(18.7–366.6)
Nitratemg/L40.210.20.02–34.7a, b, c, f, g, h, n, s
(1.4–249.6)(2.1–18.5)
Phosphatemg/L-0.50.005–2.3a, b, c, g, n
(0.0–0.94)
TSS*mg/L44.99.21–46,000a, c, g, h, p, r
(26.3–92.0)(2.5–56.0)
Copperµg/L852.46–1800a, g, h, q
(b.d.–1356)(b.d.–36.3)
Nickelµg/L4.9 4–170a, g
(b.d.–68)b.d.
Leadµg/L63.17.92–525a, g, h, m, q
(b.d.–893.0)(b.d.–118.0)
Zincµg/L459.119.725–13,000a, g, h, q, r
(b.d.–5899.0)(n.d.–118.0)
∑PAH16µg/L11.15.30–22.6a, l
(b.d.–21.1)(b.d.–8.0)
E. coliCFU/100 mL2.3 * 1046.44 * 102110–106g, i, j, k, p
(0–2.0 * 105)(0–2.3 * 104)
Note: * Results based on grab samples during rain storm, not on weekly sampling (n = 6). b.d. below method detection limit; References: a = (Göbel et al. 2007), b = (Reddy et al. 2014), c = (Kayhanian et al. 2007), d = (Ledford and Lautz 2014), e = (Corsi et al. 2010), f = (Han et al. 2006), g = (Grebel et al. 2013), h = (Hatt et al. 2009), i = (Dorfman and Rosselot 2012), j = (Schueler and Holland 2000), k = (Mallin et al. 2000), l = (Boving and Neary 2007), m = (Chong et al. 2013), n = (Mallin et al. 2009), o = (Deletic and Maksimovic 1998), p = (Surbeck et al. 2006), q = (Gilbert and Clausen 2006), r = (Davis et al. 2009), s = (Jasper et al. 2014).
Table 4. Summary of winter and summer average changes in TF influent and effluent concentrations along with TF removal rates, literature reported removal values, Rhode Island Stormwater Manual (RISM) minimum removal requirements and StormTree © reported removal values for the parameters of interest. Bolded values meet or exceed RISM minimum removal percentages for the given contaminant.
Shale Tree FilterRed Cedar Tree Filter
ParameterUnitWinterSummerWinterSummerRISM Minimum Removal %Literature Reported Removal %Reference
% Change% Change% Change% Change
Chloridemg/L70.7 ± 20.6−13.7 ± 12.946.0 ± 25.17.1 ± 5.9---
Nitratemg/L32.1 ± 26.8−8.0 ± 29.360.8 ± 53.8−8.3 ± 40.2303–99h, r, s, t, u
Phosphatemg/L~45.3 ± 20.5~50.1 ± 26.93065–80h, t
TSS*mg/L63.4 ± 14.359.1 ± 10.385.4 ± 17.373.8 ± 10.08554–99h, u, v
Copperµg/L^^^^-67–99h, y
Nickelµg/L^^^^-+z
Leadµg/L^^^^-80–99h, y
Zincµg/L^^^^-84–99h, y
∑PAH16µg/L46.5 ± 5.28.5 ± 2.454.7 ± 8.49.1 ± 3.6-18.5–99l, u
E. coliCFU/100 mL71.3 ± 35.586.3 ± 20.377.3 ± 32.089.9 ± 14.5600–96w, x
Note: * Results based on grab samples during rain storm, not on weekly sampling (n = 6). ^ Metal release either due to pH change or from brass fitting on sampling pan; + Nickel release reported by authors, but not quantified; ~ Not measured; - No standard set in RISM, no reported removal values for tree filters or other BMPs; References: a = (Göbel et al. 2007), b = (Reddy et al. 2014), c = (Kayhanian et al. 2007), d = (Ledford and Lautz 2014), e = (Corsi et al. 2010), f = (Han et al. 2006), g = (Grebel et al. 2013), h = (Hatt et al. 2009), i = (Dorfman and Rosselot 2012), j = (Schueler and Holland 2000), k = (Mallin et al. 2000), l = (Boving and Neary 2007), m = (Chong et al. 2013), n = (Mallin et al. 2009), o = (Deletic and Maksimovic 1998), p = (Surbeck et al. 2006), q = (Gilbert and Clausen 2006), r = (Davis et al. 2009), s = (Jasper et al. 2014), t = (Davis et al. 2006), u = (UNHSC et al. 2007), v = (Davis 2007), w = (Karim et al. 2004), x = (Hathaway et al. 2009), y = (Davis et al. 2003), z = (Tromp et al. 2012), aa = (Boving and Neary 2007).

