Article

The Potential Growth of Sugarcane in Constructed Wetlands Designed for Tertiary Treatment of Wastewater

by
Dina M. R. Mateus
1,2,*,
Mafalda M. N. Vaz
3,†,
Isabel Capela
3,4,† and
Henrique J. O. Pinho
1,5,†
1
Engineering Departmental Unit, Instituto Politécnico de Tomar, Campus da Quinta do Contador, Estrada da Serra, 2300-313 Tomar, Portugal
2
GEOBIOTEC—GeoBioSciences, GeoTechnologies and GeoEngineering, Universidade de Aveiro, Campus Universitário de Santiago, 3810-193 Aveiro, Portugal
3
Department of Environment and Planning, Universidade de Aveiro, Campus Universitário de Santiago, 3810-193 Aveiro, Portugal
4
CESAM—Centre for Environmental and Marine Studies, Universidade de Aveiro, Campus Universitário de Santiago, 3810-193 Aveiro, Portugal
5
CERENA—Centre for Natural Resources and Environment, Instituto Superior Técnico, Universidade de Lisboa, Av. Rovisco Pais, 1049-001 Lisbon, Portugal
*
Author to whom correspondence should be addressed.
These authors contributed equally to this work.
Water 2016, 8(3), 93; https://doi.org/10.3390/w8030093
Submission received: 25 January 2016 / Revised: 25 February 2016 / Accepted: 4 March 2016 / Published: 10 March 2016
(This article belongs to the Special Issue Constructed Wetlands Systems and Management)

Abstract

:
This research was conducted to evaluate the feasibility of using the bioenergy crop Saccharum officinarum (sugarcane) as vegetation and mineral wastes for filling in constructed wetlands (CWs) designed for the removal of nutrients from wastewater. Four horizontal subsurface flow pilot-scale CWs were monitored during one year: two filled with fragmented limestone and two with clay brick fragments, two planted and two unplanted controls. Sugarcane stalk height, diameter and foliar area were evaluated during the plant-cane cycle along with total phosphorus (TP) and total nitrogen (TN) removal efficiencies from the wastewater. Sugarcane biomass production was 107 ton/ha for the brick fragments filled CW and 67 ton/ha for the fragmented limestone filled CW. Planted CWs show better nutrient removal efficiencies than the unplanted. Planted CW filled with brick fragments show average efficiencies of 77% ± 4% for TP and 60% ± 12% for TN, and planted CW filled with fragmented limestone 68% ± 3% for TP and 58% ± 7% for TN. Results showed that the use of sugarcane as CW vegetation is a viable alternative to produce a bioethanol raw-material without the use of arable land and irrigation water, while it maintains the wastewater treatment capabilities of CWs.

1. Introduction

The increase in world population, which leads to increasing needs for water, food and energy, requires more sustainable and innovative solutions to appropriately manage the limited resources of the planet. The reduction of fossil fuel reserves, as well as the need to reduce the emission of greenhouse effect gases, have increased the interest in bioenergy and in energy crops [1,2]. However, this increasing awareness of bioenergy alternatives can lead to an additional source of pressure on food resources and the availability of drinking water. Biofuels for road transport are an example of this situation, in which traditional energy crops for first generation bioethanol or biodiesel productions are criticized because they can directly or indirectly compete with the use of resources for food and feed production.
Among the first-generation energy crops, sugarcane and corn prevail as raw material for the production of bioethanol, the first mainly in Brazil and the latter in the US. Together, these countries produce about 90% of the world's bioethanol, mostly used as fuel for road vehicles [3,4]. In the US, a significant area of agricultural land is used in corn cultivation for bioethanol production [3].
Sugarcane, usually grown in tropical and subtropical climates, has a higher productivity and lower production costs than corn. The sugarcane bioethanol production costs are about half of the corn bioethanol production costs [1]. However, sugarcane requires more than twice the water as corn [5]. The high consumption of water, the need for fertilizers and the large areas of land required due to the low energy density of the cultures, are some of the challenges facing the expansion of bioenergy [1,2,4,5].
The sustainable development of bioenergy production can follow various paths, such as using alternative raw materials not used for food and feed production or developing more eco-efficient forms of production that reduce the use of resources. Regarding the first path, the use of traditional constructed wetland (CW) vegetation as alternative raw material for bioethanol production was tested by He and co-workers [6]. In a similar way, earlier lab scale studies demonstrate the potentiality of using sugarcane as CW vegetation, which represents a more eco-efficient form of producing a common energy crop [7]. This approach would allow for simultaneously benefitting from an advanced and environmentally friendly solution for water treatment and to further valorize, through bioenergy purposes, the vegetation grown on CWs. The cultivation of sugarcane in CWs allows bioethanol feedstock to be produced without having to use cultivated soils or fresh water for irrigation. In this way, mature first generation bioethanol production technology may be used for second-generation biofuels. Moreover, as soon as the bioethanol production from lignocellulosic materials is shown to be technically and economically feasible, it will be possible to use all sugarcane biomass produced in CWs for bioenergy conversion.
A set of preliminary studies were already implemented but on a laboratory small-scale and for a short trial period [7]. This study aims to evaluate CWs used for tertiary treatment in pilot-scale: the adaptation of the sugarcane to real conditions used in traditional macrophytes based CWs; the crop biomass and sucrose productivity during the overall cycle of plant cane; the performance of the sugarcane planted CWs in the removal of nutrients from the wastewater, especially phosphorus compounds, given their importance for effluents discharged into areas sensitive to eutrophication. Furthermore, taking into account that the use of low cost by-products or industrial wastes as filling materials is also a way to improve their sustainability, two different types of residual mineral materials from construction activities were tested.

2. Materials and Methods

2.1. Analytical Procedures

The CW inlet and outlet water samples were analyzed for total nitrogen (TN), total phosphorus (TP) and chemical oxygen demand (COD) as standard methods for the examination of water and wastewater [8].
For TP analyses, 5 mL water samples were autoclaved in an acid potassium persulfate solution at 121 °C for 30 min. After digestion and cooling, liberated ortophosphates were quantified spectrophotometrically at 880 nm, by ascorbic acid method.
TN was analysed by alkaline persulfate digestion method. A volume of 10 mL of water sample was autoclavated in an alkaline persulfate solution at 121 °C for 30 min, followed by spectrophotometrically quantification at 324 nm by the 2,6-dimethylphenol method.
COD determination was carried out according to the reflux method.
All chemicals and reagents used for the experiments and the analysis were of analytical grade. A Spectrophotometer DRLANGE CADAS 100 was used to measure the absorbances.

2.2. Data Analysis

Nutrients’ removal efficiency, sugarcane growth indicators and related calculations were computed using an MS Excel® 2013 (Microsoft Corp, Redmond, WA, USA) Spreadsheet.
Statistical tests were performed using IBM SPSS® software (IBM Corp, Armonk, NY, USA), version 21.
All numerical confidence intervals were computed from the standard deviation assuming a 95% confidence level.

2.3. Constructed Wetlands’ Filling Materials

The filing materials used were fragmented Moleanos limestone (FML), a construction rock also internationally branded as Gascoigne beige, and clay brick fragments (CBF). These materials were waste residues and by-products resulting from civil construction or related activities and were selected due to their availability and low cost. Both were studied in previous works with respect to their characteristics of P-sorption and tested in laboratory scale CWs for a short period of time as support media for sugarcane growth [7].
Moleanos limestone is a sedimentary mineral aggregate extracted from Moleanos, a limestone area located in central Portugal. The FML is mainly composed of CaCO3 (Al2O3 [0.23–0.51], CaO [55.58–55.76], Fe2O3 [0.04–0.60], K2O [0.00–0.04], MgO [0.00–0.26], MnO2 traces, Na2O [0.05–0.07], SiO2 [0.06–0.50], TiO2 [0.00], and L.o.I. [41.87–43.82]) [9].
The clay is mainly composed by SiO2 (Al2O3 [15.0–19.8], CaO [0.2–0.4], Fe2O3 [4.9–7.3], K2O [3.2–3.9], MgO [1.2–2.1], MnO [0.02–0.04], Na2O [0.1–0.8], SiO2 [57.3–68.3], TiO2 [0.9–1.0], and L.o.I. [4.3–8.1]) [10].
The particle size distribution of the materials was evaluated using standard sieve analysis techniques, and the values of d10 and d60 were determined [11]. The pycnometer method was used to determine the true density of the materials tested [12].

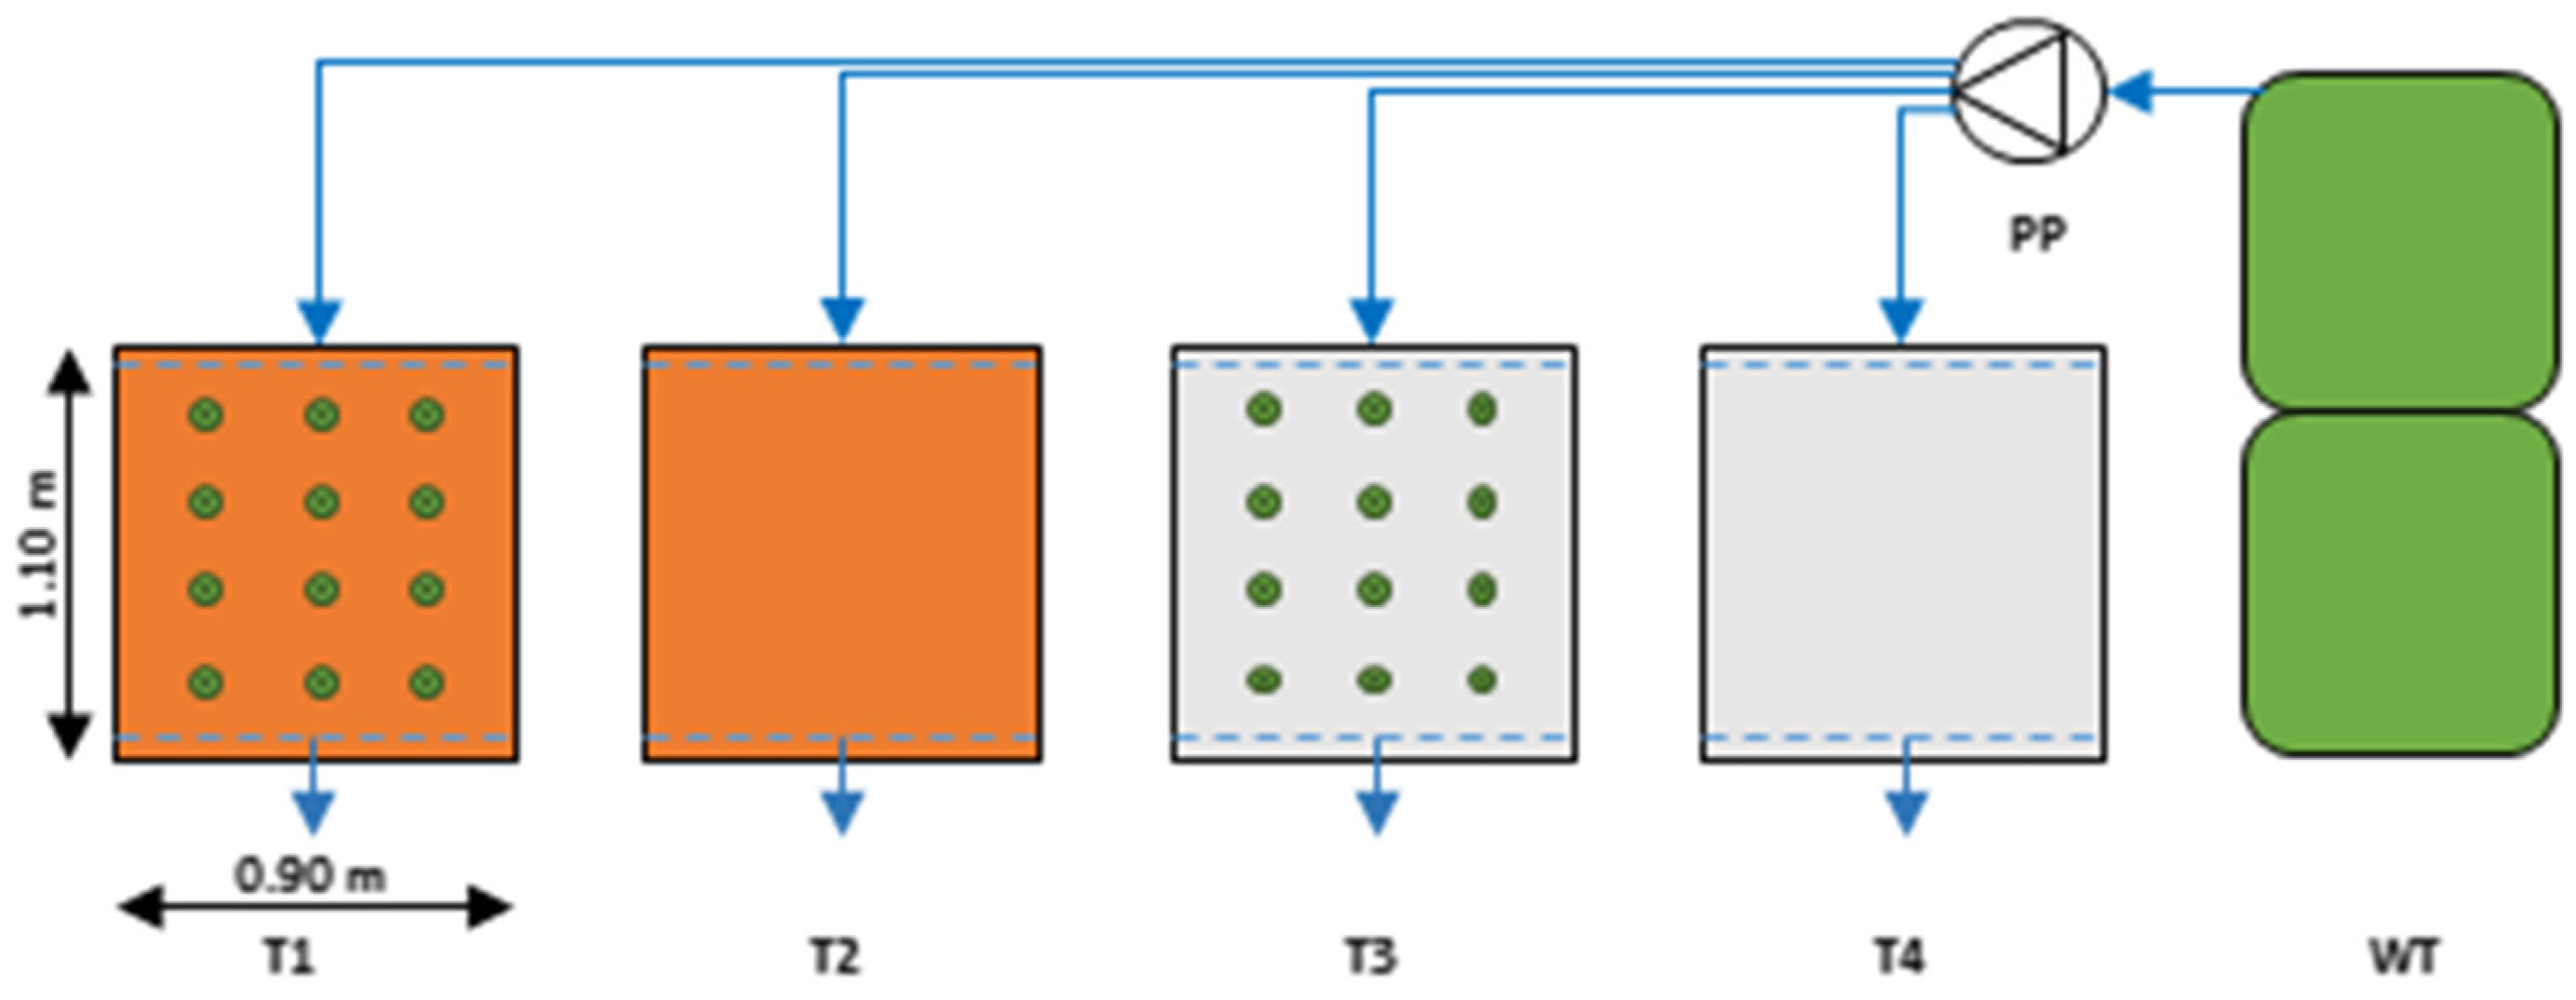
2.4. Pilot-Scale Constructed Wetlands

The pilot unit (Scheme 1) includes four horizontal subsurface flow constructed wetlands, named T1 to T4, each one consisting of a 1.10 m long × 0.90 m wide × 0.56 m deep rectangular PVC tank. Approximately 0.50 m of the respective filler material was placed in the tanks, with no other filling or support material. The liquid operating depth was nearly 0.49 m, which was controlled by a valve at the outlet of each tank.
The tanks T1 and T2 were filled with 650 kg of CBF, corresponding to a total volume of 0.495 m3 and a void fraction of ε = 0.465. True and bulk densities were 2650 ± 40 kg/m3 and 1310 ± 10 kg/m3 respectively, and the values of d10 and d60 computed from the particle size distribution were 3.36 mm and 6.58 mm, respectively. Tanks T3 and T4 were filled with 780 kg of FML, corresponding to a total volume of 0.495 m3 and a void fraction of ε = 0.453. True and bulk densities were 2690 ± 10 kg/m3 and 1570 ± 10 kg/m3, respectively, and the values of d10 and d60 computed from the particle size distribution were 20.2 mm and 38.2 mm, respectively.
The CWs continuously received a synthetic secondary wastewater effluent prepared with tap water, with average COD, TP, TN and pH of 40 ± 4 mg/L, 10.6 ± 0.9 mg/L, 30 ± 5 mg/L and 7.7 ± 0.1, respectively. The effluent was continuously fed at an average hydraulic loading rate of 40.8 ± 0.3 L/(m2 day), and the flow rate controlled by a peristaltic pump with four channels (323 S, Watson-Marlow Inc, Wilmington, DE, USA). Theoretical hydraulic retention time was 5.7 ± 0.1 days for T1 and T2 and 5.6 ± 0.2 days for T3 and T4. Wetland influent water samples were collected in line after the feed pump and effluent samples were collected at a collecting pipe placed on the bottom of each tank opposite to the influent feed.
The CWs have been operating since May 2013, and this paper reports the results obtained during the first year of operation until June 2014. In order to evaluate the efficiencies of the CWs, influent and effluent water samples were collected from all CWs and unfiltered replicate aliquots were immediately analyzed. Samplings were performed every two weeks during this trial period for TP and pH, and monthly between May and November 2013 for TN and COD.
TP, TN and COD removal efficiencies (η) were computed from the input and output compositions, with Equation (1),
η = C i Q i C o Q O C i Q i ,
where C represents concentration (mg/L TP, mg/L TN or mg/L COD) and Q represents the volumetric flow rates (L/h). Subscripts represent CW output stream (o) or CW input stream (i).

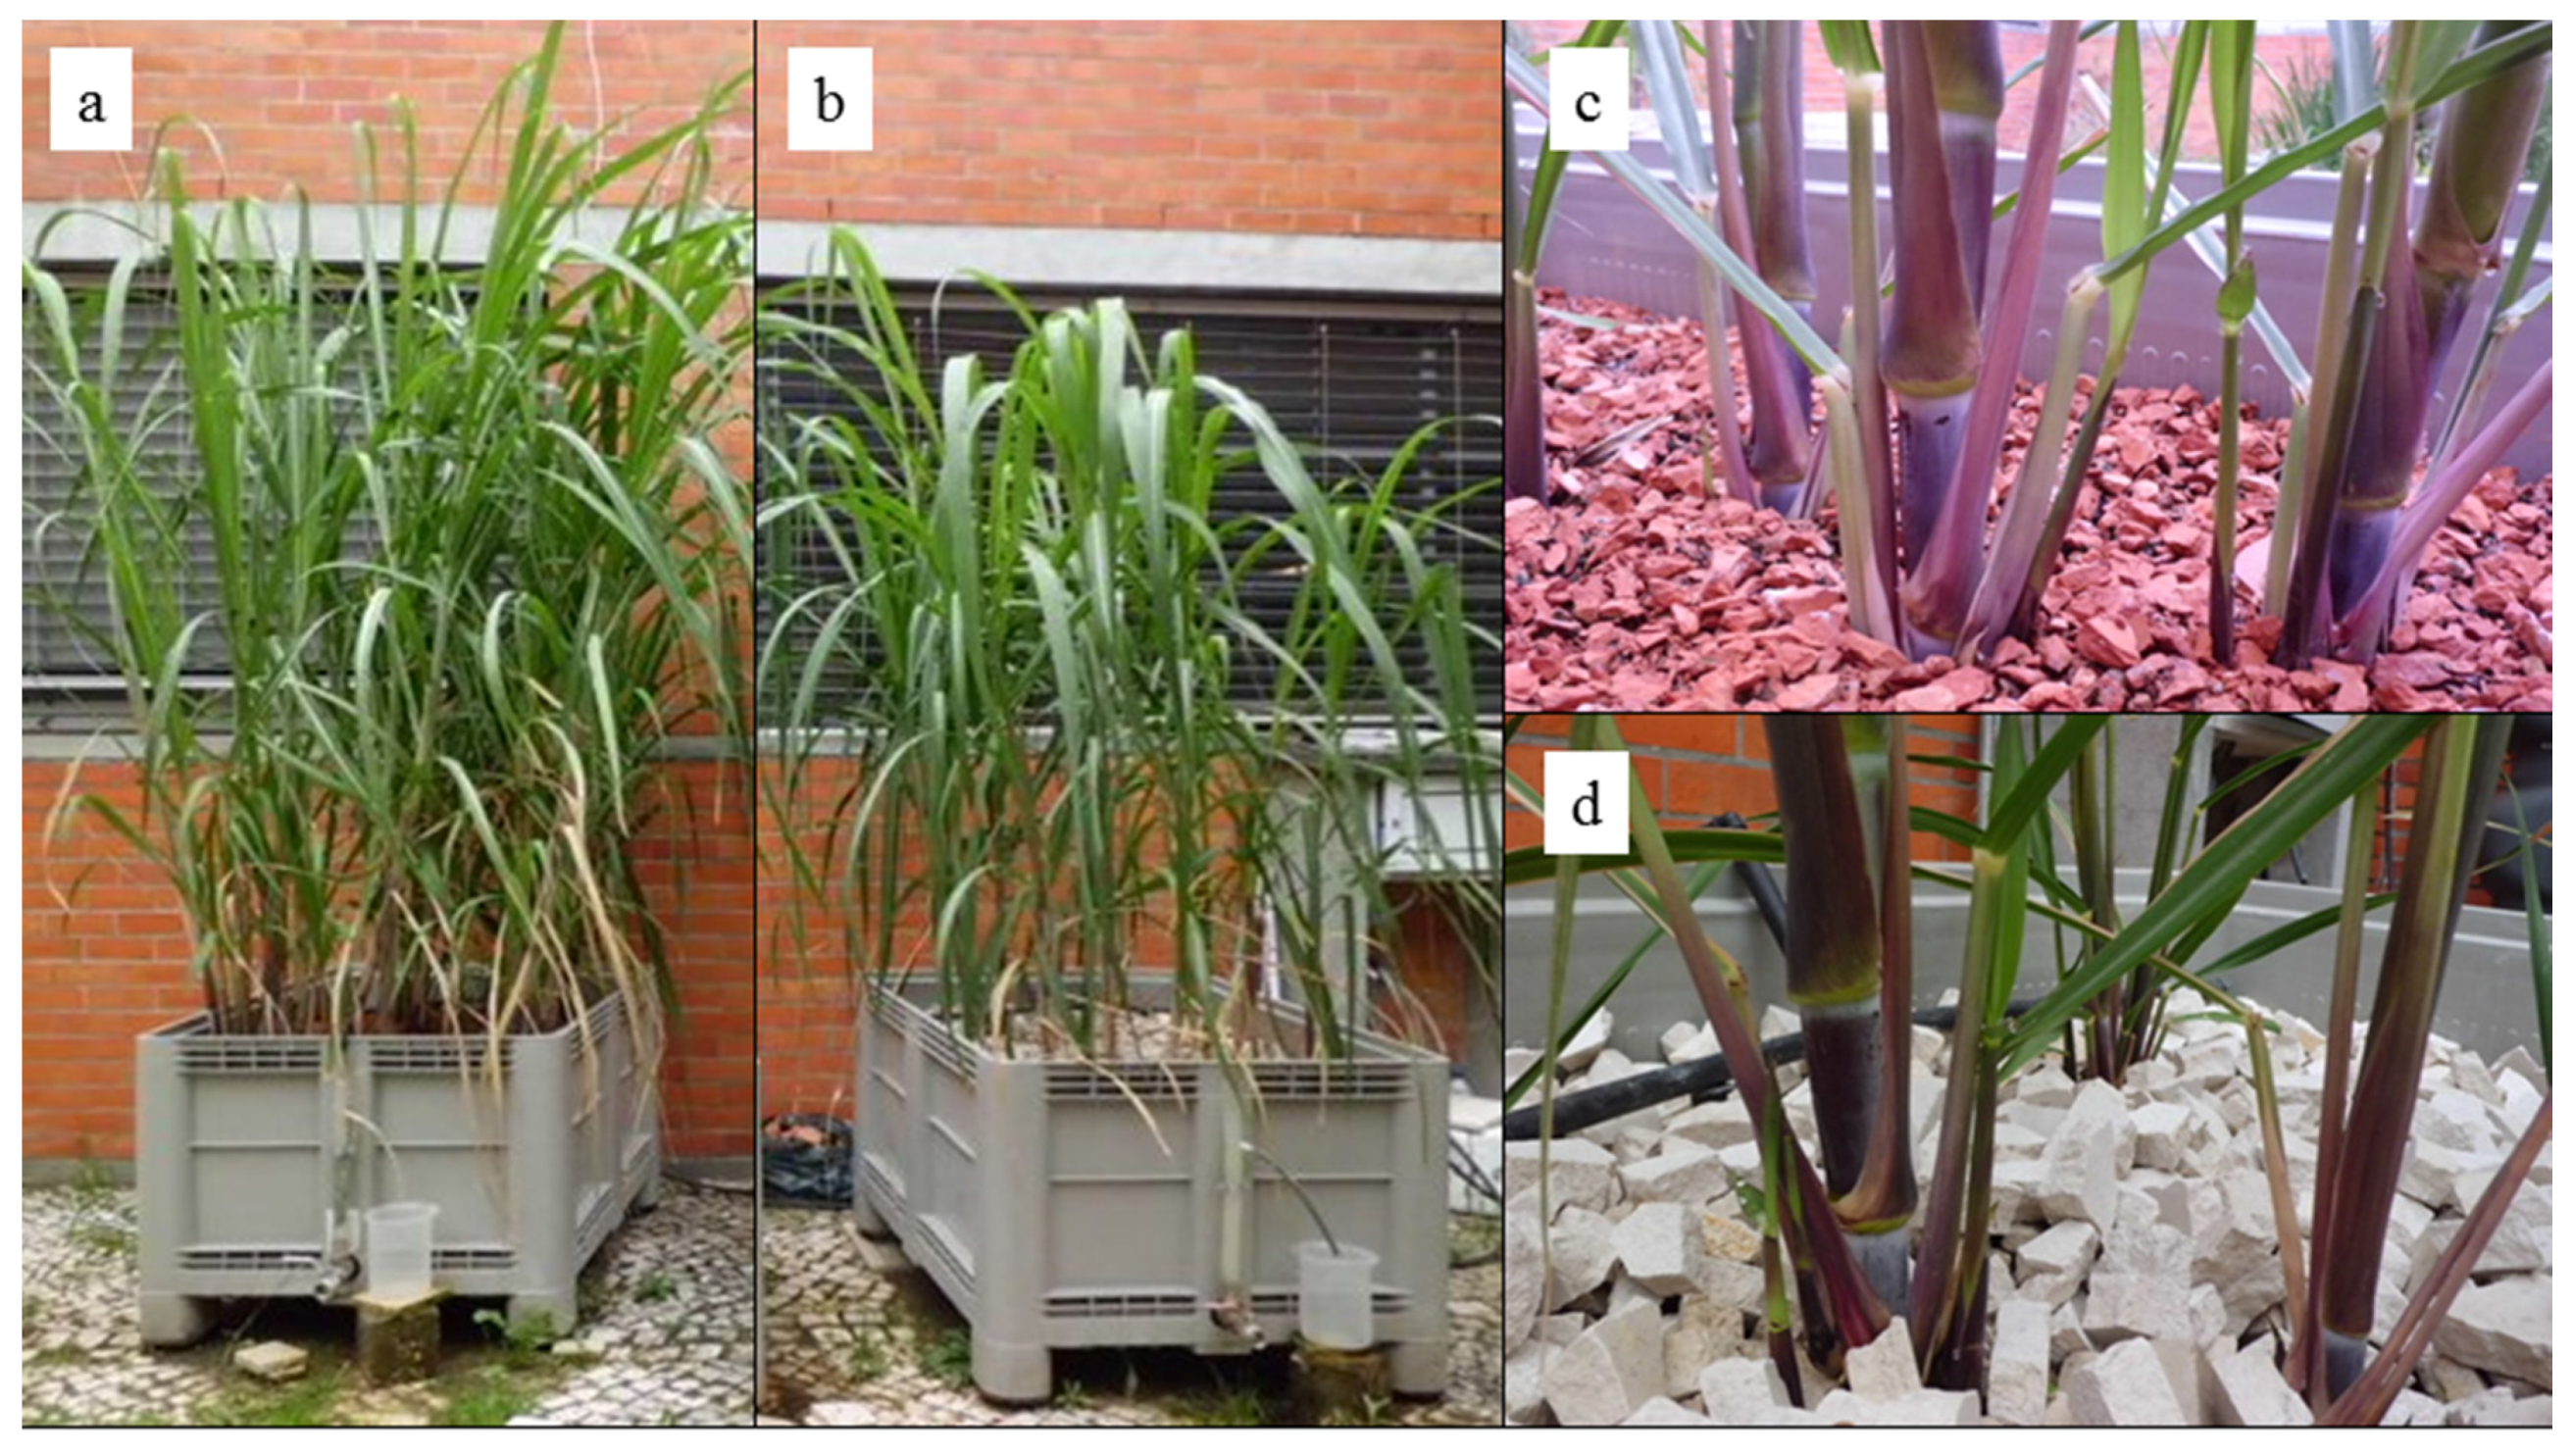
2.5. Cultivation Details and Plant Growth

The experiment was conducted outdoors in the Tomar campus of the Instituto Politécnico de Tomar (Central Portugal, 39°35′57.7″N, 8°23′26.1″W) under the conditions of a Mediterranean climate, classification Csa according to the Köppen–Geiger climate classification [13].
CW T1 and T3 were planted with sugarcane, and CW T2 and T4 were maintained plant-free. The sugarcane plants, Saccharum officinarum, were kindly donated by the Botanical Garden of the University of Coimbra, Portugal. The sugarcane was vegetatively propagated in March 2013. Double-budded sets 40 to 50 cm in length were planted at a 10 cm depth in sandy soil. Three months after germination, in June 2013 (summer), uniform plants were transplanted to CW T1 and T3 (12 plants/m2). The experiments were conducted without any pretreatment of the filler materials and with no addition of fertilizers or pesticides.
The crops were monitored every two weeks during the plant cane cycle. The biometric analysis was conducted in the field by a non-destructive method: the primary shoots were measured for height and diameter (measured at the first internode from the stalk base with a digital caliper), number of green leaves, width and length of the third well-developed leaf counted from the plant’s top, and the number of new shoots was counted.
The average value of the diameter and height of primary stalks of sugarcane plants in each CW was calculated. The average rates of elongation of stems were calculated according to the simple method proposed by Ramesh [14], from the ratio between the difference of stalk height and the interval of time between two successive measurements.
The plant’s leaf area was estimated from measurements of leaf width at the widest part of the leaf and length with a shape factor of 0.72 valid for sugarcane leaves [15].
In December 2013 (winter), at the end of the first growing season, approximately 6 months after planting (9 months after germination), above-ground biomass was harvested, separated into stalk and leafs and the fresh weight of each component was measured. Above-ground materials on a fresh weights basis were used to determine the productivity of cane biomass per CW area.
Representative samples of the each part of the plant, stem and leaf, were fibrated (finely-chopped) using a cutter-grinder. Sub-samples were dried at 60 °C to constant weight and dry matter content was determined. After drying, the materials were calcined at 550 °C in a muffle furnace for 4 h and the ashes dissolved in hydrochloric acid 3 M as described in Handbook of Reference Methods for Plant Analysis [16]. Then, TP contents for each part of the plants were determined, allowing the evaluation of P accumulation in the aerial part of plants.
Representative samples from the fresh fibrated material of millable stalk were ground and the crusher juice analyzed for Brix value at 20 °C. The °Brix, which is an estimator of the soluble solids fraction, was measured using a hand refractometer ATAGO, ATC-1, which automatically corrected the results for the temperature of 20 °C. Sucrose production was estimated according to the correlaton proposed by Muchow et al. [17], which correlates the sucrose accumulation in the sugarcane stalk in relation to crop biomass, on a dry weight basis.

3. Results and Discussion

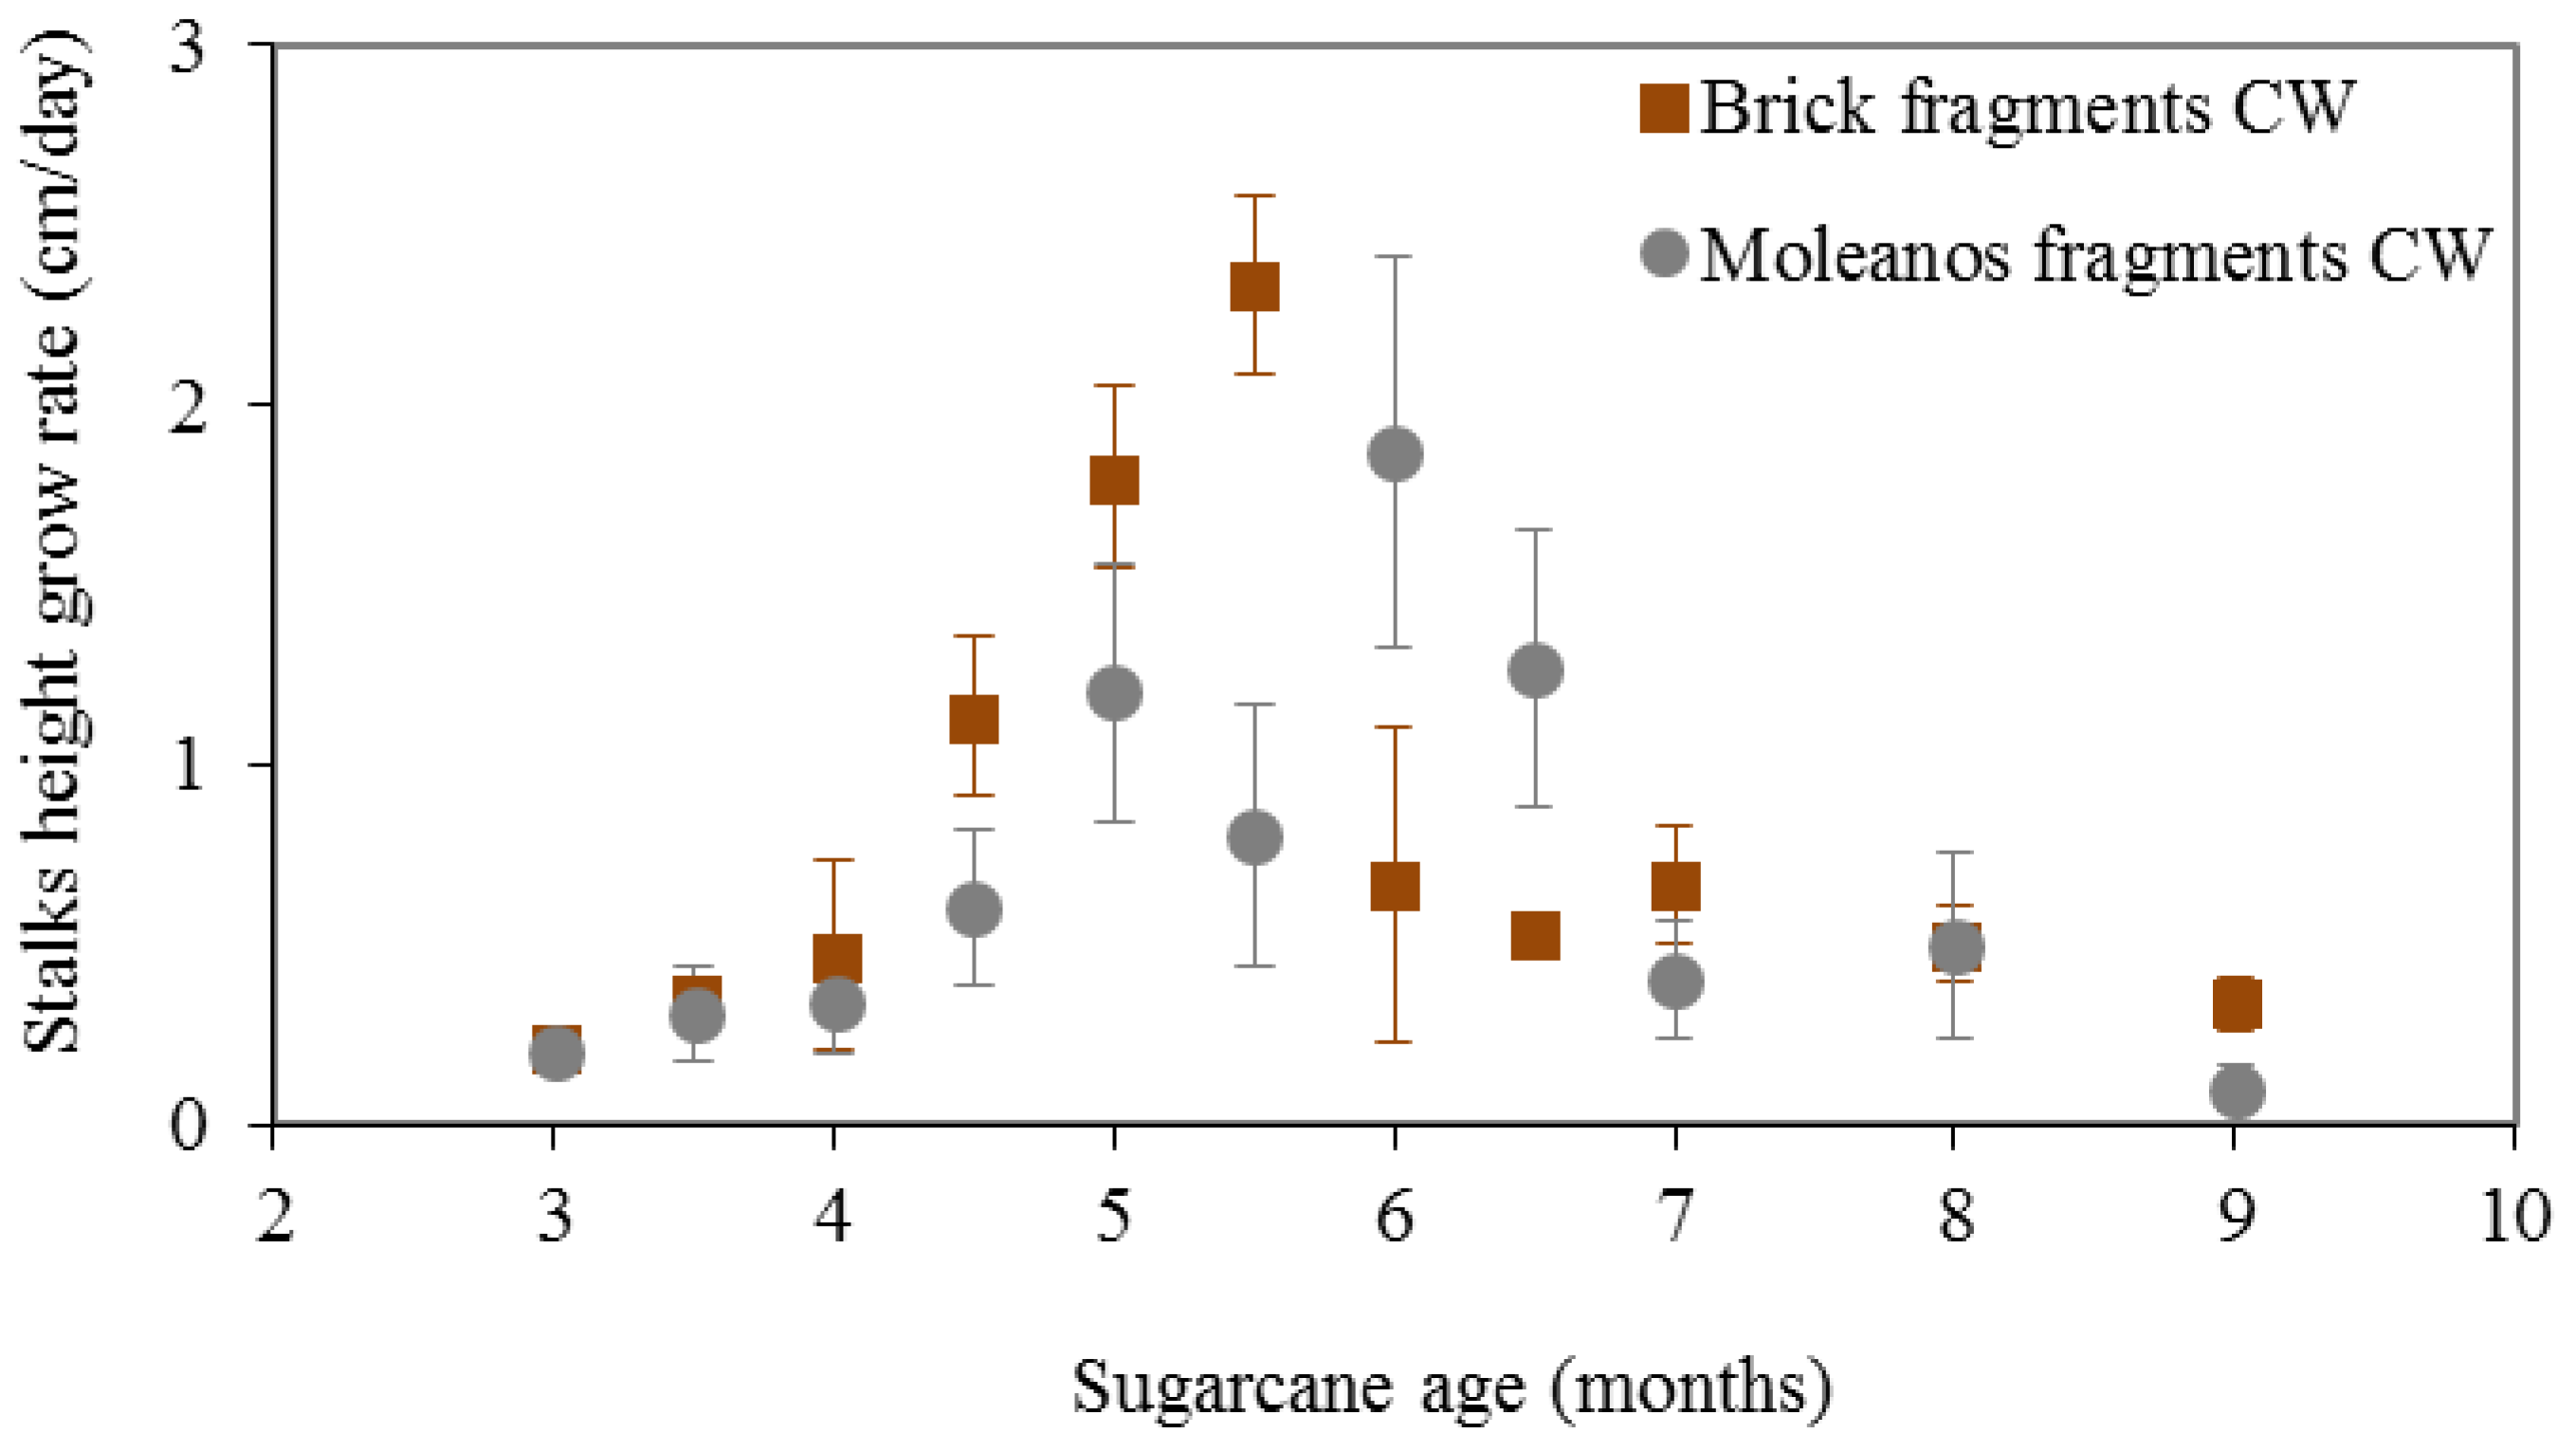
3.1. Sugarcane Growth Indicators

Figure 1 shows photographs of the planted pilot-scale CW T1 and T3 CWs. The plants showed, for both types of tested mineral filling materials, a healthy growth throughout the monitoring period, even without the use of pesticides, as can be observed in Figure 1.
Figure 2, Figure 3, Figure 4 and Figure 5 present the sugarcane growth indicators considered: average stalk height, average stalk diameter and average foliar area. The sugarcane growth followed a sigmoidal pattern in time for both filling materials, although the average stalk height was slighter higher in the CW T1 than in the CW T3, showing a better adaptation of the plants to the clay brick fragments substrate (Figure 2).
The maximum stalk height growth rates were observed between the fifth and sixth months of germination, corresponding to the period between August and September 2013 (Figure 3), when the temperature and solar radiation are higher. The maximum growth rate was also slightly higher for the CW T1 sugarcanes (2.33 cm/day) than for the CW T3 sugarcanes (1.87 cm/day). The values obtained are similar to those cited in literature for cultivars of sugarcane: Silva et al. [18], for the variety RB92579 of Saccharum spp, obtained for the eight months after planting a maximum stalk growth rate of 1.8 cm/day, corresponding to a stalk height of 230 cm; Oliveira et al. [19], for the varieties RB72454, RB855113, RB855536, reports a rate of 2 cm/day one year after planting; and Santos et al. [20], for the variety RB75126, a maximum rate of approximately 1.3 cm/day five months after planting, corresponding to a stalk height of 115 cm.
The sugarcane stalk diameter increased markedly in the first 4.5 months in both CWs (Figure 4), with an average rate of 0.20 mm/day and 0.11 mm/day for T1 and T3 CWs, respectively. The highest increase in height of the stalks occurred during the same period. In the following months the diameter of the stalks continued to increase in both CWs, although with lower rates, respectively of 0.043 mm/day and 0.041 mm/day for T1 and T3. These results confirm a good adaptation of the sugarcane to both CW conditions but reveal a better adaptation to the clay brick fragments, in which the average stalk diameter doubled during the first five months and reached approximately 2.5 cm. The values obtained are slightly lower than those reported by Silva et al. [18]. For stalks with 4.5 months, these authors mention an average diameter of 2.67 cm and an average growth rate of 0.368 mm/day. These results, however, were obtained in a tropical climate and under classical crop conditions, with irrigation.
The average sugarcane foliar area per plant mirrored the evolution of the previous biometric parameters, also with a slightly higher growth rate for the plants in the brick fragments CW T1 over the limestone fragments CW T3 (Figure 5). In both CWs, the sugarcane foliar area increased significantly during the first six months of growth, reaching 6000 cm2/plant and 5000 cm2/plant, respectively, for CW T1 and CW T3, and tended towards stabilization in the remaining growth period. For the same species and on a subtropical climate, Streck et al. [21] report a value of sugarcane foliar area of 4000 cm2/plant four months after planting. Robertson et al. [22] reported about 5000 cm2/plant five months after planting, under high input conditions in a tropical climate.
Table 1 presents the biomass production and complementary growth indicators evaluated, the estimated sugar production, and the P accumulation in the plants aerial parts. The number of new shoots was significantly different between CW T1 and T3 (p < 0.001), higher for the clay bricks fragments filling, which may indicate a better adaptation of sugarcane germination on that lighter substrate. The clay brick fragments are smaller and lighter than the limestone fragments facilitating the development of roots and the sprouting of new shoots.The new shoots contribute considerably to the higher biomass productivity of the CW T1 (Table 1).
The pilot-scale CWs have an area of 0.99 m2. Assuming 1.5 times this area to allow for the circulation of workers and machines, the following annual values may be estimated from the experimental results, respectively for CBF filled CW T1 and FML filled CW T3: sugarcane production, wet basis, of 107 ton/ha and 67 ton/ha; sucrose production of 9 ton/ha and 5 ton/ha; and an accumulation of P in the above ground biomass of 82 kg/ha and 54 kg/ha. In both cases, the sugarcane productivity was within the range of crop productivity in traditional systems: 65 to 226 ton/ha in Brazil [23,24,25]; 68 to 110 ton/ha in the United States [26]; 60 to 167 ton/ha in Australia [17,22,27]; 38 to 106 ton/ha in Africa [28]; 68 to 149 ton/ha in Pakistan [29].
The Brix value for the sugarcane stalks was similar to the average values reported for typical cultures from 9 to 22 °Brix [24,25,30,31]. The results obtained were not amongst the higher values reported, but higher Brix values may be expected for longer growth periods.
Crop growth indicators and sugarcane productivity were higher in the plant grown in the CW filled with clay brick fragments. Growth and productivity differences could be a result of the different chemical composition of the fillings but are more probably due to the lower density and higher void fraction of CBF when compared to FML, which may facilitate the development of the plants’ roots. However, from the results, it may be observed that, in general and for both fillings, the values obtained during the trial period are within the range of values found in the literature for a wide variety of sugarcane cultivars and culture conditions, some of which were obtained in more favorable climates and using fertilizers.

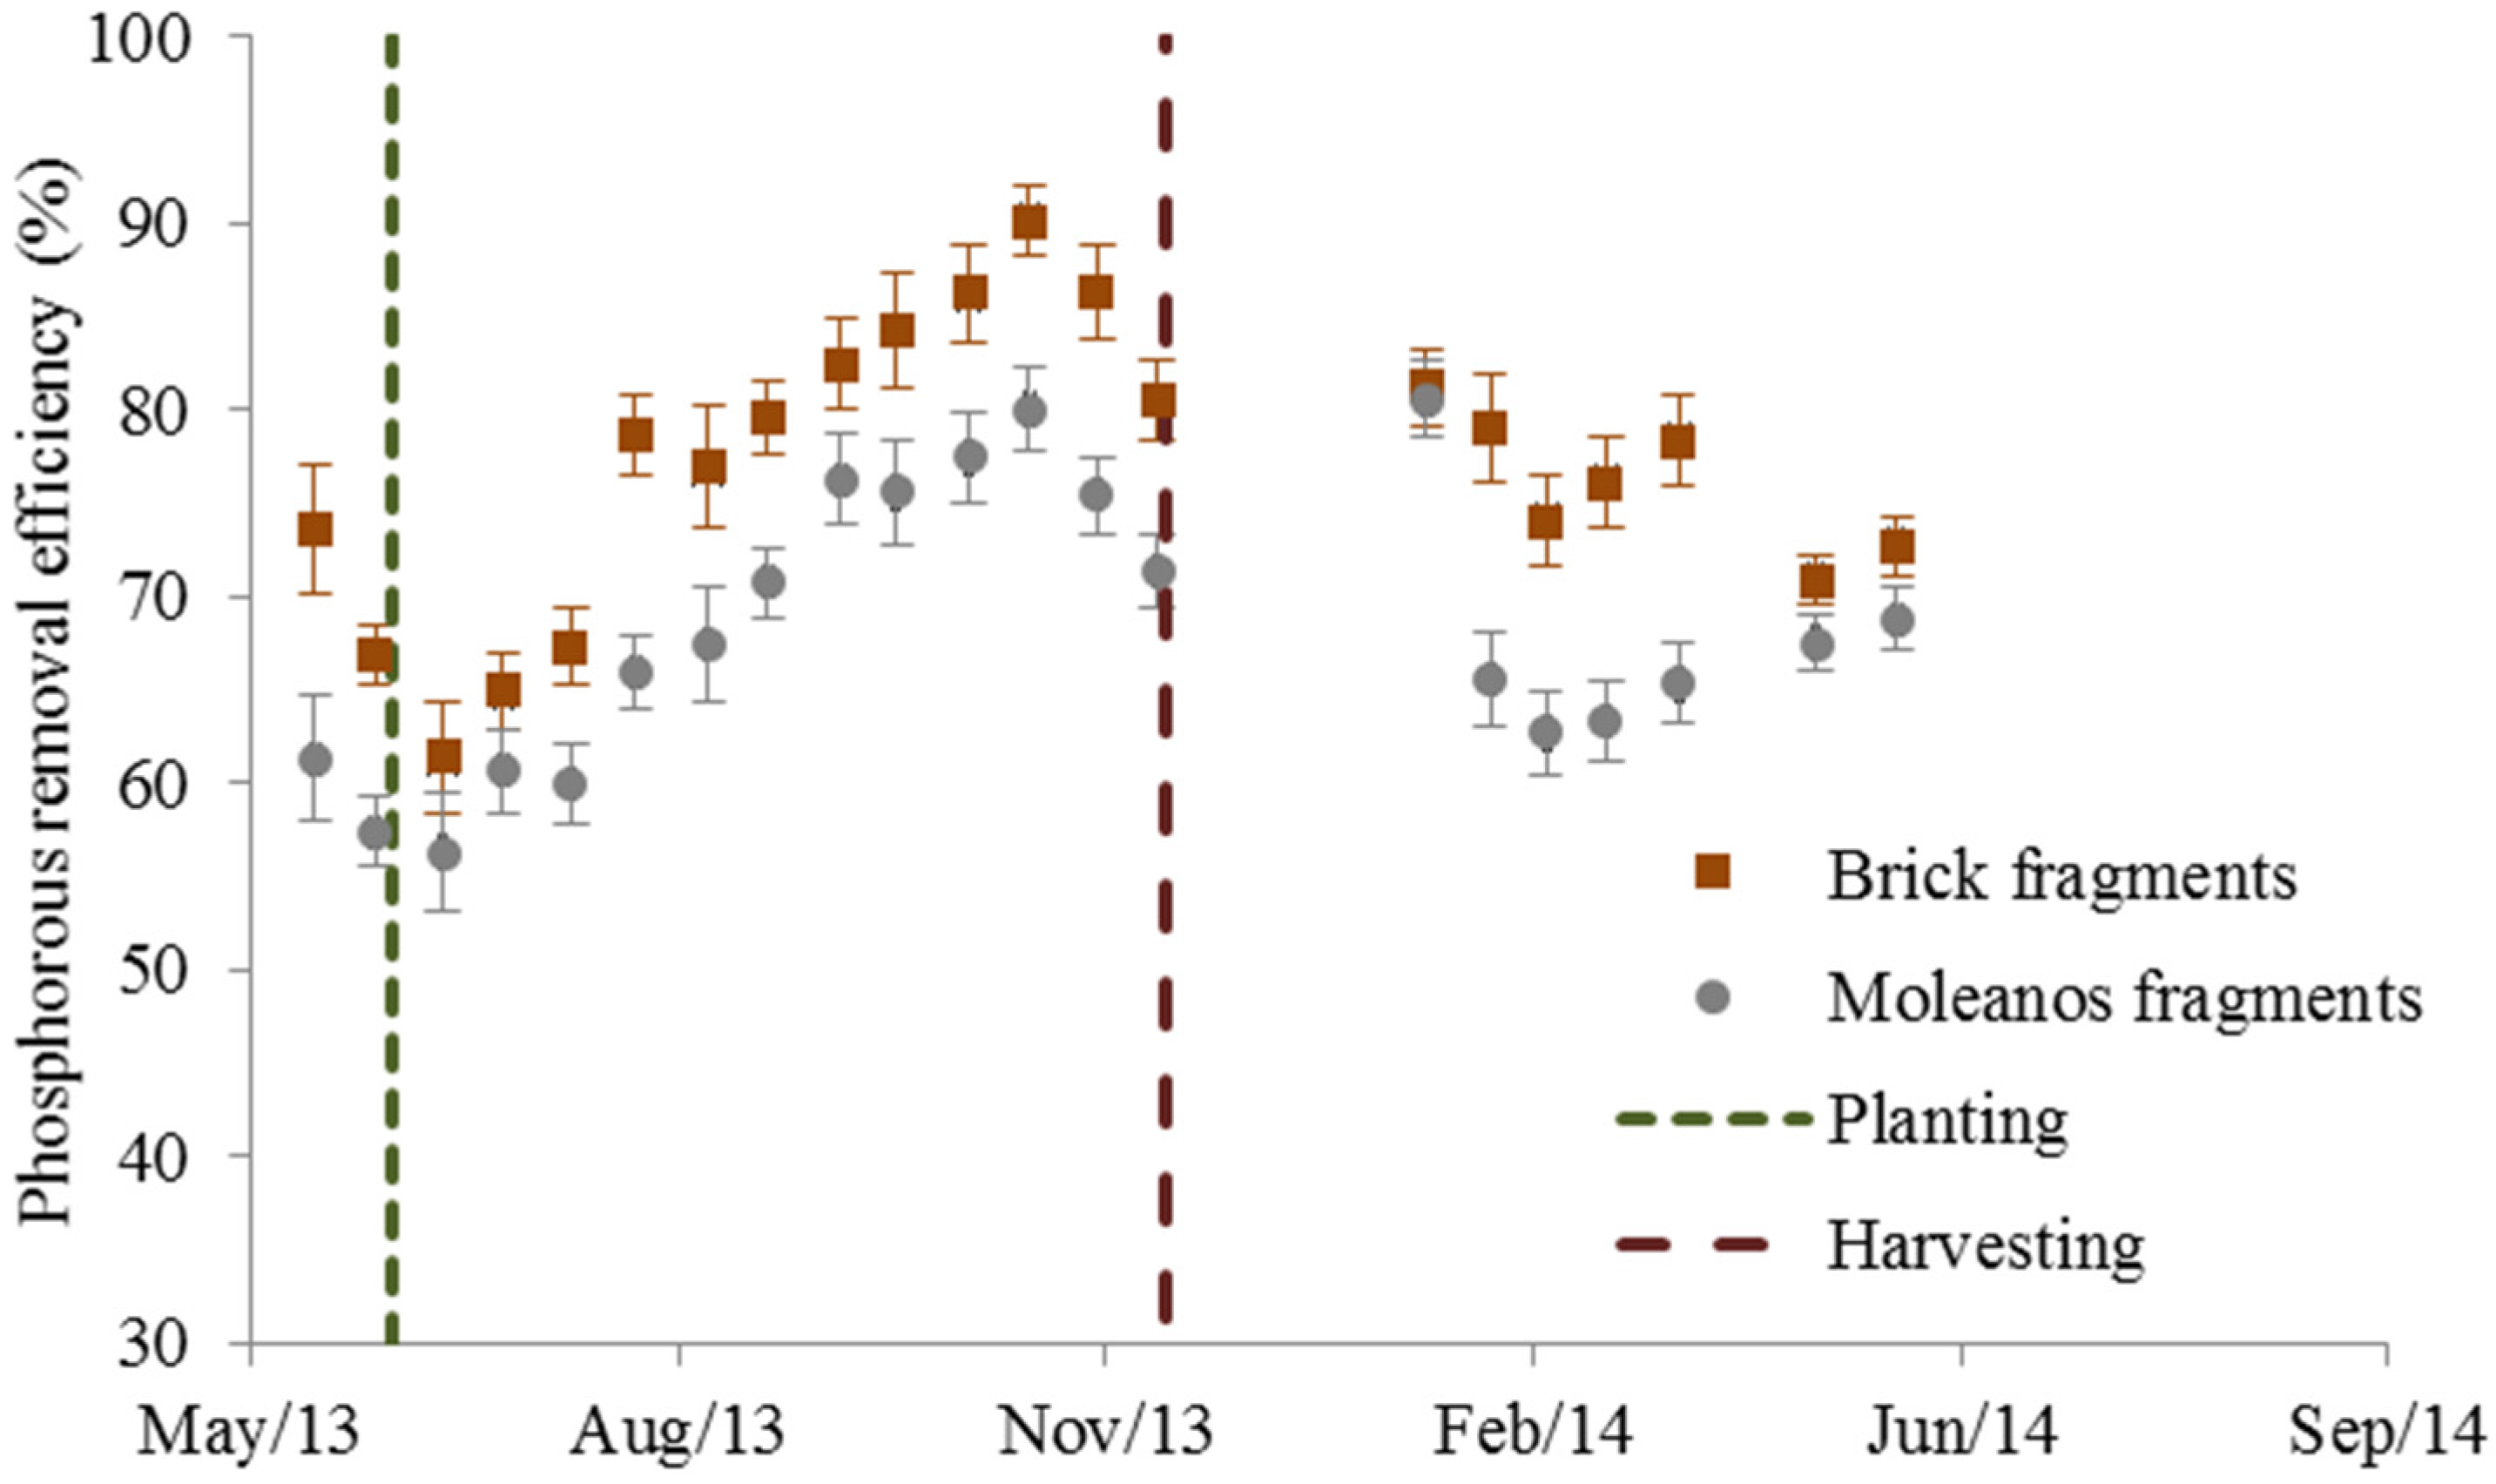
3.2. CW Performance for Nutrient Removal from Wastewater

Table 2 contains the computed average nutrient removal and the pH at output stream for all four CWs. The TP removal efficiencies in CW T1 and T3 are presented in Figure 6.
CW T1 with the clay bricks filling showed a better performance than the CW T3 filled with the limestone fragments (significantly different, p < 0.001). The minimum efficiencies were 55% for CW T3 and 60% for CW T1, both values obtained few days after planting. CWs filled with CBF have a higher efficiency for TP removal, which can be explained by the fact that the clay has a higher phosphate adsorption capacity than the limestone, reinforced by a higher interfacial area due to the smaller dimension of the brick fragments than the limestone fragments.
The maximum efficiencies were obtained near the harvesting date and coincide in time with the maximum plant stalk growth rates. They are close to 90% TP removal for CW T1, and 80% TP removal for CW T3. This range of values, and the average removal efficiencies (Table 1), are well comparable to the efficiency obtained in the same climate and with the same operational conditions for CWs planted with the traditional macrophyte Phragmites australis and filled with high phosphorous removal capacity expanded clays [32]. The proportion of input P sequestered in the plant´s aerial parts was 9.2% for CW T1 and 6.3% for CW T3.
Figure 7 shows the estimated contribution of the sugarcane plants to the TP removal efficiencies of the CWs. This data was obtained through the difference between the efficiencies of the planted CWs (T1 and T3) and the respective control non-planted CWs (respectively T2 and T4). It was verified that the contribution of the plants for TP removal was smaller in the periods after planting and pruning and higher during the growth period. The maximum values, around 25%, were observed during the period of greatest plant growth. From these results, we can say that the maximum plant growth rate induced the maximum plant contribution to phosphorous removal from wastewater, with the consequent increase of the CW TP removal efficiency. The plants’ contribution to TP removal was apparently slightly higher on the CW filled with limestone fragments, but this cannot be clearly verified due to the experimental data dispersion. The results for the two type of filling media are only slightly significantly different (p = 0.042). For both types of filling materials, the plants’ average contribution for TP removal from the wastewater throughout the experiment period is 9%, which is a typical value for the usual CW vegetation [32,33,34].
According to the data presented in Table 1, the accumulation of phosphorus in above-ground biomass correspond to 82 kg/ha and 54 kg/ha. These values are comparable to those obtained for the sugarcane crop in classic conditions [35,36] and to those obtained for the macrophytes commonly used in CWs [37]. As is the case with reeds, sugarcane can be a semi-permanent crop, as it can also be pruned several times and may be grown from three to more than 20 years before being ploughed out [38].
Based on TN and COD analysis performed in the months referred to above, average removal efficiencies were calculated and presented in Table 2. Although these results show a high dispersion, we can observe that the average efficiencies for both planted CWs are similar to those obtained with CW traditional vegetation [39,40]. The removal of TN follows the same tendency of TP removal in the experimental CWs: TN removal efficiency is superior in the CW T1 filled with CBF and planted with sugarcane. The behavior is different in the case of COD: it is observed that the COD removal efficiency was lower in the planted CWs, and particularly lower in the CW T1 where the sugarcane development was the highest. Lower COD removal efficiency in planted CWs may be justified by: (i) very low COD level of the secondary type wastewater (c.f. Section 2.4; COD = 40 ± 4 mg/L); (ii) plants assimilate nutrients like nitrogen and phosphorus but do not contribute directly to the removal of organic loads in consequence of its autotrophic character; (iii) dead plants biomass deposition and consequent release of the carbon which had been assimilated from the atmosphere.
The contribution of plants to nutrients’ removal performance of CW depends on several factors including CW characteristics, wastewater composition, operational conditions and plant species [41,42,43,44,45]. However, in general, direct comparison experiments between planted and unplanted CW give results similar to the present work—planted CWs performed better than unplanted CWs [32,46,47,48,49]. Among the possible roles of plants in the wastewater treatment processes, the roots surface support for microbial film development and the provided oxidized rhizosphere were pointed out as the principal plants contributions [37,42,50,51].

4. Conclusions

The use of CWs to simultaneously treat wastewater and produce biomass for energy purposes can constitute an eco-efficient alternative for energy crop production and an improvement of CW sustainability. The results show that it is possible to replace the plants commonly used in CWs by sugarcane without changing the operability and performance of CWs in the treatment of wastewater. This strategy enables the production of a common energy crop without using soils suitable for agriculture and avoiding the use of irrigation water and commercial fertilizers, since the wastewater under treatment itself is used for irrigation and fertilization of the sugarcane crops.
CWs are a particularly suitable technology for advanced treatment, especially useful for reducing the content of nutrients in the wastewater in order to prevent eutrophication phenomena in the receptor waters.
In this study, carried out on a pilot-scale and for over a year, the results previously obtained in lab-scale were completed and the conclusions strengthened:
  • Sugarcane can be grown in the usual conditions of CWs with subsurface continuous flow of secondary treated wastewater;
  • Sugarcane plants grow healthy in CWs filled with mineral waste materials from construction activities;
  • The degree of removal of nutrients from the wastewater, particularly of TP, is similar to that obtained in traditional CWs;
  • The Brix value of the sugarcane plants produced in these CWs is similar to that obtained in the usual farm sugarcane for plants only one year old;
  • The productivity of the clay brick fragments filled CW during the trial period was equivalent to 107 tons of sugarcane and nine tons of sucrose per hectare, which is within the range obtained with the traditional cultivation methods in soils;
  • In the conditions used, it is possible to treat 150,000 m3/year of secondary type wastewater per hectare of subsurface sugarcane planted CWs.
The overall results obtained for the pilot-scale experiments show that the use of sugarcane as CW vegetation represents a potentially viable alternative to produce bioethanol raw-materials without the use of arable land and irrigation water, simultaneously providing the wastewater advanced treatment capabilities of CWs. The production of sugarcane in CWs may be an even more interesting solution in tropical countries where sugarcane is usually grown, with an expected higher productivity, and it can be a wastewater-bioenergy technology combination suitable for developing countries.
The maintenance of CWs is a significant aspect for the successful operation of the systems and spreading of the technology, so future studies should be done to determine the viability of sugarcane for nutrient removal in CWs on a field scale and for a long time period. CWs are also used for secondary treatment, so future studies can also be done to evaluate plants tolerance to high pollutants loads.

Acknowledgments

The authors acknowledge Isabel Silva and Alcino Serras from IPT´s Chemical and Environmental Technical Lab for helpful technical assistance.

Author Contributions

Dina Mateus and Mafalda Vaz conceived and designed the experiments; Mafalda Vaz performed the experiments; Mafalda Vaz, Dina Mateus and Henrique Pinho analysed the data; Dina Mateus and Isabel Capela supervised the experimental work and the manuscript proofreading; Dina Mateus and Henrique Pinho wrote the paper.

Conflicts of Interest

The authors declare no conflict of interest.

Abbreviations

The following abbreviations are used in this manuscript:
CBFClay Brick Fragments
CODChemical Oxygen Demand
CWConstructed Wetlands
FMLFragmented Moleanos Limestone
TNTotal Nitrogen
TPTotal Phosphorous

References

  1. Balat, M.; Balat, H.; Öz, C. Progress in bioethanol processing. Prog. Energ. Combust. 2008, 34, 551–573. [Google Scholar] [CrossRef]
  2. Rahman, M.M.; Mostafiz, S.B.; Paatero, J.V.; Lahdelma, R. Extension of energy crops on surplus agricultural lands: A potentially viable option in developing countries while fossil fuels reserves are diminishing. Renew. Sustain. Energy Rev. 2014, 29, 108–119. [Google Scholar] [CrossRef]
  3. Koçar, G.; Civaş, N. An overview of biofuels from energy crops: Current status and future prospects. Renew. Sustain. Energy Rev. 2013, 28, 900–916. [Google Scholar] [CrossRef]
  4. Vohra, M.; Manwar, J.; Manmode, R.; Padgilwar, S.; Patil, S. Bioethanol production: Feedstock and current technologies. J. Environ. Chem. Eng. 2014, 2, 573–584. [Google Scholar] [CrossRef]
  5. Su, M.-H.; Huang, C.-H.; Li, W.-Y.; Tso, C.-T.; Lur, H.-S. Water footprint analysis of bioethanol energy crops in Taiwan. J. Clean Prod. 2015, 88, 132–138. [Google Scholar] [CrossRef]
  6. He, M.; Hu, Q.; Zhu, Q.; Pan, K.; Li, Q. The feasibility of using constructed wetlands plants to produce bioethanol. Environ. Prog. Sustain. Energy 2015, 34, 276–281. [Google Scholar] [CrossRef]
  7. Mateus, D.M.R.; Vaz, M.M.N.; Capela, I.; Pinho, H.J.O. Sugarcane as constructed wetland vegetation: Preliminary studies. Ecol. Eng. 2014, 62, 175–178. [Google Scholar] [CrossRef]
  8. American Public Health Association; American Water Works Association; Water Environment Federation. Standard Methods for the Examination of Water and Wastewater, 21th ed.; APHA: Washington, DC, USA, 2005. [Google Scholar]
  9. Catálogo de Rochas Ornamentais Portuguesas (Portuguese ornamental stones catalogue), Instituto Nacional de Engenharia, Tecnologia e Inovação. Avaliable online: http://rop.ineg.pt/rop/ index-en.php (accessed on 19 February 2016).
  10. Coroado, J.F.; Ferraz, E.; Gomes, C.F.; Rocha, F. Clays from Vila Nova da Raínha (Portugal): Appraisal of their relevant properties in order to be used in construction ceramics. Acta Geodyn. Geomater. 2010, 7, 189–200. [Google Scholar]
  11. European Committee for Standardization. Tests for Geometrical Properties of Aggregates—Part 1: Determination of Particle Size Distribution—Sieving Method; European Norm 933-1:1997; European Committee for Standardization: Brussels, Belgium, 2012. [Google Scholar]
  12. European Committee for Standardization. Tests for Mechanical and Physical Properties—Part 6: Determination of Particle Density and Water Absorption; European Norm 1097-6:2000; European Committee for Standardization: Brussels, Belgium, 2012. [Google Scholar]
  13. Kottec, M.; Grieser, J.; Beck, C.; Rudolf, B.; Rubel, F. World map of the Köppen-Geiger climate classification. Meteorol. Z. 2006, 15, 259–263. [Google Scholar] [CrossRef]
  14. Ramesh, P. Effect of different levels of drought during the formative phase on growth parameters and its relationship with dry matter accumulation in sugarcane. J. Agron. Crop Sci. 2000, 185, 83–89. [Google Scholar] [CrossRef]
  15. Sinclair, T.R.; Gilbert, R.A.; Perdomo, R.E.; Shine, J.M., Jr.; Powell, G.; Montes, G. Sugarcane leaf area development under field conditions in Florida, USA. Field Crops Res. 2004, 88, 171–178. [Google Scholar] [CrossRef]
  16. Campbell, C.R.; Plank, C.O. Preparation of plant tissue for laboratory analysis. In Handbook of Reference Methods for Plant Analysis; Kalra, Y.P., Ed.; CRC Press: New York, NY, USA, 1998; pp. 37–49. [Google Scholar]
  17. Muchow, R.C.; Robertson, M.J.; Wood, A.W.; Keating, B.A. Effect of nitrogen on the time-course of sucrose accumulation in sugarcane. Field Crop. Res. 1996, 47, 143–153. [Google Scholar] [CrossRef]
  18. Silva, T.G.F.; Moura, M.S.B.; Zolnier, S.; Carmo, J.F.A.; Souza, L.S.B. Biometrics of the sugarcane shoot during irrigated ratoon cycle in the submedio of the Vale do São Francisco. Rev. Cienc. Agron. 2012, 43, 500–509. [Google Scholar] [CrossRef]
  19. Oliveira, R.A.; Daros, E.; Zambon, J.L.C.; Weber, H.; Ido, O.T.; Zuffellato-Ribas, K.C.; Koehler, H.S.; da Silva, D.K.T. Growth development of three varieties of sugarcane, in cane-plant, in the Paraná state: Growth indexs. Sci. Agraria 2005, 6, 85–89. [Google Scholar]
  20. Santos, V.R.; Filho, G.M.; Albuquerque, A.W.; Costa, J.P.V.; Santos, C.G.; Santos, A.C.I. Growth and yield of sugarcane under different phosphorus sources. Rev. Bras. Eng. Agric. Ambien. 2009, 13, 389–396. [Google Scholar] [CrossRef]
  21. Streck, N.A.; Hanauer, J.G.; Gabriel, L.F.; Buske, T.C.; Langner, J.A. Leaf development and growth of selected sugarcane clones in a subtropical environment. Pesqui. Agropecu. Bras. 2010, 45, 1049–1057. [Google Scholar] [CrossRef]
  22. Robertson, M.J.; Wood, A.W.; Muchow, R.C. Growth of sugarcane under high input conditions in tropical Australia. I. Radiation use, biomass accumulation and partitioning. Field Crops Res. 1996, 48, 11–25. [Google Scholar] [CrossRef]
  23. Agostinho, F.; Ortega, E. Integrated food, energy and environmental services production as an alternative for small rural properties in Brazil. Energy 2012, 37, 103–114. [Google Scholar] [CrossRef]
  24. Caione, G.; Lange, A.; Benett, C.G.S.; Fernandes, F.M. Phosphorus sources for sugarcane forage cultivars fertilization in the Brazilian savannah. Pesqui. Agropecu. Trop. 2011, 41, 66–73. [Google Scholar]
  25. Muraro, G.B.; Rossi Junior, P.; Schogor, A.L.B. Forage yield of sugarcane growing in different row spacing and harvesting periods. Cienc. Agrotec. 2011, 35, 131–136. [Google Scholar] [CrossRef]
  26. Gilbert, R.A.; Rainbolt, C.R.; Morris, D.R.; McCray, J.M. Sugarcane growth and yield responses to a 3-month summer flood. Agric. Water Manag. 2008, 95, 283–291. [Google Scholar] [CrossRef]
  27. Thorburn, P.J.; Biggs, J.S.; Attard, S.J.; Kemei, J. Environmental impacts of irrigated sugarcane production: Nitrogen lost through runoff and leaching. Agric. Ecosyst. Environ. 2011, 144, 1–12. [Google Scholar] [CrossRef]
  28. Watson, H.K. Potential to expand sustainable bioenergy from sugarcane in southern Africa. Energ Policy 2011, 39, 5746–5750. [Google Scholar] [CrossRef]
  29. Maqsood, M.; Iqbal, M.; Tayyab, M. Comparative productivity performance of sugarcane (Saccharum officinarum L.) sown in diferente planting patterns at farmer´s field. Pak. J. Agric. Sci. 2005, 42, 25–28. [Google Scholar]
  30. Azzini, A.; Teixeira, J.P.F.; Moraes, R.M.; Camargo, J.F.P. Correlation between the soluble solid contents of the cane juice and the culm basic density. Bragantia 1980, 39, 181–183. [Google Scholar] [CrossRef]
  31. Tasso Júnior, L.C.; Marques, M.O.; Franco, A.; Nogueira, G.A.; Nobile, F.O.; Camilotti, F.; Silva, A.R. Yield and quality of sugar cane cultivated in sewage sludge, vinasse and mineral fertilization supplied soil. Eng. Agríc. 2007, 27, 276–283. [Google Scholar] [CrossRef]
  32. Mateus, D.M.R.; Pinho, H.J.O. Phosphorous removal by expanded clay—Six years of pilot-scale constructed wetlands experience. Water Environ. Res. 2010, 82, 128–137. [Google Scholar] [CrossRef] [PubMed]
  33. Lu, S.Y.; Wu, F.C.; Lu, Y.F.; Xiang, C.S.; Zhang, P.Y.; Jin, C.X. Phosphorus removal from agricultural runoff by constructed wetland. Ecol. Eng. 2009, 35, 402–409. [Google Scholar] [CrossRef]
  34. Toet, S.; Bouwman, M.; Cevaal, A.; Verhoeven, J.T.A. Nutrient removal through autumn harvest of Phragmites australis and Thypha latifolia shoots in relation to nutrient loading in a Wetland System used for polishing sewage treatment plant effluent. J. Environ. Sci. Health A 2005, 40, 1133–1156. [Google Scholar] [CrossRef]
  35. Oliveira, E.C.A.; Freire, F.J.; Oliveira, R.I.; Oliveira, A.C.; Freire, M.B.G.S. Accumulation and allocation of nutrients in sugar cane. Rev. Cienc. Agron. 2011, 42, 579–588. [Google Scholar]
  36. Lopez-Hernandez, D.; Sequera, D. Phosphorus biogeochemical cycling in a sugar cane agroecosystem. Am. J. Agric. Biol. Sci. 2012, 7, 473–481. [Google Scholar]
  37. Brix, H. Do macrophytes play a role in constructed treatment wetlands? Wat. Sci. Technol. 1997, 35, 11–17. [Google Scholar] [CrossRef]
  38. Van Antwerpen, R. Sugarcane root growth and relationships to above-ground biomass. Proc. S. Afr. Sugar Technol. Assoc. 1999, 73, 89–95. [Google Scholar]
  39. García, J.; Rousseau, D.P. L.; Morató, J.; Lesage, E.; Matamoros, V.; Bayona, J.M. Contaminant removal processes in subsurface-flow constructed wetlands: A review. Crit. Rev. Environ. Sci. Technol. 2010, 40, 561–661. [Google Scholar] [CrossRef]
  40. Zhang, D.Q.; Jinadasa, K.B.S.N.; Gersberg, R.G.; Liu, Y.; Ng, W.J.; Tan, S.K. Application of constructed wetlands for wastewater treatment in developing countries—A review of recent developments (2000–2013). J. Environ. Manag. 2014, 141, 116–131. [Google Scholar] [CrossRef] [PubMed]
  41. Kadlec, R.H.; Wallace, S.D. Treatment Wetlands, 2nd ed.; CRC Press: Boca Raton, FL, USA, 2008. [Google Scholar]
  42. Bhatia, M.; Goyal, D. Analyzing remediation potential of wastewater through wetland plants: A review. Environ. Prog. Sustain. Energy 2014, 33, 9–27. [Google Scholar] [CrossRef]
  43. Shelef, O.; Gross, A.; Rachmilevitch, S. Role of plants in a constructed wetland: Current and new perspectives. Water 2013, 5, 405–419. [Google Scholar] [CrossRef]
  44. Vymazal, J. Plants used in constructed wetlands with horizontal subsurface flow: A review. Hydrobiologia 2011, 674, 133–156. [Google Scholar] [CrossRef]
  45. Collison, R.S.; Grismer, M.E. Nitrogen and COD removal from septic tank wastewater in subsurface flow constructed wetlands: Plants effects. Water Environ. Res. 2015, 87, 1999–2007. [Google Scholar] [CrossRef] [PubMed]
  46. Grismer, M.E.; Shepherd, H.L. Plants in constructed wetlands help to treat agricultural processing wastewater. Calif. Agric. 2011, 65, 73–79. [Google Scholar] [CrossRef]
  47. García, J.A.; Paredes, D.; Cubillos, J.A. Effect of plants and the combination of wetland treatment type systems on pathogen removal in tropical climate conditions. Ecol. Eng. 2013, 58, 57–62. [Google Scholar] [CrossRef]
  48. Sarmento, A.P.; Borges, A.C.; Matos, T. Effect of cultivated species and retention time on the performance of constructed wetlands. Environ. Technol. 2013, 34, 961–965. [Google Scholar] [CrossRef] [PubMed]
  49. Sehar, S.; Sumera, S.; Naeem, S.; Perveen, I.; Ali, N.; Ahmed, S. A comparative study of macrophytes influence on wastewater treatment through subsurface flow hybrid constructed wetland. Ecol. Eng. 2015, 81, 62–69. [Google Scholar] [CrossRef]
  50. Bezbaruah, A.N.; Zhang, T.C. Quantification of oxygen release by Bulrush (Scirpus validus) roots in a constructed treatment wetland. Biotechnol. Bioeng. 2005, 89, 308–318. [Google Scholar] [CrossRef] [PubMed]
  51. Colmer, T.D. Long-distance transport of gases in plants: A perspective on internal aeration and radial oxygen loss from roots. Plant Cell Environ. 2003, 26, 17–36. [Google Scholar] [CrossRef]
Scheme 1. Description of the experimental set up, with identification of the four pilot-scale CWs. The circles with crosses represent the positions of the sugarcane plants in the planted CWs. T1 to T4 are the four pilot-scale CWs. PP represents a peristaltic pump with four channels and WT two connected wastewater feed tanks.
Water 08 00093 g008
Figure 1. Picture of the two sugarcane planted CW systems: (a) CW T1 filled with the clay brick fragments (October 2013); (b) CW T3 filled with the Moleanos fragments (October 2013); (c) close picture of sugarcane and the filling material CBF in the CW T1 (August 2013); (d) close picture of sugarcane and the filling material FML in the CW T3 (August 2013).
Water 08 00093 g001
Figure 2. Sugarcane average stalk height in the two planted CW systems.
Water 08 00093 g002
Figure 3. Sugarcane stalk height growth rate in the two planted CW systems.
Water 08 00093 g003
Figure 4. Sugarcane average stalk diameter in the two planted CW systems.
Water 08 00093 g004
Figure 5. Sugarcane average foliar area in the two planted CW systems.
Water 08 00093 g005
Figure 6. Efficiency for phosphorous compound removal from wastewater by the two pilot-scale CWs planted with sugarcane. The dashed lines represent the planting and harvesting dates.
Water 08 00093 g006
Figure 7. Apparent contribution of sugarcane plants to the phosphorous compounds removal from wastewater. The data represents the difference between the removal efficiency of the planted CWs and the reference non-planted CWs.
Water 08 00093 g007
Table 1. Sugarcane growth indicators, estimated sugar production and accumulation of P in the aerial parts of the plants.
CWAbove Ground Biomass a (kg)Number of New ShootsNew Shoots Fraction of BiomassStalks Fraction of Biomass°BrixEstimated Sucrose Production (kg)P in the Plants’ Aerial Parts (g)
T1 (CBF)16.21030.7%77.8%13.251.48.2
T3 (FML)10.4211.5%74.3%13.670.85.4
Note: a Stalk and leaf wet weight.
Table 2. Average TP, TN and COD removal efficiencies and average pH at output stream for the sugarcane pilot-scale CWs.
Analyzed ParametersCW T1CW T2CW T3CW T4
Clay Brick Fragments Filling. Sugarcane Planted CW.Clay Brick Fragments Filling. Unplanted CW.Fragmented Moleanos Limestone Filling. Sugarcane Planted CW.Fragmented Moleanos Limestone Filling. Unplanted CW.
TP removal (%)77 ± 469 ± 268 ± 358 ± 2
TN removal (%)60 ± 1255 ± 1258 ± 751 ± 14
COD removal (%)58 ± 1866 ± 1364 ± 1477 ± 17
pH at output stream7.6 ± 0.27.8 ± 0.17.8 ± 0.27.8 ± 0.1

