Article

Modeling of Andean Páramo Ecosystems’ Hydrological Response to Environmental Change

Stockholm Environment Institute, US Center, Somerville, MA 02144, USA
*
Author to whom correspondence should be addressed.
Water 2016, 8(3), 94; https://doi.org/10.3390/w8030094
Submission received: 4 December 2015 / Revised: 2 March 2016 / Accepted: 3 March 2016 / Published: 10 March 2016

Abstract

:
In the Peruvian Andes, water infiltration from tropical wetlands, called páramo, generates headwaters for downstream rivers. The hydrological processes of these wetlands are not well understood within the larger hydrological system, impeding efforts to mitigate the rapid environmental changes anticipated due to regional population growth and climate change. This study constructed and calibrated a Water Evaluation and Planning (WEAP) system model for ecosystems with sparse data in the Quiroz-Chipillico watershed in the Piura region of Peru. The model simulates the impacts of possible changes within the hydrological system to assist decision-makers in strategizing about sustainable development for the region, especially the páramo. Using scenarios designed with stakeholder participation, the WEAP model for the Quiroz-Chipillico watershed examines river headflow production, reservoir water levels, and demand coverage for downstream users when the upstream páramo and its environs are subjected to changes of temperature, precipitation, and land use. The model reveals that while temperature and precipitation changes can be expected to impact páramo water production, the anticipated land use changes will be a primary driver of hydrological responses in the páramo and subsequent changes downstream.

1. Introduction

Andean landscapes have sustained human habitation and alteration for five to 10 millennia as people used the land for farming or grazing [1]. The Andes Mountains of Peru, Bolivia, Ecuador, Colombia, and Venezuela host a unique ecosystem of tropical alpine wetlands called páramo in a discontinuous belt covering roughly 36,000 square kilometers [2]. The countries with páramo ecosystems support roughly 100 million people and are projected to grow to 135 million by the mid-century [3]. Josse et al. [4] estimate that a subset of 40 million people depend directly on the tropical Andean ecosystems for their water resources.
The páramo is among the least studied and described ecosystems of the world [5] and is in a region currently witnessing the retreat of glacial icecaps [6,7], the disappearance of high altitude water bodies, and the occurrence and rapid spread of natural and man-induced forest fires [8]. The implications of these rapid changes will register on both local and regional scales. Land use and climate changes are already underway; however, the páramo ecosystem’s response and its potential impact on numerous dependent downstream communities has yet to be reliably predicted.
The páramo serves as the region’s headwaters by collecting, storing, and supplying water for downstream users. Surface water from the páramo is crucial for local water supply in some communities [9] and provides supply stability during seasonal variations.
However, due to the geophysical diversity within the páramo and limited data availability, the páramo’s hydrological processes remain poorly understood despite its importance to local hydrology, ecosystem services, and socioeconomic factors downstream. A better understanding of the páramo’s hydrology may encourage interventions to minimize destructive changes.
The objective of this study was to evaluate possible impacts on the páramo ecosystem from land use changes, climate variability, and other exogenous factors. To accomplish this, the study simulated the hydrological processes of the páramo ecosystems in the Quiroz-Chipillico watershed in Piura, Peru, using the theory of integrated water resource management (IWRM).
This study convened basin stakeholders in the Quiroz-Chipillico watershed of Peru to identify management goals for the region’s water availability and to implement a Water Evaluation and Planning (WEAP) system model to examine future conditions in the watershed with respect to those goals. Over three workshops between February and November of 2012, watershed stakeholders, decision makers, and local experts engaged with the WEAP model of the Quiroz-Chipillico watershed to evaluate the future impacts of policy decisions such as ecosystem conservation or agriculture expansion on water resources availability. In particular, during the third and last workshop, stakeholders participated in validating the model output and reviewing and interpreting the results.
Alterations in páramo ecosystems due to climate change and human intervention (see [9]) affect both the local hydrological balance and the resultant streamflows that supply water for species, ecosystems, communities, and infrastructure. Thus, changes in the páramo ecosystems should be expected to exert many impacts downstream. This study included a detailed analysis of the páramo ecosystems and revealed that the current trends of land use change will be more detrimental to the páramo than the anticipated changes in temperature and climate.

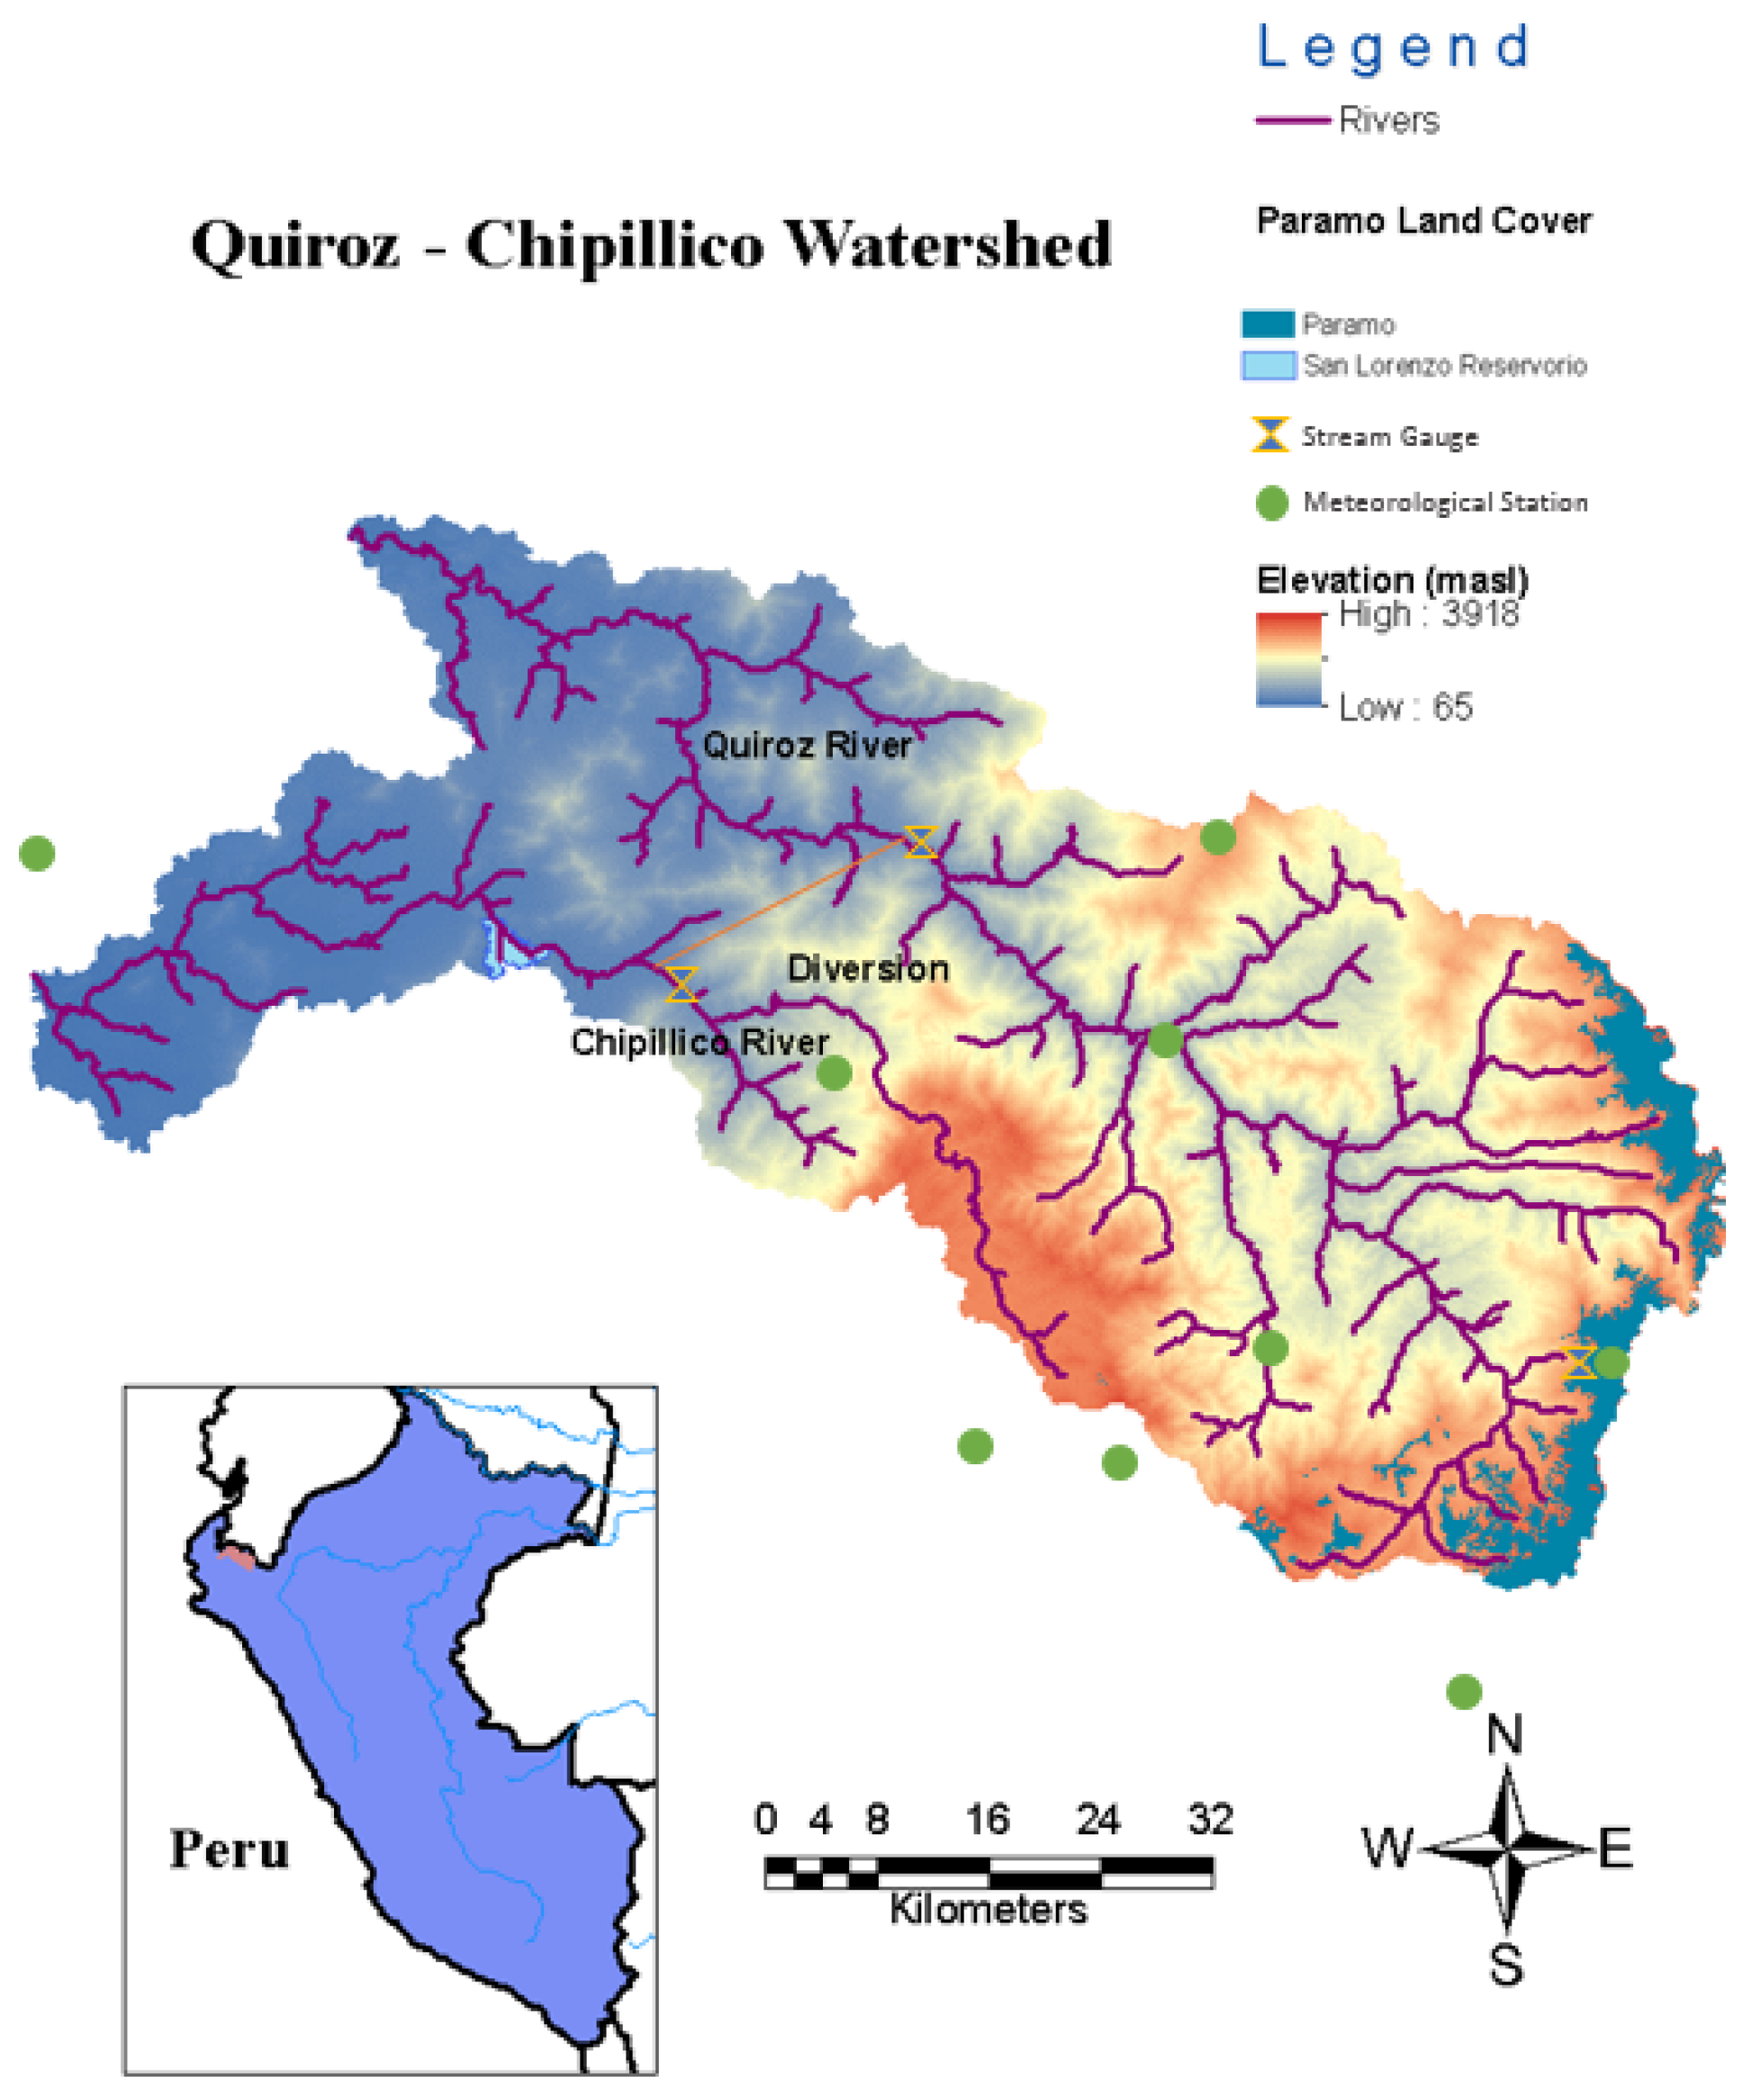
2. Study Site and Key Introduction Páramo Hydrology Components

The páramo is an exceptionally diverse ecosystem due to its spatially distinct environments and their discontinuous configuration. The unique biology leaves the páramo particularly vulnerable to perturbation by minor changes in meteorological, hydrological, and biological processes [10], changes that can potentially disrupt delicate balances developed over millennia. The diversity of the páramo ecosystems underscores their fragility and lends them high value for scientific study.
The land use surrounding the páramo ecosystems differs by region. In the Piura region of Peru, the subtropical desert of Sechura and savanna-like scrub tropical dry forests border the páramo ecosystem. Piura also contains small valleys with irrigated and rainfed agriculture, which constitutes a main economic activity of the region and influences the hydrological response of the downstream system.
The páramo are now subject to a variety of anthropogenic changes, including local land use and global temperature changes. Recently, however, these changes have accelerated. Human activities generate additional socioeconomic benefits, but risk damaging the very systems that support them. Land use changes affect the ecosystems and can hinder the production of water [11]. Such changes have produced habitat loss, fragmentation, and land degradation [12], and the impacts are not yet fully understood. Most of the extensive alterations of natural habitats in the Northern Andes have occurred since the beginning of the 20th century [13]. Intensified activities, including cattle grazing, cultivation, and pine planting, among others, threaten to severely alter the hydrological regime [9].
The effects in high elevation tropical locales like the páramo are not well represented in current global General Circulation Models (GCMs), partially because the models’ coarse spatial resolution cannot adequately capture the Andean narrow and rugged topography [14,15]. GCMs downscaled for the region predict rising temperatures for the páramo, and Vuille and Bradley [16] corroborated this when they documented a rise of 0.11 °C per decade from 1961 to 1990 in the tropical Andes. The temperature rise escalated to 0.34 °C per decade in the last 25 years of the 20th century, although some variability appears to be related to the El Niño South Oscillation. The GCM models also predict longer or more pronounced drier seasons. These changes could cause significant shifts in páramo biodiversity and its ability to supply water [10], as well as reduce its total area [5].
The Piura region is located in the northern Andes of Peru on the border with Ecuador. Within Piura, the Quiroz-Chipillico watershed has an area of 4280 km2 with an elevation range from 65 to 3950 meters above sea level. Such topographic variation creates temperature and precipitation gradients, with an annual average precipitation of 700 mm in the lower watershed and 1980 mm in the high elevations.
Table 1 gives descriptive statistics for the Quiroz-Chipillico watershed. Roughly 5% of the watershed is covered by the páramo ecosystem, which contributes a significant and relatively stable flow to downstream water resources. During dry seasons, the páramo can contribute up to 50% of the flow downstream [17].

3. Methodology

This study uses a model to simulate the hydrological processes of the páramo ecosystems in the Quiroz-Chipillico watershed in Piura, Peru (Figure 1). The model represents the water infrastructure and management of the system and includes a hydrological component capable of simulating the hydrological processes.

3.1. Building the Model

The project assembled local decision-makers and stakeholders to solicit data and management objectives and describe future management changes under consideration. Stakeholder inclusion in the watershed characterization process for the model was meant to ensure that any results produced would be relevant to the needs and concerns already expressed by local managers. These activities supported incorporating decision-making processes within the model while accounting for the different water demands and water supplies.
Though many of the physical characterizations of the watershed could be obtained through publicly available sources, data for demand, model assumptions, and most importantly future scenarios were obtained through these stakeholder workshops. The scenarios included diverse views regarding the future of the watershed, and, when implemented in the watershed model, produced results relevant to all the parties involved. The joint scenario exploration aimed to frame water resources management in a more harmonious and environmental sustainable way.
Remote sensing data has expanded opportunities for monitoring the tropical Andes (see [18]), but many challenges remain, such as the high number of sparse ungauged watersheds. Additionally, the existing gauges disproportionally favor locations near populated areas of water demand rather than those important to water supply [10]. The lack of complete datasets of páramo hydrology and the need to understand the vulnerabilities of páramo water supply call for a method that can provide information using existing data and at the watershed scale.
This study uses the Water Evaluation and Planning (WEAP) system model [19,20] to simulate water supply, allocation, and infrastructure for watersheds. WEAP allows users to create spatially-based models that calculate hydrological changes by incorporating evolving climate conditions and human-managed infrastructure. The resolution of hydrological units in WEAP can be adjusted based on the density of climatic stations available. As such, in regions with sparse data, the number of hydrological units can be lower, but still linked to the representation of a complete watershed.
In a WEAP model, water infrastructure and allocation can be dynamically nested within the underlying hydrological processes. Thus the impacts of specific infrastructural configurations and priorities of water allocation for different water uses can be analyzed using weather data and physical watershed conditions. WEAP allocates available supplies at each time step based on user-defined demand priorities and supply preferences [19]. Demands, reservoir storage, and instream flow requirements are assigned integer priority numbers, ranging from 1 (the highest priority) to 99 (the lowest priority). All the demand sites in the Quiroz-Chipillico watershed model, including irrigated agriculture and instream flow requirements, have a priority of 1, which forces WEAP to divide between them evenly in terms of percentage of demand met during times of shortage.
WEAPs represents the terrestrial water cycle with a series of simultaneously solved equations in a rainfall–runoff module [19]. The module is able to capture variability in the hydrological cycle, including the páramo’s hydrological response. Yates et al. [20] apply a similar methodology using a one-dimensional, two-storage soil water accounting scheme that partitions rainfall into surface runoff or infiltration, depending on land cover, while calculating the soil moisture status. Moisture in the root zone is partitioned into evapotranspiration (ET), sub-surface runoff, deep percolation, or storage as a function of soil water capacity, hydraulic conductivity, potential ET, and vegetation-specific ET coefficients. Deep percolation enters a second soil compartment and is modeled as base flow or deep soil moisture storage, depending on soil moisture storage status, the deep compartment’s water retention capacity, and the hydraulic conductivity of the deep sediments. This representation of catchment hydrology is suitable for mountainous hydrology like that of the study region [20].
Páramo ecosystems have a high water retention capacity which is attributed to their soils [21] and slow water release. However, the land surrounding the páramo ecosystems has a complete different hydrological response. This hydrological response is a direct result of the meteorological conditions in combination with topography (smooth in the coast and rough at higher altitudes), soils, vegetation (subtropical desert vegetation in the low altitudes to savanna-like scrub tropical dry forest at higher altitudes), and the different types of land use (natural vegetation, irrigated and rainfed agriculture) that produce different hydrological responses than the páramo ecosystems. A model for the hydrological processes of the páramo ecosystems has not been used in the region.
To properly represent these different and complex hydrological processes, two WEAP models were developed for the Quiroz-Chipillico watershed. A daily time step model can simulate the particular hydrological processes of the páramo and their corresponding drainage area to reproduce headflows. This requires daily meteorological data for model input. A second model runs in monthly time steps and covers the remaining area of the Quiroz-Chipillico watershed surrounding the páramo. This WEAP model uses monthly meteorological data and incorporates the first model’s output with the watershed’s remaining hydrological responses, including those related to human-built infrastructure and to the defined types of land use: natural vegetation, irrigated and rainfed agriculture. See Table 2 for sources of digital data for the study site. This second WEAP model for the Quiroz-Chipillico watershed serves as the study’s decision support system: a fully integrated hydrological simulation model that includes robust and flexible representations of water demands from all sectors. It can implement the impacts of different management priorities for infrastructure elements such as reservoirs, diversions, environmental flows, canals, etc. (Table 2).

3.1.1. Catchment Delineation

The process for defining the catchments, including size and land use type, within the Quiroz-Chipillico watershed model followed the same methodology described by [22]. It consists of four steps: (1) delineation of watersheds and elevation bands using a DEM; (2) intersection of elevation bands with watersheds to create WEAP catchments; (3) classification of vegetation; and (4) intersection of vegetation, and watersheds to calculate fractional areas for each vegetation combination in each catchment node. For the model, a 30 m DEM was obtained from NASA’s Earth Observing Systems Data and Information System to delineate elevation bands every 500 masl. The intersections of elevation bands and subwatersheds in the Quiroz-Chipillico watershed produced 107 catchments. The Regional Government of Piura provided the shape file layer with 2010 land cover information for the Quiroz-Chipillico watershed. This became six classified land cover types: páramo, forest, non-forest, fruit trees, and irrigated and rainfed agriculture (Table 2). The classifications derive from general similarities in hydrological properties such as transpiration rates and runoff characteristics.
With the classification complete, the fractional areas for vegetation in each catchment node were estimated using an intersection of classified vegetation with the elevation bands. The results were used to characterize the WEAP model the Quiroz-Chipillico watershed.

3.1.2. Meteorological Data

The meteorological data require time series for temperature, precipitation, humidity, and wind speed at daily time steps for the páramo catchments and monthly time steps for the remaining catchments without páramo.
The Quiroz-Chipillico watershed model used daily and monthly historic time series data obtained from nine different meteorological stations located within or closely bordering the watershed. These stations are operated by national and regional agencies and provided historic records spanning from 1980 to 2010 for both daily and monthly time series (Table 2). Average daily and monthly observations supplemented any missing data in the time series. This is a standard assumption made when attempting to model watershed systems. While this assumption followed other examples in the literature, we recognize that they introduce points of uncertainty into the model. Because only páramo catchments required daily data, monthly time series for other catchments used aggregated data or monthly data where meteorological stations have monthly data available.

3.1.3. Demands

The Quiroz-Chipillico study area’s demands consist of four irrigated units and one municipal demand, all of which are represented in the model. The irrigation areas totals to 27,400 ha and the municipal demand site (Distrito Las Lomas) has 26,418 inhabitants for the year 2005 (Table 1). The Quiroz-Chipillico watershed model also includes the San Lorenzo reservoir which moderates the supply for these demands.
Annual and perennial crop weights determine the agricultural water demands. The Quiroz-Chipillico watershed model uses the annual volume equivalent to 0.2–0.5 liters/second/ha as agricultural water demand. The agricultural demands use representative irrigation schedules for different crops to approximate general irrigation practices in the region.
Local water authorities, stakeholder associations, and regional and national water authorities provided water demand data to characterize these demands (Table 2).

3.2. Building Scenarios for the Quiroz-Chipillico Watershed Model

A climate-informed water resources framework can help manage the complexity of water resources by studying future trends of climate variability, uncertainties, and other stressors [19,20] as model scenarios. Scenario modeling compares the future without change (“reference scenario” or “base line”) and futures with climate, infrastructure, or policy change. Selecting scenarios to model requires an understanding of the possibilities of future circumstances in the watershed under examination. Such simulations can enhance the understanding of the páramo’s ecosystems to assist policy makers in understanding which contributions and direct actions will effectively minimize ecosystem damage and support system performance.
Consequently, local actor participation is crucial for scenario development [23,24]. The modeling process in Piura began with participatory workshops with key regional actors, decision makers, and stakeholders from the Quiroz-Chipillico watershed to solicit knowledge sharing. Workshop participants were identified as key actors in the watershed and invited to share their knowledge about watershed conditions and possibilities. The 41 participants included 27 representatives from public institutions, seven people from research groups, and seven from the private sector, respectively. Participatory activities were led with the support of local facilitators and included one workshop, one training, and one data socialization event. Within the activities, participants defined (1) uncertainties and stressors that impact availability of water resources; (2) potential policy adaptation strategies to improve existing conditions; and (3) the metrics and indicator measures for judging the success of the strategies.
To identify these factors, the participatory workshop used the XLRM assessment framework (exogenous uncertainties, policy Levers, Relationships, and Measures) [25]. The “R” component is comprised of the WEAP model that simulates the Quiroz-Chipillico watershed. Within the XLRM discussion, the potential levers identified included a wide range of options such as conservation, infrastructure, and agriculture interventions. Although some of these options imply development actions, it is possible through the process to identify the adaptive capacity of these options. Following lectures, round table discussions, brainstorming activities, and presentations over about eight hours in two days, the participants specified the remaining three elements of the XLRM table. Table 3 shows the results of the discussions.
The results of the XLRM assessment framed the design and implementation of the scenarios in the model, as described in [17]. Following the XLRM assessment, we defined six scenarios that examined changing páramo area and reforestation, population growth rates, infrastructure improvement, irrigation efficiency, and a reservoir implementation to compare against the model’s reference scenario between the years 2010 and 2060.
Quantifying the scenarios required numerical values to represent the changes in these characteristics. To model changes in land use area, WEAP uses parameters in the Penman-Monteith method [26] to estimate potential evapotranspiration and simulate soil water evaporation as a function of relative soil moisture. The parameters include Kc and soil characteristics like the runoff resistance factor and soil water capacity [19] (see Table 4, below). Each land use type has its own parameters, and with these parameters in place, the model specifies an area (km2) for each land use type. These areas can be changed within the model’s scenarios.
Values for a 30% linear decrease in the páramo’s area and a 30% linear increase in reforestation came from the stakeholder workshop, agreed upon by stakeholders in consensus follow an evaluation of the existing data. The factors driving land use change include activities such as cattle grazing, cultivation, and pine planting that alter the hydrological regime [9]. Cattle grazing is the main activity reducing the areas of the páramo ecosystem in the region. Other levels of potential area reduction were evaluated during the workshop and the group decided that the best option was to consider a worst case scenario of pressure over land at the páramo level. The group decided that these pressures are likely because with higher temperature at high elevations and land degradation at lower elevations, páramo land turns into a desirable new frontier cattle grazing. Therefore, the 30% reduction in páramo between 2010 and 2060 assumes a compensatory increase in natural grassland during the same period.
The model drew from conservative future climate change conditions for the region to simulate changes in climatic conditions. By 2012 when the study was implemented, the latest Intergovernmental Panel on Climate Change (IPCC) Assessment Report available was the 4th Assessment Report, thus this was implemented. Although new values from the IPCC’s 5th assessment reports are now available, IPCC’s 4th still provides a good representation of climate variability for the future in the region [27]. Precipitation changes were modeled as a 6% increase, a 2% decrease, or a 6% decrease, deduced as appropriate for the study site from the IPCC [27] report for the B1 scenario in the Amazon region. The Amazon region was selected because it is the closest region with IPCC reports describing potential climate change effects. The IPCC 4th Assessment Report provides quantifying temperature increases of either 1.5 °C or 2.5 °C for the region. The stakeholders supported examination of the B1 scenario and consequently the corresponding range of values selected for precipitation and temperature. Stakeholders were aware that the watershed could experience more adverse conditions over time; however, they opted to explore these climate scenarios.
An interpolation method assigned input time series for each WEAP catchment object for the climate data. The historic time series were 20 years long; therefore to create a 50-year time series, data values were repeated every 20 years until a 50-year time series was completed. To simulate warmer and drier scenarios, the daily and monthly Quiroz-Chipillico watershed models followed [22] to create a precipitation and temperature forcing method. This produced time series of future climate data using a delta value, a constant value applied to the time series data in order to increase or decrease the values in a monthly and daily time step, respectively, for the watershed land surrounding the páramo up to the closing point in the downstream watershed.
Though almost all the model scenarios used the population growth of 0.9% from the National Institute of Statistics and Information, watershed stakeholders in the workshops expressed interest in evaluating a more extreme population growth of 2.0% (Table 4).
In the participatory workshop, water managers proposed modeling increasing efficiencies of irrigation. In the major canals distribution network, water managers suggested a 5% increase in efficiency as an outcome of improving infrastructure (Table 4).
According to water managers, irrigation efficiencies in water use can be improved 35%, depending on irrigation areas to reach 75% efficiency in all units through the implementation of irrigation technology (Table 4).
Lastly, the reservoir implementation modeled in the Quiroz-Chipillico watershed model involved many parameters, all of which were obtained from a local stakeholders association and the national water authority (Junta de Usuarios de San Lorenzo, Autoridad Nacional del Agua).
Following the procurement of the various quantifications, the changing circumstances were combined into six scenarios for modeling within the model. The optimistic and pessimistic (three and six, respectively) scenarios defined the critical upper and lower boundaries of probable change with a corresponding hydrological response. The reference scenario included neither the land use changes nor the climatic changes (Table 4).
Scenario 3 is the upper boundary or optimistic scenario with an increment in precipitation of 6% and an increment of 1.5 °C in temperature. The pessimistic scenario or lower bracket (Scenario 6) corresponds to a 6% decrement on precipitation with 2.5 °C increment in temperature. It is also the only scenario to model the 2% elevated population growth rate. The remaining four scenarios fall between the extremes of the optimistic and pessimistic scenarios.
The model scenarios specified possible ranges of the uncertainties imposed by climate change conditions, population growth, and changing per capita water demand. The model then simulated specific interventions identified by local stakeholders and decision-makers as options to reduce the negative effects of uncertainties. Modeling the uncertainties and interventions together enabled the model to simulate system performance results for the various metrics identified in the stakeholder workshop. Following an analysis with the model, the project presented the results to the local water managers to suggest the most appropriate types of interventions based on their stated needs.

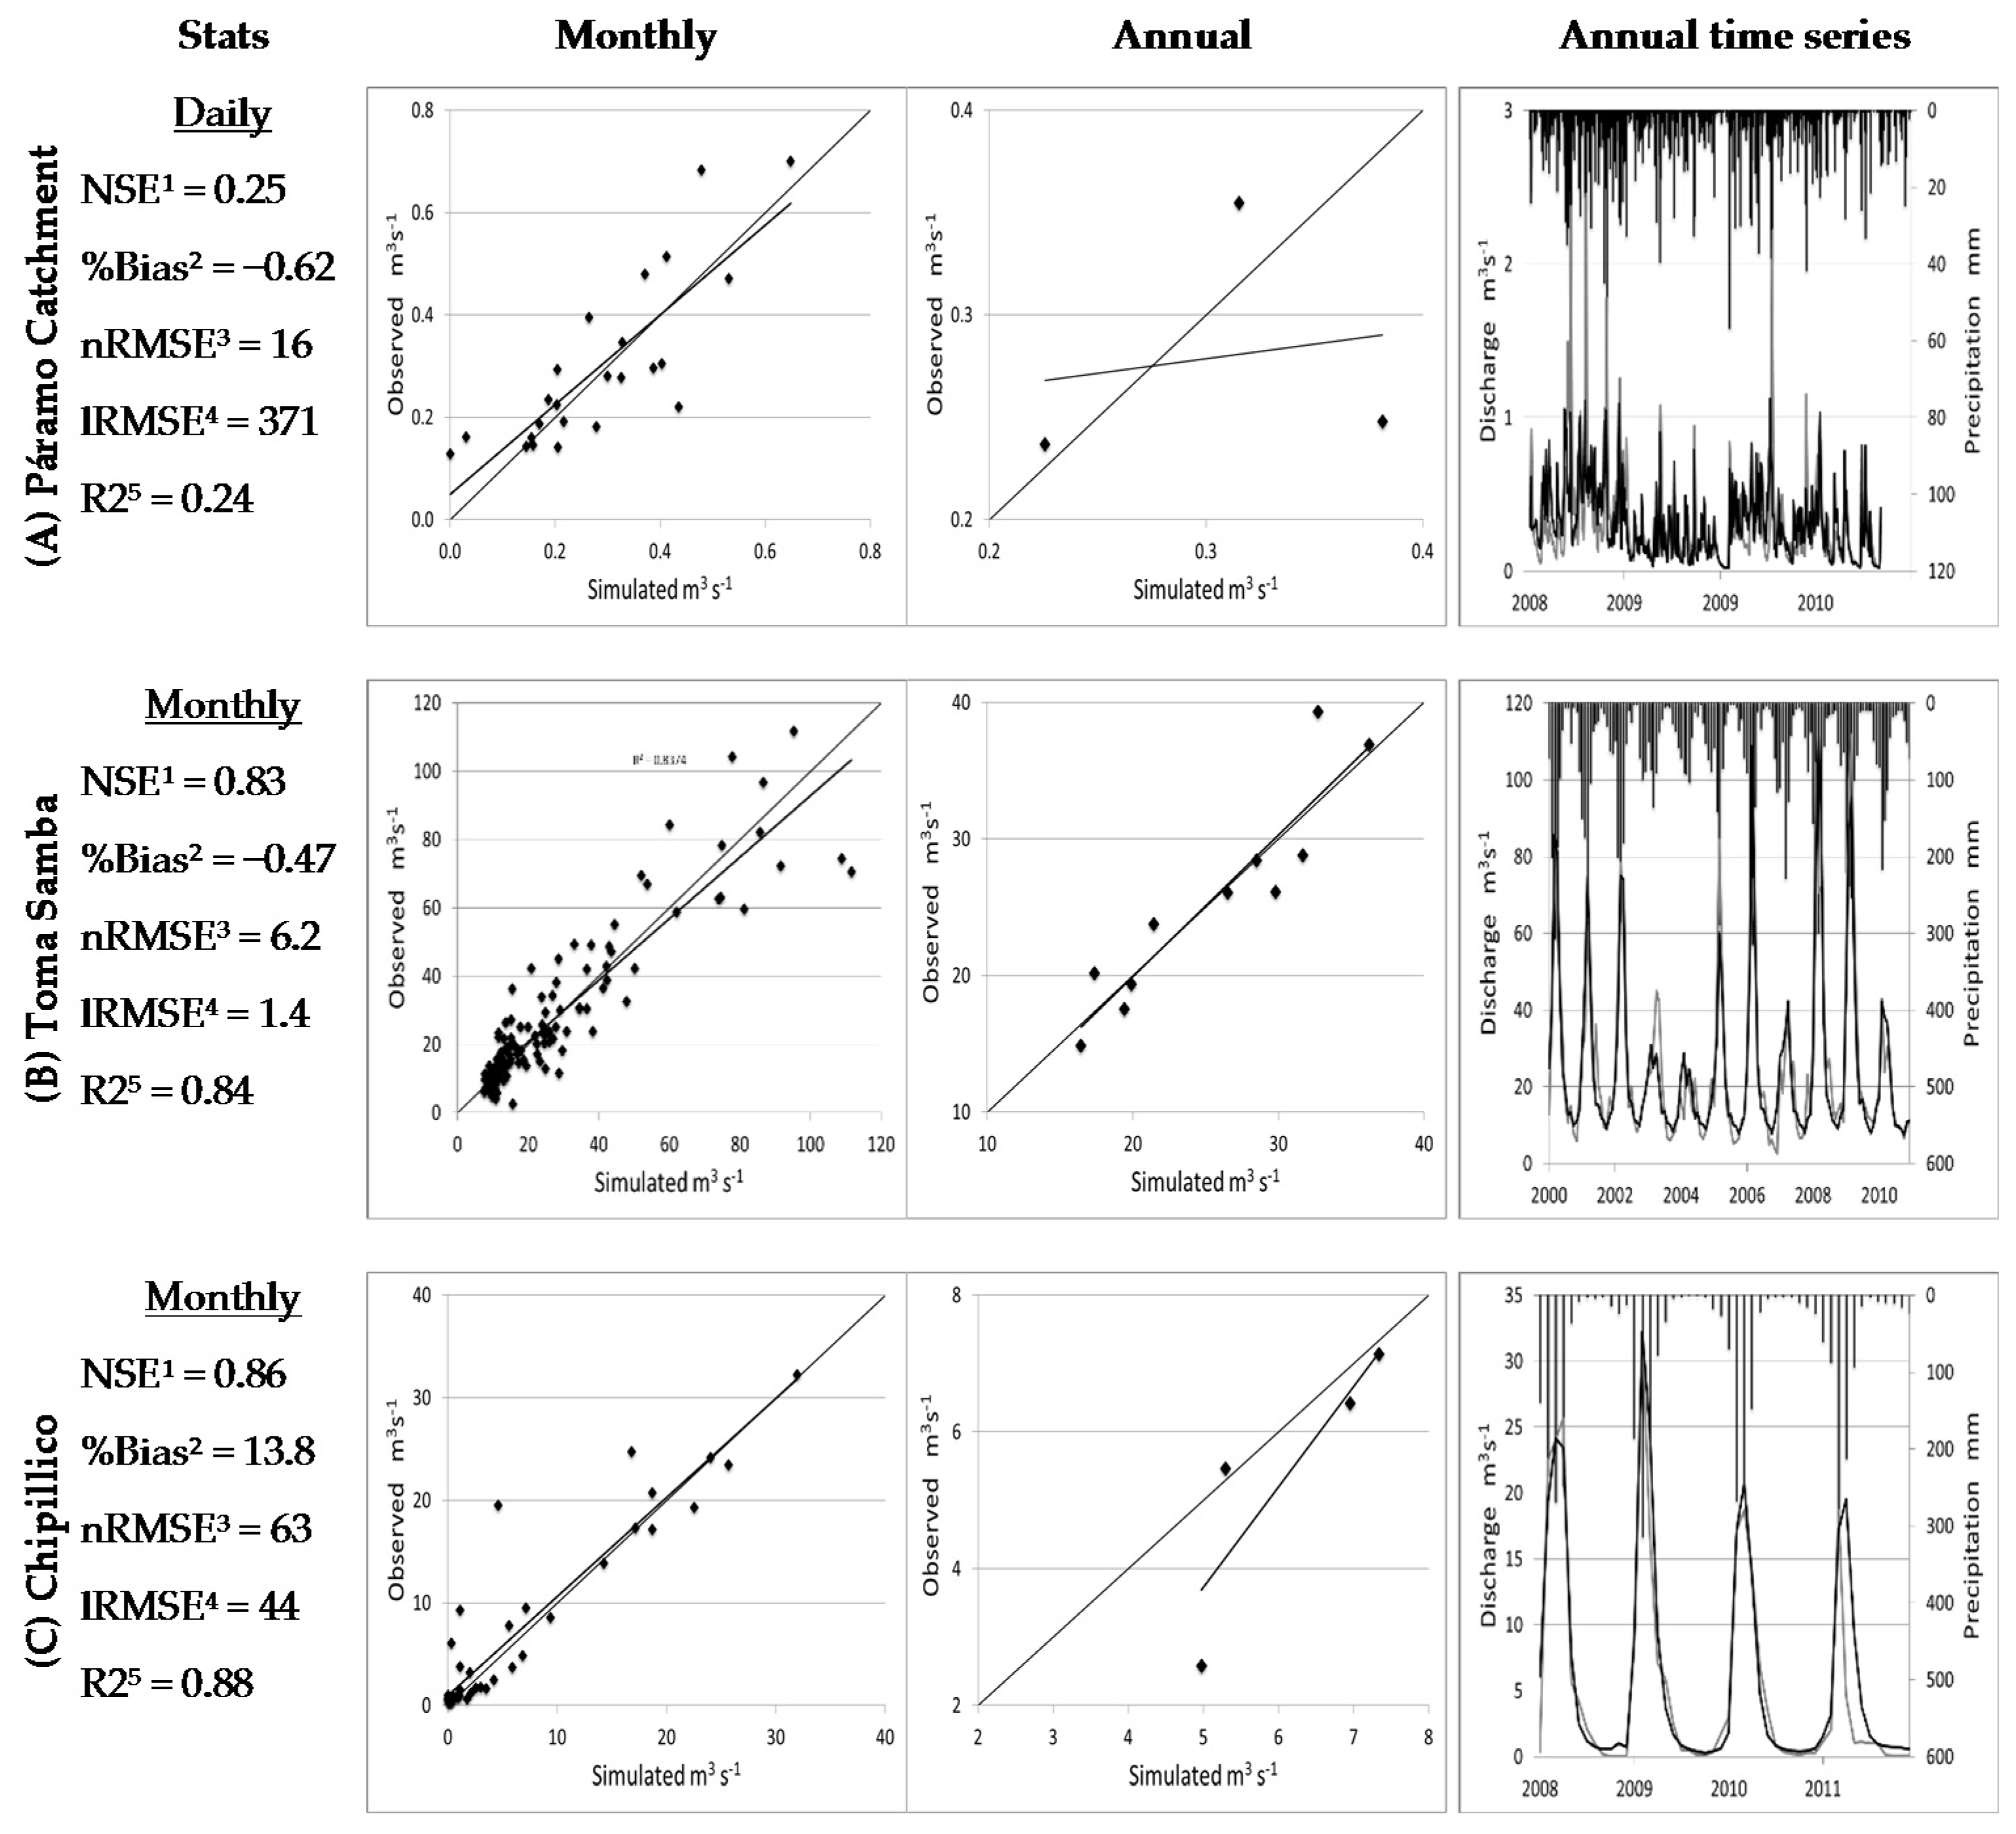
3.3. Model Calibration

The daily time step and monthly time step models were calibrated on two different scales: (a) the headflow’s catchments, and (b) the whole watershed. The headflow calibration scale reproduces the hydrological processes on a daily basis for the páramo by simulating the páramo’s discharges. The model calibration of streamflow discharge employed manual calibration techniques replicating daily and monthly values of observed streamflows. An initial set of calibrated parameters was developed for application across all different catchments to capture the seasonal and inter-annual variability of flow measurements across the models. The most sensitive model parameters were subsequently adjusted on a catchment-by-catchment basis, including soil water capacity and hydraulic conductivity for both shallow and deep layers to account for fine-scale differences in basin characteristics (Table 5). Land cover changes in the scenario analysis were expressed in terms of the area within which each land use’s parameters were applicable.
The Quiroz-Chipillico watershed model uses three streamflow gauges for calibration. One gauge calibrates the páramo’s catchment discharge on a daily basis (Figure 2A), measured at the outlet of a 604-hectare drainage area extending from 3157 to 3840 masl. Three tipping bucket rain gauges with loggers and one streamflow-gauge with a water level logger measured the páramo’s catchment discharge every 15 min. All collected data were transformed to one-day time series. Discharge data were available for calibration from 30 October 2008 to 4 September 2010 and precipitation data from 4 October 2008 to 11 August 2010 (675 days) from the data source Naturaleza y Cultura Internacional (Table 2).
The other two streamflow gauges that calibrated the Quiroz-Chipillico watershed model are downstream in the basin. Both have monthly streamflow data from 2000 to 2011. Toma Samba’s gauge (Figure 2B) is located in the Quiroz River and is used to calibrate the catchments draining into it, including the headflows of the páramo’s catchments before water is diverted to Chipillico River. The second gauge is Chipillico (Figure 2C) in the Chipillico River, upstream from the confluence with the Quiroz River. The streamflows observed at this gauge correspond to the model’s catchments without páramo and the data source was the Autoridad Nacional del Agua (Table 2).
This study followed the guidelines given in [28] for evaluating systematic quantification of watershed simulations. Among these is the Nash-Sutcliffe Efficiency (NSE), a normalized statistic that determines the relative magnitude of the residual variance compared to the measured data variance [29]. Values can range from −∞ to 1. An NSE value of 1 corresponds to a perfect match of observed to simulated streamflow. An NSE value between 0 and 1 is considered an acceptable level of performance, whereas an NSE value ≤0 suggests the observed average is a better predictor than the model.
The percentage bias (%Bias) compares the average tendency of the simulated data to the corresponding observed data [30]. The optimal value of %Bias is 0. A positive value indicates that the model has underestimated and a negative value indicates overestimation [30]. The coefficient of determination R squared (R2) indicates how well the data fit a linear statistical model and provides a measure of how well observed outcomes are replicated by a model, as the proportion of total variation of outcomes explained by the model. The statistical parameters of normalized root mean square error and log-transformed/normalized root mean square error were also estimated.

4. Results

4.1. Quiroz-Chipillico Watershed Model Performance

The Quiroz-Chipillico watershed model’s streamflow simulations during the years with available data showed an acceptable performance according to the statistical indicators. Calibration results of NSE for Toma Samba and Chipillico’s gauges (Figure 2B,C) show very good model performance (i.e., 0.75 < NSE < 1) and a low performance for the páramo’s catchment (NSE = 0.25) in the daily model (Figure 2A), which is incorporated in the monthly model. Despite this low NSE, we were encouraged by the monthly model’s performance statistics to use the daily mode’s estimates. Also, we acknowledge that a scenario-based study can be most useful to identify tendencies of change, and not the precise estimates that are achieved with more accurate model performance.
Similar results are observed with coefficient of determination R squared (0.75 < R2 < 1 for Toma Samba and Chipillico’s gauges and R2 = 0.24 for the páramo catchment). The %Bias value shows good performance (%Bias< ±15%) only for the Chipillico gauge. The first column in Figure 2 shows the model evaluation statistics for the model’s three river gauging stations, including normalized root mean square error, log-transformed/normalized root mean square error, and the R-squared coefficient of determination. The hydrograph at daily and monthly time steps showed reasonable agreement between the simulated and the observed streamflows at the three river gauging stations (Figure 2) according to the statistical indicators.
The model calibration used both the monthly and daily data in efforts to accurately reproduce the system’s base flows for the period of time from 2009 to 2010 with available data. The base flow discharges were well represented (Figure 2) but deviated for extreme events and high peak stream flows. This bias results from the fact that the priority is to capture base flow instead of high peak stream flows during the wet season. Base flow becomes very important to estimate properly especially during the dry season when base flows are of high interest for stakeholders in the lower watershed. During wet seasons there is an abundance of water, thus peak and base flows are not of much interest for stakeholders in the downstream watershed, so there is not a high priority to estimate them. An annual base flow water mass balance for the years of 2009 and 2010 indicates a difference of +8% and +0.1% for both years, respectively.

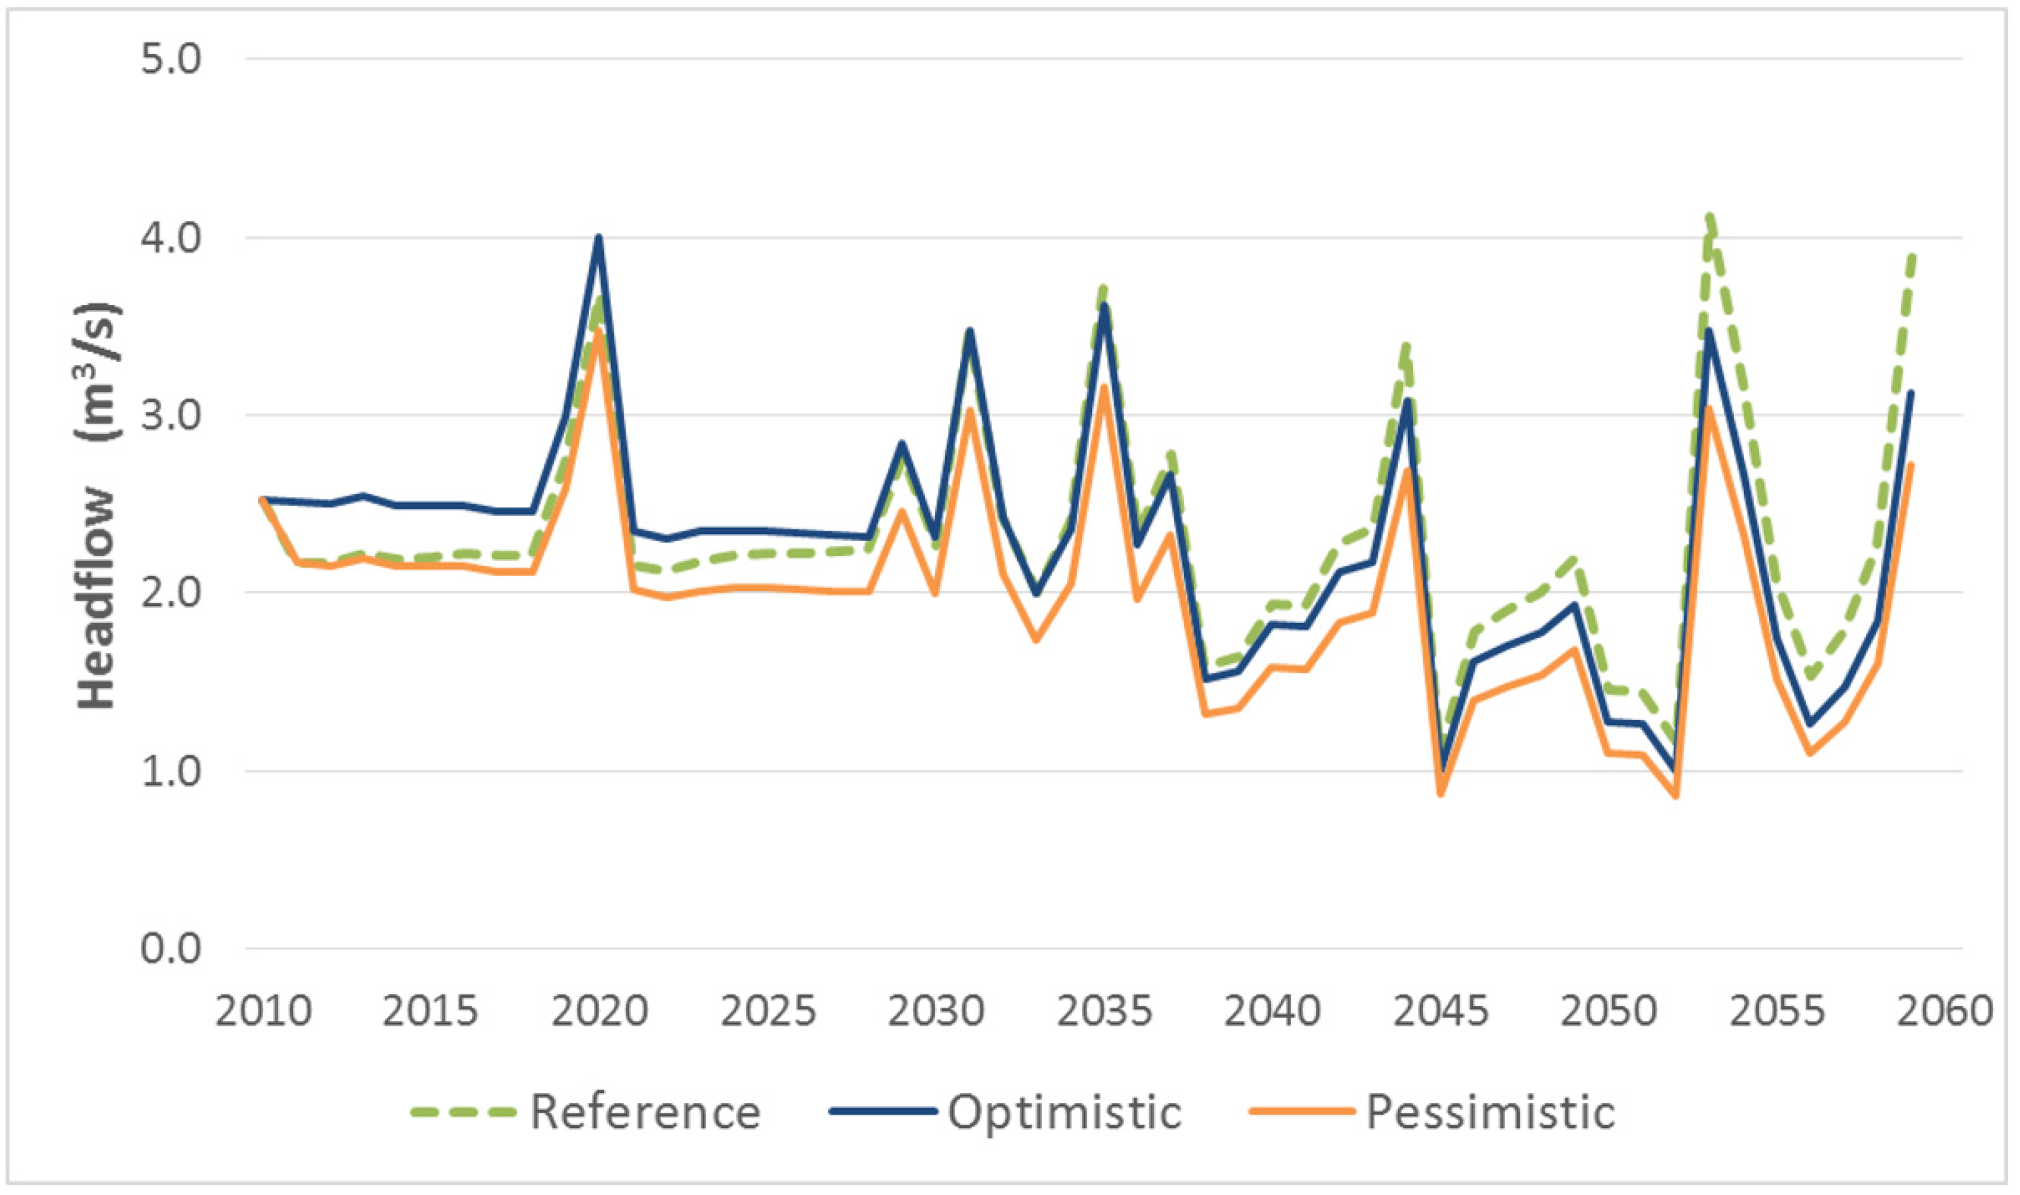
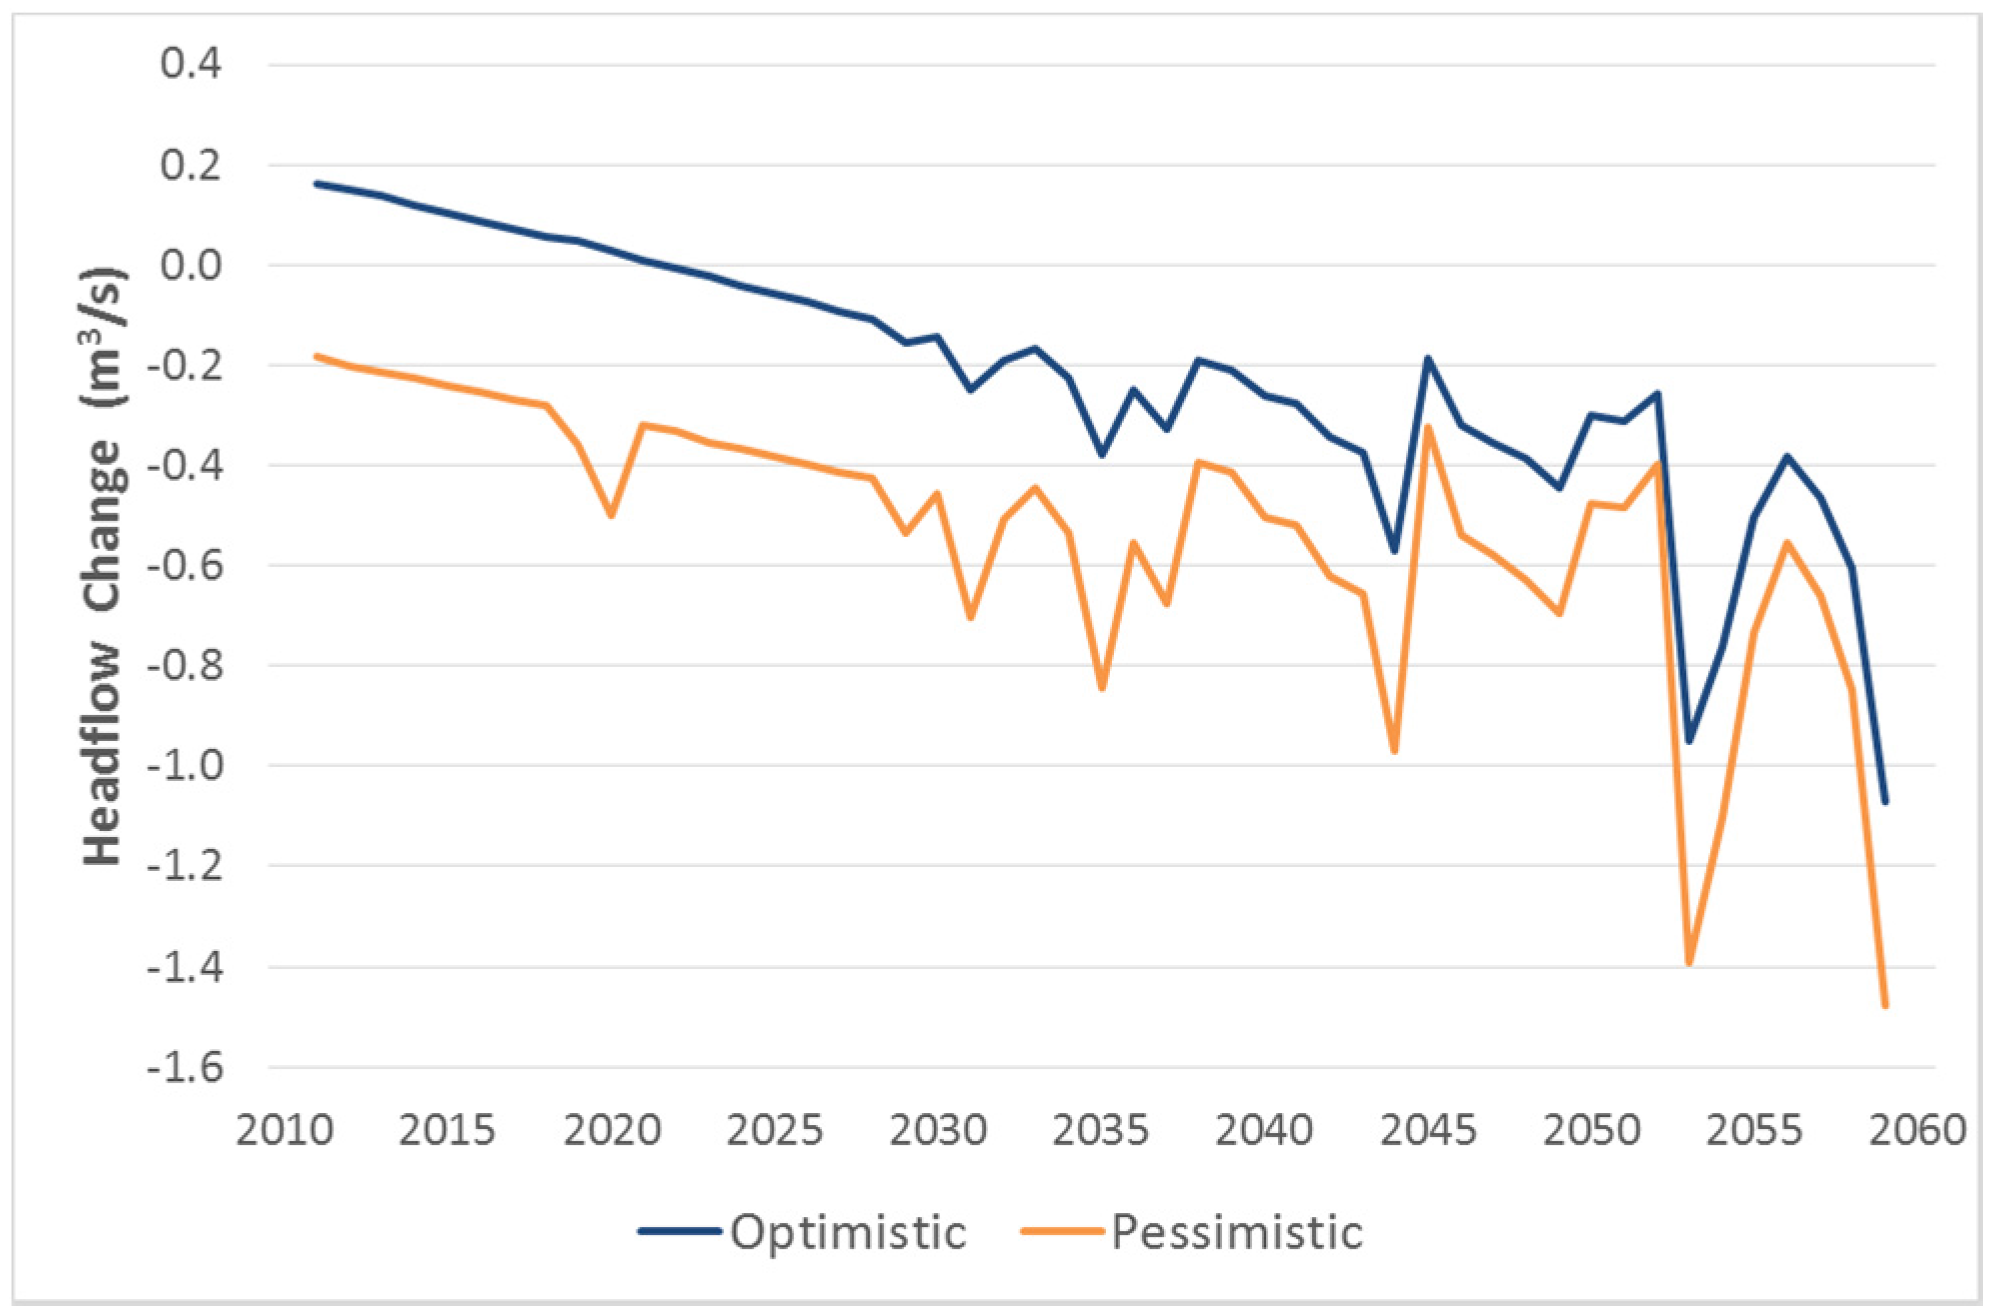
4.2. Páramo Headflows

The model simulates the páramo’s water production in response to changes in land use through a cumulative 30% reduction of the páramo’s area due to human activity over 50 years, climate variability in precipitation and temperature, and reforestation with native species (Table 4). In comparing the model’s land change scenario results to the reference scenario without land use or climatic changes (preserving the current conditions), the model’s headflow production shows significant hydrological response to these respective drivers. Figure 3 shows the páramo catchments’ headflows’ hydrological response to the drivers for the optimistic and pessimistic scenarios against the reference scenario that preserves the current conditions.
As Table 4 shows, only climate variability factors determined the difference between scenarios: land use change and reforestation factors were represented the same way for all six scenarios, while factors such as population growth would not impact headflow. Figure 3 shows that precipitation plays a significant role, altering headflow by +6% and −6% for the optimistic and pessimistic scenarios. The reference scenario has no changes at all.
The model shows a trend in decreasing water production over time during the optimistic and pessimistic scenarios (Figure 4).
During the optimistic scenario, there is initially a positive effect up to 2020 (Figure 4), deriving from the 6% increase in precipitation. However, water production decreases over time due to land use change and the progressive reduction of the páramo’s areas. A more negative effect is observed for the pessimistic scenario (Figure 4), with a possible water production decrease of 1.5 m3/s. These results show the potentially high negative impact that land use change and reduction in the páramo’s area would have on the headflow catchments and subsequently the Quiroz-Chipillico watershed. The impacted headflows would reduce the available base flow during the dry season and affect users downstream. Because the more dramatic results are seen between scenarios with different land usage, the model results indicate that, as a trend, precipitation plays a role (Figure 4) in determining headflows; however, land use change and reduction in the páramo’s area are the primary drivers of the hydrological response and subsequent changes in water production.

4.3. Water Demand Coverage

Predicting demand coverage at different water demand sites in the downstream areas of the watershed will help managers develop sustainable policies towards the páramo. WEAP uses the metric “Coverage” to measure the percentage of demand being met by the available supply over each time step. Values range from 0%, meaning no water access, to 100%, meaning full delivery of requirements. Flores-Lopez et al. [17] showed that in the Peruvian páramo, the ecosystems provide base flows during dry seasons that can amount to 50% of the streamflows and become the main water source for demand sites located downstream. However, in the Andean region, páramo water supply tends to exert localized impacts rather than basin-wide impacts. Different demand sites, such as irrigation areas, municipal and rural demand sites, etc. use water at different rates. As a major water user, agriculture may experience significant impacts from climate change as water availability and temperature change.
In the Quiroz-Chipillico watershed model, irrigation can consume as much as 100% of the water storage in the San Lorenzo reservoir. Thus, the storage volume in the San Lorenzo reservoir partially determines the agricultural demand coverage. The storage volume depends on streamflows, including from the páramo ecosystems. Figure 5 shows that the storage volume over time in the San Lorenzo reservoir is lower in the pessimistic scenario than the optimistic scenario. In some years the storage volume drops to the top of the inactive storage level in the reservoir, meaning no more water can be drawn from the reservoir. It is important to note that even the Quiroz-Chipillico watershed model’s optimistic scenario shows low storage volumes during the dry years.
In the five Quiroz-Chipillico watershed model irrigation demand sites, water demand coverage decreases with time in both the optimistic and pessimistic scenarios in comparison to the reference scenario. The unmet demand increases through time between 0% unmet demand at the beginning of the simulation (2010) to 5%–7% unmet demand by 2060 based on the annual average, as shown in Figure 6. This indicates the deleterious effects of decreasing páramo areas over time because less water is produced to feed streams and ultimately the San Lorenzo reservoir. A 5%–7% decrease in irrigation water demand coverage (Figure 6) is a significant number if we translate this number into actual values of production.

5. Discussion

Unreliable water supply can greatly impact the economies that depend upon it, especially when their predictive capacity is insufficient to support strategizing coping mechanisms, as is currently the case for agricultural use in the Quiroz-Chipillico. In this part of the Andes, farmers have developed small-scale agriculture [4] that is highly susceptible to changes in water availability.
In terms of practicality, there is little local policy planners can do related to large-scale climate change impacts. However, we have shown that halting the reduction of páramo ecosystems will assist with maintaining a positive water balance or at least maintaining a neutral balance that can meet agricultural water demands, especially during critical times such as the dry season.
Derived from the provision of key ecosystem services, páramo ecosystems have socioeconomic importance, which may increase with climate change. Water availability country-wide in Colombia may suffer from bottlenecks by 2015–2025, which will also affect the páramo [31]. Chuquisengo Vásquez [32] estimates that throughout Peru, 60% of the population will be affected by lower water availability, and Marengo et al. [33] apply the same figure to hydroelectric power. Unreliable water supply can greatly impact the economies that depend upon it, especially when their prediction capacity may not be sufficient to allow formulation of adequate coping mechanisms.
The Quiroz-Chipillico watershed’s model’s calibration showed success in some areas more than in others, but overall produced a model that provides information about trends that may accompany future land use changes and climatic conditions. The model shows that alterations to the páramo, whether positive or negative, will have downstream effects. The results also suggest the potential impacts on other watersheds of the region that might currently be building infrastructure dependent on páramo ecosystems’ headflow, such as the San Lorenzo reservoir.
Data availability was a large factor impacting this project. The study area was data sparse, allowing us to perform calibration on the model but without enough data for a subsequent validation period. To overcome the challenges of data sparsity, we implemented average values for those days and months without data. This approach showed acceptable results since average conditions were represented; however, better data are needed to capture the model’s response to specific events. We also acknowledge that the data we used may have had input errors that further complicated or undermined our efforts at calibration. Improving data requires political capital to support gauge installation and monitoring, and research such as the current project contributes to the argument to do so. Currently, obtaining data is difficult due to challenging physical conditions in comparatively isolated areas [10]. This study has attempted to encourage further exploration of páramo ecosystems to build upon the lessons learned and to improve results through more detailed and accurate analyses.
Due to incomplete data availability, some assumptions had to be made in order to provide the model with enough data to run (see Table 2). An example of those assumptions is the representation of the watershed’s land classes that determine different hydrological responses. These types of assumptions generalize the hydrological responses of land covers, their soil types, physical soil properties, terrain characteristics, etc. The assumptions are well documented and defensible with peer-reviewed literature [19,20,21,22,34].
The project used scenarios with projections for the future using possible future trends. The results embody uncertainty because the future is not clearly mapped, and such trends may be more or less pronounced. The change in climate simulated was not based on a GCM, which would measure climate change, but on delta values derived from IPCC reports, representing instead climate sensitivity. However, by examining the magnitude of the predicted impacts from these simulated trends within the watershed, decision makers can better understand the importance of factors like land use change around the páramo ecosystems.
In the Quiroz-Chipillico model, the optimistic and pessimistic future scenarios differ from the reference, and each other, in terms of their climatic predictions. Climatically, the optimistic scenario appears more favorable for headflow production because there will be more rain with 1.5 °C increase, compared to a decrease in rain and a 2.5 °C increase in temperature. However, as Figure 3 shows, having more rain than the reference scenario does not produce more headflow—in fact, there is less headflow starting between 2035 and 2040, even in the optimistic scenario. For all their climatic differences, the pessimistic and optimistic scenarios are closer to each other by 2050–2060 than they are to the reference scenario. Both optimistic and pessimistic scenarios include a 30% reduction in páramo area over time compared with the reference scenario, indicating that this factor may be impacting headflow more than the climatic conditions. This project also described the participatory process with key stakeholders and decision-makers. This process represents a departure from traditional technical studies because it actively involved the local management and consumers in defining and framing the model to ensure it addressed their challenges and ideas. The same stakeholders then participated in evaluating the model’s results. This exercise denotes a new method for studying these types of ecosystems because it seeks to provide information to the people identified as needing it, and who are best poised to disseminate it and use it. Scientific analyses must prioritize not only asking the right questions and obtaining useful answers, but involving the people who can encourage information uptake that will benefit the system under examination.

6. Conclusions

Human-induced changes and climate change have recently accelerated consequential changes in the páramo ecosystems in the Andes. Some of these changes are associated with socioeconomic activities such as tourism and high-mountain agriculture, but they also risk damage to the ecosystems that support them. Environmental change impacts the hydrological behavior of páramo in terms of temporal and spatial water availability. Thus managers urgently need to better understand the system processes to enable hydrological prediction.
This research used WEAP, an integrated water resource management modeling tool, to simulate the hydrological processes of páramo ecosystems in the Quiroz-Chipillico watershed of Piura, Peru. Water supply availability and water infrastructure functionality corresponding to páramo resources were studied under a set of uncertainties and stressors identified during a participatory workshop with local stakeholders.
Within six scenarios, the Quiroz-Chipillico watershed model simulated changes in precipitation, temperature, land use in the páramo and surrounding areas, and improvement in hydro-agriculture infrastructure downstream. Two scenarios, labeled optimistic and pessimistic, comprised the extremes of the subsequent future predictions.
Due to inadequate model calibration, the results of this study should be viewed as indicators of trends rather than absolute values. The model showed that reduction in páramo areas diminishes water production in this ecosystem’s headflows. Climate change through variability of precipitation and temperature also impacts water production; however, human alterations to páramo land coverage constitute the main factors affecting the water supply, with a potential headflow decrease of 1.5 m3/s in the pessimistic scenario with respect to the baseline. The demand sites’ coverage varied through time as was shown for the agricultural use, demonstrating more stress over time with accumulating land use changes. Municipal and agricultural downstream demand sites are directly affected by the alteration of the páramo areas, with a larger negative effect seen for irrigated agriculture (5%–7% decrease in irrigation water demand coverage) than for municipal demands. As such, efforts to preserve páramo areas will support stabilizing the hydrological regime and downstream water supply.
The Quiroz-Chipillico watershed model demonstrates that changes in the upper watershed, positive or negative, directly impact users in the downstream areas. To ensure continued human prosperity, the region needs appropriate interventions and coping mechanisms that can protect the region’s environmental support base by improving the conditions in the páramo ecosystems. Modeling programs such as WEAP can be mobilized to build local models as tools to assist decision makers in more clearly seeing the consequences of choices. In doing so, models can help guide future courses of actions based on the pathways that will best achieve the goals that stakeholders and decision makers seek.

Acknowledgments

The authors gratefully acknowledge funding for this publication from the United States Agency for International Development (USAID) and the research support provided by Laura Forni and David Yates of the Stockholm Environment Institute, as well as Hans Segura, Cristian Guevara, and Cayo Ramos.

Author Contributions

David Purkey conceived the project and organized its implementation with the assistance of Marisa Escobar. Francisco Flores-López constructed the Quiroz-Chipillico watershed model in WEAP and performed the study and analysis. S. E. Galaitsi and Francisco Flores-López wrote the paper.

Conflicts of Interest

The authors declare no conflict of interest.

Abbreviations

The following abbreviations are used in this manuscript:
DEM
Digital Elevation Model
ET
Evapotranspiration
GCM
General Circulation Model
IPCC
Intergovernmental Panel on Climate Change
IWRM
Integrated Water Resources Management
Lpcd
Liters per capita per day
Masl
Meters above sea level
NGO
Non-governmental organization
NSE
Nash-Sutcliffe Efficiency
USAID
United States Agency for International Development
WEAP
Water Evaluation and Planning
XLRM
Shorthand for an assessment framework

References

  1. Denevan, W.M. Cultivated Landscapes of Native Amazonia and the Andes; Oxford University Press: Oxford, UK, 2001. [Google Scholar]
  2. Josse, C.; Cuesta, F.; Navarro, G.; Barrena, V.; Cabrera, E.; Chacón-Moreno, E.; Ferreira, W.; Peralvo, M.; Saito, J.; Tovar, A. Mapa de Ecosistemas de los Andes del Norte y Centrales; Universidad de Los Andes: Bogotá, Colombia, 2008. [Google Scholar]
  3. Raven, P. Foreward. In Climate Change and Biodiversity in the Tropical Andes; Inter-American Institute for Global Change Research (IAI): Montevideo, Uruguay; Scientific Committee on Problems of the Environment (SCOPE): Stanford, CA, USA, 2011; pp. 1–5. [Google Scholar]
  4. Josse, C.; Cuesta, F.; Navarro, G.; Barrena, V.; Becerra, M.T.; Cabrera, E.; Chacón-Moreno, E.; Ferreira, W.; Peralvo, M.; Saito, J.; et al. Physical Geography and Ecosystems in the Tropical Andes; Herzog, S., Martínez, R., Jørgensen, P., Tiessen, H., Eds.; Inter-American Institute for Global Change Research: Montevideo, Uruguay; Scientific Committee on Problems of the Environment: Stanford, CA, USA, 2011; pp. 152–169. [Google Scholar]
  5. Buytaert, W.; Cuesta-Camacho, F.; Tobón, C. Potential impacts of climate change on the environmental services of humid tropical alpine regions. Glob. Ecol. Biogeogr. 2011, 20, 19–33. [Google Scholar] [CrossRef]
  6. Vuille, M.; Francou, B.; Wagnon, P.; Juen, I.; Kaser, G.; Mark, B.G.; Bradley, R.S. Climate change and tropical Andean glaciers: Past, present and future. Earth Sci. Rev. 2008, 89, 79–96. [Google Scholar] [CrossRef]
  7. Bradley, R.S.; Vuille, M.; Diaz, H.F.; Vergara, W. Threats to water supplies in the tropical Andes. Science 2006, 312, 1755–1756. [Google Scholar] [CrossRef] [PubMed]
  8. Ruiz, D.; Moreno, H.A.; Gutiérrez, M.E.; Zapata, P.A. Changing climate and endangered high mountain ecosystems in Colombia. Sci. Total Environ. 2008, 398, 122–132. [Google Scholar] [CrossRef] [PubMed]
  9. Buytaert, W.; Célleri, R.; De Bièvre, B.; Cisneros, F.; Wyseure, G.; Deckers, J.; Hofstede, R. Human impact on the hydrology of the Andean páramos. Earth Sci. Rev. 2006, 79, 53–72. [Google Scholar] [CrossRef] [Green Version]
  10. Buytaert, W.; Vuille, M.; Dewulf, A.; Urrutia, R.; Karmalkar, A.; Célleri, R. Uncertainties in climate change projections and regional downscaling in the tropical Andes: Implications for water resources management. Hydrol. Earth Syst. Sci. 2010, 14, 1247–1258. [Google Scholar] [CrossRef] [Green Version]
  11. Harden, C.P.; Hartsig, J.; Farley, K.A.; Lee, J.; Bremer, L.L. Effects of land-use change on water in Andean páramo grassland soils. Ann. Assoc. Am. Geogr. 2013, 103, 375–384. [Google Scholar] [CrossRef]
  12. Palminteri, S.; Powell, G. Visión de Conservación de la Biodiversidad en los Andes del Norte; World Wildlife Fund: Santiago de Cali, Colombia, 2001. [Google Scholar]
  13. Corrales, E. Andes del Norte: Principales Tendencias Socioeconómicas y su Relación con la Biodiversidad; World Wildlife Fund: Santiago de Cali, Colombia, 2001. [Google Scholar]
  14. Marengo, J.A. Mudanças Climáticas Globais e Seus Efeitos Sobre a Biodiversidade: Caracterização do Clima Atual e Definição das Alterações Climáticas Para o Território Brasileiro ao Longo do Século XXI; Ministério do Meio Ambiente (MMA): Brasilia, Brazil, 2006. [Google Scholar]
  15. Anderson, E.P.; Marengo, J.; Villalba, R.; Halloy, S.; Young, B.; Cordero, D.; Gast, F.; Jaimes, E.; Ruiz, D. Consequences of climate change for ecosystems and ecosystem services in the tropical Andes. In Climate Change and Biodiversity in the Tropical Andes; Herzog, S.K., Martinez, R., Jørgensen, P.M., Tiessen, H., Eds.; Inter-American Institute for Global Change Research (IAI): Montevideo, Uruguay; Scientific Committee on Problems of the Environment (SCOPE): Stanford, CA, USA, 2011; pp. 1–5. [Google Scholar]
  16. Vuille, M.; Bradley, R.S. Mean annual temperature trends and their vertical structure in the tropical Andes. Geophys. Res. Lett. 2000, 27, 3885–3888. [Google Scholar] [CrossRef]
  17. Flores-Lopez, F.; Escobar, M.; Sei, D.P. Un Marco de Apoyo a la Toma de Decisiones para Adaptación al Cambio Climático; Stockholm Environment Institute: Davis, CA, USA, 2012. [Google Scholar]
  18. Hole, D.G.; Young, K.R.; Seimon, A.; Gomez Wichtendahl, C.; Hoffmann, D.; Schutze Paez, K.; Sanchez, S.; Muchoney, D.; Grau, H.R.; Ramirez, E. Adaptive Management for Biodiversity Conservation under Climate Change. In Climate Change and Biodiversity in the Tropical Andes; Herzog, S.K., Martinez, R., Jørgensen, P.M., Tiessen, H., Eds.; Inter-American Institute for Global Change Research (IAI): Montevideo, Uruguay; Scientific Committee on Problems of the Environment (SCOPE): Stanford, CA, USA, 2011; pp. 1–5. [Google Scholar]
  19. Yates, D.; Sieber, J.; Purkey, D.; Huber-Lee, A. WEAP21—A demand-, priority-, and preference-driven water planning model: Part 1: Model characteristics. Water Int. 2005, 30, 487–500. [Google Scholar] [CrossRef]
  20. Yates, D.; Purkey, D.; Sieber, J.; Huber-Lee, A.; Galbraith, H. WEAP21: A demand-, priority-, and preference-driven water planning model: 2. Aiding freshwater ecosystem service evaluation. Water Int. 2005, 30, 501–512. [Google Scholar] [CrossRef]
  21. Buytaert, W.; Beven, K. Models as multiple working hypotheses: Hydrological simulation of tropical alpine wetlands. Hydrol. Process. 2011, 25, 1784–1799. [Google Scholar] [CrossRef]
  22. Young, C.A.; Escobar-Arias, M.I.; Fernandes, M.; Joyce, B.; Kiparsky, M.; Mount, J.F.; Mehta, V.K.; Purkey, D.; Viers, J.H.; Yates, D. Modeling the hydrology of climate change in California’s Sierra Nevada for subwatershed scale adaptation1. JAWRA J. Am. Water Resour. Assoc. 2009, 45, 1409–1423. [Google Scholar] [CrossRef]
  23. Biggs, R.; Raudsepp-Hearne, C.; Atkinson-Palombo, C.; Bohensky, E.; Boyd, E.; Cundill, G.; Fox, H.; Ingram, S.; Kok, K.; Spehar, S.; et al. Linking futures across scales: A dialog on multiscale scenarios. Ecol. Soc. 2007, 12, 17. [Google Scholar]
  24. Peterson, G.D.; Cumming, G.S.; Carpenter, S.R. Scenario planning: A tool for conservation in an uncertain world. Conserv. Biol. 2003, 17, 358–366. [Google Scholar] [CrossRef]
  25. Lempert, R.J.; Popper, S.W.; Bankes, S.C. Shaping the Next One Hundred Years: New Methods for Quantitative Long-Term Strategy Analysis (MR-1626-RPC); RAND: Santa Monica, CA, USA, 2003. [Google Scholar]
  26. Monteith, J.L. Evaporation and environment. Symp. Soc. Exp. Biol. 1965, 19, 205–234. [Google Scholar] [PubMed]
  27. Parry, M.L. Climate Change 2007: Impacts, Adaptation and Vulnerability: Contribution of Working Group II to the Fourth Assessment Report of the Intergovernmental Panel on Climate Change; Cambridge University Press: Cambridge, UK, 2007; Volume 4. [Google Scholar]
  28. Moriasi, D.N.; Arnold, J.G.; Van Liew, M.W.; Bingner, R.L.; Harmel, R.D.; Veith, T.L. Model evaluation guidelines for systematic quantification of accuracy in watershed simulations. Trans. ASABE 2007, 50, 885–900. [Google Scholar] [CrossRef]
  29. Nash, J.E.; Sutcliffe, J.V. River flow forecasting through conceptual models part I—A discussion of principles. J. Hydrol. 1970, 10, 282–290. [Google Scholar] [CrossRef]
  30. Gupta, H.V.; Sorooshian, S.; Yapo, P.O. Status of automatic calibration for hydrologic models: Comparison with multilevel expert calibration. J. Hydrol. Eng. 1999, 4, 135–143. [Google Scholar] [CrossRef]
  31. Instituto de Hidrología, Meteorología y Estudios Ambientales. Los Glaciares Colombianos, Expresión del Cambio Climático Global; IDEAM: Bogotá, Colombia, 2000. [Google Scholar]
  32. Vásquez, O.C. El fenómeno El Niño en Perú y Bolivia: Experiencias de participación local. In El Fenómeno El Niño en Perú y Bolivia: Experiencias de Participación Local; Intermediate Technology Development Group (ITDG): Warwickshire, UK, 2004. [Google Scholar]
  33. Marengo, J.A.; Pabón, J.D.; Díaz, A.; Rosas, G.; Ávalos, G.; Montealegre, E.; Villacis, M.; Solman, S.; Rojas, M. Climate change: Evidence and future scenarios for the Andean region. In Climate Change and Biodiversity in the Tropical Andes; Herzog, S.K., Martinez, R., Jørgensen, P.M., Tiessen, H., Eds.; Inter-American Institute for Global Change Research (IAI): Montevideo, Uruguay; Scientific Committee on Problems of the Environment (SCOPE): Stanford, CA, USA, 2011; pp. 110–127. [Google Scholar]
  34. Buytaert, W.; De Bièvre, B.; Wyseure, G.; Deckers, J. The use of the linear reservoir concept to quantify the impact of changes in land use on the hydrology of catchments in the Andes. Hydrol. Earth Syst. Sci. Discuss. 2004, 8, 108–114. [Google Scholar] [CrossRef]
Figure 1. Location of Quiroz-Chipillico watershed in Piura, Peru.
Water 08 00094 g001
Figure 2. Monthly and annual simulated and estimated full natural flows with goodness of fit statistics at sub-basin outlets for the Piura model. The solid, dark line represents the 1:1 correspondence. 1: Nash-Sutcliffe efficiency; 2: percentage of Bias; 3: normalized root mean square error; 4: log-transformed/normalized root mean square error; 5: coefficient of determination R squared; 6: dark lines are the simulated values and grey lines are modeled values for annual series. (A) Páramo Catchment; (B) Toma Samba; (C) Chipillico.
Water 08 00094 g002
Figure 3. Average annual simulated headflows produced by páramo’s catchments of Quiroz-Chipillico watershed model.
Water 08 00094 g003
Figure 4. Average annual changes in headflows produced by páramo’s catchments of the Quiroz-Chipillico watershed model with respect to the reference scenario.
Water 08 00094 g004
Figure 5. Quiroz-Chipillico watershed model’s storage volume in the San Lorenzo reservoir.
Water 08 00094 g005
Figure 6. Quiroz-Chipillico watershed model’s change in water demand coverage for irrigation units supplied by the San Lorenzo reservoir.
Water 08 00094 g006
Table 1. Descriptive information of the study area.
InfrastructureQuiroz-Chipillico Watershed
Total Drainage Area4280 km2
Lowest Elevation65 m above sea level (masl)
Highest Elevation4000 masl
Páramo Drainage Area198 km2
Percentage of Páramo Area4.6%
Irrigated Area27,400 ha
Municipal Activity Driving Demand26,418 people (2005)
Per Capita Water Use96 liters per capita per day (lpcd)
Water Use Consumption Per Capita100%
Reservoir Capacity201 × 106 m3
Table 2. Sources of digital data used for building the WEAP model for the Quiroz-Chipillico watershed.
Model ComponentUse/AssumptionSource
Identification of rivers/tributaries, watershed boundaries and contributing areasGeneral model development and hydrological connectivity/No assumption madeNASA’s Earth Observing System Data and Information System. (http://reverb.echo.nasa.gov/reverb/)
Land use categories: páramo, forest, non-forest, fruit trees, irrigated and rainfed agricultureCatchments land cover/Assumed that land classes are adequate to determine the hydrological response of the catchmentLand Use Shapefile for 2010 year; Regional Government of Piura
Climate forcing of daily and monthly total precipitation and average temperatureClimate forcing for each catchment object computed as the average of each catchment’s elevation band/Assumptions made to complete data series with daily averagesNine meteorological stations (1960–2010) located within and outside the watershed but nearby (Autoridad Nacional del Agua, Servicio Nacional de Meteorología e Hidrología, Naturaleza y Cultura Internacional)
Observed, daily and monthly average streamflowUsed in model calibration and validation/No assumptions madeThree stream gauges (2008–2010) (Naturaleza y Cultura Internacional, Autoridad Nacional del Agua)
Reservoir capacities, head-area-volumes, and historic storage volumesSpecification of reservoir capacity and operating procedures. Determination of: reservoir evaporative losses, conservation and flood control storage/Assumptions about reservoir operations made to represent observed volume dataJunta de Usuarios de San Lorenzo, Autoridad Nacional del Agua; specific information on water supplies, reservoir, and water operations, etc.
Table 3. XLRM results from participatory workshops in Quiroz-Chipillico watershed.
Exogenous (X) Factors/UncertaintiesManagement Options/Levers (L)
X1. Páramo’s Area (with constant or decrease)L1. Reference Line (No changes)
X2. Climate Variability (Precipitation and Temperature)L2. Reforestation with Native Species
X3. Population GrowthL3. Infrastructure improvement
X4. Change in Crop PatternsL4. Irrigation Efficiency
X5. Expansion of Agricultural frontierL5. Reservoir Implementation
Relationships (R)Performance Metrics (M)
Monthly Quiroz-Chipillico watershed model in WEAP that incorporates the daily time step model with páramoM1. Baseflow (Páramo)
M2. Páramo’s Area
M3. Transfer Volumes of Water
M4. Agricultural Demands
M4. Rural Demands
M5. Agricultural and Rural Coverage
M6. Streamflows at Watershed Outlets
Table 4. Design of modeling scenarios on historic time series, simulated for 2010–2060.
VariableReferenceScenario 1Scenario 2Scenario 3 (Optimistic)Scenario 4Scenario 5Scenario 6 (Pessimistic)
Páramo’s AreaNo change30% Reduction30% Reduction30% Reduction30% Reduction30% Reduction30% Reduction
Agricultural Frontier (ha)No change15,000 Increase15,000 Increase15,000 Increase15,000 Increase15,000 Increase15,000 Increase
PrecipitationNo changeNo ChangeNo Change6% Increase2% Decrease6% Decrease6% Decrease
Temperature (°C)No change1.5 Increase2.5 Increase1.5 Increase1.5 Increase1.5 Increase2.5 Increase
Population Growth0.9%0.9%0.9%0.9%0.9%0.9%2.0%
Infrastructure improvementNo change5%5%5%5%5%5%
Irrigation EfficiencyNo change35%35%35%35%35%35%
Reservoir ImplementationNo changeYesYesYesYesYesYes
ReforestationNo change30% Increase30% Increase30% Increase30% Increase30% Increase30% Increase
Table 5. Calibrated parameters used on the Quiroz-Chipillico watershed model.
ParametersLand Cover TypeValue
Preferential Flow DirectionPáramo0.25, 0.75
Others0.75
Shallow Soil Conductivity (Ks) (mm/mo)Páramo480
Others100, 240
Shallow Soil Capacity (mm)Páramo70
Others140, 350
Surface Runoff Resistance FactorPáramo2
Others5, 6
Deep Soil Conductivity (Kd)(mm/mo)Páramo360
Others48, 100
Deep Soil Capacity (mm)Páramo210
Others50, 3000
Crop Coefficient, kcPáramoJanuary–December: 1.2
OthersJanuary–December: 0.25–1.2
Notes: Preferred flow direction (from 0.0, vertical to 1.0, horizontal); Shallow Soil Capacity in mm; Kc—Hydraulic Conductivity (mm/month); Runoff resistance factor—smaller values lead to greater component of surface runoff; Others: other general types of land cover presented in models.

