Article

Performance of an Underground Stormwater Detention Chamber and Comparison with Stormwater Management Ponds

1
Department of Civil Engineering, University of Toronto, 35 St George St., Toronto, ON M5S 1A4, Canada
2
Toronto and Region Conservation Authority, 9520 Pine Valley Drive, Vaughan, ON L4L 1A6, Canada
*
Author to whom correspondence should be addressed.
Water 2016, 8(5), 211; https://doi.org/10.3390/w8050211
Submission received: 21 January 2016 / Revised: 29 April 2016 / Accepted: 11 May 2016 / Published: 20 May 2016
(This article belongs to the Special Issue BMP Development, Implementation, and Performance)

Abstract

:
The transportation of pollutants from impervious surfaces during runoff events to receiving water bodies is a serious environmental problem. Summer runoff is also heated by impervious surfaces, causing thermal enrichment in receiving water body systems and degradation of coldwater aquatic ecosystems. End-of-pipe stormwater management facilities that are open to the environment can result in further elevated temperatures due to exposure to solar radiation. Receiving water systems that provide coldwater habitat require cool water temperatures to sustain healthy conditions for cold water flora and fauna (e.g., trout, dace). Underground Stormwater Detention Chambers (USDC) are a technology for the detention and treatment of stormwater runoff that can potentially solve the thermal issues associated with sun-exposed detention facilities while still providing an equivalent level of treatment services for stormwater pollutants. A field study of an USDC located in Southern Ontario was undertaken to characterize its treatment performance and effect on water temperature. The results were: the USDC was found to provide similar levels of stormwater treatment as wet detention ponds. On average, outlet maximum temperatures were 5 °C cooler than inlet maximum temperatures, and outlet water temperatures remained within the thermal regime for coldwater fish habitat throughout the evaluation period. There was little to no stratification of temperature, nor dissolved solids, but stratification of dissolved oxygen was observed mid-winter and into the spring.

1. Introduction

Stormwater management is a key issue in the design of urban infrastructure. Sustained increases in urbanization have resulted in large-scale replacement of pervious land by impervious surfaces, which reduces infiltration rates and available surface storage [1]. Due to these changes, a larger proportion of urban precipitation becomes runoff. Runoff from urban areas causes non-point source pollution by transporting pollutants-which are deposited on impervious surfaces through human activities and atmospheric deposition-to receiving water bodies [2,3].
Stormwater management (SWM) ponds have been the most widely employed management practice in urban drainage for over 40 years [4]. SWM ponds have been widely documented to improve stormwater quality reducing concentrations of suspended sediments [5], metals [5], nutrients [5,6] and bacteria [7]. Ponds are often assumed to provide high removal efficiency for total suspended solids (TSS). Typical performance is often reported as 70% TSS removal or higher [8,9]. However, the TSS removal performance of SWM ponds is highly variable depending on storm, catchment and pond characteristics. Carpenter et al. (2014) observed an average removal efficiency of 39% but values from individual events were found to range from 1% to 67% [5]. More recently, SWM ponds have been found to provide lower levels of treatment compared to vegetated low impact development techniques such as bioretention, grassed swales and constructed and/or floating wetlands [8,10]. Other drawbacks of traditional SWM ponds are the substantial dedication of land required, and their warming effect on water temperature caused by sun exposure.
Underground stormwater detention chamber systems (USDC) are an alternative technology for the detention and treatment of stormwater runoff, but there is limited field performance information available. UDCSs have been regularly used in densely developed urban areas to provide volume storage and peak flow control for building roof runoff, as well as for combined sewer overflow water [11]. Studies of UDCS have focused on specific water quality parameters such as temperature [1] and metal toxicity [12]. USDCs share many similar features to SWM ponds: both technologies detain runoff with a permanent pool and an orifice which restricts flow to a set maximum; they both have sedimentation forebays to capture coarse sediments; and both are end-of-pipe systems.
Despite their similarities, there are several key differences which prevent research conducted on SWM ponds from being directly applied to USDCs. SWM ponds use a combination of biological processes and settling to retain nutrients and metals carried by runoff. SWM ponds exhibit “diurnal rhythms” [13]. Internal water temperatures will rise and fall with diurnal solar radiation while dissolved oxygen (DO) and pH are influenced by the diurnal biological processes of photosynthesis and respiration [13]. USDC are dark and unvegetated so pollutant removal mechanisms are limited to physical processes such as sedimentation. While winter has a significant effect on SWM pond performance through thermal and dissolved solids stratification and a reduction in dissolved oxygen concentrations [14,15], its effects on USDCs are unknown.
The various concrete structures within the USDC change the flow path of the water, which causes turbulence and may or may not assist in the removal of contaminants. USDC are not open to the environment so they are not affected by solar radiation. Therefore, the thermal issues with SWM ponds, such as elevated effluent temperature and thermal gradients [1,13,14,15,16] may be avoided. All of these factors combine such that the conditions within a USDC need to be researched as a separate entity to the SWM pond.
The objective of this study is to characterize the stormwater treatment performance of a pilot USDC and compare it to the typical treatment performance of SWM ponds. The USDC was monitored over a six month period, by the Toronto and Region Conservation Authority’s Sustainable Technologies Evaluation Program (STEP) including continuous flow, turbidity, and temperature measurements and sampling during storm events.

2. Methodology

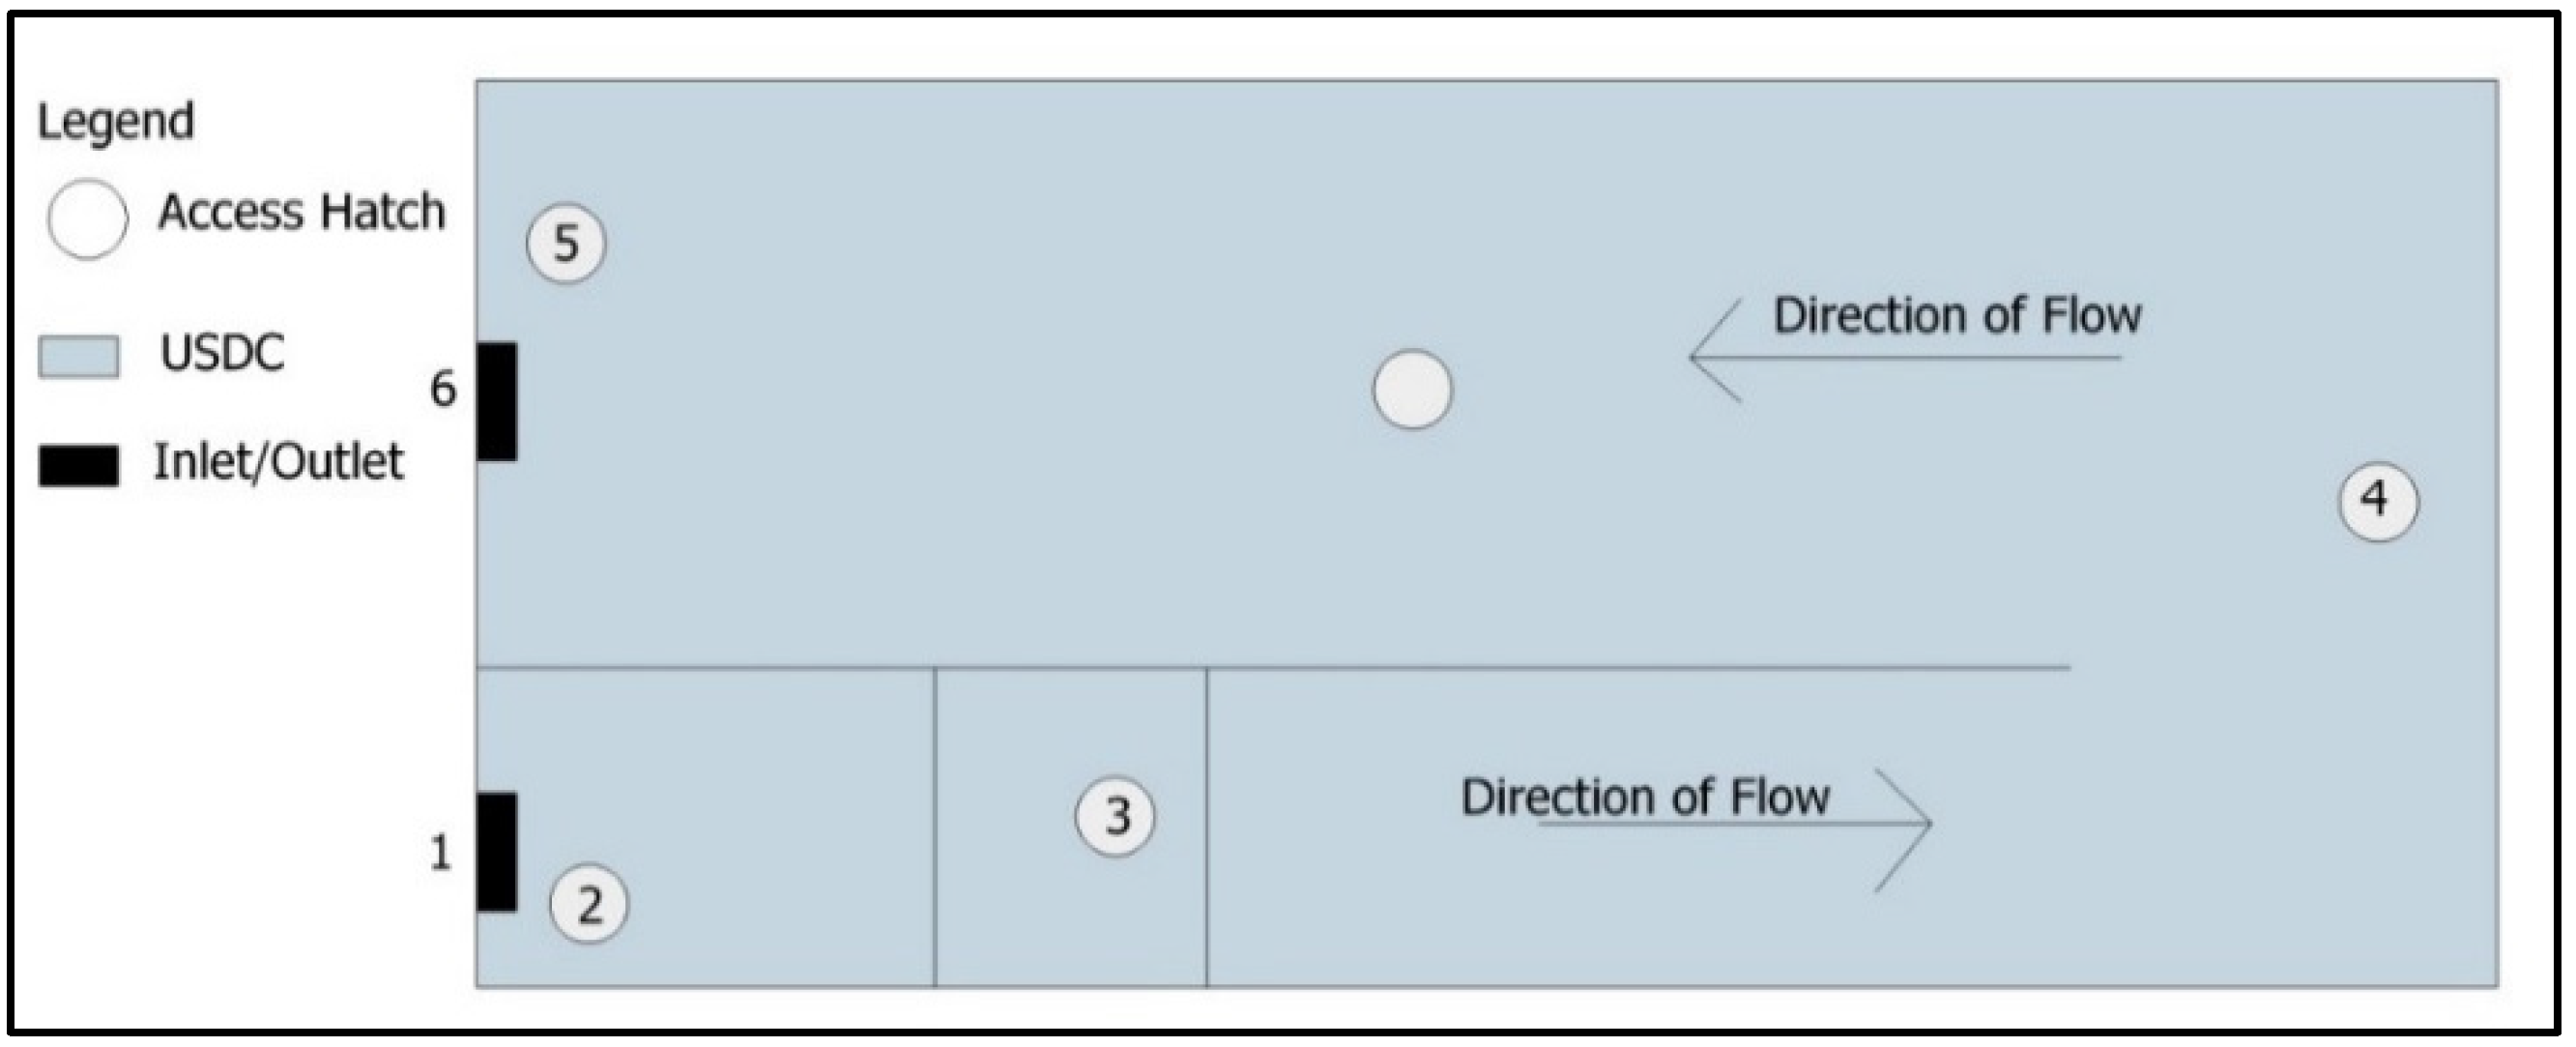
2.1. Site Description

The USDC monitored for this project services a portion of the South Unionville neighbourhood in the City of Markham, Ontario (Figure 1) with the chamber top located approximately 1.4 m beneath a park. The drainage area, serviced by the StormTrap® DoubleTrap™ USDC, is 5.24 ha in size and contains a mixture of commercial, residential and parkland developments and is one of the first in Ontario to services by such a system [17]. In addition to stormwater runoff, the South Unionville USDC also receives flow intermittently during summer months from a nearby recreational splash pad feature of the park in which the system is located. Stormwater from the South Unionville neighbourhood is released to a tributary of the Rouge River that is identified as having a coolwater thermal regime supporting target fish species such as Rainbow Trout and Rainbow Darters [18].
Figure 2 shows the layout of the South Unionville USDC as well as the location of the various monitoring equipment installed on the site.
The USDC has an approximate 1200 m2 footprint, a permanent pool of 1475 m3 and an extended storage volume of 1143 m3 is provided for treatment. The system is designed to provide extended detention of runoff from a 25 mm storm over the catchment area with a 24 h drawdown period. An orifice control at the outlet is sized to maintain the post-development peak release rate from the catchment area at the pre-development rate or a 5-year return period storm (Qp = 0.03 m3/s). The USDC was designed to treat a total drainage area 7.97 ha however, the serviced catchment was ultimately reduced to the as-built 5.24 due to complications encountered during construction. Consequently, the USDC is oversized by 52% which has increased the detention time of stormwater within the chamber and likely increases the overall effectiveness of stormwater treatment.

2.2. Data Collection and Analysis

Temperature and turbidity were recorded at the inlet and outlet approximately 1.35 m from the bottom of the USDC. Monitoring was conducted from the beginning of June to the end of November 2014. Precipitation measurements were taken at Milne Dam in the City of Markham, which is three kilometers east of the site.
The sampling equipment properties and purpose are shown in Table 1. ISCO samplers were installed at the inlet, end of the forebay and outlet and were programmed to collect samples when water level in the USDC increased by at least 3 cm in order to ensure that only rain events of approximately 5 mm depth or greater were sampled, when splash pad flow would not significantly dilute runoff pollutants within incoming stormwater flow. Event mean concentrations (EMC) studied include: total suspended solids (TSS), turbidity, nutrients and metals. For each storm event captured by the ISCO samplers, flow weighted composite samples at the inlet, forebay, and outlet were sent to the Ontario Ministry of Environment and Climate Change analytical laboratory for analysis.
Throughout the study, samples were collected by the Toronto and Region Conservation Authority (TRCA) from six storm events at the inlet and seven storm events at the inlet and outlet. The 2014 sampling events at the inlet occurred on: 11, 16 August; 2, 5, 21 September; and 3 October; an additional sample from the forebay and the outlet locations was captured on 25 June 2014.
Descriptive statistics were calculated for continuous temperature and turbidity data as well as for pollutant EMC data. Unfortunately, the configuration of the USDC inlet did not allow for flow monitoring so event mean temperatures and turbidity cannot be flow-weighted. Vertical profiles of temperature, specific conductivity/total dissolved solids, dissolved oxygen and pH were taken during winter and spring seasons between 2014 and 2016 in the permanent pool portion of the USDC (Hatch 4 on Figure 2). Profile data collection was scheduled to determine if water stored in the permanent pool becomes stratified for any of these parameters during winter operation, and if any observed stratification dissipates with the arrival of spring rain storms. Four vertical profiles were conducted on the South Unionville USDC; they took place on 2 December 2014, 18 February 2015, 4 May 2015, and 23 February 2016.

3. Results and Discussion

3.1. Stormwater Quality

A summary of hydrological parameters for the seven sampled storm events is shown in Table 2. Sampled storms had average rainfall intensities that ranged between 0.6 and 11.3 mm/h and storm durations between 2.83 and 11.75 h. The 2-year average rainfall intensities were calculated using local IDF curve equations [19]. The highest intensity storm event over the evaluation period occurred on 25 June 2014, when 28.2 mm of rain fell over a 2.42 h period (Table 2). Based on measured rainfall depth at the Milne Dam location and intensity-frequency-duration curves for the nearest climate station with 20 years or more of historical data (Environment Canada, 2013-Toronto Buttonville Airport climate station), this storm was approximately equivalent to the 2 year return period storm events of 5 min, one hour and two hours duration. Flows from this event were fully captured by the active storage component of the USDC (i.e., did not raise water level to the elevation of the overflow outlet pipes).
Descriptive statistics for EMC data is provided in supplemental materials (Table S1). TSS concentrations were observed to decrease through the USDC (TSS: Inlet > Forebay > Outlet). The forebay was found to be an important component in the TSS removal. Overall, 50% of the suspended particles were removed between the inlet and forebay with remaining particles being reduced again by 50% after traversing the permanent pool. The range of values at the outlet was observed to be much more regular than at the inlet, indicating that the pollutants at the outlet are fines that will not settle regardless of detention time.
The average removal efficiency of TSS by the USDC was 82%. Under provincial stormwater quality criteria the USDC is providing an “enhanced level of protection”, i.e., the longterm removal of 80% of suspended solids. With this removal rate the USDC is achieving similar TSS removal performance as compared to SWM ponds [8,9,20,21]. Another important feature of the South Unionville USDC is that due to changes in catchment development and layout the USDC is significantly oversized. A smaller sized USDC would be expected to provide lower rates of TSS removal.

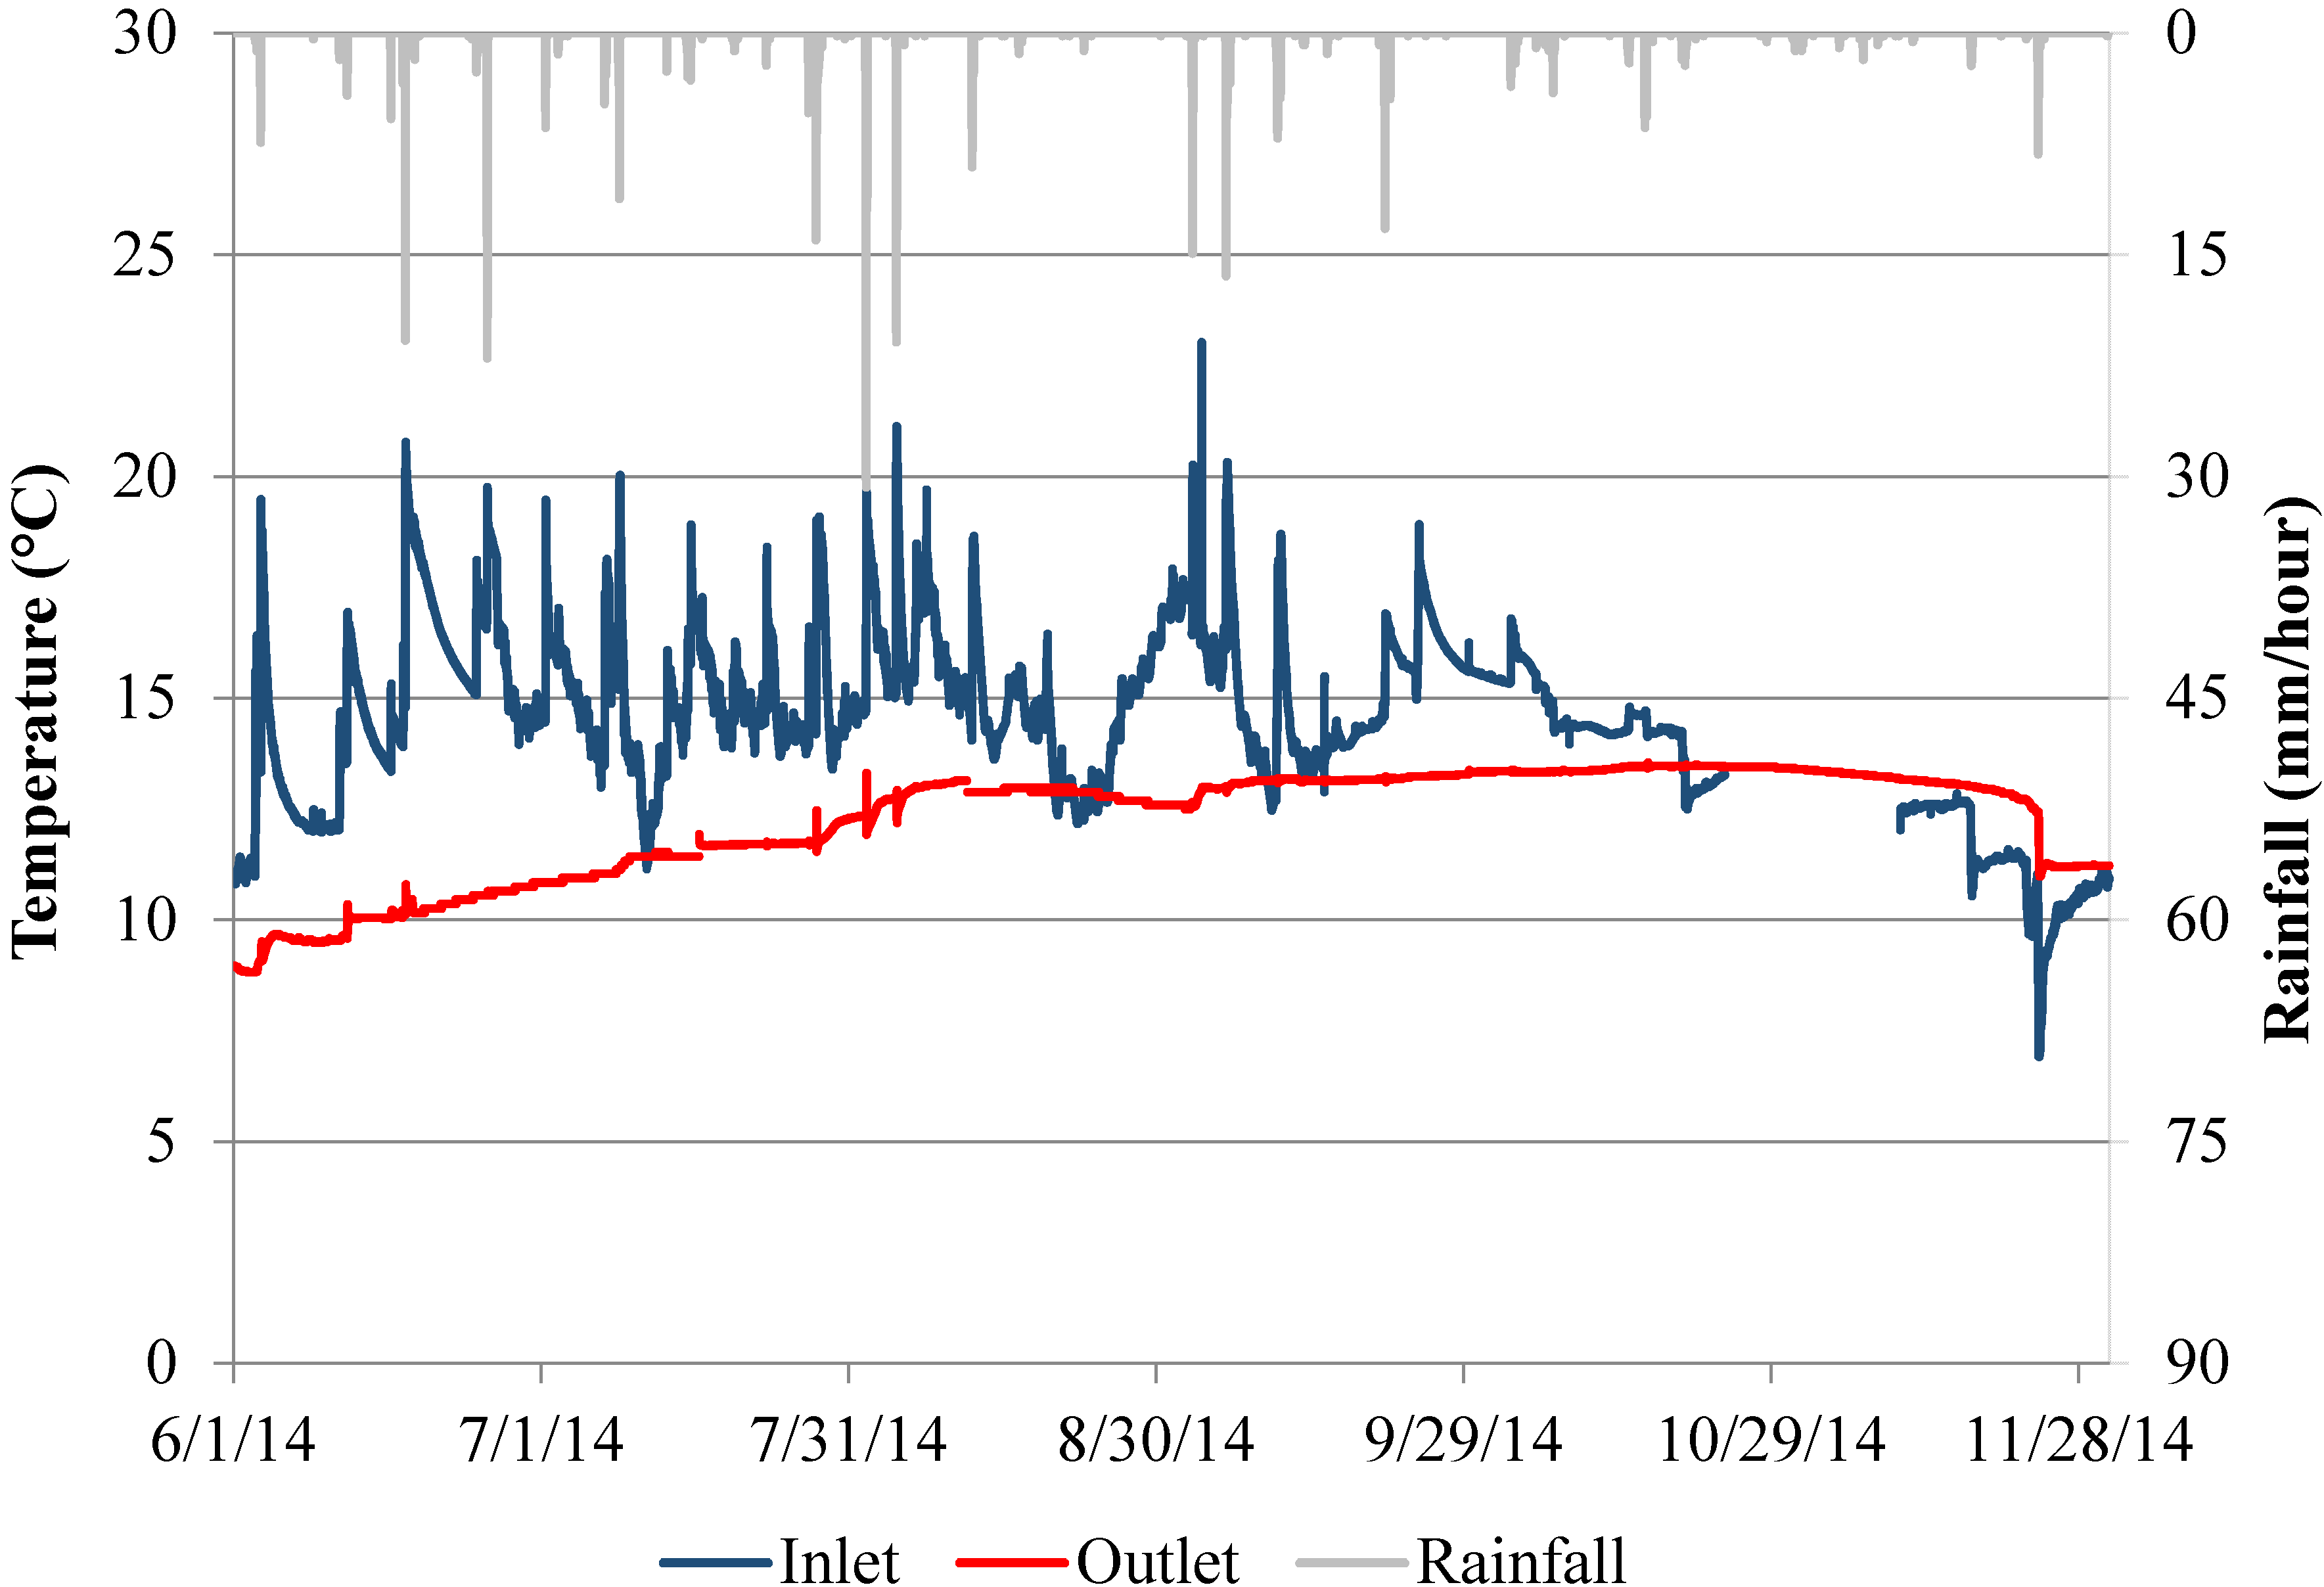
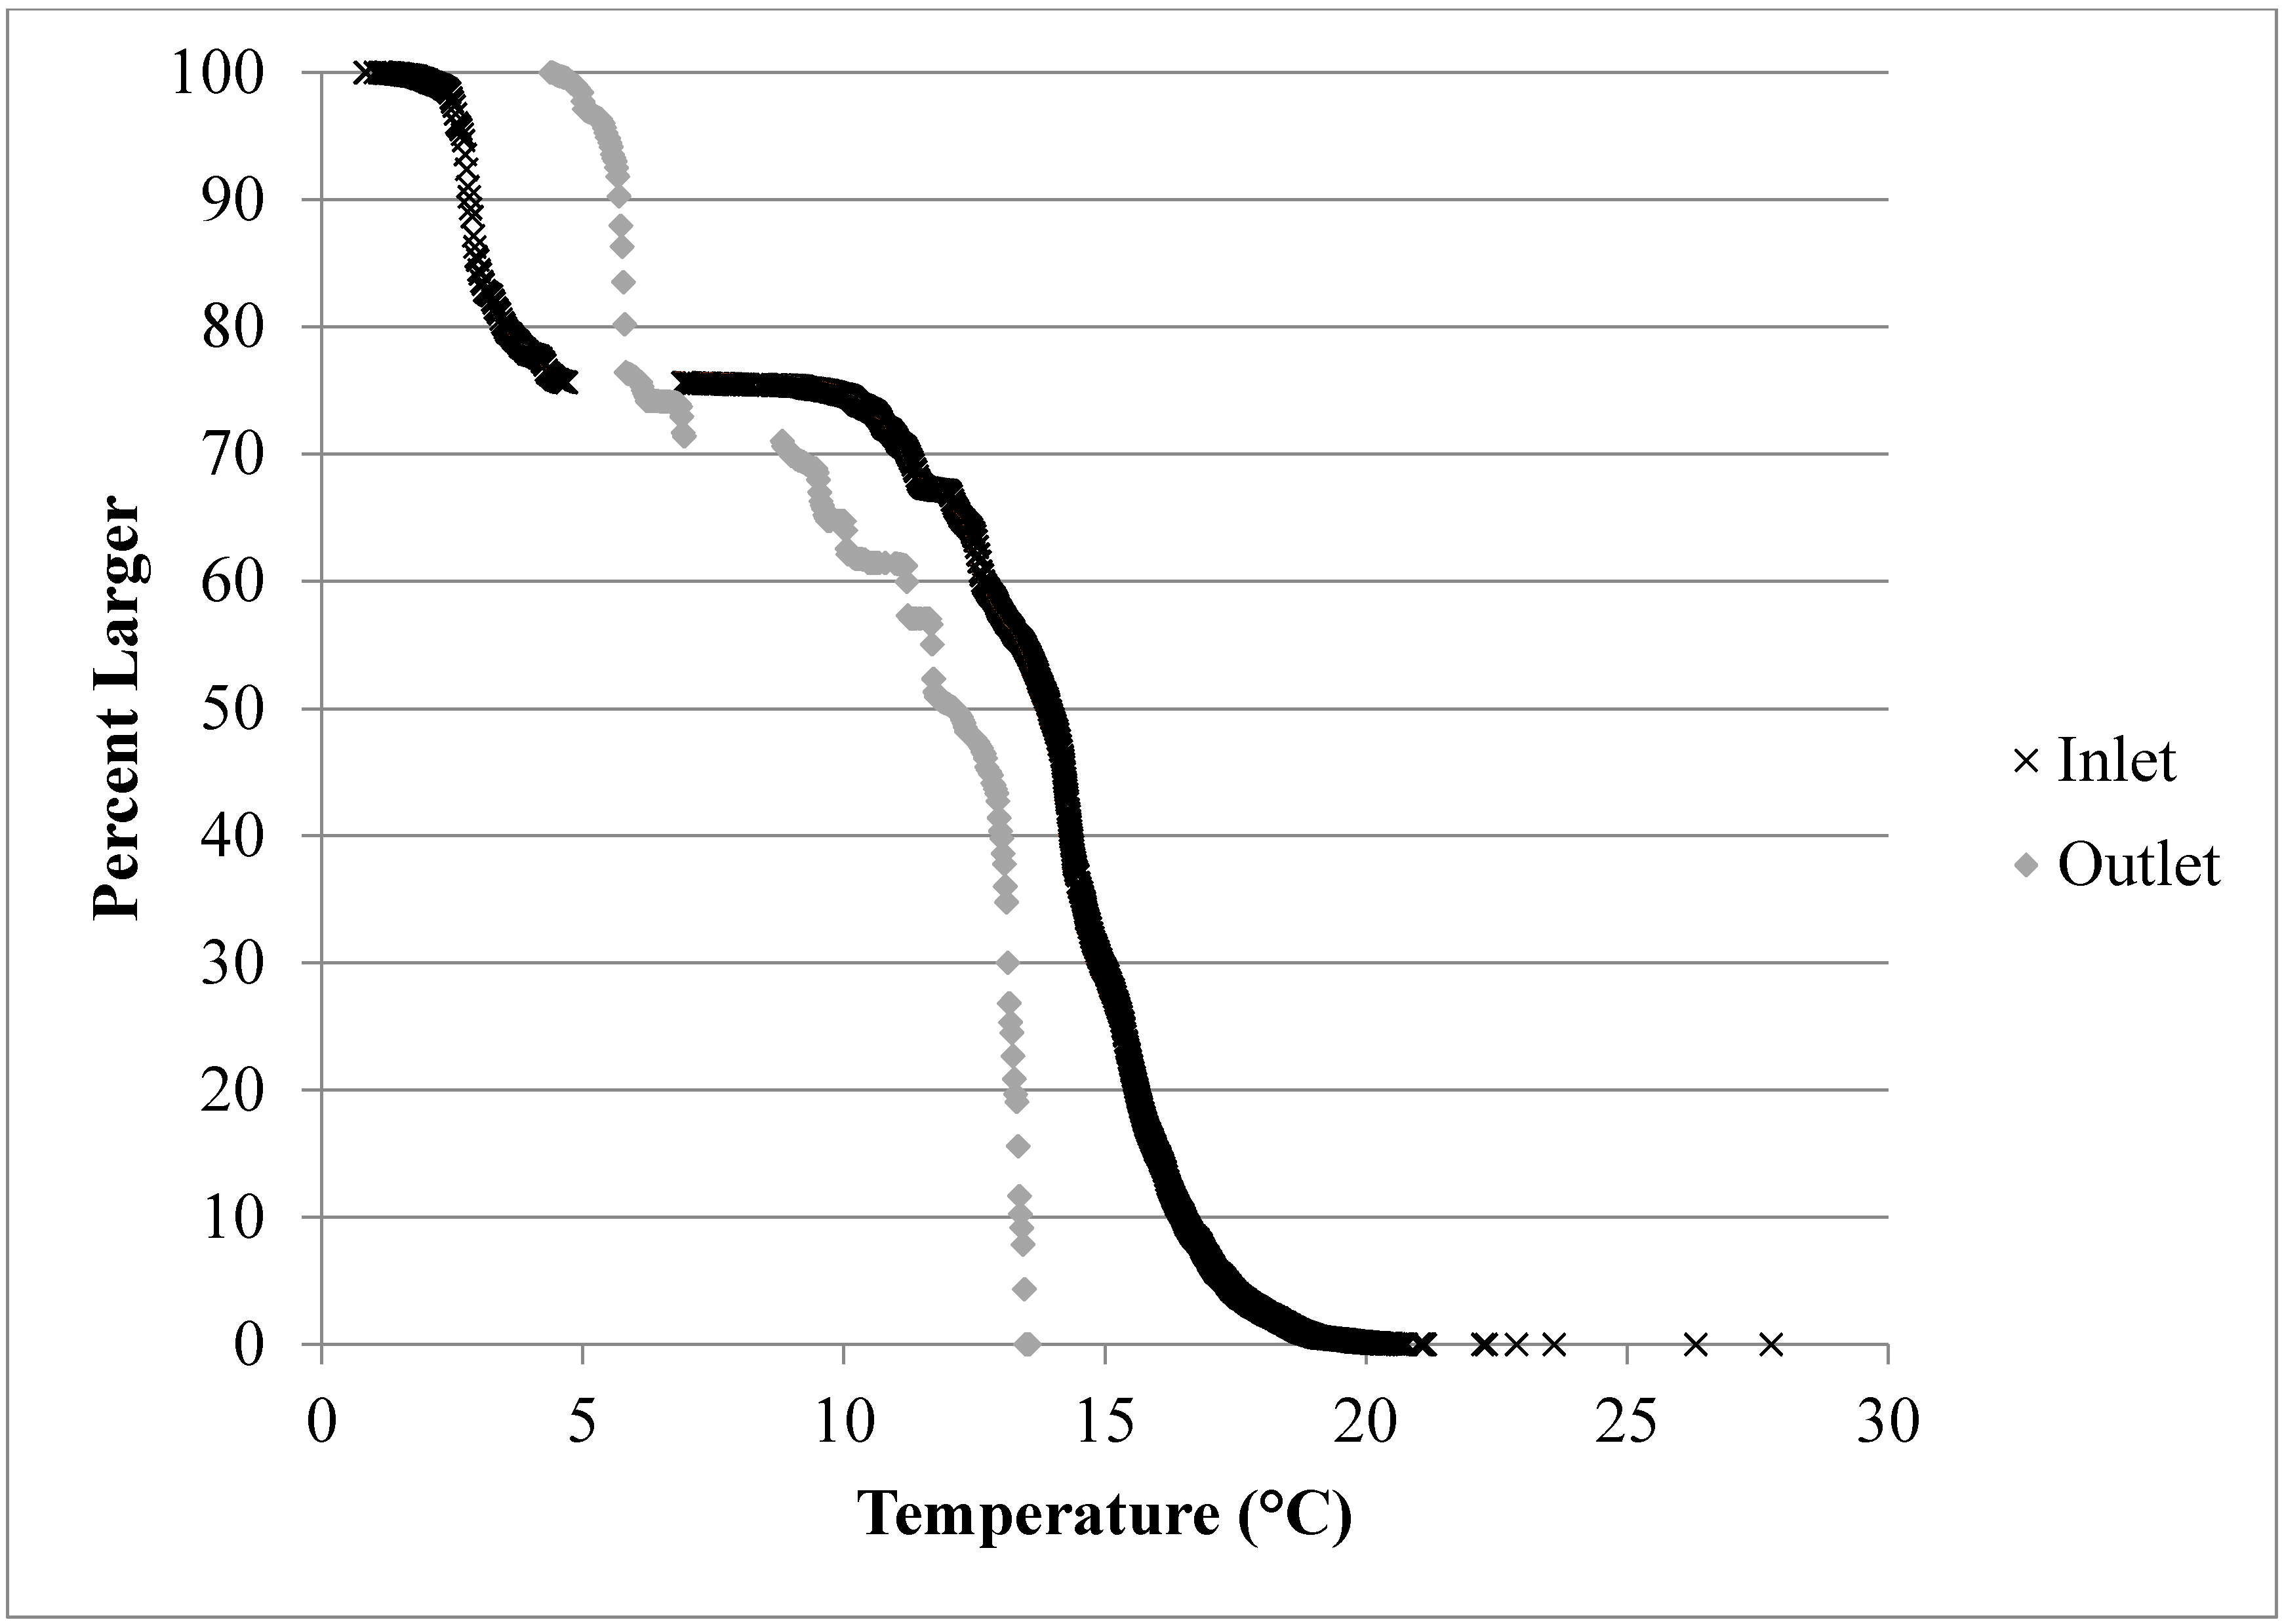
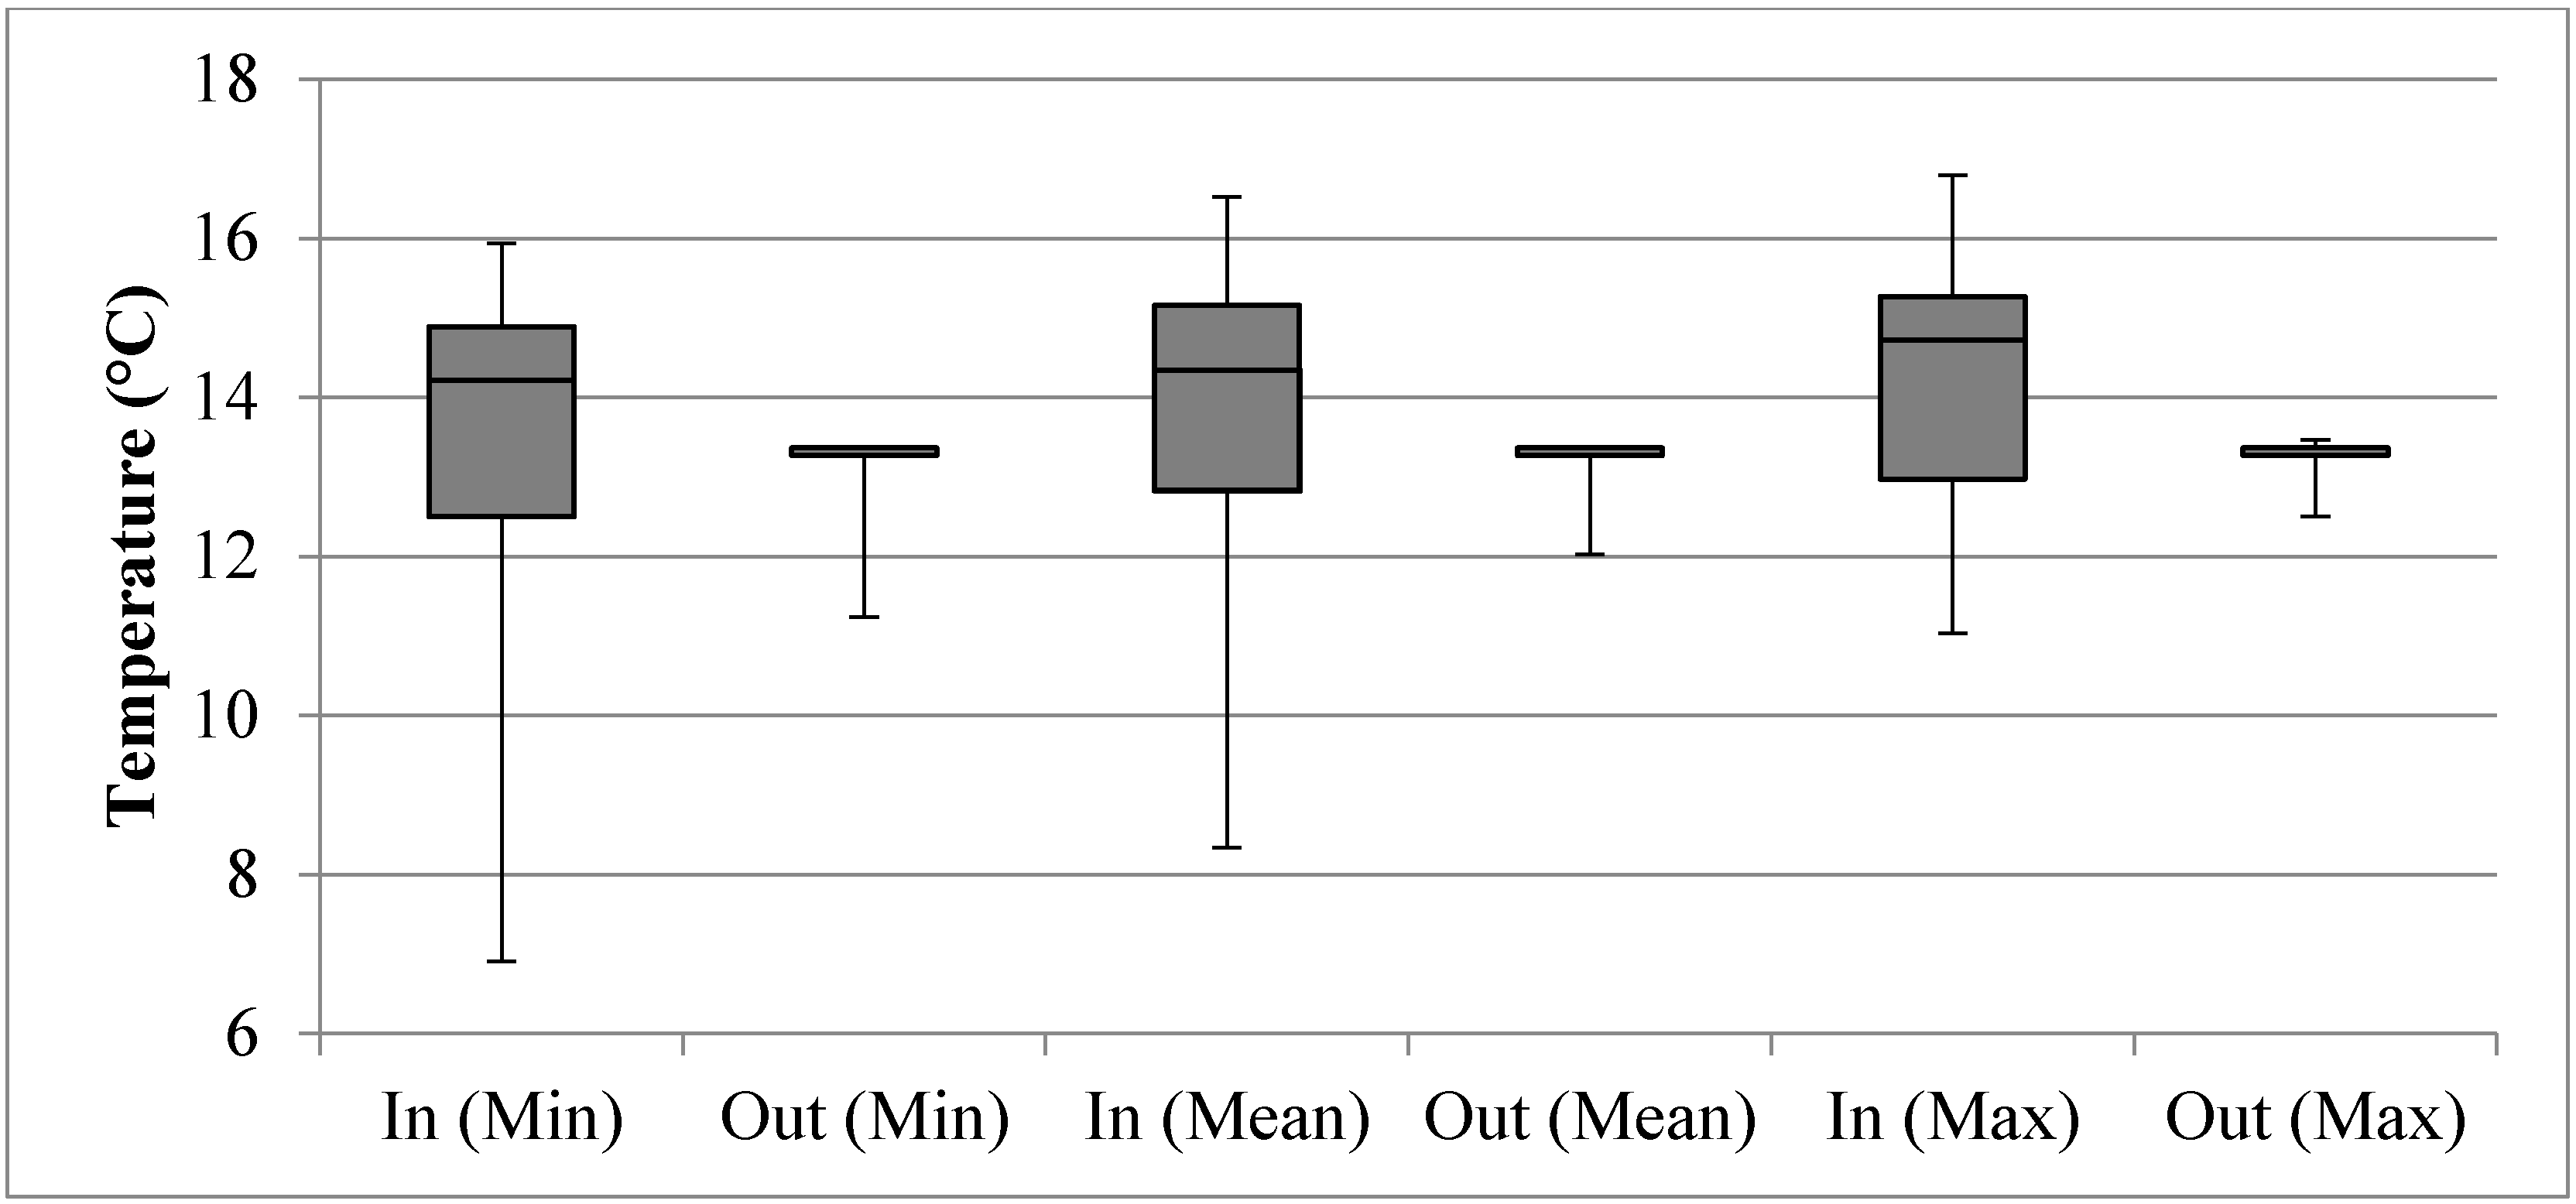
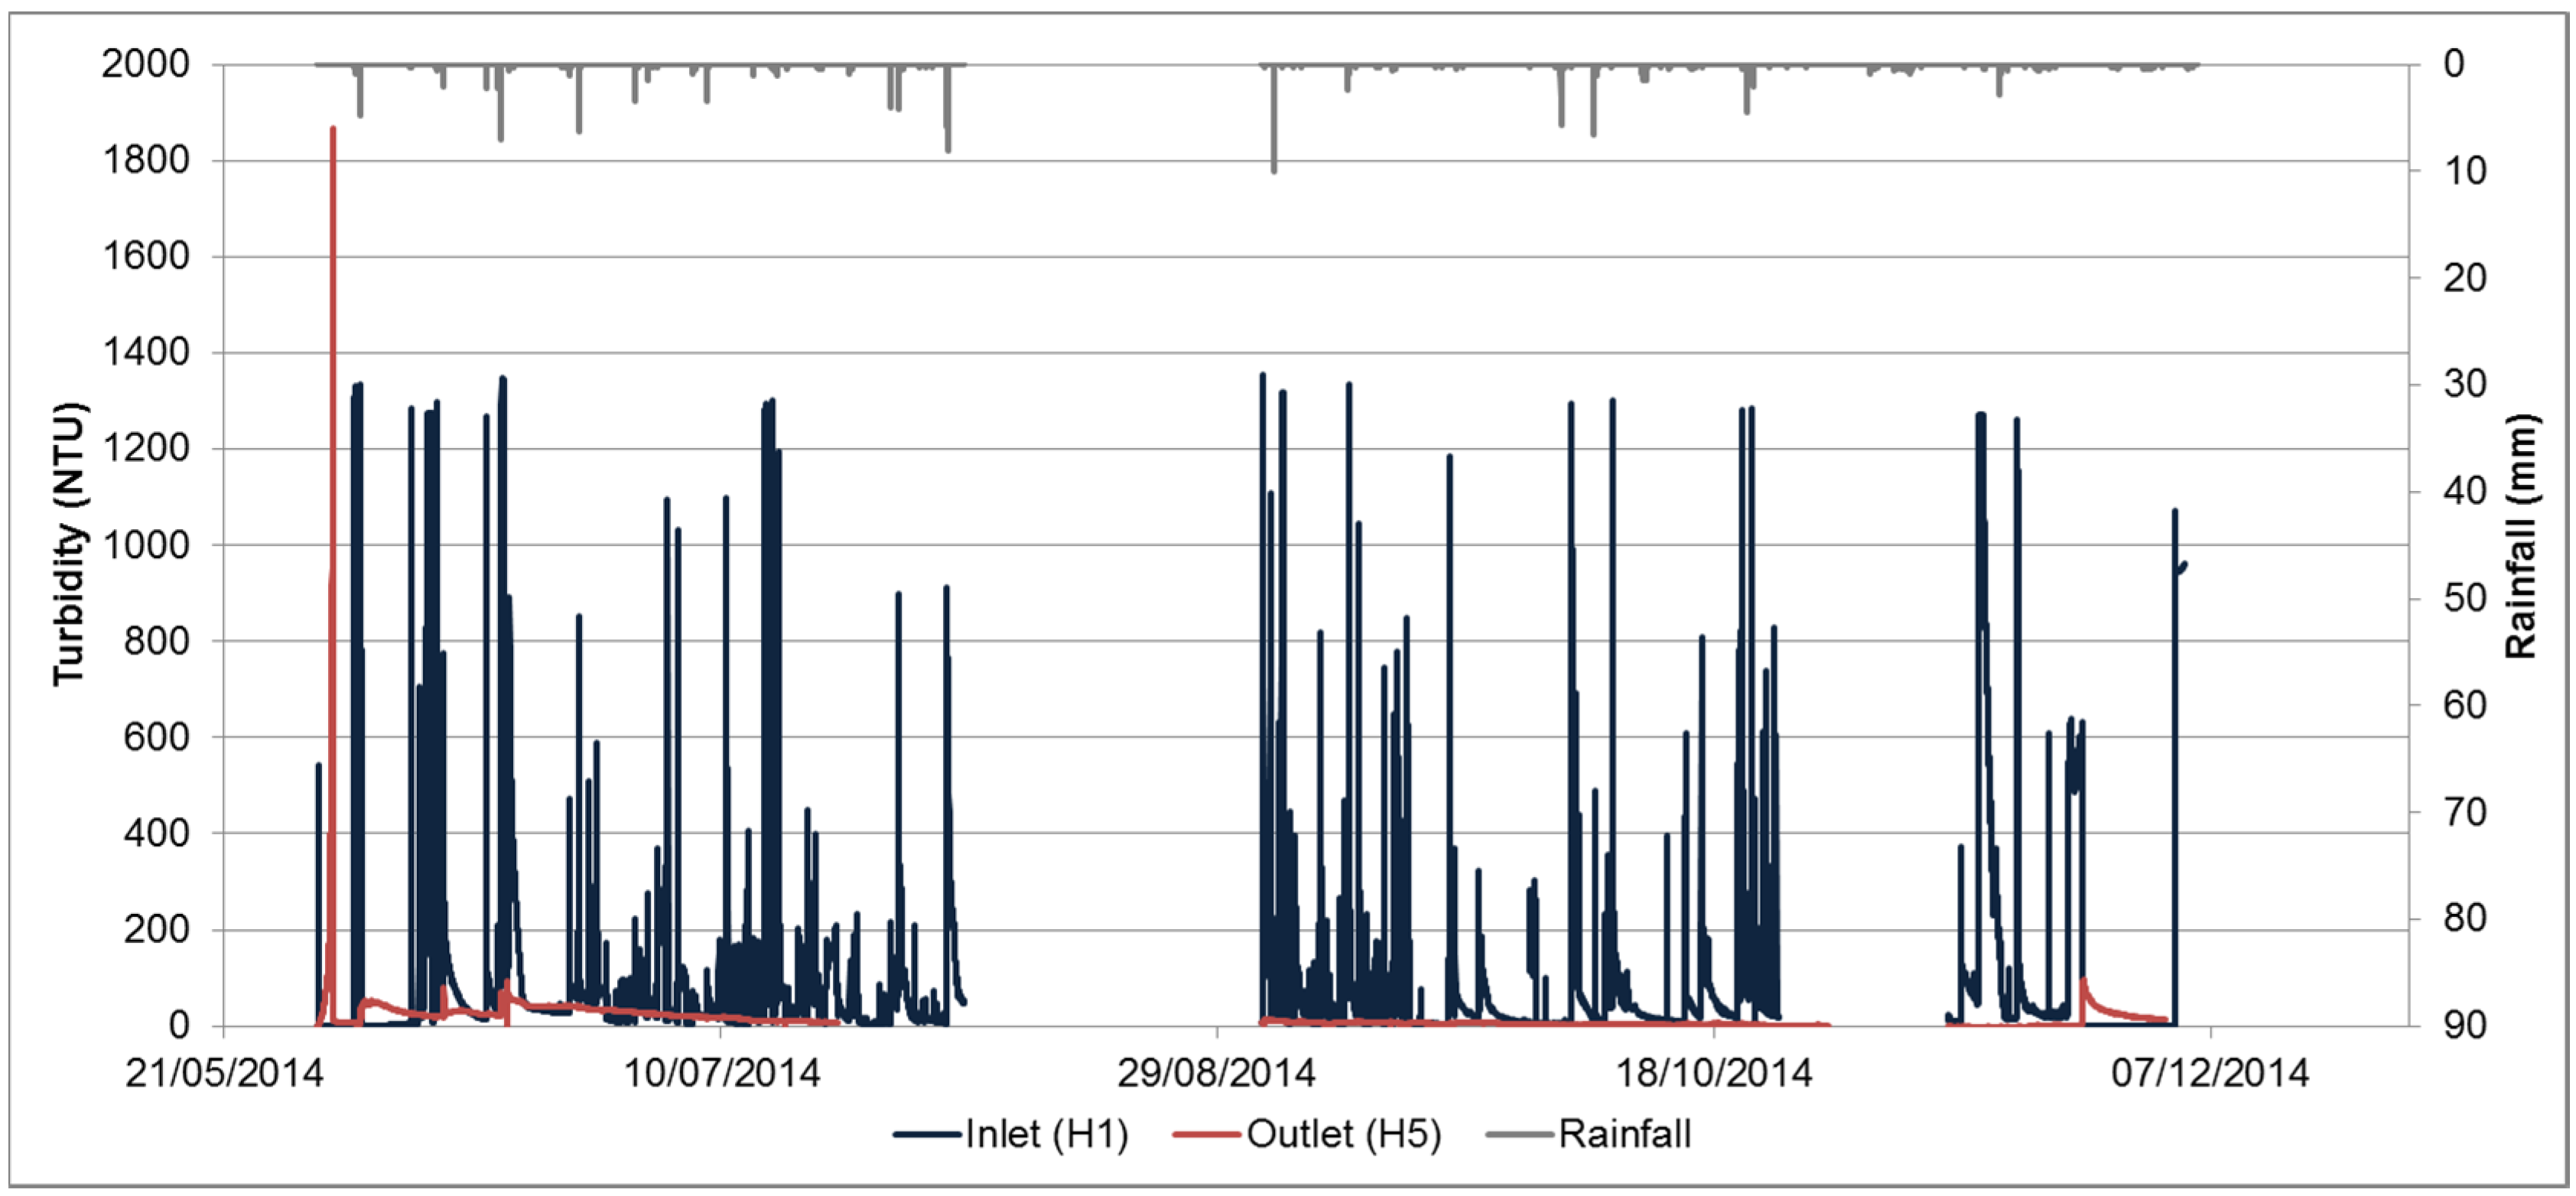
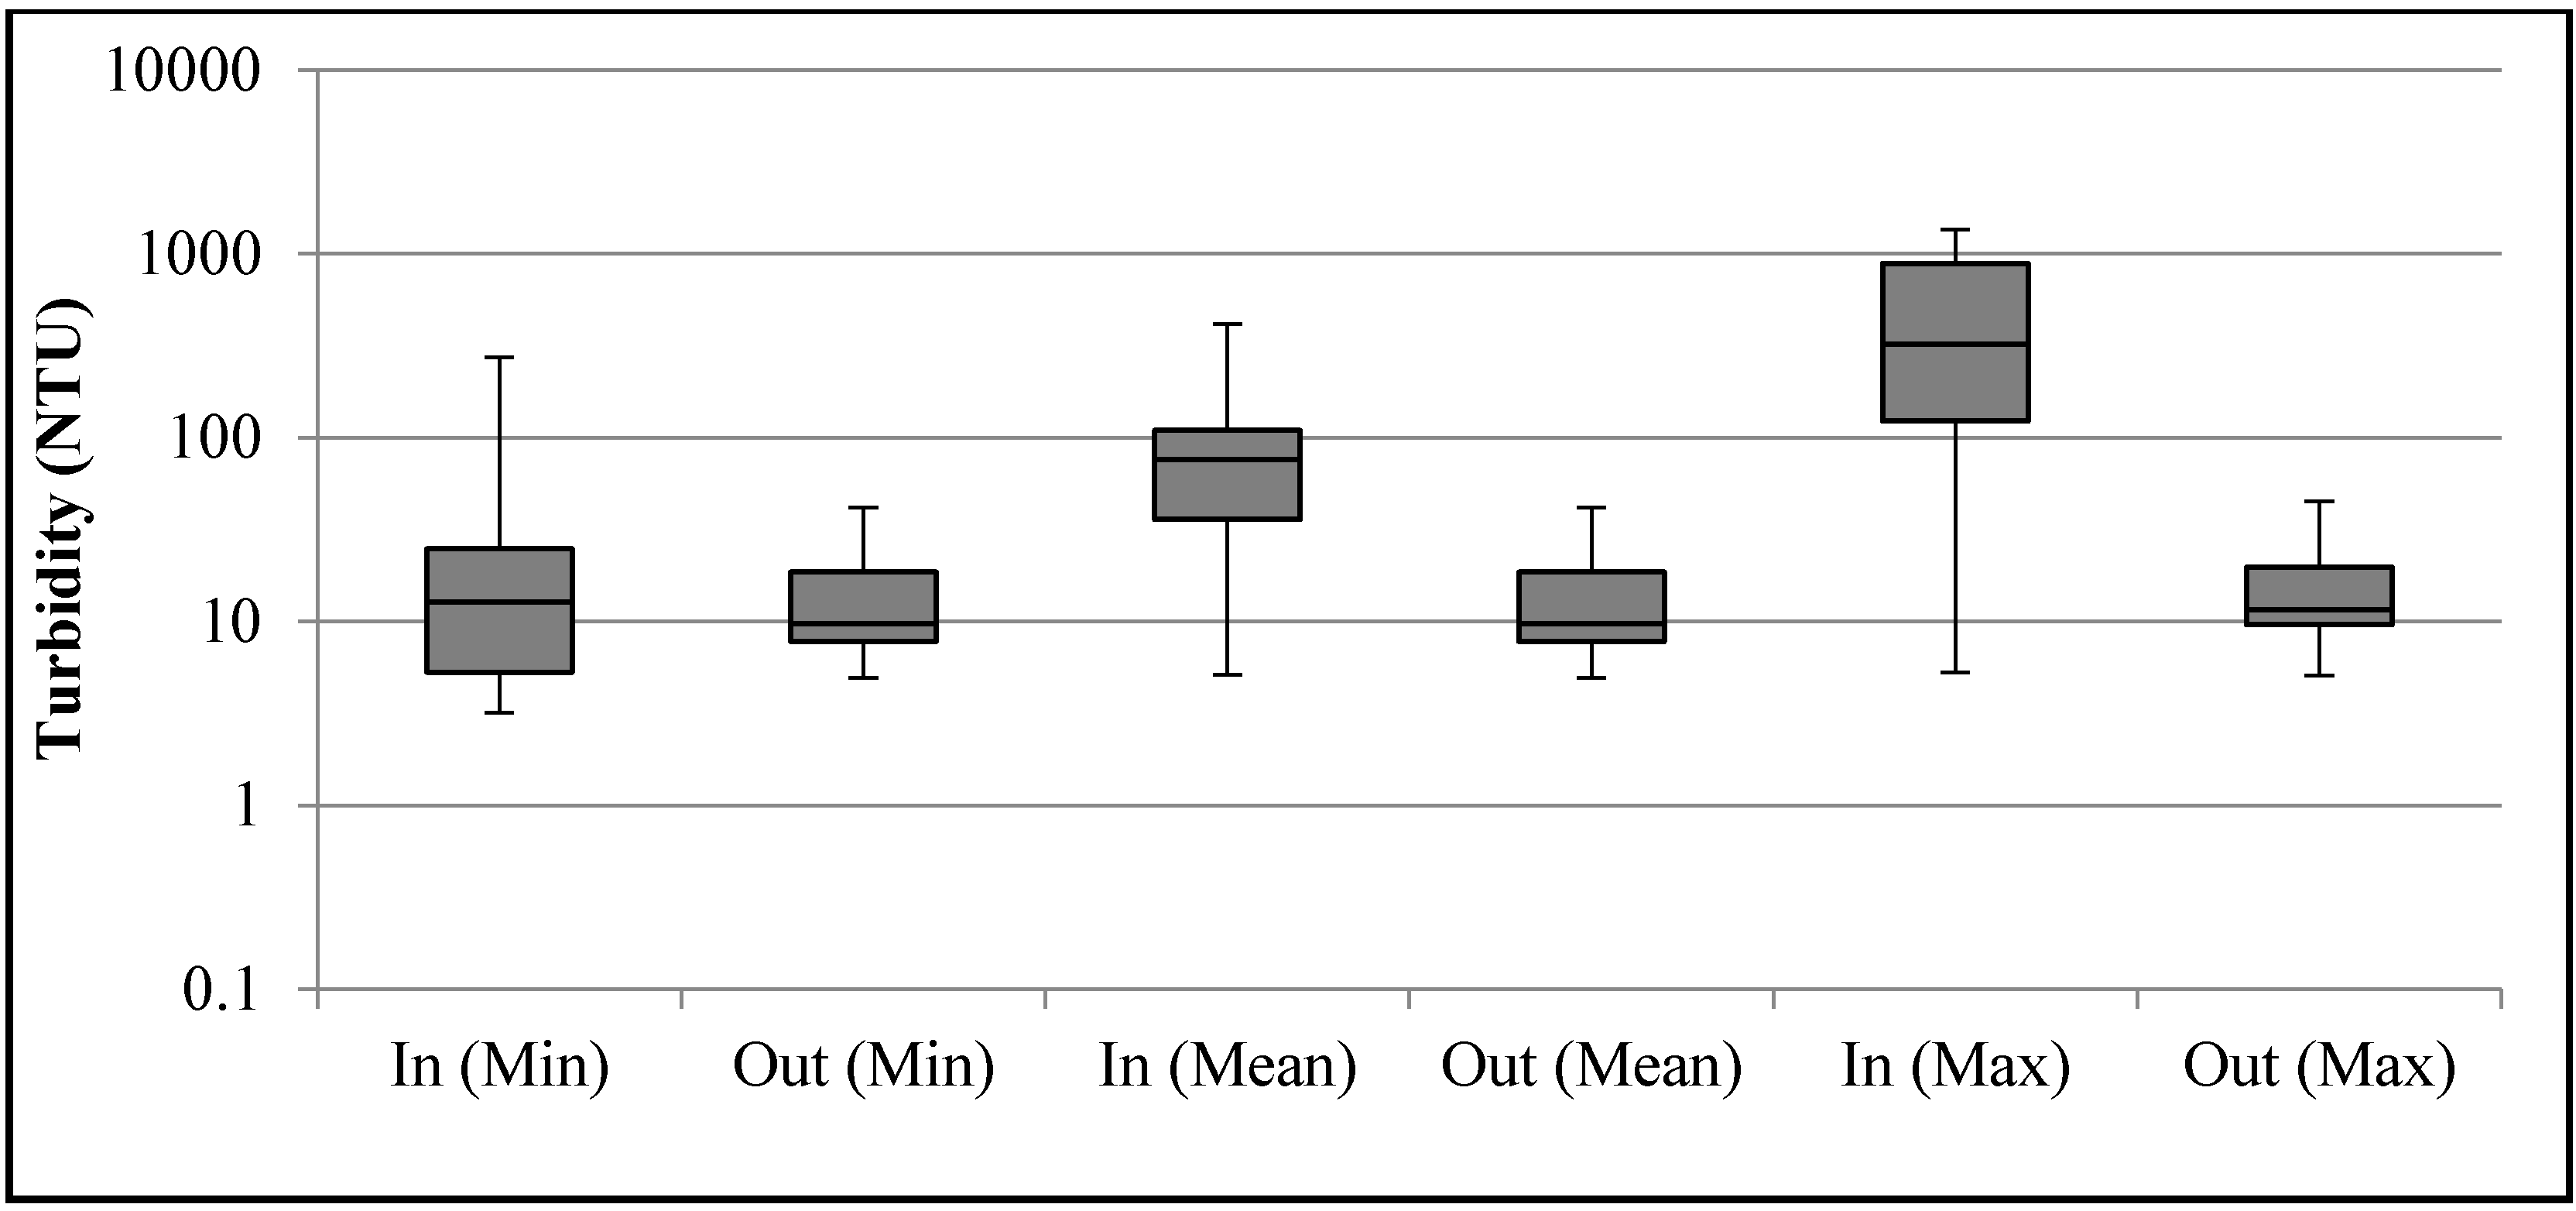
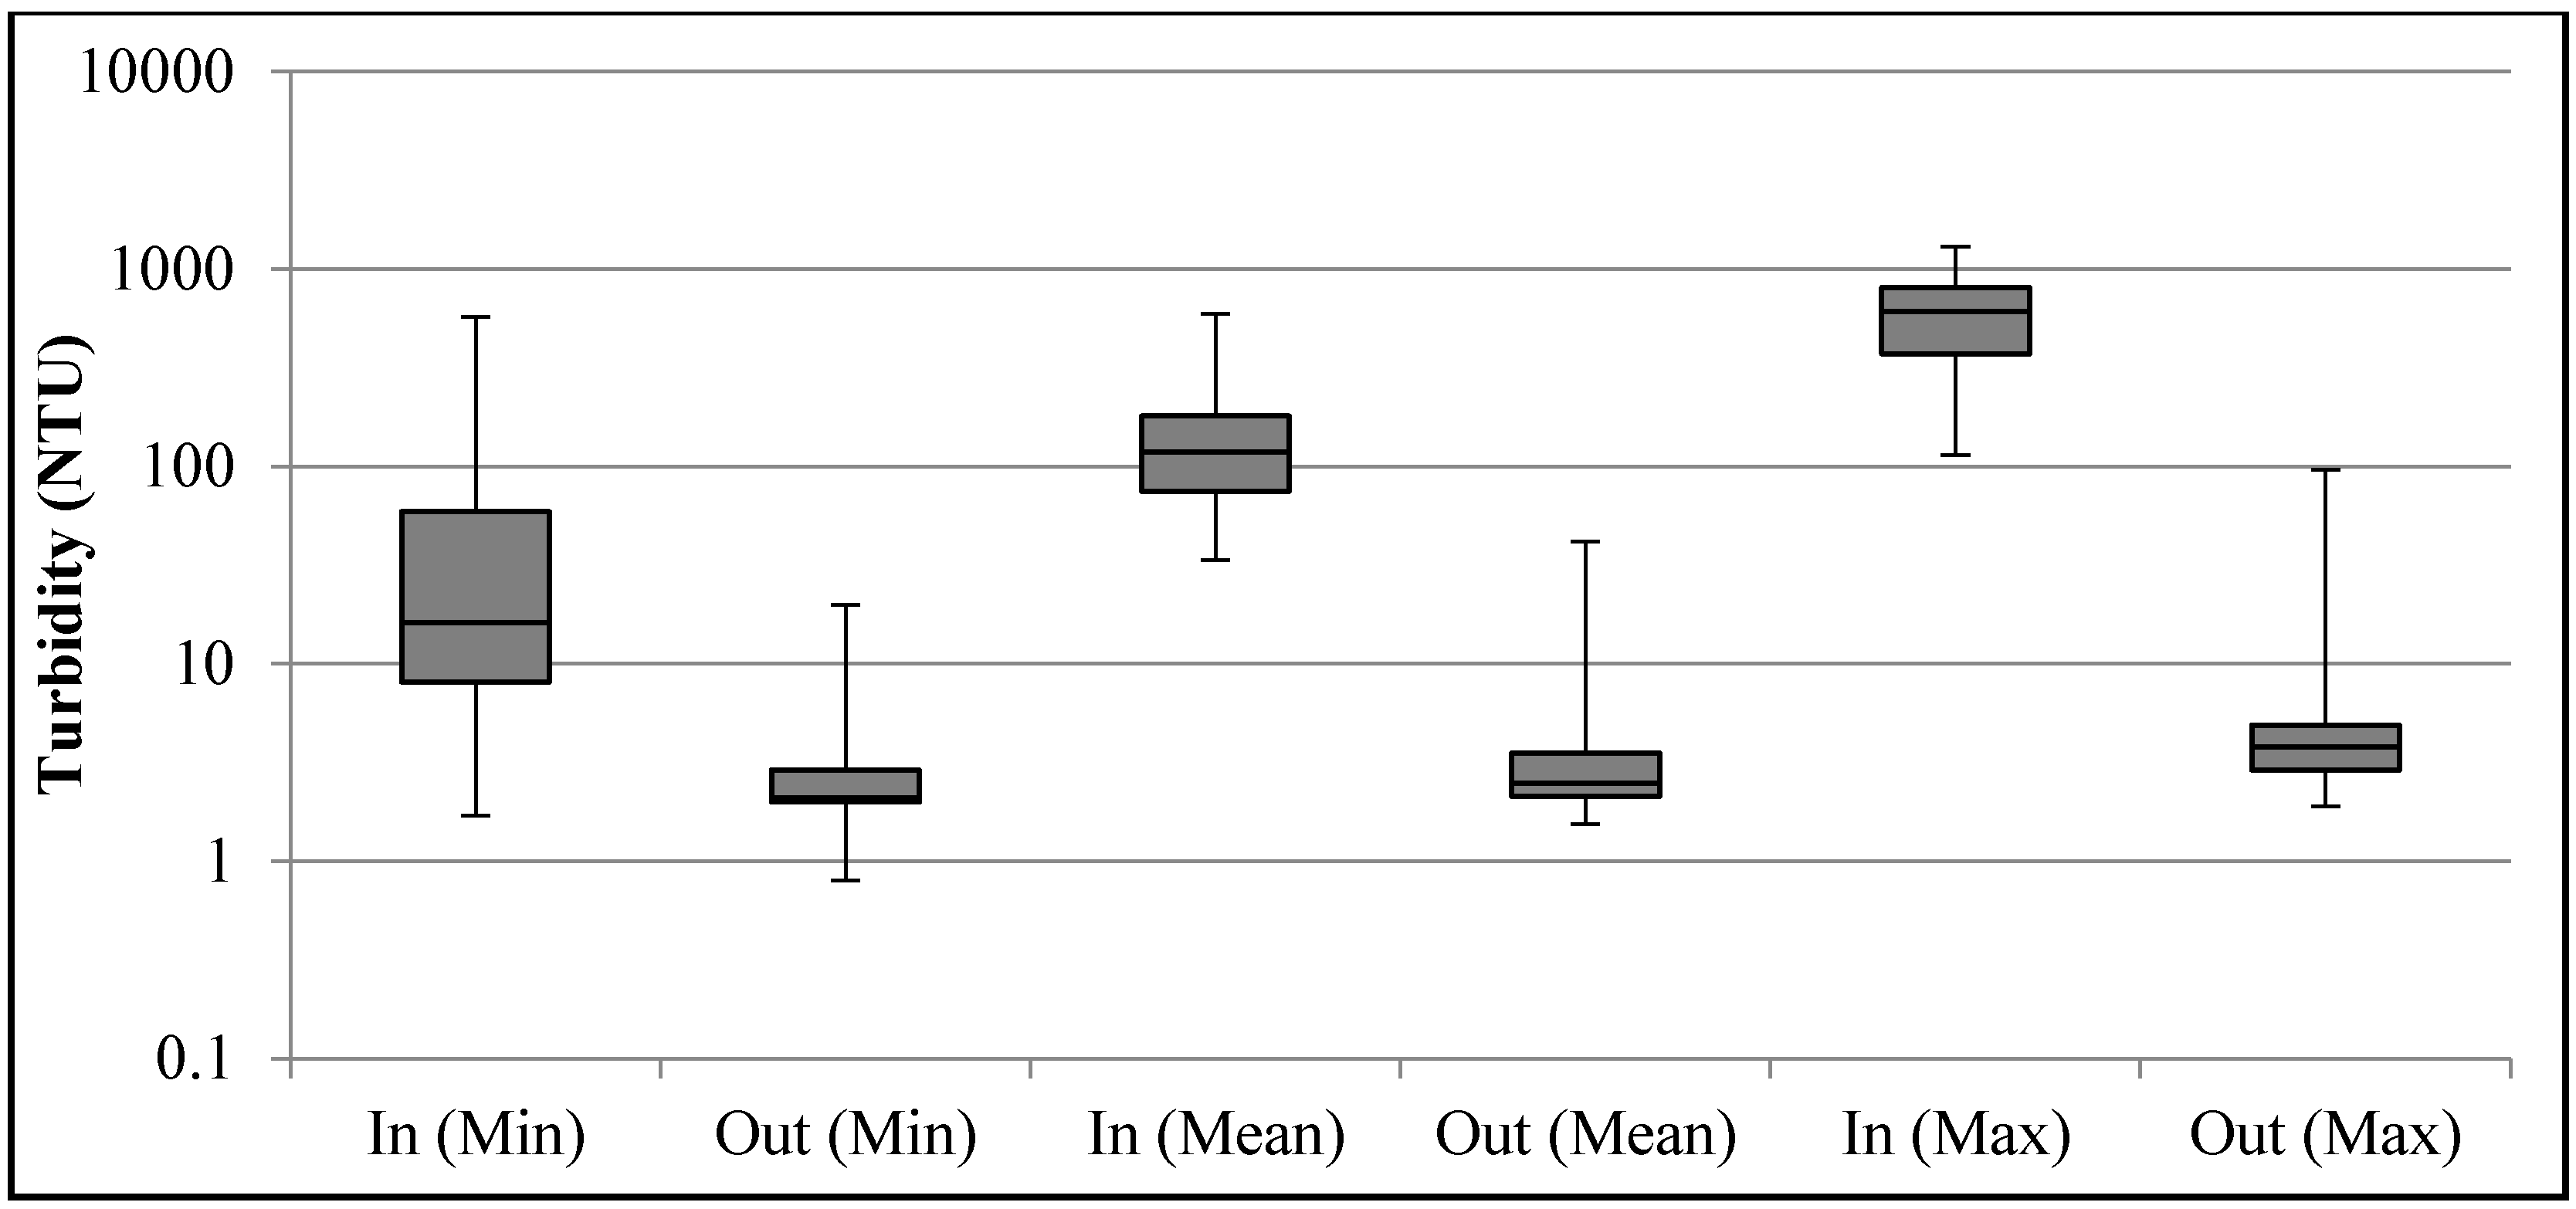
3.2. Stormwater Temperature and Turbidity

Temperature was monitored at the inlet and outlet to determine what effect USDCs have on the thermal properties of urban runoff. The time series record is provided in Figure 3 and a probability plot of the temperature data is shown in Figure 4. The gap in recorded inlet data between 24 October and 11 November 2014 was caused by a temporary malfunction of the HOBO temperature sensor. In total ninety discrete rainfall events were observed over the six month period generating forty-three measureable thermal events.
Throughout the summer and early fall (June–September) the temperature of water at the outlet of the USDC was consistently cooler than inlet waters. During the summer months peak inlet temperature regularly exceeded 18 °C during runoff events. At the outlet, the USDC water temperature increases steadily from 8 °C to its highest around 13 °C in October. Water temperatures then steadily decreased as the year progressed into November. The inlet temperature varied significantly more than outlet temperatures. Runoff is thermally enriched as it flows over warmed impervious surfaces (e.g., asphalt) to the sewer system and into the USDC. The water stored inside the USDC is not exposed to energy inputs including solar radiation and atmospheric temperature. As the concrete structure of the USDC is installed 1.4 m below ground, it is well insulated from above ground air temperature fluctuations. Results shown in Figure 3 illustrate that effluent from the USDC remains cool during warm summer months and does not exhibit diurnal patterns in water temperature as would be seen in a SWM pond. This is likely due to heat exchange between the warm inflowing runoff and the cool permanent pool water and concrete structure itself.
Over the time period noted by Circle 1 in Figure 3, a sharp drop and rise in the inlet temperature, and a sharp drop in the outlet temperature was observed. The drop was caused by a storm on 24th November that occurred during the night when air temperature was cooler than the permanent pool water temperature. Instead of being warmed by the impervious surfaces, the runoff entering the USDC was warmed as the stormwater flowed through the chambers. Outlet water temperatures were frequently warmer than inlet temperatures throughout November.
Figure 5 and Figure 6 present box plots of minimum, mean and maximum inlet and outlet temperatures during summer and fall runoff events, respectively. Relative to previous case studies of a USDC [1] the observed outlet temperatures were very cool. For summer storms the most significant thermal effect is a pronounced reduction in event maximums. On average, outlet maximum temperatures were 5 °C cooler than inlet maximum temperatures. Additionally, event mean and minimum temperatures were typically reduced by 4 °C and 2.7 °C respectively. It is important to recognize that the cool outlet temperatures observed by at the South Unionville USDC are influenced by the oversizing of the USDC. The temperature of the outflow eliminates the release of thermally enriched runoff and would be appropriate for discharge into coldwater streams [22,23]. For the general protection of aquatic life, daily mean temperatures of 18 °C and a maximum daily temperature of 19 °C is recommended [24]. Over the study, two events had inflow temperatures that exceeded the daily mean temperature guideline. More significantly, ten events had inflow temperatures that exceeded the daily maximum guideline. Outflow from the USDC never exceeded 13.5 °C demonstrating that the system provided a significant thermal buffering benefit.
During the fall (October and November) inlet and outlet water temperatures were very similar; averaging 13.8 °C and 13.2 °C during runoff events, respectively. Outlet temperatures were extremely uniform during the fall while inlet temperature were more variable ranging from 7 °C to 17 °C. Cold water species (e.g., brown trout, brook trout) require water temperatures of 13 °C or cooler for spawning during October and November [24]. Therefore the USDC mitigated thermal enrichment during rain events over these months also, particularly in October, to such an extent that outflow water could be released to a downstream receiving waterbody where coldwater fish spawning habitat exists.
The turbidity of inlet and outlet flows was also continuously monitored over the summer and fall (Figure 7, Figure 8, Figure 9 and Figure 10). In total thirty-eight turbidity events were observed.
In monitoring studies TSS and/or suspended solids (SS) [5,8,19,21,25,26,27] has been reported more often than turbidity [20,26]. During runoff events, the mean turbidity at the inlet was 33 NTU which is higher than inlet turbidities reported in several pond monitoring studies (e.g., 17 NTU [20], 9–21 NTU [26]). During the data collection several areas within the South Unionville USDC remained under active construction with un-stabilized soils. Therefore, it is not entirely surprising that runoff delivered to the USDC was often highly turbid. During runoff events, the mean turbidity at the USDC outlet was 8.8 NTU which is also higher than levels reported in some of the SWM pond literature (1 NTU [20]).
Turbidity at the USDC outlet, in both the summer and fall, was an order of magnitude smaller than inlet levels. Provincial Water Quality Objectives (i.e., local drinking water standards) recommend a turbidity of less than 5 NTU [28]. Outlet turbidity was above this objective during summer runoff events but was achieved during some fall events. For the protection of aquatic life, it is recommended that high flow water with background levels greater than 80 NTUs should not experience more than a 10% increase during short term events [29]. For the majority of runoff events this target was achieved.

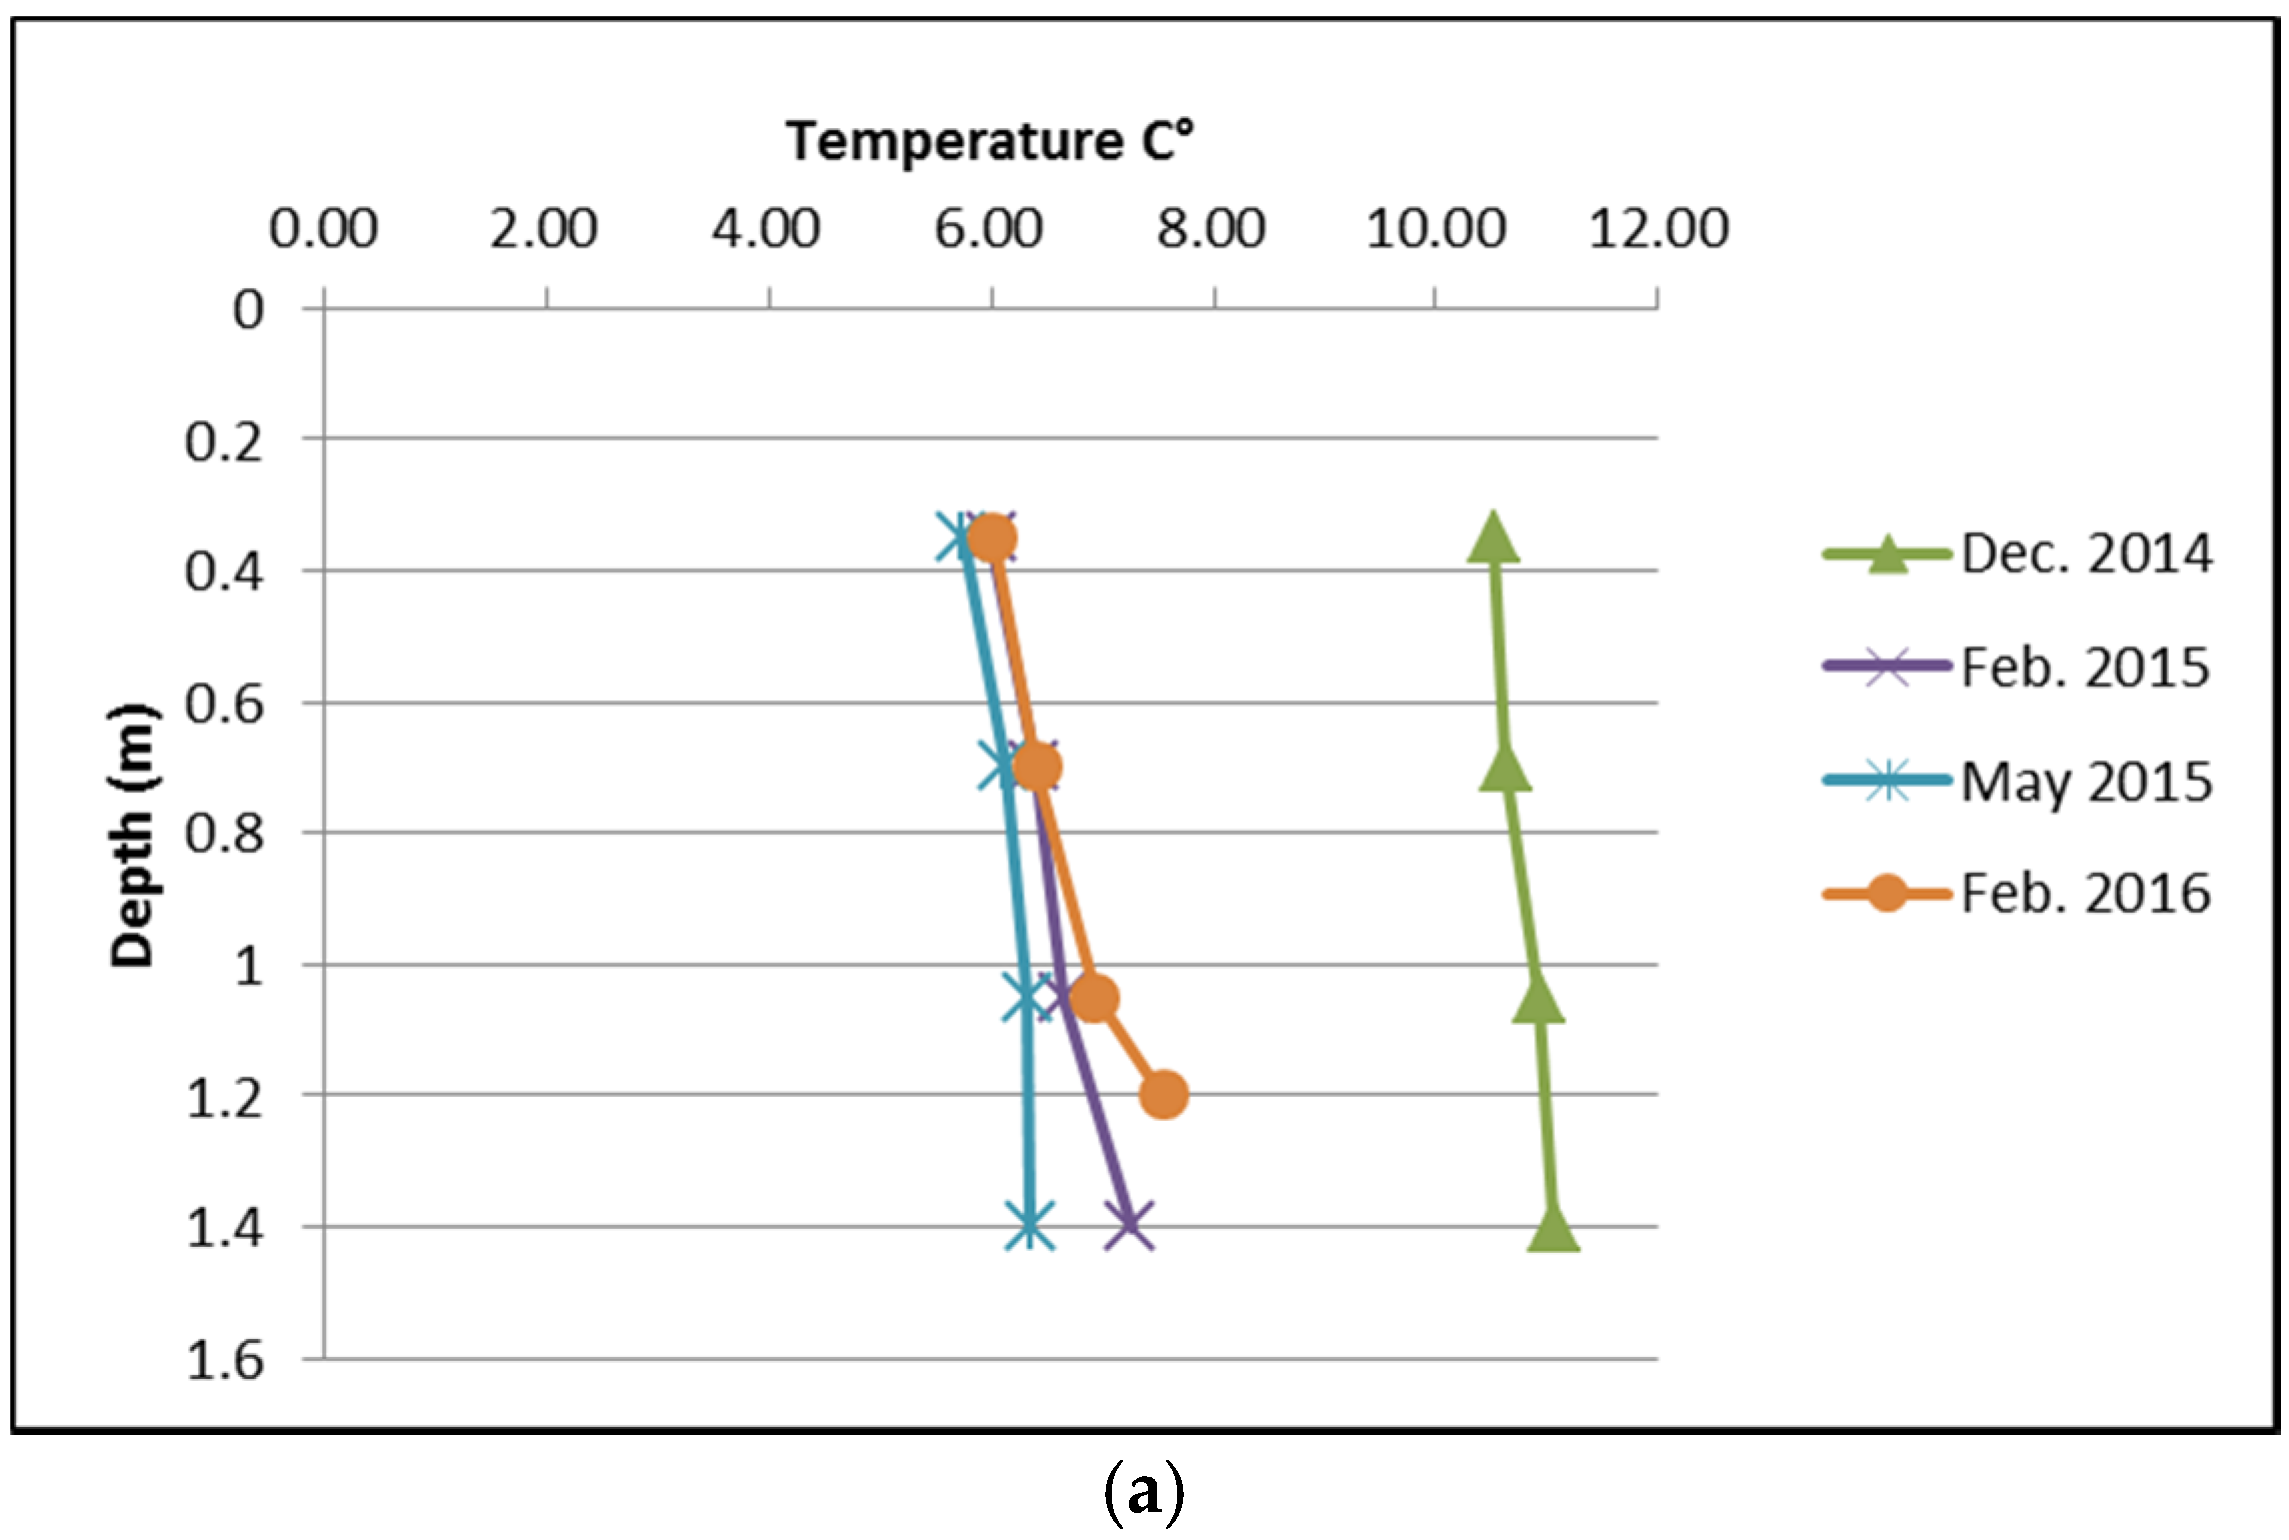
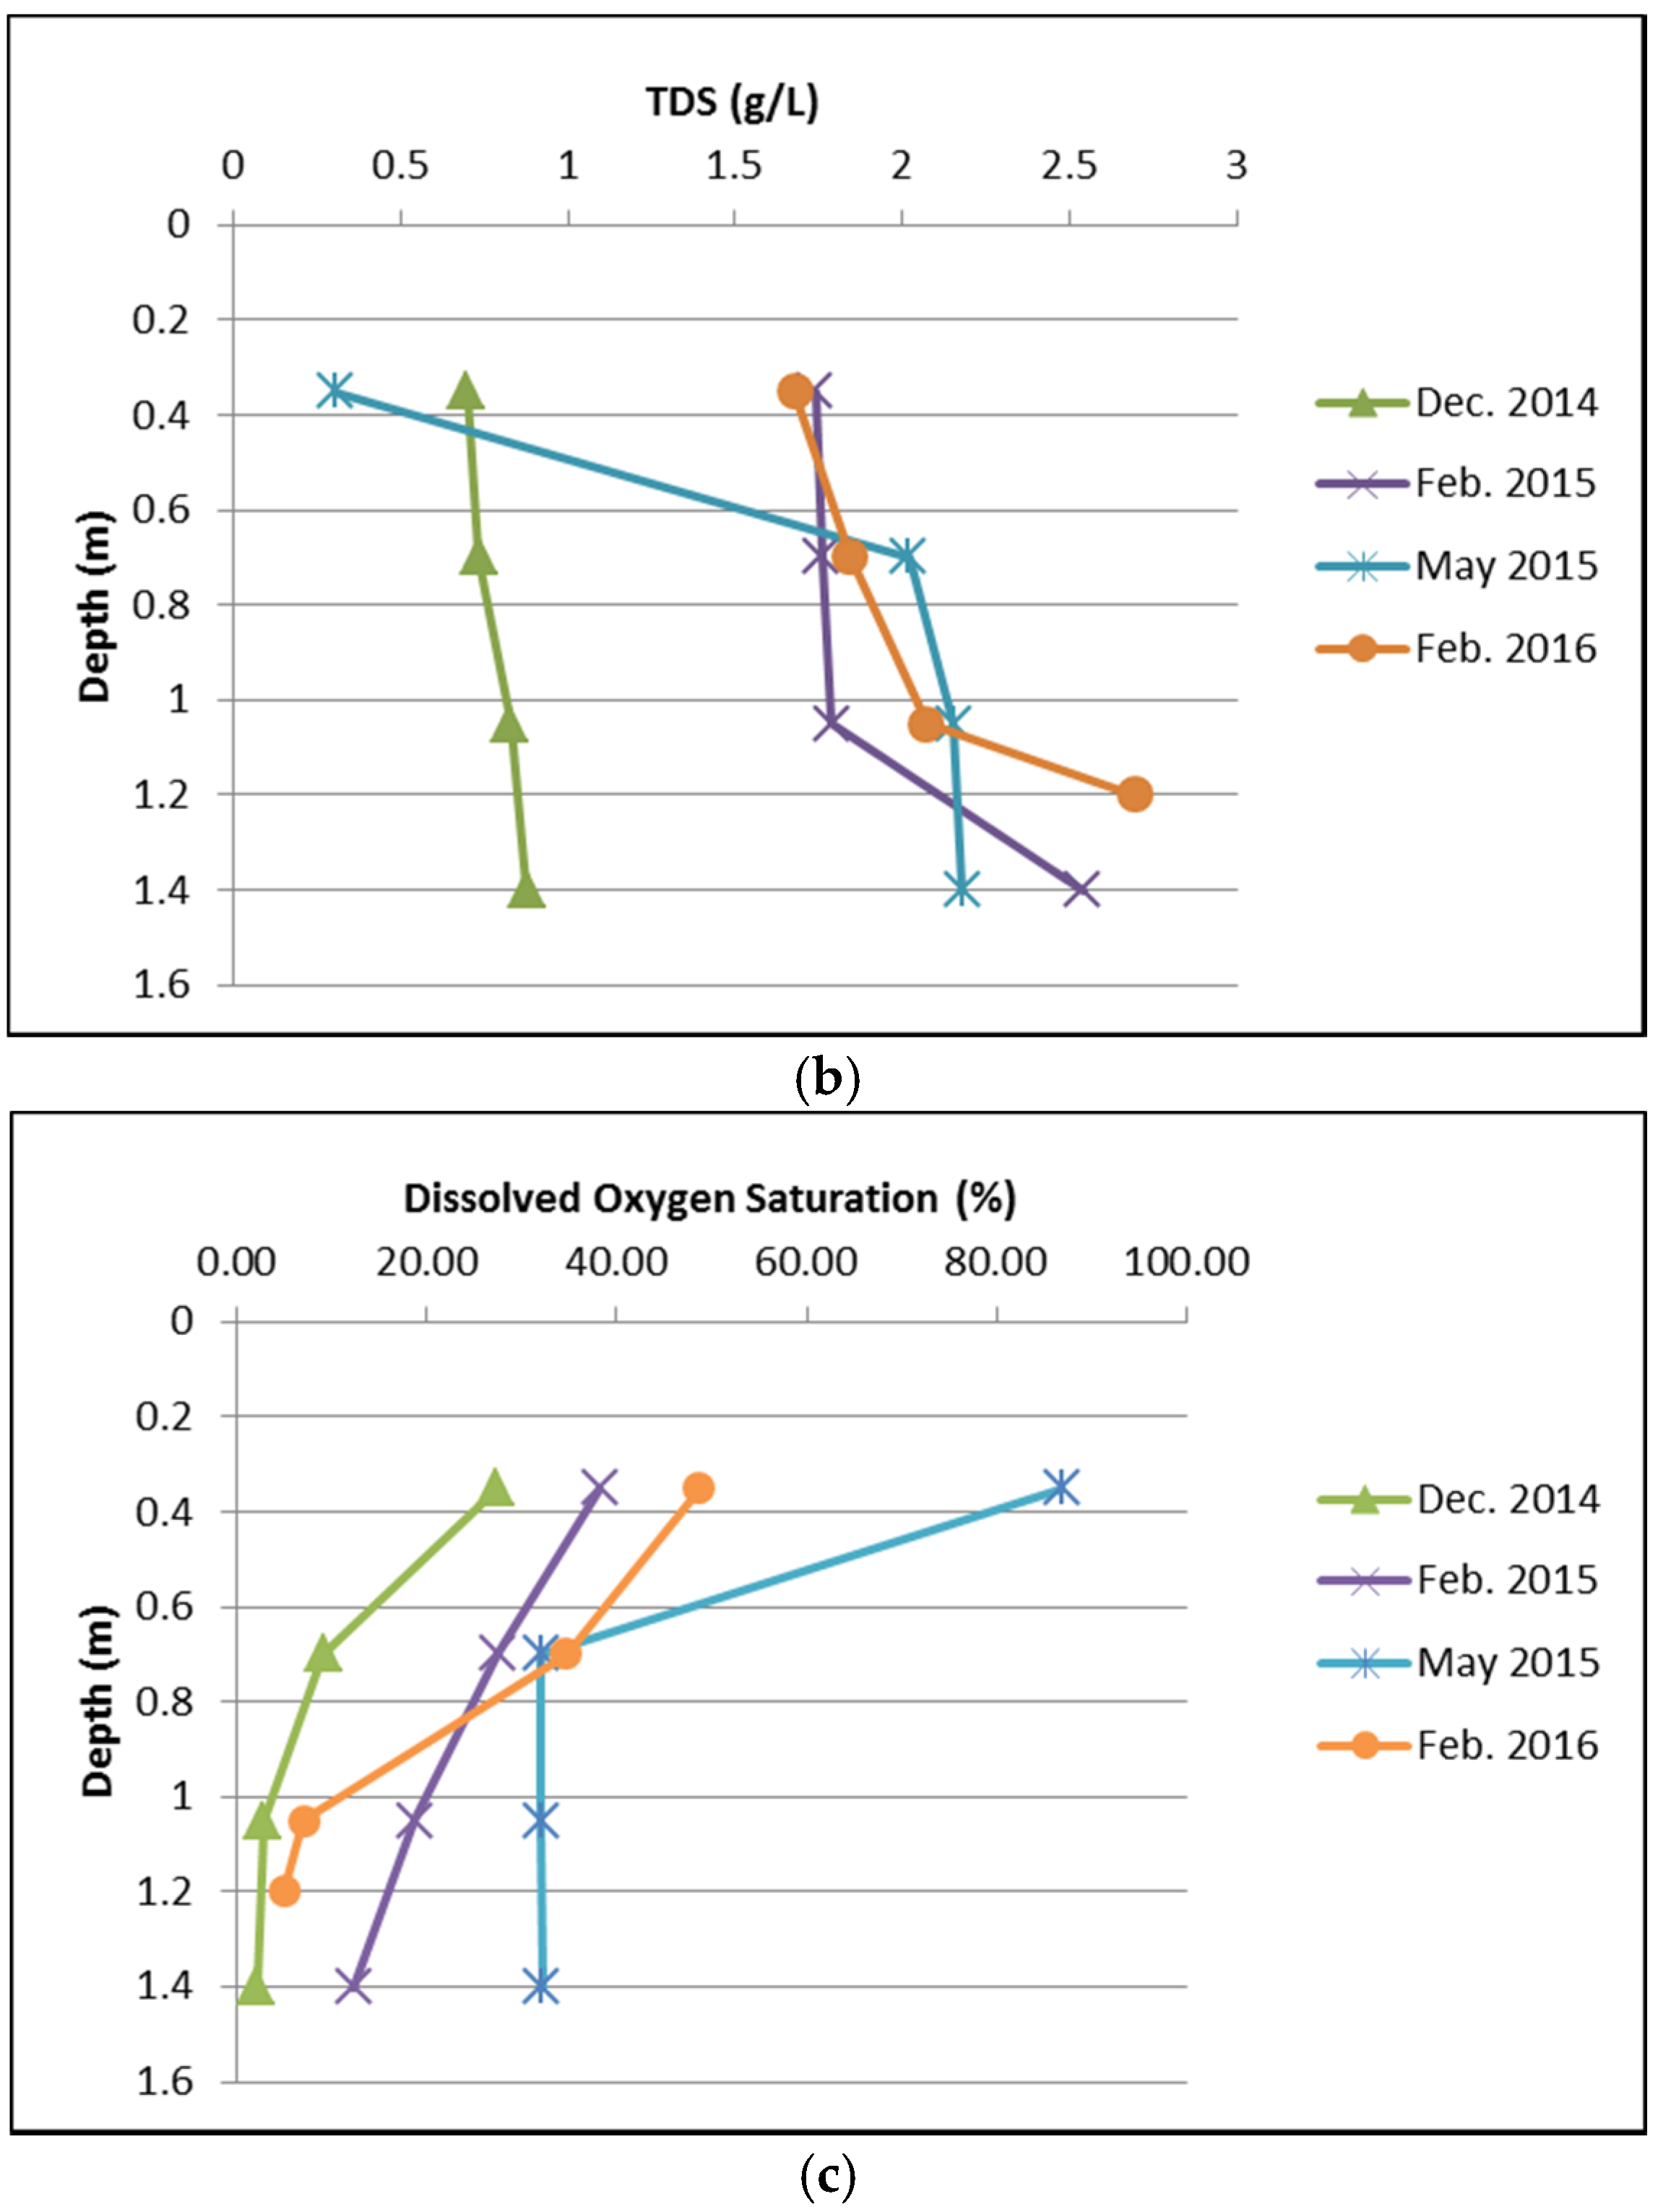
3.3. Vertical Profiles

Vertical measurements of temperature, TDS (calculated from specific conductivity measurements) and DO (Figure 11) show that DO stratification was present within the USDC permanent pool water column at times during the study period. Water temperatures and TDS only slightly increased (≤1.6 °C and <2 g/L, respectively) with depth. Therefore the USDC appears to have limited stratification.
DO levels were found to decrease with depth and exhibited some stratification (Figure 10). The DO stratification is likely due to accumulation and decomposition of fine particulate organic matter in the permanent pool. For the protection of warm water aquatic life it is recommended that DO concentrations remain above 6 mg/L [28]. The water in the USDC was found to be below the minimum acceptable DO concentration for protection of aquatic organisms at all depths in the 10 March 2014, 2 December 2014 and 18 February 2015 profiles and for the majority of the 4 May 2015 profile (Figure 10). The low DO levels are an important drawback of USDC and should be considered seriously by designers when selecting underground detention systems as a stormwater control and treatment approach. To gain a better understanding of dissolved solids and DO stratification in USDCs and how it compares to SWM ponds, further sampling is required to capture conditions after a longer period of the USDC being in service, during winter, spring and summer months, and over the course of individual storm events.

4. Conclusions

The stormwater treatment performance of a newly constructed StormTrap® DoubleTrap™ USDC was studied using field monitoring equipment installed in the South Unionville neighbourhood located in Markham, Ontario. Continous monitoring during natural storm events was performed by TRCA technicians from May to December 2014. The USDC was found to provide water quality benefits for many monitored pollutants. The USDC achieved: an overall 82% removal efficiency of TSS, and an average reduction in temperature of 4 °C between the inlet and outlet with little to no variation in temperature at the outlet during storm events. Over the study period, outlet temperatures never exceeded 13.5 °C highlighting that USDCs are viable end-of-pipe alternative to traditional ponds in watersheds that support coldwater fish populations. Vertical profiles conducted during the winter and spring months revealed that there is little to no temperature nor TDS gradients after twenty-one months of routine operation, but DO stratification was observed.
The treatment capability of the South Unionville USDC was compared against values found in the literature for SWM ponds [8,9,20,21]. The performance of the South Unionville USDC was enhanced by the oversizing caused by a reduction of the design catchment area (7.97 ha) to the as-built area (5.24 ha). Oversizing is undesirable as it unnecessarily increases construction costs.
Biological processes, microbioal, pathogen and vectors are important water quality considerations but were beyond the scope of this project. Additional sampling is needed of key water quality indicators such as bacteria (e.g., E. coli) to determine if USDCs support baterial populations which may be harmful to human health or negatively impact beneficial uses of downstream receiving waterbodies. Low (<4 mg/L) and, in some instances, anoxic conditions (DO < 0.5 mg/L) were observed within the USDC permanent pool water column. Futher investigation is needed to determine if the level of DO in outlet waters meets requirements for the protection for aquatic life (DO > 6 mg/L). Study of DO dynamics within the USDC is needed to understand the potential effects that low DO levels may have on the fate of pollutants such as phosphorus that become more soluable anoxic and low pH conditions.
The long term performance of USDCs must also be studied. This continous monitoring program took place over a single year, in order to ascertain the treatment performance of USDC over their full operating life cycle, a long term study should be conducted. This would assist in determining the long term maintenance requirements for sediment and debris removal. Extended monitoring can also be used to determine whether the accumulation of sediment has an effect on the hydraulics or treatment processes of USDCs.

Supplementary Materials

The following are available online at www.mdpi.com/2073-4441/8/5/211/s1, Table S1: Water quality statistical analysis results.

Acknowledgments

Funding for this research was provided by the Toronto and Region Conservation Authority, StormTrap and MITACS Accelerate. In-kind services were provided by Toronto and Region Conservation Authority and Con Cast Pipe.

Author Contributions

Data collection for this project was managed by Dean Young. Analysis work was completed by Nicholas McIntosh as part of the degree requirements for his MASc thesis at the University of Toronto. Jennifer Drake served as Nicholas McIntosh’s academic supervisor. Writing for the paper was completed by Jennifer Drake and Nicholas McIntosh with editing provided by Dean Young.

Conflicts of Interest

The authors declare no conflict of interest.

Abbreviations

The following abbreviations are used in this manuscript:
DODissolved oxygen
EMCEvent mean concentration
PWQOProvincial Water Quality Objective
NTUNephelometric Turbidity Unit
STEPSustainable Technologies Evaluation Program
SWMStormwater management
TDSTotal dissolved solids
TRCAToronto and Region Conservation Authority
TSSTotal suspended solids
USDCUnderground stormwater detention chamber

References

  1. Natarajan, P.; Davis, A. Thermal Reduction by an Underground Storm-Water Detention System. J. Environ. Eng. 2010, 136, 520–526. [Google Scholar] [CrossRef]
  2. Thomson, N.; McBean, E.; Snodgrass, W.; Mostrenko, I. Sample Size Needs for Characterizing Pollutant Concentrations in Highway Runoff. J. Environ. Eng. 1997, 123, 1061–1065. [Google Scholar] [CrossRef]
  3. Marsalek, P.; Watt, W.E.; Marsalek, J.; Anderson, B.C. Winter operation of an on-stream stormwater management pond. Water Sci. Technol. 2003, 48, 133–143. [Google Scholar] [PubMed]
  4. Brabec, E.; Schulte, S.; Richards, P.L. Impervious surfaces and water quality: A review of current literature and its implications for watershed planning. J. Plan. Lit. 2002, 16, 499–514. [Google Scholar] [CrossRef]
  5. Carpenter, J.; Vallet, B.; Pelletier, G.; Lessard, P.; Vanrollegham, P. Pollutant removal efficiency of a retrofitted stormwater detention pond. Water Qual. Res. J. Can. 2014, 49, 124–134. [Google Scholar] [CrossRef]
  6. Koch, B.; Febria, C.; Gevrey, M.; Wainger, L.; Palmer, M. Nitrogen removal by stormwater management structures: A data synthesis. J. Am. Water Resour. Assoc. 2014, 50, 1594–1607. [Google Scholar] [CrossRef]
  7. Hathaway, J.; Hunt, W. Indicator bacteria performance of storm water control measures in Wilmington, North Carolina. J. Irrig. Drain Eng. 2012, 138, 157–197. [Google Scholar] [CrossRef]
  8. Fassman, E. Stormwater BMP treatment performance variability for sediment and heavy metals. Sep. Purif. Technol. 2012, 84, 95–103. [Google Scholar] [CrossRef]
  9. Ontario Ministry of the Environment. Stormwater Management Planning and Design Manual; Queen’s Printer for Ontario: Toronto, ON, Canada, 2003. [Google Scholar]
  10. Borne, K. Floating treatment wetland influences on the fate and removal performance of phosphorus in stormwater retention ponds. Ecol. Eng. 2014, 69, 76–82. [Google Scholar] [CrossRef]
  11. Maruejouls, T.; Lessard, P.; Wipliez, B.; Pelletier, G.; Vanrolleghem, P. Characterization of the potential impact of retention tank emptying on wastewater primary treatment: A new element for CSO management. Water Sci. Technol. 2011, 64, 1898–1905. [Google Scholar] [CrossRef] [PubMed]
  12. Karlsson, K.; Viklander, M.; Scholes, L.; Revitt, M. Heavy metal concentrations and toxicity in water and sediment from stormwater ponds and sedimentation tanks. J. Hazard. Mater. 2010, 178, 612–618. [Google Scholar] [CrossRef] [PubMed]
  13. He, J.; Valeo, C.; Chu, C. Variation in water quality of a stormwater pond from diurnal thermal stratification. J. Water Resour. Hyd. Eng. 2015, 4, 189–198. [Google Scholar] [CrossRef]
  14. Marsalek, P.; Watt, W.E.; Marsalek, J.; Anderson, B.C. Winter flow dynamics of an on-stream stormwater management pond. Water Qual. Res. J. Can. 2000, 35, 505–523. [Google Scholar]
  15. McEnroe, N.A.; Buttle, J.M.; Marsalek, J.; Pick, F.R.; Xenopoulos, M.A.; Frost, P.C. Thermal and chemical stratification of urban ponds: Are they “completely mixed reactors”? Urban Ecosyst. 2013, 16, 327–339. [Google Scholar] [CrossRef]
  16. Song, K.; Xenopoulos, M.A.; Buttle, J.M.; Marsalek, J.; Wagner, N.D.; Pick, F.R.; Frost, P.C. Thermal Stratification Patterns in Urban Ponds and their relationships with Vertical Nutrient Gradients. J. Environ. Manag. 2013, 127, 317–323. [Google Scholar] [CrossRef] [PubMed]
  17. Toronto and Region Conservation Authority. Memorandum: Proposed Surface Water Monitoring Program for the South Unionville Square DoubleTrap Performance Evaluation; Toronto and Region Conservation Authority: Toronto, ON, Canada, 2012. [Google Scholar]
  18. Toronto and Region Consernation Authority. Rouge River Watershed Fisheries Management Plan; Toronto and Region Conservation Authority and the Ontario Ministry of Natural Resources: Toronto, ON, Canada, 2011. [Google Scholar]
  19. Ontario Ministry of Transportation. IDF Curve Lookup Online Tool. 2012. Available online: http://www.mto.gov.on.ca/IDF_Curves/map_acquisition.shtml (accessed on 12 May 2016). [Google Scholar]
  20. International Stormwater BMP Database. International Stormwater Best Management Practices (BMP) Database Pollutant Category Statistical Summary Report: Solids, Bacteria, Nutrients, and Metals. Available online: http://www.bmpdatabase.org/Docs/2014%20Water%20Quality%20Analysis%20Addendum/BMP%20Database%20Categorical_StatisticalSummaryReport_December2014.pdf (accessed on 12 May 2016).
  21. Stormwater Assessment Monitoring and Performance Program. Synthesis of Monitoring Studies Conducted under the Stormwater Assessment Monitoring and Performance Program; Toronto and Region Conservation Authority: Toronto, ON, Canada, 2005. [Google Scholar]
  22. Chu, C.; Jones, N.; Piggot, A.; Buttle, J. Evaluation of a Simple Method to Classify the Thermal Characteristics of Streams Using a Nanogram of Daily Maximum Air and Water Temperatures. N. Am. J. Fish. Manag. 2009, 29, 1605–1619. [Google Scholar] [CrossRef]
  23. Stoneman, C.; Jones, M. A simple method to classify stream thermal stability with single observations of daily maximum water and air temperatures. N. Am. J. Fish. Manag. 1996, 16, 728–737. [Google Scholar] [CrossRef]
  24. British Columbia Ministry of Environment. Water Quality Guidelines for Temperature. 2001. Available online: http://www.env.gov.bc.ca/wat/wq/BCguidelines/temptech/temperature.html (accessed on 12 May 2016). [Google Scholar]
  25. Wium-Anderson, T.; Nielsen, A.; Hvitved-Jakobsen, T.; Vollertsen, J. Heavy metals, PAHs and toxicity in stormwater wet detention ponds. Water Sci. Technol. 2011, 64, 503–511. [Google Scholar] [CrossRef]
  26. Mallin, M.; Ensign, S.; Wheeler, T.; Mayes, D. Pollutant removal efficacy of three wet detention ponds. J. Environ. Qual. 2002, 31, 654–660. [Google Scholar] [CrossRef] [PubMed]
  27. Winston, R.; Hunt, W.; Kennedy, S.; Merriman, L.; Chandler, J.; Brown, D. Evaluation of floating treatment wetlands as retrofits to existing stormwater retention ponds. Ecol. Eng. 2013, 54, 254–265. [Google Scholar] [CrossRef]
  28. Ontario Ministry of Environment and Energy. Water Management: Policies, Guidelines, Provincial Water Quality Objectives; Queen’s Printer for Ontario: Toronto, ON, Canada, 1999. [Google Scholar]
  29. Canadian Council of Ministers of the Environment. Water Quality for the Protection of Aquatic Life. 2015. Available online: http://www.ccme.ca/en/resources/canadian_environmental_quality_guidelines/ (accessed on 12 May 2016).
Figure 1. South Unionville Underground Stormwater Detention Chambers (USDC) Location and Service Area.
Water 08 00211 g001
Figure 2. South Unionville USDC plan view with monitoring equipment layout.
Water 08 00211 g002

LocationDescriptionData Collected
1Inlet PipeDepth sensor, water quality auto-sampler
2Inlet HatchWater temperature and turbidity sensors
3Forebay HatchDepth sensor, water quality auto-sampler
4Permanent Pool HatchWater temperature, specific conductivity, dissolved oxygen and PH profiles
5Outlet HatchDepth sensor, water temperature and turbidity sensors water quality sampling
6Outlet pipeArea-velocity flow rate sensor, water quality auto-sampler
Figure 3. Water temperature over monitoring period (Gap in October inlet temperature is due to malfunctioning equipment).
Water 08 00211 g003
Figure 4. Probability plot of inlet and outlet water temperature over the entire monitoring period.
Water 08 00211 g004
Figure 5. Summer Inlet and Outlet Temperatures during runoff events: minimum, mean and maximum.
Water 08 00211 g005
Figure 6. Fall (October and November) inlet and outlet temperature during runoff events: minimum, mean and maximum.
Water 08 00211 g006
Figure 7. Turbidity of water over the monitoring period (gaps in continuous data are due to equipment malfunctions).
Water 08 00211 g007
Figure 8. Probability plot of inlet and outlet turbidity for the entire monitoring period.
Water 08 00211 g008
Figure 9. Summer inlet and outlet turbidity during runoff events: minimum, mean and maximum.
Water 08 00211 g009
Figure 10. Fall (October and November) inlet and outlet turbidity during runoff events: minimum, mean and maximum.
Water 08 00211 g010
Figure 11. Vertical profile results: Temperature (a); TDS (b); dissolved oxygen (DO) (c).
Water 08 00211 g011aWater 08 00211 g011b
Table 1. USDC monitoring equipment properties and purpose.
ParameterEquipmentFrequencyAccuracy
Water QualityISCO 6712 Series Porable sampler coupled with water level sensors to trigger start and end of samplingAll storm events that generate enough flow to trigger the sampler
Water LevelHOBO water level logger5 min intervals± 3 mm
TemperatureHOBO temperature logger5 min intervals±0.44° (from 0 to 50 °C)
TurbidityYSI multiparameter sonde5 min intervals±2% of reading or 0.3 NTU, whichever is greater
Flow Rate/VolumeISCO ultrasonic area-velocity sensor5 min intervals± 0.03 m/s (−1.5 to 1.5 m/s) ±2% of reading (1.5 to 6.1 m/s)
Dissolved Oxygen, Specific Conductivity/Temperature/pH ProfilesYSI probe lowered at 0.35 m depth intervalsFour profiles conducted during summer and winter seasons
Precipitation0.2 mm four season (heated) tipping bucket precipitation gauge5 min intervals
Table 2. Sampled storm event hydrologic parameters.
Event DateDuration (h)Depth (mm)Max 5-min Intensity (mm/h)Average Intensity (mm/h)Preceding Dry Daysi2-year (mm/h)
25-June-142.4228.274.411.3<111.3
11-August-144.4219.228.84.367.39
16-August-149.754.87.20.644.25
02-September-143.0026.667.28.6109.69
05-September--1411.7542.679.23.633.72
21-September--142.832152.87.2<110.1
03-October-142.8379.62.41210.1

