Article

Evaluation of TRMM 3B43 Precipitation Data for Drought Monitoring in Jiangsu Province, China

1
State Key Laboratory of Desert and Oasis Ecology, Xinjiang Institute of Ecology and Geography, Chinese Academy of Sciences, Urumqi 830011, China
2
Department of Geosciences, Eberhard Karls University, Tübingen 72070, Germany
3
Jiangsu Climate Center, Nanjing 210008, China
4
Max Planck Institute for Meteorology, Klima Campus, Hamburg 20144, Germany
*
Author to whom correspondence should be addressed.
Water 2016, 8(6), 221; https://doi.org/10.3390/w8060221
Submission received: 27 February 2016 / Revised: 19 May 2016 / Accepted: 20 May 2016 / Published: 25 May 2016

Abstract

:
Satellite-based precipitation monitoring at high spatial resolution is crucial for assessing the water and energy cycles at the global and regional scale. Based on the recently released 7th version of the Multi-satellite Precipitation Analysis (TMPA) product of the Tropical Rainfall Measuring Mission (TRMM), and the monthly precipitation data (3B43) are evaluated using observed monthly precipitation from 65 meteorological stations in Jiangsu Province, China, for the period 1998–2014. Additionally, the standardized precipitation index (SPI), which is derived by a nonparametric approach, is employed to investigate the suitability of the TRMM 3B43 precipitation data for drought monitoring in Jiangsu Province. The temporal correlations between observations and the TRMM 3B43 precipitation data show, in general, reasonable agreement for different time scales. However, in summer, only 50% of the stations present correlation coefficients that are statistically significant at the 95% confidence interval. The overall best agreement of TRMM 3B43 precipitation data at seasonal scale tends to occur in autumn (SON). The comparative analysis of the calculated SPI time series suggests that the accuracy of TRMM3B43 decreases with increasing time scale. Stations with significant correlation coefficients also become less spatially homogeneous with increasing time scale. In summary, the findings demonstrate that TRMM 3B43 precipitation data can be used for reliable short-term drought monitoring in Jiangsu province, while temporal-spatial limitations exist for longer time scales.

1. Introduction

Research on droughts has received special attention in recent years due to concerns over global climate change [1,2,3]. Numerous studies have emphasized that precipitation is the primary factor controlling the formation and persistence of various droughts (e.g., [4]). Accurate estimation of precipitation is crucial for improving our understanding of droughts at different temporal and spatial scales (e.g., [5,6]). This cannot be achieved without reliable measurements of precipitation. Although rain gauge observations provide long-term records, the density of most rain gauge networks is typically far too coarse to capture the spatial variability of rainfall in many regions of the world, and particularly in developing countries, mainly due to the high costs of establishing and maintaining such an infrastructure [7]. In the past several decades, with advances in the field of remote sensing, satellite-based precipitation estimation products with high spatial resolution for different time steps have been widely used for hydrological and climatic applications (e.g., [8,9,10]). These products play a vital role in the global monitoring of precipitation because they fill in large data voids where conventional measurements from surface rain gauges and weather radars are primarily restricted to populated land regions [11]. Although these products are similar in that most of them combine data from passive microwave and thermal infrared sensors, each of them has its unique approaches in retrieval algorithms and blending of various data sources. Therefore, a comprehensive evaluation of the results of satellite-based precipitation measurements by using available observational data has become an important scientific focus (e.g., [12,13,14]). Indeed, further applications of these products rely heavily on their rigorous and informative validation.
Currently, measuring precipitation at a global scale is feasible only through the application of satellite remote sensing. A number of high-resolution precipitation products at global scale are now available. Among these products the Tropical Rainfall Measuring Mission (TRMM) Multi-satellite Precipitation Analysis (TMPA) products have received much attention after the TRMM launch in November 1997. TMPA is available for past time-series (3B42) and in real-time (3B42RT), both based on calibration by the TRMM Combined Instrument and TRMM Microwave Imager precipitation products [15]. The most recent 7th version (V7) was released in December 2012 after retrospective reprocessing of version 6. V7 is assumed to be more accurate as the major revisions to the algorithm involve the radar reflectivity–rainfall rate relationship, surface clutter detection over high terrain, a new reference database for the passive microwave algorithm, and a higher-quality gauge analysis product provided by the Global Precipitation Climatology Centre (GPCC) for monthly bias correction [16].
Numerous studies have been conducted with the aim to compare the TMPA results with in situ observations over various regions with different physiographic and climatic conditions (e.g., [17,18]). Most of them indicate that those products have great potential in supplying excellent spatial and temporal data for hydrometeorological applications such as hydrological modeling and drought monitoring (e.g., [19,20,21]). For example, Su et al. [22] and Wagner et al. [23] evaluated the robustness of TRMM 3B42V6 by comparing the precipitation data with available gauged data and applied it as inputs for hydrological modeling in the La Plata basin in South America and the White Volta catchment in West Africa, respectively. Both studies concluded that TRMM data are quite accurate at monthly time steps but less accurate at daily time steps. In the arid region of Central Asia, Moazami et al. [24] found that TRMM 3B42V7 data shows better estimates of daily precipitation than those of the TRMM 3B42 real-time and the PERSIANN satellite imagery products over Iran.
Although the accuracy and precision of TMPA products has greatly improved since important changes have been incorporated into the new version, TMPA data are still subject to significant uncertainties due to the indirect measurements of processes in the atmosphere and the rain retrieval algorithm [25,26,27]. For example, Zulkafli et al. [9] compared the precipitation data of version 7 and version 6 and found that version 7 shows a significantly lower bias and an improved representation of the rainfall distribution in and around the northern Peruvian Andes. However, over the continental United States, Chen et al. [28] found that 3B42RTV7 gained a little improvement over 3B42RTV6, but with the relative bias increasing from 8.18% to 14.92% over the central US and from 0.16% to 3.22% over the eastern US. Therefore, it is recommended to evaluate the robustness and accuracy of TRMM 3B42V7 data against observations before opting for a specific application.
Compared to drought monitoring based on ground station observations, the use of satellite based rainfall estimates offers important advantages in terms of accuracy, spatial coverage, timeliness, and cost efficiency [29]. Numerous studies have extensively validated the TRMM data on ground station data worldwide, and most of them suggest that the TRMM data could be used as an alternative data source for drought monitoring (e.g., [30,31,32]). Based on the TRMM 3B43 monthly precipitation product and the GPCC full-reanalysis gridded precipitation dataset, a nonparametric resampling bootstrap approach was used by Naumann et al. [8] to compute the confidence bands associated with the Standardized Precipitation Index (SPI) estimation, the comparative analysis suggests that TRMM 3B43 is reliable for drought monitoring over Africa.
The purpose of this study is to perform an initial qualitative and quantitative comparison between monthly precipitation from TRMM 3B43 and ground station observations, and to investigate the suitability of applying TRMM 3B43 for drought monitoring in Jiangsu Province, China. The findings will help to determine whether the TRMM 3B43 productcan be recommended forfuture drought monitoring at a provincial level in East China.

2. Study Area: Geographical Setting

The study domain is Jiangsu Province, which is located in the coastal area of East China. The province stretches between the latitudes 30°45′ N and 35°20′ N and the longitudes 116°18′ E and 121°57′ E, covering an area of approximately 100,000 square kilometers (Figure 1). Most parts of the province lie below 50 meters above sea level. Jiangsu has a humid subtropical climate. The annual average precipitation ranges from 550 to 1450 mm, concentrated mostly in summer (JJA) during the monsoon season. Jiangsu Province has the highest GDP per capita of all Chinese provinces. The total population is 78.5 million, which makes Jiangsu the most densely populated province in China [33]. The worst droughtobserved in the last 50 years occurred in the spring of 2011 [34]. This adverse event increased the demand in drought monitoring and the assessment of environmental and social-economic impacts due to drought events.

3. Data and Methodology

3.1. Precipitation Datasets

The monthly precipitation data of TMPA Version 7 is obtained from the NASA archive [35]. This data release consists of three products with different temporal resolutions: three-hourly (3B42), daily (3B42 derived), and monthly (3B43). The spatial resolution for all three products is 0.25° × 0.25° and extends from latitude 50° S to 50° N. In this study, only the TRMM 3B43 product for the period of 1998–2014 is used, which is the monthly mean of the TRMM 3B42 dataset with additional rain gauge station data used for verification and adjustment for rainfall biases. The historical observed precipitation datasets (1998–2014) of 65 meteorological stations are obtained from the National Climate Center of China. In order to facilitate product intercomparison, the monthly TRMM 3B43 gridded datasets of 1220 pixels in the study domain are interpolated to meteorological stations using the nearest neighbor interpolation method.

3.2. Methodology

For the evaluation of the TRMM 3B43 precipitation product, the correlation coefficient (R2) is applied to assess the agreement between TRMM 3B43 precipitation and rain gauge observations. The variability of average annual and seasonal (MAM, JJA, SON, DFJ) precipitation during 1998–2014 is measured by the standard deviation (SD) for the two datasets, respectively. The bias (relative mean bias) and root mean square error (RMSE) are employed to estimate the average difference between the two datasets (Table 1).
In this study, we also apply the widely-used SPI to characterize drought on different time scales [36]. The SPI is calculated from monthly precipitation data only [37], whereas other drought indices such as the Standardized Precipitation Evapotranspiration Index (SPEI; [38]) and the Palmer Drought Severity Index (PDSI; [39]) use several parameters. In general, the raw precipitation data are typically fitted to a gamma or a Pearson Type III distribution, and then transformed to a normal distribution [40]. Since different SPI values may be obtained if different probability distributions are used to describe the precipitation time series [41], the SPI values derived from observations and the TRMM 3B43 cannot be compared with each other directly. In this study, SPI is computed by a nonparametric approach proposed by Farahmand and AghaKouchak [42]. Instead of fitting an appropriate probability density function to the frequency distribution of precipitation summed over the time scale of interest (usually 1-, 3-, 6-, 12-, and 24-months), this method standardizes the marginal probability of precipitation using the empirical distribution function of the data. Namely, p ( x i ) = ( i 0.44 ) / ( n + 0.12 ) , where n is the sample size, i denotes the rank of non-zero precipitation data from the smallest, and p ( x i ) is the corresponding empirical probability. The approach does not require an assumption on representativeness of a parametric distribution function for describing drought-related variables. The p ( x i ) can be transformed into a Standardized Index as: S I = 1 (p), where ∅ is the standard normal distribution function, and p is the empirical probability of precipitation. The classification of drought intensities resulting from SPI computation and the corresponding probabilities of occurrence of each severity are shown in Table 2.

4. Results

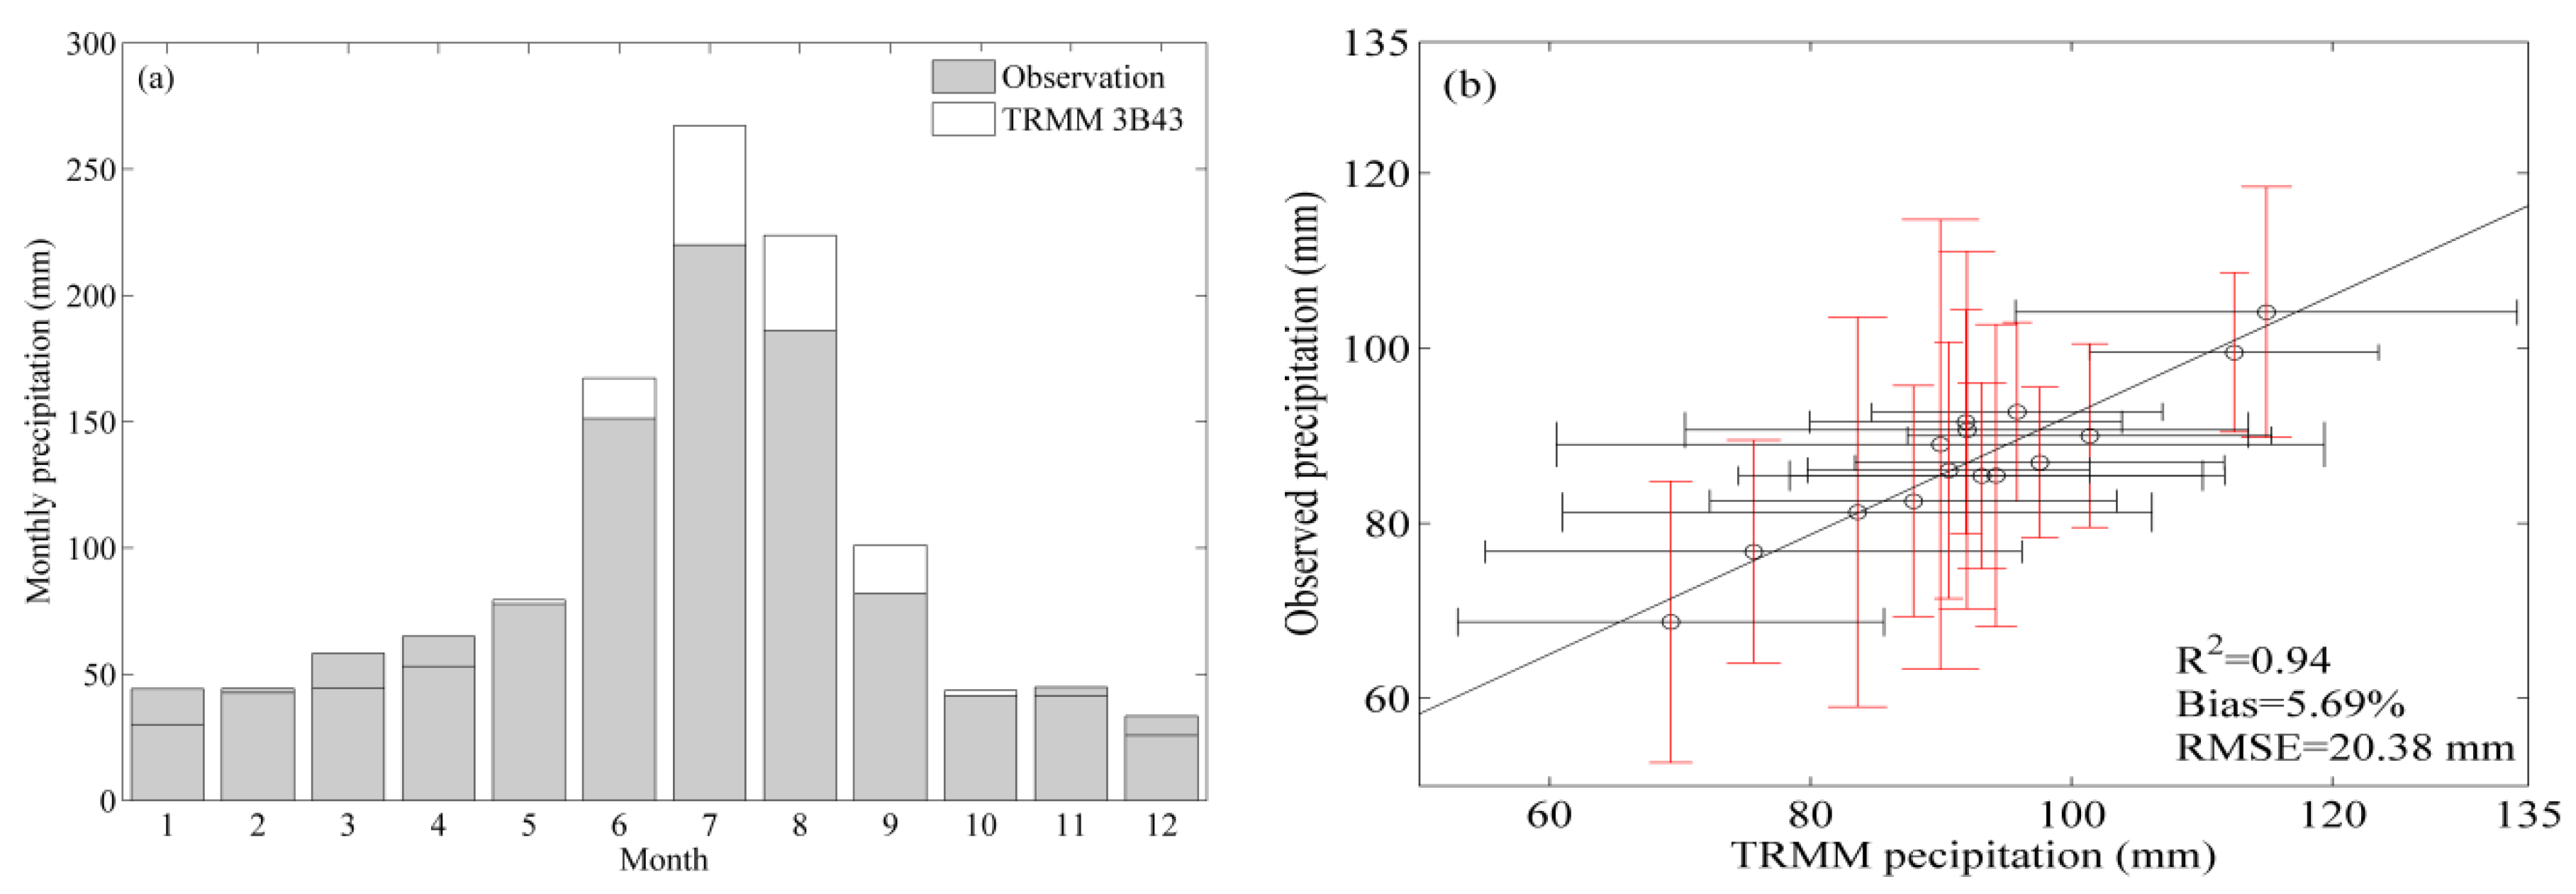
4.1. Temporal Validation

The comparison of the two datasets of monthly mean precipitation shows that the TRMM 3B43 product follows the observed annual cycle for the period 1998–2014 (Figure 2a) but overestimates the precipitation amounts in the rainy season (JJAS) and slightly underestimates the precipitation amounts in the dry season (DJFMA). The scatter plot of the TRMM 3B43 and the observed annual precipitation data, as shown in Figure 2b, suggests that the TRMM 3B43 product highly agrees with the observations (R2 = 0.94), with the scatter dots close to the diagonal line, an RMSE of 20.38 mmand a bias of 5.69%. The comparison of the standard deviations (SD) also shows a good agreement between the TRMM 3B43 product and the observations at annual time scale.
The positive bias values for the seasonal precipitation indicate that TRMM 3B43 tends to overestimate precipitation in all seasons (Figure 3). The lowest correlation coefficient and bias is observed in summer, while the highest correlation coefficient and the lowest RMSE are observed in spring and winter, respectively. In summer (Figure 3b), the large differences in SD indicate that the fluctuations within the TRMM 3B43 productare more intense than within the observed data. Contrarily in winter (Figure 3d), the differences in SD are relatively small, which indicate that the temporal variability of the TRMM 3B43 productis more consistent with the observed precipitation.
Since the correlation coefficient, the bias, and the RMSE may be concealed by their averages, an evaluation on individual station data is particularly important. In Figure 4, the bias, RMSE, and correlation coefficient of each station in the study area are shown. The correlation coefficients for summer are relatively low (Figure 4b), i.e., about 50% of the stations present correlation coefficients significant at the 95% confidence level, while the bias values in summer and autumn are relatively small. Although large biases can be observed at some stations in winter (Figure 4d), all stations show significant correlation coefficientsat the 99% confidence level.

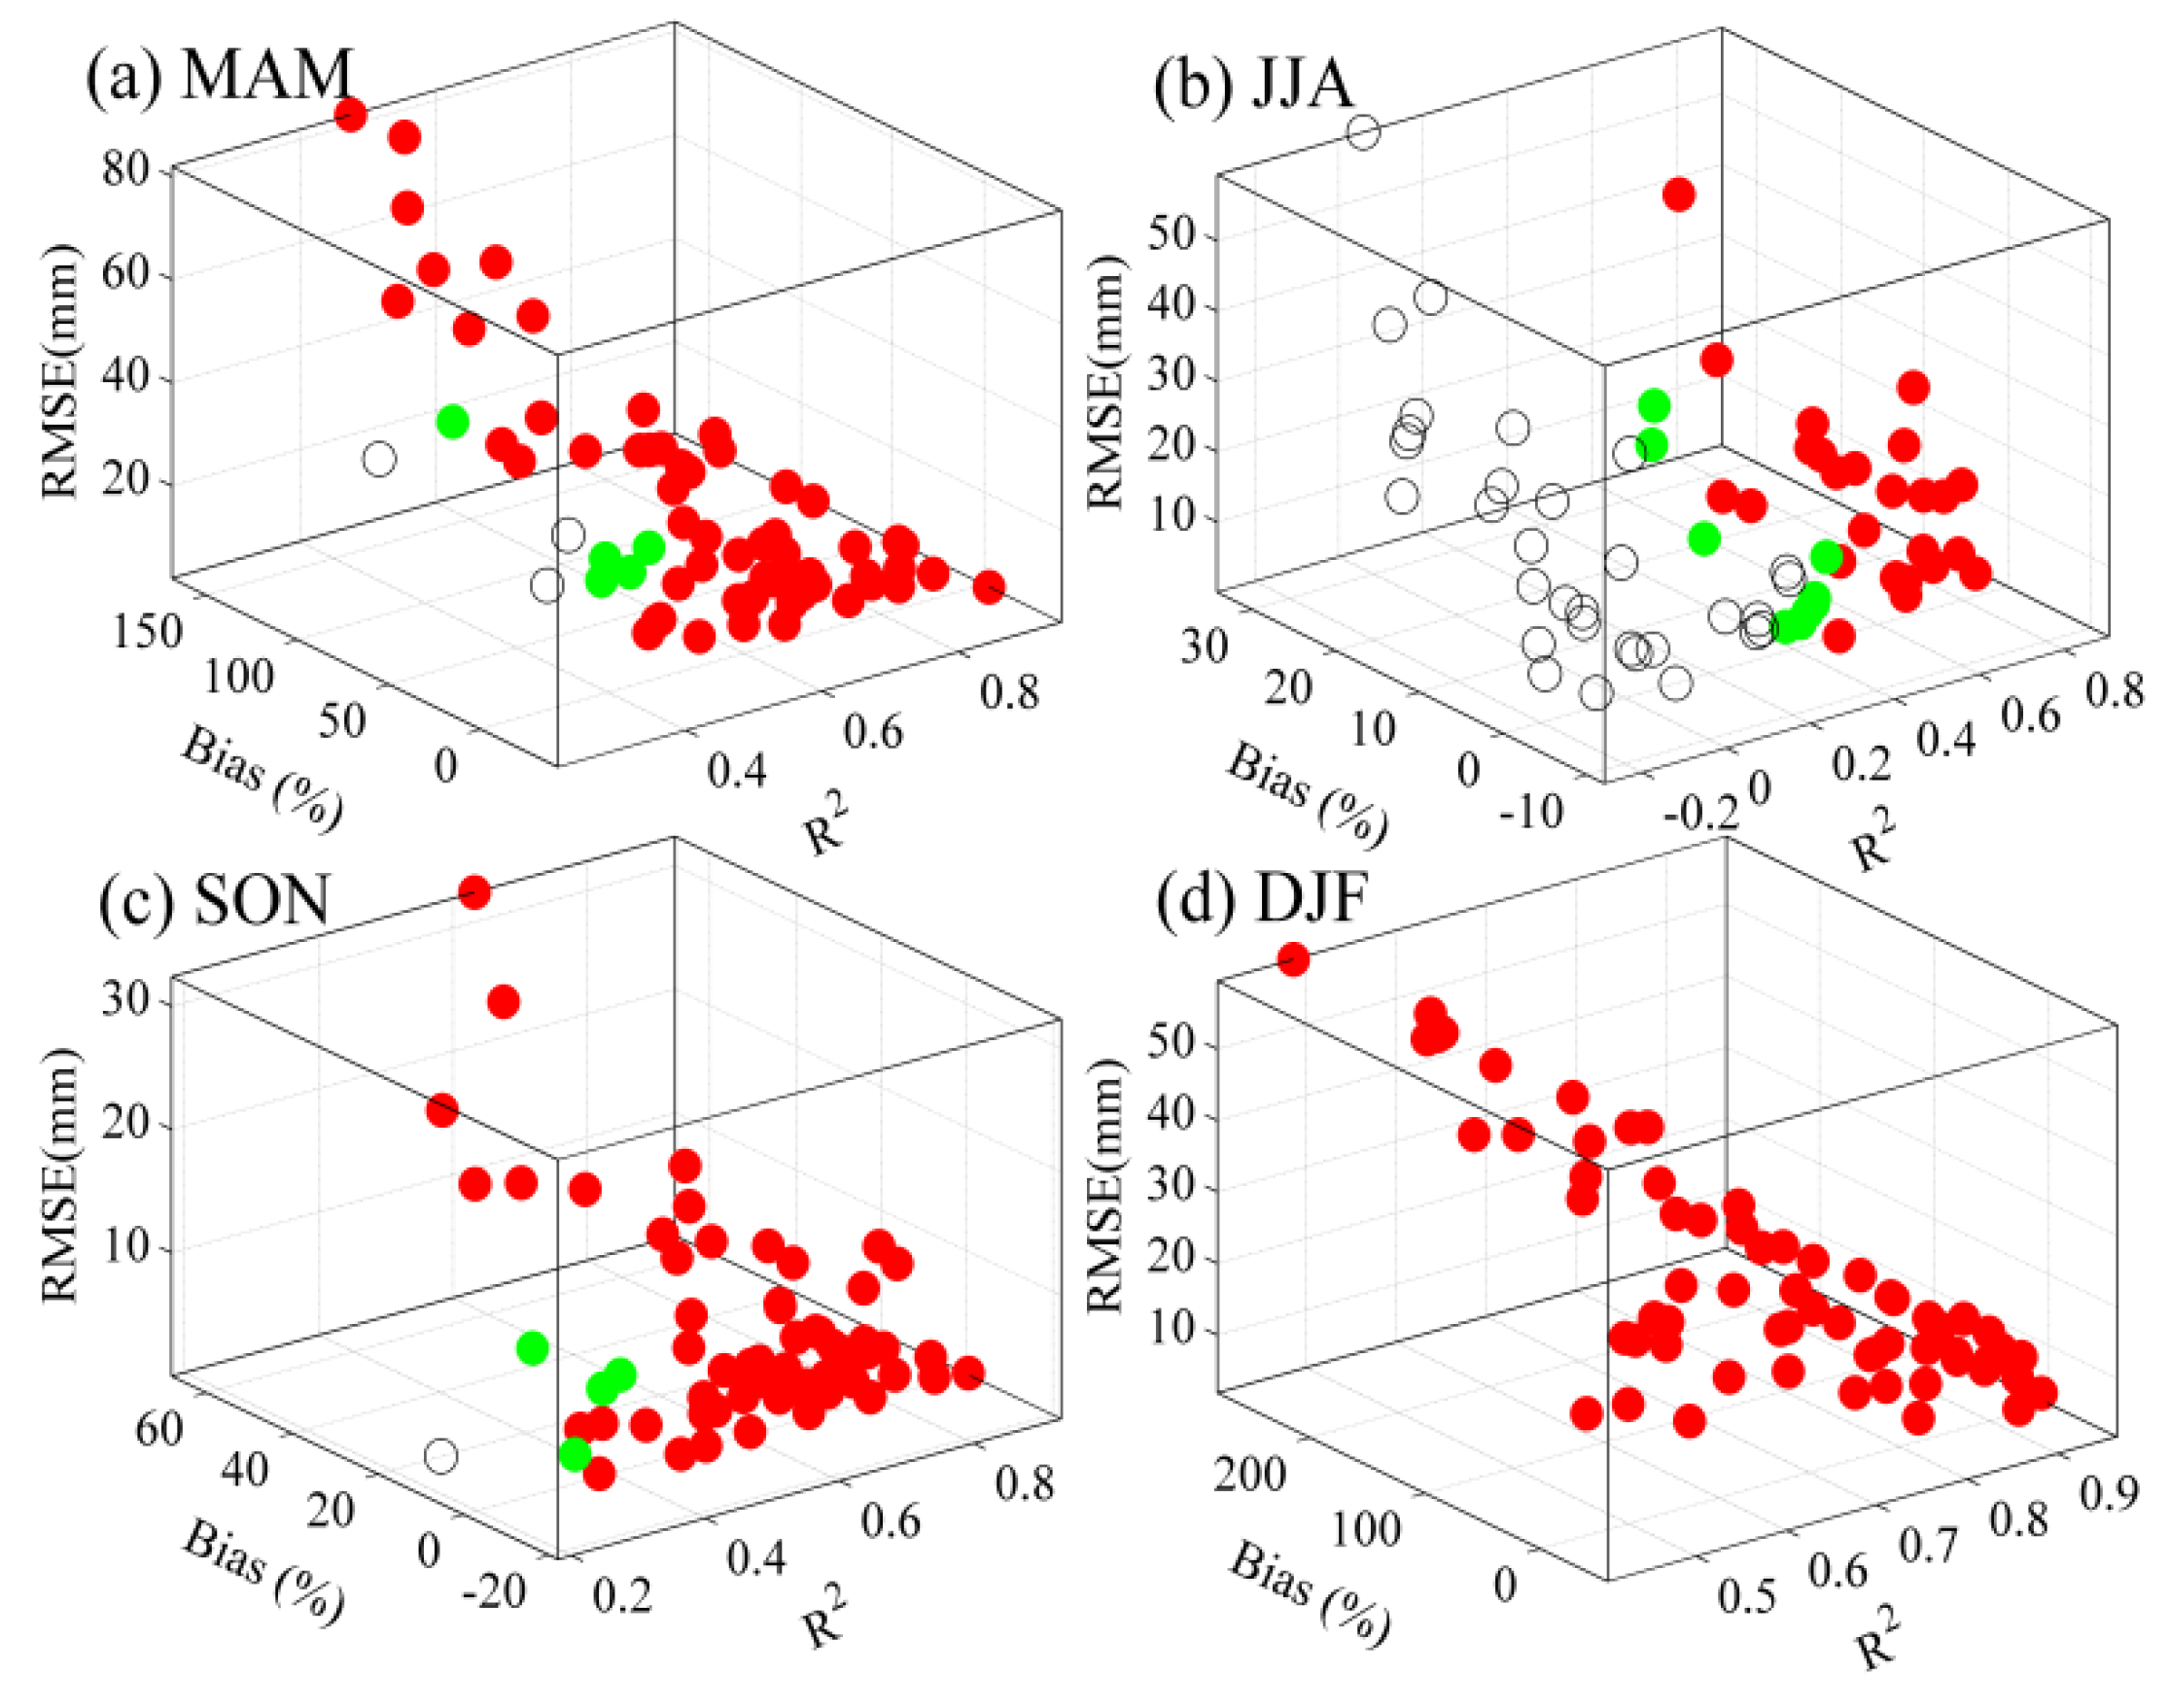
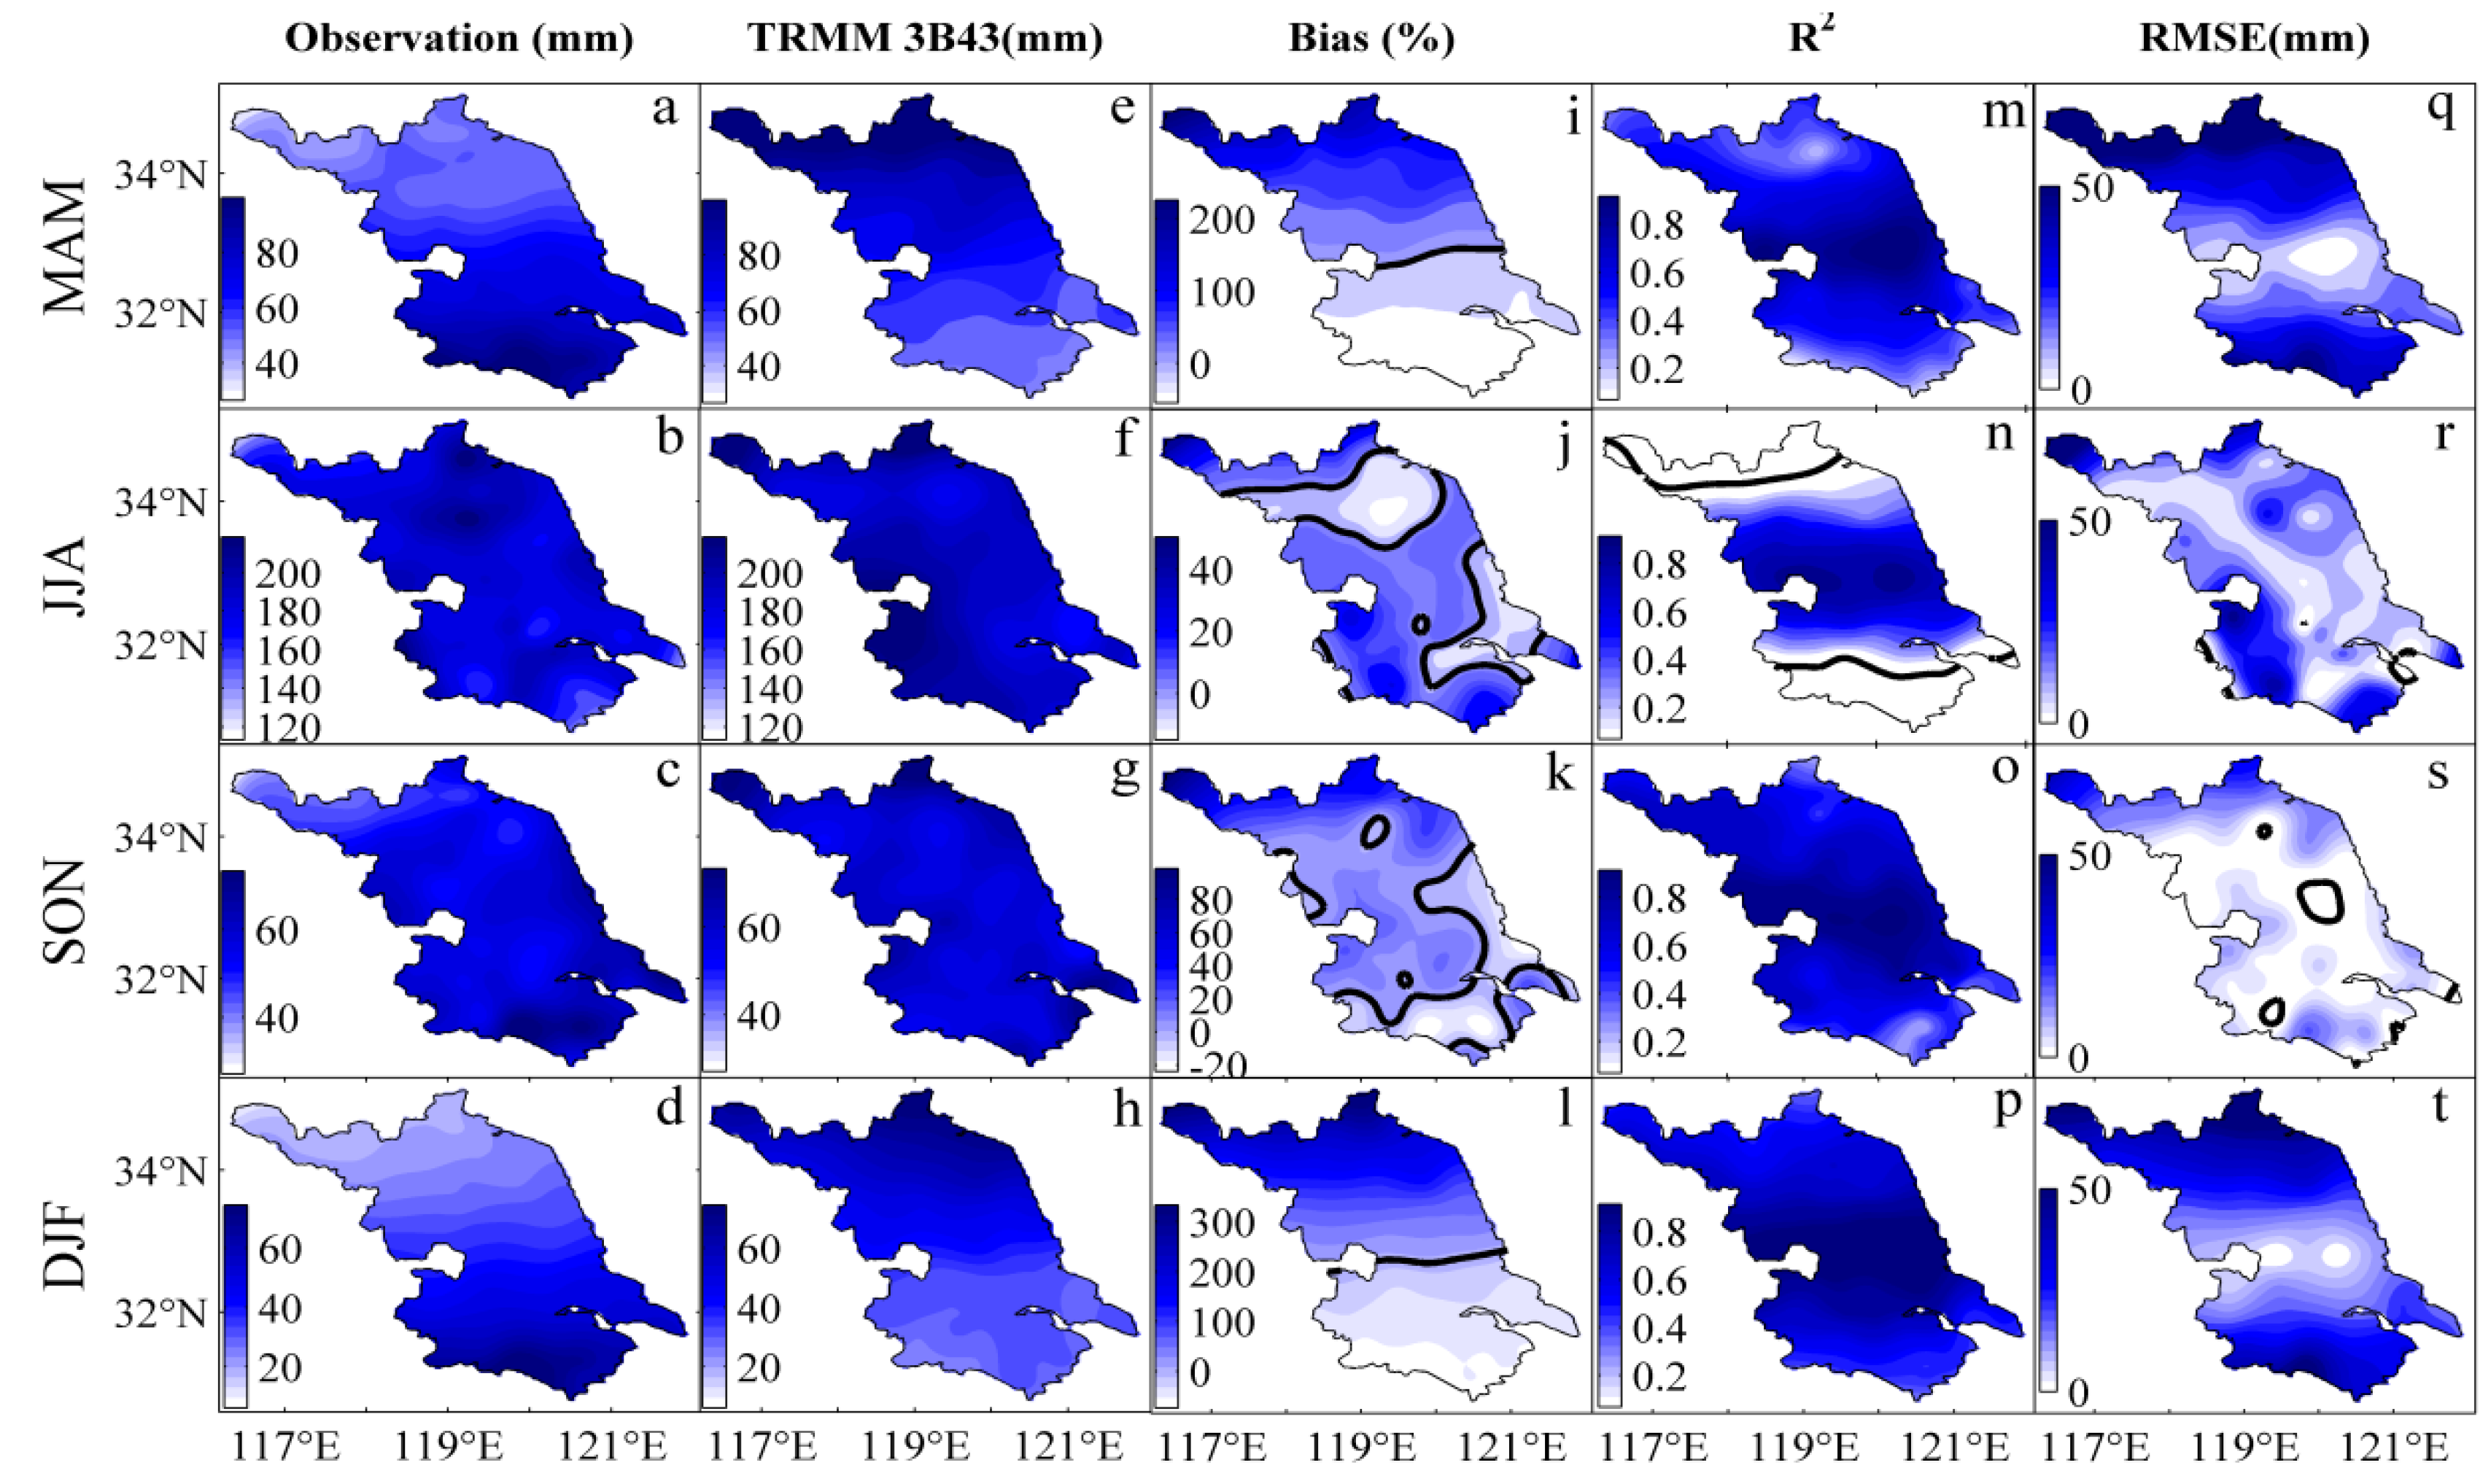
4.2. Spatial Validation

The spatial distributions of biases, correlation coefficients (R2), and RMSE in seasonal precipitation are shown in Figure 5. The bias between TRMM 3B43 and observations has a distinct geographic pattern, i.e., in spring and winter, the precipitation amounts derived from TRMM 3B43 (Figure 5e,h) are considerably higher than observed (Figure 5a,d), especially in the northwestern region, which is characterized by mountainous topography. Meanwhile, the TRMM 3B43 product failed to reveal precipitation maxima in the southern region, which results in a reverse precipitation pattern over the study area when compared to observations of those two seasons. Consequently, larger RMSEs tend to appear for the northern region in spring and winter (Figure 5q,t). The bias between TRMM 3B43 and observed precipitation in spring (Figure 5i) and winter (Figure 5l) ranges from −48% to +195% and −64% to 300%, respectively, both with a distinctive low bias zone in the central part of Jiangsu Province. In general, the spatial distributions of precipitation from TRMM 3B43 in summer and autumn (Figure 5f,g) are similar to those from observations (Figure 5b,c), with the bias ranging from −15% to +34% and −22% to +80%, respectively.
It should be noted that, although in summer only 50% of the stations present significant correlation coefficients at the 95% confidence level, the RMSE are relatively small and in the range of 0 to +25 mm (Figure 5r). Stations with higher correlation coefficients are mainly distributed in the central part of Jiangsu Province (Figure 5m–p), which implies that in this region the TRMM 3B43 results perform better in estimating the precipitation amounts. In general, the overall best spatial agreement of TRMM 3B43 tends to occur in autumn.

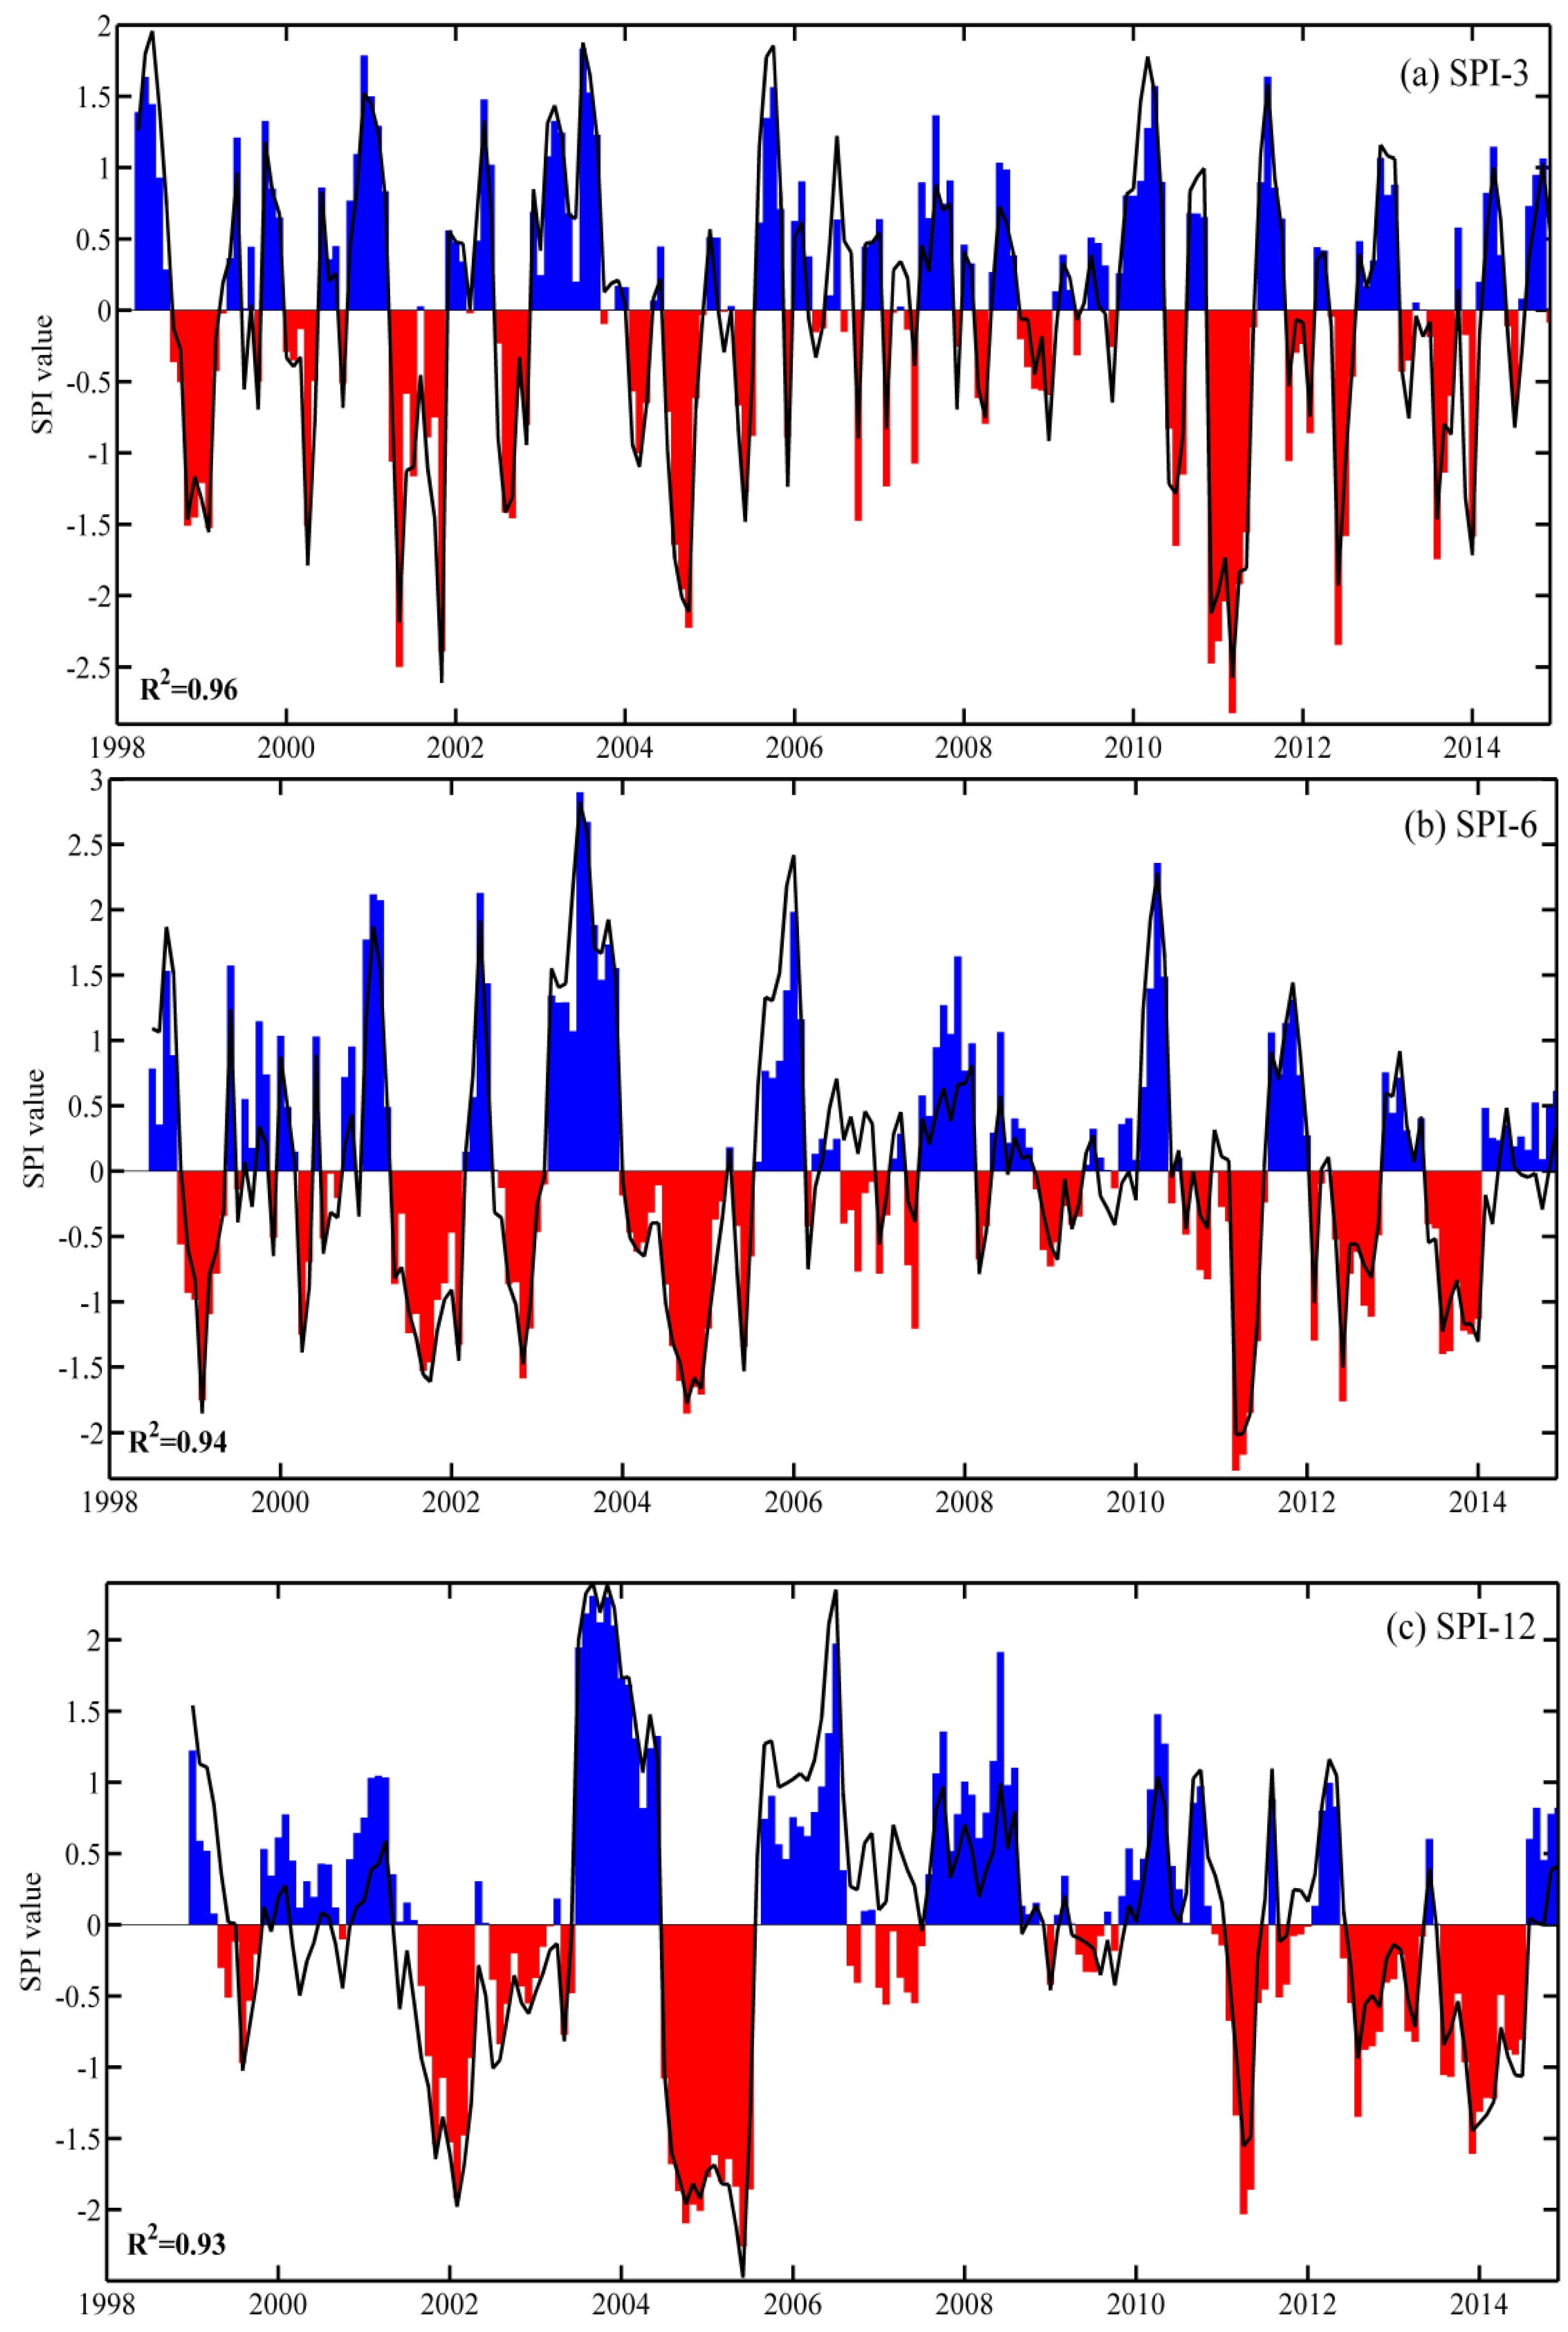
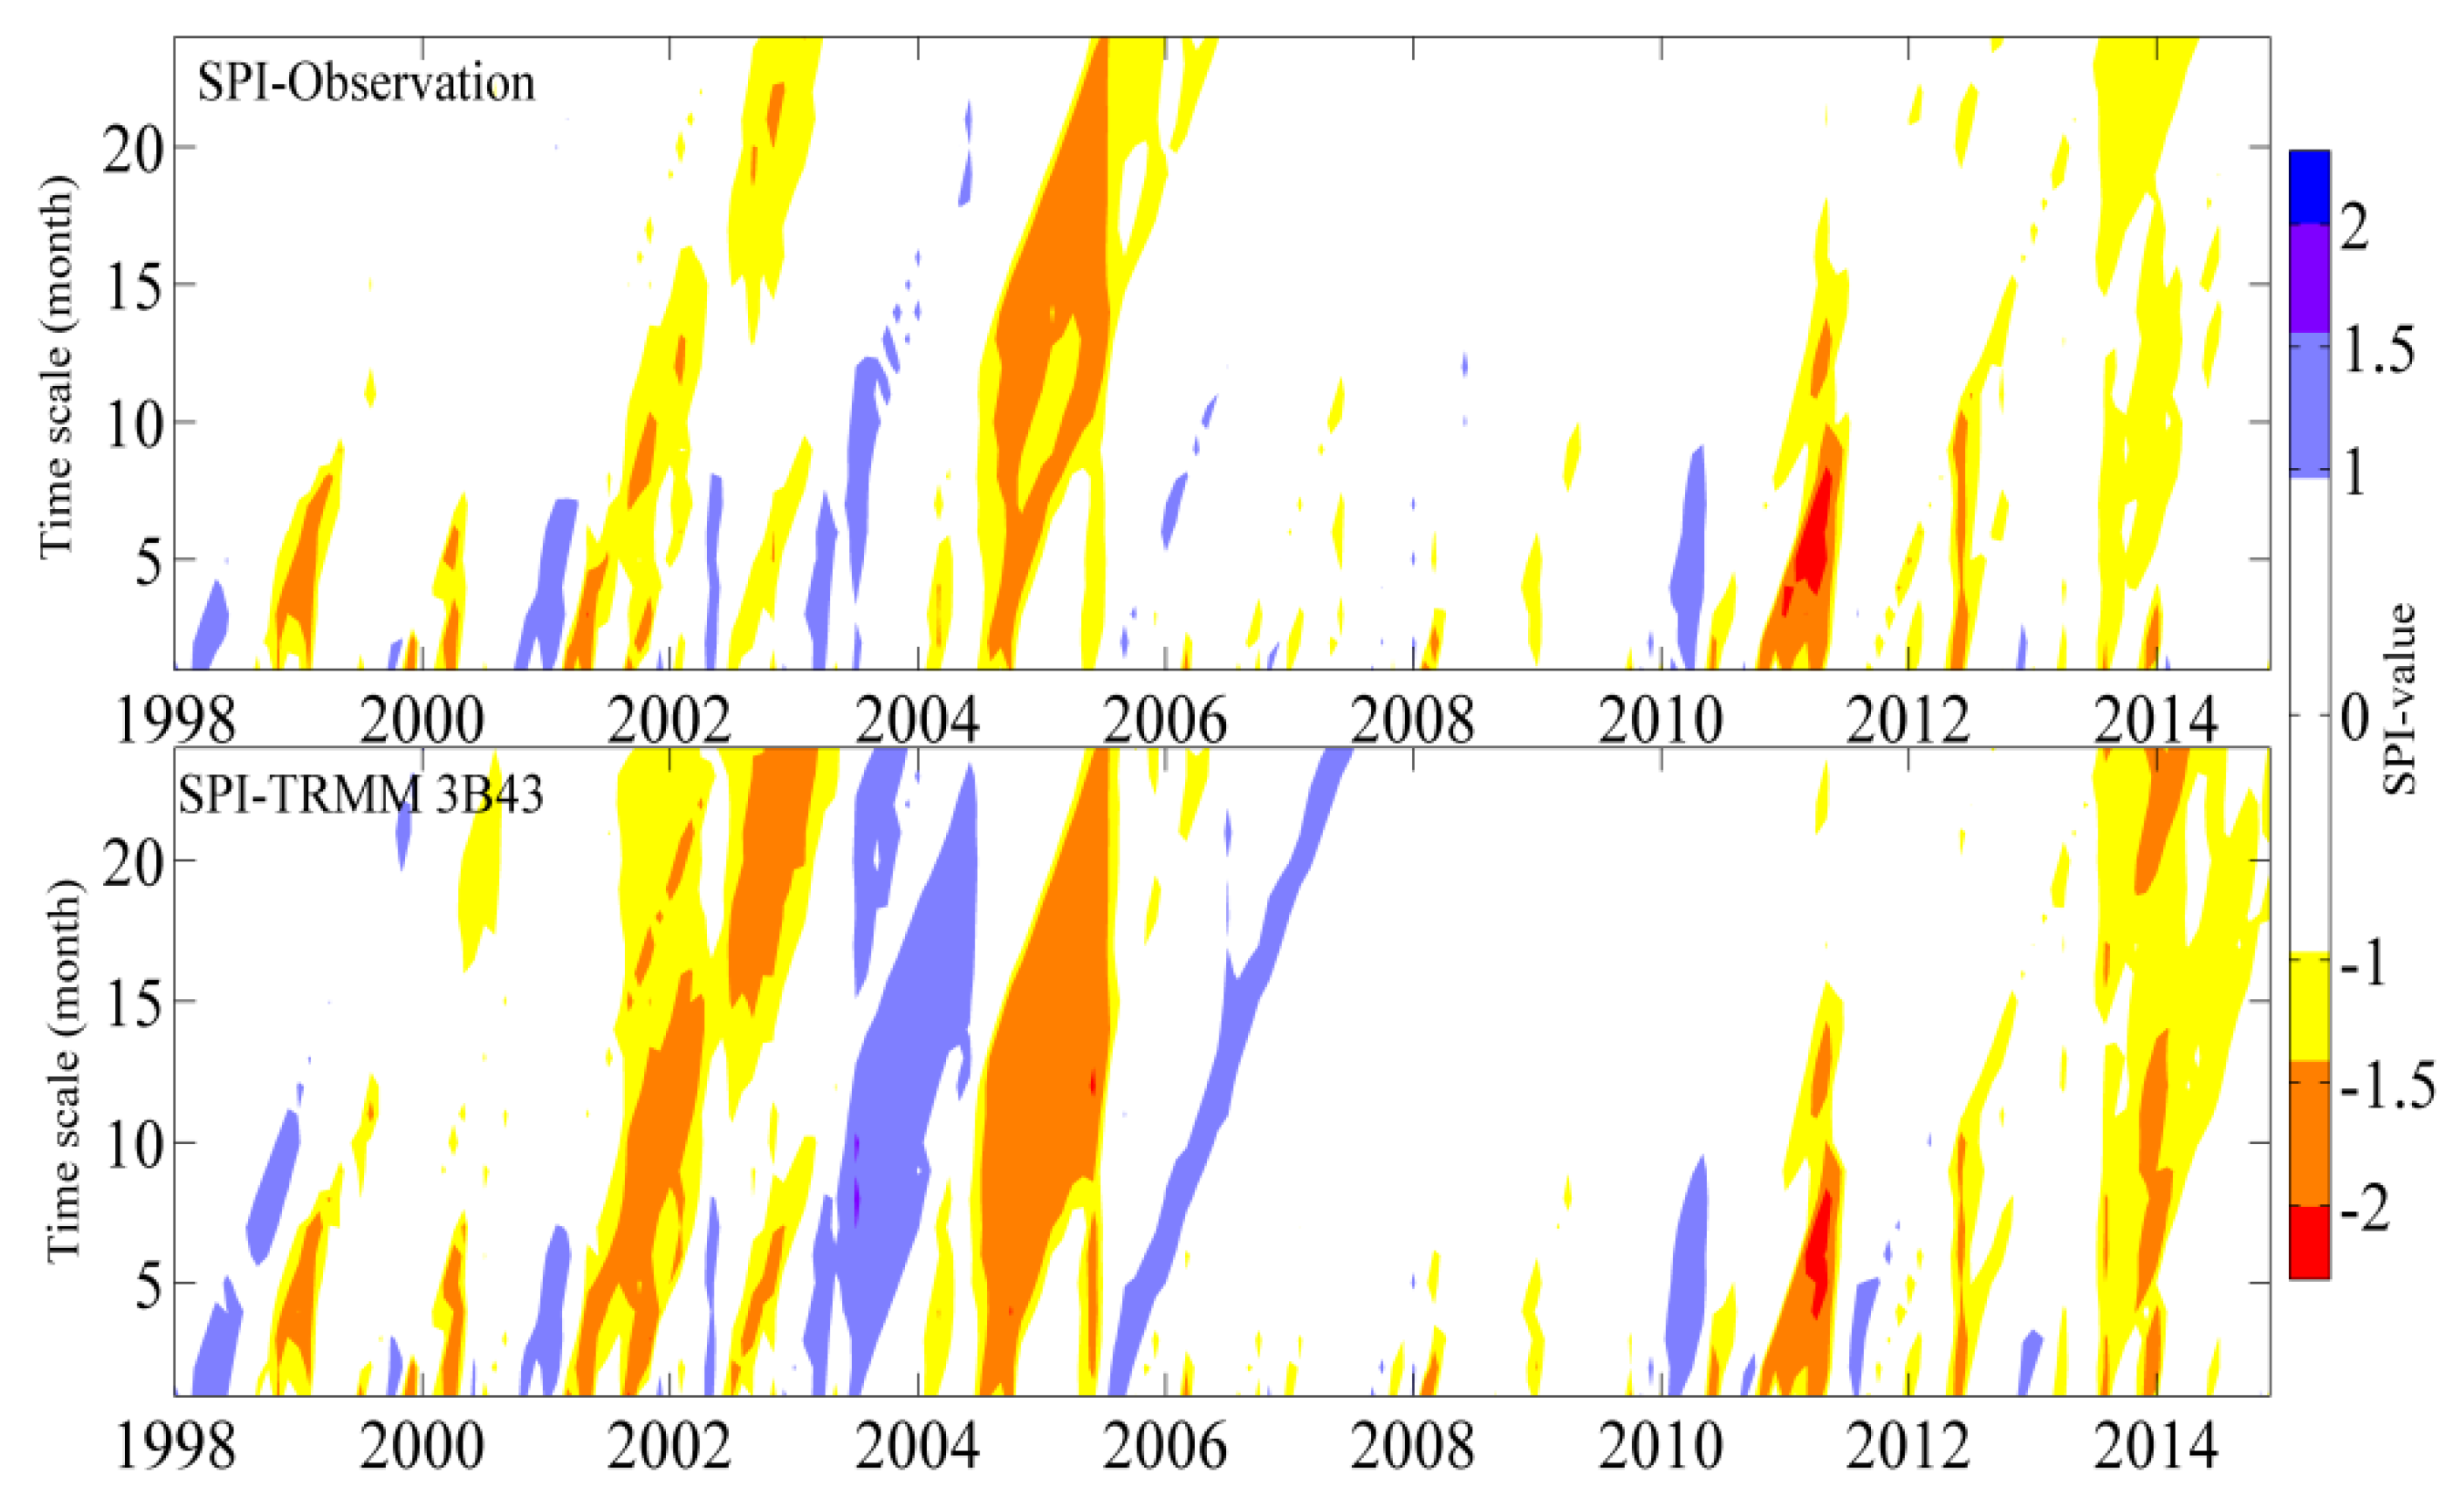
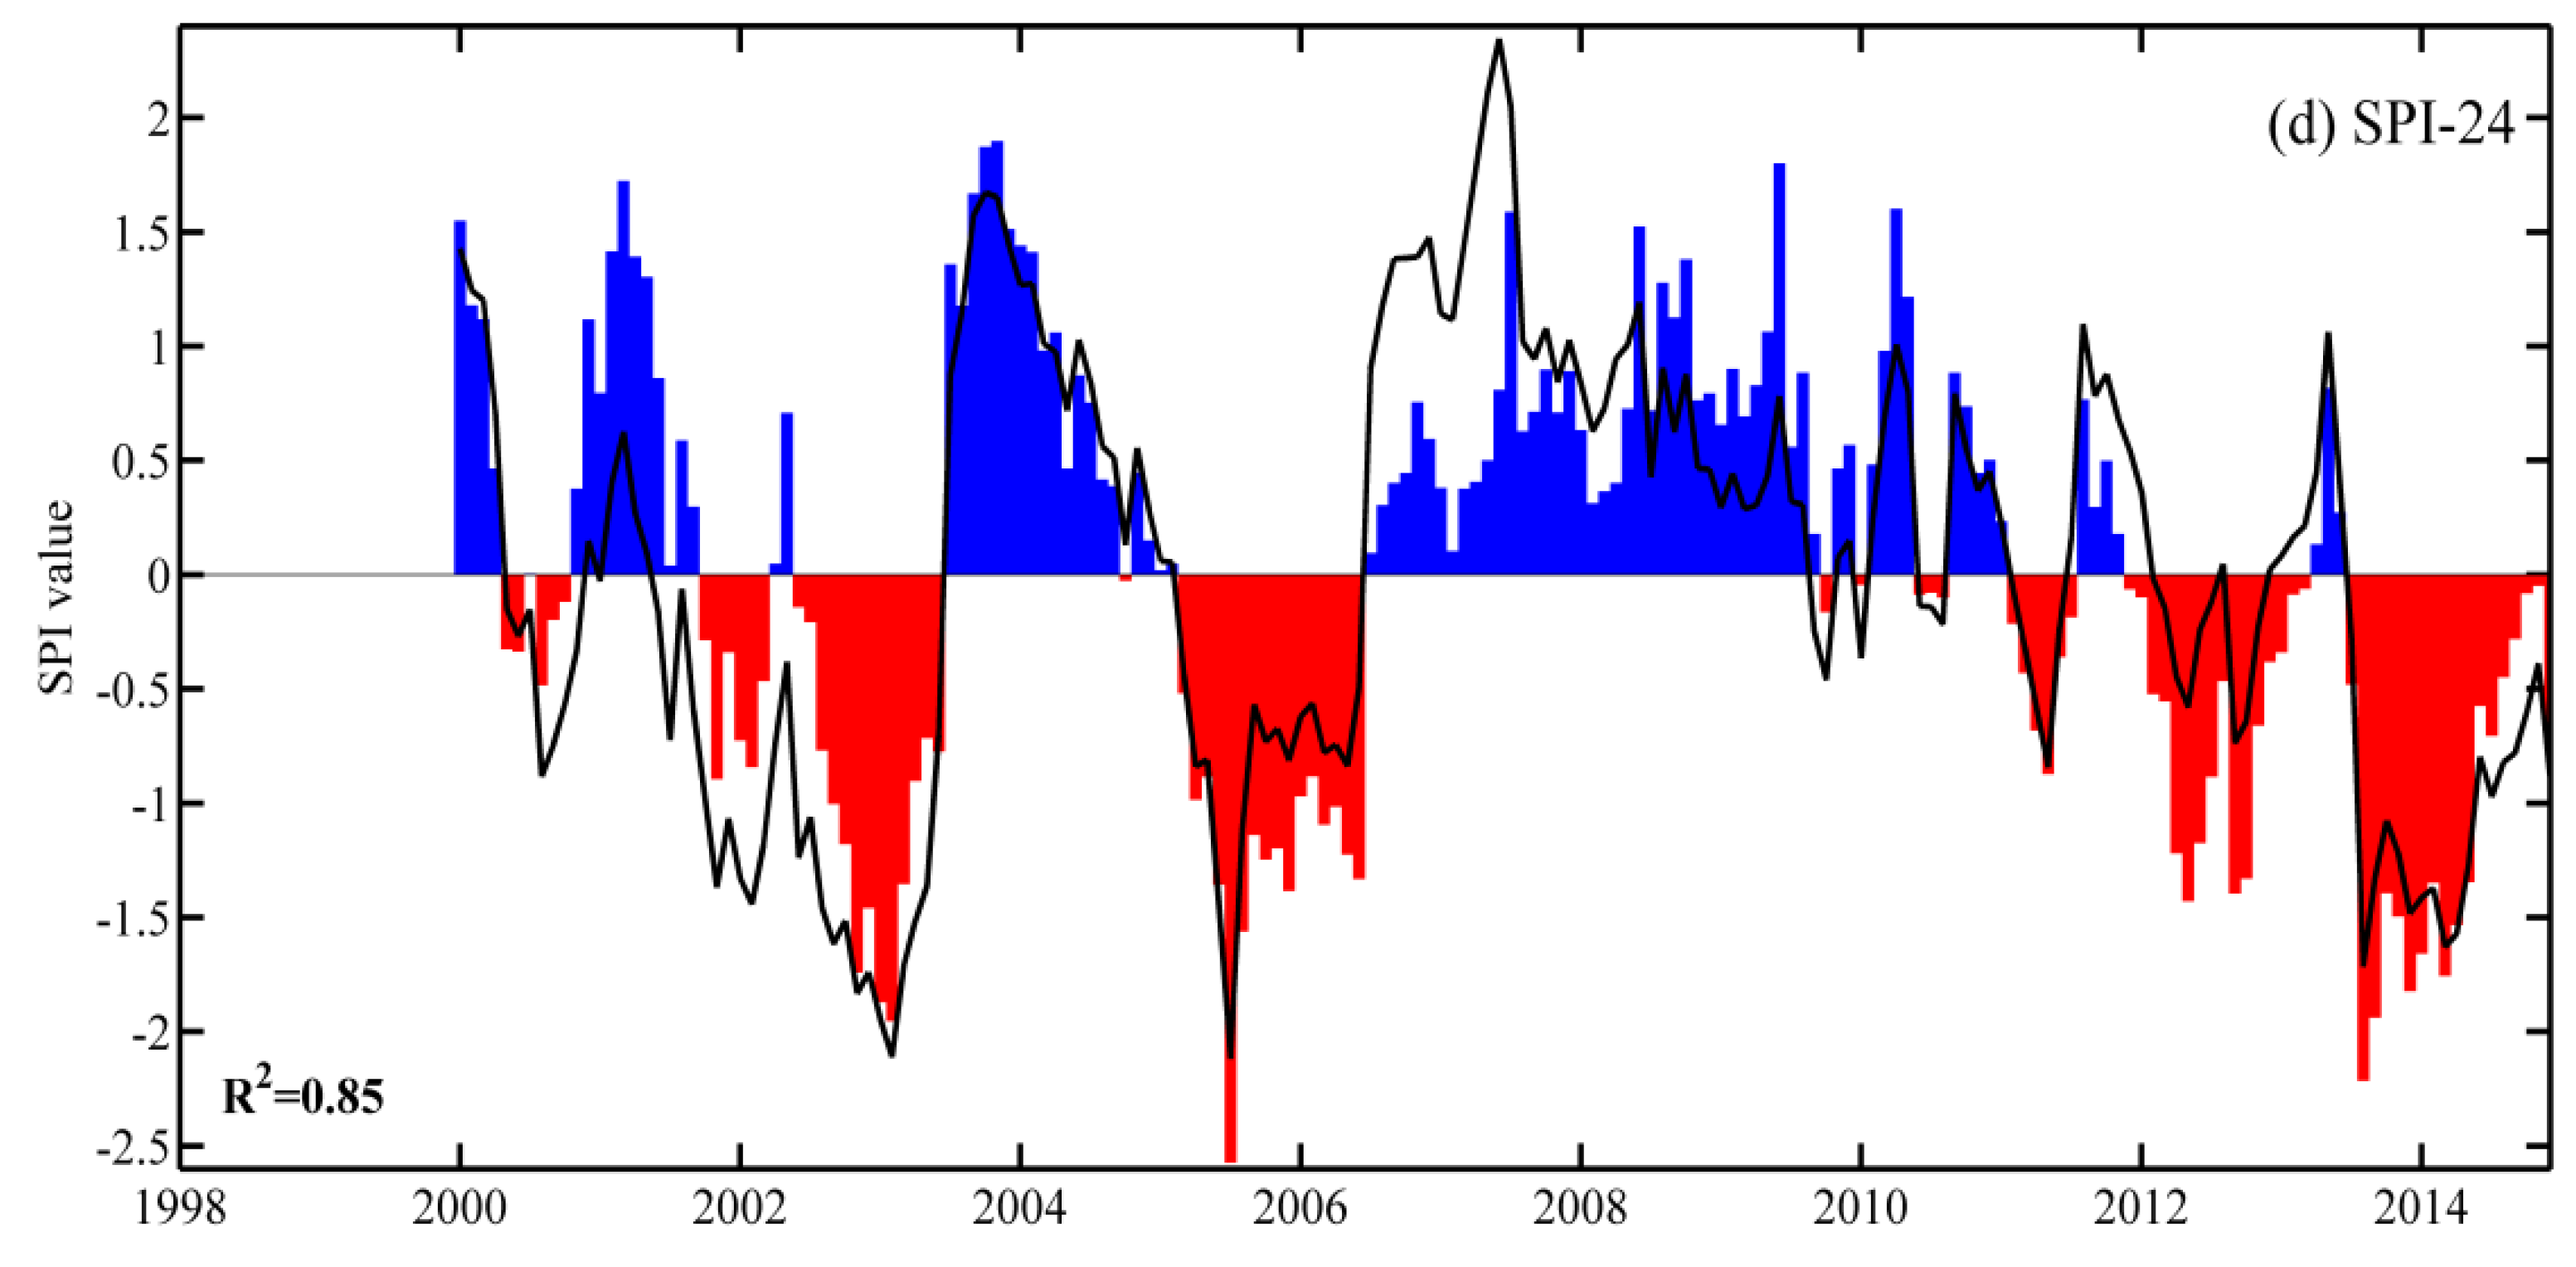
4.3. Validation of the TRMM 3B43 Product for Drought Monitoring

To validate the suitability of the TRMM 3B43 product for drought monitoring applications, the SPI time series are calculated at various time scales with 1- to 24-months for each station for the period 1998–2014 (Figure 6). A drought episode is defined as a continuous period of SPI values below −1. In both SPI time series calculated from observations and the TRMM 3B43 product, major drought episodes can be detected in 2001–2002, 2005, 2011, and in 2013–2014. The drought events found in the observed SPI are not as strong as in the TRMM 3B43 based SPI. Furthermore, intense and prolonged wet periods during 2003–2004 and 2006–2007 are detected by the TRMM 3B43 based SPI only.
For a more detailed comparison, the SPI time series with time scales of 3-, 6-, 12-, and 24-months are visualized in Figure 7, respectively. These timescales reflect the impacts of drought on sectors with different focus on water resources, e.g., hydrology, agriculture, and energy [43]. All these SPI time series are significant at the 99% confidence level. The correlation coefficient (R2) ranges between 0.85 and 0.96. For short time scales (i.e., 3- and 6-months), the TRMM 3B43 based SPI show very good agreement in frequency and intensity with the SPI from observations (Figure 7a,b). However, the accuracy of TRMM 3B43 based SPI time series decreases with increasing time scales (i.e., 12- and 24-months), which can be seen by the lower correlation coefficients and the higher discrepancies in the intensities of the SPI time series (Figure 7c,d).
For the 12-month SPI, which is generally taken as an indicator for hydrological drought, both time series capture the two major droughts in 2001–2003 and 2005–2006. The TRMM 3B43 based SPI with a 24-month time scale tends to overestimate the wet period of 2007 compared to the observations. According to Guttman [38], the number of data points limits the range of the SPI, and timescales longer than 24 months may be unreliable. Due to the limited precipitation datain this study, especially long time scales (e.g., 12- and 24-months), the statistical confidence of the probability estimates of the tail ends decreases for dry and wet episodes.
To detect the spatial reliability of the SPI from the TRMM 3B43 product, the correlation coefficients between both SPI time series at four different time scales (3-, 6-, 12-, and 24-months) are illustrated for each station in Figure 8. In the central region of Jiangsu Province, the correlation coefficients are high, while those in the northern and southern regions are low or not significant. The longer the SPI time scale, the fewer stations show significant correlations. This indicates that the SPI from TRMM 3B43 performs well in the central region of Jiangsu Province. The SPI from TRMM 3B43 with time scales longer than 12 months does not appear to be reliable for drought monitoring in both northern and southern Jiangsu Province.

5. Conclusions

In this study, the TRMM 3B43 precipitation product was compared with observed precipitation data from Jiangsu Province for the period of 1998–2014. The results vary with different temporal and spatial scales, i.e., the comparison of the areal mean precipitation shows a very good relationship between TRMM 3B43 and observations on monthly and seasonal time scales. Nevertheless, some poor agreements are found in summer when the correlation coefficients at individual stations are investigated. A distinct geographic pattern can be observed for the bias in spring and summer, which results in a reverse spatial pattern for precipitation derived from TRMM 3B43 in contrast to the observations. Large bias can be observed in spring and winter, especially in the northern region of Jiangsu Province. In general, the spatial pattern of the error statistics of the TRMM 3B43 precipitation product is relatively well estimated for autumn compared to other seasons. With certain exceptions, the TRMM 3B43 product can be used as a potential substitute for ground observations in Jiangsu Province, especially for areal mean precipitation at monthly and seasonal scales. The quantitative evaluation of the TRMM 3B43 product against observations also suggests that an additional use of the TRMM 3B43 product can enhance the spatial density of precipitation records for drought monitoring.
The capabilityof the SPI time series from TRMM 3B43 decreases with longer time scales. This is also confirmed by the reduction in the number of stations with significant correlation coefficients between TRMM 3B43 and observations when longer time scales are used. Based on the analysis, the TRMM 3B43 productshows reliable results for drought monitoring in the central regions of Jiangsu Province even though further investigation are necessary. It is therefore proposed that the TRMM 3B43 product might be a cost-effective solution for drought monitoring in the support of decision-making in Jiangsu Province. Nonetheless, caution should be exercised when the TRMM 3B43 product is applied for the SPI at long time scales, as well as for the northern and southern regions of Jiangsu Province.

6. Disscusion

One possible reason that caused the poor agreement of TRMM 3B43 over the northern and southern regions of Jiangsu Province might be the topographic features and atmospheric forcing, which influence the convective characteristics and structures. According to Yong et al. [27], satellite-based precipitation estimates may fail to capture orographic rainfall in mountainous regions. Hence, the satellite-based precipitation data from relatively flat plains is potentially more reliable for drought monitoring. In terms of seasonal scale, the large differences (e.g., SD, bias, and RMSE) in summer and winter might be caused by the two dominant convective and stratiform precipitations. Li et al. [44] found that over eastern China, the winter precipitation demonstrates stratiform features, but in summer, precipitation has both convective and stratiform characteristics. Those differences might also be caused by systematic and random errors of the TRMM product. AghaKouchak et al. [45] argued that the systematic biases of satellite precipitation are distinctively different in summer andwinter. The systematic (random) error is remarkably higher (lower) during the winter. Furthermore, Maggioni et al. [46] concluded thatlarger error components correspond to a larger magnitudeof rain ratesover the contiguous United States, whichsuggests that future satellite bias adjustment procedures should account for this dependence. Thus, the TRMM 3B43 precipitation products still require further investigation, especially for future developments of more precise precipitation algorithms.
In addition, Wu et al. [47] report that the SPI is strongly influenced by the length of the time series, because the reduced effective sample size leads to instability of the parameter estimates. They suggest a minimum precipitation record for the SPI of 30 years, which is not possible in this study because the TRMM started in 1998 and ended in 2015. However, NASA’s Global Precipitation Measurement (GPM) will continue to offer long-term and consistent precipitation products. A high resolution and advanced data set of the Integrated Multi-satellite Retrievals for GPM (IMERG) wasrecently released [48]. Thus, the use of the IMERG precipitation products for future application in drought monitoring is recommended.

Acknowledgments

This study is financially supported by the Key Programs of the Ministry of Science and Technology of China (2013CB956501), the National Natural Science Foundation of China (41375099&41330529), the National Key Technology Research and Development Program of China (2012BAC07B01), and the Natural Sciences Foundation of Jiangsu Province (BK20141061).

Author Contributions

Hui Tao processed the observations and TRMM 3B43 product and designed the structure. Thomas Fischer was responsible forparts of the data analysis and manuscript writing. Yan Zengprovided in situ observation data, technical support, and conceptual advice. Klaus Fraedrich made important contributions to the concept and final editing of the manuscript.

Conflicts of Interest

The authors declare no conflicts of interest.

References

  1. Bordi, I.; Fraedrich, K.; Jiang, J.M.; Sutera, A. Spatio-temporal variability of dry and wet periods in eastern China. Theor. Appl. Climatol. 2004, 79, 81–91. [Google Scholar] [CrossRef]
  2. Sheffield, J.; Wood, E.F.; Roderick, M.L. Little change in global drought over the past 60 years. Nature 2012. [Google Scholar] [CrossRef] [PubMed]
  3. Trenberth, K.E.; Dai, A.G.; van der Schrier, G.; Jones, P.D.; Barichivich, J.; Briffa, K.R.; Sheffield, J. Global warming and changes in drought. Nat. Clim. Chang. 2014, 4, 17–22. [Google Scholar] [CrossRef]
  4. Damberg, L.; AghaKouchak, A. Global trends and patterns of drought from space. Theor. Appl. Climatol. 2014, 117, 441–448. [Google Scholar] [CrossRef]
  5. Almazroui, M. Calibration of TRMM rainfall climatology over Saudi Arabia during 1998–2009. Atmos. Res. 2011, 99, 404–414. [Google Scholar] [CrossRef]
  6. McRoberts, D.B.; Nielsen-Gammon, J.W. The Use of a High-Resolution Standardized Precipitation Index for Drought Monitoring and Assessment. J. Appl. Meteor. Climatol. 2012, 51, 68–83. [Google Scholar] [CrossRef]
  7. Stampoulis, D.; Anagnostou, E.N. Evaluation of Global Satellite Rainfall Products over Continental Europe. J. Hydrometeorol. 2012, 13, 588–603. [Google Scholar] [CrossRef]
  8. Naumann, G.; Barbosa, P.; Carrao, H.; Singleton, A.; Vogt, J. Monitoring Drought Conditionsand Their Uncertainties in Africa Using TRMM Data. J. Appl. Meteorol. Clim. 2012, 51, 1867–1874. [Google Scholar] [CrossRef]
  9. Zulkafli, Z.; Buytaert, W.; Onof, C.; Manz, B.; Tarnavsky, E.; Lavado, W.; Guyot, J.L. A Comparative Performance Analysis of TRMM 3B42 (TMPA) Versions 6 and 7 for Hydrological Applicaiotns over Andean-Amazon River Basins. J. Hydrometeorol. 2014, 15, 581–592. [Google Scholar] [CrossRef]
  10. Zhao, T.B.; Yatagai, A. Evaluation of TRMM 3B42 product using a new gauge-based analysis of daily precipitation over China. Int. J. Climatol. 2014, 34, 2749–2762. [Google Scholar] [CrossRef]
  11. Qu, J.J.; Powell, A.M.; Sivakumar, M.V.K. Satellite-Based Applications on Climate Change; Springer: Dordrecht, The Netherlands, 2013. [Google Scholar]
  12. Fleming, K.; Awange, J.L. Comparing the version 7 TRMM 3B43 monthly precipitation product with the TRMM 3B43 version 6/6A and Bureau of Meteorology datasets for Australia. Aust. Meteorol. Oceanogr. J. 2013, 63, 421–426. [Google Scholar]
  13. Pfeifroth, U.; Mueller, R.; Ahrens, B. Evaluation of Satellite-Based and Reanalysisprecipitation data in the tropical pacific. J. Appl. Meteorol. Clim. 2013, 52, 634–644. [Google Scholar] [CrossRef]
  14. Prakash, S.; Gairola, R.M. Validation of TRMM-3B42 precipitation product over the tropical indianocean using rain gauge data from the RAMA buoy array. Theor. Appl. Climatol. 2014, 115, 451–460. [Google Scholar] [CrossRef]
  15. Huffman, G.J.; Adler, R.F.; Bolvin, D.T.; Nelkin, E.J. The TRMM Multisatellite Precipitation Analysis (TMPA). In Satellite Applications for Surface Hydrology; Gebremichael, M., Hossain, F., Eds.; Springer Verlag: New York, NY, USA, 2010; pp. 3–22. [Google Scholar]
  16. Prakash, S.; Mahesh, C.; Gairola, R.M. Comparison of TRMM Multisatellite Precipitation Analysis (TMPA)-3B43 version 6 and 7 products with rain gauge data from ocean buoys. Remote Sens. Lett. 2013, 4, 677–685. [Google Scholar] [CrossRef]
  17. Thiemig, V.; Rojas, R.; Zambrano-Bigiarini, M.; Levizzani, V.; Roo, A.D. Validation of Satellite-Based Precipitation Products over Sparsely Gauged African River Basins. J. Hydrometeorol. 2012, 13, 1760–1783. [Google Scholar] [CrossRef]
  18. Chen, Y.; Ebert, E.E.; Walsh, K.J.E.; Davidson, N.E. Evaluation of TMPA 3B42 daily precipitation estimates of tropical cyclone rainfall over Australia. J. Geophys. Res. 2013, 118. [Google Scholar] [CrossRef]
  19. Gebremichael, M.; Hossain, F. Satellite Rainfall Applications for Surface Hydrology; Springer: Houten, The Netherlands, 2010. [Google Scholar] [CrossRef]
  20. Du, L.T.; Tian, Q.J.; Yu, T.; Meng, Q.Y.; Jancso, T.; Udvardy, P.; Huang, Y. A comprehensive drought monitoring method integrating MODIS and TRMM data. Int. J. Appl. Earth Obs. 2013, 23, 245–253. [Google Scholar] [CrossRef]
  21. Dutra, E.; Wetterhall, F.; Giuseppe, F.D.; Naumann, G.; Barbosa, P.; Vogt, J.; Pozzi, W.; Pappenberger, F. Global meteorological drought-Part 1: Probabilistic monitoring. Hydrol. Earth Syst. Sci. 2014, 18, 2657–2667. [Google Scholar] [CrossRef]
  22. Su, F.G.; Hong, Y.; Lettenmaier, D.P. Evaluation of TRMM Multisatellite Precipitation Analysis (TMPA) and Its Utility in Hydrologic Prediction in the La Plata Basin. J. Hydrometeorol. 2008, 9, 622–640. [Google Scholar] [CrossRef]
  23. Wagner, S.; Kunstmann, H.; Bárdossy, A.; Conrad, C.; Colditz, R.R. Water balance estimation of a poorly gauged catchment in West Africa using dynamically downscaled meteorological fields and remote sensing information. Phys. Chem. Earth 2009, 34, 225–235. [Google Scholar] [CrossRef]
  24. Moazami, S.; Golian, S.; Kavianpour, M.R.; Hong, Y. Comparison of PERSIANN and V7 TRMM Multi-satellite Precipitation Analysis (TMPA) products with rain gauge data over Iran. Int. J. Remote Sens. 2013, 34, 8156–8171. [Google Scholar] [CrossRef]
  25. Smith, T.M.; Arkin, P.A.; Bates, J.J.; Huffman, G.J. Estimating Bias of Satellite-BasedPrecipitation Estimates. J. Hydrometeorol. 2006, 7, 841–856. [Google Scholar] [CrossRef]
  26. Hossain, F.; Huffman, G.J. Investigating error metrics for satellite rainfall data at hydrologically relevant scales. J. Hydrometeorol. 2008, 9, 563–575. [Google Scholar] [CrossRef]
  27. Yong, B.; Liu, D.; Gourley, J.J.; Tian, Y.D.; Huffman, G.J.; Ren, L.L.; Hong, Y. Global view of real-time TRMM Multi-satellite Precipitation Analysis: Implication for its successor Global Precipitation Measurement mission. Bull. Am. Meteorol. Soc. 2014, 96, 283–296. [Google Scholar] [CrossRef]
  28. Chen, S.; Hong, Y.; Gourley, J.J.; Huffman, G.J.; Tian, Y.D.; Cao, Q.; Yong, B.; Kirstetter, P.E.; Hu, J.J.; Hardy, J.; et al. Evaluation of the successive V6 and V7 TRMM multisatellite precipitation analysis over the Continental United States. Water Resour. Res. 2013, 49, 8174–8186. [Google Scholar] [CrossRef]
  29. Vernimmen, R.R.E.; Hooijer, A.; Mamenun; Aldrian, E.; van Dijk, A.I.J.M. Evaluation and bias correction of satellite rainfall data for drought monitoring in Indonesia. Hydrol. Earth Syst. Sci. 2012, 16, 133–146. [Google Scholar] [CrossRef]
  30. Aghakouchak, A.; Nakhjiri, N. A near real-time satellite-based global drought climate data record. Environ. Res. Lett. 2012, 7, 044037. [Google Scholar] [CrossRef]
  31. Zhang, A.Z.; Jia, G.S. Monitoring meteorological drought in semiarid regions using multi-sensor microwave remote sensing data. Remote Sens. Environ. 2013, 134, 12–23. [Google Scholar] [CrossRef]
  32. Sahoo, A.K.; Sheffield, J.; Pan, M.; Wood, E.F. Evaluation of the Tropical Rainfall Measuring Mission Multi-Satellite Precipitation Analysis (TMPA) for assessment of large-scale meteorological drought. Remote Sens. Environ. 2015. [Google Scholar] [CrossRef]
  33. National Bureau of Statistics of China. Available online: http://www.stats.gov.cn (accessed on 20 May 2016).
  34. Lu, E.; Liu, S.Y.; Luo, Y.L.; Zhao, W.; Li, H.; Chen, H.X.; Zeng, Y.T.; Liu, P.; Wang, X.M.; Higgins, R.W.; et al. The atmospheric anomalies associated with the drought over the Yangtze River basin during spring 2011. J. Geophys. Res. 2014, 119, 5881–5894. [Google Scholar] [CrossRef]
  35. Goddard Earth Science Data and Information Services Center (GES DISC). Available online: http://disc.sci.gsfc.nasa.gov (accessed on 20 May 2016).
  36. Fischer, T.; Gemmer, M.; Su, B.; Scholten, T. Hydrological long-term dry and wet periods in the Xijiang River basin, South China. Hydrol. Earth Syst. Sci. 2013, 17, 135–148. [Google Scholar] [CrossRef]
  37. McKee, T.; Doesken, N.; Kleist, J. The relationship of drought frequency and duration to time scales. In Proceedings of the 8th Conference of Applied Climatology; American Meteorological Society: Anaheim, CA, USA, 1993; pp. 179–184. [Google Scholar]
  38. Vicente-Serrano, S.M.; Beguería, S.; López-Moreno, J.I. A multiscalar drought index sensitive to global warming: The standardized precipitation evapotranspiration index. J. Clim. 2010, 23, 1696–1718. [Google Scholar] [CrossRef]
  39. Palmer, W.C. Meteorological Droughts; Research Paper 45; U.S. Department of Commerce, Weather Bureau: Washington, DC, USA, 1965; p. 58.
  40. Guttman, N.B. Accepting the standardized precipitation index: A calculation algorithm. J. Am. Water Resour. Assoc. 1999, 35, 311–322. [Google Scholar] [CrossRef]
  41. Sienz, F.; Bothe, O.; Fraedrich, K. Monitoring and quantifying future climate projections of dryness and wetness extreme: SPI bias. Hydrol. Earth Syst. Sci. 2012, 16, 2143–2157. [Google Scholar] [CrossRef]
  42. Farahmand, A.; AghaKouchak, A.A. generalized framework for deriving nonparametric standardized drought indicators. Adv. Water Resour. 2015, 76, 140–145. [Google Scholar] [CrossRef]
  43. World Meteorological Organization (WMO). Standardized Precipitation Index User Guide; WMO-No 1090; Svoboda, M., Hayes, M., Wood, D., Eds.; WMO: Geneva, Switzerland, 2012. [Google Scholar]
  44. Li, Y.Y.; KOU, X.W.; Fang, L.X.; Sun, G.R. Analysis and model evaluation of the relationship between clouds and precipitation over eastern China. Acta Meteorol. Sin. 2015, 73, 766–777. [Google Scholar]
  45. Aghakouchak, A.; Farahmand, A.; Melton, F.S.; Teixeira, J.; Anderson, M.C.; Wardlow, B.D.; Hain, C.R. Remote sensing of drought: Progress, challenges and opportunities. Rev. Geophys. 2015, 53, 452–480. [Google Scholar] [CrossRef]
  46. Maggioni, V.; Sapiano, M.R.P.; Adler, R.F. Estimating Uncertainties in High-Resolution Satellite Precipitation Products:Systematic or Random Error? J. Hydrometeorol. 2016, 17, 1119–1129. [Google Scholar] [CrossRef]
  47. Wu, H.; Hayes, M.J.; Wilhite, D.A.; Svoboda, M.D. The effect on the length of record on the Standardized Precipitation Index calculation. Int. J. Climatol. 2005, 25, 505–520. [Google Scholar] [CrossRef]
  48. Prakash, S.; Mitra, A.K.; Pai, D.S.; AghaKouchak, A. From TRMM to GPM: How well can heavy rainfall be detectedfromspace? Adv. Water Resour. 2016, 88, 1–7. [Google Scholar] [CrossRef]
Figure 1. Geographical distribution of meteorological stations in Jiangsu Province.
Water 08 00221 g001
Figure 2. Annual cycle of monthly precipitation (a) and scatter plot with fitted regression line of annual precipitation (b) derived from TRMM 3B43 and observations; all are averaged over the Jiangsu Province for the period 1998–2014; The horizontal and vertical error bar in Figure 2b denote the standard deviation of annual precipitation derived from TRMM 3B43 and observations, respectively.
Water 08 00221 g002
Figure 3. Scatter plots with fitted regression lines of seasonal precipitation derived from TRMM 3B43 and observations; all are averaged over the Jiangsu Province for the period 1998–2014; The horizontal and vertical error bars denote the standard deviation of seasonal precipitation derived from observations and TRMM 3B43, respectively.
Water 08 00221 g003
Figure 4. 3D scatter plots of seasonal precipitation derived from TRMM 3B43 and observations per station in Jiangsu Province for the period 1998–2014; the green and red dots denote the stations with correlation coefficient significant at the 95% and 99% confidence level, respectively; thehollow dots denote the stations with correlation coefficients not significant at the 95% confidence level.
Water 08 00221 g004
Figure 5. Mean seasonal distribution of precipitation from observations and the TRMM 3B43 product, with corresponding statistical error estimations in Jiangsu Province, 1998–2014; The bold line indicates values of zero; please note that the color bars in the middle panels are not identical.
Water 08 00221 g005
Figure 6. SPI time series calculated from observations (upper panel) and TRMM 3B43 (lower panel) at various monthly time scales (1 to 24 months) over Jiangsu Province, 1998–2014.
Water 08 00221 g006
Figure 7. SPI time series calculated from observations (blue and red shaded bars) and TRMM 3B43 (solid line) at time scales of (a) 3-months; (b) 6-months; (c) 12-months; and (d) 24-months over Jiangsu Province, 1998–2014.
Water 08 00221 g007aWater 08 00221 g007b
Figure 8. Correlation coefficients of the SPI time series calculated from observations and TRMM 3B43 at time scales of 3-, 6-, 12-, and 24-months for each station in Jiangsu Province, 1998–2014; hollow dots indicate stations, which are not significant at the 95% confidence level.
Water 08 00221 g008
Table 1. Descriptive statistics and corresponding equations, where “O” is the observed precipitation data, “T” is the TRMM 3B43 product, and “n” is the sample size.
Descriptive StatisticsEquationUnit
R2 R 2 = i = 1 n ( Oi O ¯ ) ( Ti T ¯ ) i = 1 n ( Oi O ¯ ) 2 . i = 1 n ( Ti T ¯ ) 2 -
Bias Bias = i = 1 n ( Ti Oi ) i = 1 n Oi × 100 %
RMSE RMSE = 1 n i = 1 n ( Ti Oi ) 2 mm
Table 2. Classification of the Standardized Precipitation Index (SPI).
SPIClassificationProbability (%)
1.0 > SPI ≥ −1.0Near normal68.2
−1.0 ≥ SPI > −1.5Moderate drought9.2
−1.5 ≥ SPI > −2.0Severe drought4.4
SPI ≤ −2.00Extreme drought2.3

