
Changing Characteristics of the Water Consumption Structure in Nanjing City, Southern China


Abstract
:
1. Introduction
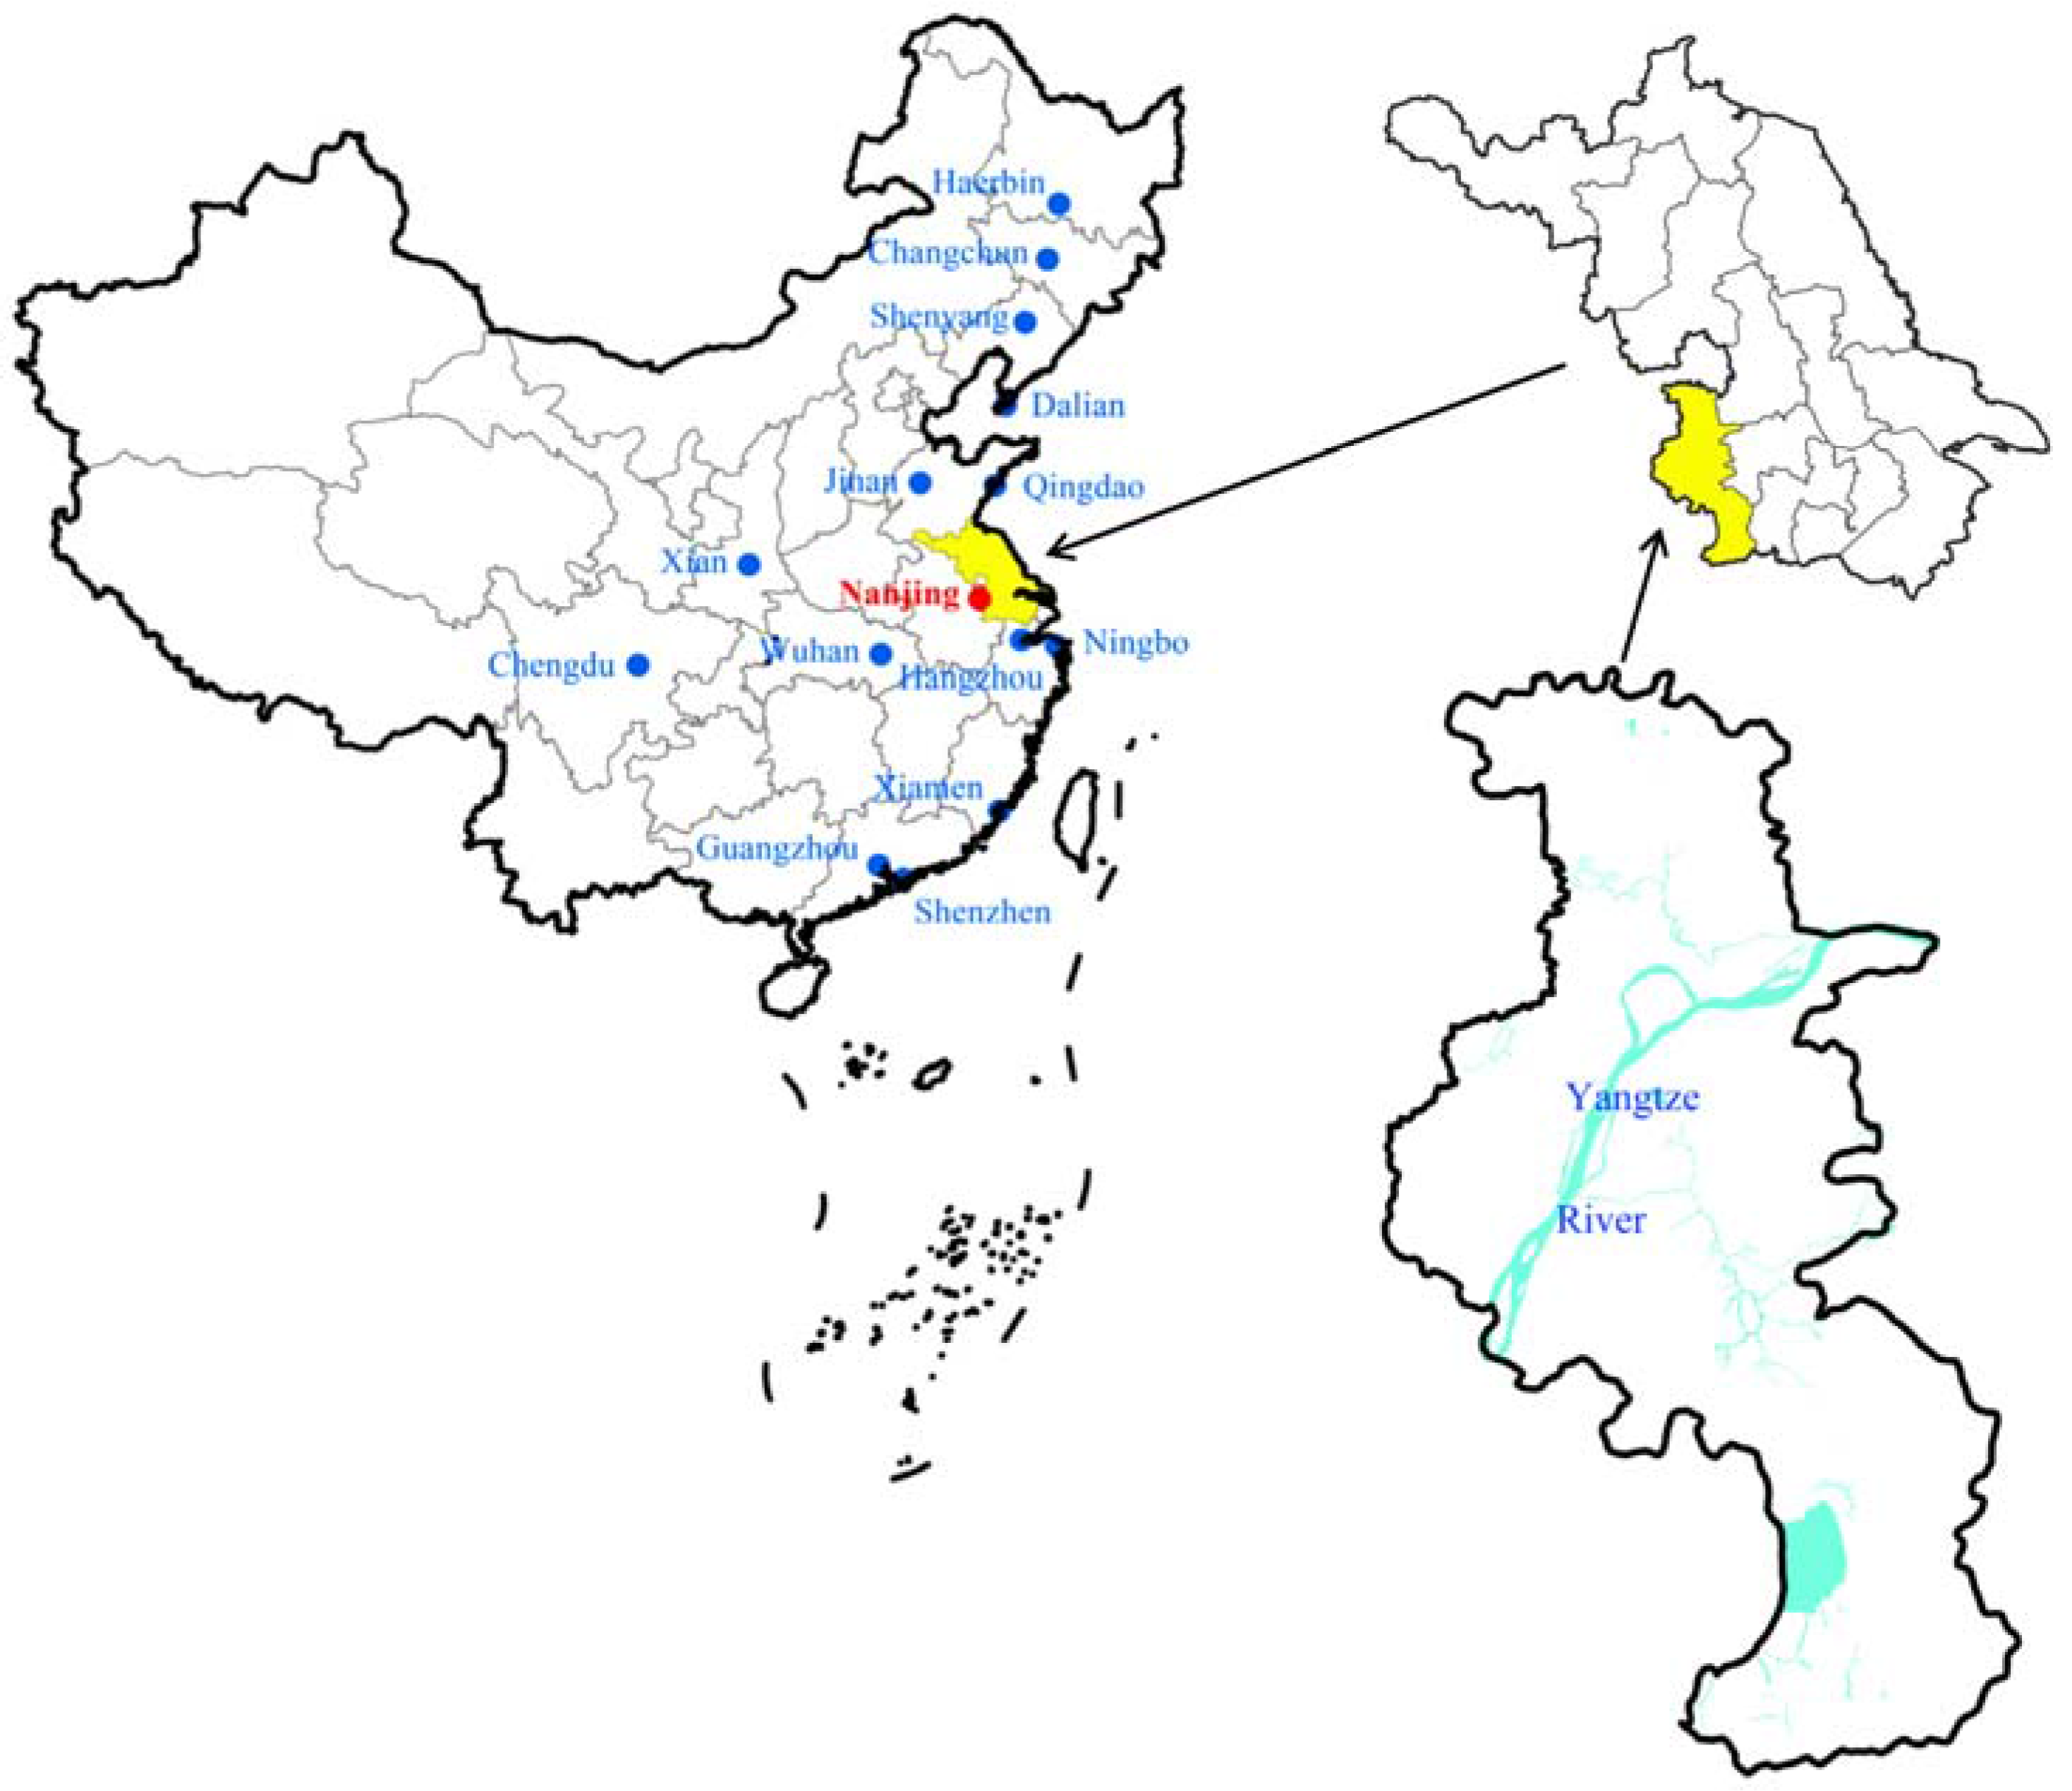
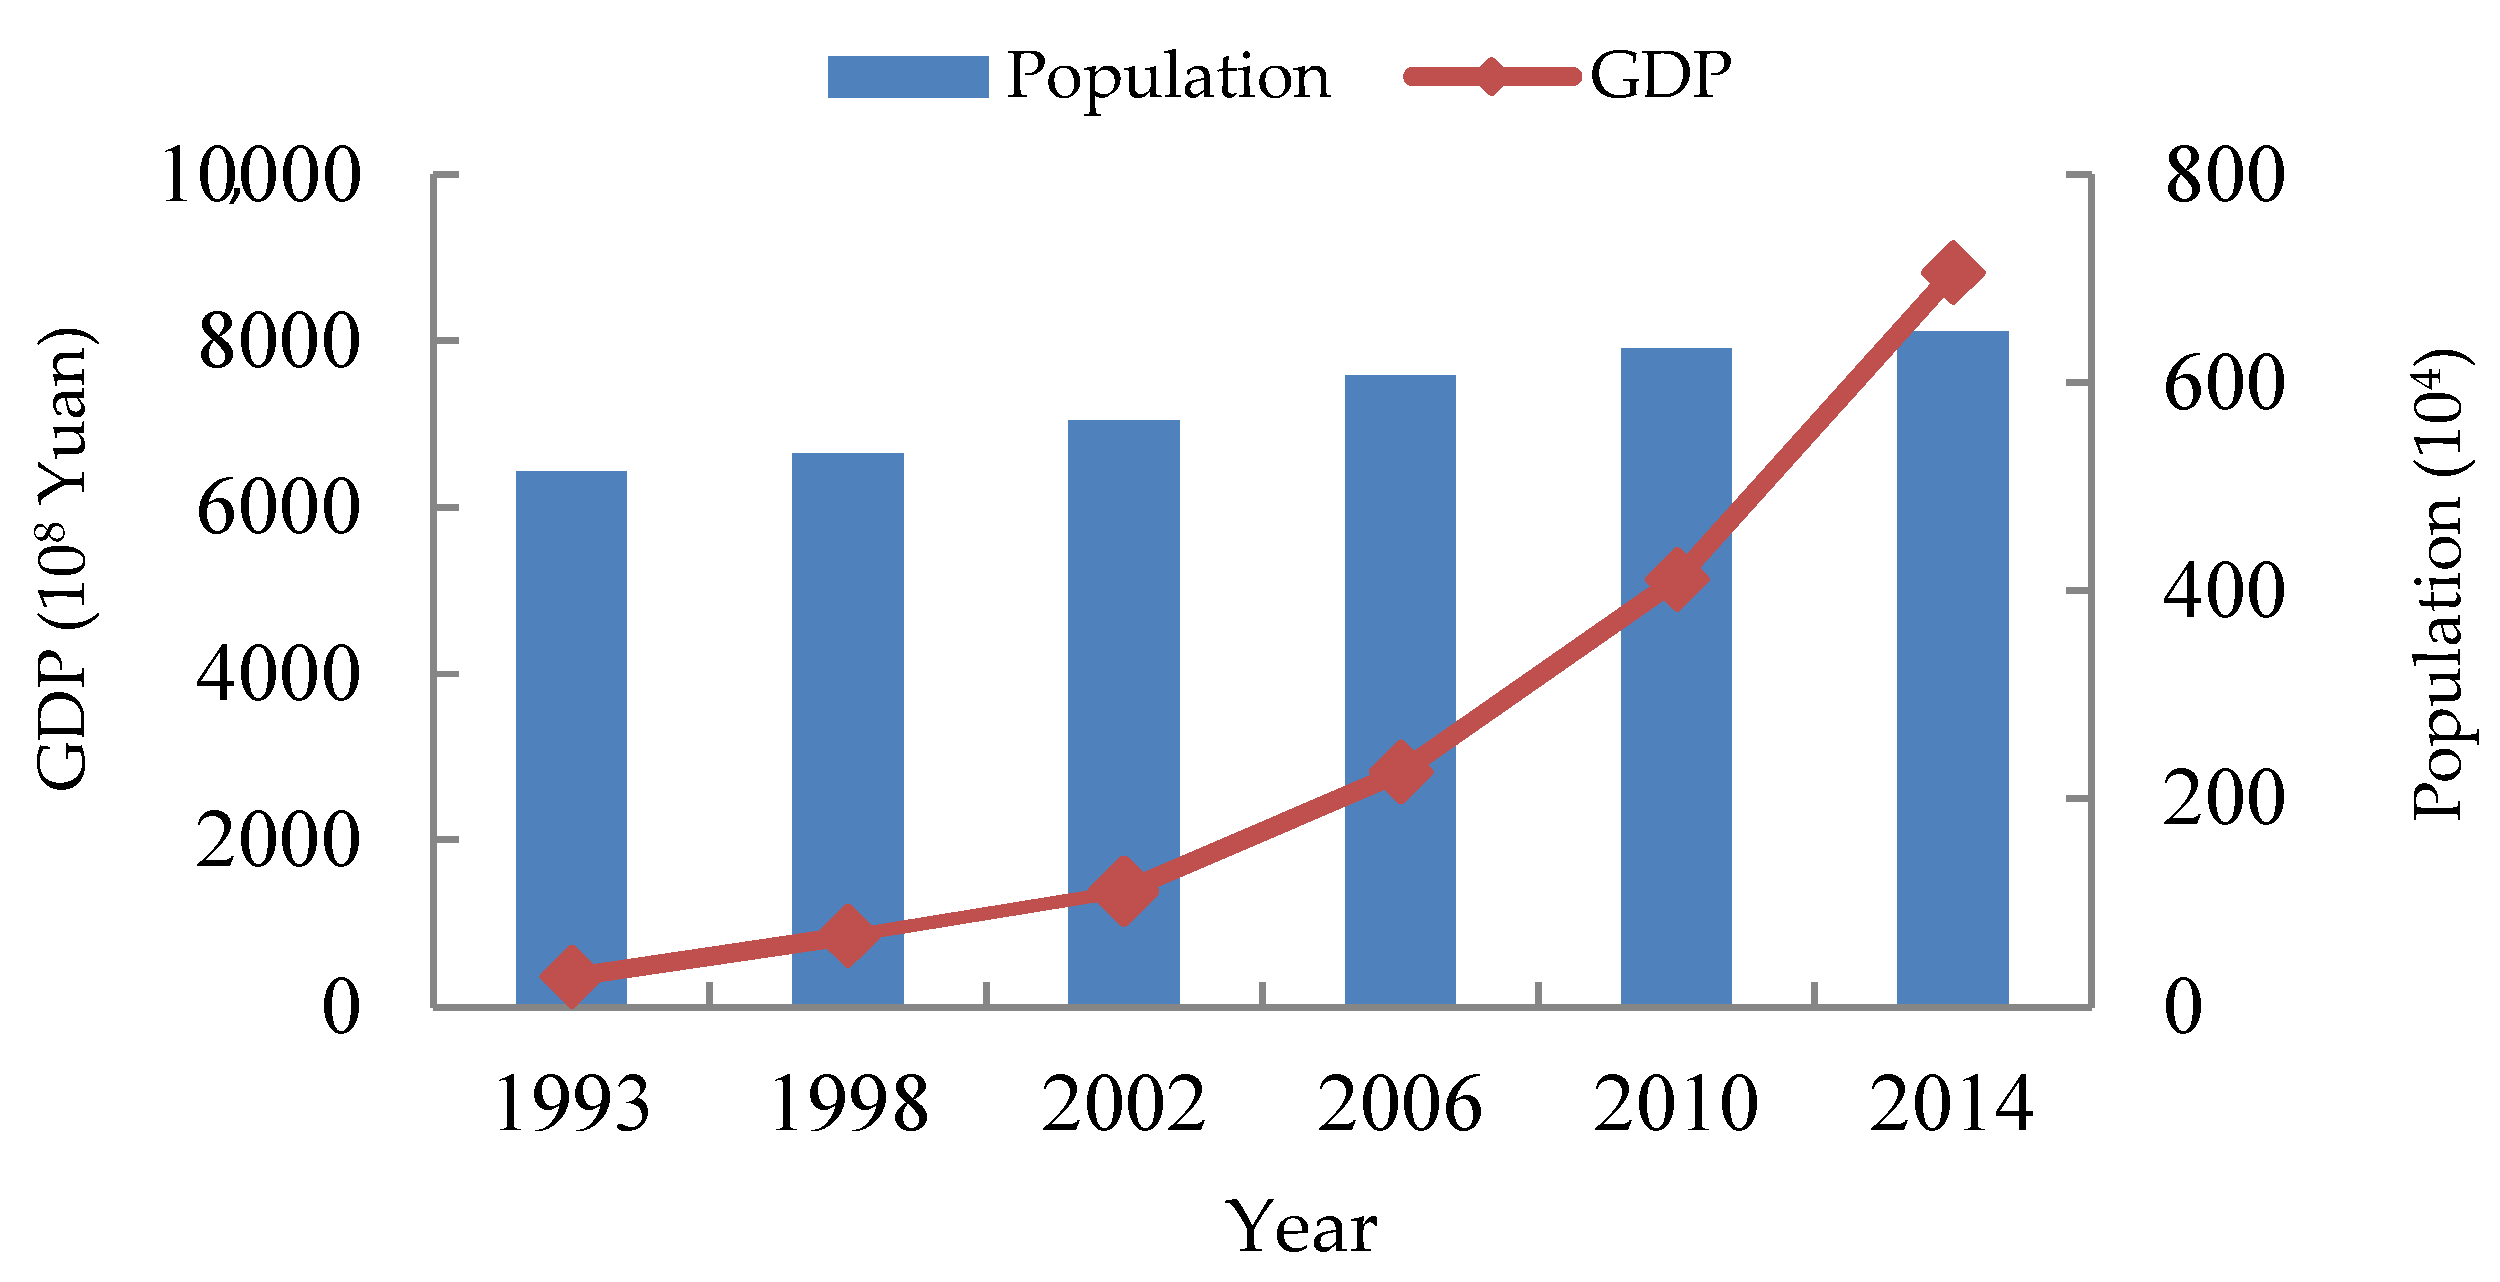
2. Study Area
3. Data and Methods
3.1. Data and Sources
3.2. Methods
3.2.1. Information Entropy
3.2.2. Grey Incidence Analysis
4. Results and Discussion
4.1. Analysis of Water Consumption Using Entropy
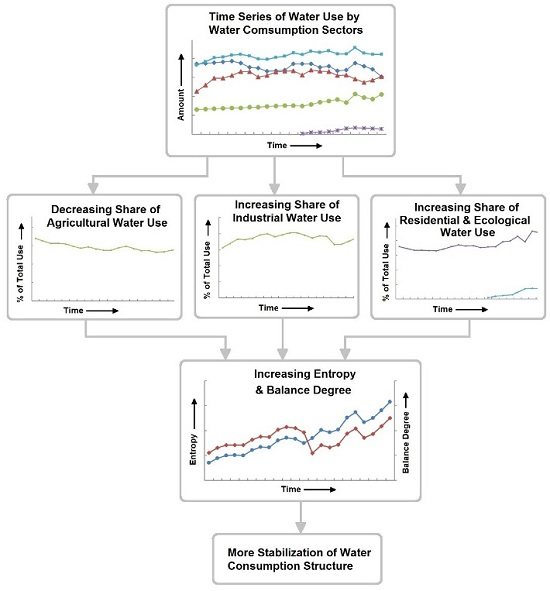
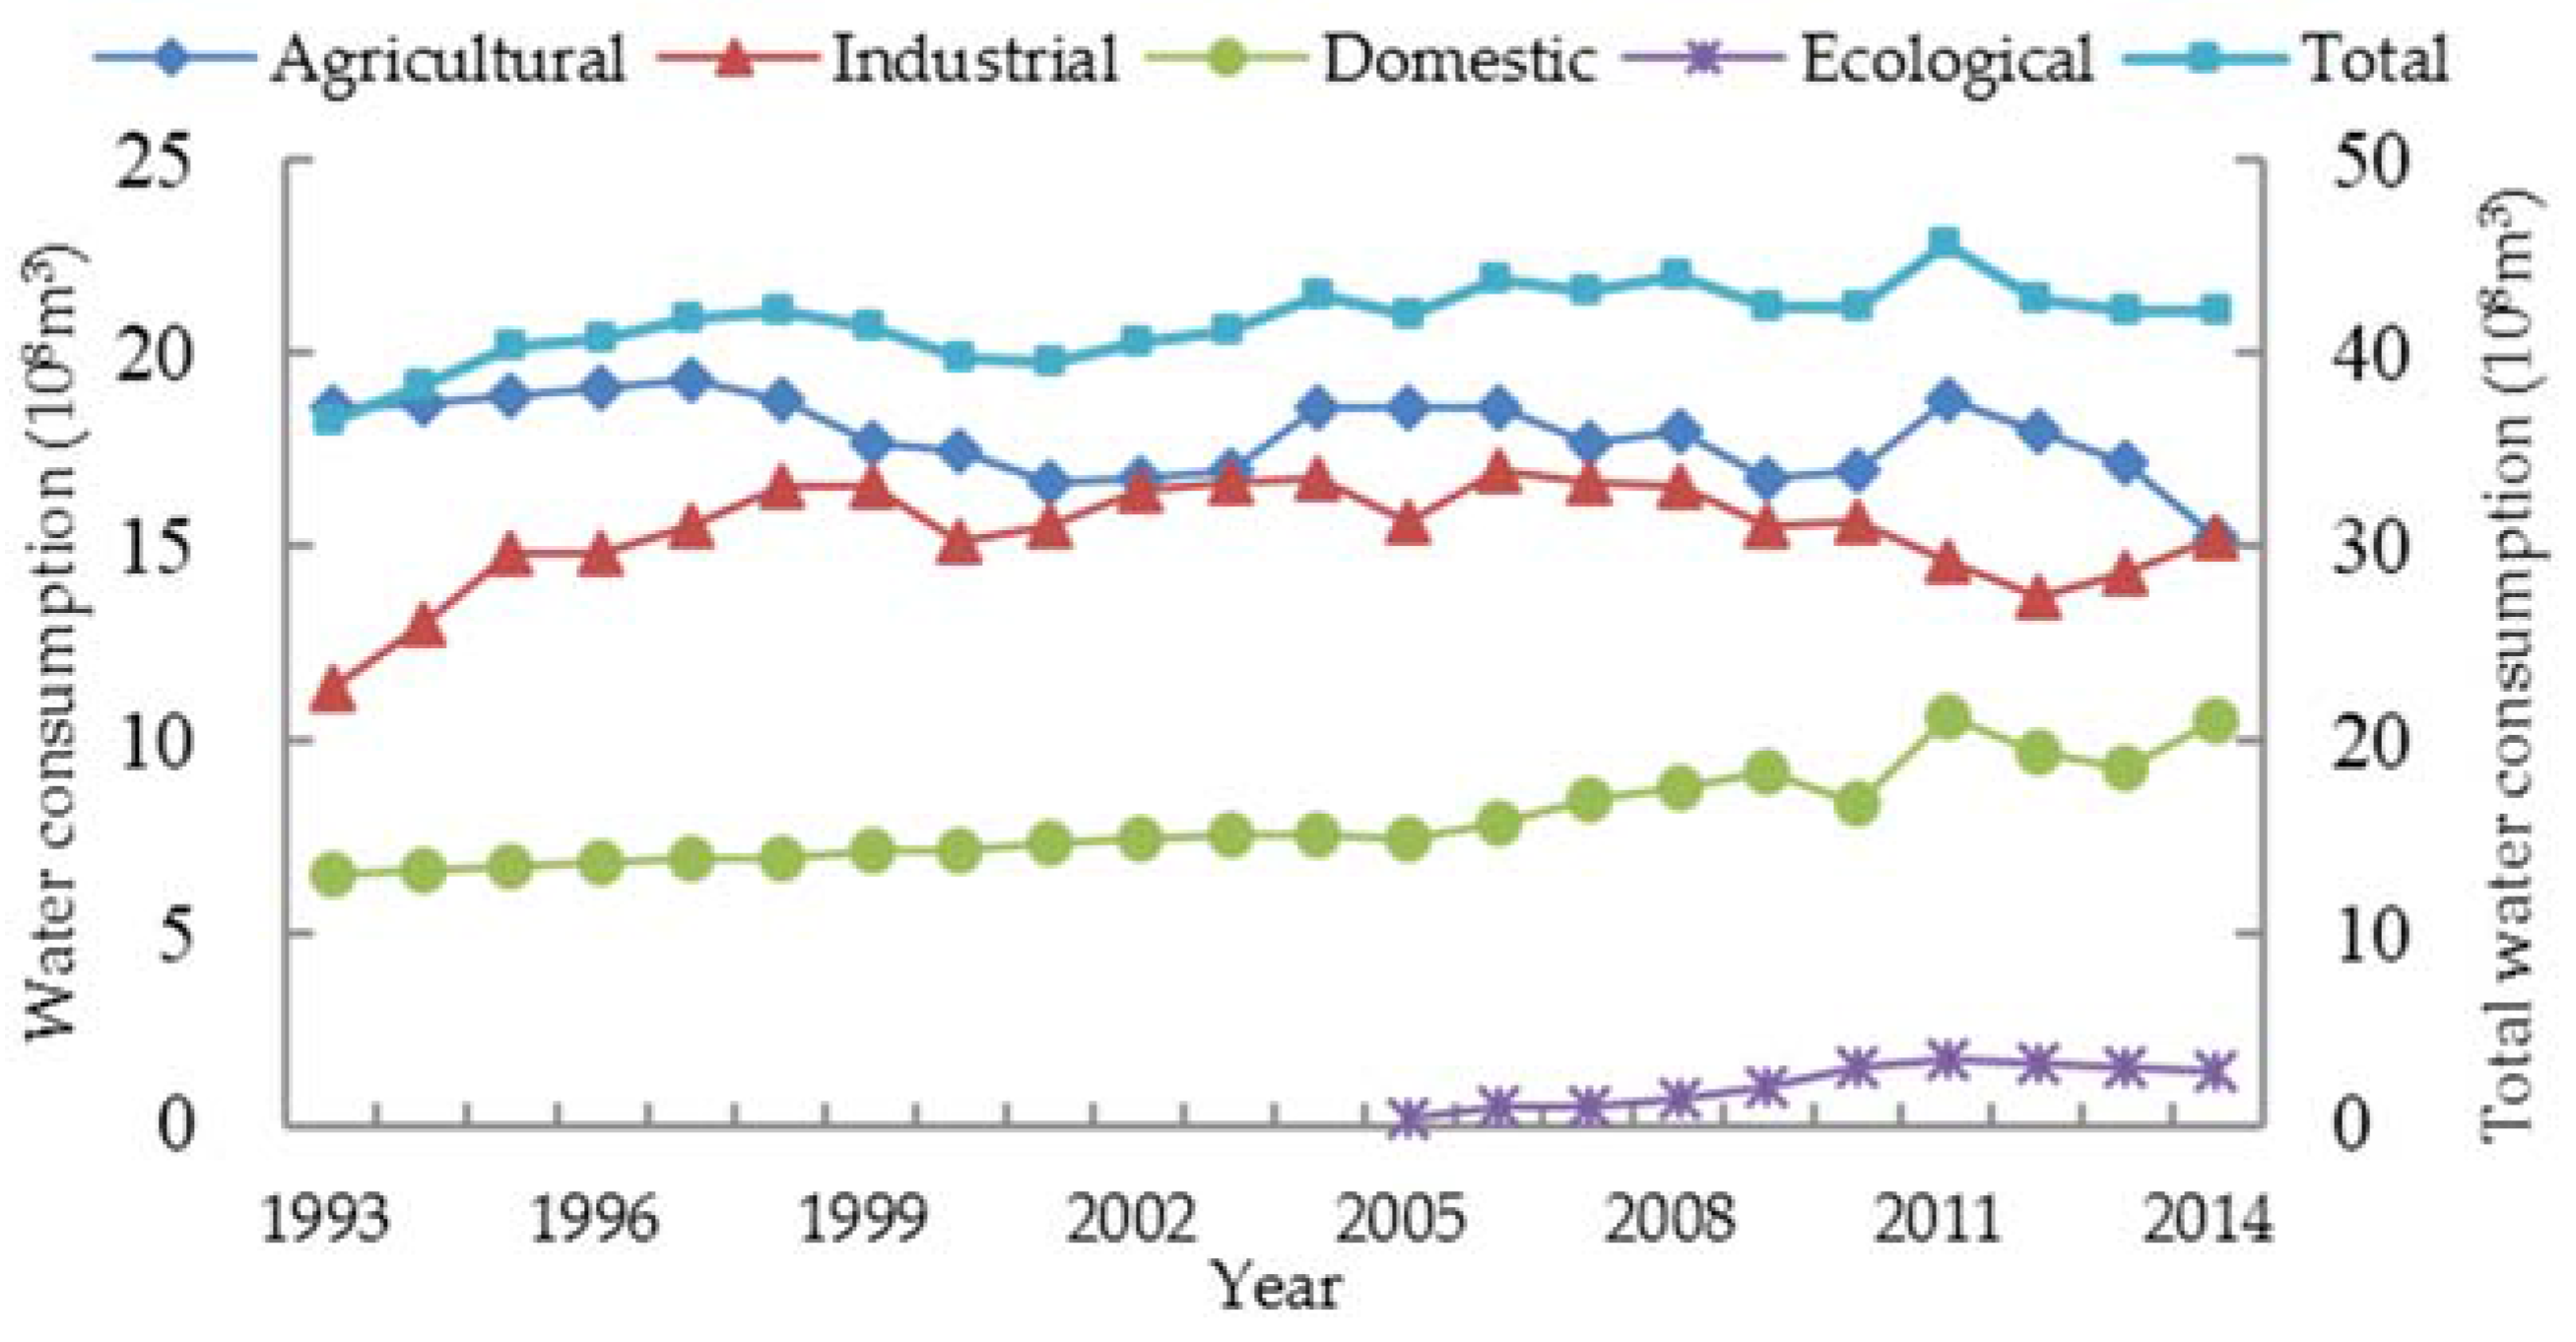
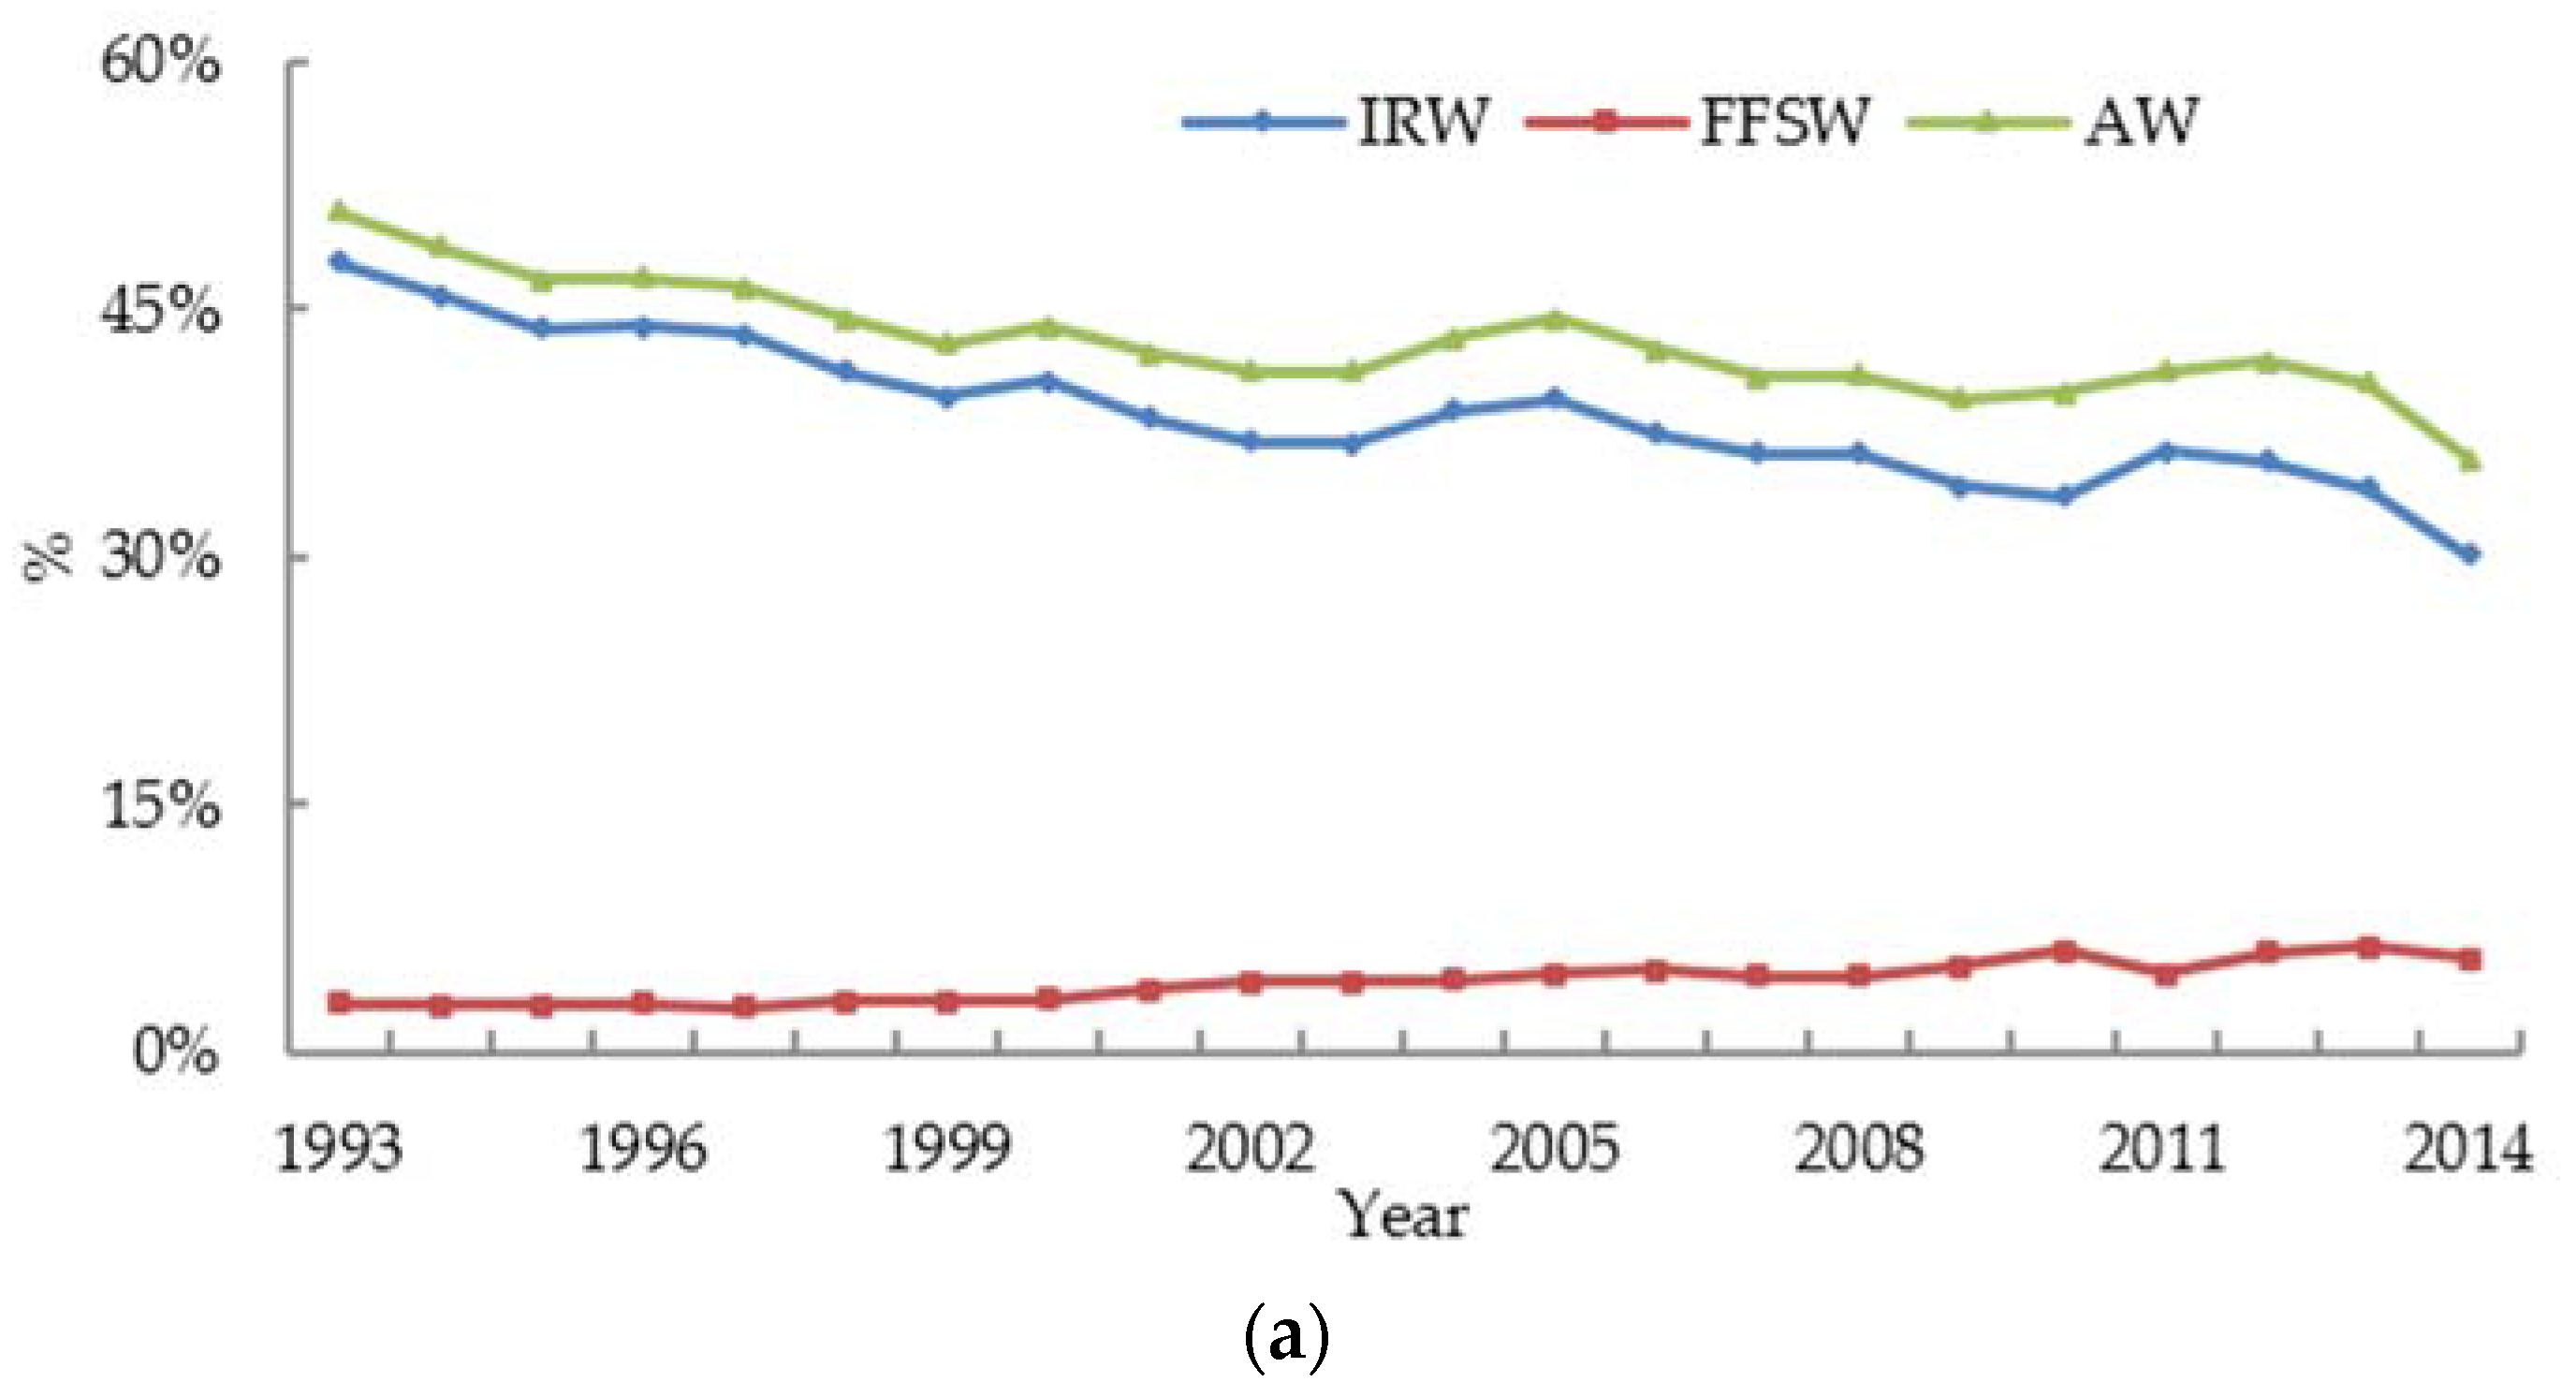
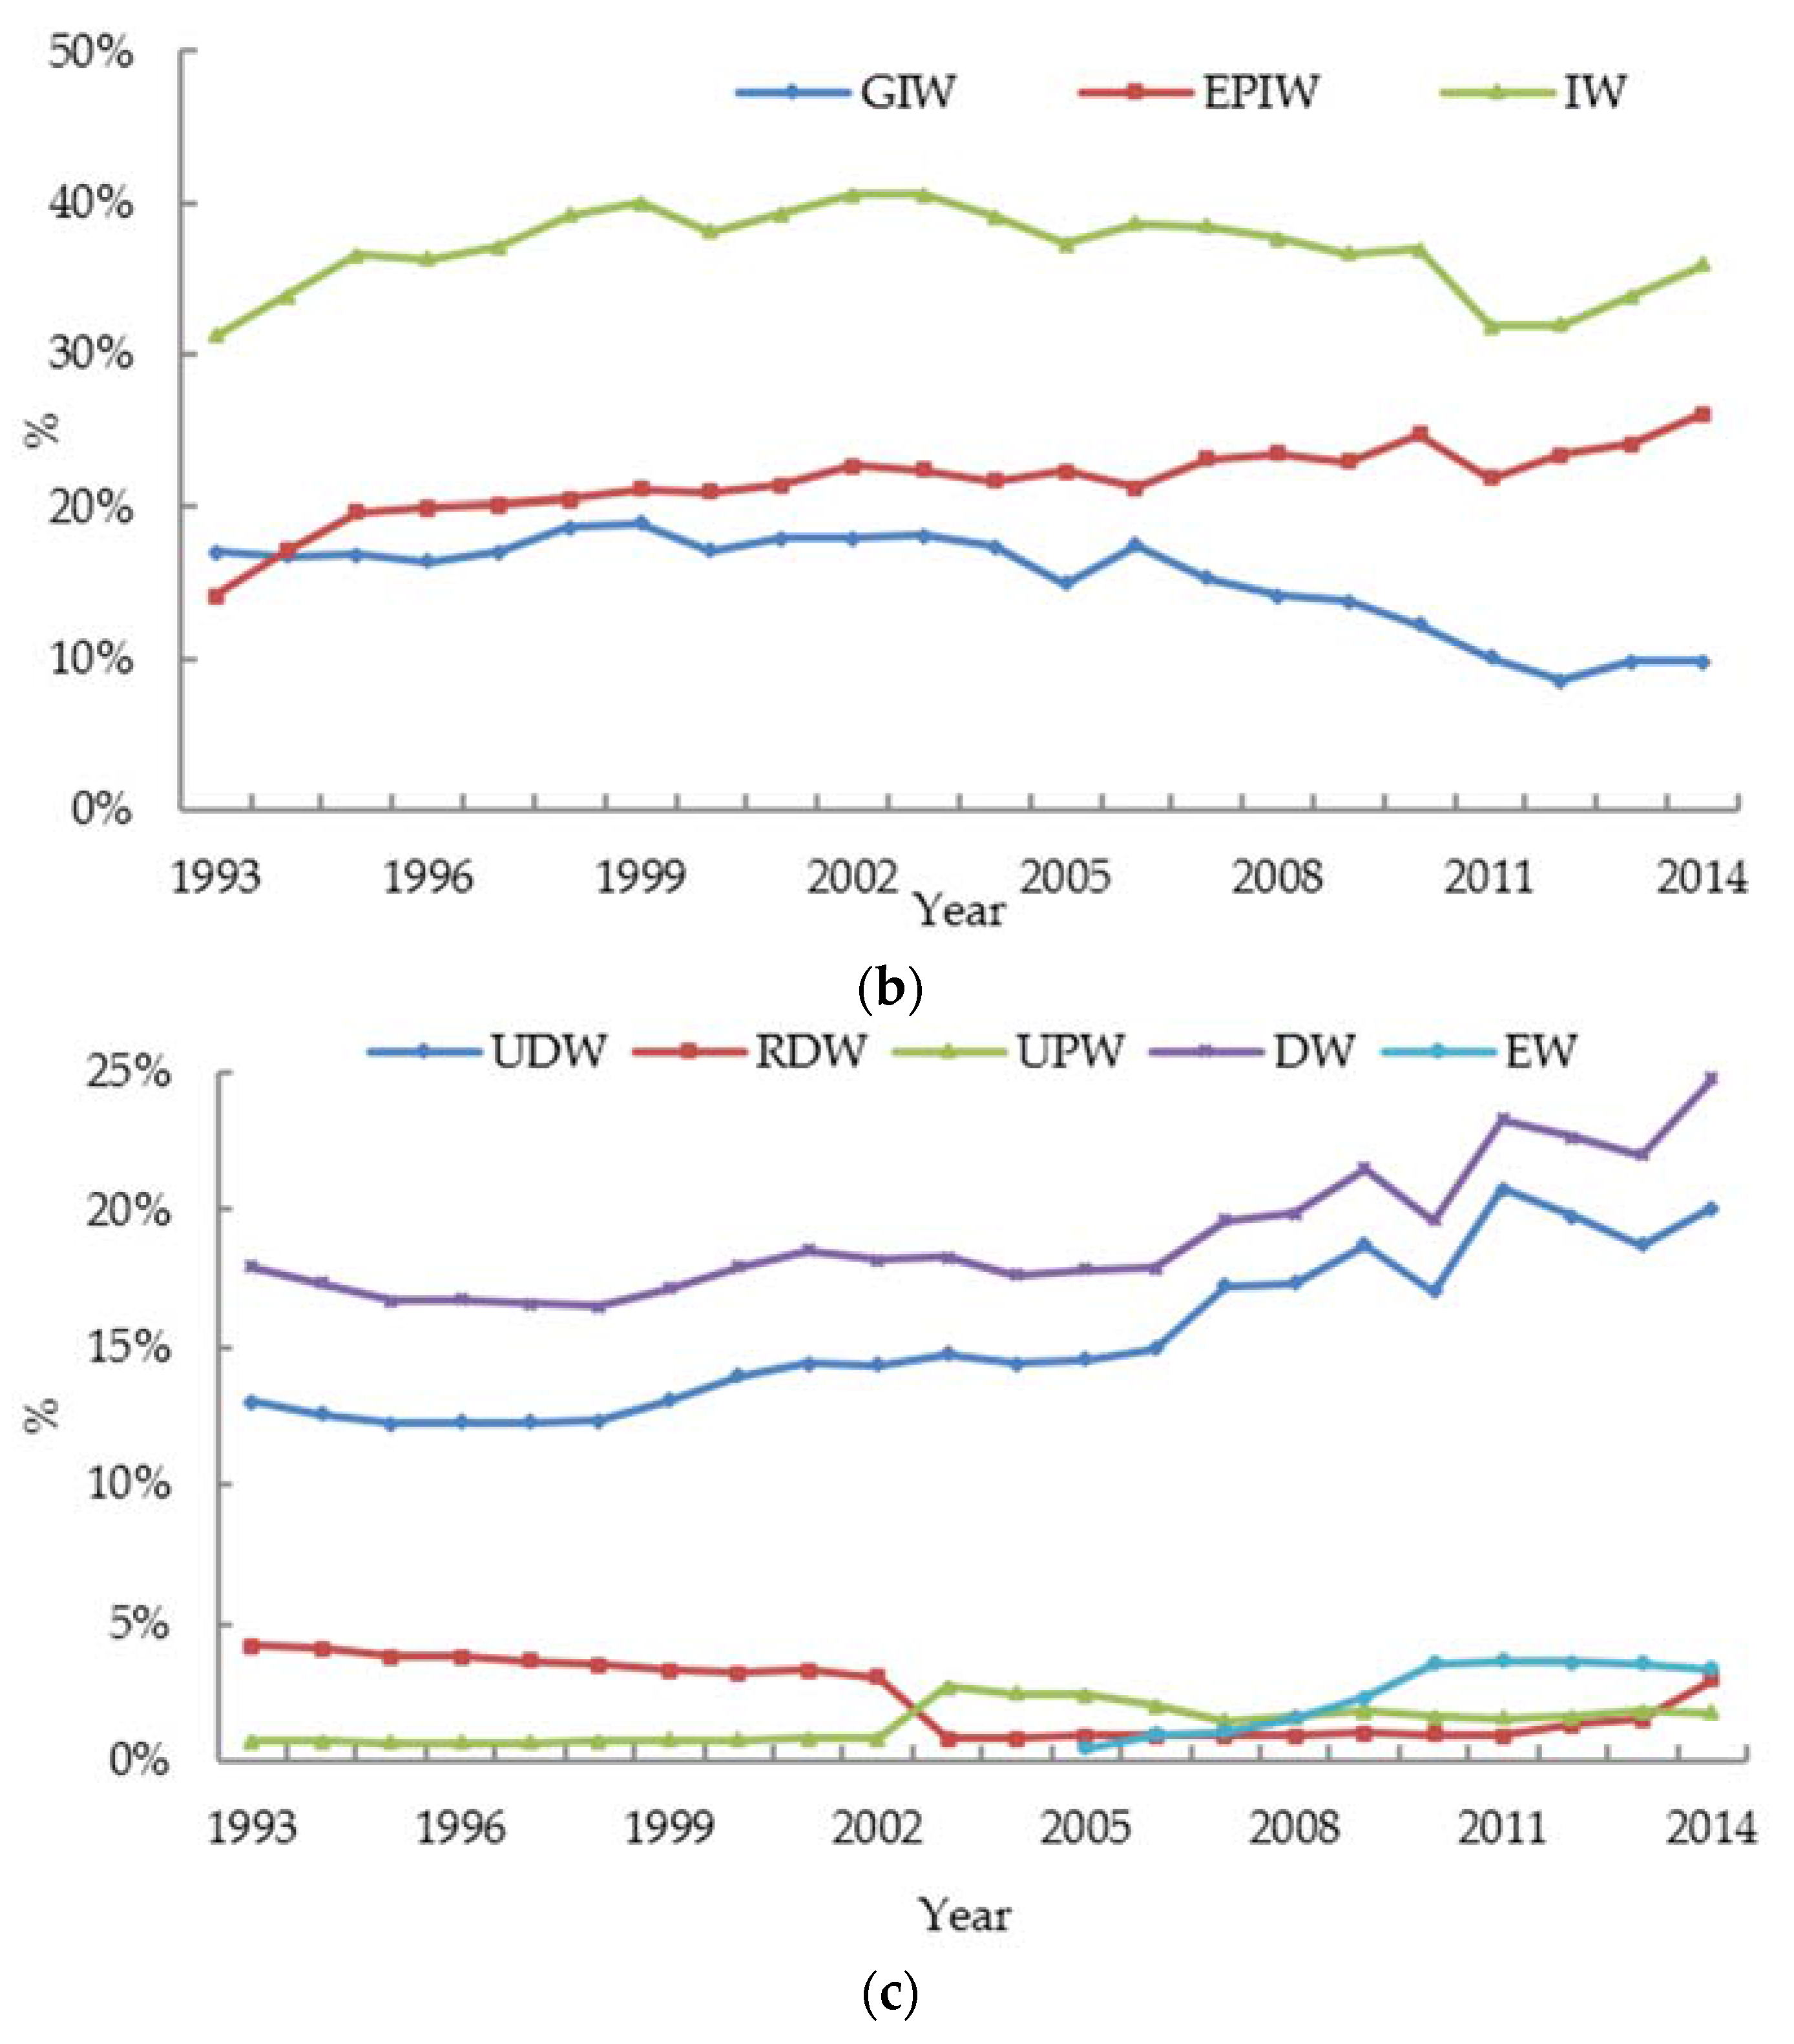
4.1.1. Changes in the Relative Proportions of Water Consumption Sectors
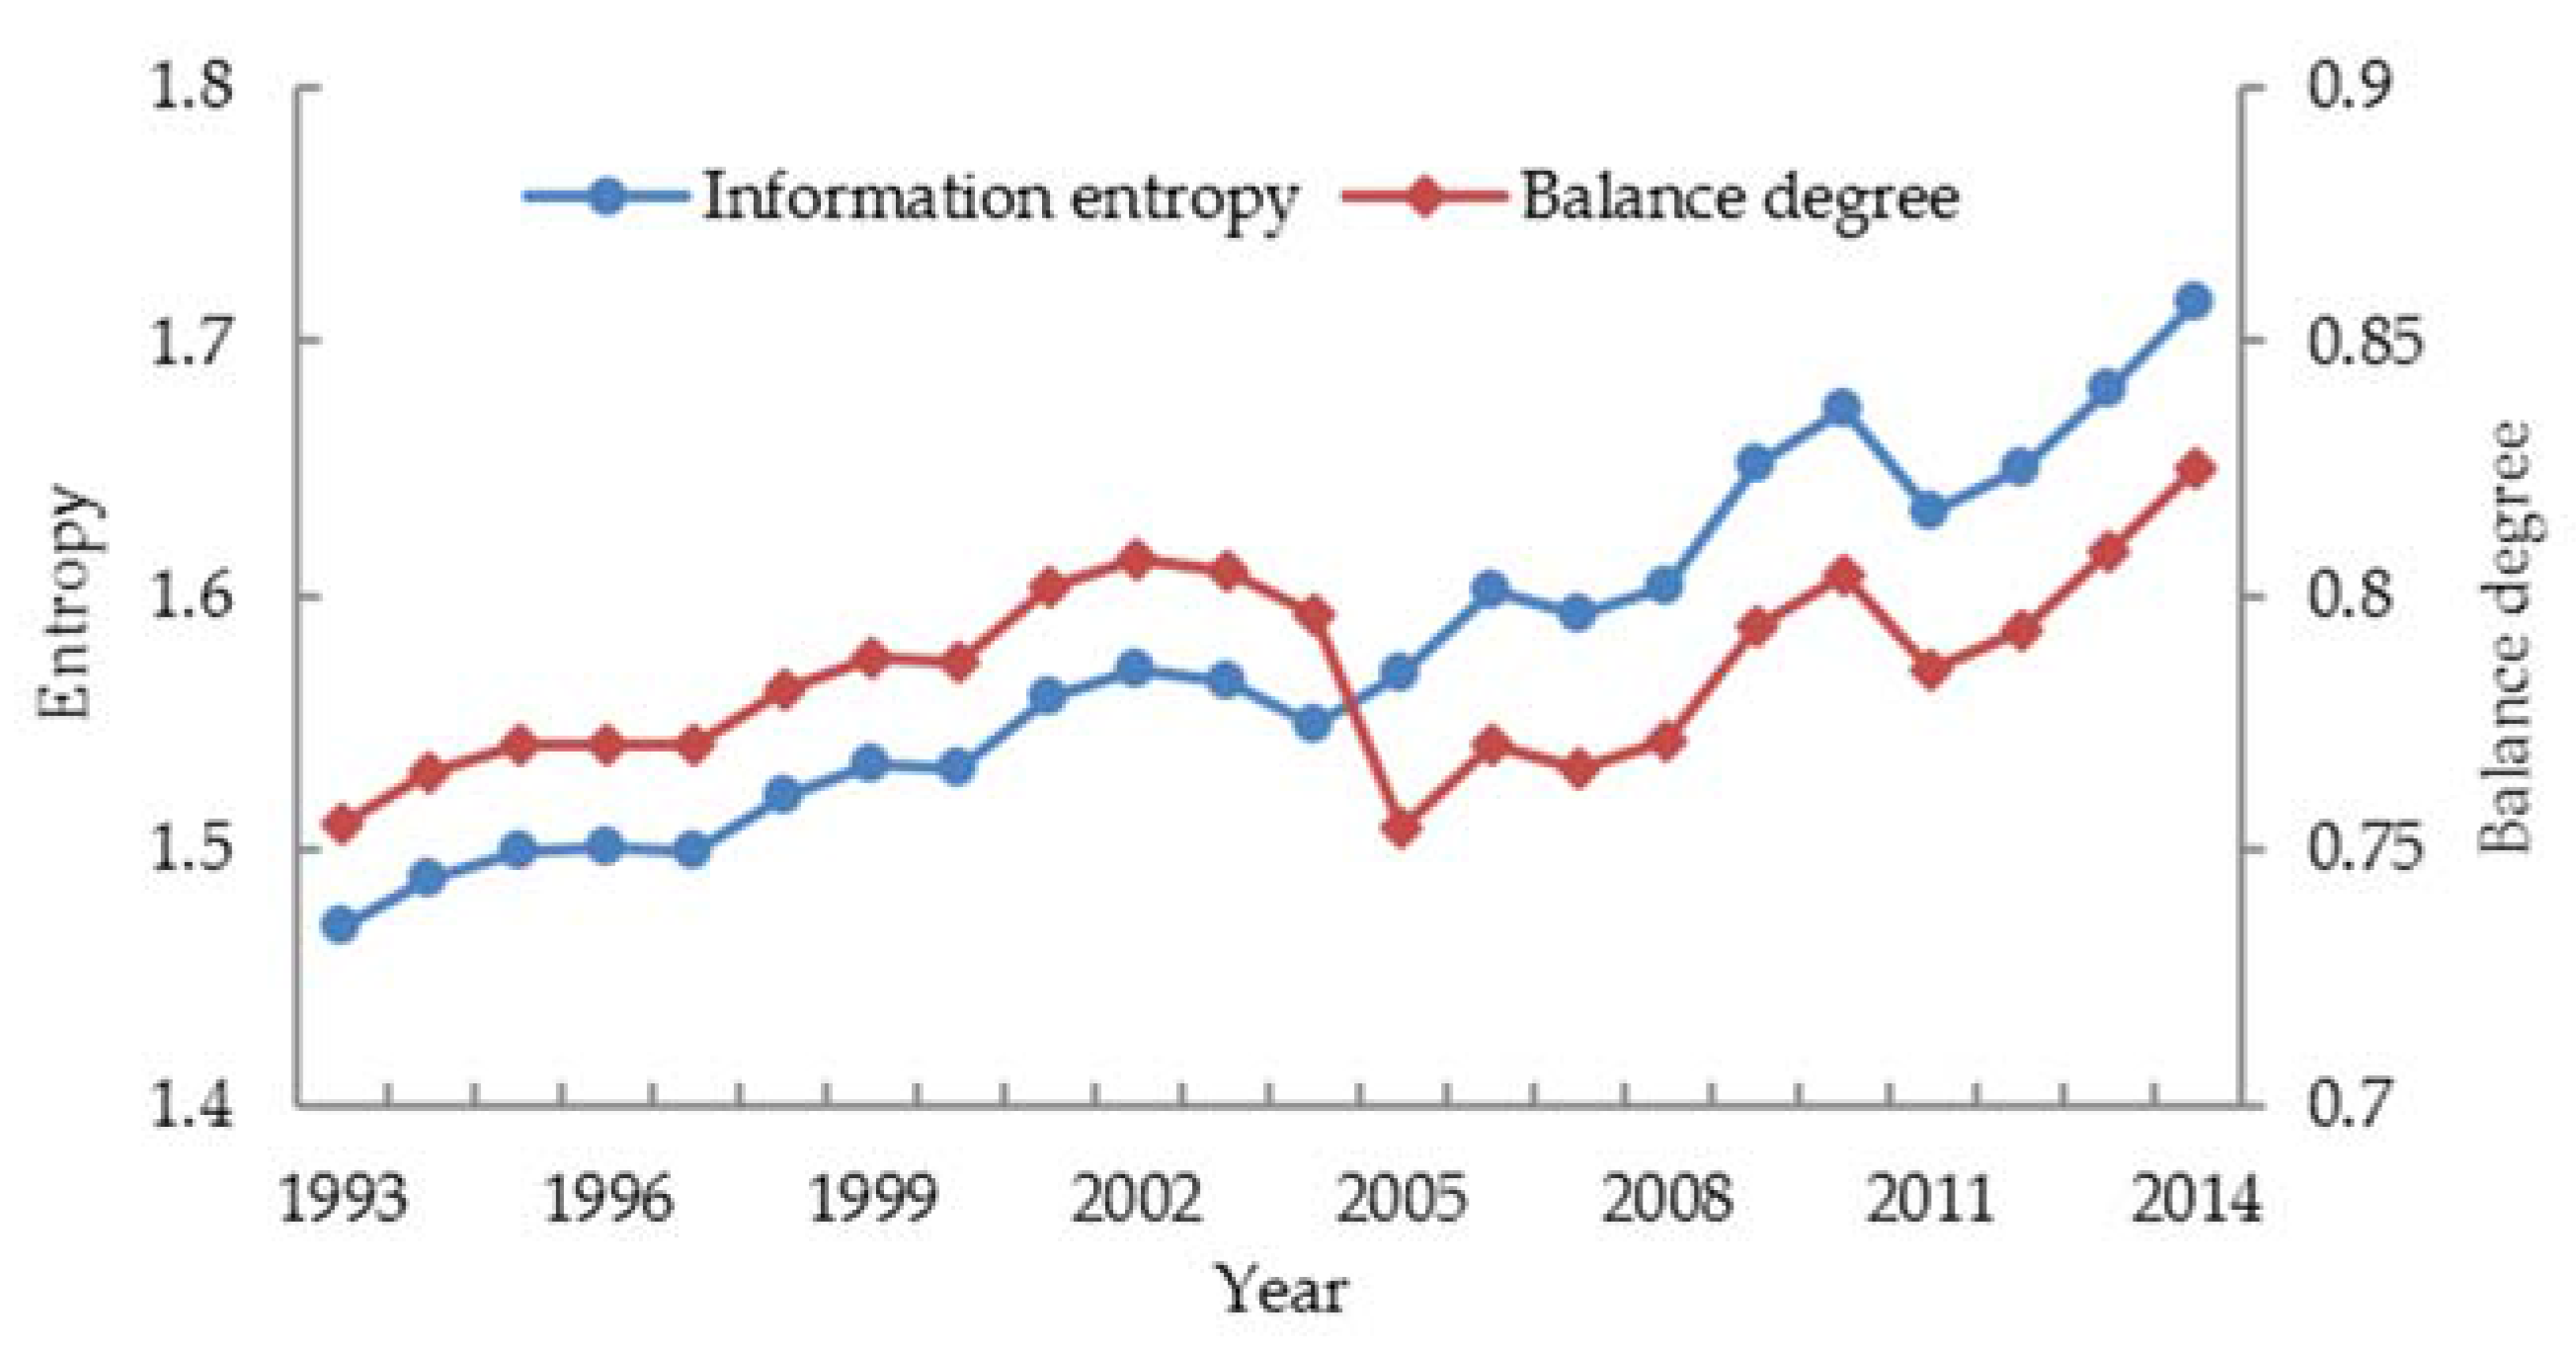
4.1.2. Information Entropy Analysis for Water Consumption
4.2. Analysis of Driving Forces That Affected Water Consumption
4.2.1. Selection and Calculation of Driving Forces
- (1)
- Factors related to AW consumptionRatio of agricultural output (%):Ratio of irrigation area (%):Per capita food production (ton/person):Ratio of grain crops to economic crops (%):Grain crops include wheat, rice, potato, corn, and soybean in Nanjing.
- (2)
- Factors related to IW consumptionRatio of industrial output (%):Ratio of high water consumption industry (%):Reuse ratio for IW (%):Per ten thousand Yuan industrial output of water consumption (m3/ten thousand Yuan):
- (3)
- Factors related to DW consumptionRatio of third industry output (%):Population density (person/km2):Daily water consumption per capita (m3/personday):Natural population growth rate (%):
- (4)
- Factors related to EW consumptionPer capita disposable income of urban residents (Yuan):GDP growth rate (%):Ratio of urban green coverage (%):Per capita park green area (m2/person):
4.2.2. Analysis of Driving Force Factors by Grey Incidence Analysis
- Grey relational ranking of AW consumption: X13 > X11 > X14 > X12
- Grey relational ranking of IW consumption: X22 > X23 > X21 > X24
- Grey relational ranking of DW consumption: X34 > X31 > X32 > X33
- Grey relational ranking of EW consumption: X42 > X43 > X41 > X44
5. Conclusions
Acknowledgments
Author Contributions
Conflicts of Interest
References
- Blanc, E.; Strzepek, K.; Schlosser, C.; Jacoby, H.; Gueneau, A.; Fant, C.; Rausch, S.; Reilly, J. Analysis of US Water Resources under Climate Change; MIT Joint Program on the Science and Policy of Global Change: Cambridge, MA, USA, 2013. [Google Scholar]
- Blignaut, J.; Van Heerden, J. The impact of water scarcity on economic development initiatives. Water SA 2009, 35, 415–420. [Google Scholar] [CrossRef]
- Schlosser, C.A.; Strzepek, K.; Gao, X.; Fant, C.; Blanc, É.; Paltsev, S.; Jacoby, H.; Reilly, J.; Gueneau, A. The future of global water stress: An integrated assessment. Earth’s Future 2014, 2, 341–361. [Google Scholar] [CrossRef]
- Gosling, S.N.; Arnell, N.W. A global assessment of the impact of climate change on water scarcity. Clim. Chang. 2016, 134, 371–385. [Google Scholar] [CrossRef]
- Shandas, V.; Lehman, R.; Larson, K.L.; Bunn, J.; Chang, H. Stressors and strategies for managing urban water scarcity: Perspectives from the field. Water 2015, 7, 6775–6787. [Google Scholar] [CrossRef]
- Cheng, H.; Hu, Y.; Zhao, J. Meeting china’s water shortage crisis: Current practices and challenges. Environ. Sci. Technol. 2009, 43, 240–244. [Google Scholar] [CrossRef] [PubMed]
- Keskinen, M.; Guillaume, J.H.; Kattelus, M.; Porkka, M.; Räsänen, T.A.; Varis, O. The water-energy-food nexus and the transboundary context: Insights from large asian rivers. Water 2016, 8, 193. [Google Scholar] [CrossRef]
- Vörösmarty, C.J.; Green, P.; Salisbury, J.; Lammers, R.B. Global water resources: Vulnerability from climate change and population growth. Science 2000, 289, 284–288. [Google Scholar] [CrossRef] [PubMed]
- Wang, X.; Zhang, J.; Shahid, S.; Eimahdi, A.; He, R.; Bao, Z.; Ali, M. Water resources management strategy for adaptation to droughts in China. Mitig. Adapt. Strateg. Glob. Chang. 2012, 17, 923–937. [Google Scholar] [Green Version]
- Duarte, R.; Pinilla, V.; Serrano, A. Globalization and natural resources: The expansion of the Spanish agrifood trade and its impact on water consumption, 1965–2010. Reg. Environ. Chang. 2016, 16, 259–272. [Google Scholar] [CrossRef]
- Chen, X.F. Analysis of grey relation degree based on water utilization evolution and driving force of information entropy in xiamen. J. Water Resour. Water Eng. 2013, 24, 188–191. [Google Scholar]
- Yun, Y.; Zou, Z.; Wang, H. A regression model based on the compositional data of Beijing’s water consumed structure and industrial structure. Syst. Eng. 2008, 26, 67–71. [Google Scholar]
- Liu, X.; Xie, J. The interactive relationship between water consumption structure and industrial structure of shanxi province. Syst. Eng. 2011, 29, 45–51. [Google Scholar]
- De Paola, F.; Fontana, N.; Galdiero, E.; Giugni, M.; Savic, D.; Degli Uberti, G.S. Automatic multi-objective sectorization of a water distribution network. Procedia Eng. 2014, 89, 1200–1207. [Google Scholar] [CrossRef]
- De Paola, F.; Galdiero, E.; Giugni, M. A jazz-based approach for optimal setting of pressure reducing valves in water distribution networks. Eng. Optim. 2016, 48, 727–739. [Google Scholar] [CrossRef]
- Zheng, A.; Wang, W.; Duan, L. Water consumption structue evolvement and its driving forces for Guanzhong basin. J. Arid Land Resour. Environ. 2011, 9, 015. [Google Scholar]
- Lu, C.-M.; Wu, Z.-N.; Hu, C.-H. Grey relational degree analysis on the major driving forces of water use structure. Water Sav. Irrig. 2008, 2, 013. [Google Scholar]
- Wang, X.-J.; Zhang, J.-Y.; Yang, Z.-F.; Shahid, S.; He, R.-M.; Xia, X.-H.; Liu, H.-W. Historic water consumptions and future management strategies for haihe river basin of northern China. Mitig. Adapt. Strateg. Glob. Chang. 2015, 20, 371–387. [Google Scholar] [CrossRef]
- Zhang, C.; Dong, L.; Liu, Y.; Qiao, H. Analysis on impact factors of water utilization structure in Tianjin, China. Sustainability 2016, 8, 241. [Google Scholar] [CrossRef]
- Ma, L.-H.; Kang, S.-Z.; Su, X.-L. Study on evolution and its driving forces of water utilization structure of shiyang river basin in northwest arid areas. Agric. Res. Arid Areas 2008, 1, 022. [Google Scholar]
- Su, X.; Zhao, C.; Ma, L. Water consumed structure evolvement and its driving forces for guanzhong region in the past 20 years. J. Irrig. Drain. 2008, 5, 019. [Google Scholar]
- Shannon, C.E. Mathematical theory of communication. Bell Syst. Tech. J. 1948, 27, 379–443. [Google Scholar] [CrossRef]
- Doutsoyiannis, K. Uncertainty, entropy, scaling and hydrological statistics. 1. Marginal distributional properties of hydrological processes and state scaling. Hydrol. Sci. J. 2005, 50, 381–404. [Google Scholar]
- Pechlivanidis, I.; Jackson, B.; McMillan, H. The use of entropy as a model diagnostic in rainfall-runoff modelling. In Proceedings of the 2010 International Congress on Environmental Modelling and Software Modelling for Environment’s Sake, Fifth Biennial Meeting, Ottawa, ON, Canada, 5–8 July 2010; Swayne, D.A., Yang, W., Voinov, A.A., Rizzoli, A., Filatova, R.T., Eds.; International Environmental Modelling and Software Society (iEMSs): Ottawa, ON, Canada, 2010. [Google Scholar]
- Singh, V. The use of entropy in hydrology and water resources. Hydrol. Process. 1997, 11, 587–626. [Google Scholar] [CrossRef]
- Mogheir, Y.; De Lima, J.; Singh, V. Characterizing the spatial variability of groundwater quality using the entropy theory: I. Synthetic data. Hydrol. Process. 2004, 18, 2165–2179. [Google Scholar] [CrossRef]
- Singh, V.P. Hydrologic synthesis using entropy theory: Review. J. Hydrol. Eng. 2011, 16, 421–433. [Google Scholar] [CrossRef]
- Singh, V.P. Entropy Theory and Its Application in Environmental and Water Engineering; John Wiley & Sons: Chichester, UK, 2013. [Google Scholar]
- Chen, J.; Zhang, Y.; Chen, Z.; Nie, Z. Improving assessment of groundwater sustainability with analytic hierarchy process and information entropy method: A case study of the hohhot plain, china. Environ. Earth Sci. 2015, 73, 2353–2363. [Google Scholar] [CrossRef]
- Kim, S.; Kim, Y.; Kang, N.; Kim, H.S. Application of the entropy method to select calibration sites for hydrological modeling. Water 2015, 7, 6719–6735. [Google Scholar] [CrossRef]
- Da Silva, V.P.R.; Belo Filho, A.F.; Almeida, R.S.R.; de Holanda, R.M.; da Cunha Campos, J.H.B. Shannon information entropy for assessing space–time variability of rainfall and streamflow in semiarid region. Sci. Total Environ. 2016, 544, 330–338. [Google Scholar] [CrossRef] [PubMed]
- Zeng, X.; Wu, J.; Wang, D.; Zhu, X.; Long, Y. Assessing bayesian model averaging uncertainty of groundwater modeling based on information entropy method. J. Hydrol. 2016, 538, 689–704. [Google Scholar] [CrossRef]
- Deng, J. A Course on Grey System Theory; Huazhong University of Science and Technology Press: Wuhan, China, 1990. [Google Scholar]
- Deng, J.L. Grey control system. J. Huazhong Univ. Sci. Technol. 1982, 3, 9–18. [Google Scholar]
- Liu, S.; Fang, Z.; Lin, Y. A new definition for the degree of grey incidence. Sci. Inq. 2006, 7, 111–124. [Google Scholar]
- UNESCO-WWAP. Facts and Figures Managing Water Under Uncertainty and Risk; The United Nations World Water Development Report 4; The United Nations World Water Assessment Programme: Paris, France, 2012. [Google Scholar]
- National Bureau of Statistics of China (NBS). Statistical Communiqué of the People’s Republic of China; National Bureau of Statistics of China: Beijing, China, 2012.
- Wu, B.; Zhao, D.; Jia, H.; Zhang, Y.; Zhang, X.; Cheng, S. Preliminary risk assessment of trace metal pollution in surface water from Yangtze river in Nanjing section, China. Bull. Environ. Contam. Toxicol. 2009, 82, 405–409. [Google Scholar] [CrossRef] [PubMed]
- Statistical Bureau of Nanjing. Nanjing Statistical Yearbook; China Statistics Press: Beijing, China, 2015.
- Bureau of Nanjing Water Resources. Water res Bulletin of Nanjing 2002–2013; Bureau of Nanjing Water Resources: Nanjing, China, 2002–2013.
- Liu, S.; Lin, Y. Grey Information: Theory and Practical Applications; Springer Science & Business Media: Heidelberg, Germany, 2006. [Google Scholar]
- Liu, S.; Forrest, J.Y.L. Grey Systems: Theory and Applications; Springer: Berlin, Geramny, 2010. [Google Scholar]
- Lin, Y.; Liu, S. Solving problems with incomplete information: A grey systems approach. Adv. Imaging Electron Phys. 2006, 141, 77–174. [Google Scholar]
- Lin, Y.; Chen, M.-Y.; Liu, S. Theory of grey systems: Capturing uncertainties of grey information. Kybernetes 2004, 33, 196–218. [Google Scholar] [CrossRef]
- Ingle, V.R.; Ingle, V. An empirical study on degrees of grey incidences to decide maintenance priorities of power transformers. Int. J. Recent Trends Eng. Technol. 2014, 11, 60–66. [Google Scholar]
- Lei, H.; Zhang, X. Analysis on water use structure change and its driving forces during last 10 years in shaanxi province. J. Water Resour. Water Eng. 2012, 4, 028. [Google Scholar]


| Referenced Sequence | Comparison Sequence | N | Mean | SD | Synthetic Incidence Degree |
|---|---|---|---|---|---|
| Ratio of AW | X11 | 22 | 0.046 | 0.017 | 0.7370 |
| X12 | 22 | 0.734 | 0.080 | 0.5494 | |
| X13 | 22 | 0.228 | 0.071 | 0.9085 | |
| X14 | 22 | 1.197 | 0.650 | 0.6016 | |
| Ratio of IW | X21 | 22 | 0.471 | 0.031 | 0.5571 |
| X22 | 22 | 0.328 | 0.054 | 0.8948 | |
| X23 | 22 | 0.669 | 0.138 | 0.6449 | |
| X24 | 22 | 238.863 | 178.781 | 0.5073 | |
| Ratio of DW | X31 | 22 | 0.483 | 0.046 | 0.6441 |
| X32 | 22 | 883.201 | 70.601 | 0.6374 | |
| X33 | 22 | 358.086 | 100.066 | 0.5766 | |
| X34 | 22 | 0.025 | 0.011 | 0.6490 | |
| Ratio of EW | X41 | 10 | 28,076.2 | 9474.497 | 0.5551 |
| X42 | 10 | 0.127 | 0.019 | 0.6439 | |
| X43 | 10 | 44.756 | 0.811 | 0.5629 | |
| X44 | 10 | 13.620 | 0.853 | 0.5226 |
© 2016 by the authors; licensee MDPI, Basel, Switzerland. This article is an open access article distributed under the terms and conditions of the Creative Commons Attribution (CC-BY) license (http://creativecommons.org/licenses/by/4.0/).
Share and Cite
Wu, H.; Wang, X.; Shahid, S.; Ye, M. Changing Characteristics of the Water Consumption Structure in Nanjing City, Southern China. Water 2016, 8, 314. https://doi.org/10.3390/w8080314
Wu H, Wang X, Shahid S, Ye M. Changing Characteristics of the Water Consumption Structure in Nanjing City, Southern China. Water. 2016; 8(8):314. https://doi.org/10.3390/w8080314
Chicago/Turabian StyleWu, Hao, Xiaojun Wang, Shamsuddin Shahid, and Mao Ye. 2016. "Changing Characteristics of the Water Consumption Structure in Nanjing City, Southern China" Water 8, no. 8: 314. https://doi.org/10.3390/w8080314