1. Introduction
Meteorological disasters caused by climate change have become more frequent and more widespread around the world [
1,
2]. The influence of meteorological disasters, such as drought and flood, involves social, economic and environmental fields [
3,
4,
5]. Of all meteorological disasters, droughts account for 5%, but losses caused by droughts account for 30% of all disaster-related losses [
6]. In China, droughts play a vital role because they make up 53% of natural disasters [
6,
7]. Statistical data show that, from 1950 to 2013, the average annual percentages of arable land considered statistical drought-affected area (the planting area with more than 10% reduction in yield caused by drought hazards, compared with the annual average yield) and drought-suffering area (the planting area with more than 30% reduction in yield caused by drought hazards, compared with the annual average yield) are 18.5% and 8.3%, respectively. Both ratios show simultaneous increasing trends. The Huang-Huai-Hai River Basin of China is one of the regions that often experiences the most frequent and severe occurrences of drought. Drought events in Huang-Huai-Hai River Basin possess three characteristics: high intensity, wide range, and high frequency [
8].
As an extreme event in the water cycle, the occurrence of drought can be affected by complex factors such as climate change, underlying surface conditions and the regulation of water conservancy projects [
9]. Drought and flood events have a natural–artificial dualistic characteristic, which means that water conservancy projects such as reservoirs and ditches can influence the hydrological process to some extent, which then influences the characteristics of the drought and flood events [
10,
11,
12,
13]. From the hydrological process aspect, conservancy projects disturb the hydrologic regime downstream and directly affect variations in streamflow [
14,
15]. Zhao found that after the construction of Manwan Dam in Lancang River, China, the variability in maximum runoff occurrence in the post-dam period was less than that in the pre-dam period [
16]. The ditches affect connectivity and flow stream of the rivers and the lakes. Thus influence the land surface processes in the hydrological process. For drought and flood events, water conservancy projects reduce or even eliminate high flows by storing water in reservoirs in the flood season and increase low flows by releasing the stored water for water supply during times of drought [
17,
18].
Due to the mechanism mentioned above, water conservancy projects, which mainly include projects to store, divert, lift and transfer water, are critical influencing factors of drought coping ability [
19]. The layout, scale and connectivity of those projects determine the drought coping ability of the region. In recent years, scholars in other countries have mainly focused on the importance of water supply management in researching drought coping systems [
20,
21]. Scholars in China have made some progress in the study of drought coping ability of the water resources projects [
22,
23,
24]. However, less research has been performed to understand the drought coping ability in multi-water sources and multi-project regions or basins.
Focusing on the issues mentioned above, in this paper we chose the China-Z index of growing season during 1961–2011 as the assessment index of drought categories in the Huang-Huai-Hai River Basin. The density and capability of several water conservancy projects were chosen to establish the assessment index system of the drought coping ability of water conservancy projects in the Huang-Huai-Hai River Basin. The fuzzy comprehensive assessment model was constructed on the basis of analytic hierarchy process (AHP) and fuzzing mathematics. The assessment result of the drought coping ability could provide evidence to assist in the regulation of the water conservancy projects.
2. Materials and Methods
2.1. Description of the Study Area
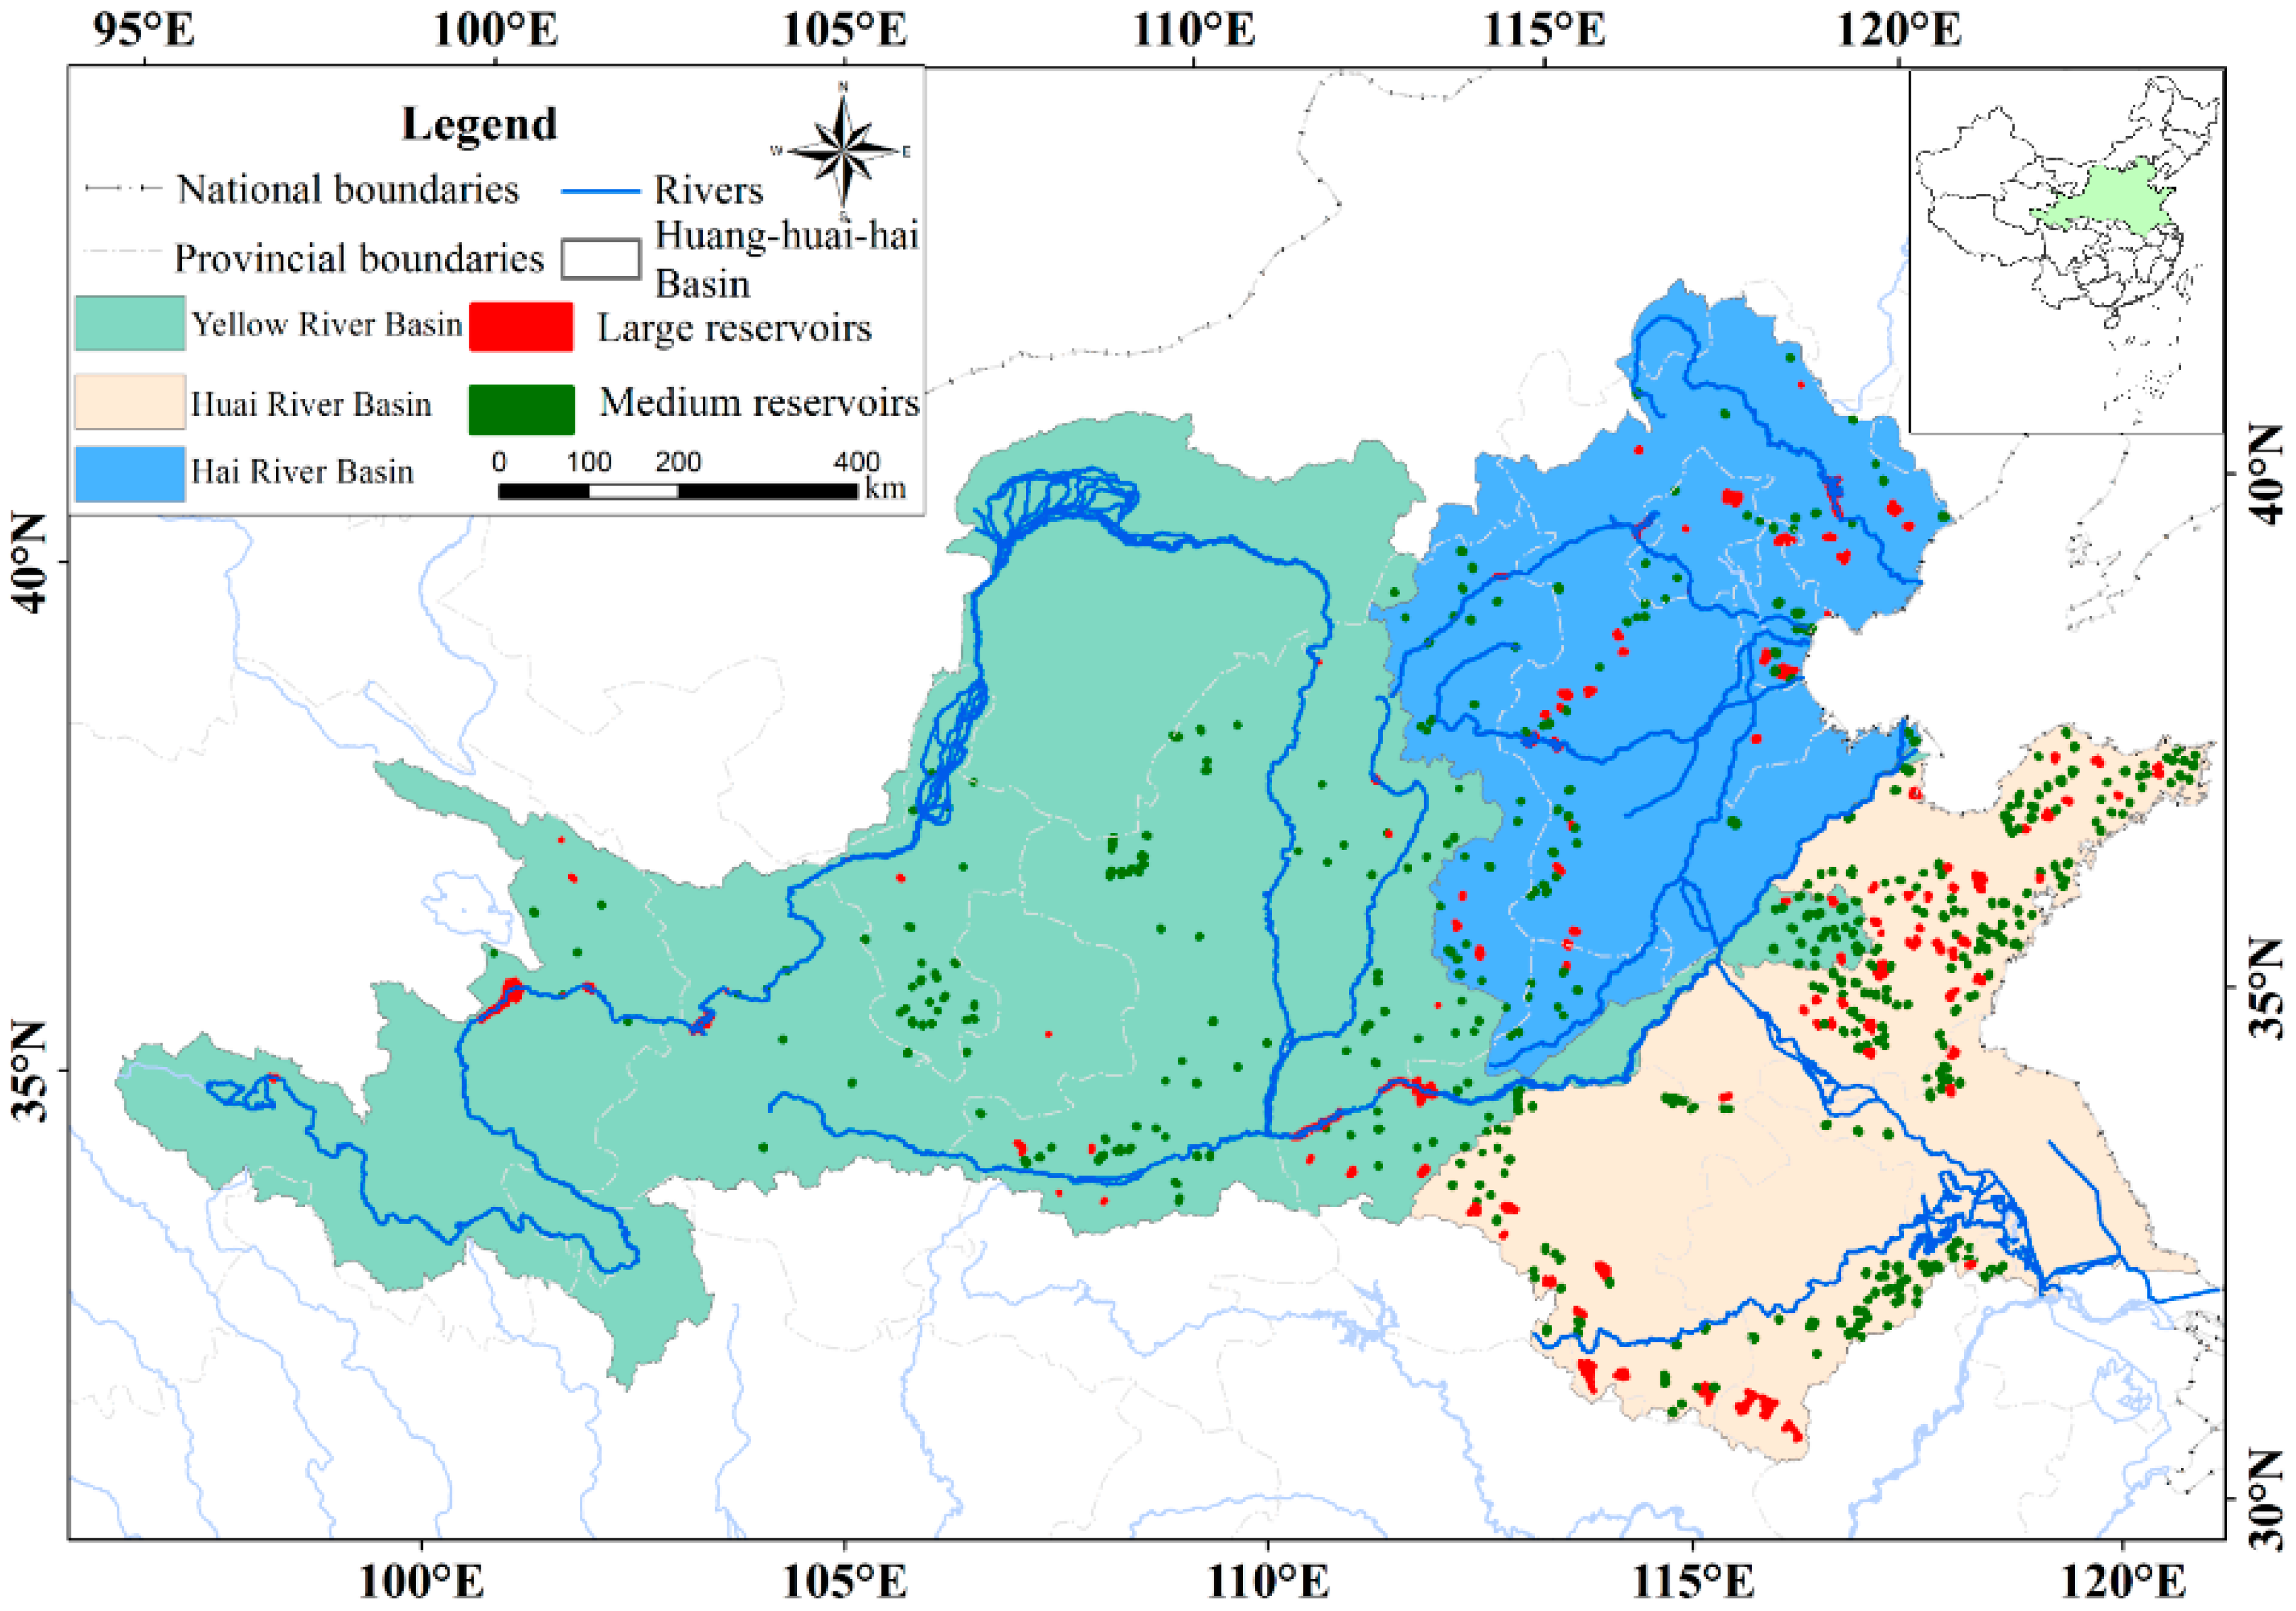
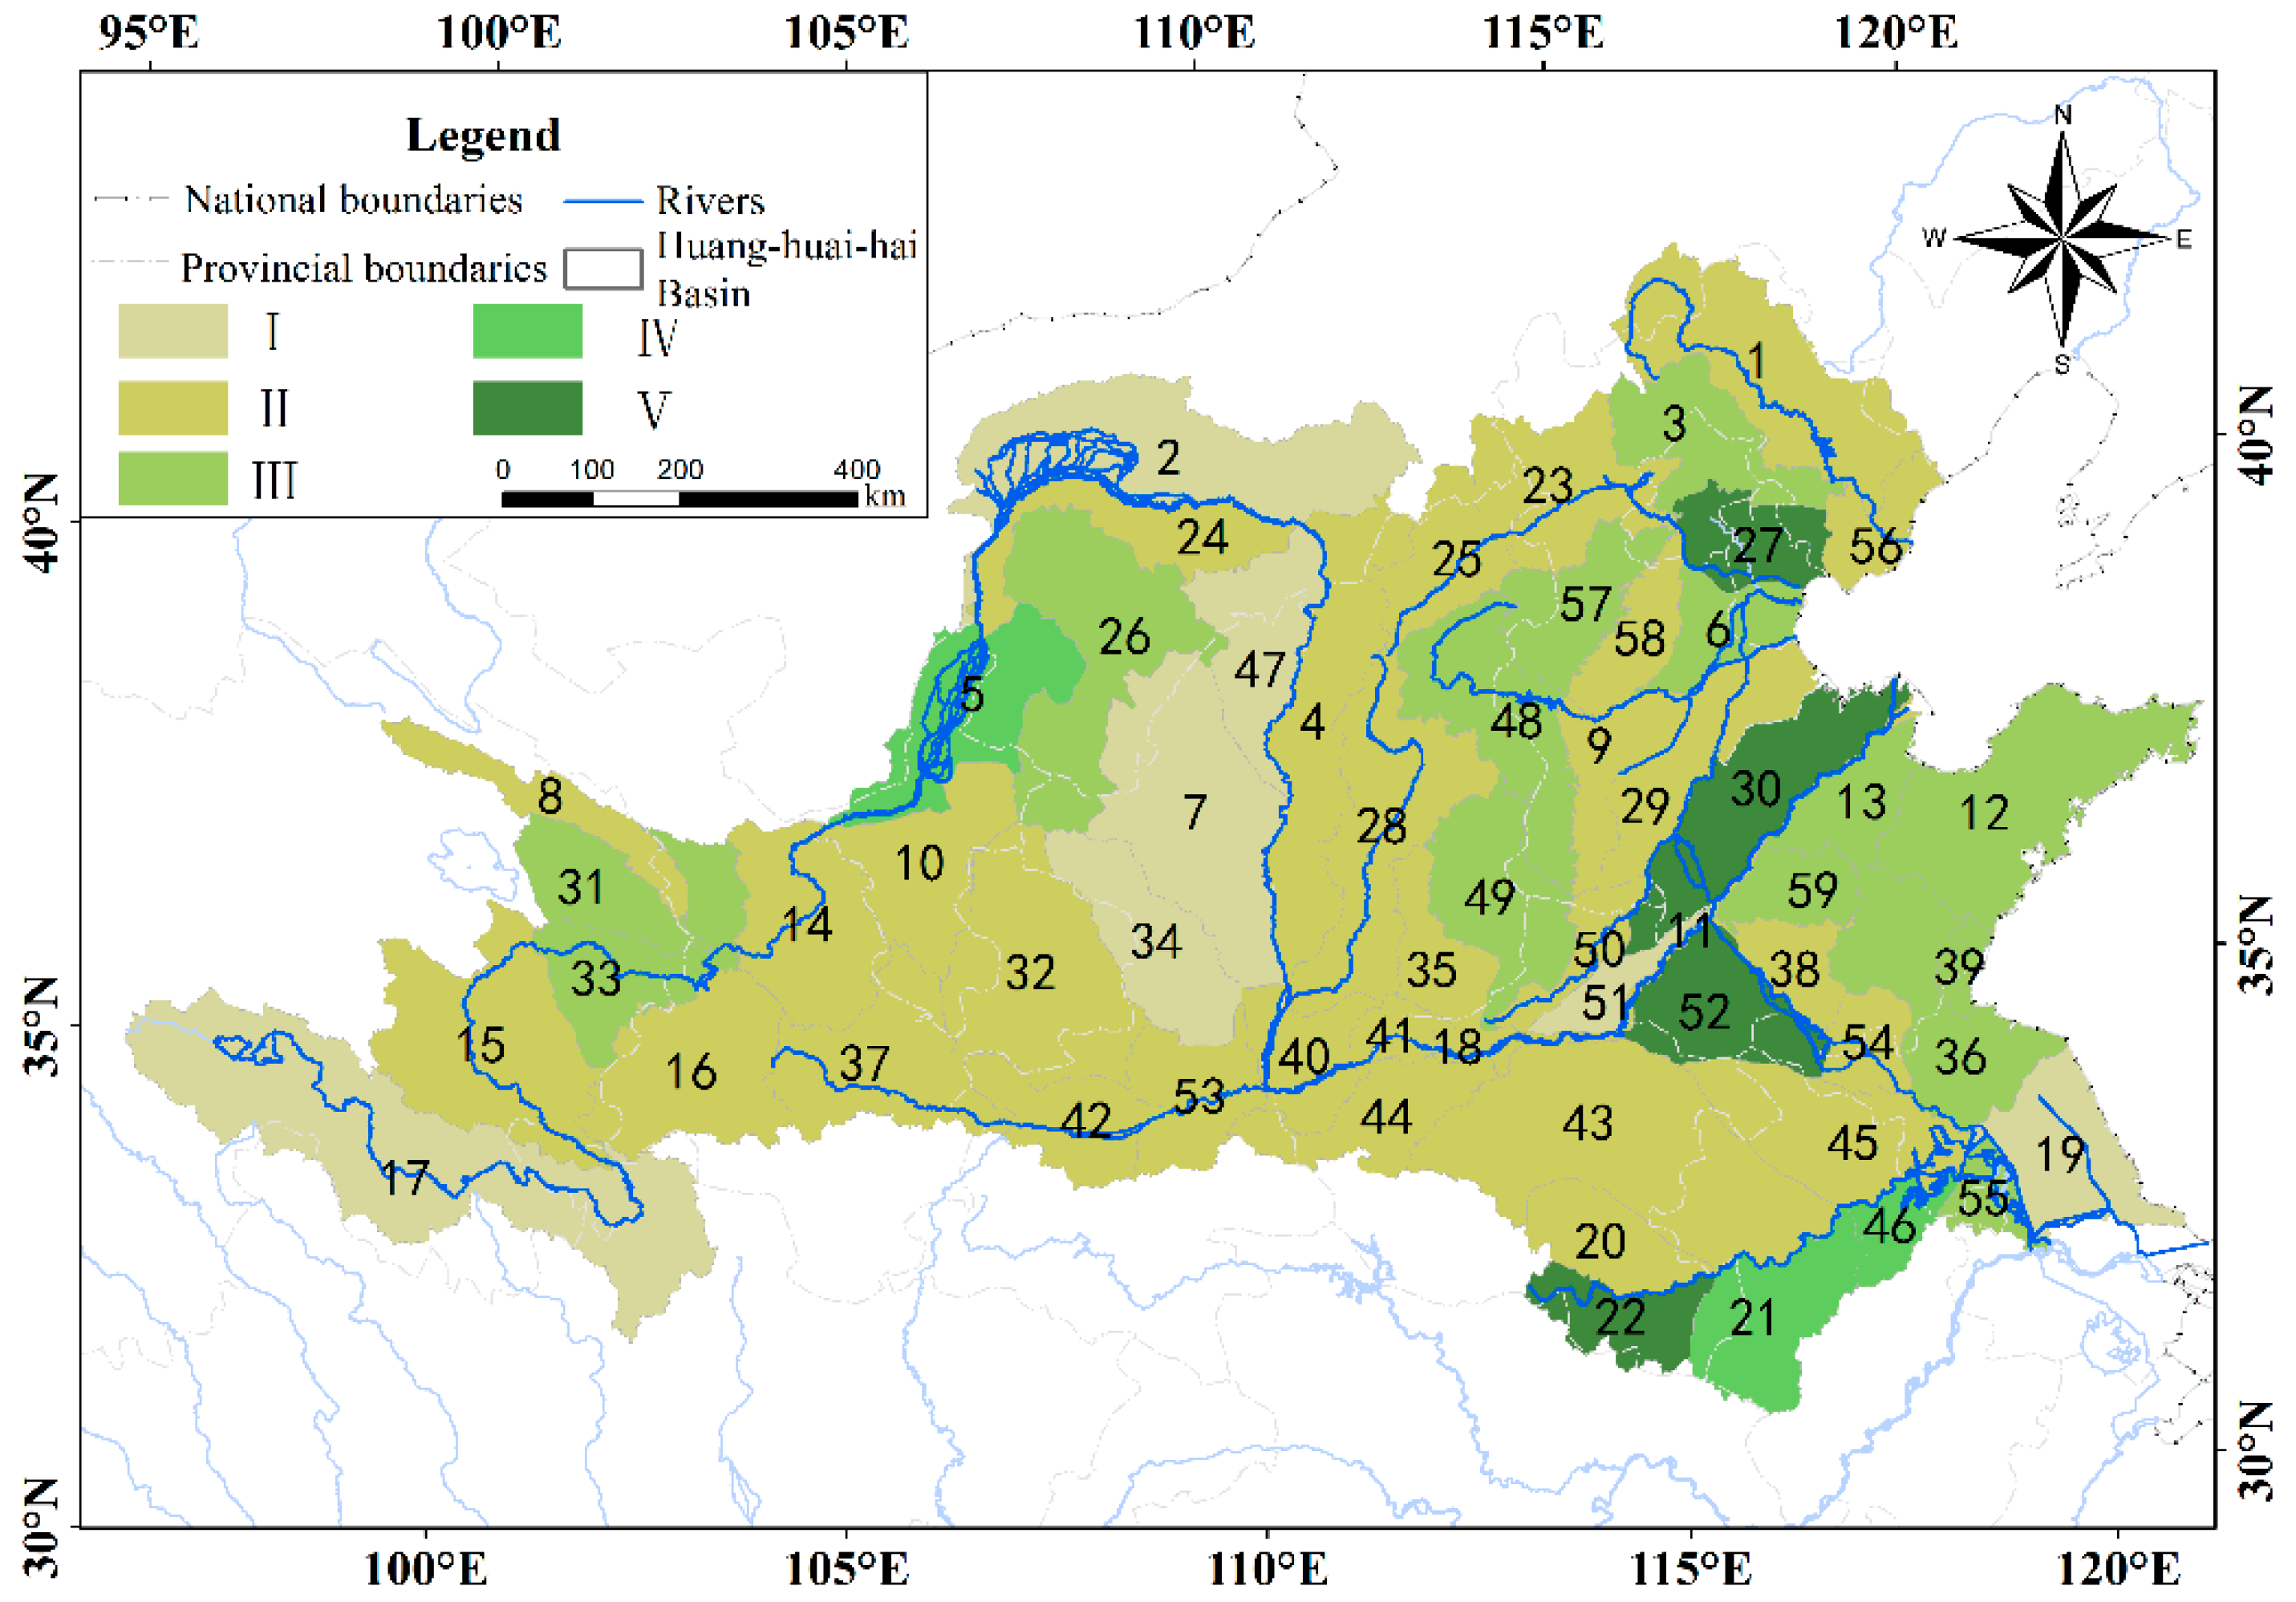
The Huang-Huai-Hai River Basin is located within the geographic coordinates of 95°–123° E and 30°–43° N, covering an area of 14.45 × 10⁵ km2. The basin ranges from south of the Inner Mongolia Plateau and Inland River Basin to north of Dabie Mountain, Jianghuai Hill district, Nantong-Yangzhou Navigation Canal and the Yangtze River and from east of the Tibetan Plateau and Northwest Catchment Area to west of the Bohai Sea and Huanghai Sea. The Huang-Huai-Hai River Basin contains 16 provinces and cities, namely, all of Beijing, Tianjin, and Shandong, most of Hebei and Henan and part of Jiangsu, Anhui, Hubei, Liaoning, Inner Mongolia, Ningxia, Qinghai, Gansu, Shanxi, Shaanxi and Sichuan.
The Huang-Huai-Hai River Basin consists of three important basins of China: the Yellow River Basin (eight of the two-level water resources districts and 19 of the three-level water resources districts), the Huai River Basin (five of the two-level water resources districts and 15 of the three-level water resources districts) and the Hai River Basin (four of the two-level water resources districts, 15 of the three-level water resources districts). The hierarchy of water resources districts is governed by the Ministry of Water Resources of the People’s Republic of China according to the watershed system and administrative division.
The climate of this region is quite complex and includes arid zones, semi-arid zones, semi-humid zones and humid zones. Annual average precipitation and evaporation are 555.6 mm and 1699.5 mm, respectively [
25]. There are 106 large reservoirs (total storage ≥ 0.1 billion m
3) and 436 medium reservoirs (10 million m
3 ≤ total storage < 0.1 billion m
3) in the Huang-Huai-Hai River Basin. The geographical location of Huang-Huai-Hai River Basin and the distribution of reservoirs are depicted in
Figure 1.
The Huang-Huai-Hai River basin is one of China’s most important political, economic and cultural centers [
26]. The basin has 34% of the Chinese population, and produces 38% of China’s GDP but contains only 7% of national water resources. The basin also provides 23.6% of China’s grain production and 34% of the whole nation’s farmland [
27].
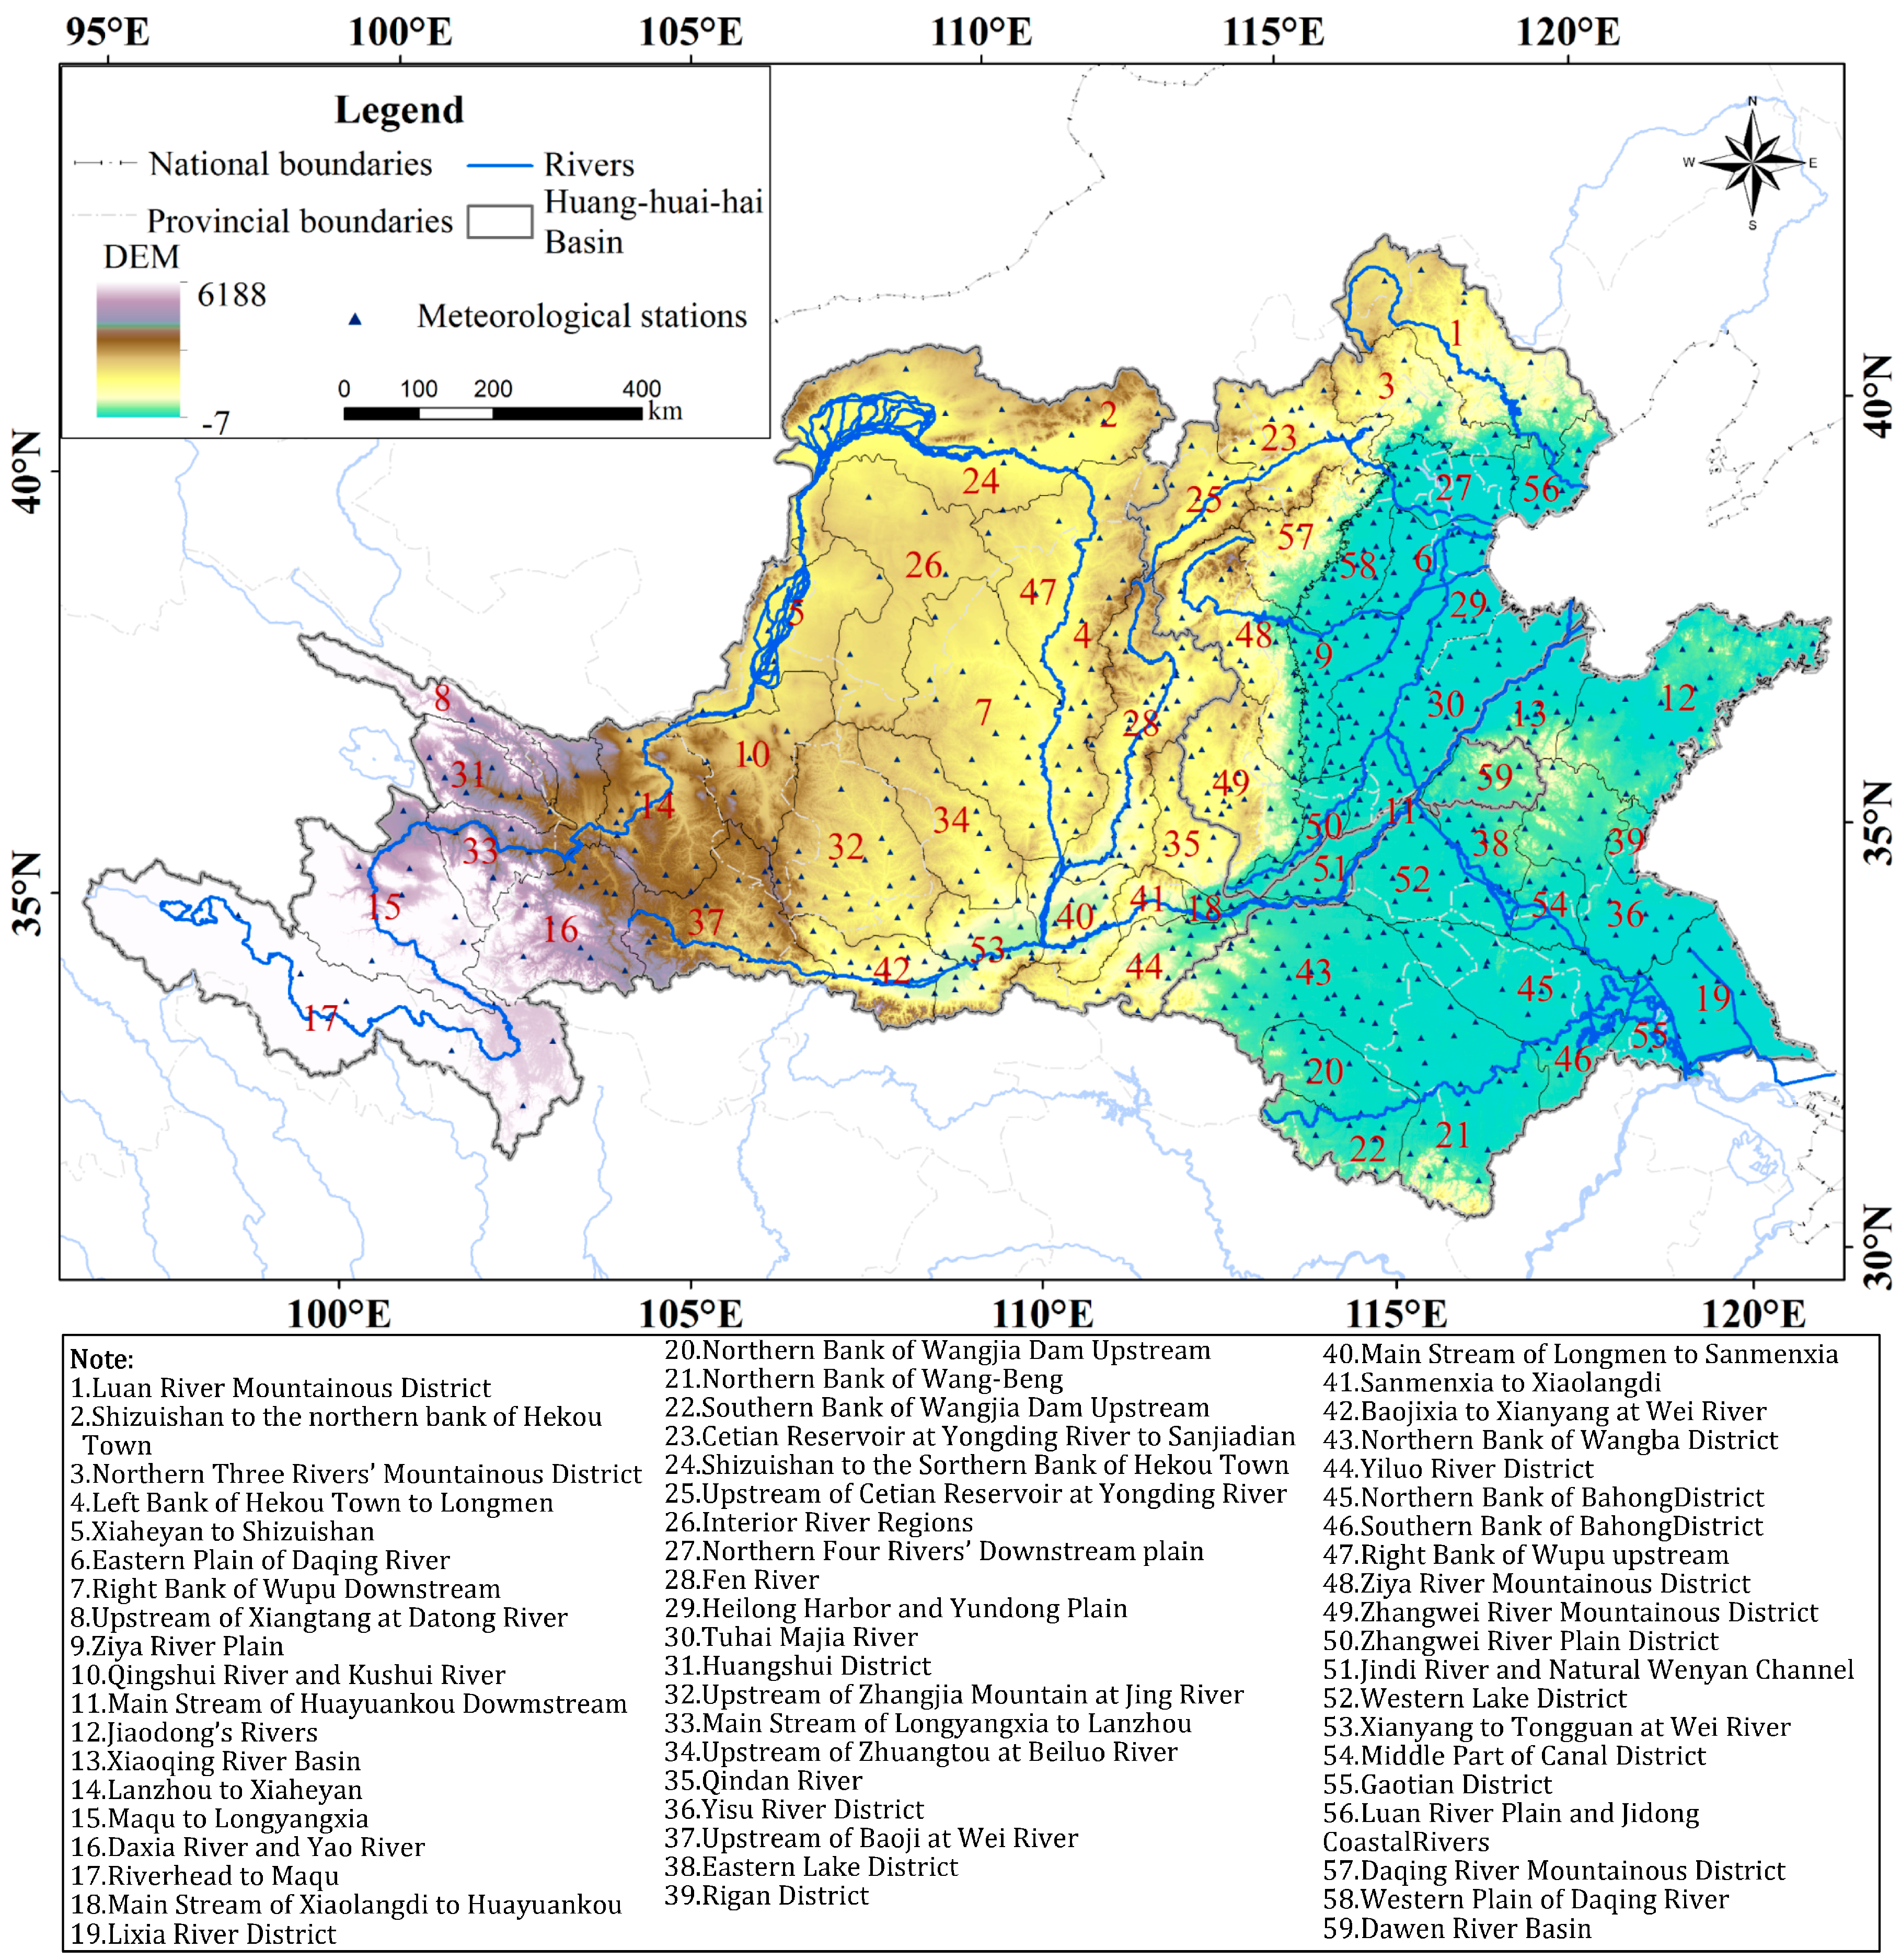
2.2. Data Sources
This paper uses the precipitation data of growing seasons (from March to October) during the 1961–2011 period from 1109 meteorological stations located in the Huang-Huai-Hai River Basin (
Figure 2), which was recorded by the National Meteorological Centre of China. The 1961–2011 data are more complete compared to those of other periods. Statistical droughts were observed by each region’s administration, which used yield reduction and water shortage rate as criteria. The data of statistical droughts were taken from the statistical yearbook (2000–2011) of each province or city. However, data are scarce in some areas of Qinghai and Gansu Provinces.
2.3. Assessment of Drought Category
2.3.1. Ratio of Drought-Affected Area (RDAA) and Drought-Suffering Area (RDSA)
The ratios of meteorological drought affected area and the meteorological drought suffering area are determined based on the China-Z index (in
Section 2.3.2).
where meteorological drought affected area and drought suffering area are the area of moderate-severe droughts and the area of severe droughts.
In this paper, the ratios of statistical drought-affected area and statistical drought-suffering area are determined based on the statistical data from the 2000–2011 period. The ratio of each three-level water resources district is then calculated as follows:
where statistical drought affected area and drought suffering area are the planting area with more than 10% and 30% reduction in yield caused by drought hazards, respectively, compared with the annual average yield.
2.3.2. China-Z Growing Season Index
The China-Z index (Z-index) was put forward by Ju et al. [
28] and then was introduced to the National Meteorological Centre of China (NMCC) in the early 1990s. Fewer operation steps and a more objective presentation than the previous drought index have made it widely used in China [
29]. As droughts’ greatest impacts on agriculture are mainly during the growing season, this paper calculates the Z-index of the growing season.
The calculation of the Z-index was based on the assumption that the precipitation data obey the Pearson III distribution, is then normalized via the following normalization formula [
30]:
where
i is the current growing season,
is the skewness coefficient, and
is the standardized variate,
and
can be both calculated from the precipitation data series of growing seasons as follows [
28]:
where
is the cumulative precipitation from March to October in
growing season, one value per year,
σ is the standard deviation,
n is the length of the data series and
is the average precipitation of the growing season.
Then we divide the Z-index values of the normal precipitation distribution into seven levels to evaluate the categories of waterlog or drought [
29] (
Table 1).
The IDW (inversed distance weighted) interpolation method was applied to create continuous grid data for the Z-indexes in ArcGis. The Z-index in each three-level water resources district can then be calculated by the “Zonal” ArcGis tool. The ratios of drought affected area, drought suffering area and the drought area of different categories in each three-level water resources district can be calculated in the same way.
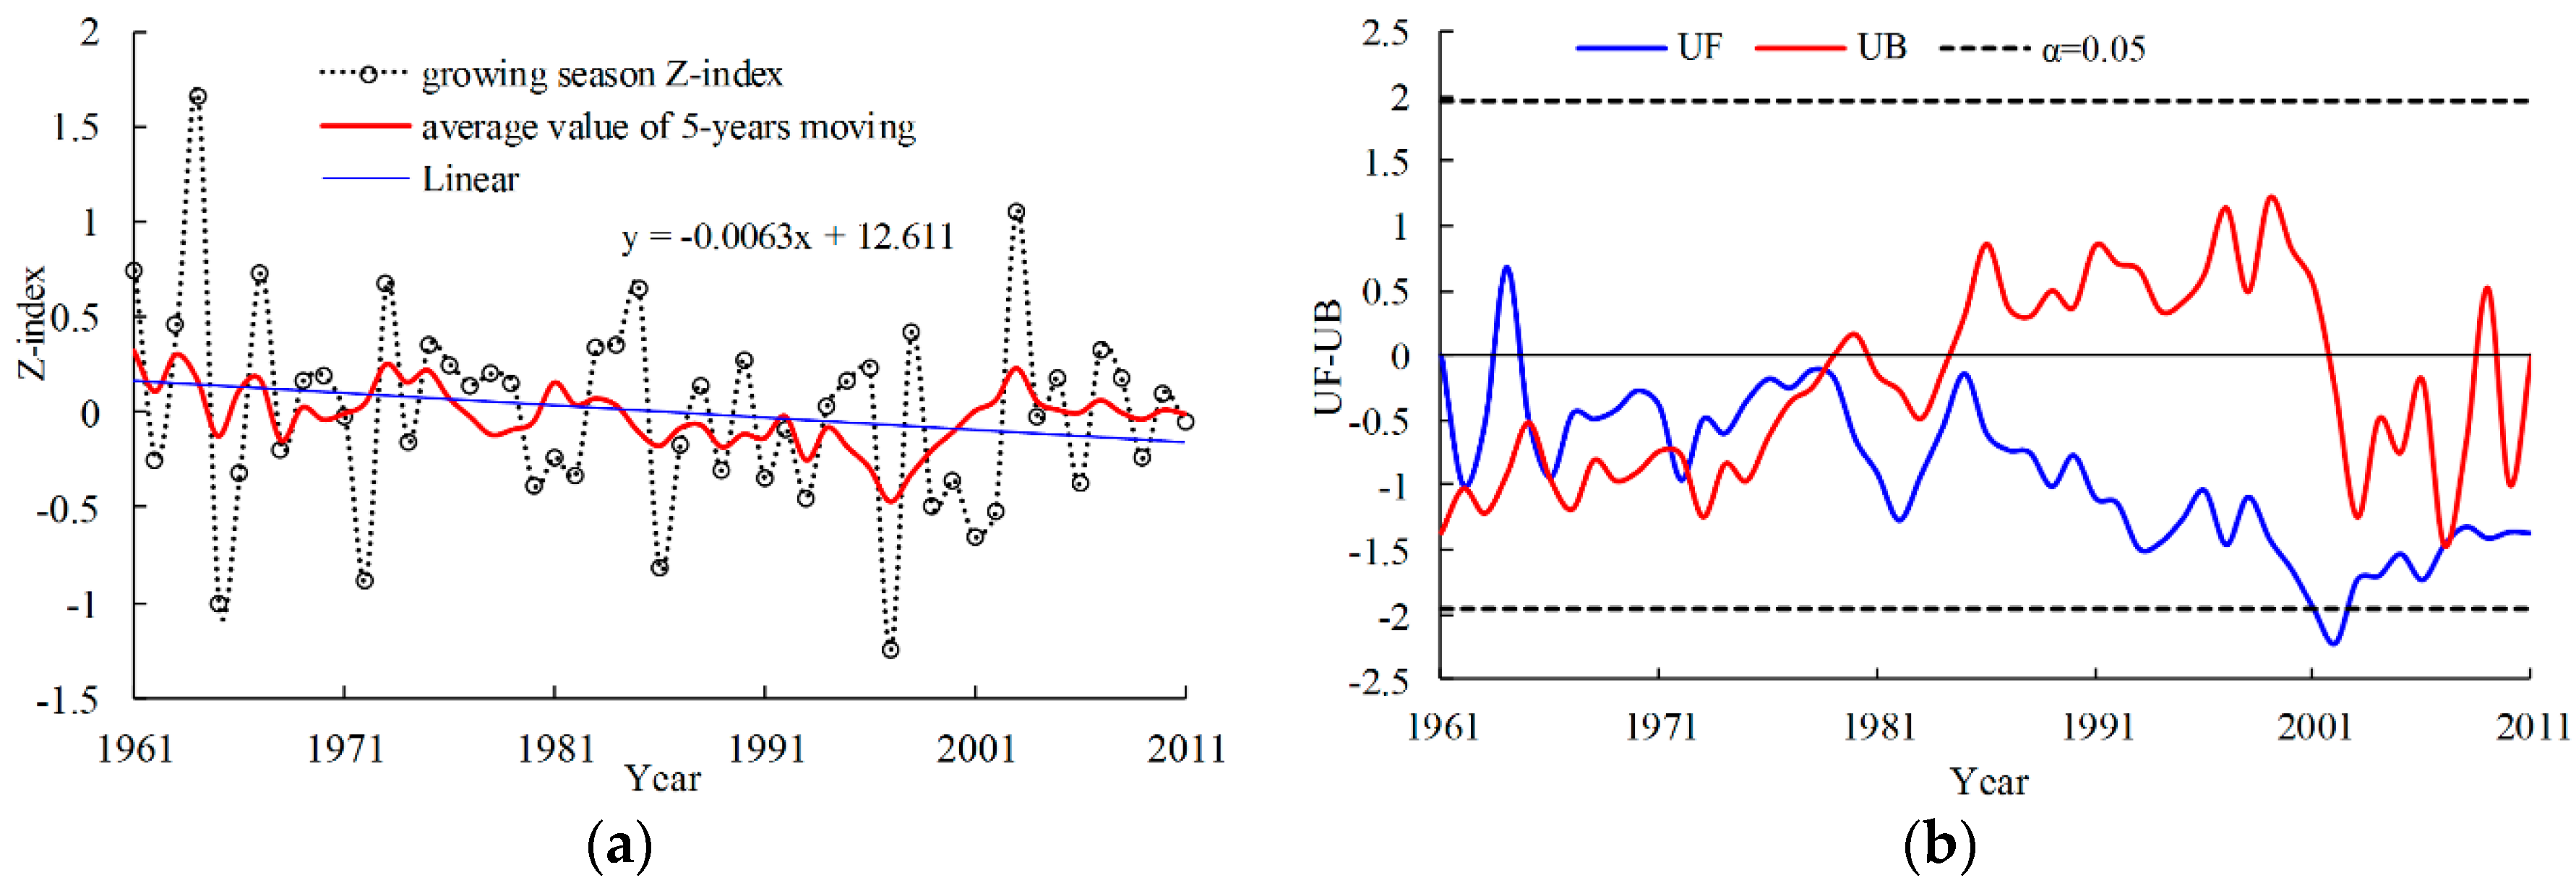
2.3.3. Nonparametric Test Method of Meteorological Drought
The nonparametric test of Mann–Kendall (MK) was adopted in this paper to evaluate the significance level of the trend.
The nonparametric test method of Mann–Kendall which was proposed by Mann and Kendall in 1945 [
31], is widely used to test the trend of meteorological and hydrological data. The test statistic, Kendall’s
S, is calculated as follows:
where
and
are the data values at times
i and
j,
n is the length of the dataset and
Under the null hypothesis that
xi is independent and randomly ordered,
S is approximately normally distributed when
n > 8, with zero mean and a variance of
The standardized test statistic
Z is computed by the following formula:
The statistic Z follows the standard normal distribution with a mean of zero and a variance of one under the null hypothesis of no trend in the series. MK values of 1.65 and 1.96 represent the significance levels of 0.1 and 0.05, respectively.
The MK test provides another test statistic to evaluate the significance level of trend, which is calculated as follows:
in which
k = 2, 3, 4,
.
is the standardized normal distribution, at a chosen level of significance a = 0.05. If > Ua, the trend of the series is significant. When x is ranked in reverse order according to time, can be determined and used in the same way.
2.4. Assessment System of the Drought Coping Ability of Water Conservancy Projects
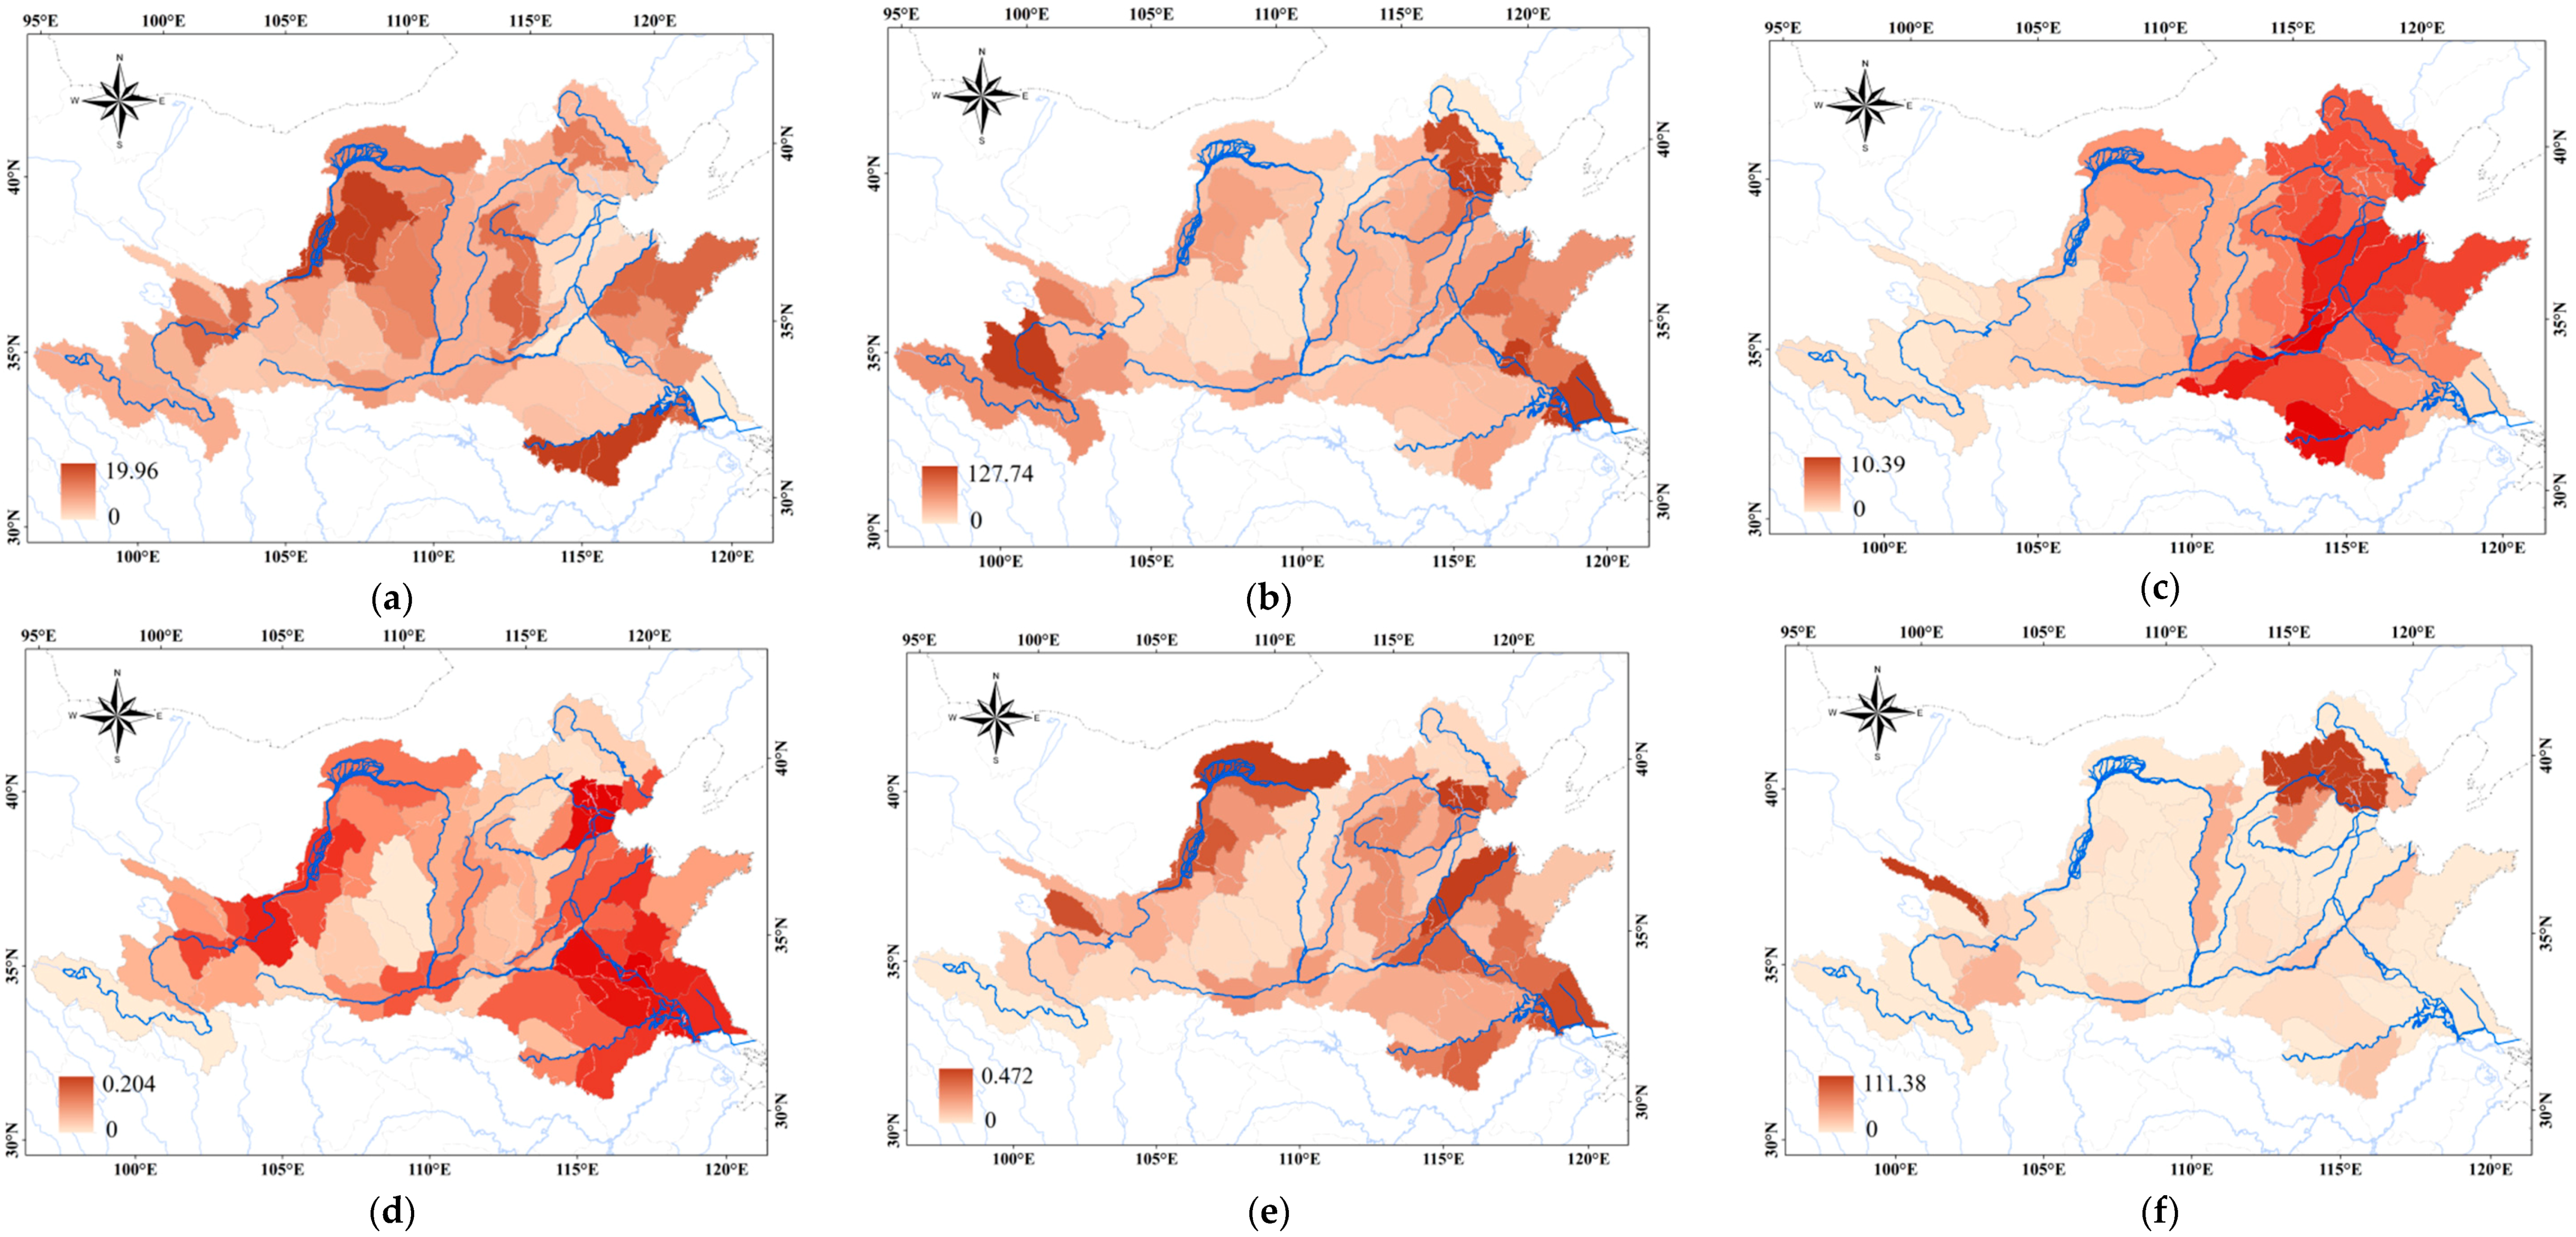
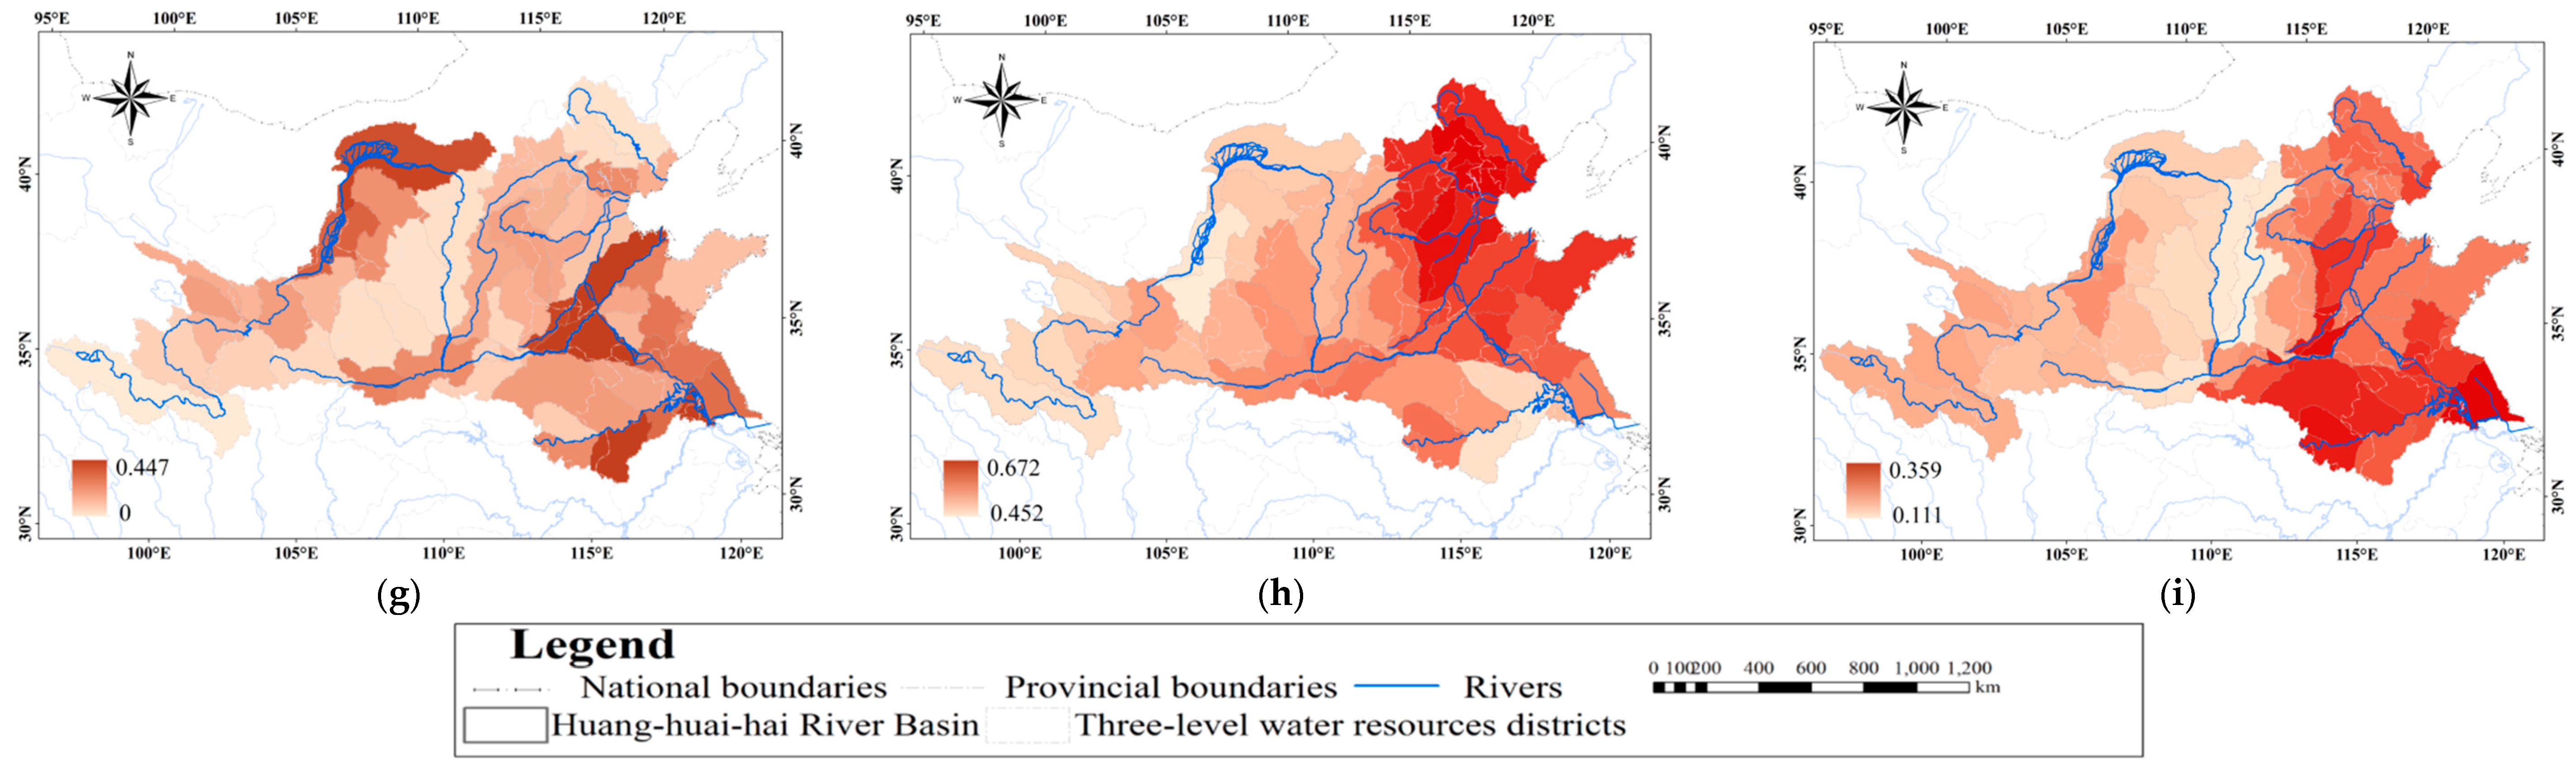
2.4.1. Selection of Assessment System
The assessment indexes of drought coping ability of water conservancy projects (DCAwcp) were selected based on principles that were independent, representative, measurable, comparable and operable [
32], relating to current study results and the specific situation of the study area. The assessment system reflects the overall level of DCAwcp. The assessment system used in this paper mainly included three criterion layers: scale of projects, connectivity of projects and guarantee rate of projects [
22,
33] (
Table 2).
Water conservancy project data presented in
Table 2 were provided by the first National Census for Water in China in 2011 [
34]. The reason why the reservoir storage excluded the large reservoirs is that the large reservoirs not only serviced the district (three-level water resources district) in which they are located, but also the surrounding districts. Furthermore, this paper used the arable–residential–industrial area instead of the area of the whole three-level district because drought mainly influences on these areas and it would thus be more precise in the assessment model.
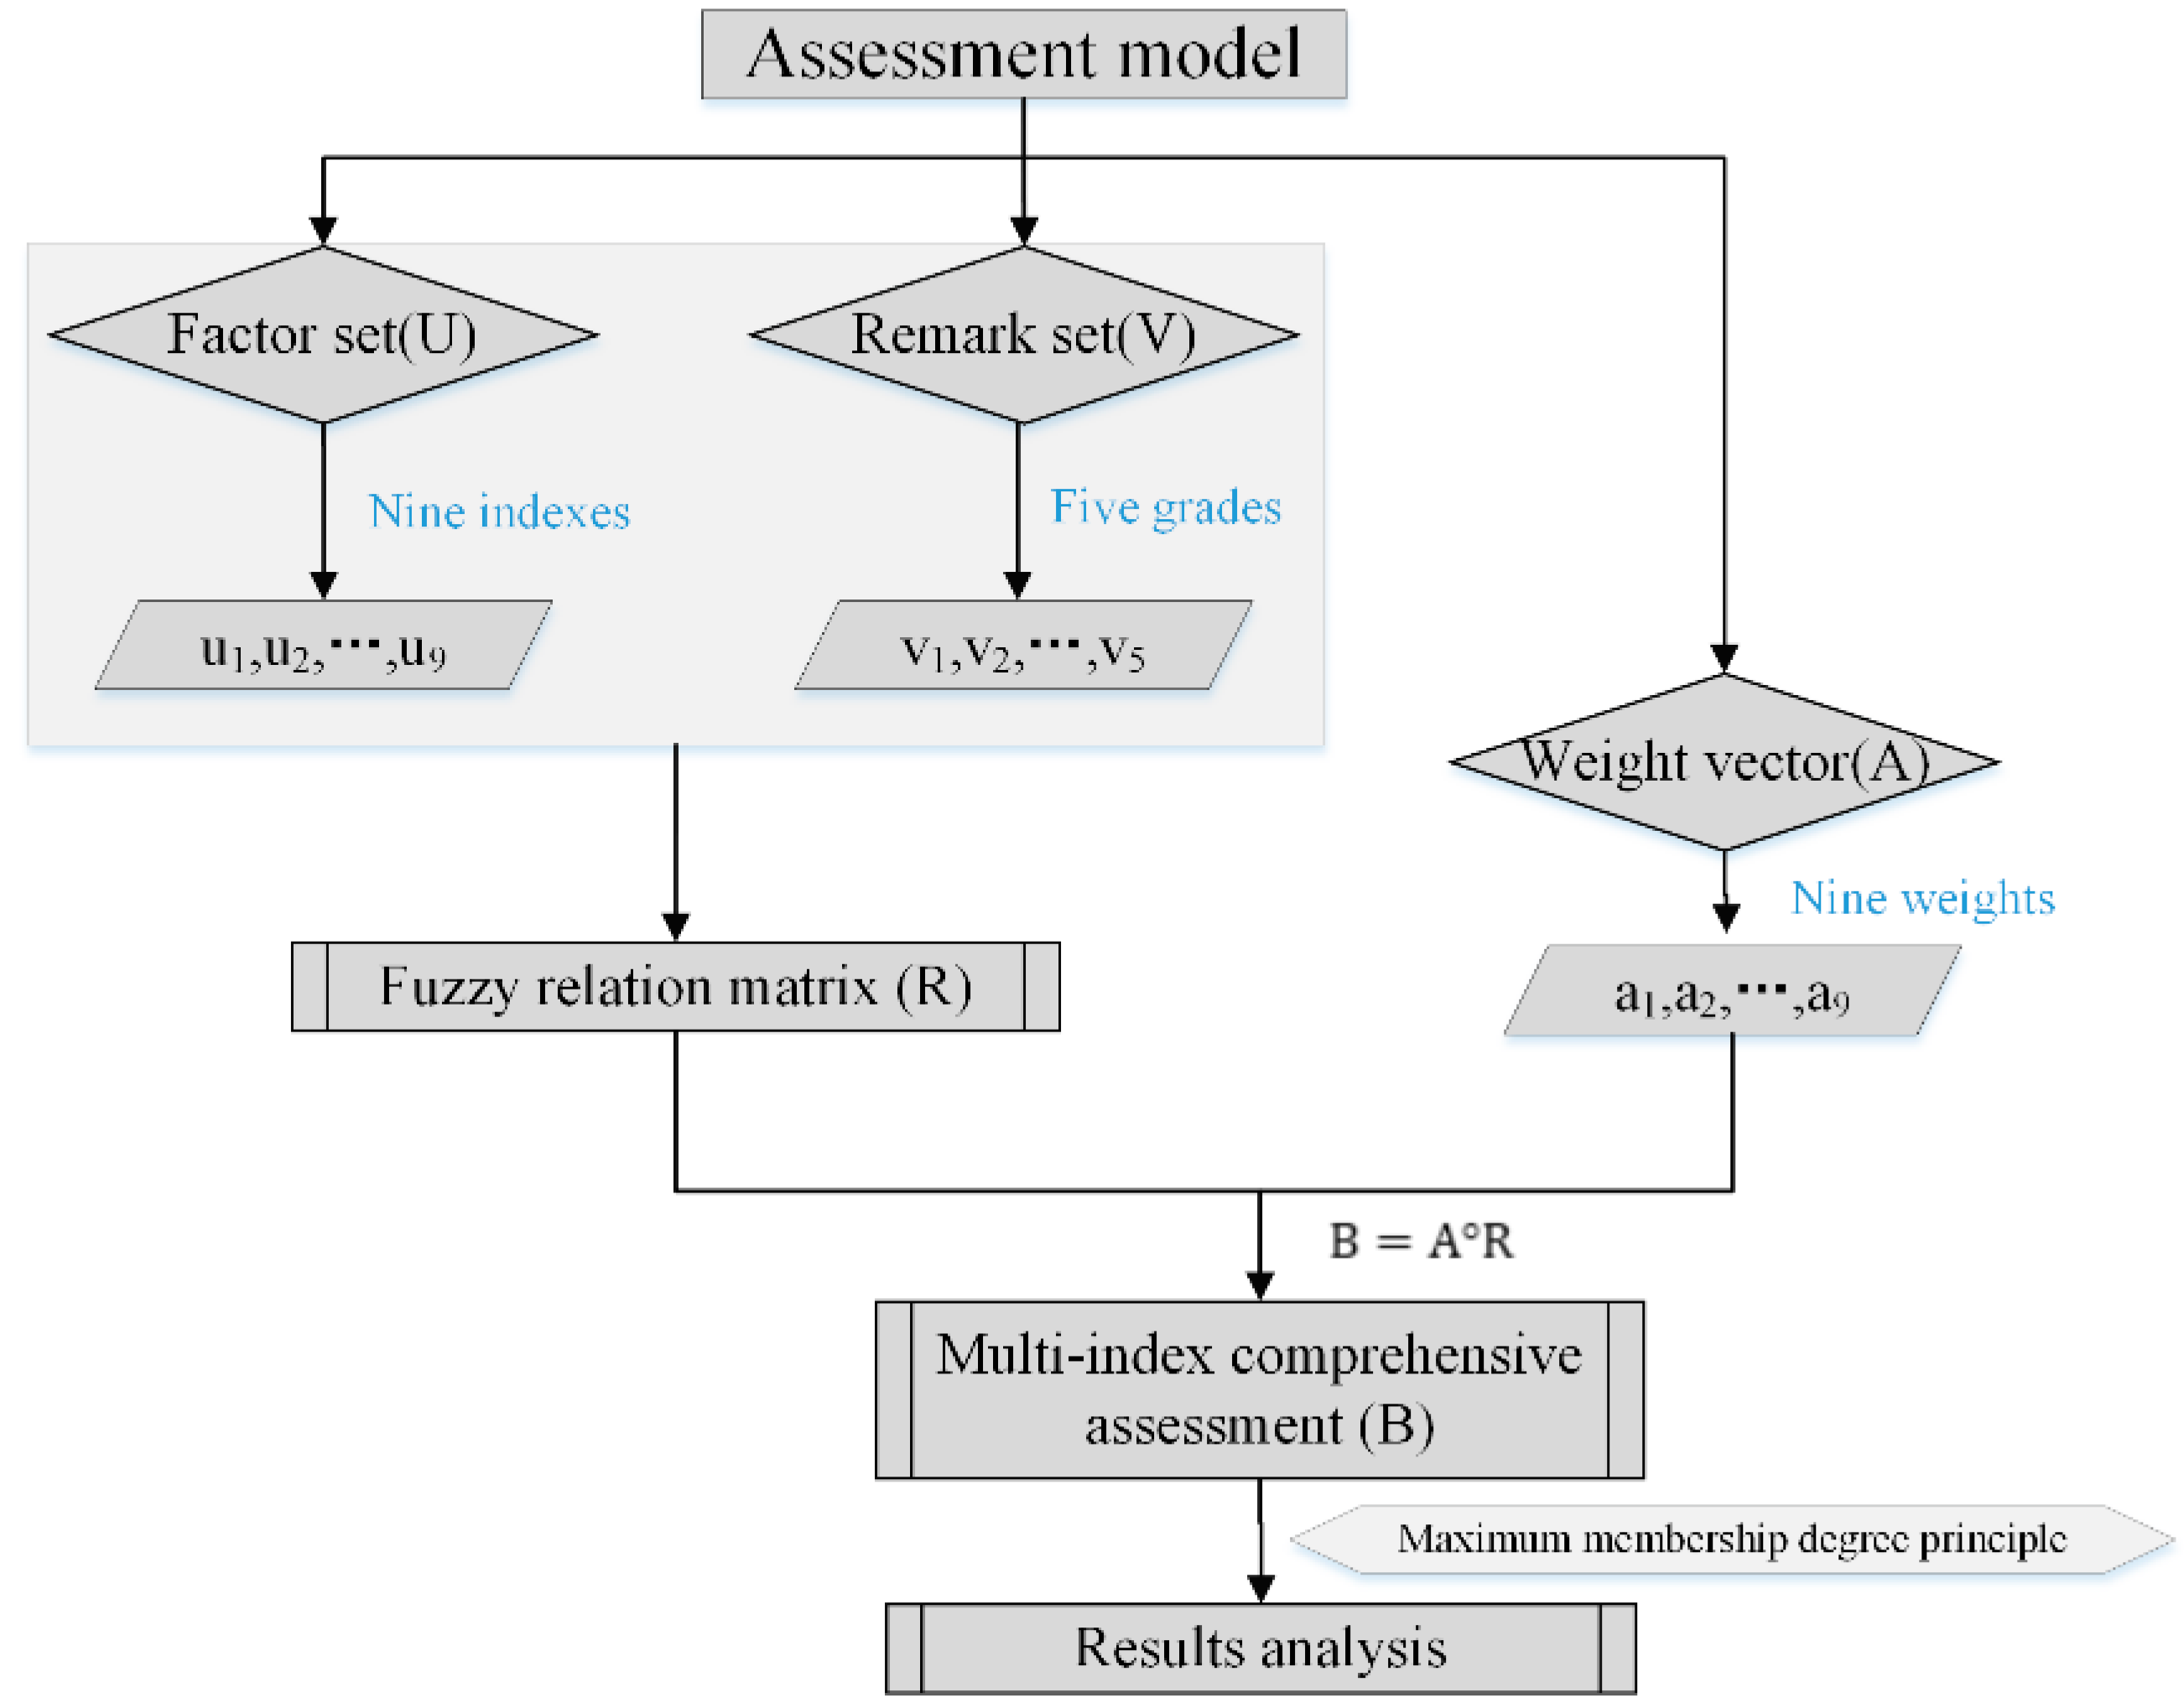
2.4.2. Assessment Model
The fuzzy comprehensive assessment model was used to evaluate the drought coping ability. This model employs the analytic hierarchy process [
35] (AHP) and fuzzing mathematics to evaluate the multi-index quantitatively with the fuzzy relation synthetic theory. It has been widely accepted in various assessments because of its systematic feature and intuitive results [
36].
The main steps are described as follows (
Figure 3):
- (1)
Build the factor set of the assessment objects: , where is the ith element of the assessment object. Because nine factors were chosen in this paper, the value of n is 9.
- (2)
Confirm the remark set of the assessment objects: , where is the jth remark level of the assessment element. Because the drought coping ability of water conservancy projects is divided into five grades in this paper, weakest, poor, moderate, high, and extremely high, the value of m is 5.
- (3)
Determine the weight vector of the assessment elements: , where is the weight of the ith element, and meets the conditions: and . The analytic hierarchy process (AHP) is adopted to determine the weight of each element and is described as follows:
First, the assessment system is divided into three layers: the target layer, the criteria layer and the index layer. Based on a pair-wise comparison, a 1–9 scaling method is adopted to determine which role each element plays in the index and a judgment matrix is obtained after assigning values to each element [
37]. The following consistency ratio is used to test the consistency of the matrix.
where
,
CI is the deviation degree of consistency,
RI is the stochastic degree of consistency,
is the maximum eigenvalue of the judgment matrix,
n is the order of the judgment matrix and
k is the average value of the maximum eigenvalues of a stochastic positive reciprocal matrix A’.
When CR < 0.1, it is generally considered that the inconsistent degree of matrix A is within the acceptable range and its eigenvector can be used as a weight vector.
- (4)
Build the fuzzy relation matrix R: following the above steps, a single factor
is evaluated between the element field U and the remark field V to obtain the fuzzy relationship matrix R.
where
is the relative membership degree of the ith element in element field corresponding to the
jth grades in remark field;
.
For an assessment system where there are five grades and all of the indicators are positive, the detailed method of membership degree function is expressed as:
where,
are the dividing points of five grades,
, and so forth.
- (5)
Conduct a multi-index comprehensive assessment. Obtain the assessment result matrix B by synthetic fuzzy comprehensive operation.
where
is the fuzzy synthetic operator, the weighted average operator
is used for synthesis in the paper, and
.
- (6)
Analyze the results. The remark grade corresponding to the maximum of each component in the assessment result matrix B is taken as the comprehensive assessment result according to the maximum membership degree principle.


