Article

Providing Evidence-Based, Intelligent Support for Flood Resilient Planning and Policy: The PEARL Knowledge Base

1
Laboratory of Hydrology and Water Resources Utilization, School of Civil Engineering, National Technical University of Athens, Iroon Polytechniou 5, GR-15 780 Zografou, Greece
2
Innovative City Lab, Polytech Nice-Sophia, University of Nice—Sophia Antipolis, 930 Route des Colles, 06903 Biot, France
3
Satways Ltd., Chr. Lada Str. 3, 15233 Halandri, Greece
4
UNESCO-IHE, Institute for Water Education, Westvest 7, 2611 AX Delft, The Netherlands
*
Author to whom correspondence should be addressed.
Water 2016, 8(9), 392; https://doi.org/10.3390/w8090392
Submission received: 22 July 2016 / Revised: 29 August 2016 / Accepted: 1 September 2016 / Published: 9 September 2016
(This article belongs to the Special Issue Hydroinformatics and Urban Water Systems)

Abstract

:
While flood risk is evolving as one of the most imminent natural hazards and the shift from a reactive decision environment to a proactive one sets the basis of the latest thinking in flood management, the need to equip decision makers with necessary tools to think about and intelligently select options and strategies for flood management is becoming ever more pressing. Within this context, the Preparing for Extreme and Rare Events in Coastal Regions (PEARL) intelligent knowledge-base (PEARL KB) of resilience strategies is presented here as an environment that allows end-users to navigate from their observed problem to a selection of possible options and interventions worth considering within an intuitive visual web interface assisting advanced interactivity. Incorporation of real case studies within the PEARL KB enables the extraction of (evidence-based) lessons from all over the word, while the KB’s collection of methods and tools directly supports the optimal selection of suitable interventions. The Knowledge-Base also gives access to the PEARL KB Flood Resilience Index (FRI) tool, which is an online tool for resilience assessment at a city level available to authorities and citizens. We argue that the PEARL KB equips authorities with tangible and operational tools that can improve strategic and operational flood risk management by assessing and eventually increasing resilience, while building towards the strengthening of risk governance. The online tools that the PEARL KB gives access to were demonstrated and tested in the city of Rethymno, Greece.

Graphical Abstract

1. Introduction

In the context of climate variability and flood management, vulnerability and resilience are two basic terms widely used within the research and decision making community. It is interesting to note that the same terms are being used in different ways by different disciplines (e.g., ecology and natural science, climate change, etc.). The IPCC, within the Special Report on Managing the Risks of Extreme Events and Disasters to Advance Climate Change Adaptation (SREX) defines resilience as “the ability of a system and its component parts to anticipate, absorb, accommodate, or recover from the effects of a hazardous event in a timely and efficient manner, including through ensuring the preservation, restoration, or improvement of its essential basic structures and functions” and vulnerability as “the propensity or predisposition to be adversely affected” [1]. Adjusting those terms within the content of 7th Framework Programme (FP7) PEARL project (PEARL project: Preparing for Extreme And Rare events in coastaL regions (FP7-ENVIRONMENT—603663): http://www.pearl-fp7.eu/), resilience has been defined as “the ability of risk bearers, assets or components of nature to prepare for, respond to, and recover from the impact of a flood event in a timely and efficient manner”, whereas the term vulnerability refers to “the level of damage that risk bearers, assets and components of nature receive from a flood event, considering both their susceptibility and adaptive capacity” [2].
The Human Development Report 2014 elaborated by the United Nations Development Programme [3] clearly states that reducing vulnerability and building resilience are essential for sustainable human development. Enhancing and protecting individual choices and capabilities and societal competences is essential for future societies and human development strategies and policies must consciously aim to reduce vulnerability and build resilience. A better understanding of vulnerability and resilience from a multidimensional human development perspective allows for a deeper analysis of the key factors and policies that explain why some individuals, communities or countries are more resilient to adverse events and respond better to them.
Within this setting, assessing and measuring resilience is a new and rapidly developing area of research and practice for which several resilience frameworks have been developed [4]. Within those frameworks, various indicators have been elaborated trying to qualitatively measure resilience under different dimensions. Most of the frameworks are focused on a combination of different aspects of the dimensions of resilience [5]. In this paper, emphasis will be given to the Flood Resilience Index (FRI), a framework developed by Batica et al. [6], which assesses resilience related to flood risk management by employing five dimensions in order to evaluate the level of disturbance and the ability to cope with various issues during and after a flood event. The methodology was initially developed within the Collaborative Research on Flood Resilience in Urban Areas (CORFU) project [7] and has been revised and enhanced within the PEARL project [8].
While being less vulnerable often goes hand in hand with being more resilient, resilience is more than just a mirror of vulnerability. It may be possible to reduce vulnerability by lowering the incidence of shocks and threats. At the same time, emergency response efforts are important and necessary, but resilience requires comprehensive efforts to build preparedness and response capacities [3]. Towards that goal, research efforts have been allocated towards the collection of best practices and measures for adaptation and mitigations against hazards and risks, for example:
  • The Natural Water Retention Measures (NWRM) project aimed at collaboratively building knowledge and promoting best practice on Natural Water Retention Measures in Europe [9];
  • The FP7 PREPARED project focused on developing advanced strategies for meeting climate related challenges of European and Worldwide Water and Sanitation Utilities [10]; and
  • Water practitioners and researchers proceeded with the development of applications and tools providing possible adaptation measures such as the Climate App [11] and the Green-Blue Design Tool [12].
Building on these initiatives and taking a step further within the PEARL project, an intelligent Knowledge Base (KB) of resilience measures and strategies against flood risk has been developed, incorporating at the same time lessons learned from case studies all over the world. The KB allows end-users to navigate from their observed problem to a selection (screening) of possible options/interventions worth considering (through modeling or other work). However, assisting end-users in the navigation from the statement of a problem towards the identification of suitable measures for more detailed examination is only part of the functionality developed for the KB. Another part is supporting direct vulnerability and resilience assessment as part of the decision process and to that effect the PEARL KB was enriched using the FRI framework [6].
In the following sections, we will present the main aspects of the PEARL KB and argue that it provides an integrated and comprehensive solution to decision makers and urban planners, serving both as a repository of measures and good practices against flood risk management, but also providing tools to assess vulnerability and resilience of a city. Most importantly, we will suggest that the PEARL KB creates the necessary tangible links between resilience frameworks and good practices through which an end user can be supported in the selection of strategies that will enable the building of resilience against current and future flood related threats.

2. Materials and Methods

2.1. Developing the Knowledge Base

2.1.1. Back End Development

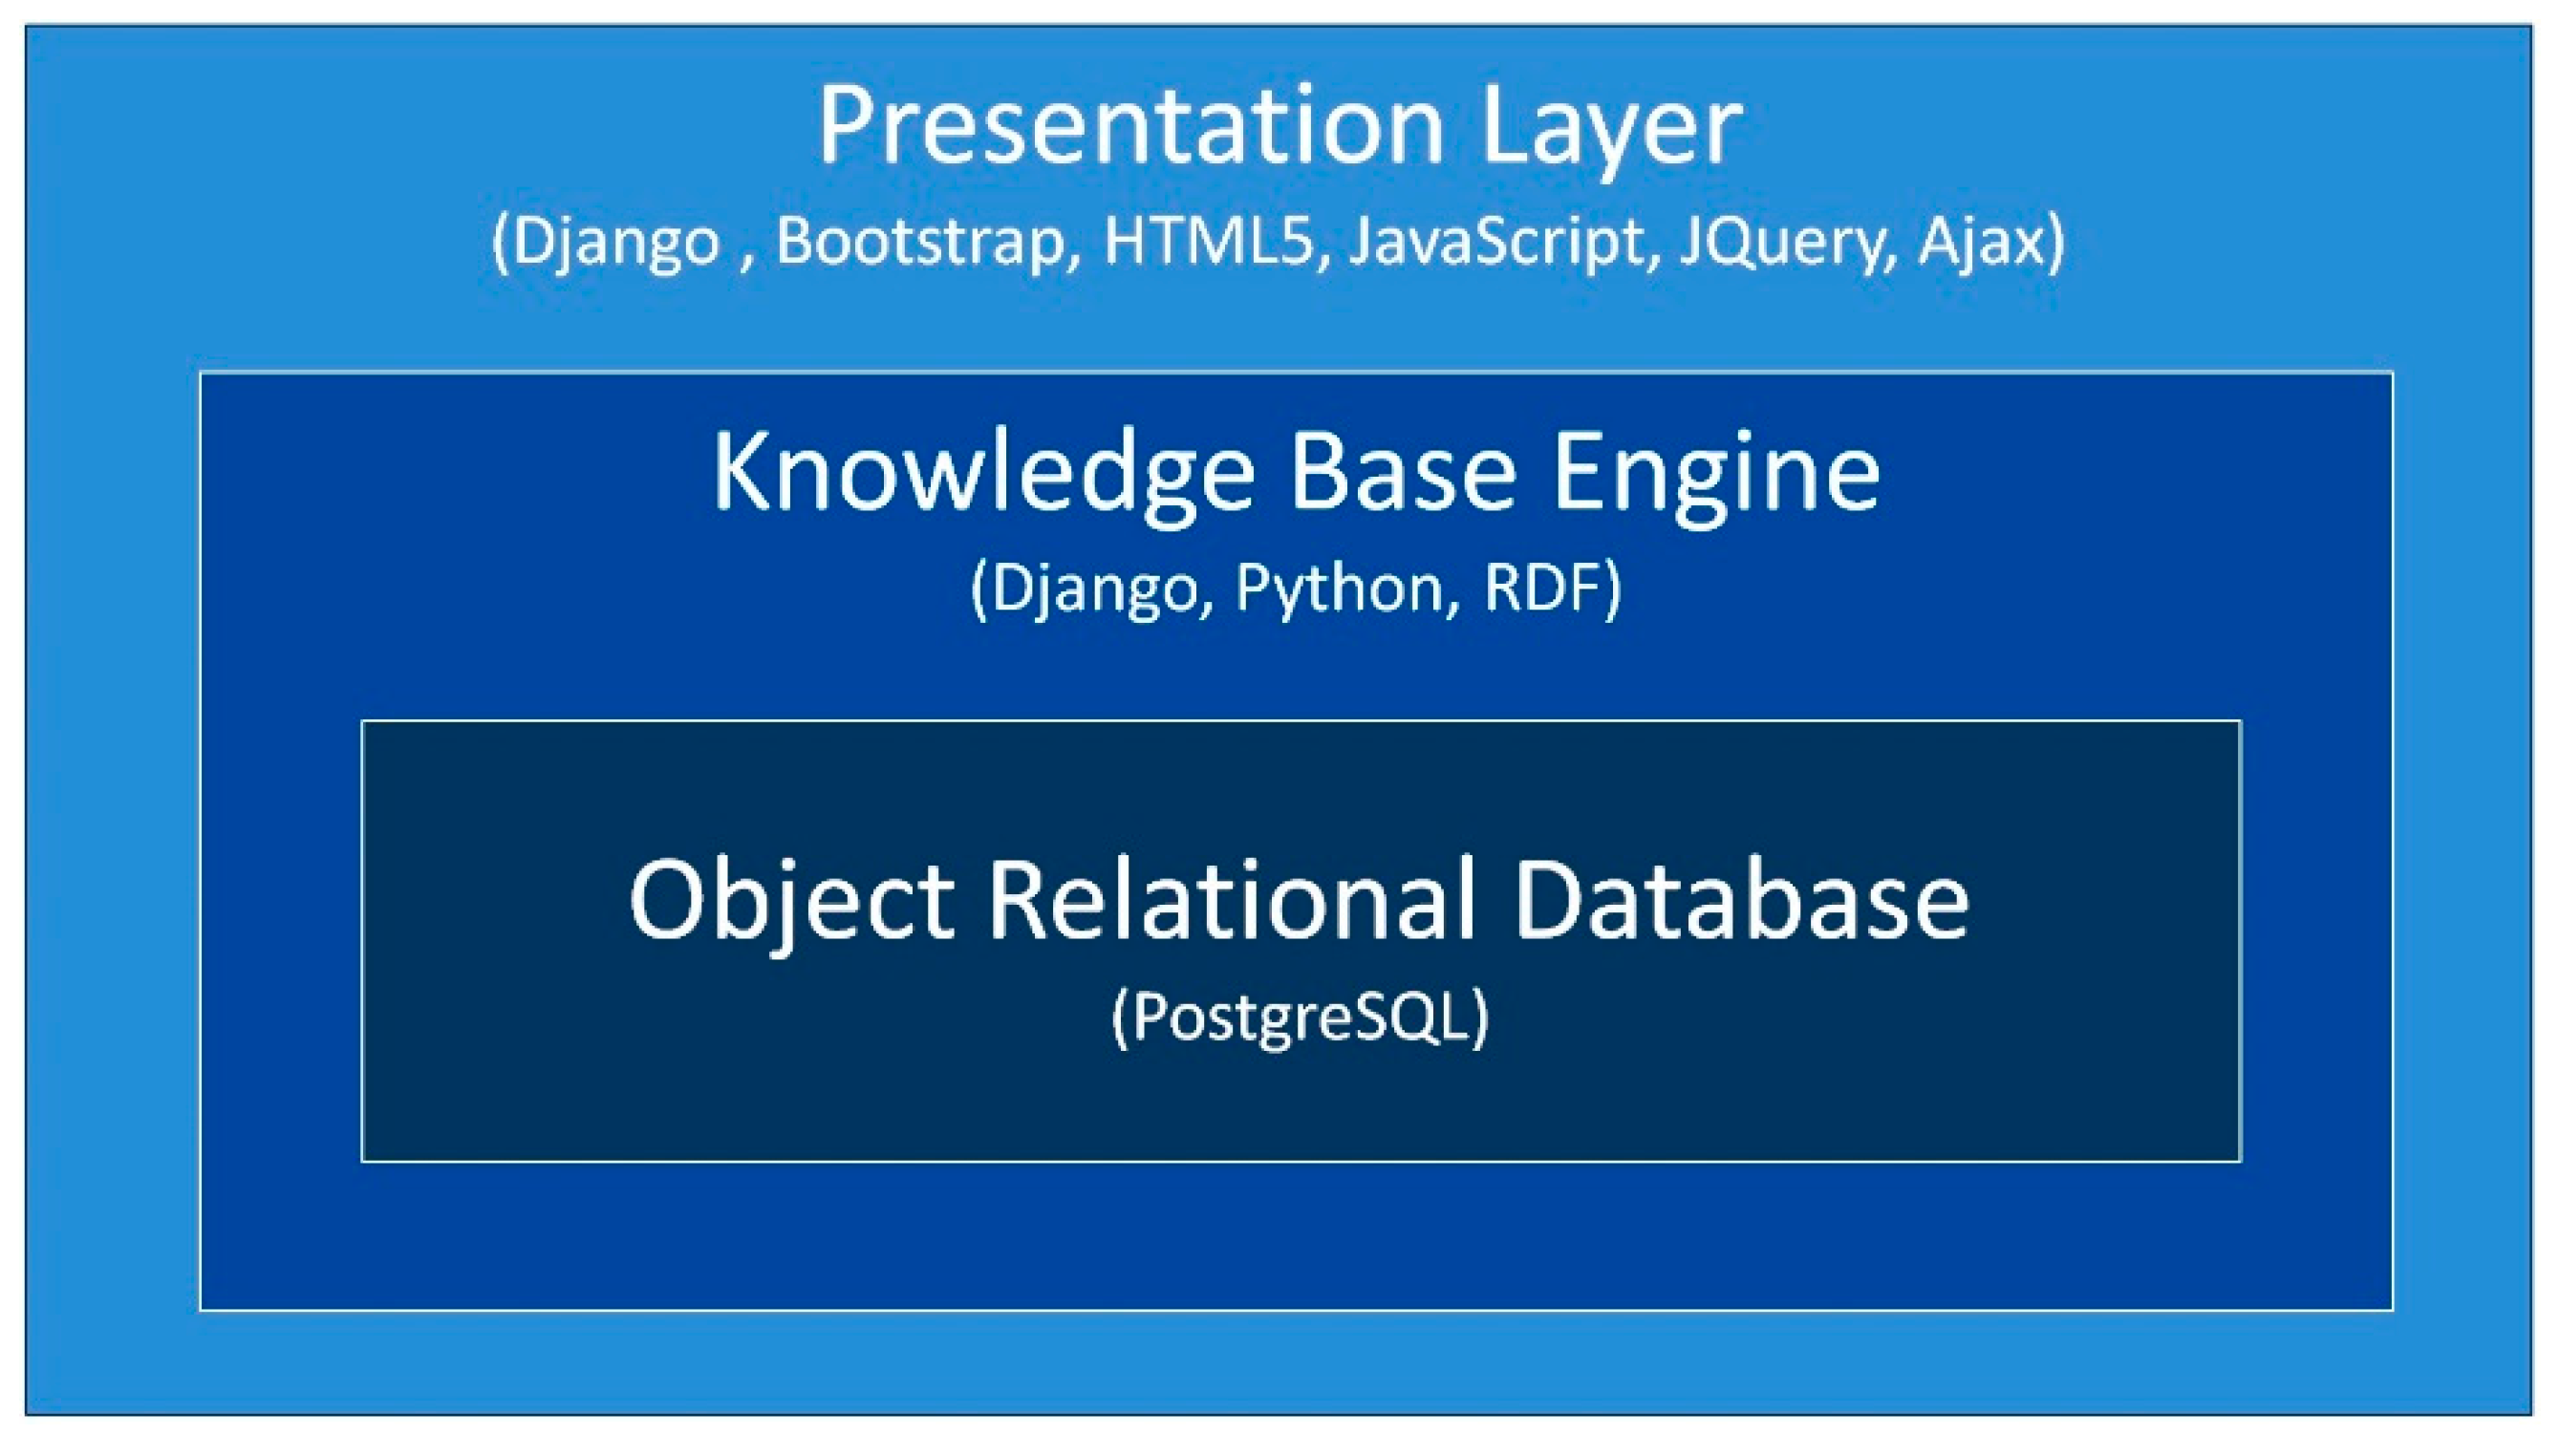
The PEARL KB has been built on top of the well-established Object-Relational Database (ORDB) management system PostgreSQL. It is capable to handle workloads of large applications with many concurrent users, while it comes with a free and open source license (FOSS), as all other software components of the PEARL KB. PostgreSQL is a cross-platform database and at the same time easily expandable and supported by a variety of software tools and frameworks, one of which is Django. Django is used as the web framework of the PEARL KB. It is capable of supporting complex database-driven websites and includes an object-relational mapper (ORM) that mediates between data models, defined as classes of the programing language Python, and PostgreSQL. In essence, Django allows designing databases at the conceptual data model level, hiding the underlying physical data model and making the Database Management System exchangeable. Django expands the possibilities of processing data retrieved from the ORDB in response to HTTP requests and separates the logic from the presentation layer by supporting a flexible and efficient template system that controls the presentation of web applications.
This basic architectural design of the PEARL KB, shown in Figure 1, has been developed using the technologies suggested above. It follows the Model–View–Controller architectural pattern consisting of three interconnected layers: (a) the presentation layer, responsible for the presentation of the information to the user and the interaction with him; (b) the Knowledge Base Engine (KBE), which encapsulates all logic responsible for processing a user’s request and for returning the response; and (c) the database layer responsible for the data management.
Several software modules constitute the KBE accessing the other two layers. Some of them have been adopted from existing third-party libraries or software packages, such as Django Admin, the powerful data management framework of Django and xlrd/xlwt for accessing and creating spreadsheet files which are compatible with Microsoft Excel files.
Other modules have been developed from scratch in a generic way so that they can be applied to any other database structure as well with very few or even without any modifications to the source code. These modules cover the typical functionality of a knowledge base such as the following:
  • Creation of lists of records from an arbitrary class, such as case studies or publication sources/
  • Collection of detailed information for an arbitrary object, including its relations to other objects and, in the case of georeferenced objects, their location on the map.
  • Textual search by applying approximate string matching.
  • Pivot table summarizing information from several tables of the database.
Finally, some modules needed to be developed or adjusted especially for the PEARL project, including the PEARL FRI Tool (see Section 2.2.1) and a specialized filter for sorting-out resilience measures based on user defined criteria.

2.1.2. Front End Development

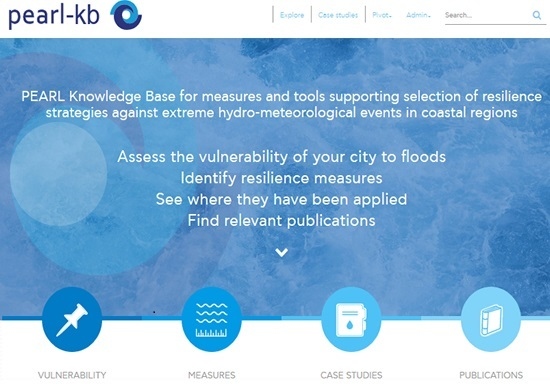
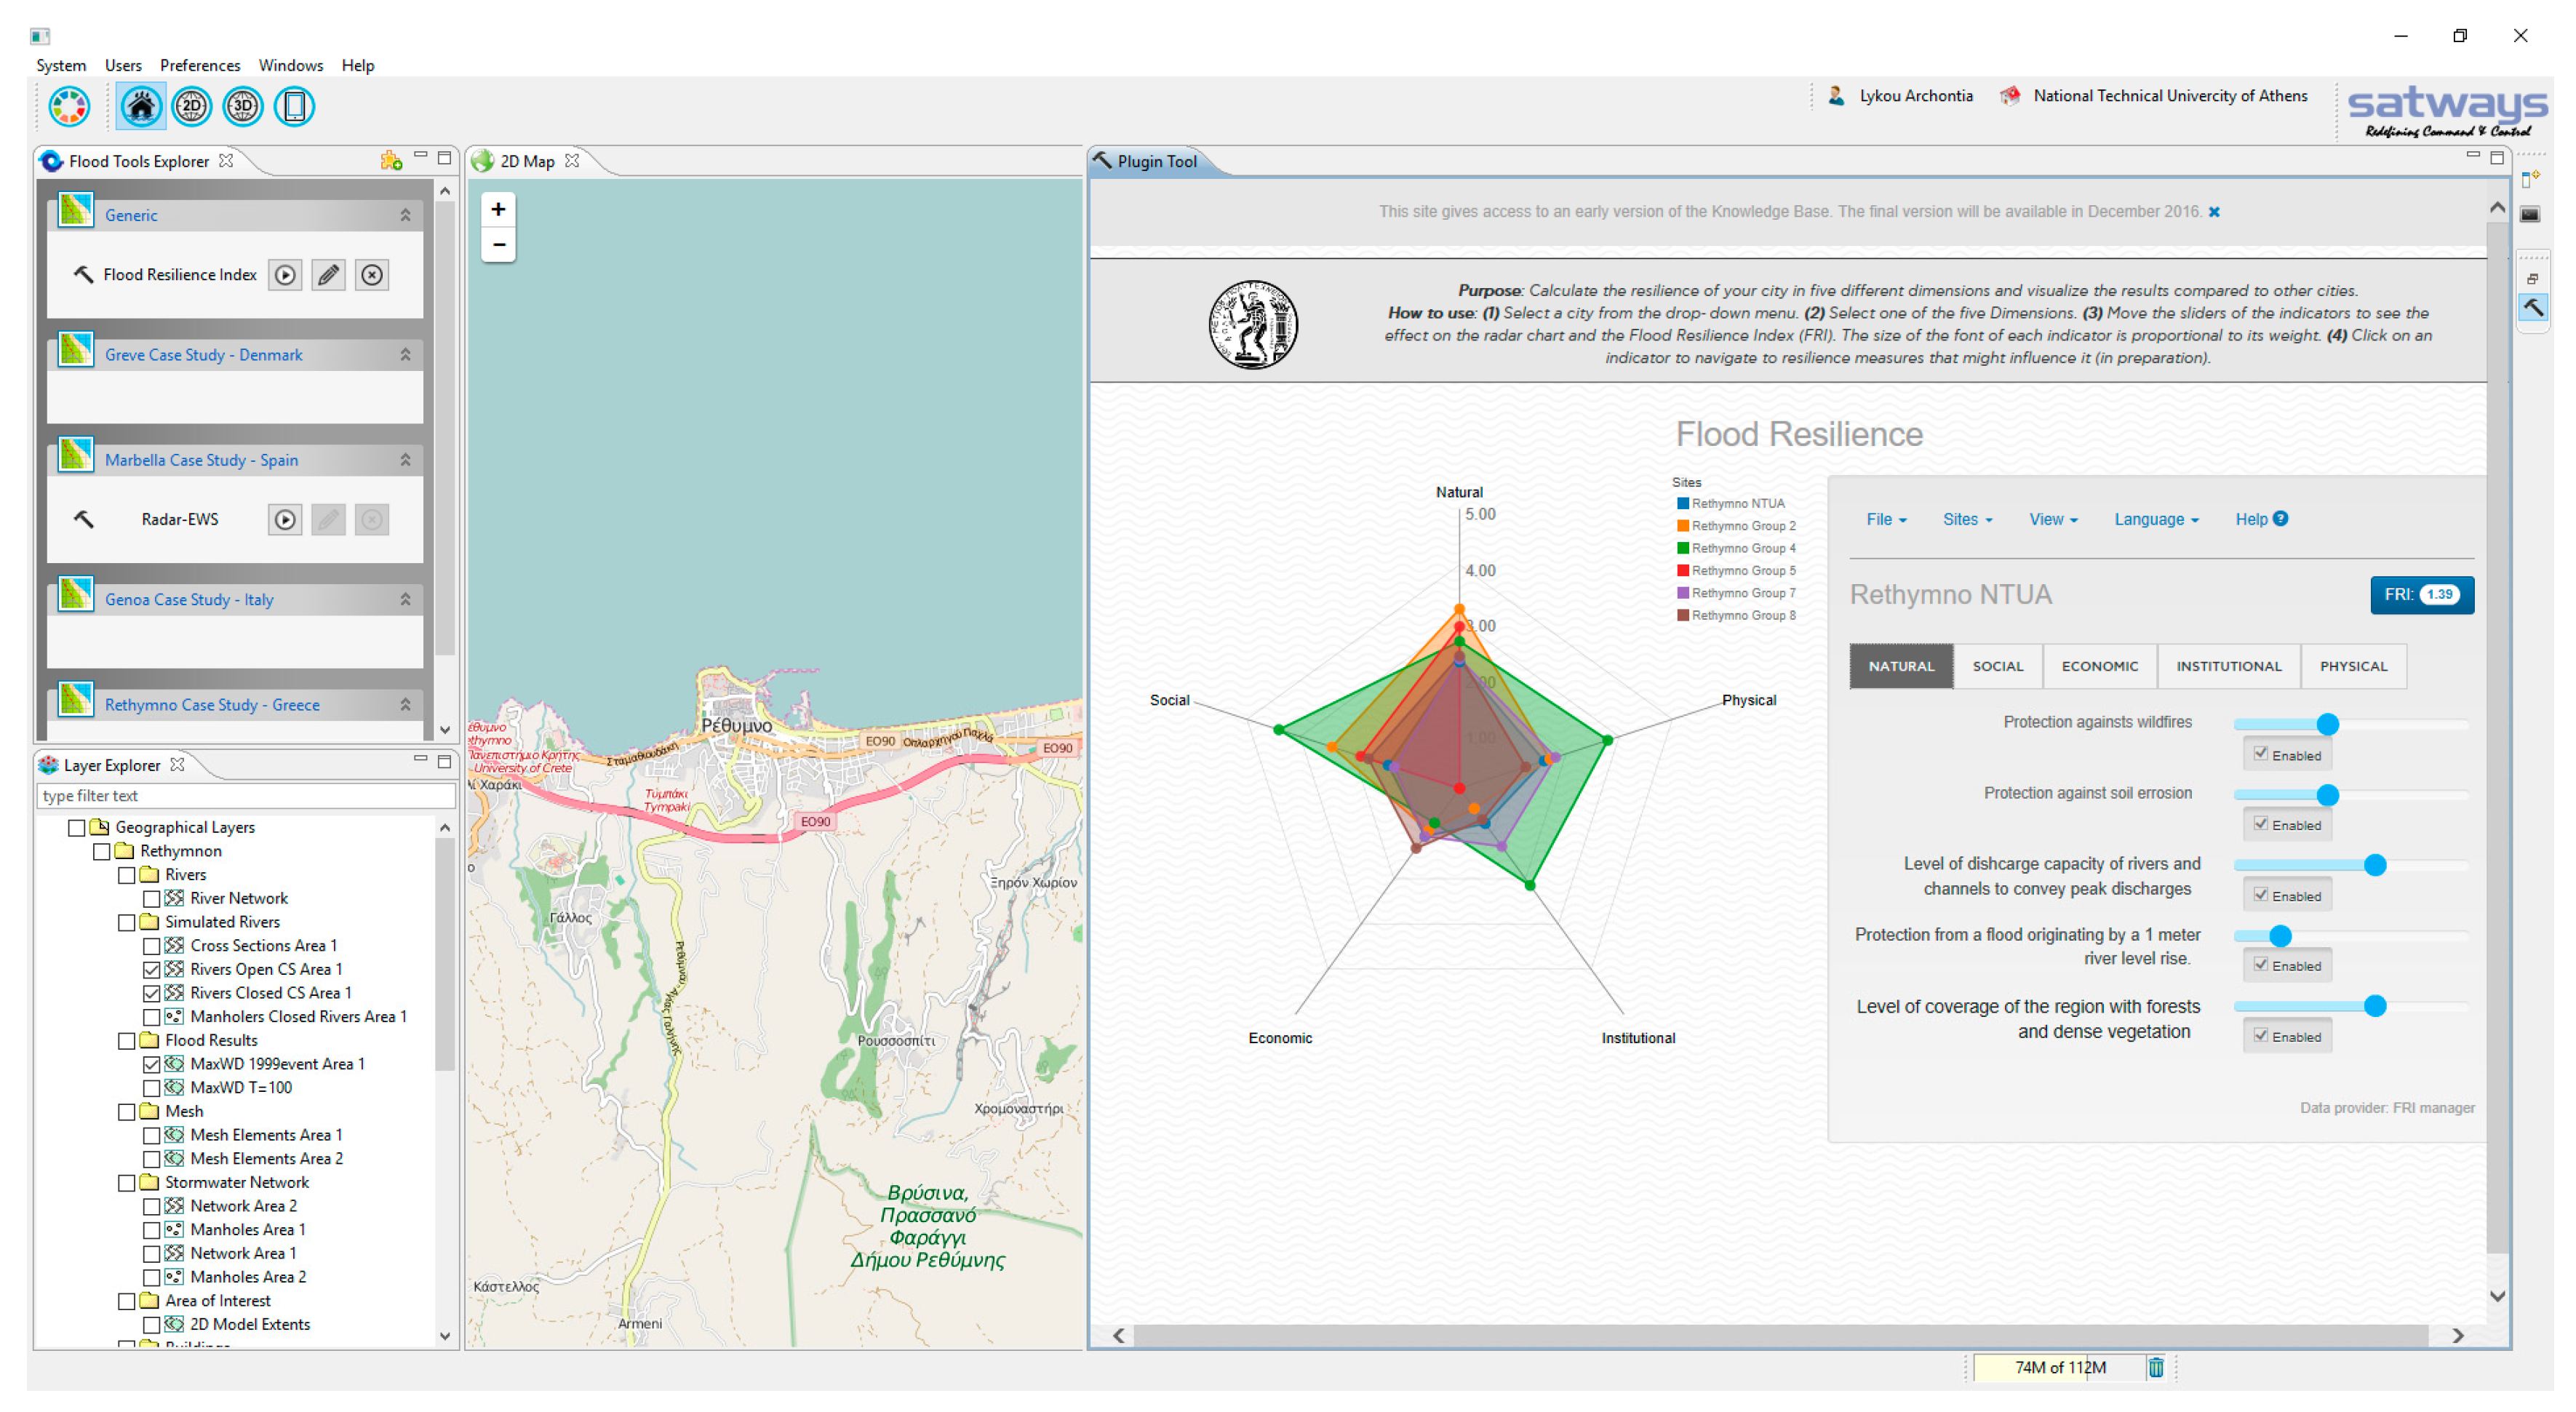
The main objective of the PEARL KB front end is to support the users in their aim to identify resilience strategies and specific measures that are suitable for their region against extreme events. Appropriate functionality of the website has been developed to guide the users in the following activities:
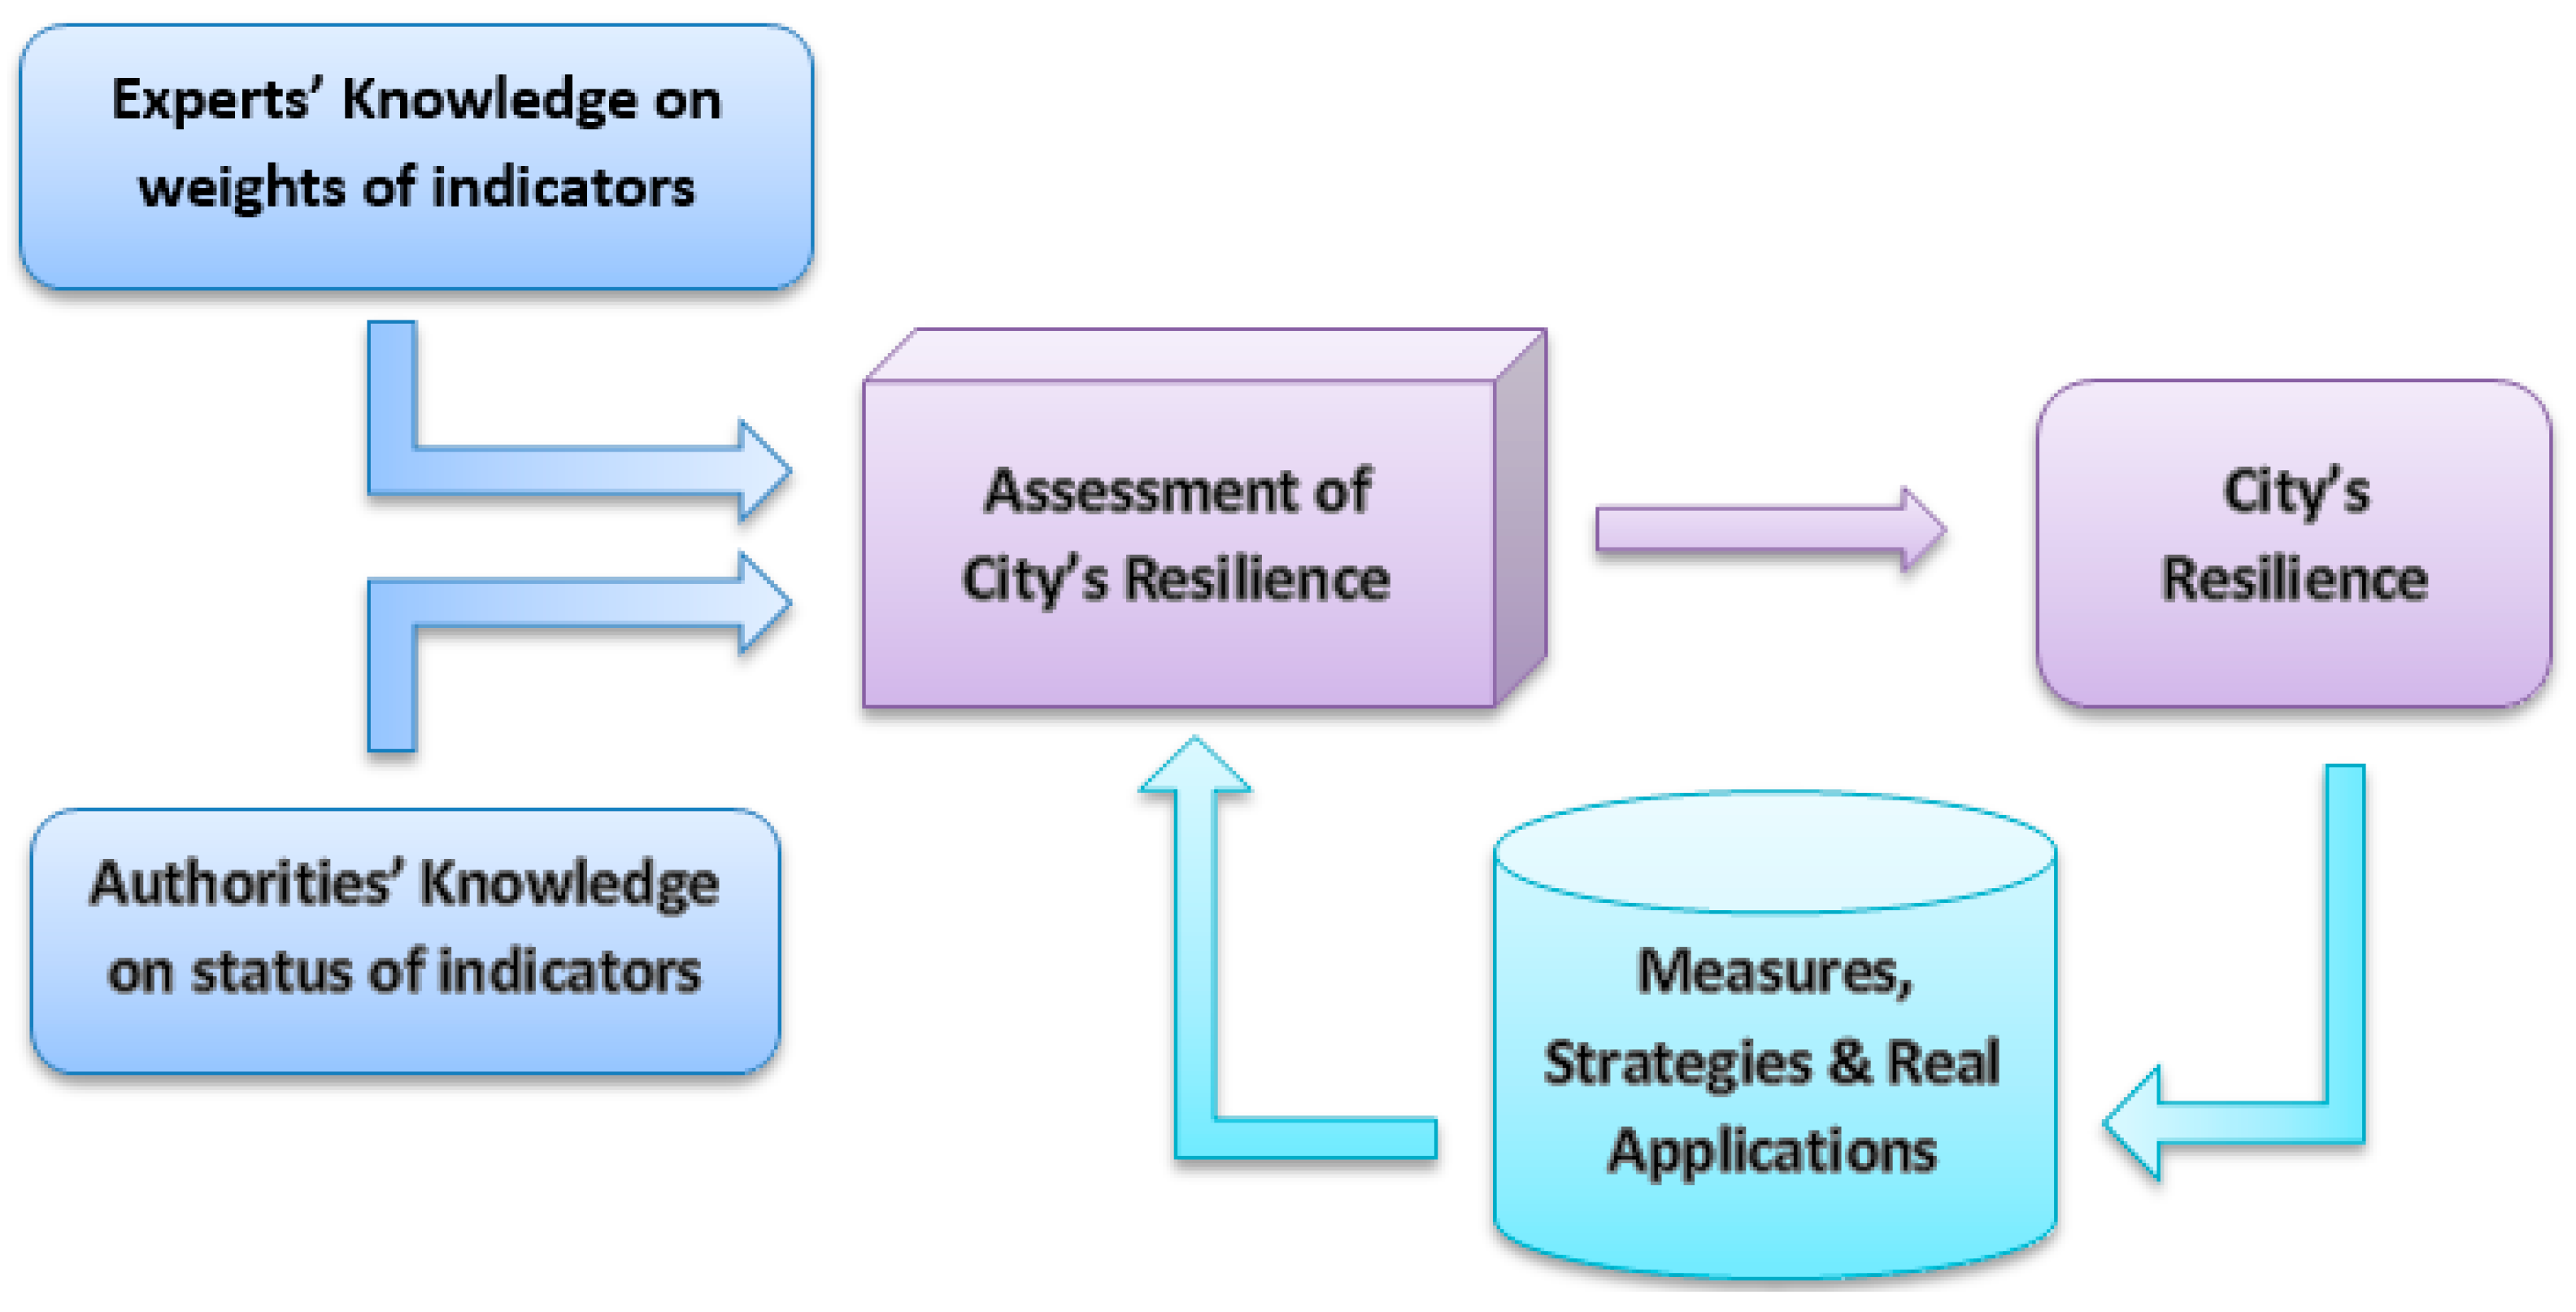
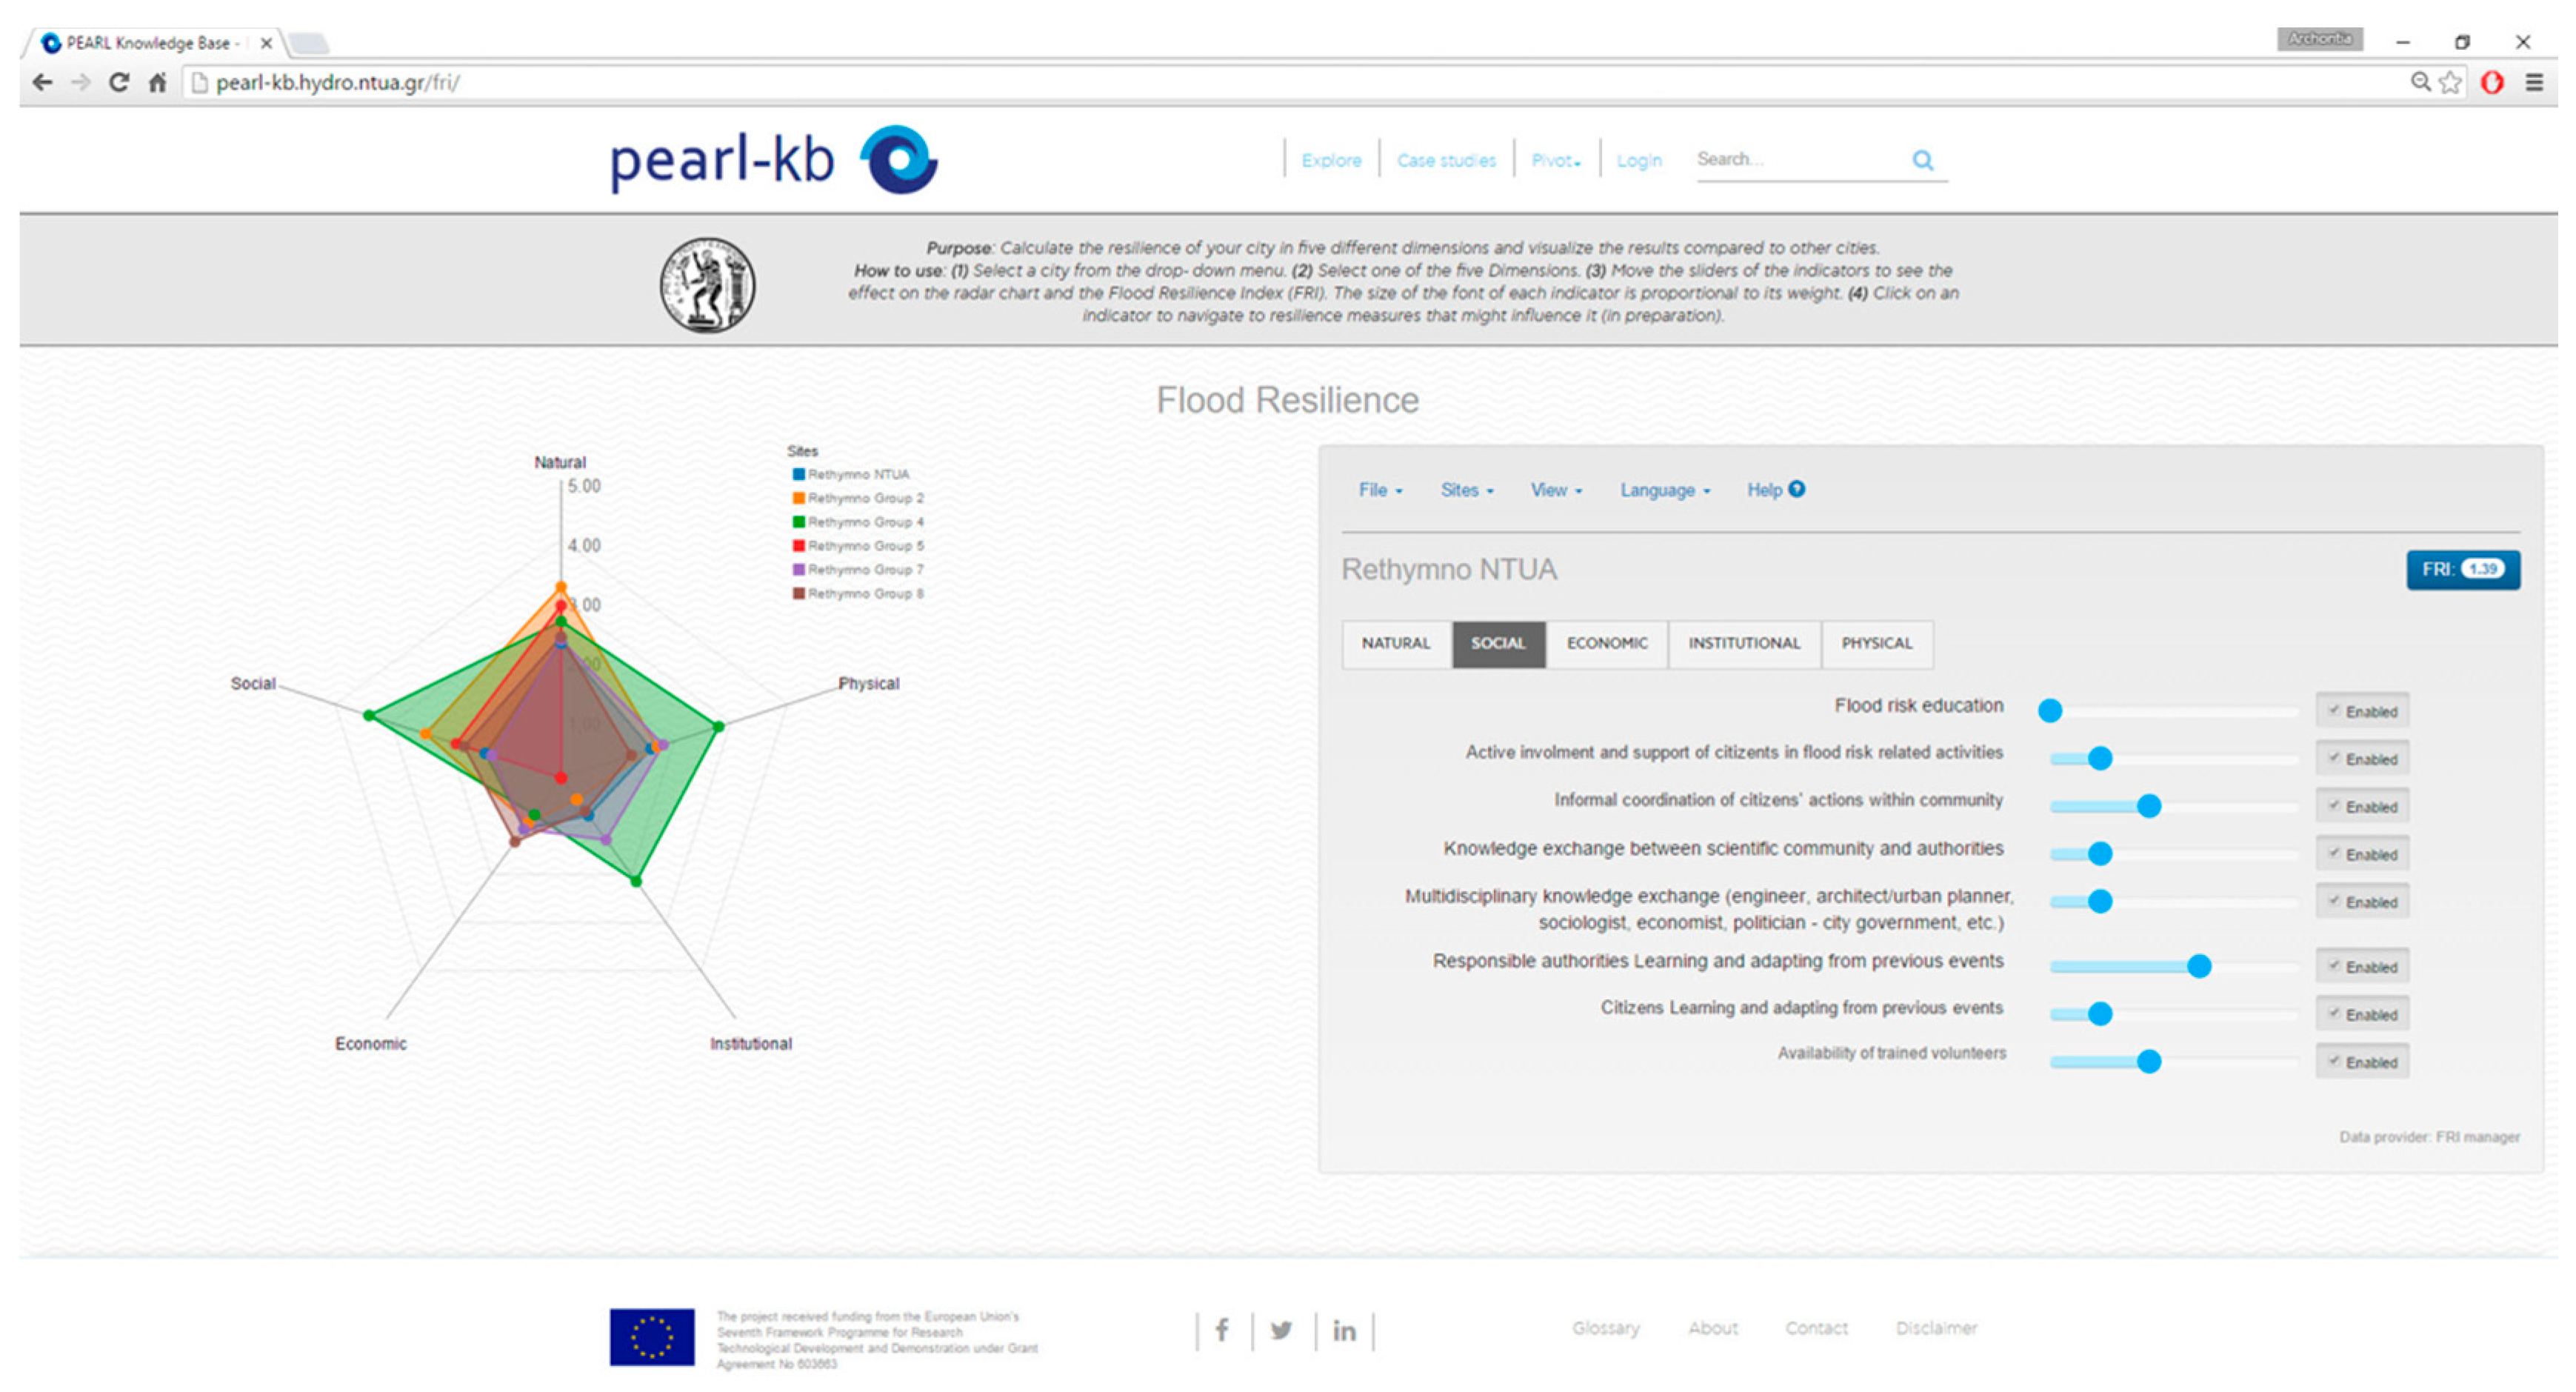
  • Assess the resilience of their city to floods by calculating the Flood Resilience Index (FRI) and identifying dimensions and specific fields where the coastal region is particularly vulnerable (see Section 2.2).
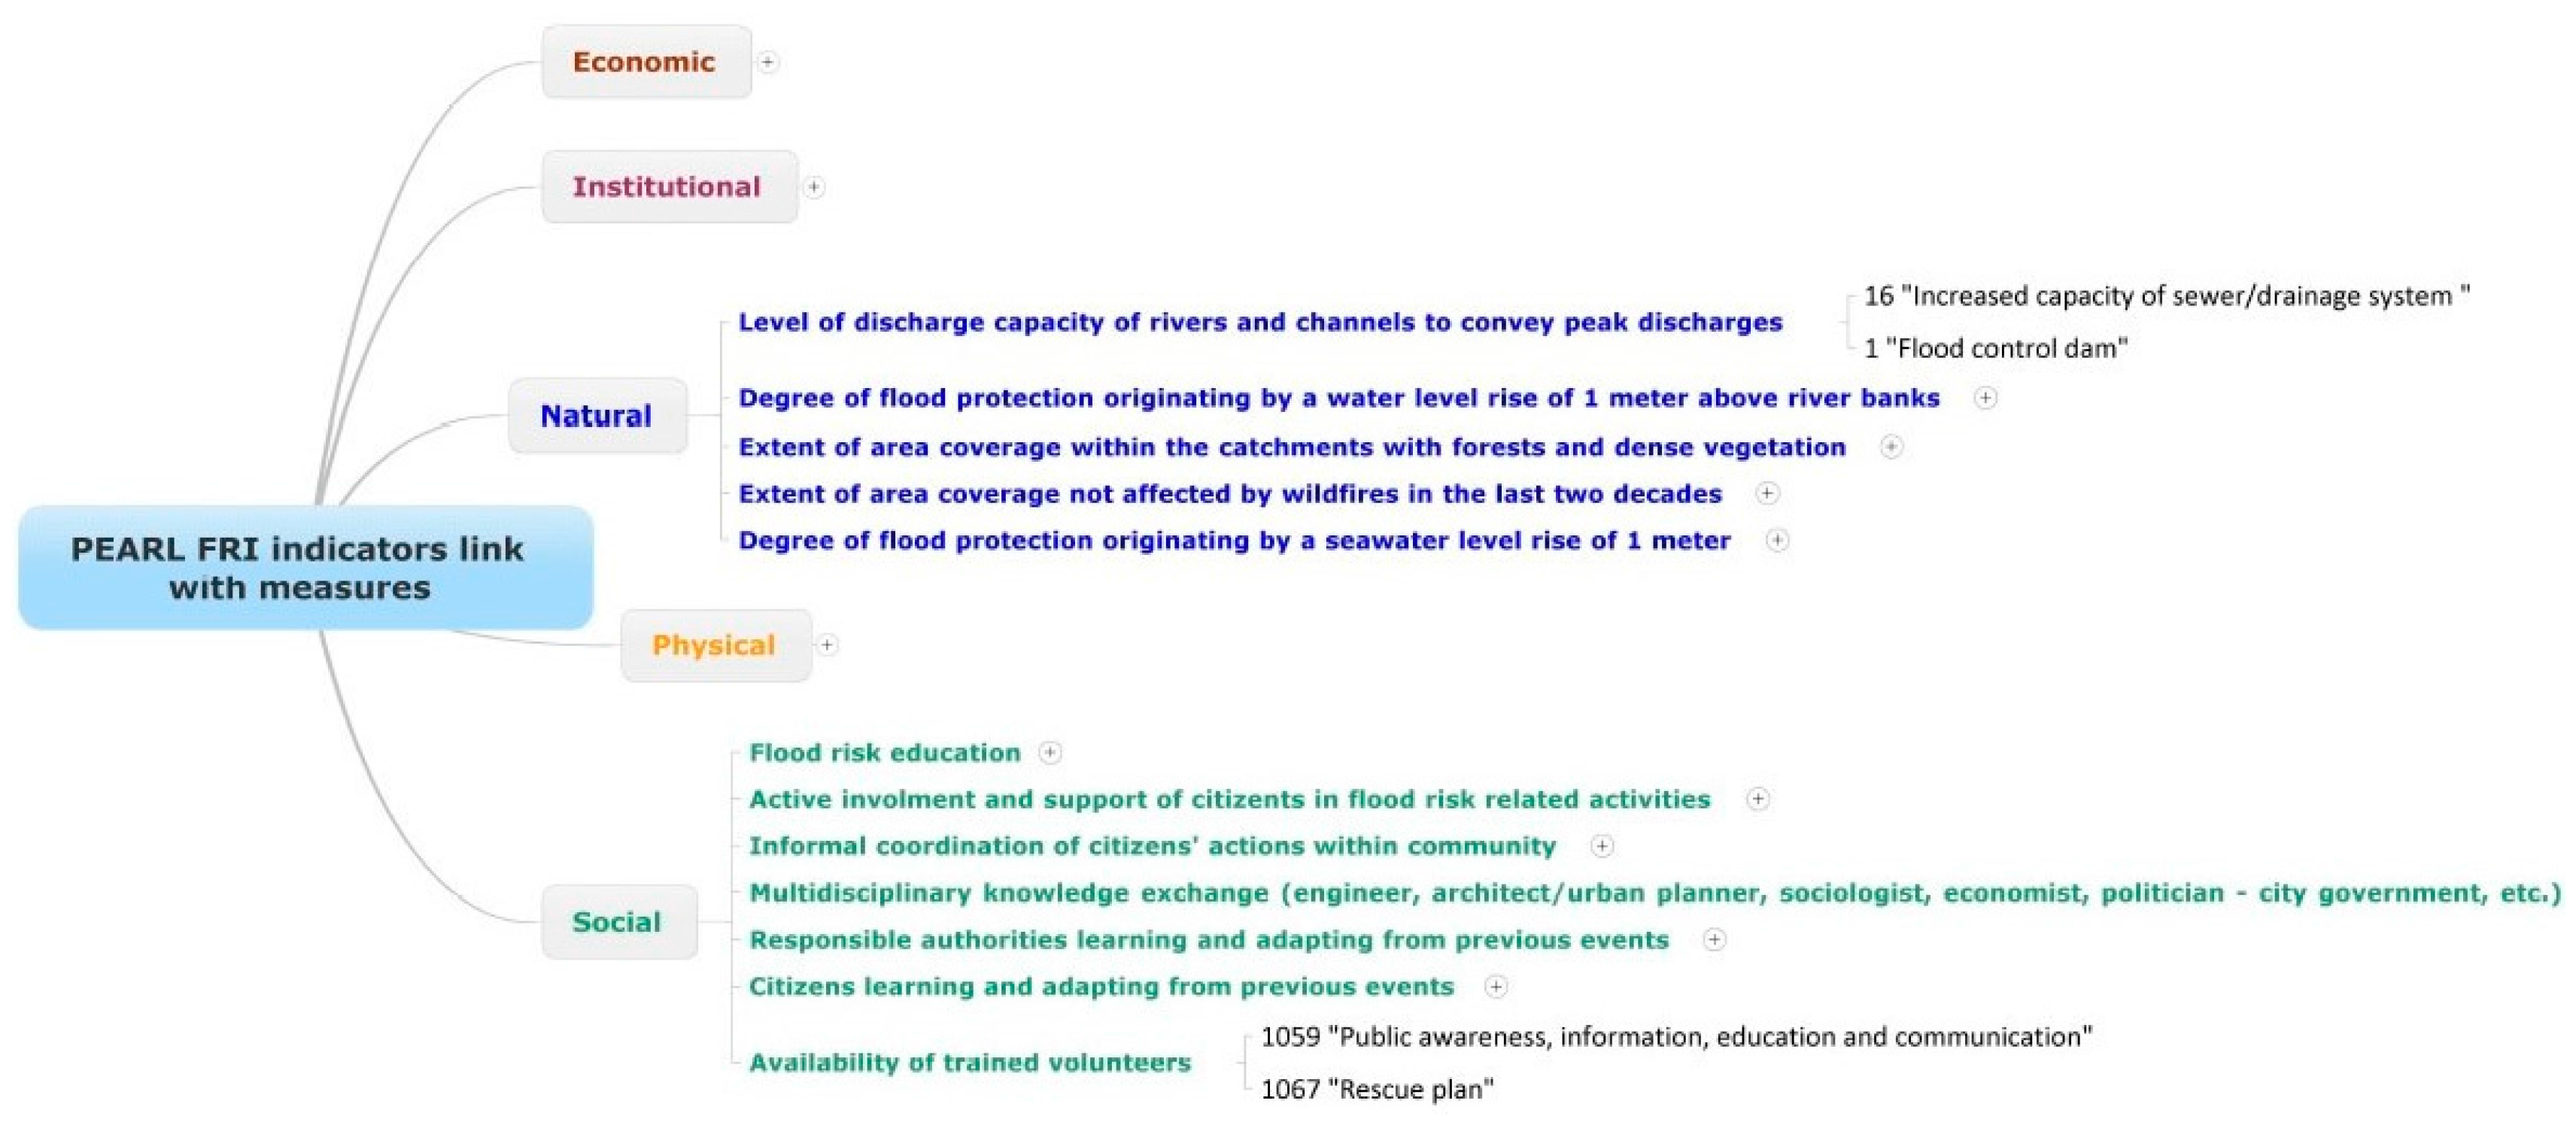
  • Once the main vulnerabilities have been recognized, the user may proceed in identifying measures and strategies which may help improving the city’s resilience. The PEARL KB supports this transition by linking all indicators comprising the FRI with relevant measures and thus the user is able to navigate from the FRI page directly to the specific measures (see Section 2.2.2).
  • Known case studies of the selected resilience measures can be explored next. The user can spot them on a map and review detailed information related to the case study, such as its description, implementation costs, lessons learned, etc.
  • Finally, publications and other sources that document the resilience measures of choice or their applications in various coastal regions can be retrieved for further research.
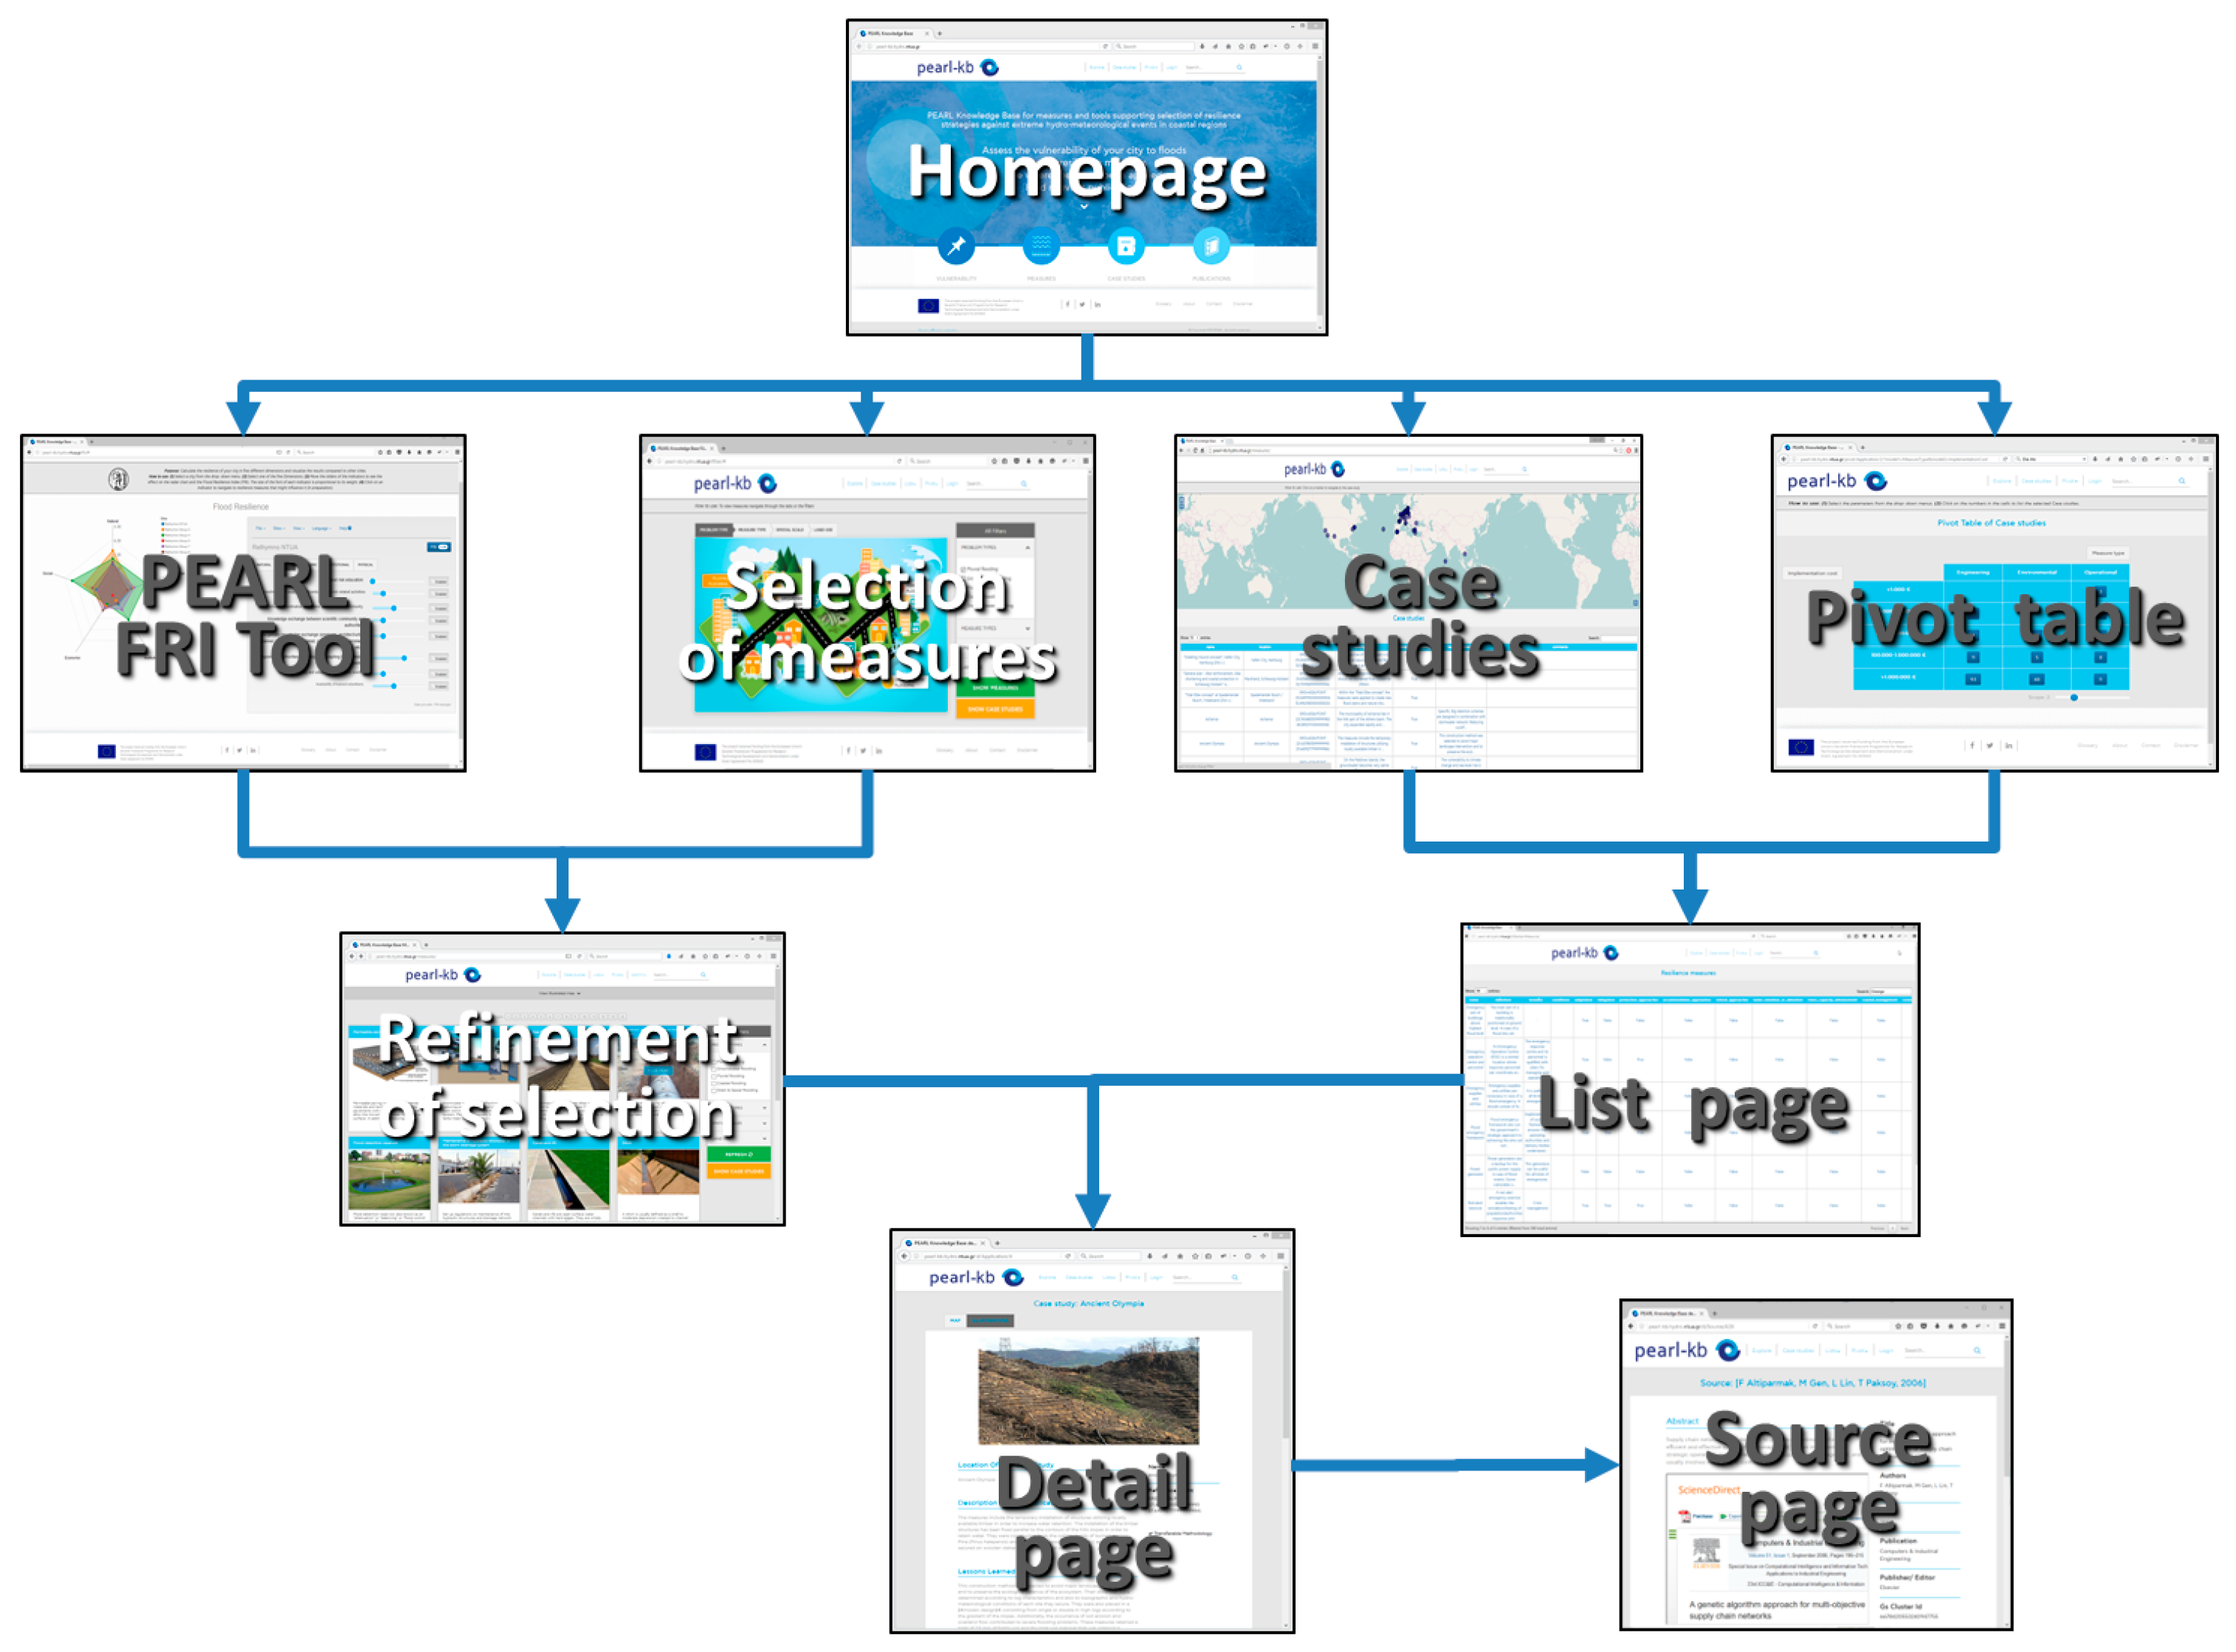
The functionality described above can be accessed in sequence from the homepage of the site. Although this approach may be convenient for many users, other users may prefer a more targeted approach. Using graphical elements such as buttons or menus, the user may navigate directly to specific pages, e.g., resilience measure explorer, case study map, pivot table and publications list. The schema in Figure 2 shows web pages and common navigation paths that may be accessed by the user. They will be described in more detail in this and the following sections.
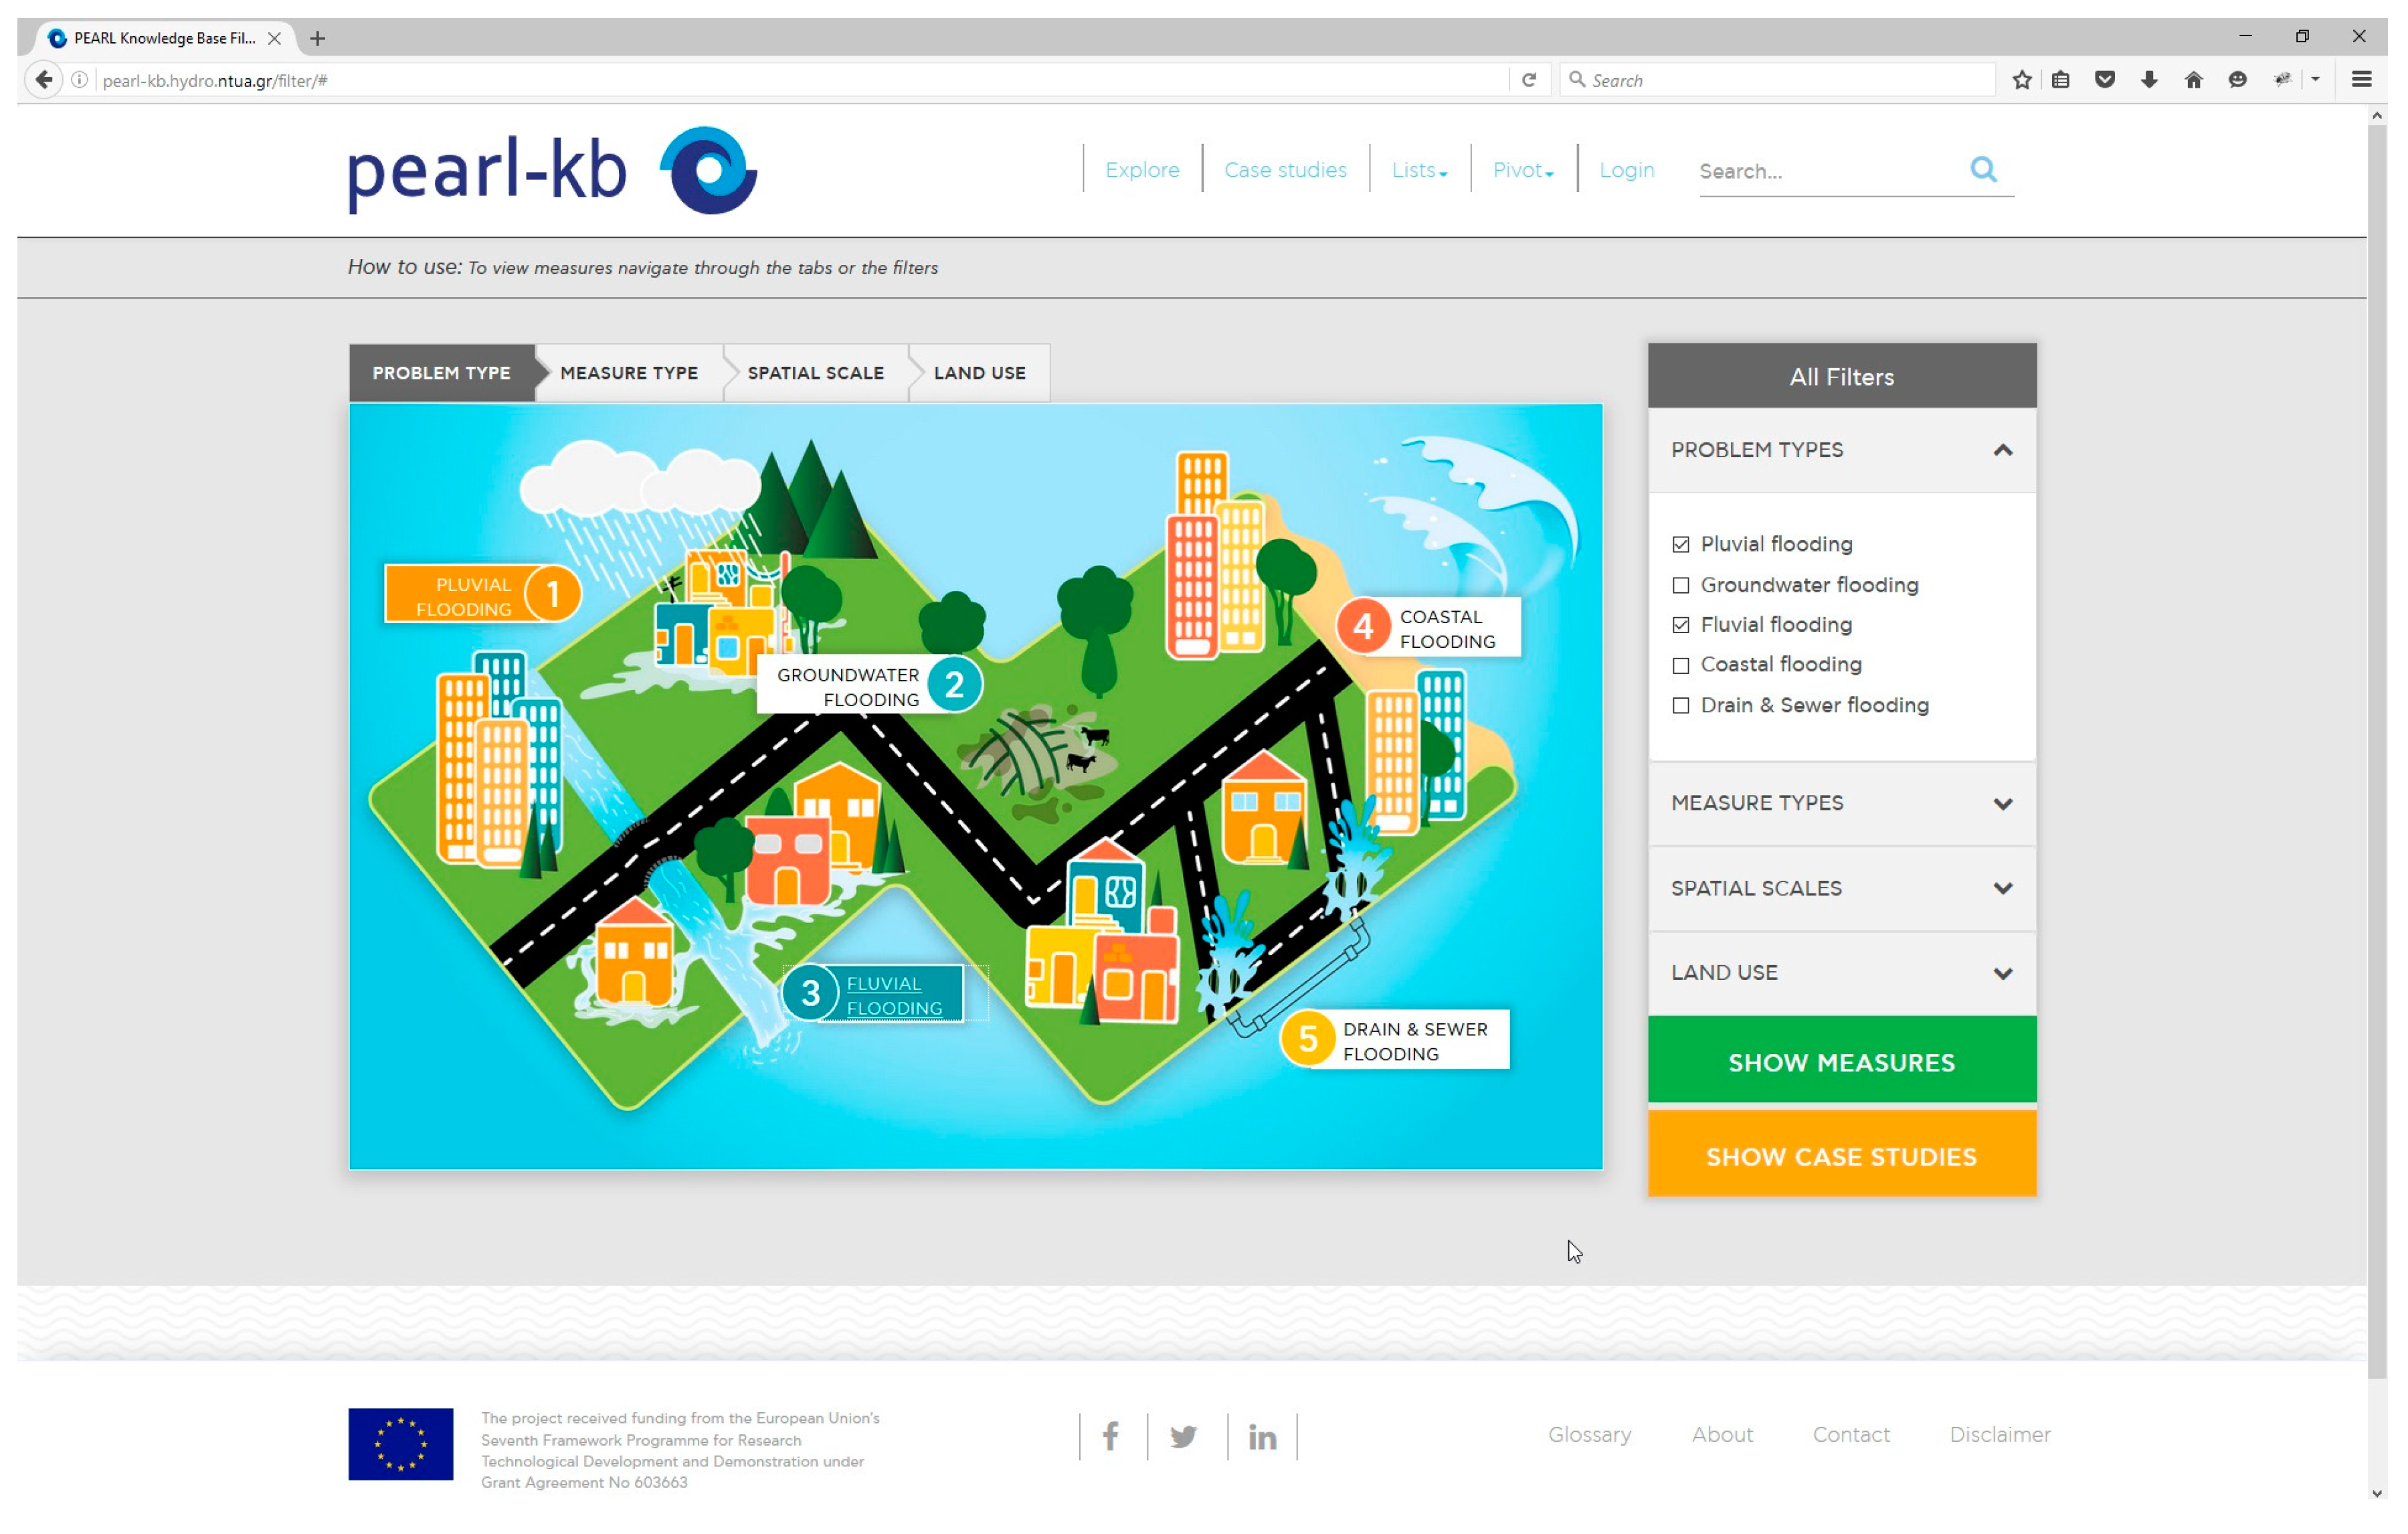
More specifically, the PEAL KB supports the users in narrowing down their search to those resilience measures that match certain criteria. Filters are available in four categories: (a) flood problem type; (b) measure type; (c) spatial scale; and (d) land use. For each of these categories, interactive illustrations support the selection of the filters (see Figure 3).
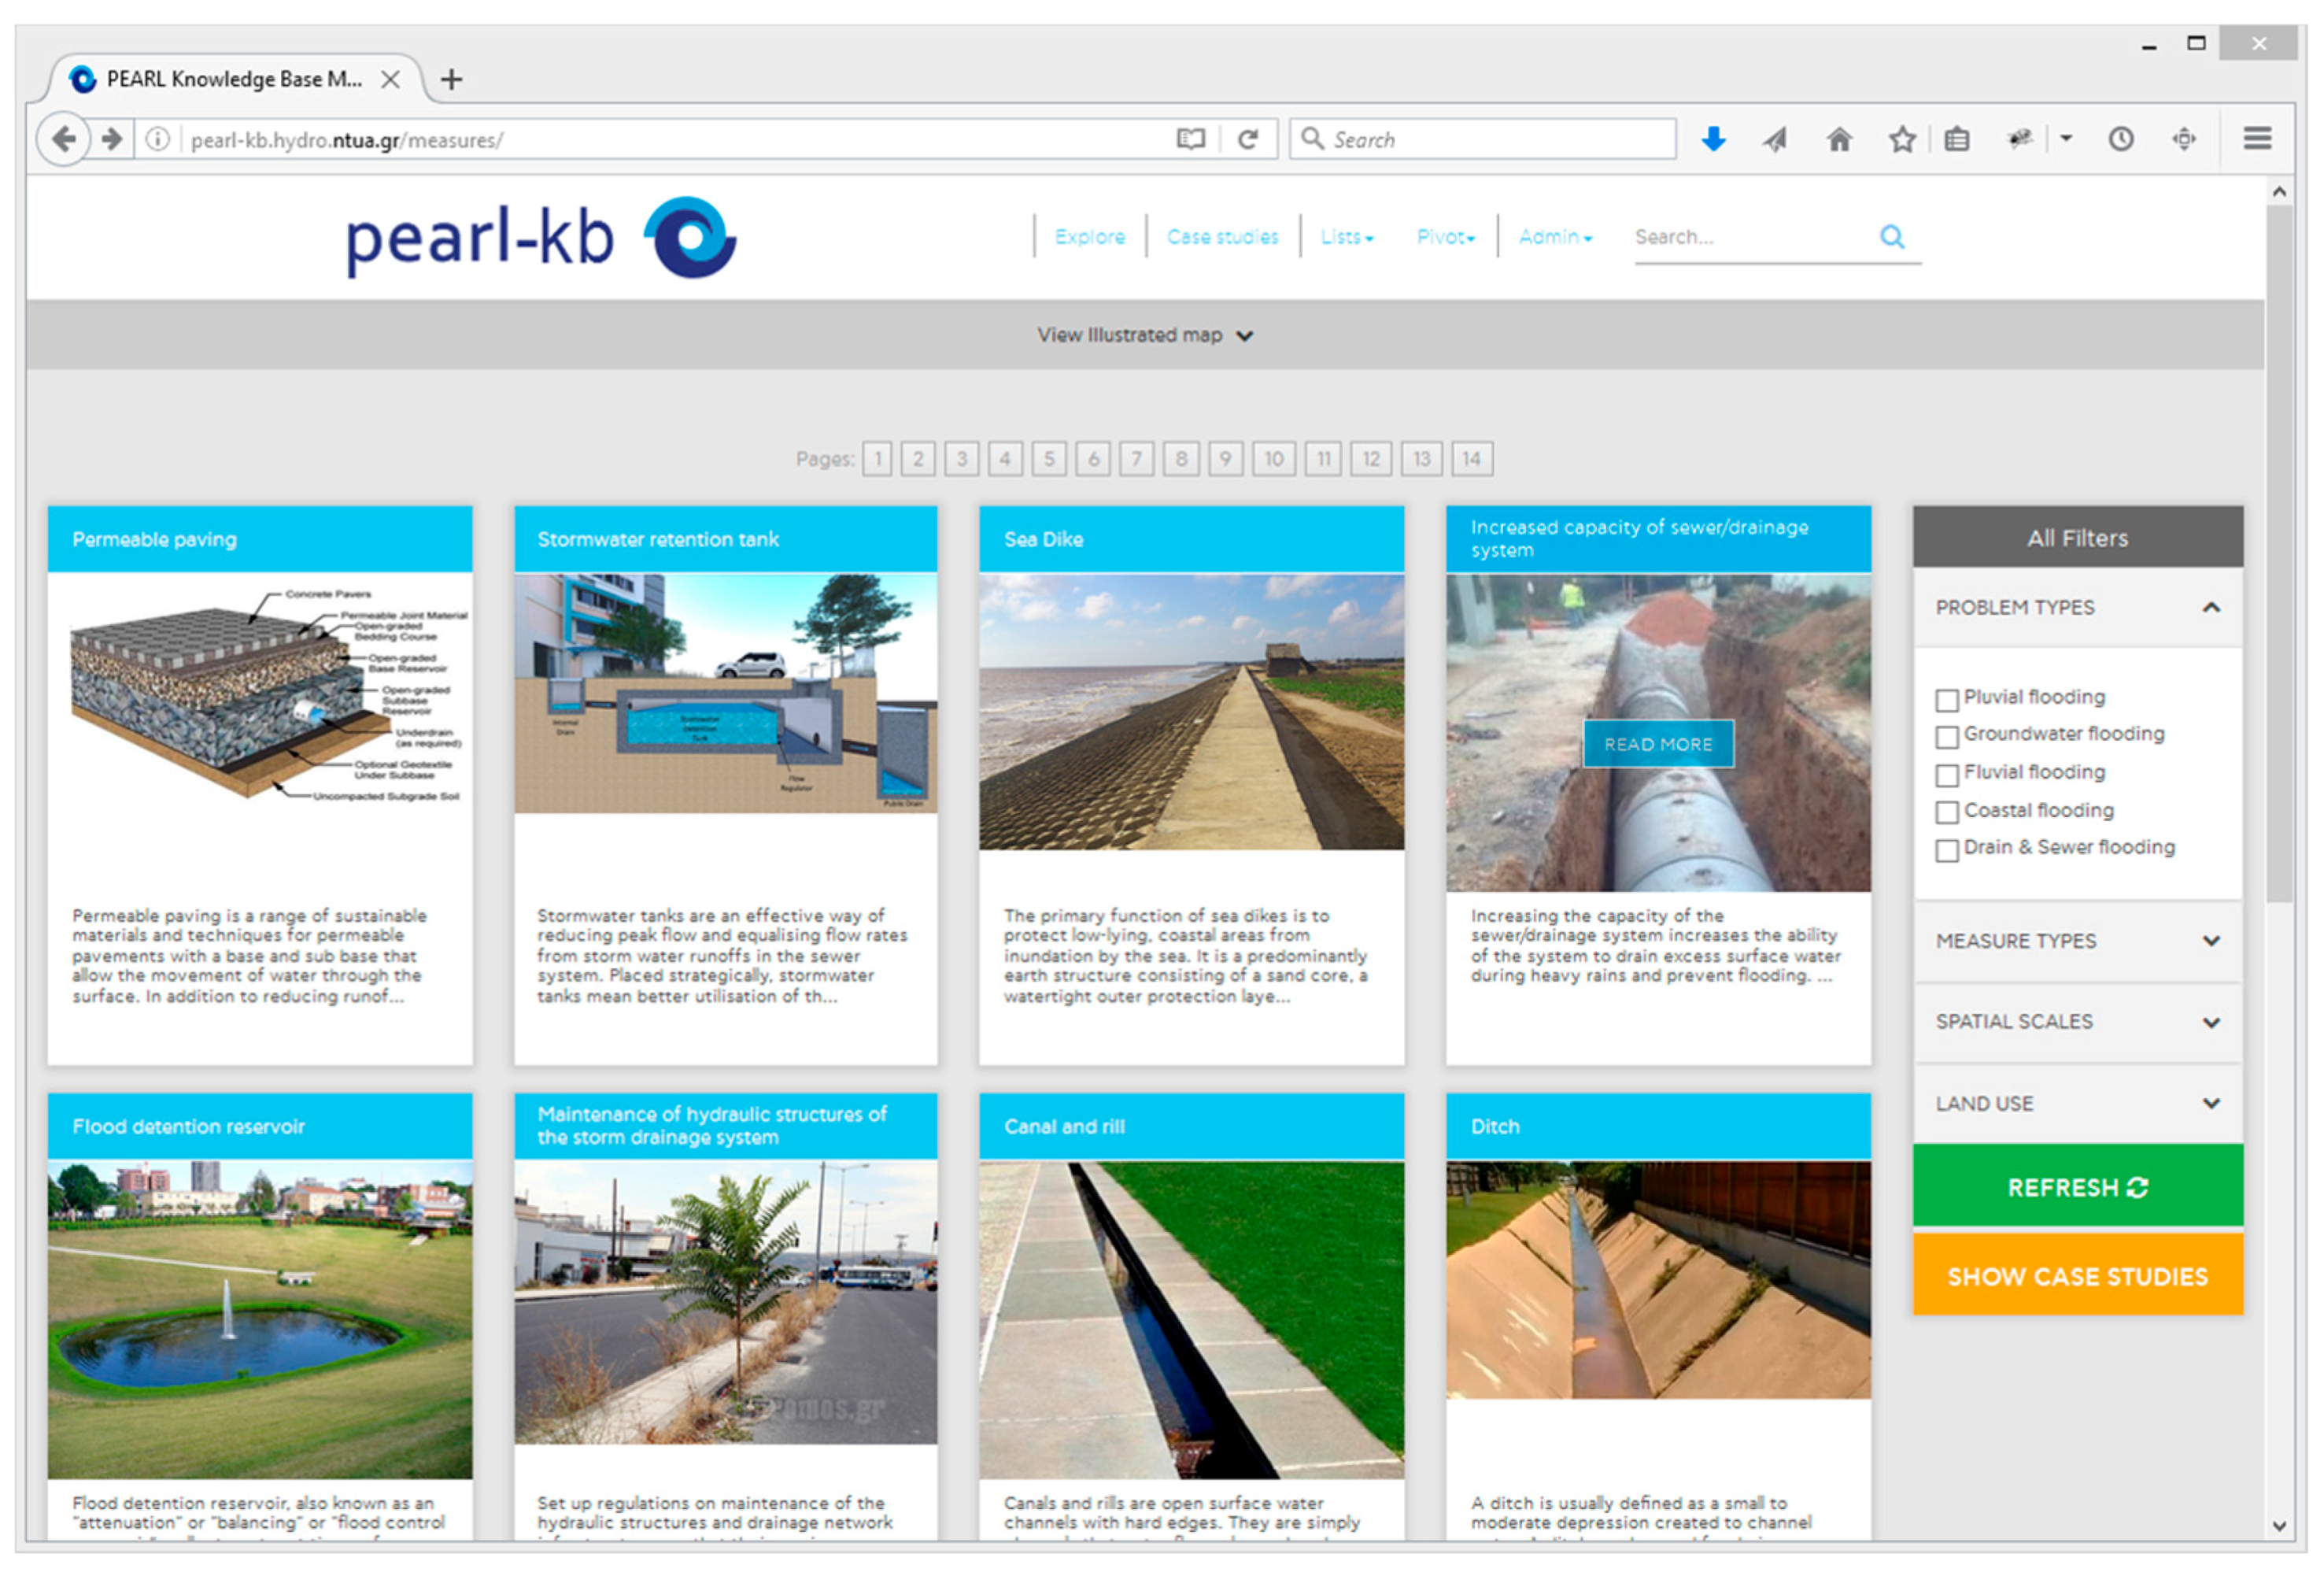
Measures that match the criteria are presented next in a page in which the user may refine the search and navigate to the detail page of selected measures (see Figure 4). The pool of measures selected for the PEARL project originate from various sources, such as related projects (e.g., NWRM, and PREPARED) and contributions from PEARL project partners. For this purpose, a questionnaire has been distributed to selected experts asking them to review the suitability of the identified measures for this project and request their contribution with new measures. Their responses have been processed, resulting in a list of (at present) 168 measures. However, this list of measures can be expanded in the future, as the system provides the possibility to adapt to newer knowledge by including new and modifying existing measures.
The same filtering criteria may apply also to case studies, resulting into a list of known applications of measures that match the selected criteria (Figure 5). In addition to the list, the case studies are also marked on a map. The user may navigate to the detail page of the case study by selecting it either from the list or the map.
A number of pages in PEARL KB are generated and rendered in a generic way, i.e., the same page generation routines apply for any class stored in the KB. PEARL KB recognizes the type of class properties through introspection and renders the page accordingly. Most notable examples of this approach are class list pages, object detail pages and pivot tables.
As in the aforementioned cases study list, list pages include a list of all class objects and their properties in the form of a table. In the case of a large number of objects, the table is divided into pages and textual search may be applied upon the list entries. The title of the columns corresponds to the names of the class properties. As this page provides only a list of the object properties, long textual information is truncated. In the case that the class objects are georeferenced, an interactive map appears at the top of the page on which the locations of the objects are marked.
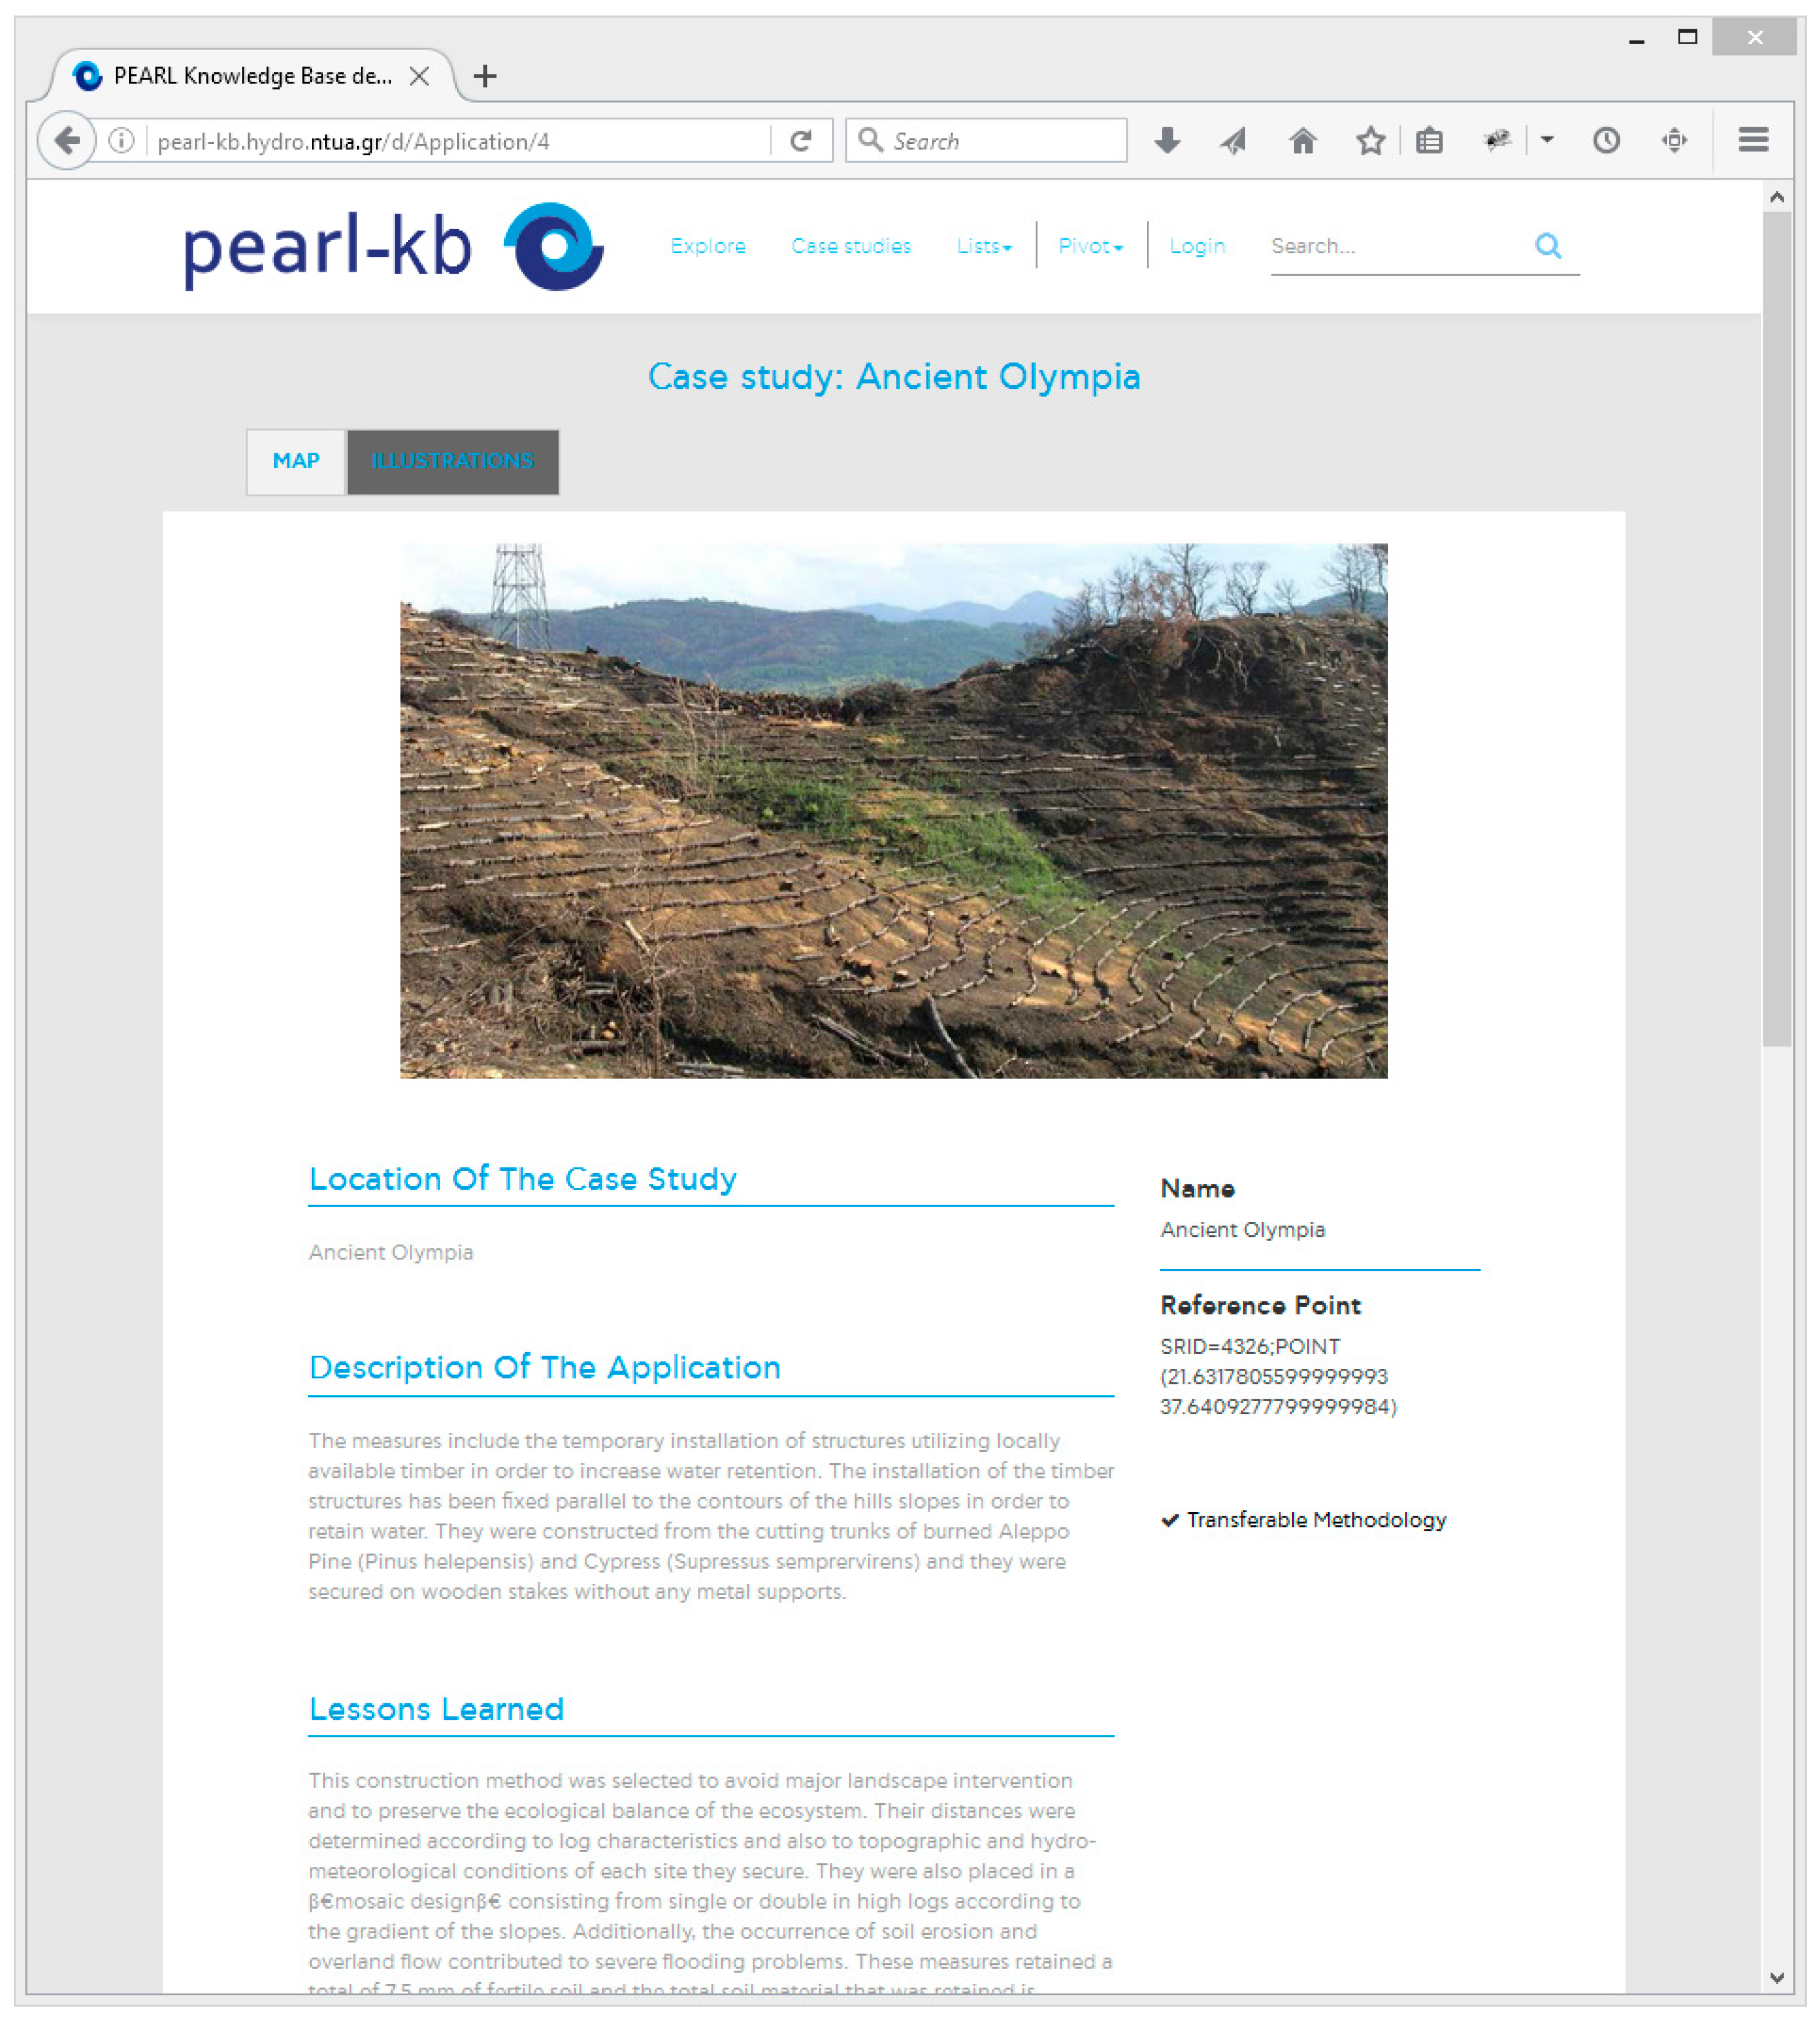
When a detail page of an object is requested, the PEARL KB retrieves all available data related to this object organizing them by data type in the following categories: Numbers (Integer, Real), Boolean variables, Textual information, URLs, Geographic data, Illustrations and Relationships (one-to-many, and many-to-many). The page is then rendered according to the identified information (see Figure 6). In the case of georeferenced objects, a map appears on top of the page showing its location. Illustrations appear in another tab on top of the page. Relationships are listed in categories with the name of the related object as hyperlink. A tooltip explaining the relationship in a human readable sentence appears by hovering the mouse over the hypertext. By clicking on the name, the user is navigated to the detail page of the related object.
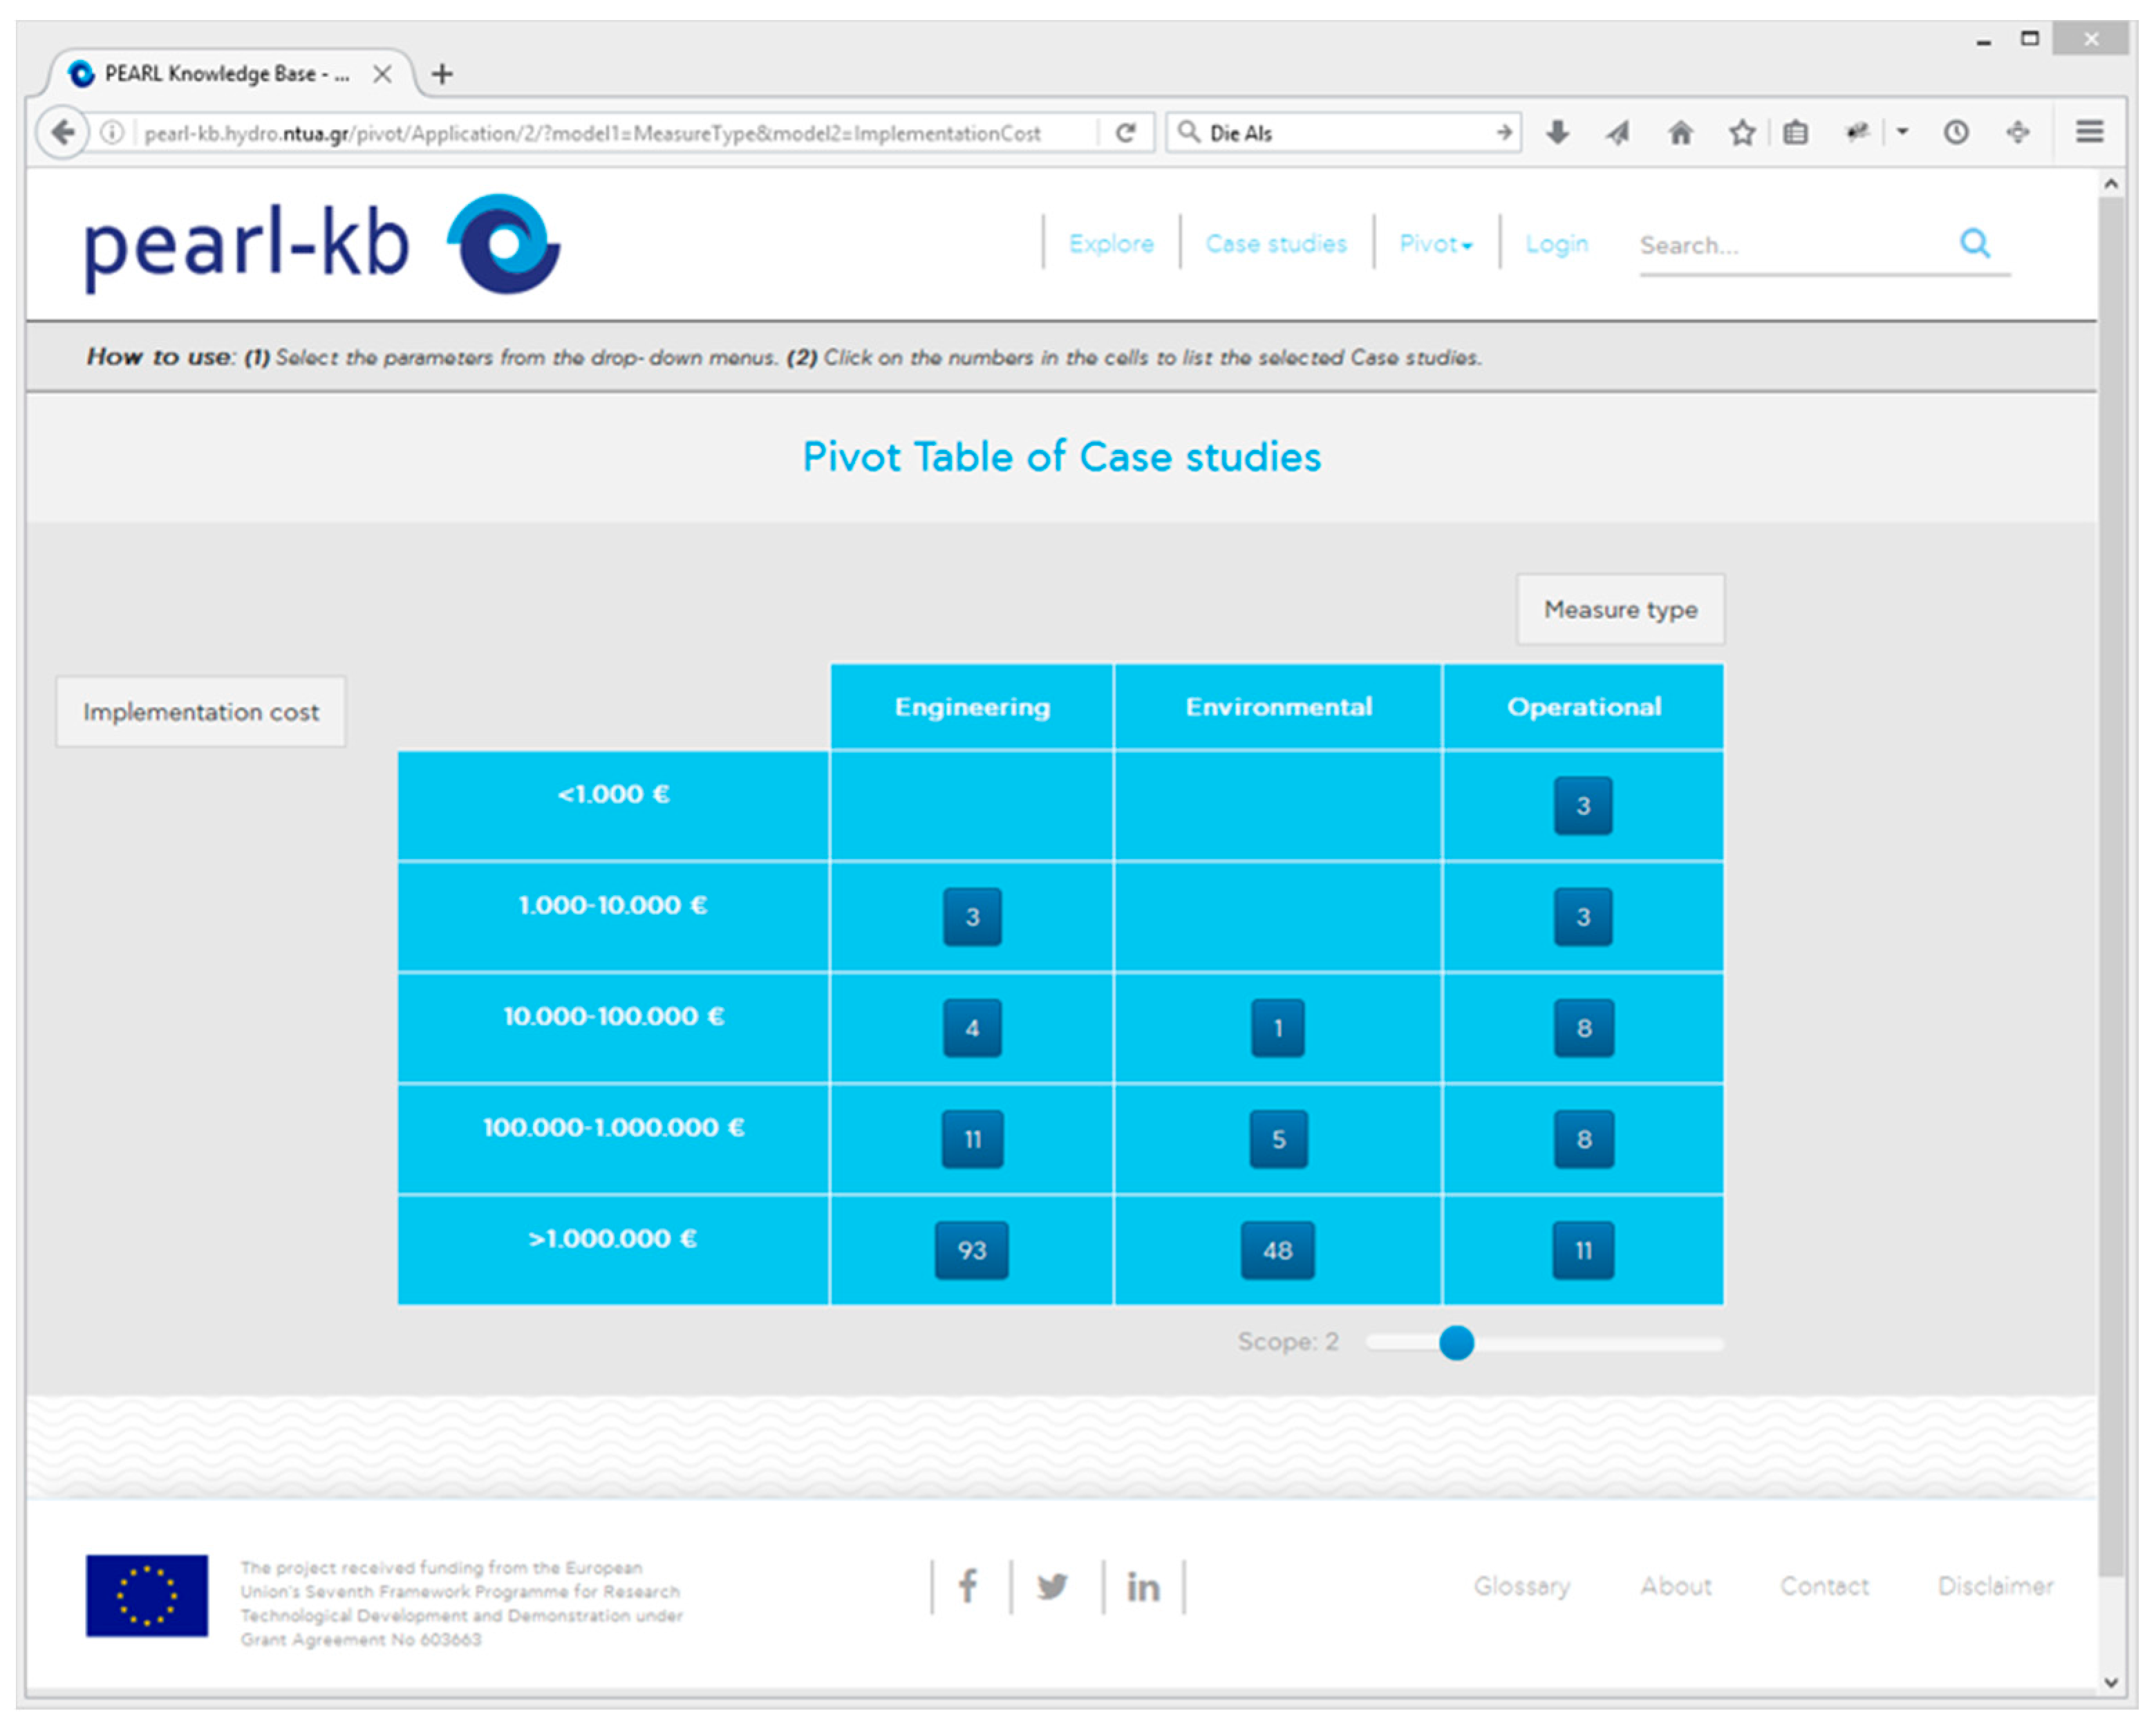
An alternative way to retrieve the desired information stored in the PEARL KB is offered through the pivot table. A pivot table is a generic tool that summarizes information from several other tables and can be applied on any class of the KB. By selecting a class from the pivot menu, a pivot table of this class appears. Each of the two dimensions of the class table is associated with a property of the class selected from the pull-down menus. Columns and rows represent the values of lookup tables associated with the selected properties. In each cell of the pivot table, a number is displayed representing the stored items that match both property values specified by the line and the column of the cell. By clicking on a cell the user is navigated to further pages (list page, and object page) providing detailed information on these items. The example in Figure 7 gives the number of case studies having implementation costs at a certain range (rows) and at the same time applying measures that are of specific type (columns). This example also demonstrates the ability of the pivot table to collect information that span across several tables. Measure types is actually a property of the class Measures, which is related to the class Case studies. By specifying the scope of the pivot table, the user can determine how far from the pivot class in the Knowledge Base the query should reach. Scope 0 means that only the properties directly associated with the pivot class should be available for selection from the pull-down menus, while scope n means that the selection list will be expanded to include properties of related classes that span across n relations from the pivot class.
Next to the various other search capabilities (filtering measures, locating case studies on the map, and searching in lists), the Knowledge Base provides full search functionality to all kinds of stored textual information. This includes names of entities, classes, descriptions, etc. The search algorithm is based on Levenshtein Distance [13] for approximate string matching, i.e., finding strings within a longer text that match a given keyword approximately. The results are presented as an excerpt of the text in which the given keyword has been encountered, along with the names of the relevant object and property including a link to the object’s detail page.
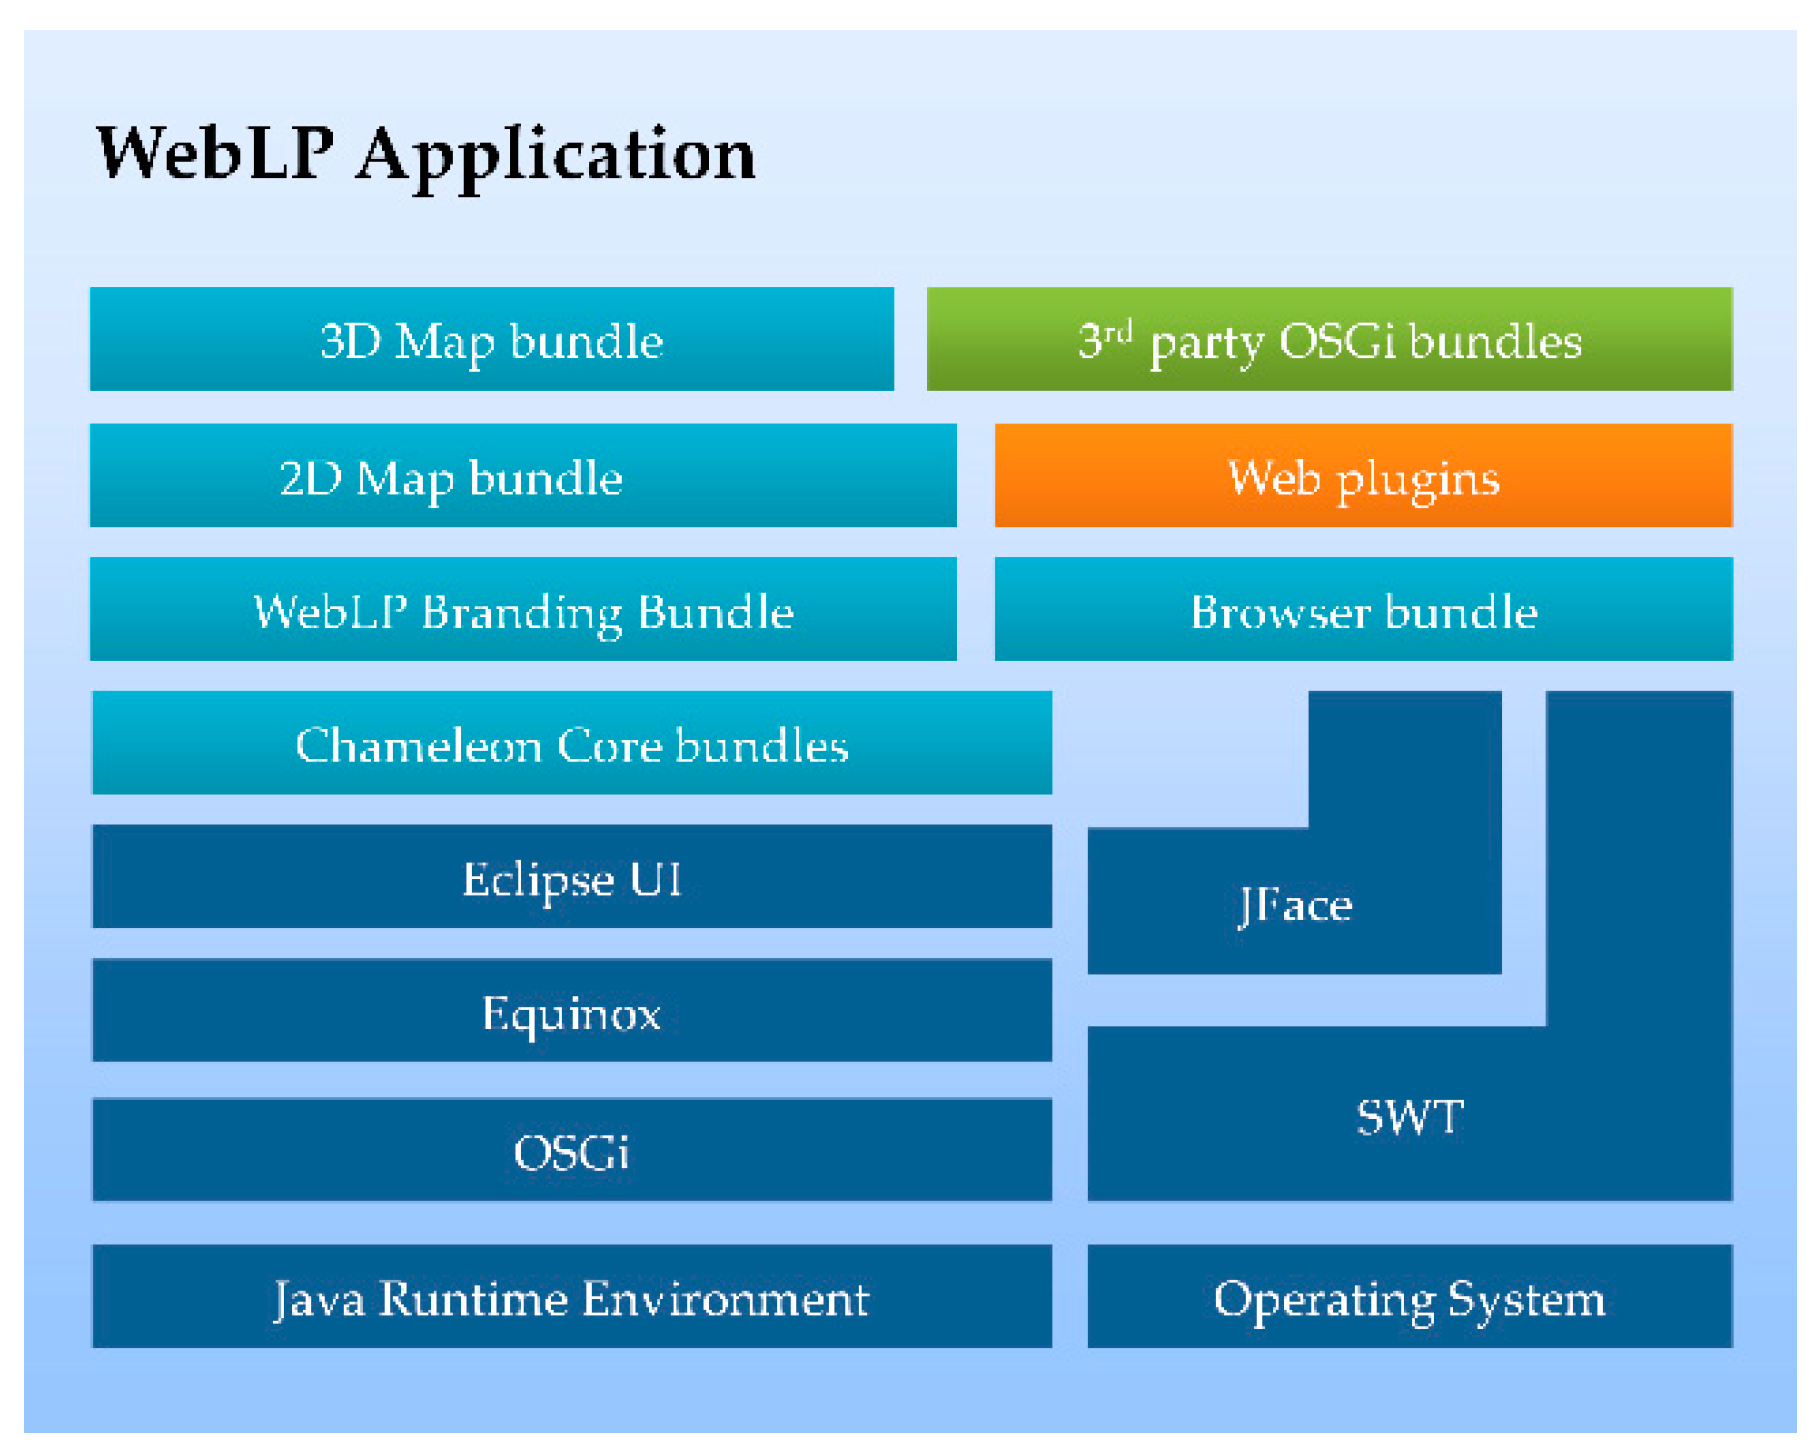
PEARL KB front-end has been developed using the following technologies: The main web framework is Django, which is based on Python programing language. The design of the web pages is based on Bootstrap elements and the markup language HTML5 enabling a fully responsive web design. Additional functionality to web pages has been implemented using the programming language Javascript and the library JQuery while often Ajax techniques have been applied.

2.1.3. Repository of Measures and Resilience Strategies and Their Applications

While trying to collect best practices and make them available for the decision makers to consider, over one hundred measures and over sixty case studies have already been collected and entered into the KB. Multiple sources, i.e., several websites, research projects, etc. have been identified from which the already available knowledge has been harvested and referenced within the KB. The most important ones, which aimed not only to enhance flood protection/preparedness of an urban system but also to increase flood resilience, are listed below:
Collection of measures has also been accomplished using a macro-enabled excel sheet and support by the PEARL partners, i.e., experts with years of experience in flood management solutions in Europe and Worldwide, but efforts are still ongoing and currently targeting a worldwide audience of experts through the development of online forms. It is important to highlight that KB content is being constantly updated, enriched and modified since the system provides the possibility to adapt its content to newer knowledge by including new and modifying existing measures and strategies, even beyond the end of the project.
Apart from indicating the collected measures within the KB, a short definition and their primary function have also been provided along with the (co) benefits of measures implementation. The measures have been categorized and basic attributes have been appointed to them. The type of measure (engineering, environmental, and operational), the application target (adaptation, and mitigation), the problem type for which they are being implemented (coastal, fluvial, pluvial, groundwater, and drain and sewer flooding), as well as the spatial scale (river basin, city, neighborhood, street, and building) and the land use (urban, suburban, rural, coastal, industrial, and park) where they can be implemented are the main attributes of measures. However, auxiliary classes and subcategories of measures primary related to measures’ functioning (e.g., temporary or permanent approach, infiltration techniques, financial preparedness, raising awareness, etc.) have also been defined assisting in a more advanced search. Illustrations of measures are available for the end users along with textual information. Permeable paving, flood control dams, land use conversion, evacuation routes and flood shelters, international loans and insurances, public awareness and use of media, etc. are some of the collected measures that has been documented so far and aim at flood risk management prior, during and after a flood event.
Gaining knowledge and experiences from implemented measures all over the world is of primary importance within this work. Lessons learned from the analysis of different combinations of strategic and operational measures are extracted and be available assisting in planning procedures. Towards that goal, applications of resilience measures, i.e., real case studies, modeled/simulated case studies or even prototypes/lab physical models, have been included, incorporating knowledge from alternative and/or combined interventions as well as knowledge of the “suitability” of each measure (or combination of measures) per type problem, also taking into consideration restrictions that might be imposed, e.g., by spatial scale or land uses of measures' implementation. Apart from including basic information of applications e.g., location, illustrations and the implemented measures, reference is being made to the level of responsible authorities who proceed to measures implementation as well as the possible engagement of other parties such as Non-Governmental Organizations (NGOs), residents, volunteer teams, etc., the implementation cost, the impact of floods prior and after measures’ implementation, qualitative assessment indicating if measure(s) served their purpose, the transferability of the methodology and the lessons learned. Description of case studies is also accompanied with a map indicating their geographical distribution providing yet another way for search. Examples of real applications already included in the KB, include but are not restricted to the major aquifer recharge project at Paso del Norte in the United States, the award winning, stormwater management of the Bluebelt Project in New York, dike constructions and relocations in several areas near Hamburg, Germany, flood control dams constructed in Greece (Rethymno, Crete and Rapentosa, Attiki), stormwater harvesting in Australia, early warning system developed in Marbella, Spain etc.

2.2. Integrating the Knowledge Base with the Flood Resiliece and Vulnerability Frameworks

The usual response of urban communities to flood hazard challenges (such as those faced by the Rethymno case study) was mainly extensive flood-control infrastructures, such as levees, dams, arrangement works, designed in an ad hoc basis, trying to solve flood problems locally. Latterly however, there is a shift from “Conventional Flood Planning” to “Flood Resilience Planning”, which, we argue, makes an attempt to emphasize the importance of adaptation and mitigation processes in managing flood risk while changing the paradigm from “fighting with water” to “living with water”. Learning from past flood events, enhancing awareness and engagement of all stakeholders in a community are all aspects playing a significant role in flood resilience planning, while taking into consideration all parts of an urban system, including society, economy, local government, etc. As suggested in the “resilience” term definition within the PEARL project (refer to paragraph 1. of this paper), flood resilience planning includes changes and interventions in all phases of flood control management: prior, during and after a flood event and tries to cover actions related to preparedness, response and recovery that will enable a community to resist flood related interruptions.
Integrating the KB of PEARL with Flood Resilience Frameworks, the authors argue that a useful tool is being developed assisting stakeholders throughout the decision making process. As such, the KB does not only include a plethora of flood control measures and strategies, but also provides most commonly documented (co) benefits and impacts that authorities should consider before selecting and implementing such measures. The collection of real case studies from all around the world enables the extractions of lessons learned but most importantly provides a way for knowledge exchange related to more robust flood management solutions. Furthermore, the integrated FRI tool enables decision makers to broaden their knowledge and awareness of flood resilient planning. Providing a resilience framework through an online, freely available and easy-to-use tool and assessing a city’s resilience while pointing towards relevant flood management solutions, assists local authorities, but also other stakeholders, to understand the importance of multiple aspects of flood resilience planning and the impact of related decisions throughout all dimensions of an urban system.
The following paragraphs provide a brief description of the FRI framework, its modification and integration with the KB and its functionality.

2.2.1. Flood Resilience Index Framework

As part of the PEARL KB toolbox, a tool for the quantification of flood resilience based on the Flood Resilience Index (FRI) methodology [16] was also developed. FRI estimates the level of flood resilience for a particular area and for a specific flood event.
The approach focuses on a macro composition of the urban system under study. Due to the complexity of any urban system the following five dimensions (or subsystems) are defined: natural, physical, economic, social and institutional. Definitions of the dimensions are given in Appendix A. Dimensions have a set of parameters that correspond to indicators, highlight the most important characteristics of a sub-system and enable the quantification of flood resilience (Figure 8). The methodology applied in the CORFU project has been used to identify the initial set of indicators, starting from the flood risk management cycle with five elements or phases in the process, i.e., reflect, relief, resist, response and recovery. These elements cover the stages before, during and after a flood event (Figure 9). Further analysis of aforementioned elements is outside the scope of this paper but it has been provided by Batica and Gourbesville (2014) [16].
As a result of an initial analysis within the CORFU project, a matrix comprising a number of indicators has been created. The value of each indicator ranges from 0 to 5, corresponding to the description provided in Table 1.
The overall FRI value is calculated by applying the following equations:
F R I = j = 1 5 W D i × F R I D j j = 1 5 W D j ,
F R I D j = i = 1 n i W i × s i i = 1 n i W i
where FRIDj is the calculated Flood Resilience Index for a dimension, WDj and Wi the weights for dimension j and indicator i, respectively, and si the score indicating how well a city performs in the field covered by a specific indicator.
After consultations with stakeholders in the case study areas, including hands-on workshops using the Knowledge Base, the need for adjustments of the initial Flood Resilience Framework to improve intuitiveness and ease of use was identified. As a consequence, the initial total number of indicators of the FRI method (91 indicators) has been reduced to 60 (termed hereafter the PEARL Flood Resilience Index), while a few indicators have been added to the Natural dimension. Moreover, some indicators had to be further clarified.

2.2.2. Modifying Flood Resilience Index Framework and Linking Indicators with Measures

In a next phase, indicators of the PEARL Flood Resilience Index have been linked with flood resilience measures that have been identified in earlier stages. Such relationships are of the many-to-many type, denoting that indicators may be influenced by a number of measures (Figure 10). In other words, stakeholders, being aware of the poor performance of their city in a specific dimension or area, are able to identify measures, which could improve the resilience of the city in exactly those fields of interest.
A group of 15 experts was then asked to participate in an exercise aiming at assessing the importance of each PEARL FRI indicator at the city scale with respect to flood resilience. The importance was expressed by a weighting factor in a scale from 1, corresponding to less significant, to 5 for very significant. A similar assessment was undertaken for each of the five dimensions. Additionally, participants had to indicate to which flood type their answers were more suitable to, by choosing between: (a) Fluvial-pluvial flood; and (b) Coastal flood-Storm surge. The answers given by the experts have been analyzed separately for each flood type and act as the “default” weighting factors for each indicator, to be able to calculate the FRI. It is understood that these weights are subject of expert judgment and would in principle be dependent on regional, local and other characteristics. Therefore, it is planned to expand the functionality of the PEARL FRI with weighting factors entered by the end users, superseding the default values.
An interesting result of the exercise discussed above is related to the variability of the answers given by the experts. By calculating the standard deviation of the assessments, indicators have been identified for which a consensus among the experts regarding their significance could be achieved. It could be argued that these indicators are less sensitive to regional and other aspects and their significance to flood resilience can be expressed by a single weighting factor in a variety of sites. On the other hand, indicators for which the weighting assessment showed high variability need to be considered very sensitive to local parameters. Of particular interest are those indicators rated with a high weighting factor while showing low variability between the assessments of the experts, as these become the most important ones for the calculation of the FRI regardless of the site. Some of these indicators from the Institutional, Physical and Social dimensions are listed in Table 2. From the remaining two dimensions, Economic and Natural, no clear indicator has been rated with very high importance by all experts. The full list of indicators is given in Appendix B. They provide an association between FRI component and the measures that could potentially improve the resilience of coastal, flood prone regions.
Experts’ knowledge can be very important when it comes to assessing a city’s resilience against extreme events. The PEARL FRI can be used in an iterative procedure towards the identifications of the optimal measures and strategies (Figure 11).

2.2.3. Developing an Online Tool for Assessing Cities’ Resilience

To operationalize the modified PEARL FRI methodology, the PEARL FRI Tool was developed (see Figure 12). By using the tool, users are able to estimate the resilience of a city for a specific flood event (or flood type event) in five dimensions, visualize the results in a spider diagram and compare them with other cities or with other flood (type) events of the same city. The level of resilience of an urban system, as calculated by the PEARL FRI methodology, is affected by the characteristics of a specific flood event i.e., different flood depths (or durations or velocities) change the level of impact on urban functions (e.g., housing, education, transportation, etc.) and services (e.g., energy, water, communications, etc.), and consequently the overall value of the FRI and its components. It is further affected by its type, i.e., being coastal or pluvial alters the evaluation of city resilience and its dimensions.
More specifically, while the users interact with the online tool, they may start by selecting an existing city, which is stored in the database, or make a fresh start by estimating the resilience of their own city. After that, one may select one-by-one the dimensions from which the FRI consists. The names of the indicators associated with the dimension appear on the right side of the window. The size of the font of each indicator is proportional to its weight, as it has been estimated by experts for a typical pluvial or fluvial flooding. Next to the name, a slider indicates how well the city performs in the respective field. Moving the slider to the one or to the other direction changes the estimated value of the indicator, which affects the performance in the respective dimension and the overall FRI. The results can be observed immediately on the spider diagram and the FRI display.
The spider diagram enables the visual comparison of the performance of cities, which are stored in the database, in five dimensions. Users are able to see only the charts of those cities (or the different scenarios examined within a specific city) that are of interest to them and while hiding the rest from view.
After having identified the dimensions in which their city is more vulnerable to floods and the specific fields with poor performance, a user can search for measures that might improve the city’s resilience. By clicking on the name of an indicator users are navigated to a list of measures influencing this specific indicator. They may then navigate further to the page of a measure in order to obtain additional information regarding the particular measure.
The PEARL FRI Tool is capable of assisting stakeholders in identifying measures that will improve the resilience of their city. However, some points and caveats related to its use need to be highlighted: The weightings of the indicators have been assessed for typical fluvial and pluvial floods. Some of the weighting factors might have quite a different value for other types of floods such as coastal floods originating from storm surges. Moreover, the importance of some indicators may vary from one site to another and thus the default weights suggested by the PEARL FRI Tool may not always represent the local circumstances. Users are able to influence the calculation of the FRI by disabling selected indicators in case they are insignificant for their city. In this case, the score of the dimension and the FRI are calculated using the remaining active indicators. In future releases of the Tool, users will also be able to modify the default indicator weights.

2.3. Integrating the Knowledge Base with a Learning and Planning Platform

Despite the fact that the Knowledge Base can be deployed as a standalone web application, it has also been integrated with a larger framework called “The Web Learning and Planning Platform—WebLP”. The latter is a Web accessible Rich Client application that can be considered as an Integrated GIS-based Collaboration Toolbox. Its purpose is to consolidate various Flood Risk Management applications under a single end user interface and provide them with well-defined interfaces for their interaction with core platform services like 2D/3D mapping, messaging and collaboration tools for planning and interactive learning.
The platform itself is based on the Eclipse Rich Client Platform and the Open Services Gateway Initiative (OSGi) in order to provide a modular enterprise system where developers can contribute either Java based OSGi plugins or Web plugins. The Knowledge Base is integrated via this Web plugin mechanism and is able to interact with the platform’s pure Java components via a Java to Javascript and vice versa communication mechanism. This functionality is enabled by an OSGi Browser plugin (see Figure 13).
The platform is accessible to stakeholders either directly or through expert workshop facilitators and allows for the visualization of the effect of alternative choices on their risk situation and its propagation through time under different scenarios. Two roles/user profiles of the platform are considered (accessible through different user profile logins):
  • A stakeholder profile, with which stakeholders interact with the platform in real time (prior and during the workshops), make decisions (from a wide, pre-computed set of options) and investigate/visualize their impacts under different scenarios for their own case.
  • An expert profile, with which expert facilitators (or stakeholder consultants) use the full functionality of the platform to setup and evaluate new scenarios using models, algorithms and datasets that are accessible through the platform.
Web plugin developers with suitable rights are able to register their plugin into the platform, test it and subsequently make it available to either user groups or individual platform users. Selected results from the execution of different Web plugins are depicted in Figure 14 and Figure 15.
Figure 15 in particular shows the integration of the Flood Resilience Index (FRI) Application (see also Section 2.2), developed for the PEAL KB as a remote plugin in Web Learning and Planning (WebLP). The methodology used and the underlying technology allows the development of the application in one place, eliminating duplicate code. New published versions of the FRI application are automatically adopted in both systems.

2.4. Testing the Methodological Framework in Two Case Studies

The PEARL KB and the PEARL KB FRI Tool in particular have been tested in two case studies facing different flood problems, for which a brief description is provided below. During tools implementation different local stakeholders were involved.
Case 1: The City of Rethymno, Greece
For the city of Rethymno (Figure 16), multiple stressors have always posed flood threats. The terrain and streams morphology convey volumes of storm water runoff from the upstream rural areas to the highly urbanized, flat downstream zones, pressurizing the drainage facilities and the flood defense infrastructures. The dominant strong northern and northwestern winds highly affect the exposed coastal zone and result in the development of waves, which often overtop the harbor infrastructure and erode recreational beaches. Historic floods (1969–1999) led to adverse human, material, economic and environmental effects and eventually to the selection of prevention and mitigation measures, e.g., arrangement and diversion of streams and torrents, construction of circular storm water drainage collectors, internal-primary drainage network and flood control dams. Nevertheless, both the urban and coastal areas are still subject to flood problems, e.g., extensive damages to windward breakwaters of the harbor and backwater effects at drainage network outfalls as experienced during recent flood events (2010–2015). As such, it was suggested that providing suitable tools to the City Authorities, would support a more interactive, inclusive and forward looking decision making, against flood related challenges that coastal communities face, giving also thought to the evolution and growth of urban systems as well local stakeholders’ perspectives, needs and ambitions [17].
Case 2: Les Boucholeurs, France
Another case study area is Les Boucholeurs, a fishing district located in the south part of Chatelaillon-Plage, a commune of Charente-Maritime department located in the south west of France. Its importance for the PEARL project raises from a coastal extreme flood event formed due to high waves and a storm surge, occurred on February 2010. The magnitude of this event was devastating for population since the storm surge height reached 1.6 m, further to the approximately 2.75 m sea level rise caused by the tide phenomena. The rare extreme event Xynthia occurred early in the morning of 28th February 2010 as a result of atmospheric depression created on 27th February morning. The storm hit the west coast of France resulting to large-scale floods and causing huge damages. The storm also hit neighboring countries such as Germany and the Benelux. According to the Bureau de Recherches Géologiques et Minières (BRGM), the measured level of 4.5 m General Levelling of France (NGF) recorded at la Rochelle (at the north of the case study area) has a very high return period. Up to this moment there is no official statement regarding the calculated or estimated return period of this storm.
As presented in Figure 17, the storm destroyed the oyster farm located in the shallow water along the coast line. Beside the impact on the agriculture sector, significant damages also occurred on residential areas causing failure of houses, road infrastructure, and electricity and most importantly leading to civilian casualties.
The storm Xynthia affected this small community in many aspects from physical to social. In order to assess the vulnerability of the village to future hazards, an evaluation of its resilience has been performed, based on the collected data and the FRI framework (see Section 2.2).
Case study approach
In both case studies, the FRI framework has been implemented at city scale based on information collected by desk based study, field visits and meetings/workshops with the stakeholders. Evaluation of the overall FRI was made by assigning qualitative values (1–5) to the variable status of indicators examined within this resilience framework, estimating at the same time the level of resilience for each dimension.
In the Rethymno case study in particular, local stakeholders have actively participated in the evaluation process involving representatives from municipality, port authority, water utility, civil protection, fire brigade and volunteer teams. In workshops they were requested to assess the level of resilience of their city by evaluating the different indicators per dimension using the PEARL KB FRI Tool (see Section 2.2.3). After that, users were encouraged to navigate within the online PEARL KB and explore the available measures and case studies in order to identify and indicate the measures they think would be more suitable to be implemented in Rethymno, but also to identify measures that would increase the level of resilience of each dimension and the overall resilience of the city in case they were implemented.

3. Results and Discussion

Applying the PEARL KB FRI tool at the city scale for Rethymno enabled the extraction of the following results in terms of city’s resilience and the assessment of the resilience level for each dimension (Figure 18). The overall resilience of the city of Rethymno was estimated at 1.39 for an extreme flood event. In conjunction with authorities’ perspective, Figure 18 depicts the spider diagrams resulted from the estimations of authorities while using the developed tool within workshop’s activity. Table 3 summarizes the overall values of FRI index estimated by authorities and experts, respectively.
While interpreting the results, it is apparent that the overall resilience of Rethymno city is low to moderate since most of the overall FRI values are less than 2 and that there are plenty of resilience measures and strategies to be implemented that could bring about systematic improvements to each dimension as well as to the overall resilience of the city. The most rigorous evaluation of indicators has been made by the experts compared to the overall FRI values of authorities, whereas the most optimistic estimate was provided by the “Rethymno 4” team. Such differences can be justified by the fact that the members of the aforementioned team were mostly representatives from the Institute of Geology and Mineral Exploration, an authority not directly involved in flood management procedures. Along with the expert’s estimate, representatives of the Fire Department (Rethymno 7), the Municipality and the Volunteer Team of Civil Protection (Rethymno 8) resulted in FRI values less than 1.5, i.e., in quite similar rating of indicators. The groups of people mostly consisting of representatives of the Regional Unit of Rethymno (Rethymno 5) and the Port Authority (Rethymno 2) had common perspectives regarding the overall resilience of Rethymno city and suggested an FRI of approximately 1.8.
Taking a closer look at the results, it appears that the institutional dimension has been rated with the lowest index values among all dimensions by almost all participants. Resilience of economic dimension is also considered low with values ranging from 0.76 to 1.32. Greater values of resilience are being attributed to the natural dimension with the lowest evaluation equal to 2.26 and the highest one equal to 3.21.
Comparing whether the authorities have the same perspective in terms of dimensions’ resilience, it becomes apparent that natural and economic dimension have received similar evaluations from almost all groups. On the other hand, the resilience of institutional and social dimension varies significantly. Looking closely to the estimates of Rethymno 2 and 7 in terms of the social dimension, it appears that representatives from the Port Authority indicate that Rethymno’s community possess an increased social resilience equal to 2.40, something which the Fire Department does not fully support, giving a value of 1.23 to this dimension. On the contrary, the Fire Department evaluated more positively the indicators of the institutional dimension (1.28) compared to the people from the Port Authority (0.44). It could be argued that through this result the Port Authority i.e., a structure of the Municipality communicates their high regard of and faith towards the people of Rethymno themselves, while the Fire Department communicates their high regard of the Municipal institutions.
In conjunction with experts’ evaluation, groups 7 and 8 (i.e., representatives from the Fire Department, the Civil Protection Volunteer team and the Municipality) seem to have quite similar perspectives on Rethymno’s overall resilience and the resilience per dimension.
Groups were then asked to explore available solutions included within the online KB and indicate the measures that they think would be most suitable for Rethymno. The most important measures selected along with the dimension in which they would mostly contribute if they were implemented are summarized in Table 4.
As anticipated, after exploring the repository of measures and strategies available through the KB, the participants identified measures that would enhance the more problematic resilience dimensions, i.e., the institutional and economic (see Figure 18 and Table 4). Under the physical dimension, several measures were suggested too, proving once more that engineering and structural measures are of primary importance for the flood defense and protection of a city (or at least of primary interest to the Authorities). In fact, the number and type of suggested measures, also proves that the city of Rethymno faces combination of flood problems, as stated in Section 2.4. i.e., pluvial/fluvial and coastal flooding. Measures targeting for the physical dimension are less in number, which is consistent with the fact that natural resilience is the one with the higher values according to authorities’ estimates. Raising public awareness was once more highlighted since public participation and the social dimension featured prominently in the overall resilience assessment.
A quantification of resilience through the FRI was also undertaken the French case study by using an initial version of the tool but also by taking a step further i.e., not just assessing Les Boucholeurs “baseline” flood resilience but also estimating the city’s resilience in case some measures were implemented. Specifically, the results presented in Figure 19 below show the level of flood resilience for two scenarios: (a) overall evaluation of FRI at the time of the Xynthia storm event; and (b) scenario including non-structural measures.
It is suggested that by applying non-structural measures the resilience of the region would improve by at least one scale in all three dimensions, Institutional, Economic and Social, raising also significantly the overall value of the FRI.
Figure 20 compares the resilience of the two case studies. Rethymno’s resilience (FRI: 1.39) appears to be significantly lower than the estimates for Les Boucholeurs (FRI: 2.31). A significant difference in resilience values has been identified in the Institutional and Economic dimension, whereas the values of Natural and Physical dimension are quite similar for the Greek and French case study. The marked differences between these two cities, as anticipated, are concentrated in dimensions which are related to stakeholders, internal and external organization of a city in terms of flood management procedures and in processes which deal with livelihoods and available resources including income, employment, insurances, etc. The Social dimension, the dimension that encompasses mostly citizens’ flood risk knowledge and awareness, is also lower for Rethymno compared to Les Boucholeurs. The implementation of quite a few flood protection measures, mostly engineering, in both case studies as well as their topographic and morphological characteristics resulted in higher resilience estimates in natural and physical dimension. Nevertheless, there are still improvements that can be achieved and might increase the flood resilience of both cities.

4. Conclusions

The Knowledge Base developed within the PEARL project is capable of supporting authorities and other stakeholders of coastal regions in their aim to adapt and mitigate the impacts of hazards and risks resulting from extreme hydro-meteorological events. The PEARL KB guides the users from the identification of vulnerabilities in their region, to the targeted selection of suitable measures that would improve the resilience of the urban area, while showing cases in which the selected measures have been successfully applied and linking to related knowledge evidence. Past experience from a number of related projects (e.g., CORFU, PREPARED, NWRM) and Tools (e.g., Climate App, Green-Blue Design) has been harvested in order to develop the PEARL KB and populate it with data.
The KB is based on an object-relational database, enhanced with capabilities which are common to Resource Description Framework data models, enabling the development of functionality such as pivot tables that supports efficient and targeted search of information.
The Flood Resilience Index framework originating from the CORFU project was further developed and integrated into the PEARL KB, providing a user-friendly tool for the quantification of resilience of a city and facilitating the identification of its vulnerabilities. The FRI framework has been successfully tested in two case studies involving local authorities. In the case of Rethymno, this effort was also followed, using the PEARL KB functionality, by the development of a list of suggested measures and strategies in each one of the five dimensions that would increase city’s flood resilience if they were implemented.
At the same time, parts of the Knowledge Base have been integrated as a remote plugin into PEARL’s Learning and Planning Platform, providing users with the ability to experiment and visualize the effect of alternative choices to flood risk (through modeling).
It is hoped that the above tools and frameworks provide a step towards bridging the gap between research communities and practitioners and directly support decision making processes for more resilient flood risk planning and management.

Acknowledgments

The research leading to these results has received funding from the European Union Seventh Framework Programme (FP7/2007-2013) under Grant agreement No. 603663 for the research project PEARL (Preparing for Extreme And Rare events in coastaL regions). The research and its conclusions reflect only the views of the authors and the European Union is not liable for any use that may be made of the information contained herein.

Author Contributions

For this research article, George Karavokiros and Archontia Lykou wrote the draft of the paper. Description of the Knowledge Base (KB), its integration with the Flood Resilience Index (FRI) framework and the development of the Preparing for Extreme and Rare Events in Coastal Regions Knowledge Base (PEARL KB) FRI tool has been provided by George Karavokiros, whereas Rethymno case study description, application of the FRI framework in Rethymno, analysis and description of results were provided by Archontia Lykou. Ifigenia Koutiva created the links between each indicator and the available measures. Jelena Batica included the description of the FRI framework, Les Boucholleurs case study and the application of the methodology in the French case study. Antonis Kostaridis integrated the PEARL KB with the PEARL Learning and Planning Platform and provided the corresponding analysis, while Alida Alves contributed in the attribute of measures of the KB and its population. Christos Makropoulos conceived and edited the paper and supervised all of the above research.

Conflicts of Interest

The authors declare no conflict of interest.

Abbreviations

The following abbreviations are used in this manuscript:
BRGMBureau de Recherches Géologiques et Minières
EWSEarly Warning System
FOSSFree and Open Source Software
FP77th Framework Programme
FRIFlood Resilience Index
GISGeographic Information System
HTTPHyperText Transfer Protocol
IPCCIntergovernmental Panel on Climate Change
KBKnowledge Base
KBEKnowledge Base Engine
LAALearning and Action Alliance
NGFGeneral Levelling in France
NGOsNon-Governmental Organisations
NTUANational Technical University of Athens
NWRMNatural Water Retention Measures
ORDBObject Relational Database
ORMObject-Relational Mapper
OSGiOpen Services Gateway Initiative
PEARLPreparing for Extreme And Rare events in coastal regions
WebLPWeb Learning and Planning

Appendix A

Definitions of dimensions used in the FRI methodology:
  • The natural dimension indicates inherent risk and resilience characteristics of the city. This includes topography, natural environment degradation, hydro-meteorological context and disasters.
  • The social dimension considers human resource issues, and includes population, health, education, knowledge and awareness, social capital, conflict, crime and related issues.
  • The economic dimension deals with the livelihoods and related activities and management of financial resources. Includes issues related to income, employment, expenditures, assets, access to financial services, household assets, savings, insurance, etc.
  • The institutional dimension concerns itself with organizational issues and looks at stakeholders. It includes internal and external institutions, institutional collaborations, coordination and cohesion.
  • The physical dimension gives an idea of the risk and resilience arising from construction, infrastructure and built environment. It also includes transportation systems, land use, early warning systems and evacuation plans for disaster situations.

Appendix B

Table B1. List of indicators used in the FRI component per dimension.
DimensionIndicator
ECONOMICAvailability and accessibility of financial resources
ECONOMICAvailability of financial resources for protection of transportation network
ECONOMICAssessment of financial resources management and allocation in relation to past flood events
ECONOMICAvailability of financial resources enabling the development and implementation of evacuation plans before human loss
ECONOMICAvailability of financial resources supporting rescue services
ECONOMICAvailability of resources assisting in quicker and more efficient drainage of flooded areas
ECONOMICAvailability of resources for solid waste removal and management
ECONOMICAvailability of insurance & financial services
ECONOMICDeduction of taxes of people in flooded areas
ECONOMICLegal building reconstruction/renovation for flood risk mitigation/adaptation purposes
INSTITUTIONALEmbodying flood risk in urban planning
INSTITUTIONALEmbodying climate change predictions in spatial urban planning
INSTITUTIONALLand use control
INSTITUTIONALPreservation of wetlands and green spaces
INSTITUTIONALAvailability of flood vulnerability maps
INSTITUTIONALDevelopment and availability of regulations and specifications depending zones of flood risk
INSTITUTIONALAvailability of crisis management plan with maps
INSTITUTIONALAvailability of plans for management of existing road network and protection from flood risk
INSTITUTIONALAvailability of evacuation plans with maps
INSTITUTIONALDevelopment and design of evacuation procedures based on flood risk simulations and assessment of results
INSTITUTIONALConduction of evacuation training
INSTITUTIONALAvailability and implementation of regulations enhancing adaptation/mitigation
INSTITUTIONALEstablishment of Stakeholders Committee on flood risk
INSTITUTIONALEmbodying flood risk in Building code
INSTITUTIONALLevel of implementation of Building Code
INSTITUTIONALPossibility and capability of modifying Building Code on reconstruction procedures
INSTITUTIONALLevel of implementation of Flood Directive in Local level
INSTITUTIONALAvailability of regulations defining reconstruction/renovation procedures after flood events
INSTITUTIONALExpected efficiency of the reconstruction works
NATURALLevel of discharge capacity of rivers and channels to convey peak discharges
NATURALLevel of area coverage unaffected by flood in case of 1 m river level rise above banks
NATURALLevel of area coverage with forests and dense vegetation
NATURALLevel of area coverage unaffected from wildfires the last 2 decades
NATURALLevel of area coverage unaffected by flood in case of 1 m sea level rise
PHYSICALUse of real-time monitoring system for hydraulic structures and urban drainage system
PHYSICALUse of real-time monitoring system in the river network
PHYSICALUse of an Early Warning System (EWS)
PHYSICALSupport of announcements (e.g., via email, SMS) to target groups by the EWS
PHYSICALLevel of accessibility of roads which are important for solid waste management and transportation network
PHYSICALAvailability and level of accessibility of emergency road network
PHYSICALAvailability and level of accessibility of emergency shelters
PHYSICALInfiltration capacity of paved areas to reduce runoff
PHYSICALSufficient storage capacity of the urban drainage system to accept flood water
PHYSICALLevel of floodwater retention and detention
PHYSICALAvailability of flood-proofing constructions of strategic infrastructures
PHYSICALLevel of protection of crisis management center and rescue services
PHYSICALAvailability of hydraulic structures within urban system capable to reduce peak discharges
PHYSICALAvailability of hydraulic structures for river watershed management capable to reduce peak discharges
PHYSICALAvailability of emergency evacuation routes
PHYSICALAvailability and level of spatial coverage of emergency communication systems
PHYSICALAvailability of GIS based information system for stakeholders
SOCIALFlood risk education
SOCIALActive involvement and support of citizens in flood risk related activities
SOCIALInformal coordination of citizens’ actions within community
SOCIALMultidisciplinary knowledge exchange (engineer, architect/urban planner, sociologist, economist, politician—city government, etc.)
SOCIALResponsible authorities learning and adapting from previous events
SOCIALCitizens learning and adapting from previous events
SOCIALAvailability of trained volunteers

References

  1. Panel on Climate Change (IPCC). Glossary of terms. In Managing the Risks of Extreme Events and Disasters to Advance Climate Change Adaptation; Field, C.B., Barros, V.R., Stocker, T.F., Qin, D., Dokken, D.J., Ebi, K.L., Mastrandrea, M.D., Mach, K.J., Plattner, G.-K., Allen, S.K., et al., Eds.; Cambridge University Press: New York, NY, USA, 2012; pp. 555–564. [Google Scholar]
  2. Deliverable 3.1: Holistic and Multiple Risk Assessment Framework, PEARL Project (FP7-ENVIRONMENT—603663). Available online: http://www.pearl-fp7.eu/about-pearl/wp/wp3/ (accessed on 3 September 2016).
  3. United Nations Development Programme (UNDP). Human Development Report 2014. Sustaining Human Progress: Reducing Vulnerabilities and Building Resilience; United Nations Development Programme (UNDP): New York, NY, USA, 2014. [Google Scholar]
  4. Bahadur, A.; Wilkinson, E.; Tanner, T. Measuring resilience: An analytical review (under review). Clim. Dev. 2015. [Google Scholar] [CrossRef]
  5. Lisa, E.; Schipper, F.; Langston, L. A Comparative Overview of Resilience Measurement Frameworks: Analysing Indicators and Approaches; Overseas Development Institute: London, UK, 2015. [Google Scholar]
  6. Batica, J.; Gourbesville, P.; Hu, F.Y. Methodology for Flood Resilience Index. In Proceedings of the International Conference on Flood Resilience: Experiences in Asia and Europe, Exeter, UK, 5–7 September 2013.
  7. CORFU Project, Official Web Site. Available online: http://www.corfu7.eu/ (accessed on 10 January 2016).
  8. PEARL Project, Official Web Site. Available online: http://www.pearl-fp7.eu/ (accessed on 10 January 2016).
  9. The European NWRM Platform. Available online: http://nwrm.eu/ (accessed on 8 January 2016).
  10. PREPARED Project, Official Web Site. Available online: http://prepared-fp7.eu/ (accessed on 15 January 2016).
  11. Climate App. Available online: http://www.climateapp.nl/ (accessed on 15 January 2016).
  12. Urban Green-Blue Grids for Sustainable and Resilient Cities. Available online: http://www.urbangreenbluegrids.com/ (accessed on 15 January 2016).
  13. Levenshtein, V. Binary codes capable of correcting deletions, insertions, and reversals. Sov. Phys. Dokl. 1966, 10, 707–710. [Google Scholar]
  14. The SUStainable DRAINage Systems (Susdrain) Website. Available online: http://www.susdrain.org/ (accessed on 15 January 2016).
  15. Ogunyoye, F.; Stevens, R.; Underwood, S. Delivering Benefits through Evidence: Temporay Demountable Flood Protection Guide; Environament Agency: Bristol, UK, 2011.
  16. Batica, J.; Gourbesville, P. Flood Resilience Index—Methodology and Application. In Proceedings of the 11th International Conference on Hydroinformatics, New York, NY, USA, 2014.
  17. RISC-KIT and PEARL Consortium. Disaster Risk Reduction Strategies in EU Coastal Areas, RISC-KIT Project (FP7-ENVIRONMENT—603458) and PEARL Project (FP7-ENVIRONMENT—603663). Available online: http://www.pearl-fp7.eu/portfolio-item/pb_drrstrategy/ (accessed on 7 September 2016).
Figure 1. Basic architectural design of the Knowledge Base and main technologies used.
Water 08 00392 g001
Figure 2. Common website navigation paths.
Water 08 00392 g002
Figure 3. Selection of resilience measures by applying filters.
Water 08 00392 g003
Figure 4. Navigating through the repository of measures.
Water 08 00392 g004
Figure 5. Exploring applications of measure(s) implemented all over the world.
Water 08 00392 g005
Figure 6. Example of an object detail page.
Water 08 00392 g006
Figure 7. Example of a pivot table showing the number of case studies that meet certain criteria.
Water 08 00392 g007
Figure 8. Flood resilience assessment created for macro scale Flood Resilience Index evaluation (reprinted from “Flood Resilience Index—Methodology and Application” by Batica and Gourbesville (2014), p. 7, Figure 3).
Water 08 00392 g008
Figure 9. Defined elements for flood risk management cycle—CORFU project (reprinted from “Flood Resilience Index—Methodology and Application” by Batica and Gourbesville (2014), p. 3, Figure 1).
Water 08 00392 g009
Figure 10. Mind map linking indicators per dimension with resilience measures.
Water 08 00392 g010
Figure 11. Integrating PEARL KB with FRI while incorporating experts’ and stakeholders’ knowledge.
Water 08 00392 g011
Figure 12. Main web page of the PEARL FRI Tool.
Water 08 00392 g012
Figure 13. The Web Learning and Planning platform modular architecture.
Water 08 00392 g013
Figure 14. Flood risk results on the 3D map component for a particular case study area.
Water 08 00392 g014
Figure 15. Selection and execution of the Flood Resilience Index web plugin.
Water 08 00392 g015
Figure 16. Rethymno city under study and its location on the island of Crete, Greece.
Water 08 00392 g016
Figure 17. Satellite images documenting the change of landscape in the commune Les Boucholeurs due to Xynthia storm: (a) October 2006 (before the storm); and (b) October 2010 (after the storm).
Water 08 00392 g017
Figure 18. Spider diagram of Rethymno’s resilience for extreme flood events.
Water 08 00392 g018
Figure 19. (a) Spider diagram of Les Boucholeurs for Xynthia extreme event; and (b) spider diagram of Les Boucholeurs assuming that non-structural measures have been implemented.
Water 08 00392 g019
Figure 20. Comparing flood resilience of Rethymno and Les Boucholeurs case study.
Water 08 00392 g020
Table 1. Scales for Flood Resilience Index.
Very low 0–2The activities are not clear and coherent in an overall flood risk management plan. Awareness of important issues is very low as well as the motivation to address them. Interventions have a short-term character. Actions are limited to crisis response.
Low 2–3Awareness of the issues and motivation to address them exist. Capacity building of human resources remains limited. Capacity to act is improved and substantial. Interventions are more numerous and long-term. There is development and implementation of solutions.
Medium 3–4Integration and implementation of solutions is at a high level. Interventions are extensive, covering all main aspects of the “problem” and they are part of a coherent long-term strategy.
High 4–5A ”culture of safety” exists among all stakeholders, where the resilience concept is embedded in all relevant policies, planning, practice, attitudes and behavior.
Table 2. Indicators rated with the highest weighting factor and showing low variability for the fluvial/pluvial flood type.
DimensionIndicator
INSTITUTIONALEmbodying flood risk in urban planning
INSTITUTIONALLand use control
INSTITUTIONALAvailability of flood vulnerability maps
INSTITUTIONALAvailability and implementation of regulations enhancing adaptation/mitigation
PHYSICALSufficient storage capacity of the urban drainage system to accept flood water
PHYSICALLevel of floodwater retention and detention
PHYSICALUse of an Early Warning System (EWS)
PHYSICALSupport of announcements (e.g., via email, SMS) to target groups by the EWS
PHYSICALAvailability and level of accessibility of emergency shelters
PHYSICALAvailability of hydraulic structures for river watershed management capable to reduce peak discharges
PHYSICALAvailability of flood-proofing constructions of strategic infrastructures
SOCIALResponsible authorities learning and adapting from previous events
SOCIALFlood risk education
SOCIALMultidisciplinary knowledge exchange (engineer, architect/urban planner, sociologist, economist, politician—city government, etc.)
SOCIALCitizens learning and adapting from previous events
SOCIALActive involvement and support of citizens in flood risk related activities
Table 3. FRI for the city scale of Rethymno.
Name of GroupAuthorities’ FRIExpert’s FRI
Rethymno 21.701.39
Rethymno 42.35
Rethymno 51.86
Rethymno 71.53
Rethymno 81.44
Table 4. Suggested measures from authorities that would increase resilience per dimension if implemented.
Dimension 1Suggested Measures and/or Strategy
NaturalAfforestation and improvement of soil infiltration capacity of upstream rural areas
Polder
PhysicalFloodwall
Artificial reef breakwaters
Artificial sand dunes and dune rehabilitation
Maintenance of hydraulic structures of the storm drainage system
Disconnecting paved surface from sewer system
Storm water retention tanks
InstitutionalEvacuation plan
Municipal plan of protection
Flood forecast and early warning systems
Inter-municipal flood alert exercises
Monitoring and flood forecasting through partnerships
Land use plan/spatial planning
Flood hazard mapping
EconomicBudget diversion
Sponsorships
International loan
Reserve funds
Government debt instrument
Emergency supplies and utilities
SocialUse of social media
Public awareness, information, education and communication
Flood alert exercise for citizens
Note: 1 Dimension for which the implementation of measure contributes.

