1. Introduction
1.1. Background
Despite the great achievements in flood mitigation and protection over the last two decades, the cities around the world continue to be affected by increasingly disastrous manifestations of floods and flood-related disasters. Such events occur almost daily [
1,
2,
3,
4]. However, these events are not the result of nature related processes alone. They are directly attributable to the actions of human beings and sociotechnical interactions that shape these processes [
5,
6,
7,
8]. Therefore, the search for optimal solutions is a great challenge for researchers and practitioners [
9,
10,
11]. The conceptual framework for holistic risk assessment which assumes the existence of co-evolutionary nonlinear interactions between the ever changing social, technical, and natural processes has been described in [
12,
13].
In view of the above, urban growth represents an important tendency in the current century, mainly in small and medium cities of developing countries. This tendency leads to an increment of impervious areas, producing changes of hydrological patterns and the increase of runoff volumes and peak discharges. Moreover, changes in rainfall distribution are also related to the higher urbanization that affects microclimates. In addition, recent studies suggest future increase of rainfall intensities due to climate change [
14,
15,
16,
17]. These factors highlight the necessity of efficient and adaptive urban drainage systems, capable of coping with an uncertain future.
Traditional drainage solutions are based on efficient collection and fast conveyance of runoff through pipe systems [
18]. Over the last years, these solutions have been recognized as inappropriate to reach long-term sustainable drainage systems. New tendencies are focused on decentralized alternatives in a long-term planning framework including the use of Green Infrastructure (GI), or sustainable practices (or measures), for stormwater management. These new trends offer sustainable and adaptive strategies in front of an unknown future, exposed to climate variability and urban dynamics [
19,
20,
21].
The application of sustainable practices in places where a drainage system already exists is referred to as retrofitting. Currently, retrofitting approaches in urban water management combine GI with conventional pipe systems, increasing the drainage capacity of existing systems through the use of these practices. However, an important restriction for GI application in urban areas is the low availability of space to place them. Another obstacle is the difficulty of decision-making, based mainly on lack of information and physical complexity of urban drainage systems, which makes it difficult to select innovative drainage technologies. As a result, these technologies should be carefully evaluated and selected by taking local aspects into account [
19,
22,
23].
The benefits of applying sustainable drainage practices have been widely documented [
18,
19,
24,
25,
26]. Among these benefits is the reduction in Combined Sewer Overflows (CSO), reached through the minimization of runoff that enters combined sewer systems. Therefore, the reduction of runoff implies the mitigation of one of the major water quality threats, reducing the amount of polluted water that goes into receiving water bodies. In fact, this is particularly important because of the hazard originated in CSO through bacteriological and pathogenic contamination, and its connection with water-related diseases [
22,
25,
27]. US EPA developed programs for CSO abatement, Roseen et al. [
25] present several cases in which economic analysis comparing the use of grey and green/grey infrastructure to achieve those regulation requirements were performed, concluding that the use of combined green/grey structures to manage combined sewage systems is the most convenient option.
This study aims to develop a methodology that can be used to evaluate different green-grey infrastructure configurations for retrofitting urban drainage systems. The approach is based on hydrodynamic modelling and optimization methods, and the main objective is the development of a useful framework for decision-making processes. The methodology is applied to a case study in Montevideo, Uruguay, by modelling an urban watershed and evaluating the effects of different strategies on runoff reduction and CSO discharge reduction.
1.2. GI in Stormwater Management
Many authors distinguish between Best Management Practices (BMPs) and Low Impact Development (LID) approaches. According to them, LID techniques preserve pre-development hydrology conditions and apply source control through small scale and decentralized solutions for runoff management, while BMPs are defined as practices and structures more centralized and oriented to runoff pollution control [
18,
28,
29,
30,
31]. According to Fletcher et al. [
31], the term GI is used equivalently with BMPs and LID, and it is a concept that goes beyond stormwater management, influencing urban planning and maximizing benefits of their implementation. These authors define GI as a network of decentralized practices (or measures) that enhances sustainability in cities, as opposite of grey infrastructures that use pipes and underground structures with the only objective of stormwater management. In this work, the terminology GI is used as synonym of sustainable/decentralized practices, while grey/centralized technologies are represented by underground storage tanks.
Current approaches for urban drainage management consider urban planning aspects, in order to achieve more robust and holistic solutions [
19,
32]. This is a key factor, considering that some of the main limitations for implementing GI are spatial restrictions and physical site conditions (e.g., soil type or terrain slope). Hence, several features should be taken into account when selecting such practices, for instance the applicability and effectiveness of the approach in each case [
33]. Consequently, the definition of methodologies for selecting GI is important in order to choose realistic practices, especially in urban areas.
1.3. Urban Drainage Modelling and Optimization
Hydrodynamic models and optimization techniques are promising tools when facing the difficulties of decision making processes for stormwater management [
34]. However, there are numerous issues associated with data and flood models, and so they require careful consideration see for example [
35,
36,
37,
38,
39,
40,
41,
42,
43,
44].
In accordance to Obropta and Kardos [
45] stormwater models are particularly useful for CSO management, BMP evaluation, and the assessment of impacts of land use changes. The present work uses the USEPA's hydrodynamic model Storm Water Management Model (SWMM). It is a dynamic hydrology-hydraulic and water quality simulation model, which includes the capability to model five different LID techniques [
46].
Since decision processes concerning urban drainage systems include the evaluation of several objectives, often contradictory among themselves, the use of multi-objective optimization techniques proves convenient [
27]. This approach is concerned with the search for best possible solutions considering different objectives, in a defined domain and under defined constraints. The result is a set of optimal solutions visualized through Pareto fronts [
9,
10,
47]. Pareto representation of optimal solutions can be used as a tool for decision-making processes regarding urban drainage solutions. This is an advantage of Multi-Objective Optimization (MOO) over single objective optimization techniques [
48].
The optimization algorithm used in this work is the Non-dominated Sorting Genetic Algorithm II (NSGA-II). It is an improved version of NSGA, proposed by Srinivas and Deb [
49]. This method falls into the group of evolutionary algorithms and achieves a better spread of solutions and convergence than other approaches [
50].
1.4. The Use of Hydrodynamic and Optimization Models for Evaluation of Green-Grey Practices
Several authors studied methods to evaluate and select GI configurations. For instance, Damodaram et al. [
30] apply a combination of solutions in a highly urbanized watershed, finding that decentralized measures are good to cope with small storms, while centralized solutions perform better in case of larger events. In a later study, Damodaram et al. [
51] present a methodology to select the location of solutions, based on simulation and single objective optimization.
In a more recent study, Jia et al. [
52] proposed a method for LID-BMPs planning and analysis using a decision support tool to assess different scenarios, obtaining optimal solution for each case. In another study, Oraei et al. [
53] considered BMPs for urban runoff management using SWMM modelling and NSGA-II, taking into account runoff quantity and quality improvements as objectives. The study of [
54] couples SWMM5 with NSGA-II to size and distribute drainage solutions, using decentralized and centralized measures for flood reduction, considering cost minimization and enhancement of ecosystem services. In another work, Zhang et al. [
55] applied multi-objective optimization to identify cost-effective practices in a watershed to be developed. Finally, Ahiablame et al. [
56] presented a review of effectiveness of sustainable measures and among the gaps identified they call for the necessity of watershed and regional scale evaluations, and the development of practical decision making tools.
There is little work published about the use of hydrodynamic models combined with multi-objective optimization for evaluation and comparison of different configurations of green-grey practices and their effects. So far, it has not been defined as a methodology for retrofitting urbanized watersheds, in particular with the objective of reducing CSO discharges. Therefore, the main objective of this work is to progress with developments in this area and to develop a framework that can assist in decision-making processes for improving the function of urban drainage systems.
2. Materials and Methods
A methodology which combines the hydrodynamic model SWMM version 5.0 [
46] and the genetic optimization algorithm NSGA-II [
50] for the purpose of selecting optimal solutions for urban drainage systems within a multi-objective framework is developed and applied in the present work.
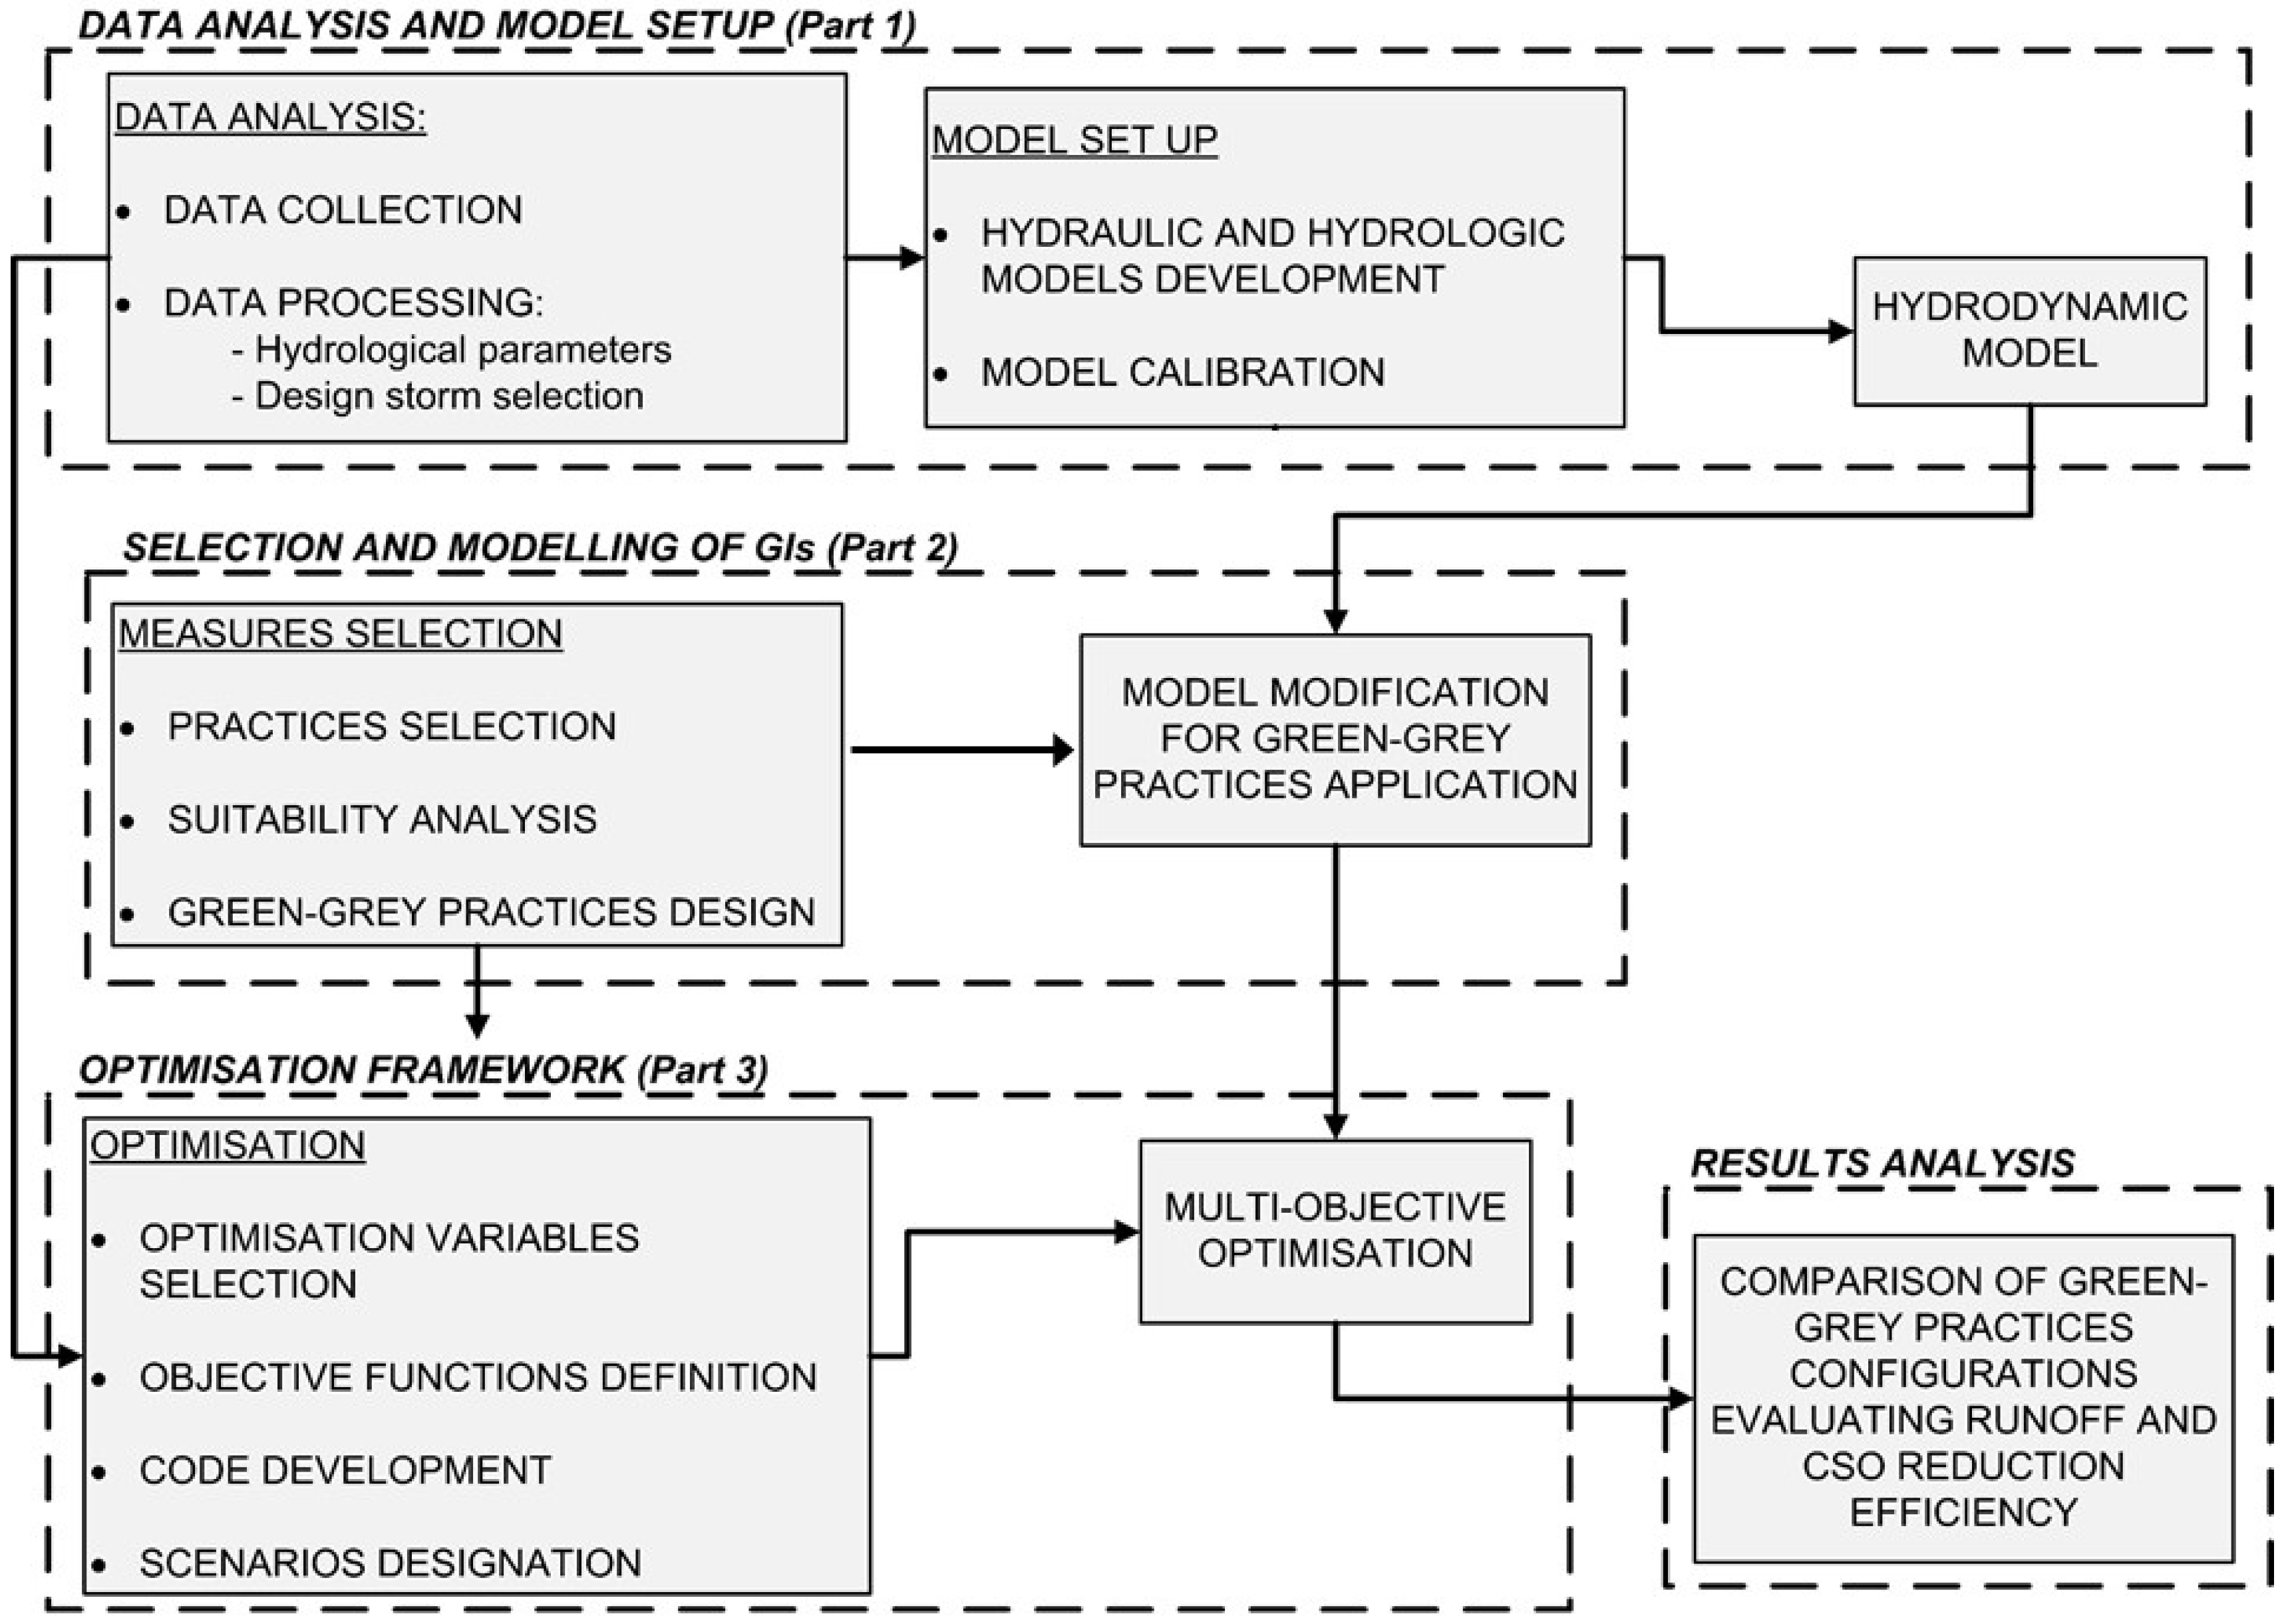
The overall methodology is illustrated in
Figure 1 and it includes three main parts:
Part 1: Data analysis and model setup.
Part 2: Selection and modelling of GIs.
Part 3: Optimization framework.
2.1. Data Analysis and Model Setup (Part 1)
The first part of the proposed methodology is concerned with data analysis and model setup activities. The necessary data include physical and hydrological characteristics of the case study area (e.g., land use, soil type, and topography), rainfall data, and drainage system data. In addition, a data set that can be used for model calibration purposes is also necessary.
Several studies were evaluated prior to selecting the rainfall event for analysis, concluding that, in general, numerous events with different return periods or long-term rainfall data are used to design and evaluate sustainable drainage systems [
54,
57,
58,
59]. However, it is important to note that the optimization procedure requires considerable computational time and therefore it will be more practical to select and apply a single event. The procedure for selection of such event can be performed by using continuous rainfall data and studying its correlation with CSO events. First, the historical rainfall data need to be analysed in order to identify the duration and return period of each storm. Thereafter, continuous hydrodynamic model simulations can be run using the same rainfall data to assess the CSO spills. Such a procedure allows us to identify those rainfall events that lead to occurrence of CSOs and which can be applied in the optimization procedure.
2.2. Selection and Modelling of GIs (Part 2)
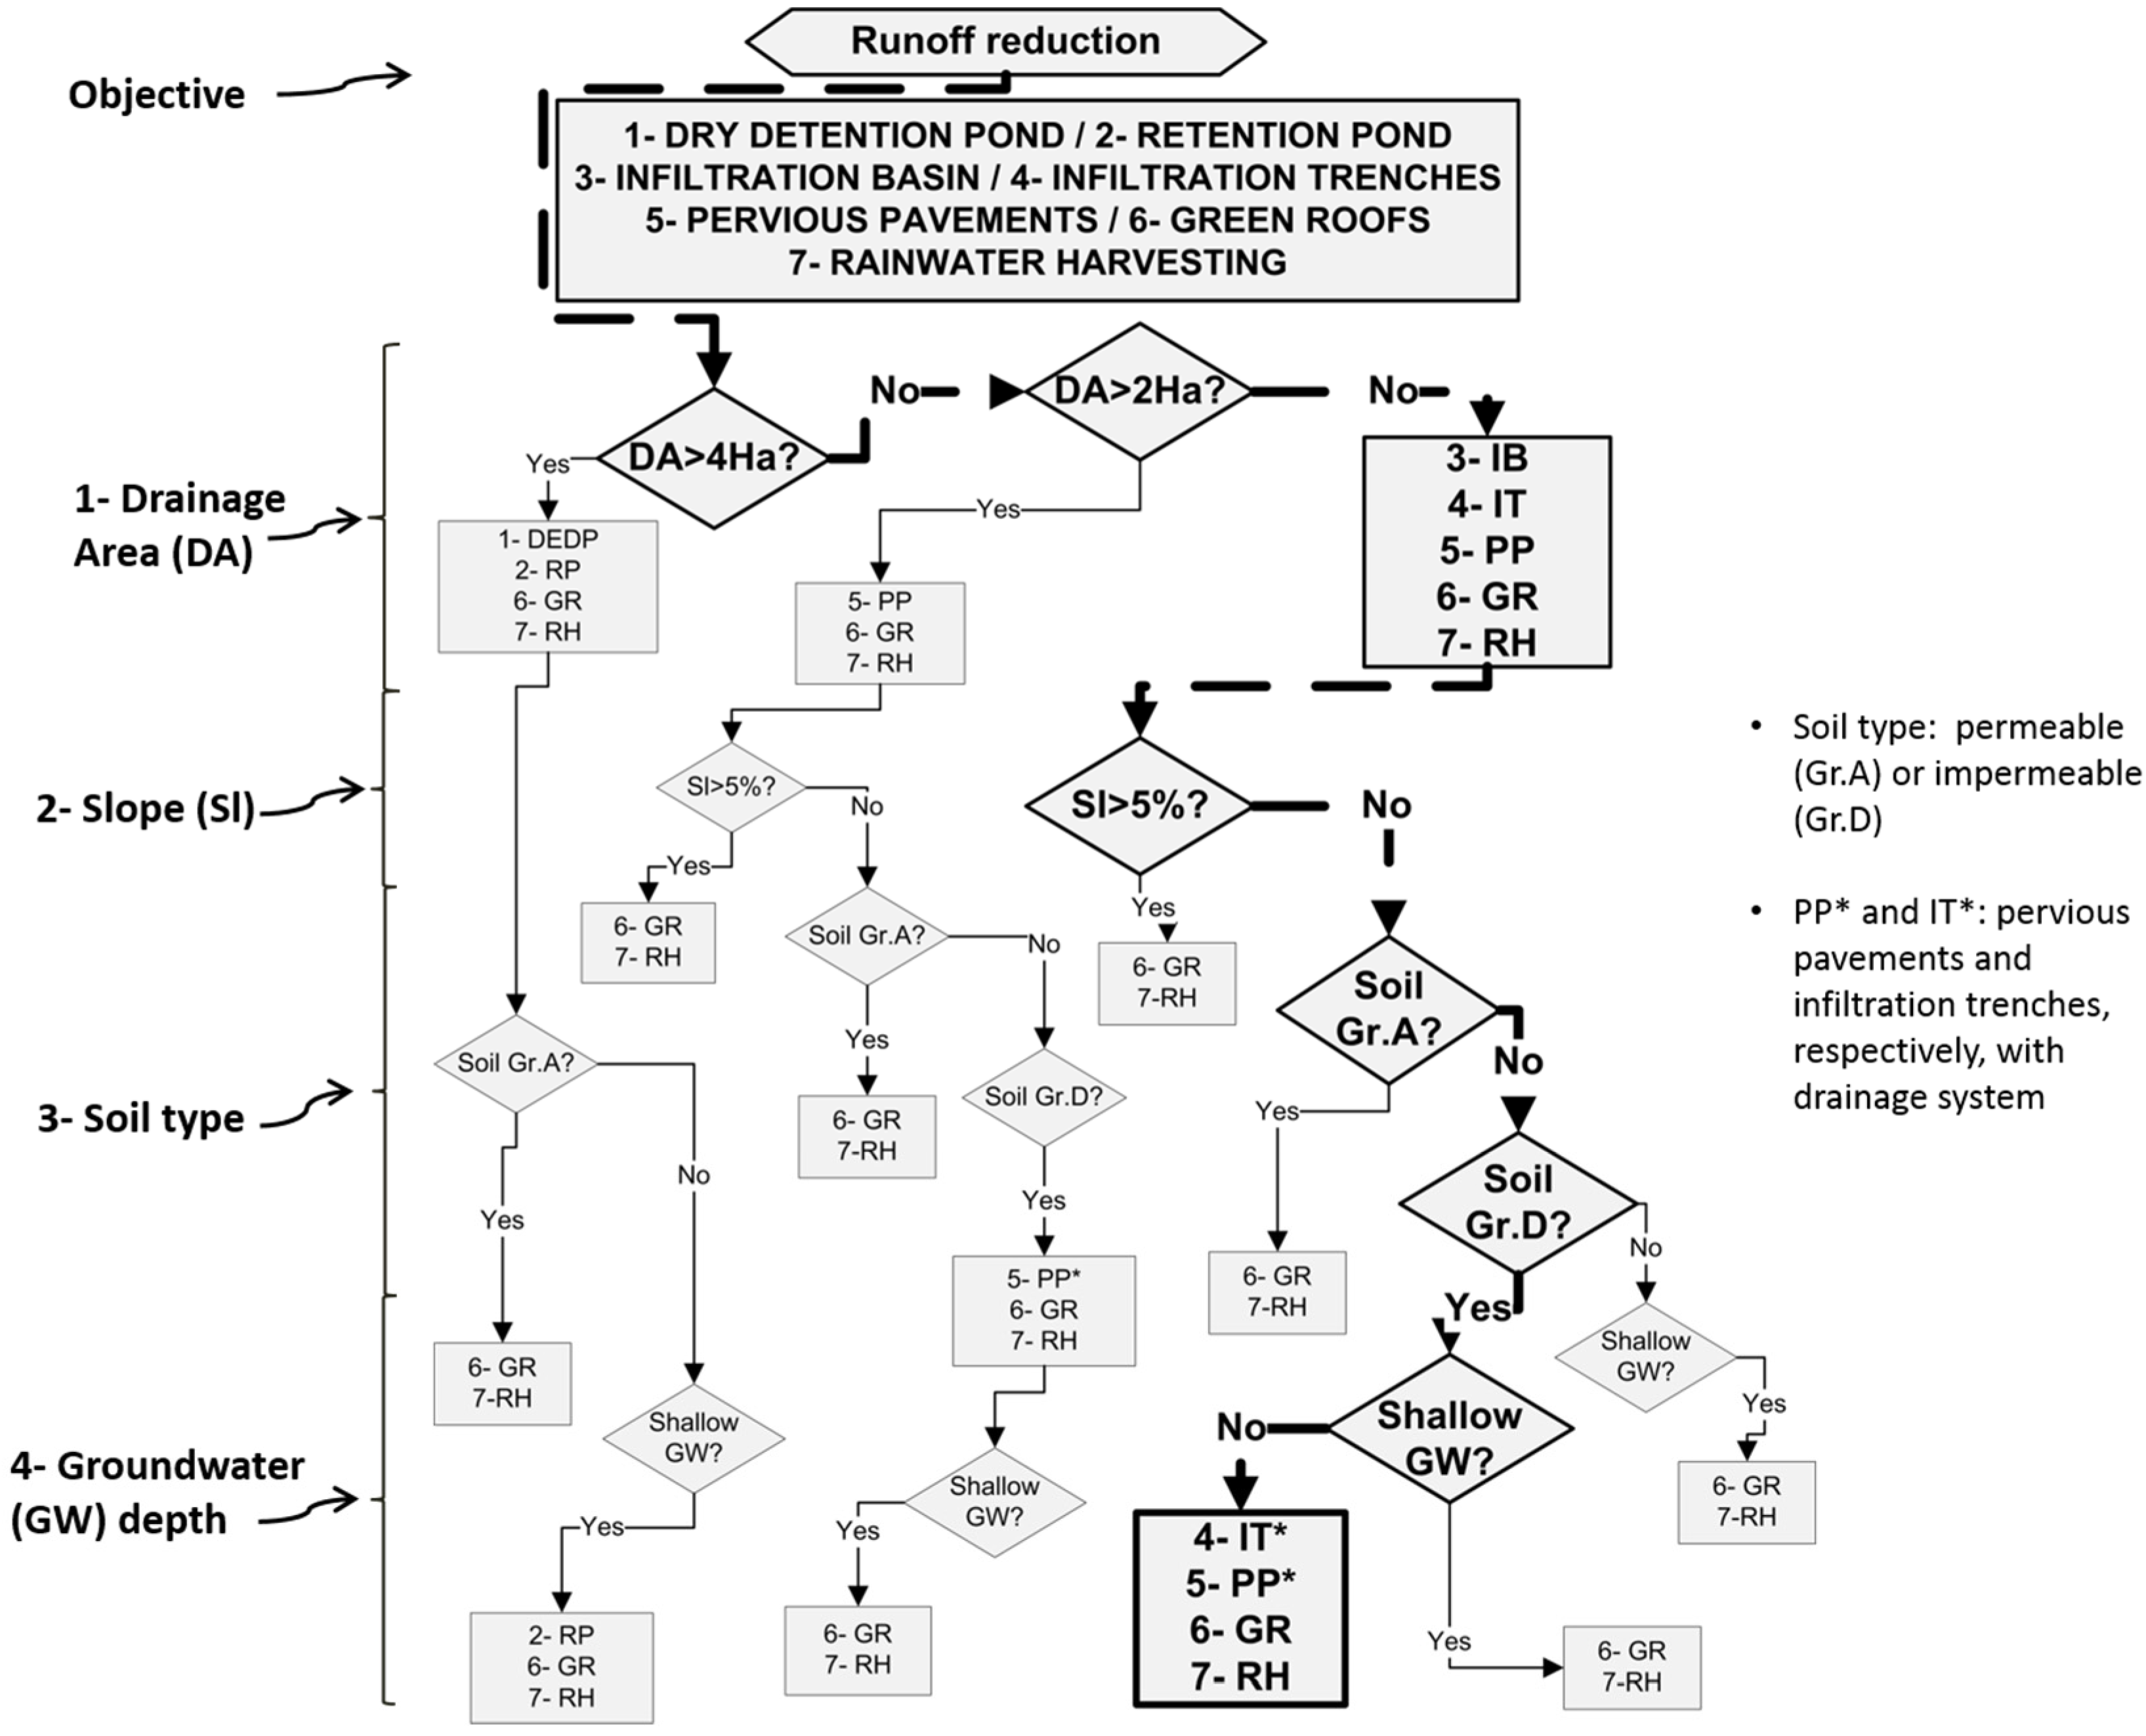
For the GIs, selection a decision tree is developed using information about applicability and effectiveness of different possible measures [
33]. Further to UDFCD [
29], several factors are considered in the development of such decision tree.
Figure 2 depicts a generic decision tree, which can be applied for GIs selection.
Step 1 in the decision tree in
Figure 2 concerns the size of the drainage area, or area contributing to the structure. Step 2 takes into account the terrain slope since this can be the limitation to implement certain practices (e.g., pervious pavements). Step 3 involves evaluation of soil’s infiltration capacity in accordance to different classes of permeability identified as Group A (Gr.A) or D (Gr.D) respectively, see also [
60]. The final step (i.e., Step 4) considers the groundwater depth in the area. The outcome from the decision tree is a group of recommended practices for a given watershed.
Following selection of GIs, a deeper analysis of local conditions would be necessary in order to determine the suitability and constraints for their local application. This can be performed by using local data and spatial analysis to determine the minimum and maximum application values for each practice. Examples of relevant local conditions are, for instance, the availability of adequate roads and roofs to implement pervious pavements and green roofs respectively.
An initial design of the structures can be developed once the GIs are selected and their limits of applicability established. Unitary costs are calculated for the initial design and expressed as cost per unit of area or volume, considering investment and maintenance costs as present net value for the lifespan of the structure.
The selected GIs need to be included into the hydrological model. In the case of SWMM model, there are two options for modelling GIs. One is by using the LID Controls module and the second one is by adding new watersheds which are completely covered by each measure [
46]. The second option was applied in the present work. With this approach, any increment on a particular GI coverage (which is the increment of area for the subwatershed totally covered for this GI) causes an equal reduction of area for the corresponding original watershed. In addition, for simulation of grey or centralized measures (e.g., storage tanks) the model allows for direct addition of tanks.
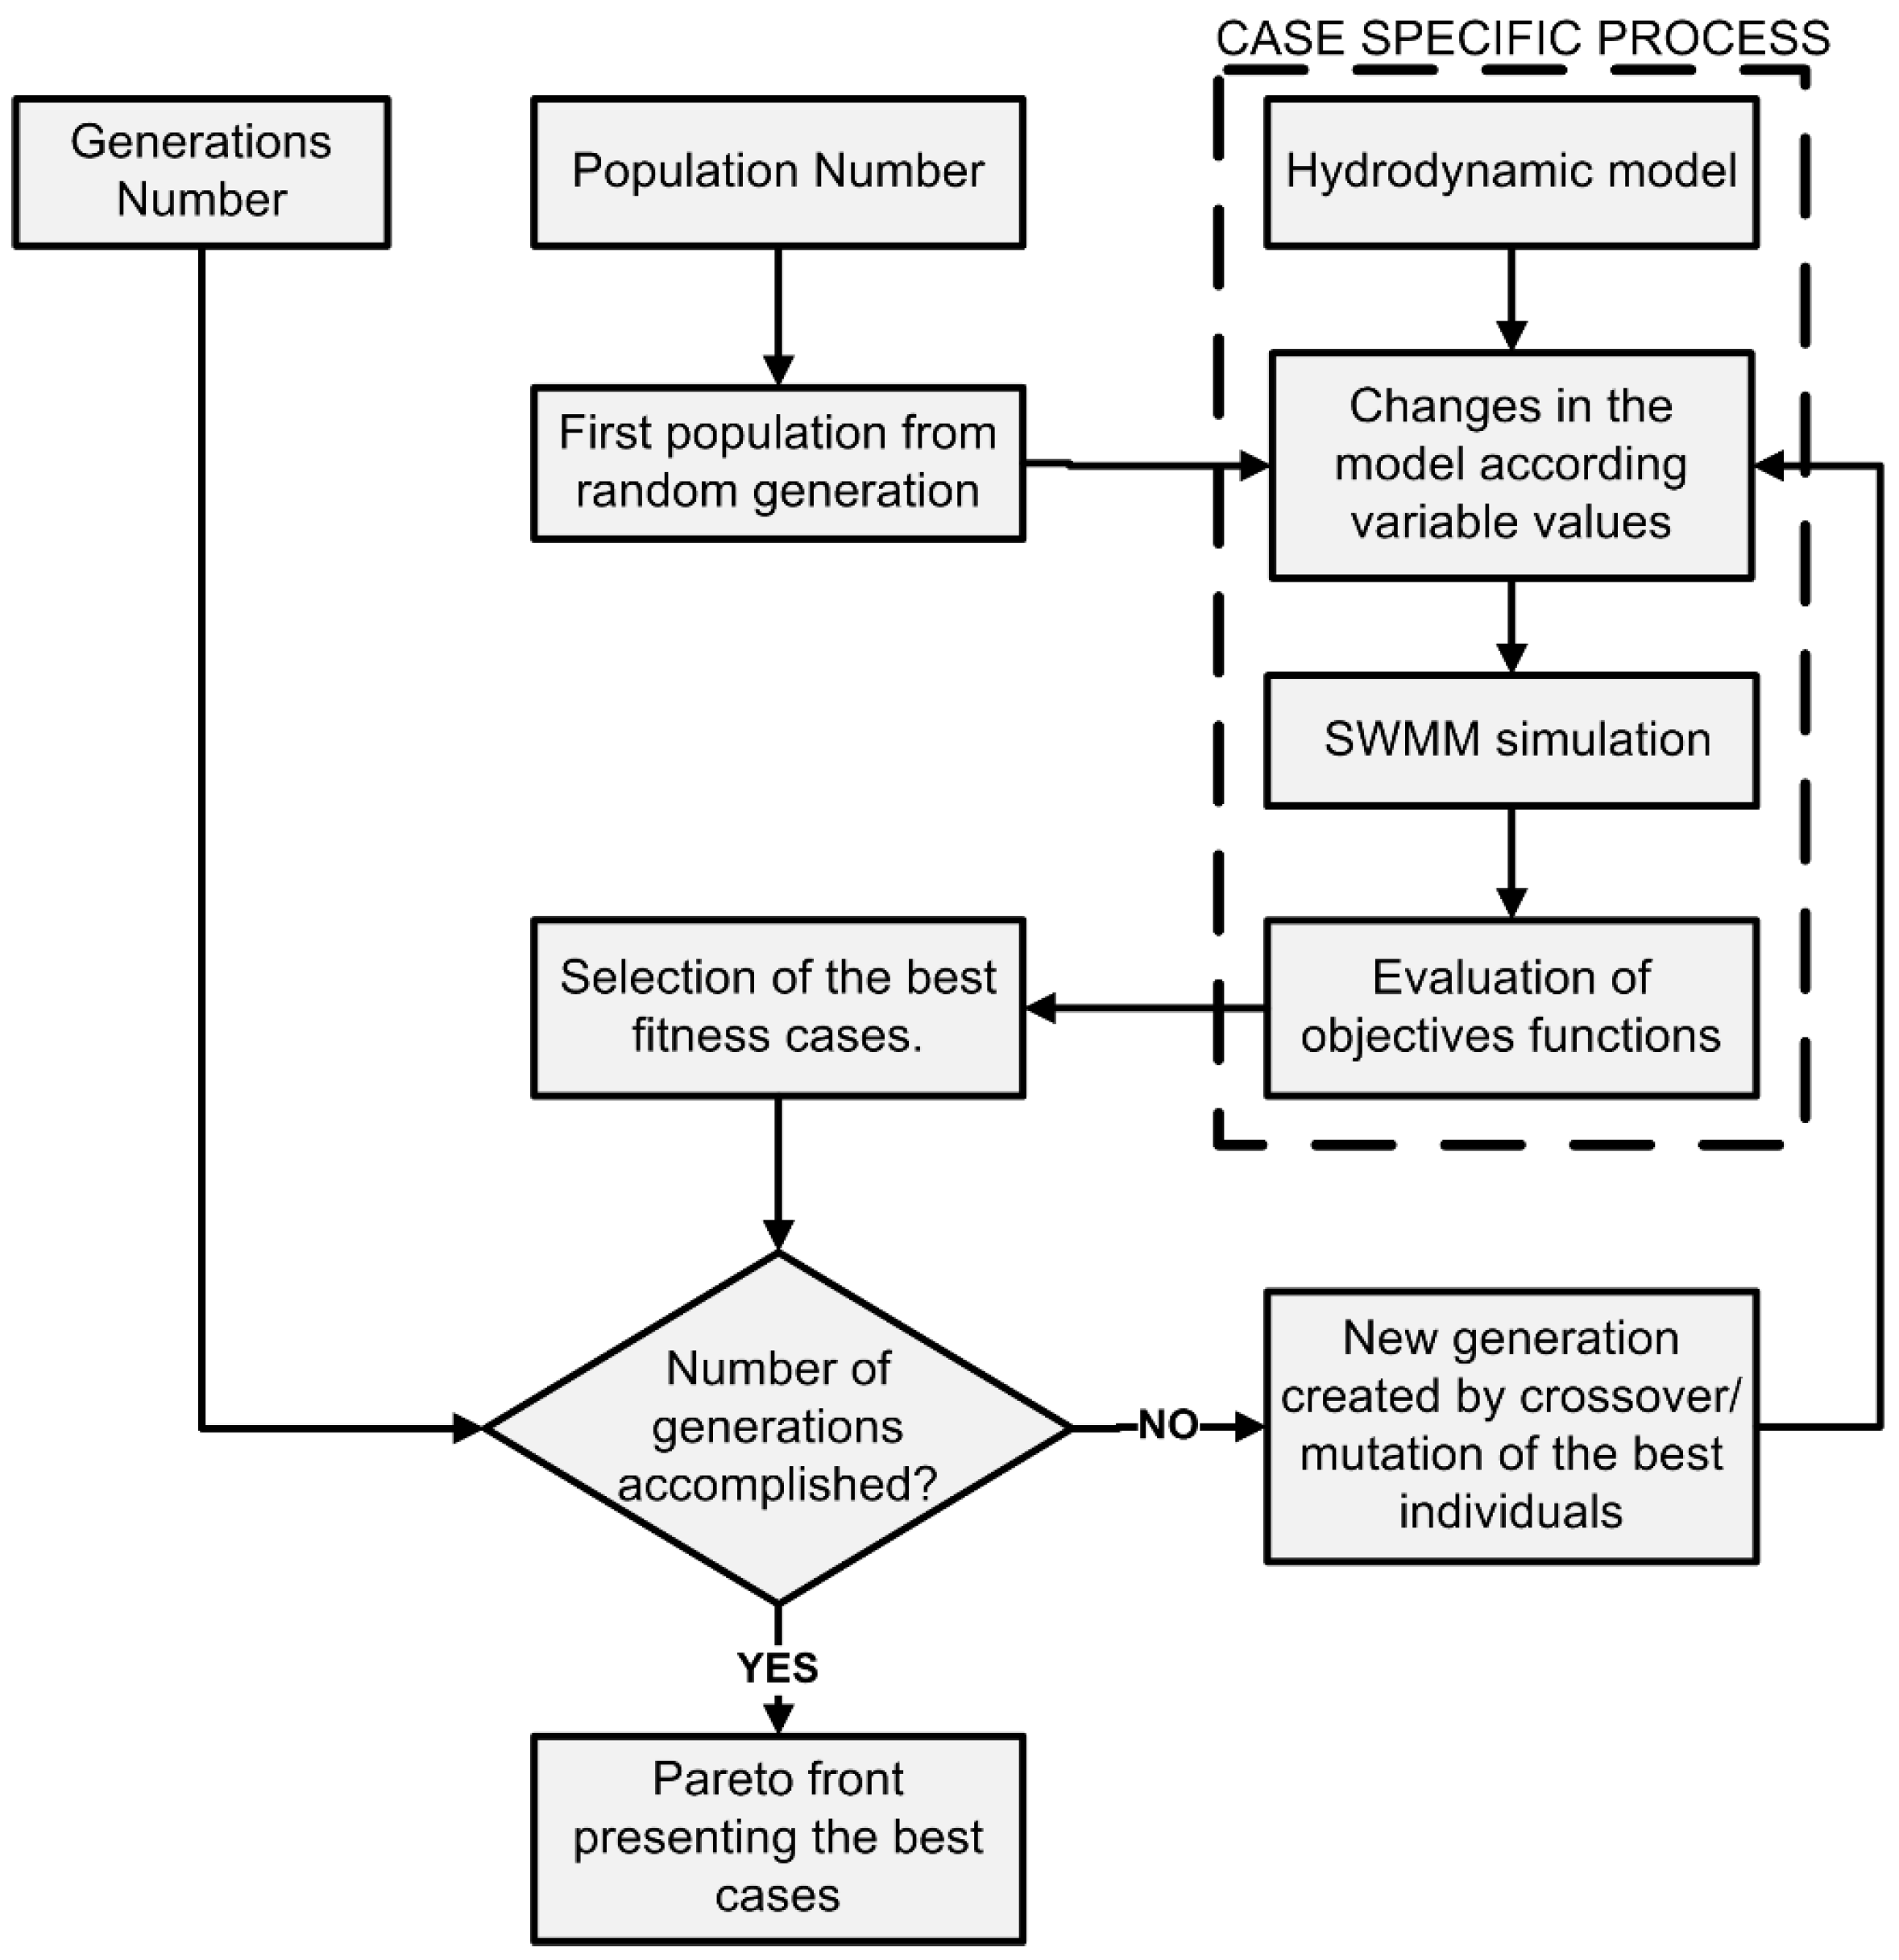
2.3. Optimization Framework (Part 3)
The optimization framework developed and applied in the present work is depicted in
Figure 3. This framework was developed to achieve optimal cost-benefit solutions through evaluation and comparison of different drainage system configurations. This framework necessitates formulation of objective function, decision variables, and constraints.
The objective functions can be defined as cost minimization and the minimization of discharge flow of CSO. The cost for each strategy can be calculated using the unitary costs previously estimated, and the coverage area of each measure, as given in Equation (1).
where M is the number of measures being applied, W is the number of subwatersheds in which the area is divided, UC
i is the Unitary Cost of measure i, and A
ij is the coverage area measure i in subwatershed j.
The function minimizing the discharge flow of CSO is given in Equation (2), and the values can be obtained as a direct result from hydrodynamic model results.
where Q
MaxCSO is the maximum CSO discharge flow.
The optimization variables can be defined as the areas covered by different GIs; these are the areas of subwatersheds completely covered by these measures in the model. The maximum limits for these variables can be defined from the analysis performed following GIs selection, where the specific limitations for application of each solution in each subwatershed is identified.
For practical implementation of the optimization framework above described, a code was developed to join the optimization tool with the SWMM model. In order to represent each configuration or possible strategy, the code changes the areas of subwatersheds containing GI and the sizes of storage tanks in the SWMM file. Thereafter, the evaluation of each individual (or each possible configuration of practices) is performed according to the objectives previously established.
Due to the high computation capacity requirements needed to perform genetic optimization, parallel computing was used through the NSGAXp developed by [
10,
61], in order to reduce the computing time.
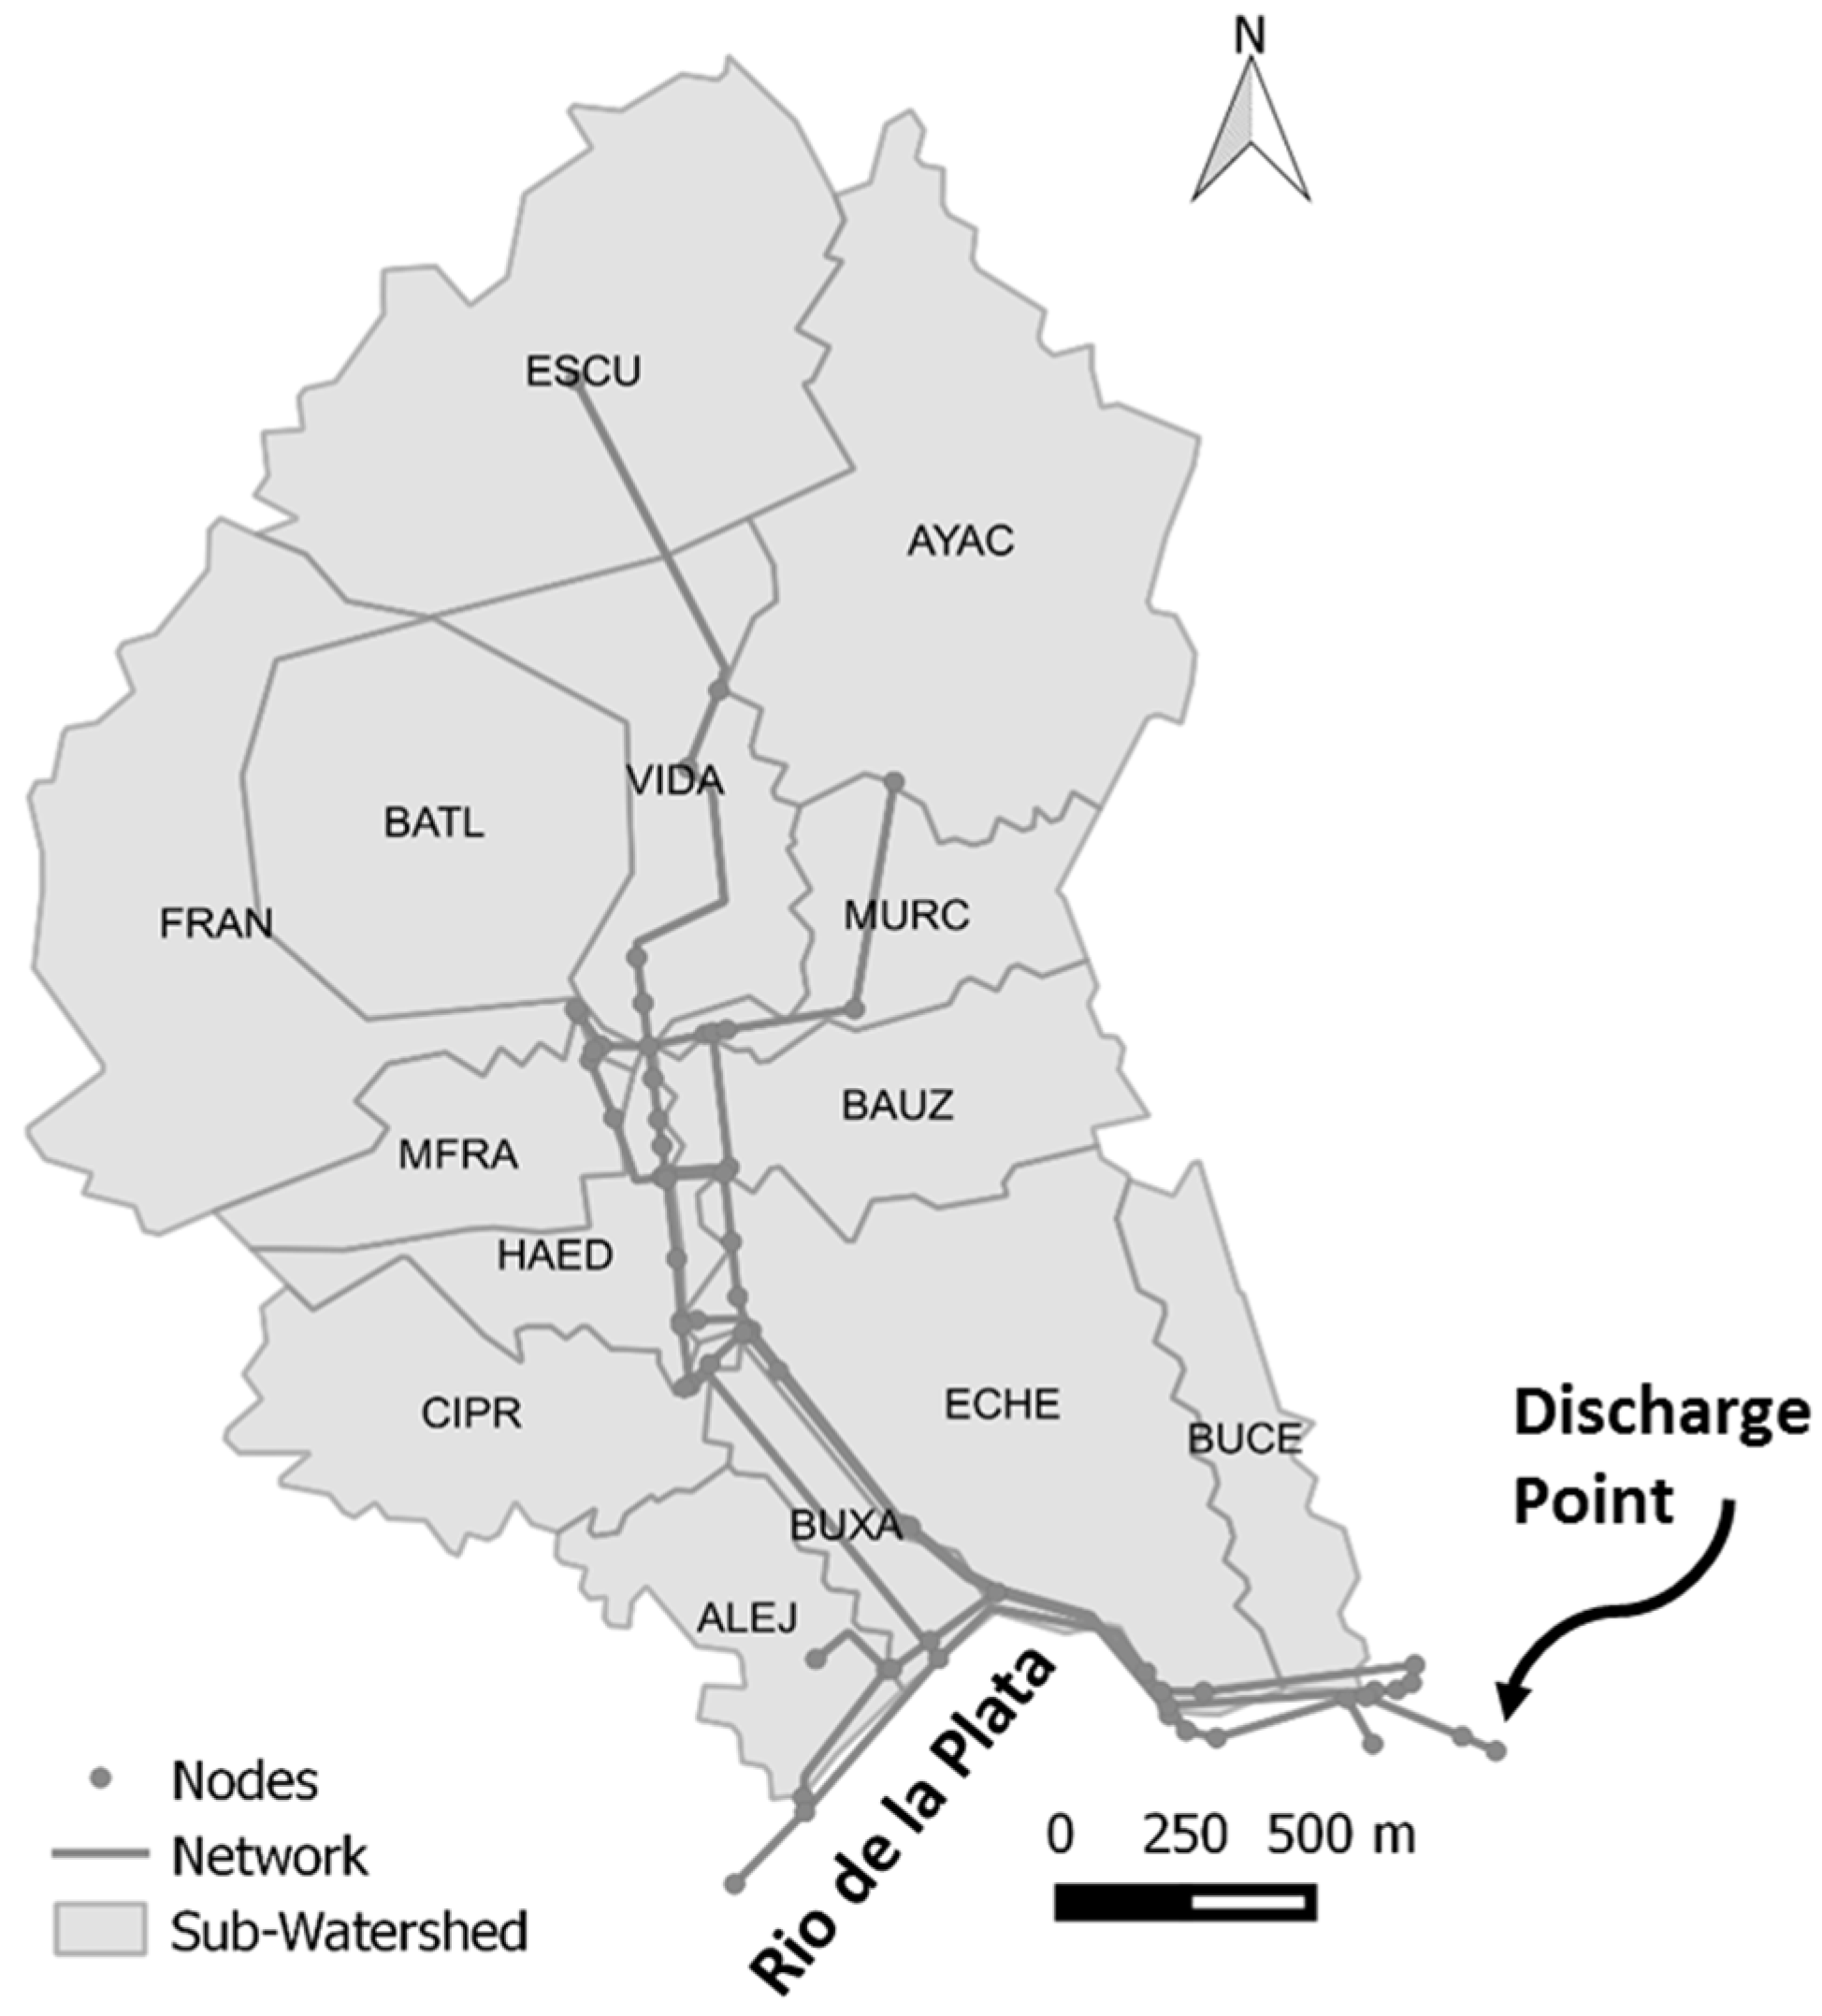
2.4. Demonstration of the Methodology in a Case Study Area
The proposed approach was applied on a study area located in the city of Montevideo, Uruguay. The case study is a coastal and highly urbanized watershed; the land use is mainly residential with medium to high economic level. The watershed has an area of 575 Ha, which was divided in 14 subwatersheds for the purpose of this work. The sewerage system in the watershed is combined and has one point of CSO discharge in the coast. This area has a border with the river Rio de la Plata in the south. In this place, one of the most visited beaches of the city is located. The interest is to reduce of CSO discharges due to the proximity between the beach and the overflow discharge point.
Figure 4 shows the watershed's division, the network used in the hydrodynamic model, and the discharge point.
3. Results and Discussion
3.1. Model Setup and Calibration
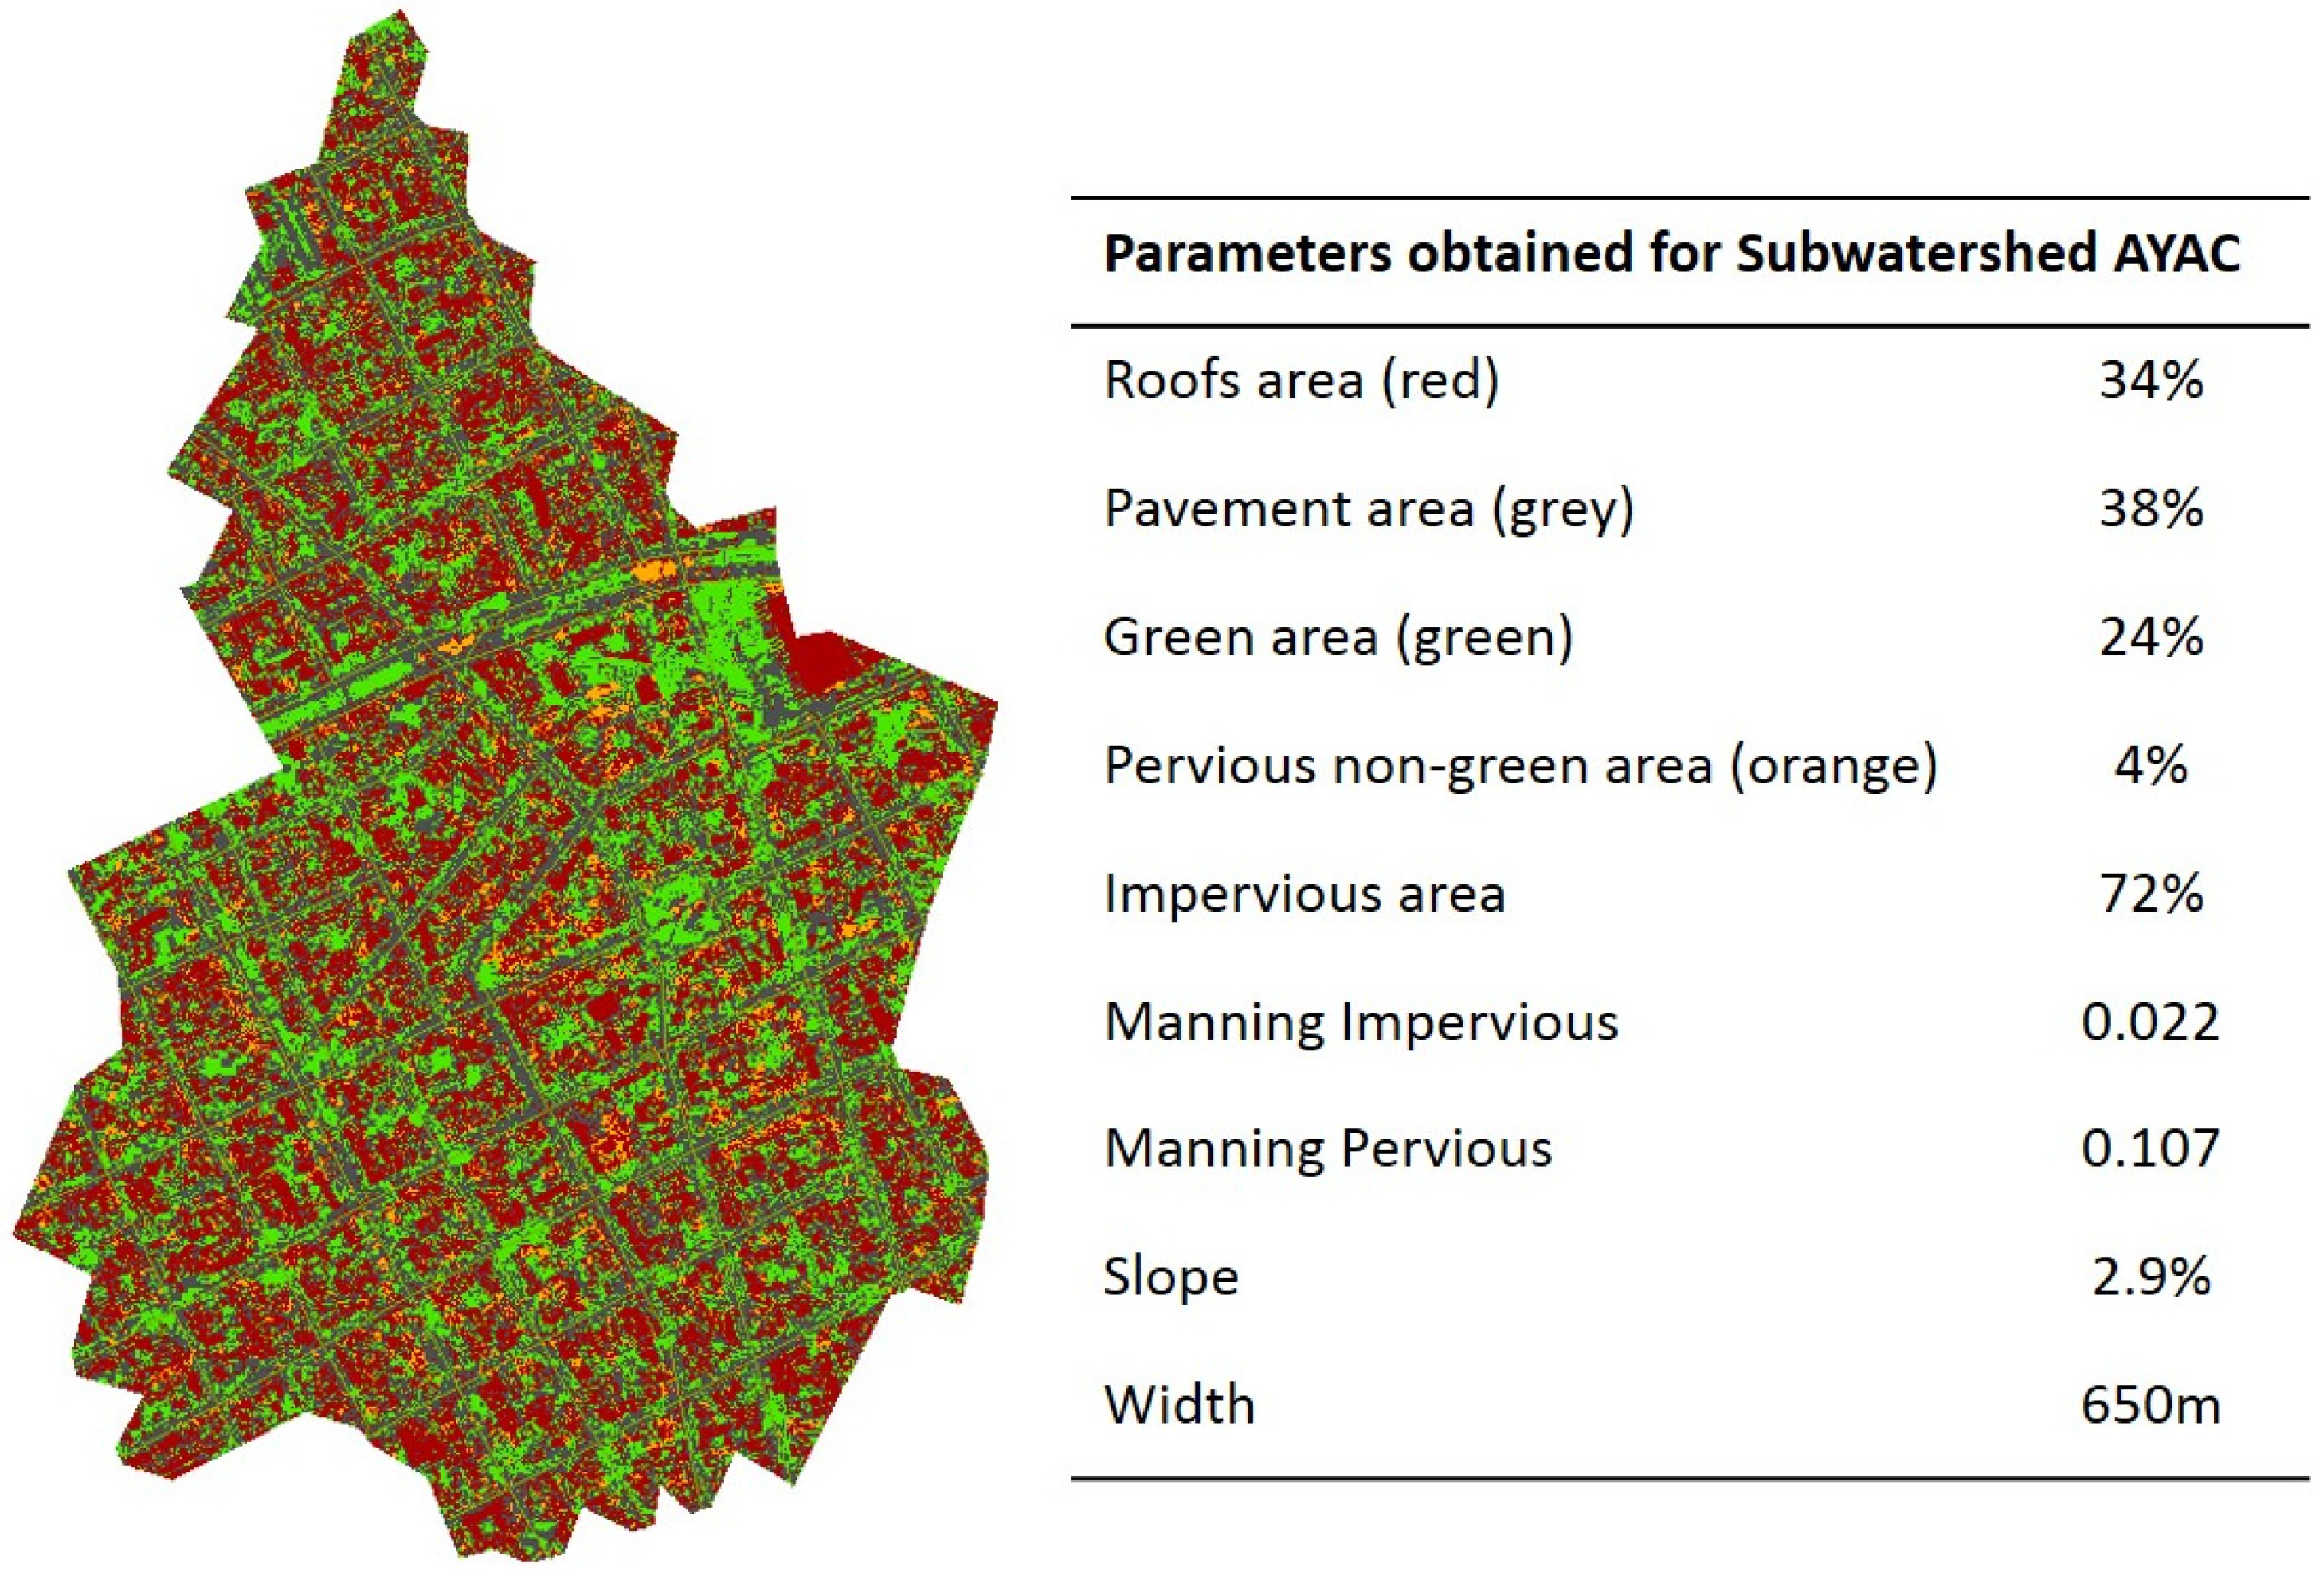
The first step in model setup was the calculation of hydrological parameters to include in the SWMM model. The parameters, that were calculated using spatial analysis, are subwatershed areas, widths, slopes, impervious percentages, and Manning coefficients. Area and slope were directly estimated from Digital Terrain Model using geographic information system analysis. The width was estimated by dividing the subwatershed area by the average maximum overland flow length [
46]. Impervious percentage and Manning coefficients were calculated using the maximum likelihood classification (MLC) algorithm [
62] in combination with a high resolution satellite image. In the present work, four different surfaces were considered: roofs, roads, green areas, and pervious non-green areas. Manning coefficients for each surface were defined in accordance with the theoretical literature-based values in [
63,
64]. As an example,
Figure 5 shows the result of MLC and parameter values for one of the subwatersheds.
Using these parameters, the hydrological model was developed and added to an existing hydraulic model for the case study area. The hydraulic model was built in SWMM and it includes the main lines of the sewerage/drainage network.
Unfortunately, the observed data (such as flow measurements), which were used in the past for model calibration, were not made available for the purposes of the present study. However, the hydrological model developed in the present work was calibrated using a previously developed and calibrated rainfall-runoff model [
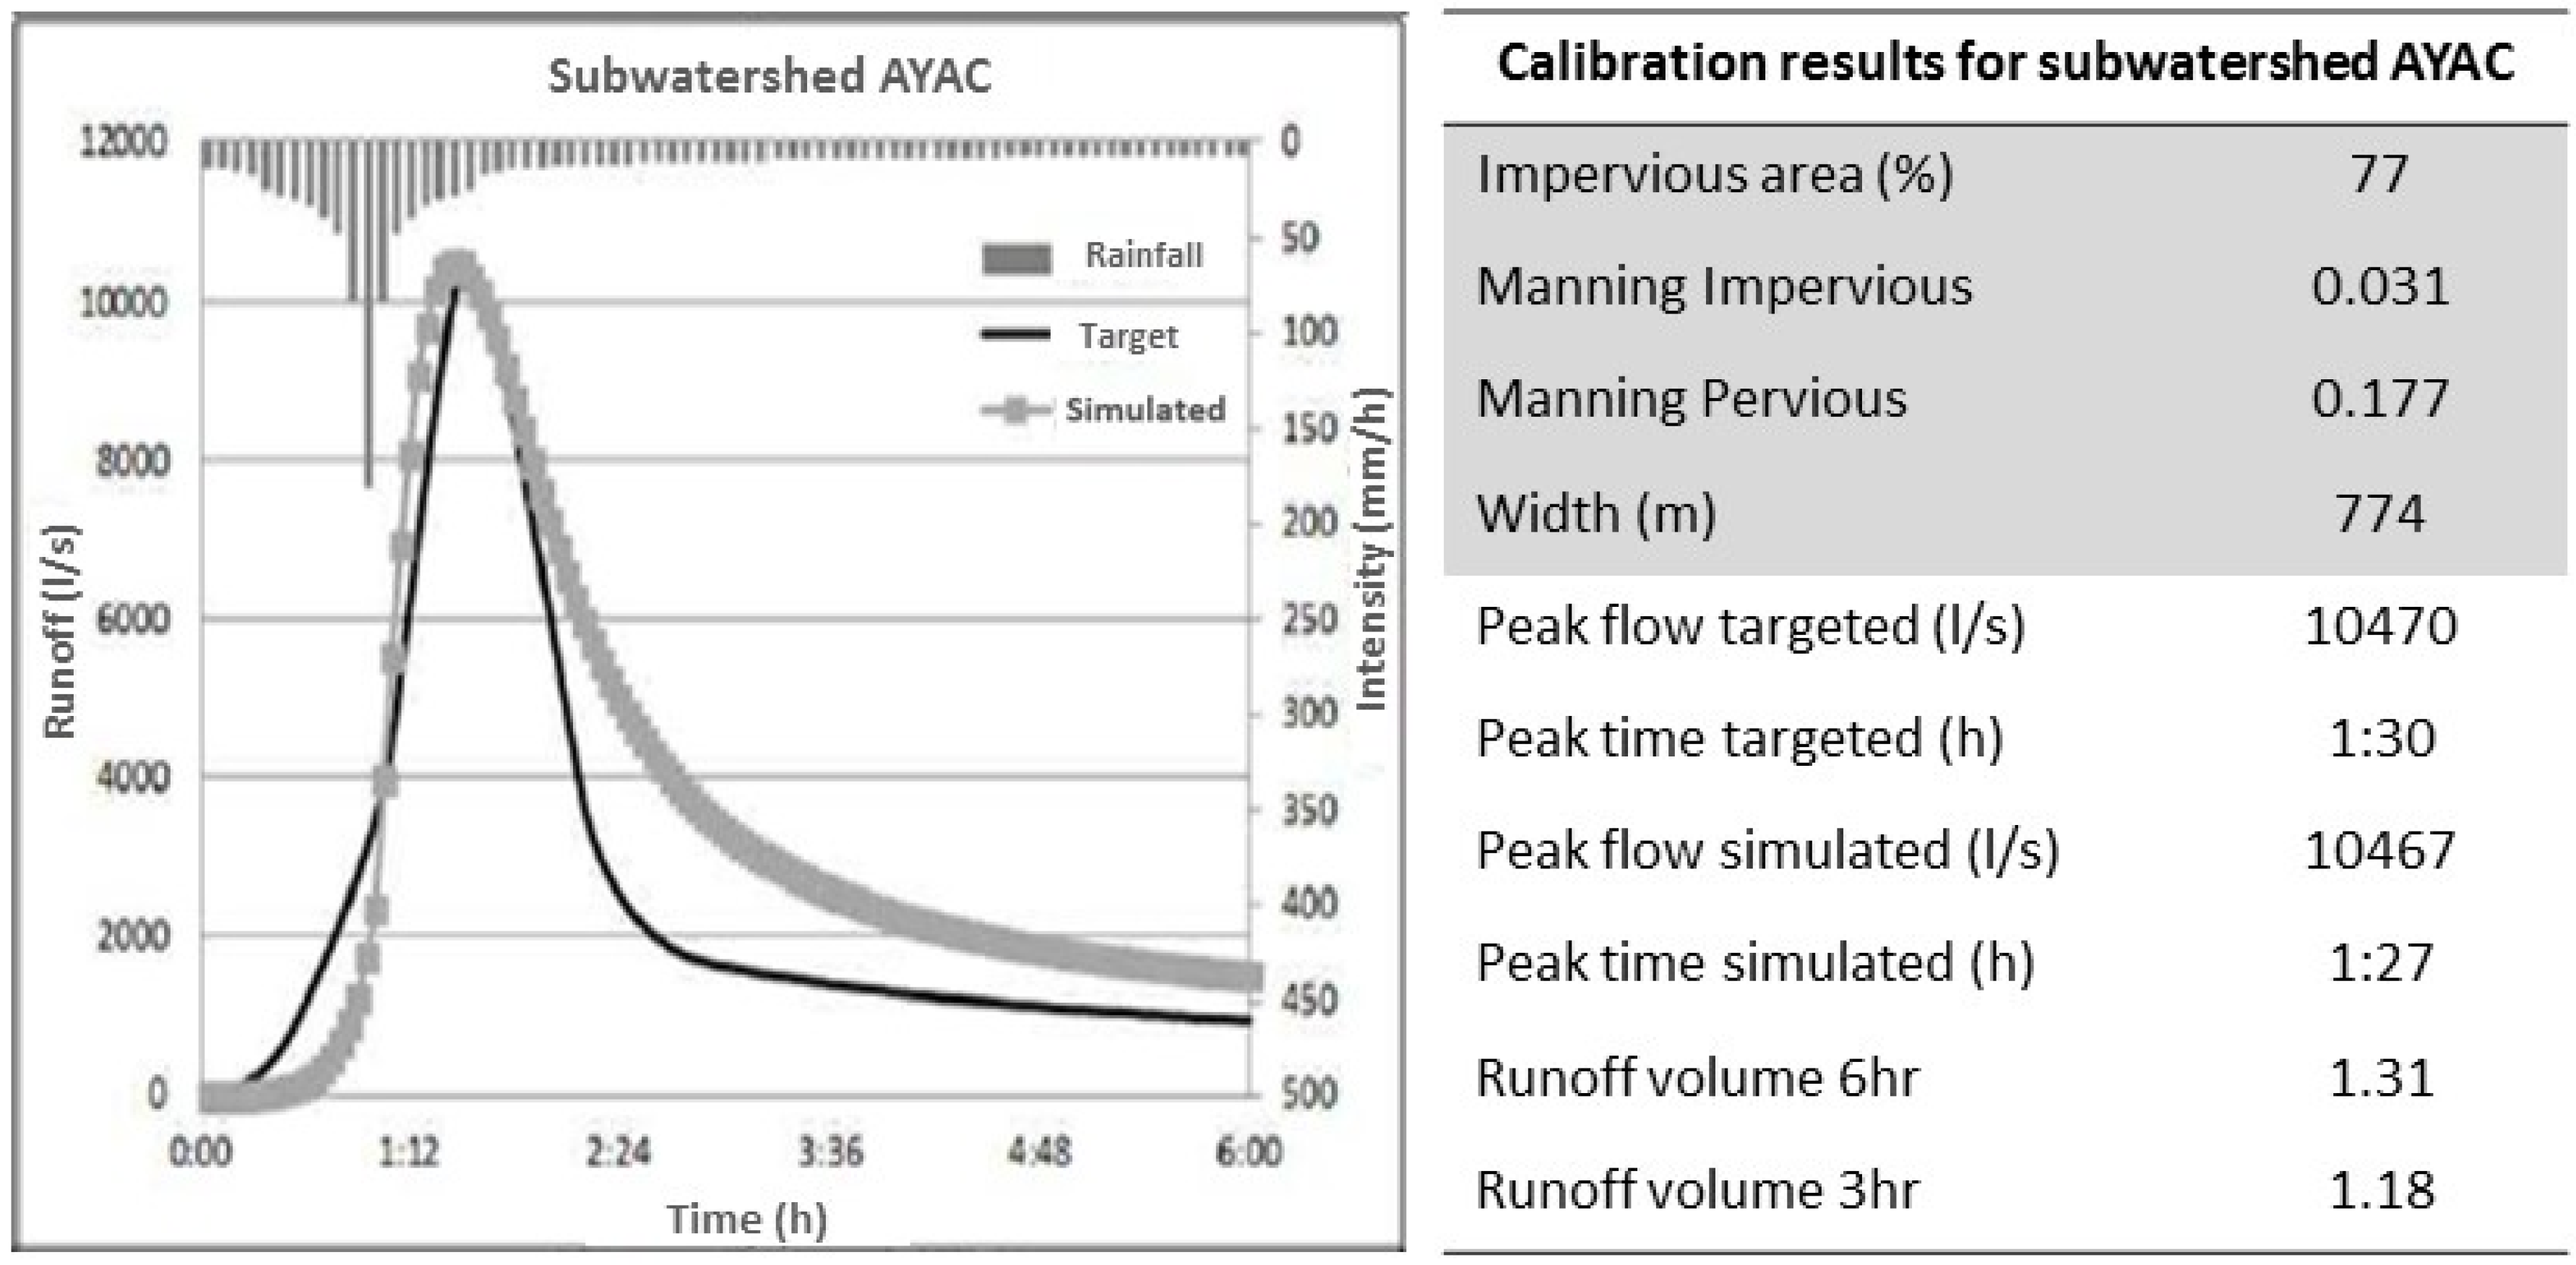
65]. The hydrological model was calibrated by correcting the peak flow and time to peak of each subwatershed hydrograph. This is performed by adjusting the values of subwatershed widths, Manning coefficients (pervious and impervious), and impervious area.
Figure 6 shows an example of calibration results obtained for the same subwatershed presented before. The targeted and simulated hydrographs are presented, as well as final values of the adjusted parameters (shaded part of the table). In addition, the targeted and obtained peak flow values and times, and two parameters comparing the values of runoff volumes targeted and simulated are given in
Figure 6 (part of the table without shade). These two parameters represent the ratio between volume targeted and volume simulated, considering runoff volumes obtained after three and six hours of the storm starting time (a storm of six hours in duration was used for calibration).
Due to data availability, nine periods of three months with hourly rainfall data were used to select the storm used in the optimization process. A summary of the results obtained from this analysis is shown in
Table 1. From these results, it was concluded that almost 80% (78%) of rainfalls that produce CSO have a return period of one year or less. This result is in accordance with the result obtained by [
32], which concludes that small storms are in charge of most of the runoff discharge amounts, while large storms contribute to a small part of annual discharges. Another result obtained from the analysis of rainfall data was that the average duration of storms is 4 h. Based on these outcomes, a design storm with one-year return period and four hours in duration was selected for optimization process in the present work.
3.2. Selection of GIs
The next part in the methodology comprises the selection of GIs. In order to use the decision tree, the main physical conditions of the study area were determined: the drainage areas are smaller than 2 ha, the average slope is lower than 5%, the soil is mainly impermeable, and the groundwater table is not shallow. Applying the decision tree, four possible measures were identified: green roofs (GR), pervious pavements (PP), rainwater harvesting tanks (RH), and infiltration trenches (IT). Based on the study of local conditions (multi-familiar buildings, no water scarcity), only three of these options were chosen: GR, PP, and IT. These measures were used as decentralized practices, and compared and combined with storage tanks used as centralized technique.
Next, land use in the watershed was studied in order to define the maximum possible coverage of each GI. For instance, the percentage of pavements with low slope determines the maximum applicability of pervious pavements. The results established the maximum limit for GRs application as 15% of total area, and the maximum limit of PPs application between 15% and 18%. In the case of IT, due to the different characteristics among subwatersheds, the maximum limit for application varies strongly; the average total area draining to IT was 14%. Due to the low infiltration capacity in the area, PP and IT were designed with drainage systems, hence the main process in these structures is decentralized storage. Finally, six spaces to locate centralized closed storage tanks (as grey structures) were identified. To define the location of these structures, it was needed to identify public available spaces placed near a main drainage pipe.
3.3. Implementing Optimization
The optimization objectives defined for this case were minimization of total costs and reduction of the discharge flow over the CSO weir. Equation (3) represents the first objective.
where UC
PP, UC
GR, UC
IT, and UC
St represent costs by unit of area for PP, GR, IT, and storages, respectively; A
PPi, A
GRi, A
ITi, and A
Sti are the areas of each measure in the case of subwatershed i.
Regarding the second objective, CSO quantity was evaluated applying the SWMM model and checking the peak flow over the weir connecting the combined system with the river. The optimization minimize the normalized value of peak flow, this function is presented in Equation (4).
where Q
MaxSi is the maximum CSO flow in the case of strategy i, and Q
MaxBL is the maximum CSO flow in the base line scenario, this is before retrofitting.
With the objective of simplification in the optimization process, a constant depth was used for storage tanks. Thus, the optimization variables are the areas covered by the tanks, and the areas covered by the subwatersheds containing GIs. Therefore, in a scenario where all the measures are considered for the 14 subwatersheds, the optimization is working with 48 variables: 14 subwatersheds for GR, 14 subwatersheds for PP, 14 subwatersheds for IT, and 6 places to locate storage tanks.
The optimization framework was settled using a population of 120 individuals and 80 generations. Probability of crossover and mutation were settled as 0.9 and 0.021 respectively.
3.4. Definition of Scenarios and Analysis of Results
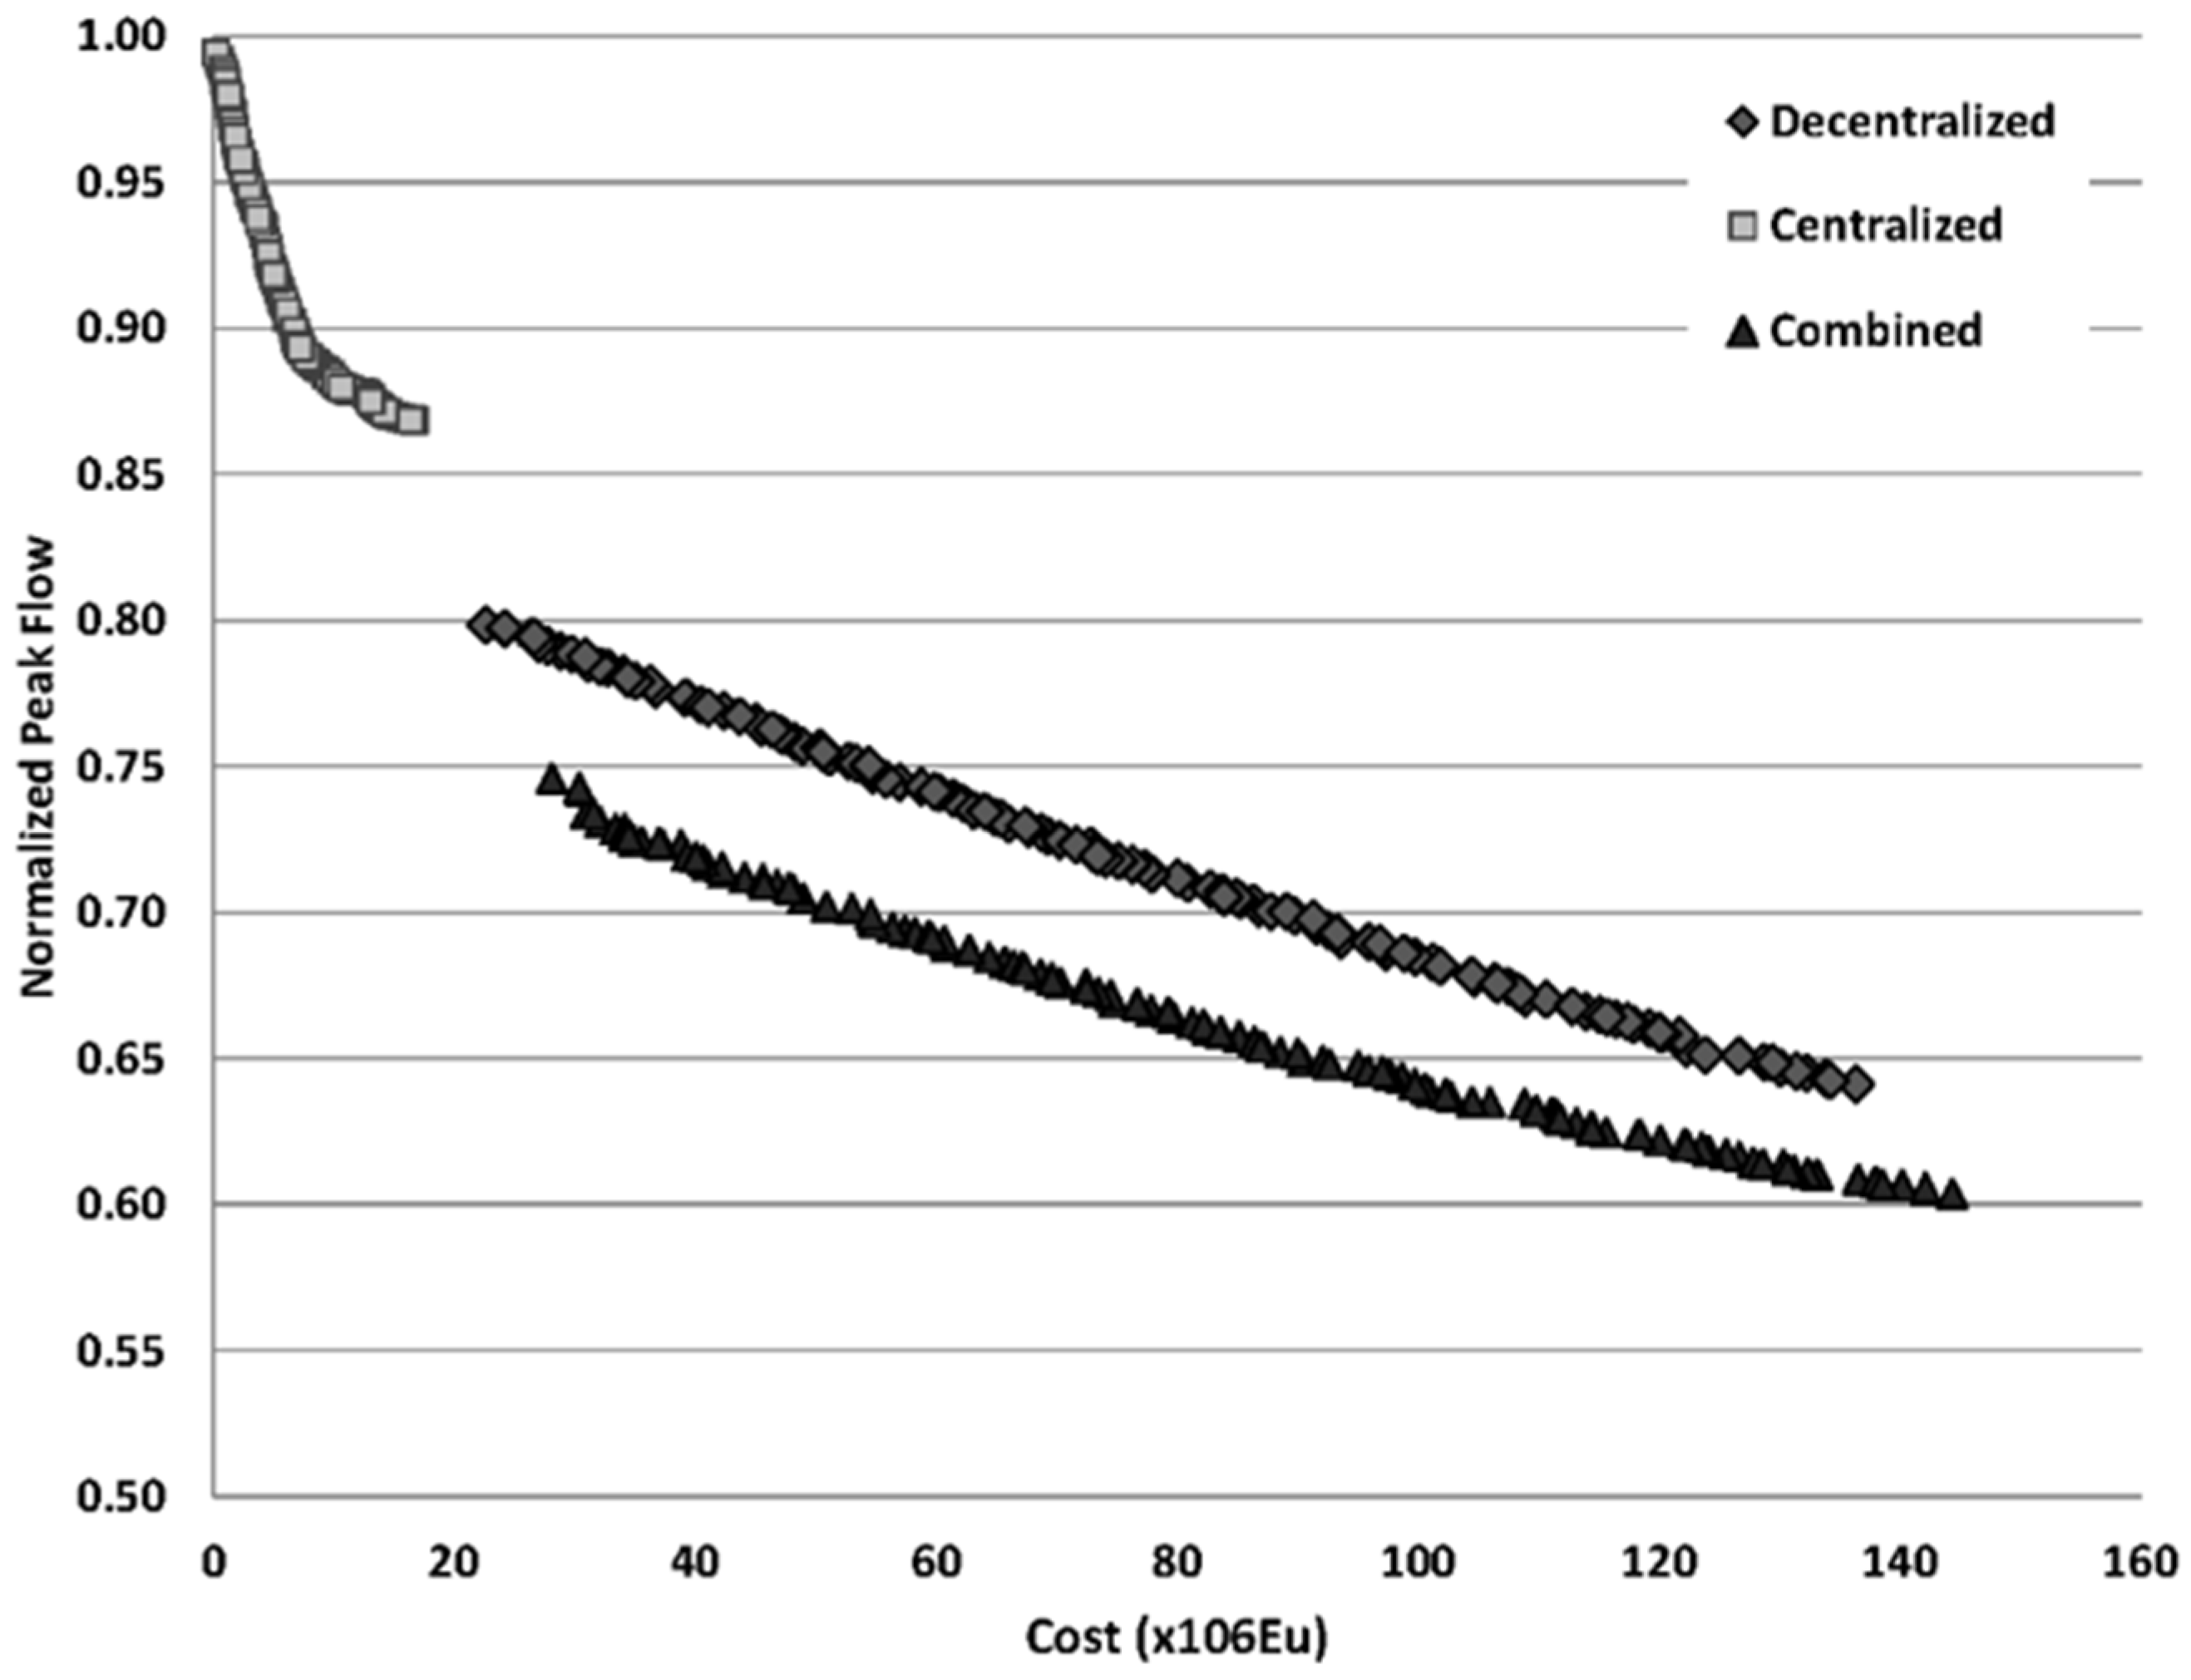
For the purpose of this work, three scenarios were defined. The first scenario includes the combination of all decentralized measures, this means PP, GR, and IT used at the same time (Scenario: Decentralized). The second case considers only storage tanks (Scenario: Centralized). Finally, the last scenario brings together all practices (Scenario: Combined).
Figure 7 presents the Pareto fronts obtained for each scenario. From the graph, it is deduced that the centralized approach works in a range of lower costs, but also the peak flow reduction is much lower than in the case of the other two cases. One reason for this result may be the limited applicability of storage tanks in the area due to high population density, since only six spaces to install tanks were identified.
Comparing the results obtained for decentralized and combined strategies, the solution combining both approaches obtains better efficiencies in peak flow reduction for the same investment. Thus, the use of storage tanks improves the performance of distributed practices applied over the watershed. This result can be explained by the greater possibility of measures application when using mixed practices in a highly urbanized area, where many constraints are found to place these elements. In another study, [
66] obtained comparable results. The authors studied how the design of green infrastructure affects the performance on flood reduction at a neighbourhood scale. Their results show that when placement options are limited, the distribution of structures across the landscape is more effective than a clustered option.
Figure 8 compares different optimal solutions obtained in the scenario of combined measures. The graph shows all solutions evaluated, the best solutions contained in the Pareto front, and three optimal solutions selected for comparison; with low (O1), medium (O2), and high cost (O3). The bar plot compares these three optimal solutions with the case of maximum cost (MC). The maximum cost case represents the solution obtained through the maximum possible application of all measures, without considering optimization. It can be observed that the high cost solution achieves considerable reductions in CSO events, flow, and volume. These results are similar to the results obtained applying maximum cost, but it requires less than 50% of the investment needed in that case.
3.5. Distribution of Optimal Solutions
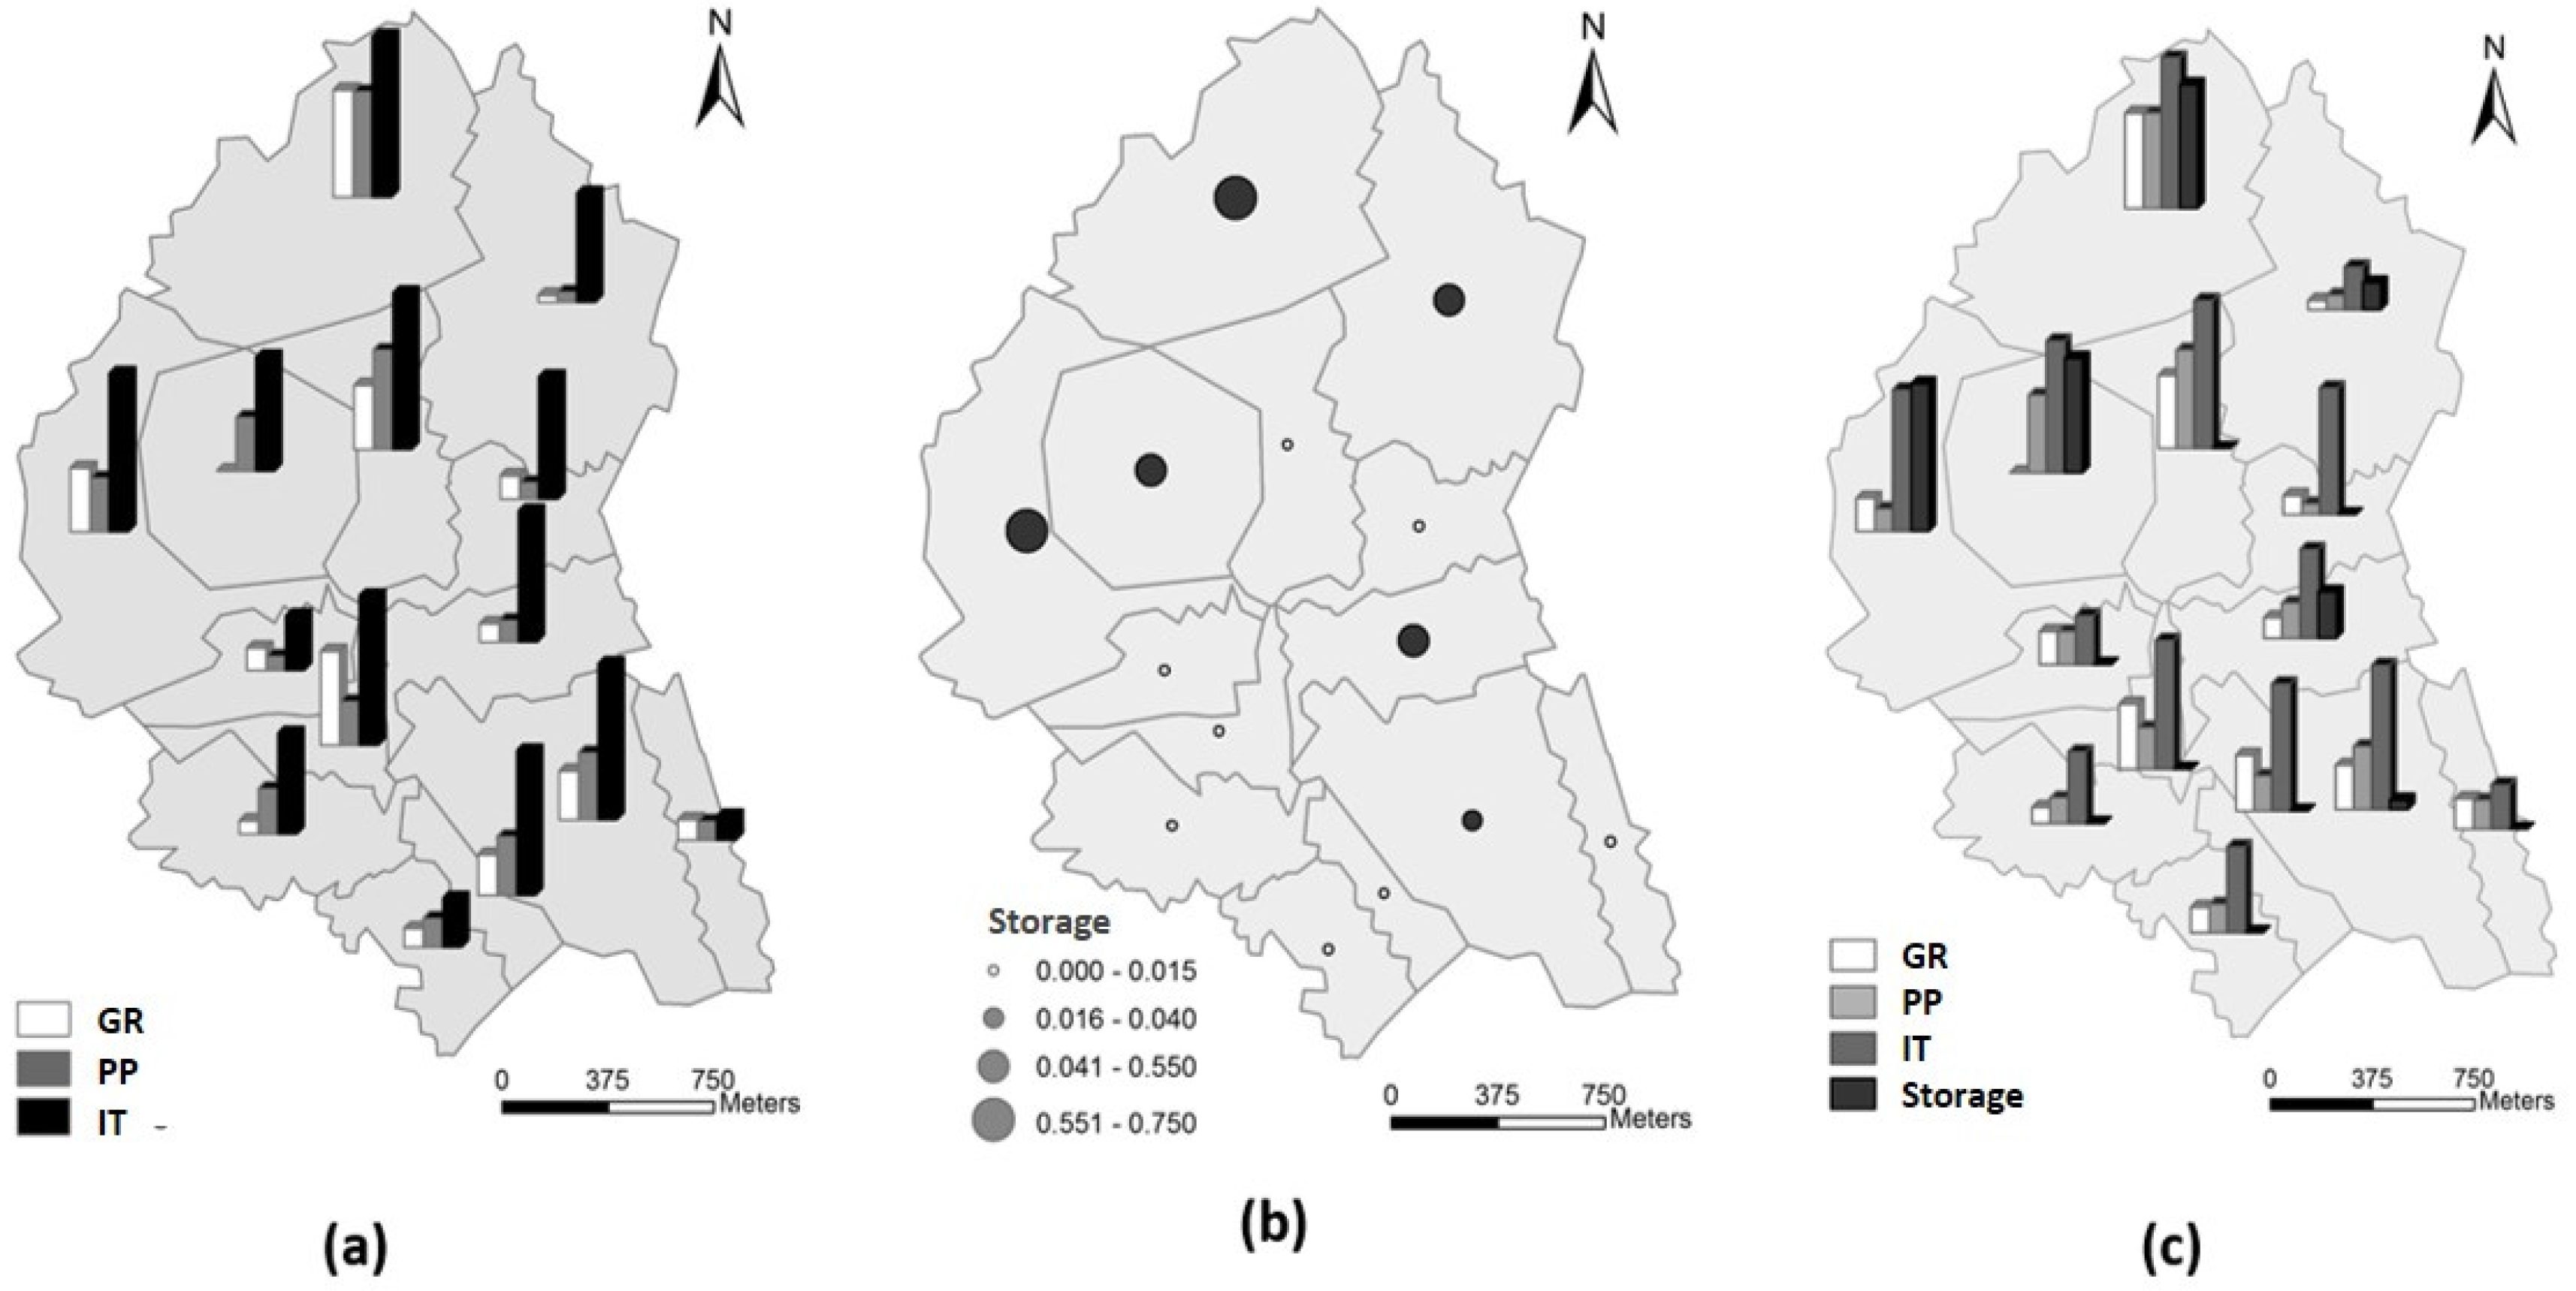
Once the results for each scenario are computed, an analysis of spatial distribution of optimal measures is performed. This is done by representing in a map, for each scenario, the average number of green-grey structures applied in optimal solutions.
Figure 9 presents the results for scenarios of decentralized (a), centralized (b), and combined (c) measures. Since the limits for measure applicability vary for the different subwatersheds, the values shown in the map are normalized by the maximum possible number of measures in each case.
Through the analysis of these results, it can be observed that when the decentralized measures are used (scenarios (a) and (c), only GIs and combined measures, respectively), the most used one in almost all subwatersheds is IT. One possible explanation is that the unitary cost of this measure is lower than in the other cases. However, some aspects were not considered in the calculation of this cost, such as the investment needed to modify the slope of pavements in order to allow the runoff to go into the trenches.
Regarding the results for scenario (b) (only storages), the optimal solutions use mainly the upper part of the watershed for the placement of storage tanks. Finally, observing the results for scenario c (combined green and grey structures), the areas in which the major number of measures are applied remain the same of the first two scenarios. This shows consistency in the results, as the physical conditions remain the same, it is expected that the chosen solutions are somehow similar for the three scenarios.
This type of analysis seems to be very useful for planning processes, identifying the zones to locate the main investment efforts with the highest reductions in CSO discharges.
4. Conclusions
This paper presents a novel methodology for optimal evaluation of different green-grey infrastructure configurations for retrofitting urban drainage systems. The framework introduces a decision tree for selection of GIs and uses hydrodynamic models and multi-objective optimization to design strategies at a watershed level. The proposed approach was applied in a highly urbanized watershed to evaluate the effect of green-grey infrastructure on CSO quantity reduction.
The methodology developed comprises three steps: data collection and hydrodynamic model setup, GIs selection and modelling, and multi-objective optimization. Optimization methods are used to compare and place different measure configurations at the watershed level. Moreover, comparison of effectiveness among centralized, decentralized, and combined practices is performed. The results show that the proposed methodology can find its application in planning and designing urban drainage systems.
From the analysis of all results, it can be concluded that the lack of space faced in highly urbanized areas when drainage systems have to be enlarged can be confronted if centralized and distributed practices are combined.
Another conclusion is that the application of multi-objective optimization processes for drainage configuration design may become a very promising tool, allowing the reduction of investments without compromising the efficiency of systems.
Finally, it can be concluded that the analysis of geographical distribution of optimal solutions can be a promising input for urban planning. It shows the areas where the investments are more efficient for reaching the desired objectives and can assist in planning the phases of future changes in the urban space.
We are aware that we have only touched on the basic aspects of the proposed methodology and there is so much more that can be done. For example, the possibility of considering potential stakeholder preferences or flexibility within the framework was not conducted and inclusion of such aspects would be very beneficial. Furthermore, consideration of other kinds of benefits (tangible and non-tangible) would be very valuable and worth incorporating in future research. Hence, we plan to take into consideration most of these aspects in our subsequent work.
Acknowledgments
This research was funded by the Joint Japan/World Bank Graduate Scholarship Program and by the Advanced Class Program at UNESCO-IHE financed by UNEP-DHI Partnership—Center on Water and Environment. We also want to thank the Municipality of Montevideo for the information and support provided.
Author Contributions
Alida Alves performed the research and wrote the article under close supervision and receiving contributions from Arlex Sanchez and Solomon Seyoum. Zoran Vojinovic contributed through research advice, as well as editing and improving the structure and writing of the manuscript. Mukand Babel and Damir Brdjanovic supervised the research process.
Conflicts of Interest
The authors declare no conflict of interest.
References
- Vojinovic, Z.; van Teeffelen, J. An Integrated Stormwater Management Approach for Small Islands in Tropical Climates. Urban Water J. 2007, 4, 211–231. [Google Scholar] [CrossRef]
- Price, R.K.; Vojinovic, Z. Urban flood disaster management. Urban Water J. 2008, 5, 259–276. [Google Scholar] [CrossRef]
- Mynett, A.E.; Vojinovic, Z. Hydroinformatics in multi-colours—Part red: Urban flood and disaster management. J. Hydroinform. 2009, 11, 166–180. [Google Scholar] [CrossRef]
- Vojinovic, Z. Supporting Flood Disaster Management with Numerical Modelling and Spatial Mapping Tools. Int. J. Geoinformatics 2010, 5, 33–40. [Google Scholar]
- Abbott, M.B.; Vojinovic, Z. Realising social justice in the water sector: 1. J. Hydroinform. 2010, 12, 97–117. [Google Scholar] [CrossRef]
- Abbott, M.B.; Vojinovic, Z. Realising social justice in the water sector: 2. J. Hydroinform. 2010, 12, 225–239. [Google Scholar] [CrossRef]
- Abbott, M.B.; Vojinovic, Z. Towards a hydroinformatics praxis in the service of social justice. J. Hydroinform. 2014, 16, 516–530. [Google Scholar] [CrossRef]
- Abbott, M.B.; Vojinovic, Z. Towards a Hydroinformatics for China. J. Hydroinform. 2013, 15, 1189–1202. [Google Scholar] [CrossRef]
- Vojinovic, Z.; Solomatine, D.; Price, R.K. Dynamic least-cost optimization of wastewater system remedial works requirements. Water Sci. Technol. 2006, 54, 467–475. [Google Scholar] [CrossRef] [PubMed]
- Barreto, W.; Vojinovic, Z.; Price, R.; Solomatine, D. Multiobjective Evolutionary Approach to Rehabilitation of Urban Drainage Systems. J. Water Res. Plan. Manag. 2010, 136, 547–554. [Google Scholar] [CrossRef]
- Vojinovic, Z.; Abebe, Y.A.; Ranasinghe, R.; Vacher, A.; Martens, P.; Mandl, D.J.; Frye, S.W.; van Ettinger, E.; de Zeeuw, R. A machine learning approach for estimation of shallow water depths from optical satellite images and sonar measurements. J. Hydroinform. 2013, 15, 1408–1424. [Google Scholar] [CrossRef]
- Vojinovic, Z. Floor Risk: The Holistic Perspective; IWA Publishing: London, UK, 2015. [Google Scholar]
- Vojinovic, Z.; Hammond, M.; Golub, D.; Hirunsalee, S.; Weesakul, S.; Meesuk, V.; Medina, N.; Sanchez, A.; Kumara, S.; Abbott, M. Holistic approach to flood risk assessment in areas with cultural heritage: A practical application in Ayutthaya, Thailand. Nat. Hazards 2016, 81, 589–616. [Google Scholar] [CrossRef]
- Parkinson, J.; Mark, O. Urban Stormwater Management in Developing Countries, 1st ed.; IWA Publishing: London, UK, 2005. [Google Scholar]
- Sathish Kumar, D.; Arya, D.S.; Vojinovic, Z. Modeling of urban growth dynamics and its impact on surface runoff characteristics. Comput. Environ. Urban Syst. 2013, 41, 124–135. [Google Scholar] [CrossRef]
- Sanchez, A.; Medina, N.; Vojinovic, Z.; Price, R. An integrated cellular automata evolutionary-based approach for evaluating future scenarios and the expansion of urban drainage networks. J. Hydroinforma. 2014, 16, 319–340. [Google Scholar] [CrossRef]
- Singh, R.; Arya, D.S.; Taxak, A.K.; Vojinovic, Z. Potential Impact of Climate Change on Rainfall Intensity-Duration-Frequency Curves in Roorkee, India. Water Resour. Manag. 2016. [Google Scholar] [CrossRef]
- United States Environmental Protection Agency (USEPA). Low Impact Development (LID). A Literature Review; USEPA: Cincinnati, OH, USA, 2000.
- Ellis, B.; Revitt, M.; Scholes, L.; Sieker, H.; Helm, B.; Winger, J.; Picouet, C.; Soutter, M. Sustainable Water Management in the City of the Future (SWITCH). Deliverable 2.1.1: Review of the Adaptability and Sensitivity of Current Stormwater Control Technologies to Extreme Environmental and Socio-Economic Drivers; Middlesex University: London, UK, 2006. [Google Scholar]
- Sieker, H.; Peters, C.; Sommer, H. Modelling stormwater and evaluating potential solutions. In SWITCH report presented at 3rd SWITCH Scientific Meeting, Belo Horizonte, Brazil, 1 December 2008.
- Eckart, J.; Sieker, H.; Vairavamoorthy, K. Flexible Urban Drainage Systems. Water Pract. Technol. 2010, 5. [Google Scholar] [CrossRef]
- Shutes, B.; Raggatt, L. Sustainable Water Management in the City of the Future (SWITCH). Deliverable 2.2.5: Development of Generic Best Management Practice (BMP) Principles for the Management of Stormwater as Part of an Integrated Urban Water Resource Management Strategy; Middlesex University: London, UK, 2010. [Google Scholar]
- Chocat, B.; Ashley, R.; Marsalek, J.; Matos, M.R.; Rauch, W.; Schilling, W.; Urbonas, B. Toward the Sustainable Management of Urban Storm-Water. Indoor Built Environ. 2007, 16, 273–285. [Google Scholar] [CrossRef]
- Ellis, J.B.; Scholes, L.; Revitt, D.M. Sustainable Water Management in the City of the Future Integrated (SWITCH). Deliverable 2.1.1b: Database Showing Threats/Uncertainties to Stormwater Control Which Exist in Selected Demonstration Cities Together with Their Predicted Major Impacts; Middlesex University: London, UK, 2008. [Google Scholar]
- Roseen, R.M.; Janeski, T.V.; Simpson, M.; Houle, J.J.; Gunderson, J.; Ballestero, T.P. Economic and Adaptation Benefits of Low Impact Development. In Proceedings of the Low Impact Development Symposium, Philadelphia, PA, USA, 25–27 September 2011; pp. 1–20.
- United States Environmental Protection Agency (USEPA). Case Studies Analyzing the Economic Benefits of Low Impact Development and Green Infrastructure Programs; USEPA: Cincinnati, OH, USA, 2013.
- Price, R.K.; Vojinovic, Z. Urban Hydroinformatics: Data, Models and Decision Support for Integrated Urban Water Management, 1st ed.; IWA Publishing: London, UK, 2011. [Google Scholar]
- Young, K.D.; Younos, T.; Dymond, R.L.; Kibler, D.F. Virginia ’ s Stormwater Impact Evaluation: Developing an Optimization Tool for Improved Site Development, Selection and Placement of Stormwater Runoff BMPs; Virginia Water Resources Research Center: Blacksburg, VA, USA, 2009. [Google Scholar]
- UDFCD. Urban Storm Drainage Criteria Manual Volume 3, Stormwater Best Management Practice. In Urban Drainage and Flood Control District, 3rd ed.; Water Resources Publications: Denver, CO, USA, 2010. [Google Scholar]
- Damodaram, C.; Giacomoni, M.H.; Prakash Khedun, C.; Holmes, H.; Ryan, A.; Saour, W.; Zechman, E.M. Simulation of Combined Best Management Practices and Low Impact Development for Sustainable Stormwater Management. J. Am. Water Resour. Assoc. 2010, 46, 907–918. [Google Scholar] [CrossRef]
- Fletcher, T.D.; Shuster, W.; Hunt, W.F.; Ashley, R.; Butler, D.; Arthur, S.; Trowsdale, S.; Barraud, S.; Semadeni-Davies, A.; Bertrand-Krajewski, J.-L.; et al. SUDS, LID, BMPs, WSUD and more—The evolution and application of terminology surrounding urban drainage. Urban Water J. 2014, 12, 1–18. [Google Scholar] [CrossRef]
- Huber, W.C.; Cannon, L.; Stouder, M. BMP Modeling Concepts and Simulation; Environmental Protection Agency: Washington, DC, USA, 2006.
- United States Environmental Protection Agency (USEPA). National Management Measures to Control Nonpoint Source Pollution from Urban Areas; USEPA: Cincinnati, OH, USA, 2005.
- Vojinovic, Z.; Sahlu, S.; Torres, A.S.; Seyoum, S.D.; Anvarifar, F.; Matungulu, H.; Barreto, W.; Savic, D.; Kapelan, Z. Multi-objective rehabilitation of urban drainage systems under uncertainties. J. Hydroinform. 2014, 16, 1044–1061. [Google Scholar] [CrossRef]
- Vojinovic, Z. A complementary modelling approach to manage uncertainty of computationally expensive models. Water Sci. Technol. 2007, 56, 1–9. [Google Scholar] [CrossRef] [PubMed]
- Vojinovic, Z.; Tutulic, D. On the use of 1D and coupled 1D-2D approaches for assessment of flood damages in urban areas. Urban Water J. 2009, 6, 183–199. [Google Scholar] [CrossRef]
- Abbott, M.B.; Vojinovic, Z. Applications of numerical modelling in hydroinformatics. J. Hydroinform. 2009, 11, 308–319. [Google Scholar] [CrossRef]
- Vojinovic, Z.; Seyoum, S.D.; Mwalwaka, J.M.; Price, R.K. Effects of model schematisation, geometry and parameter values on urban flood modelling. Water Sci. Technol. 2011, 63, 462–467. [Google Scholar] [CrossRef] [PubMed]
- Abdullah, A.; Vojinovic, Z.; Price, R.K.; Aziz, N.A.A. A methodology for processing raw LiDAR data to support urban flood modelling framework. J. Hydroinform. 2012, 14, 75–92. [Google Scholar] [CrossRef]
- Abdullah, A.; Vojinovic, Z.; Price, R.K.; Aziz, N.A.A. Improved methodology for processing raw LiDAR data to support urban flood modelling—Accounting for elevated roads and bridges. J. Hydroinform. 2012, 14, 253–269. [Google Scholar] [CrossRef]
- Vojinovic, Z.; Seyoum, S.; Salum, M.H.; Price, R.K.; Fikri, A.K.; Abebe, Y. Modelling floods in urban areas and representation of buildings with amethod based on adjusted conveyance and storage characteristics. J. Hydroinform. 2012, 15, 1150–1168. [Google Scholar] [CrossRef]
- Seyoum, S.D.; Vojinovic, Z.; Price, R.K.; Weesakul, S. Coupled 1D and Noninertia 2D Flood Inundation Model for Simulation of Urban Flooding. ASCE J. Hydraul. Eng. 2012, 138, 23–34. [Google Scholar] [CrossRef]
- Meesuk, V.; Vojinovic, Z.; Mynett, A.E.; Abdullah, A.F. Urban flood modelling combining top-view LiDAR data with ground-view SfM observations. Adv. Water Resour. 2015, 75, 105–117. [Google Scholar] [CrossRef]
- Abdullah, A.; Rahman, A.; Vojinovic, Z. LiDAR filtering algorithms for urban flood application: Review on current algorithms and filters test. Int. Arch. Photogramm. Remote Sens. Spat. Inf. Sci. 2009, 38, 30–36. [Google Scholar]
- Obropta, C.C.; Kardos, J.S. Review of Urban Stormwater Quality Models: Deterministic, Stochastic, and Hybrid Approaches. J. Am. Water Resour. Assoc. 2007, 43, 1508–1523. [Google Scholar] [CrossRef]
- Rossman, L.A. STORM Water Management Model. User’s Manual; USEPA: Cincinnati, OH, USA, 2010.
- Sahlu, S.B. Robust Optimization of Urban Drainage Systems Under Uncertainties. Master’s Thesis, UNESCO-IHE, Delft, The Netherlands, 2012. [Google Scholar]
- Delelegn, S.W.; Pathirana, A.; Gersonius, B.; Adeogun, A.G.; Vairavamoorthy, K. Multi-Objective Optimization of Cost-Benefit of Urban Flood Management using a 1D2D Coupled Model. Water Sci. Technol. 2011, 63, 1053–1059. [Google Scholar] [CrossRef] [PubMed]
- Srinivas, N.; Deb, K. Muiltiobjective Optimization Using Nondominated Sorting in Genetic Algorithms. Evol. Comput. 1994, 2, 221–248. [Google Scholar] [CrossRef]
- Deb, K.; Pratap, A.; Agarwal, S.; Meyarivan, T. A Fast and Elitist Multiobjective Genetic Algorithm: NSGA-II. IEEE Trans. Evol. Comput. 2002, 6, 182–197. [Google Scholar] [CrossRef]
- Damodaram, C.; Zechman, E.M.; Asce, M. Simulation-Optimization Approach to Design Low Impact Development for Managing Peak Flow Alterations in Urbanizing Watersheds. J. Water Resour. Plan. Manag. 2013, 139, 290–298. [Google Scholar] [CrossRef]
- Jia, H.; Yao, H.; Tang, Y.; Yu, S.L.; Field, R.; Tafuri, A.N. LID-BMPs planning for urban runoff control and the case study in China. J. Environ. Manag. 2015, 149, 65–76. [Google Scholar] [CrossRef] [PubMed]
- Oraei Zare, S.; Saghafian, B.; Shamsai, A. Multi-objective optimization for combined quality-quantity urban runoff control. Hydrol. Earth Syst. Sci. 2012, 16, 4531–4542. [Google Scholar] [CrossRef]
- Urrestarazu, S. Sustainable Drainage Systems as Ecosystem Services Case Study: Urban Catchment in the City of Montevideo, Uruguay. Master’s Thesis, UNESCO-IHE, Delft, The Netherlands, 2013. [Google Scholar]
- Zhang, G.; Hamlett, J.M.; Reed, P.; Tang, Y. Multi-Objective Optimization of Low Impact Development Designs in an Urbanizing Watershed. Open J. Optim. 2013, 2, 95–108. [Google Scholar] [CrossRef]
- Ahiablame, L.M.; Engel, B.A.; Chaubey, I. Effectiveness of Low Impact Development Practices: Literature Review and Suggestions for Future Research. Water Air Soil Pollut. 2012, 223, 4253–4273. [Google Scholar] [CrossRef]
- Lee, J.G.; Selvakumar, A.; Alvi, K.; Riverson, J.; Zhen, J.X.; Shoemaker, L.; Lai, F. A watershed-scale design optimization model for stormwater best management practices. Environ. Model. Softw. 2012, 37, 6–18. [Google Scholar] [CrossRef]
- Jia, H.; Lu, Y.; Yu, S.L.; Chen, Y. Planning of LID–BMPs for urban runoff control: The case of Beijing Olympic Village. Sep. Purif. Technol. 2012, 84, 112–119. [Google Scholar] [CrossRef]
- Paredes, D. Multi-Objective-Rehabilitation of Urban Drainage Systems within the Flood Risk Framework Case study: Quito-Ecuador. Master’s Thesis, UNESCO-IHE, Delft, The Netherlands, 2013. [Google Scholar]
- Natural Resources Conservation Service (NRCS). National Engineering Handbook Chapter 7 Hydrologic Soil Groups, Natural Resources Conservation Service; NRCS: Washington, DC, USA, 2007.
- Barreto, W. Multi-Objective Optimization for Urban Drainage Rehabilitation. Ph.D. Thesis, Delft University of Technology/UNESCO-IHE, Delft, The Netherlands, 2012. [Google Scholar]
- EDN: ESRI Developer Network: How Maximum Likelihood Classification Works. Available online: http://edndoc.esri.com/arcobjects/9.2/net/shared/geoprocessing/spatial_analyst_tools/how_maximum_likelihood_classification_works.htm (accessed on 10 December 2014).
- Chow, V.T.; Maidment, D.R.; Mays, L.W. Applied Hydrology; McGraw-Hill: New York, NY, USA, 1988. [Google Scholar]
- Chow, V.T. Open-Channel Hydraulics; McGraw-Hill: New York, NY, USA, 1959. [Google Scholar]
- Intendencia de Montevideo. Plan Director de Saneamiento del Departamento de Montevideo; Intendencia Municipal de Montevideo: Montevideo, Uruguay, 1994. [Google Scholar]
- Zellner, M.; Massey, D.; Minor, E.; Gonzalez-meler, M. Exploring the effects of green infrastructure placement on neighborhood-level flooding via spatially explicit simulations. Comput. Environ. Urban Syst. 2016, 59, 116–128. [Google Scholar] [CrossRef]
© 2016 by the authors; licensee MDPI, Basel, Switzerland. This article is an open access article distributed under the terms and conditions of the Creative Commons Attribution (CC-BY) license (http://creativecommons.org/licenses/by/4.0/).


