Article

Contributions of Climate Variability and Human Activities to Runoff Changes in the Upper Catchment of the Red River Basin, China

1
Yunnan Key Laboratory of International Rivers and Transboundary Eco-Security, Yunnan University, Kunming 650091, China
2
Asian International Rivers Center, Yunnan University, Kunming 650091, China
*
Author to whom correspondence should be addressed.
Water 2016, 8(9), 414; https://doi.org/10.3390/w8090414
Submission received: 7 August 2016 / Revised: 12 September 2016 / Accepted: 14 September 2016 / Published: 21 September 2016
(This article belongs to the Special Issue Water-Soil-Vegetation Dynamic Interactions in Changing Climate)

Abstract

:
Quantifying the effects of climate variability and human activities on runoff changes will contribute to regional water resource planning and management. This study aims to separate the effects of climate variability and human activities on runoff changes in the upper catchment of the Red River Basin in China. The Mann–Kendall test and Pettitt’s test methods were applied to identify the trends and change points of the hydro-meteorological variables. The hydrological sensitivity, climate elasticity and hydrological simulation methods were adopted to estimate the contributions of climate variability and human activities to runoff changes. Results showed that annual runoff significantly decreased by 1.57 mm/year during the period of 1961–2012. A change point in annual runoff coefficient occurred in 2002. Accordingly, the annual runoff series were divided into the baseline period (1961–2002) and the impacted period (2003–2012). Mean annual runoff of the impacted period decreased by 29.13% compared with the baseline period. Similar estimates of the contributions of climate variability and human activities were obtained by the three different methods. Climate variability was estimated to be responsible for 69%–71% of the reduction in annual runoff, and human activities accounted for 29%–31%. Climate variability was the main driving factor for runoff decrease in the catchment.

1. Introduction

The hydrological cycle and water resource systems are extensively influenced by climate variability and human activities [1,2]. Climate change, leading to rising temperatures and changes in intensities and patterns of rainfall, as well as changes in evapotranspiration, has a significant impact on regional hydrological processes [3,4]. Human activities—such as land use and land cover change, alter vegetation retention, soil water infiltration and surface evapotranspiration—result in hydrological alterations [5,6]. With a worsening of the water shortage problems globally, hydrologists have paid considerable attention to the impacts of climate variability and human activities on hydrology and water resources [7,8]. Separating the effects of climate variability and human activity on stream discharge at the catchment scale is needed in order to develop adaptive measures to cope with climate change [9,10].
Present studies mainly follow the paradigm of “identifying the change points and baseline period, and then quantifying the effects of climate change and human activities [11]”. For a given river basin, identifying the change point of stream discharge series between a baseline period and impacted period needs to be defined. Many statistical methods, such as the double cumulative curve (DCC), Pettitt’s test, Mann–Kendall test, moving t-test, and visualization plots, are used to determine change points [12,13]. According to the change points, the stream discharge series can be divided into a baseline period and an impacted period. The baseline period is assumed to have negligible human activity, while the impacted period is assumed to have measurable effects of climate change and human activity on stream discharge [9].
Both statistical methods and hydrological modeling methods have been proposed to assess the impacts of climate change and human activities on runoff. The hydrological sensitivity method, developed by Dooge et al. [14], and applied by Milly and Dunne [15], describing the first-order effect of changes in precipitation and potential evaporation on runoff, has been successfully used to evaluate the effects of climate variability and human activities on the hydrologic cycle [16,17,18,19,20]. Furthermore, the climate elasticity method proposed by Schaake [21], which is similar to the hydrological sensitivity method, has been continually extended and improved [22,23,24]. Climate elasticity of runoff provides a measure of the sensitivity of runoff to the changes in climatic variables (e.g., precipitation, temperature, and potential evaporation), and is widely used in impact assessments of climate change on hydrology [25,26,27,28].
Hydrological modeling methods are commonly used to assess the impacts of climate change and human activities on runoff. For example, Chiew et al. [29] used a simplified version of the HYDROLOG model (SIMHYD) to estimate climate change impact on runoff across Southeast Australia. Guo et al. [30] adopted the HBV (Hydrologiska Byrans Vattenbalansavdelning) model to investigate the contributions of climate change and human activities on runoff for the upper reaches of the Weihe River in China. Tang et al. [31] used the Soil Water Assessment Tool (SWAT) to investigate the responses of natural runoff to climatic variations in the Yellow River Basin in China. Bao et al. [32] assessed the impacts of climate variability and human activities on annual runoff in the Haihe River Basin in China by using the Variable Infiltration Capacity (VIC) model. Xu et al. [26] applied a geomorphology-based hydrological model (GBHM) to assess the impacts of climate variability and human activities on annual runoff in the Luan River Basin in China. Wang et al. [33] used the Simplified Water Balance Model (SWBM) to study the attribution of runoff change for the Xinshui River catchment on the Loess Plateau of China. The hydrological modeling methods could provide more detail of the hydrological cycle; however, there are always limitations in practice for hydrological model to be applied in large basin with data scarce due to their requirement of more detailed inputs. Compared to the hydrological modeling methods, the statistical methods have been considered as the more flexible methods for the advantage of using fewer data. Therefore, statistical methods, together with hydrological modeling methods, are considered an appropriate approach for separating climate and human activities effects on runoff in a catchment.
The Red River is an important international river in Southeast Asia, and it plays an important role in the sustainable development of economy and ecology for riparian countries. Recently, transboundary eco-hydrological issues, such as the changes of hydrological regime, soil erosion, sedimentation change, water pollution, and biodiversity conservation, have notably received more attention [34]. The Red River Basin flows through several vulnerable areas, where hydrological processes were greatly affected by Indian and East Asian monsoon activities [35]. Previous studies have reported that the observed annual runoff in the upper reaches of the Red River has decreased over the past 50 years; climate change, especially changes in precipitation, is the main reason for the results in the reduction of runoff [36]. However, few studies have focused on the contributions of climate variability and human activities to runoff changes.
With the rapid socioeconomic developments in the basin, water demand has increased dramatically. However, hydro-meteorological drought has become more frequent over the past decade, which has hindered social and economic development, and has resulted in severe environmental and ecological problems [37]. Moreover, conflicting interests of water use, between riparian countries, are expected to bring about increasing challenges to cooperation. Therefore, it is important to understand the effects of climate variability and human activities on runoff in order to develop sustainable catchment management strategies. The objectives of this study are: (1) to determine trends and change points in annual runoff of the catchment; and (2) to estimate the contributions of climate variability and human activities on runoff changes.

2. Materials and Methods

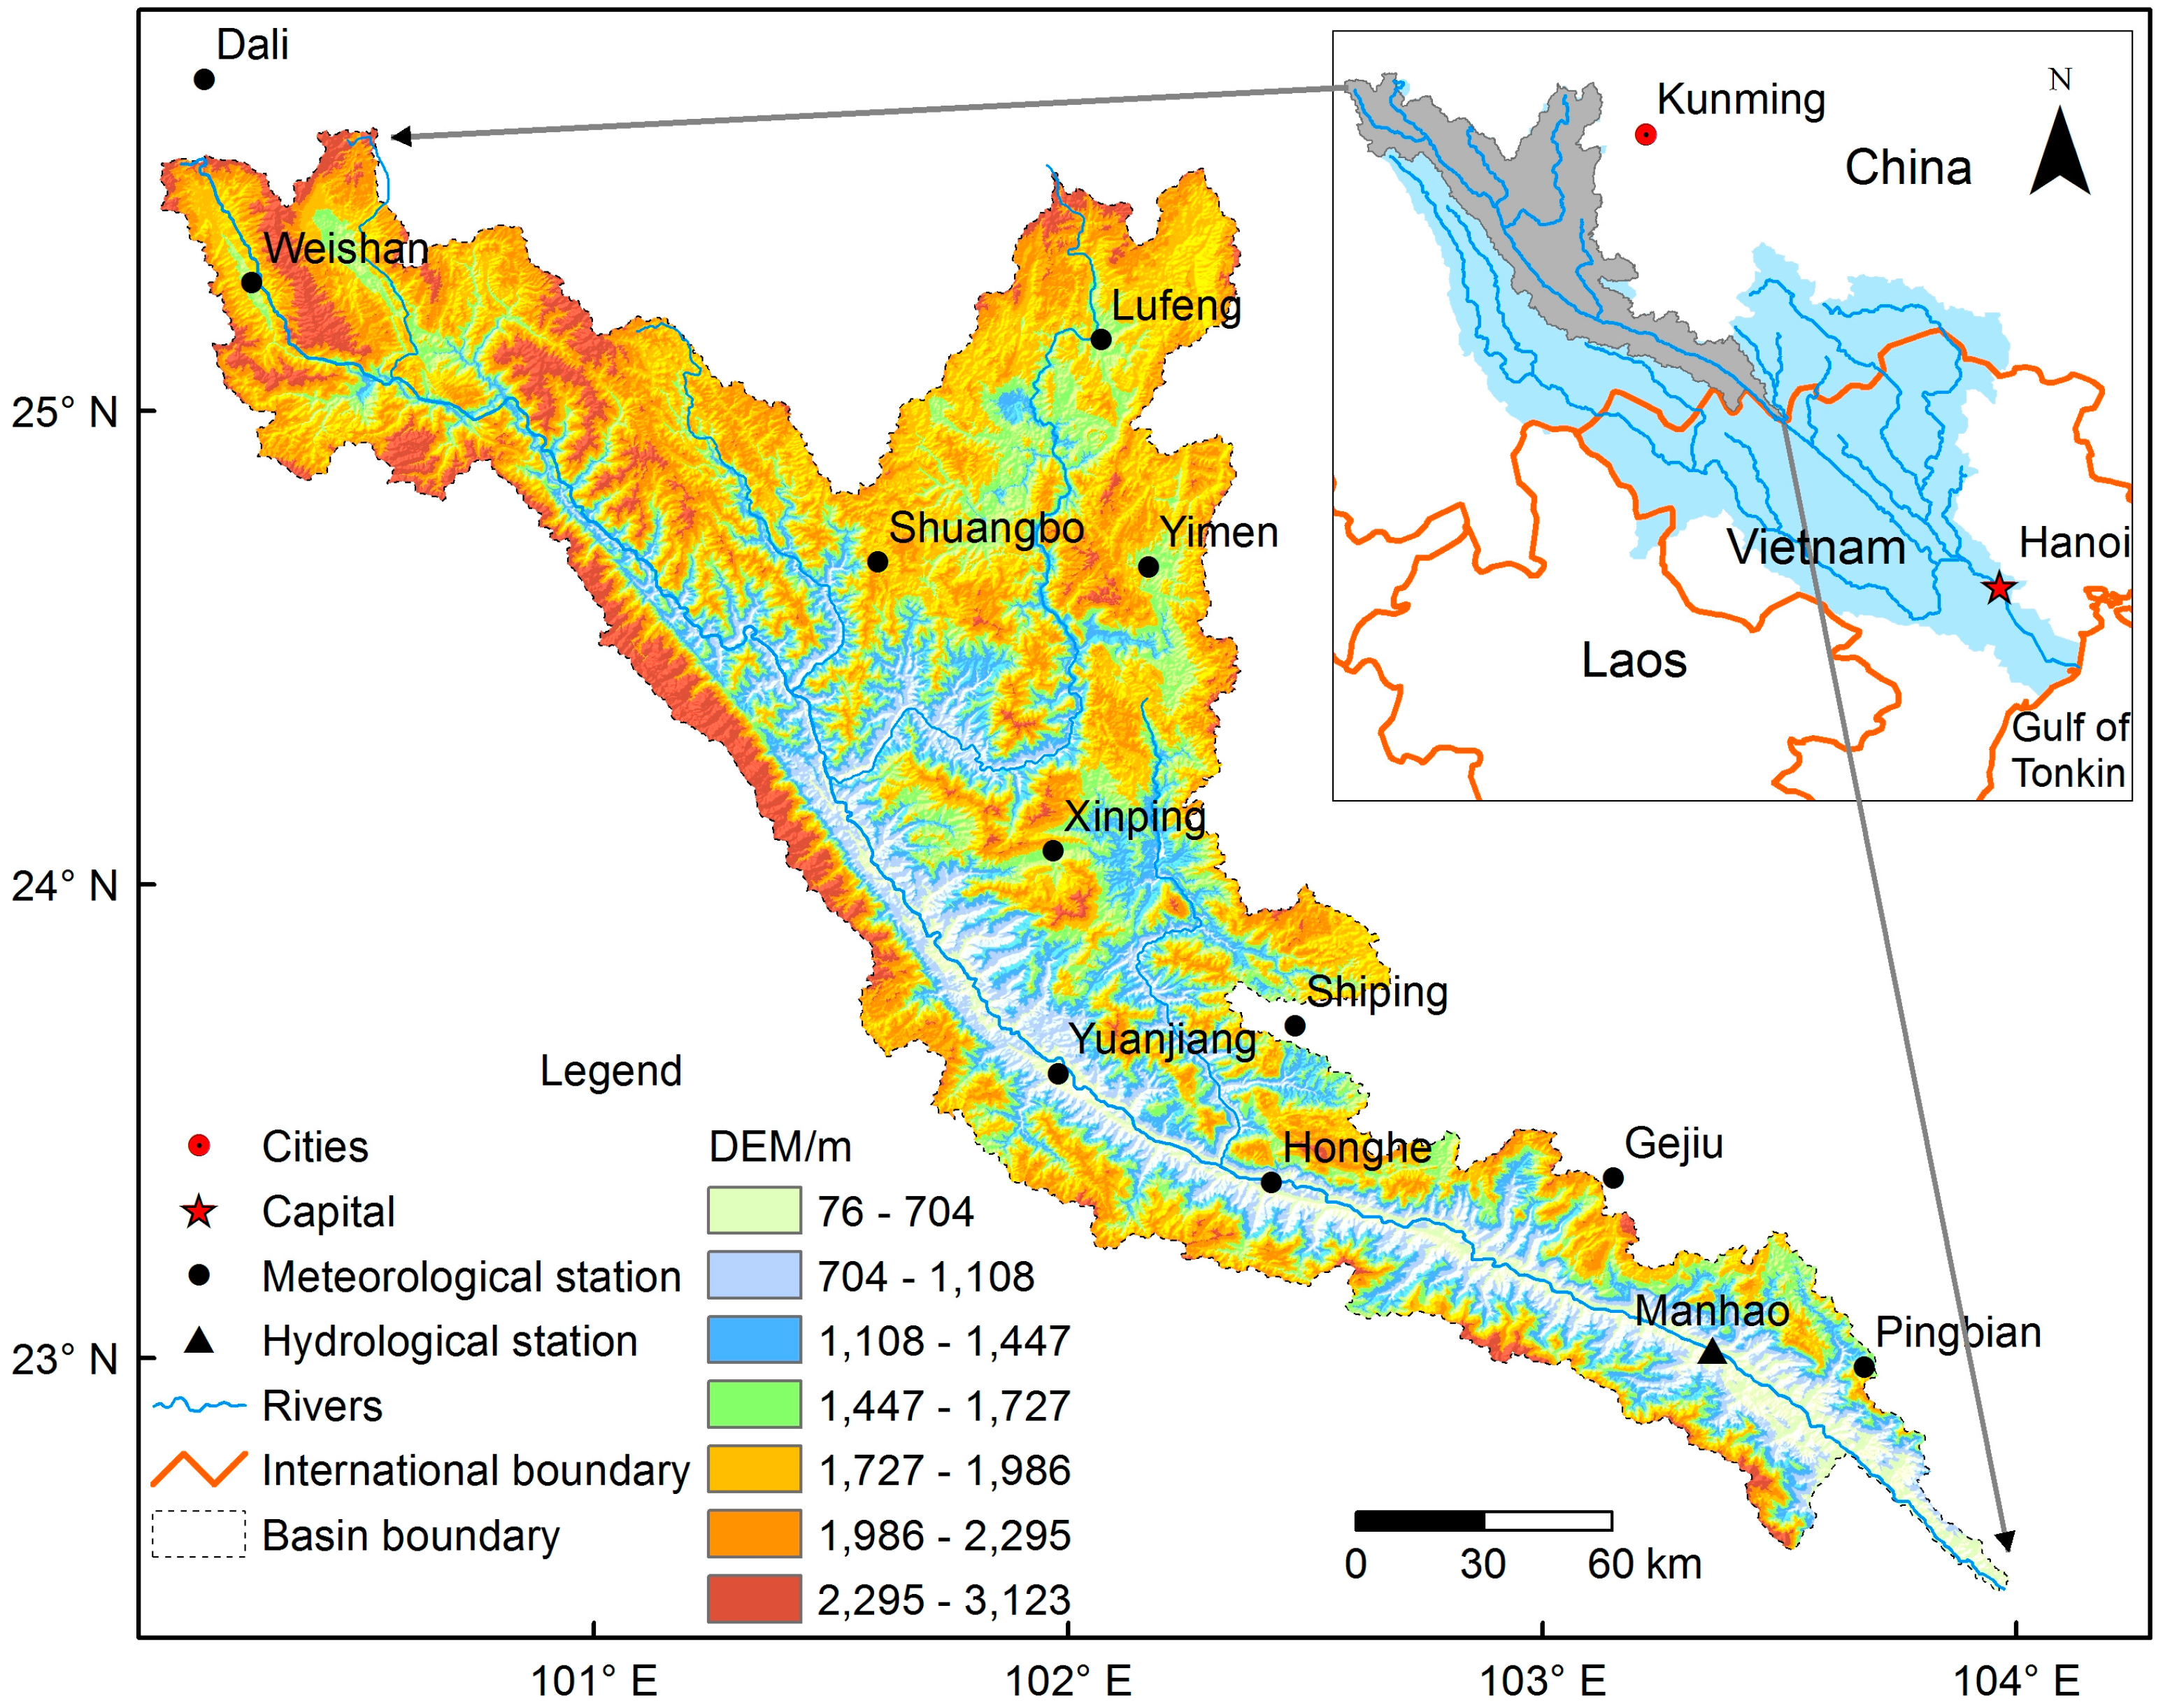
2.1. Description of the Study Area

The Red River originates in the mountainous area of Yunnan Province, China, flows 1280 km to the southeast, and ends in the Gulf of Tonkin, in the South China Sea. The upper catchment of the Red River Basin (URRB) is selected as the study area, which refers to the catchment north the China and Vietnam border (Figure 1). The catchment covers an approximate area of 33,614 km2. The elevation of the catchment ranges from 76 m to 3123 m above sea level, and the elevation decreases from the northwest to the southeast. It is characterized by a subtropical monsoon climate, with an annual average temperature of 14.8–23.8 °C. The annual average precipitation was about 976 mm, ranging from 643 mm to 1761 mm, and approximately 85% of the annual precipitation is concentrated in the rainy season (May to October). The annual average discharge was 286 m3/s at Manhao Station (the outlet of the Red River in China) for the period of 1961–2012. The estimation of the average annual runoff depth was 283 mm. There are no glaciers in the basin.
Land use in the URRB can be divided into six types: Cultivated land, forest, grassland, water, built-up area, and unutilized land (Figure 2). The dominant land use types are forest (about 61%) and grassland (about 22%). The rest of the land is cultivated land (about 16%) and other types (including built-up area, water, and unutilized land). From 1995 to 2010, changes in cultivated land and built-up area were obvious. Cultivated land and built-up area expanded by 20% and 106%, respectively. However, forest decreased by 5% during this same period. Grassland, water bodies, and unutilized land remained stable.

2.2. Data

Discharge data from the period of 1961–2012 from the Manhao hydrological station was obtained from the Hydrological Year Book and the Hydrological Bureau of Yunnan Province. The meteorological data used in this study include daily precipitation, mean air temperature, maximum temperature, minimum temperature, surface relative humidity, wind speed at 10 m height, and sunshine duration, during 1961–2012, for 11 stations inside or close to the study area (Figure 1). The meteorological data were collected from the China Meteorological Administration (CMA). Daily potential evapotranspiration for each station was estimated using the Penman–Monteith equation, as recommended by the Food and Agriculture Organization of the United Nations (FAO) [38]. NDVI (Normalized Difference Vegetation Index) data were obtained from the latest version of the GIMMS (Global Inventory Modeling and Mapping Studies) NDVI data set, which spans the period of 1982 to 2013, and is termed NDVI3g (third generation GIMMS NDVI, from Advanced Very High Resolution Radiometer sensors of National Oceanic and Atmospheric Administration). The land use maps from 1995 and 2010 were taken from the Institute of Geographical Sciences and Natural Resources Research (IGSNRR), the Chinese Academy of Sciences (CAS).

2.3. Methods

2.3.1. Mann–Kendall Test

The Mann–Kendall test was used to detect trends in hydro-meteorological series [39]. In the Mann–Kendall test, there is the null hypothesis, H0, that the data (x1, x2, ..., xn) are a sample of n independent and identically distributed random variables. The alternative hypothesis H1 of a two-sided test is that the distributions of xk and xj are not identical for all k, j. The Mann–Kendall’s statistic, S, is given by:
S   =   k = 1 n 1 j = k + 1 n sgn ( x j     x k ) ,
where the time series xk is from k = 1, 2, …, n − 1, and xj from j = k + 1, …, n. In addition,
sgn ( θ )   =   {   1           θ   >   0   0             θ   =   0 1         θ   <   0 ,
then, the parameters Zc and β are given as:
Z c   =   { S     1 / var ( S )       S   >   0   0                                                               S   =   0 S   +   1 / var ( S )       S   <   0 ,
where Z c   is the test statistic. When | Z c | > Z 1 α / 2 , in which Z 1 α / 2 are standard normal deviates, and α is the significance level for the test, H0 will be rejected. The magnitude of the trend is given as:
β   =   Median ( x j     x k j     k ) ,   k   <   j ,
where 1 < k < j < n, A positive value of β indicates an upward trend, whereas a negative value of β indicates a downward trend.

2.3.2. Pettitt’s Test

The Pettitt’s test is a non-parametric approach to determine the occurrence of a change point [40]. It tests the H0: the T variables follow one or more distributions that have the same location parameter (no change), against the alternative: a change point exists. The non-parametric statistic is defined as:
K T   =   max   | U t ,   T | ,
where
U t ,   T   =   i   =   1 t j   =   t + 1 T sgn ( x i     x j ) .
The change point of the series is located at KT, provided that the statistic is significant. The significance probability of KT is approximated for p ≤ 0.05 with
p     2 exp ( 6 K T 2 T 3   +   T 2 ) .

2.3.3. Framework of Separating the Effects of Climate Variability and Human Activities

For a given catchment, we assume that a change in mean annual runoff can be estimated as:
Δ R   =   R o b s , i     R o b s , b ,
where ΔR represents the total change in mean annual runoff, Robs,b is the average annual runoff during the baseline period, and Robs,i indicates the average annual runoff during the impacted period.
It can be assumed that the total change in runoff can be attributed to climate variability and human activities, which can be expressed as:
Δ R   =   Δ R C   +   Δ R H ,
where ΔRC represents the change in mean annual runoff caused by climate variability, and ΔRH is the change in mean annual runoff induced by human activities. With the estimation of ΔRC or ΔRH, the contributions of climate variability and human activities to runoff changes, which are defined as μC and μH, respectively, can be separated and estimated by:
μ C   =   Δ R C Δ R   ×   100 % ,
μ H   =   Δ R H Δ R   ×   100 % .
In this study, ΔRC is estimated by using hydrological sensitivity and climate elasticity methods, respectively. ΔRH is estimated by using hydrological simulation methods.

2.3.4. Hydrological Sensitivity Method

Hydrological sensitivity can be defined as the percentage change in mean annual runoff occurring in response to a change in mean annual precipitation and potential evapotranspiration. The water balance in a catchment can be described as:
P   =   E   +   R   +   Δ S ,
where P is precipitation, E is actual evapotranspiration, R is runoff, and ΔS is the change in catchment water storage. Over a long period of time (i.e., 10 years, or more), ΔS can be assumed to be zero.
Actual mean annual evapotranspiration can be estimated from precipitation and potential evapotranspiration. Budyko developed a framework for estimating actual evapotranspiration based on a dryness index [41]. Following a similar assumption to that of Budyko, Fu [42] combined dimensional analysis with mathematical reasoning, and developed analytical solutions for actual mean annual evapotranspiration (E) from P and potential evapotranspiration (E0):
E P     =     1     +     E 0 P         [ 1     +     ( E 0 P ) w ] 1 / w ,
where w is a parameter related to vegetation type, soil hydraulic property, and topography [43].
Precipitation and potential evapotranspiration are the dominant controls on mean annual water balance [41,44]. Changes in mean annual precipitation and potential evapotranspiration can lead to changes in annual runoff, and the relationship can be approximated as [15]:
Δ R C     =     R P   Δ P     +     R E 0   Δ E 0 ,
where ΔP, ΔE0 are changes in precipitation and potential evapotranspiration, respectively; and:
R P   =   P ( w 1 ) ( E 0 w   +     P w ) 1 / w 1  and ,
R E 0   =   E 0 ( w 1 ) ( E 0 w   +   P w ) 1 / w 1     1
are obtained from Equations (12) and (13).

2.3.5. Climate Elasticity Method

Schaake firstly employed the climate elasticity method to analyze the sensitivity of runoff to climate change [21]. The runoff elasticity is defined as the ratio of the runoff variation rate to the variation rate of a certain climate factor, as follows:
ε X   =   R / R X / X .
Based on the assumption that the response of runoff to the climate factors are mainly caused by P and E0, we can obtain the following equation [23]:
Δ R C   =   Δ R P   +   Δ R E 0   =   ε P   ×   R P   ×   Δ P   +   ε E 0   ×   R E 0   ×   Δ E 0 ,
where εP and ε E 0 are the precipitation elasticity and potential evapotranspiration elasticity, respectively.
Climate elasticity can be estimated based on the Budyko hypothesis. Yang et al. [45] derived the analytical water-energy balance equation at a mean annual time scale, which is expressed as:
E   =   P E 0 ( P n   +   E 0 n ) 1 / n ,
where parameter n represents the catchment properties, which are mainly related to properties of soil, topography, and vegetation [46]. Xu et al. [28] derived the climate elasticity of runoff from the differential form of the Yang equation:
ε P   =   { 1     [ ( E 0 / P ) n 1   +   ( E 0 / P ) n ] 1 n + 1 } / { 1     [ ( E 0 / P ) n 1   +   ( E 0 / P ) n ] 1 n } ,
ε E 0   =   1 1   +   ( E 0 / P ) n   ×   1 1     [ 1   +   ( E 0 / P ) n   ( E 0 / P ) n ] 1 n .

2.3.6. Hydrological Simulation Method

The hydrological simulation method is used to calibrate and validate a hydrological model for a natural period. The parameters of the hydrological model can represent the characteristics of a catchment under natural conditions, without the impact of human activities. Then, using the same model parameters, the runoff from the impacted period, without the impact of human activities, can be reconstructed. The effect of human activities on runoff is represented by the differences between the observed and simulated runoff for an impacted period.
Δ R H   =   R o b s , i     R s i m , i ,
where Robs,i and Rsim,i are the observed and simulated annual runoff in an impacted period, respectively.
The HBV model is a conceptual rainfall–runoff model, which is suitable for different purposes, such as simulation of long streamflow, streamflow forecasting and hydrological process research [47,48]. The model consists of four subroutines, a subroutine for snow accumulation and snowmelt, based on the degree-day approach; a soil routine groundwater recharge and actual evaporation are simulated as functions of actual water storage; a runoff generation routine; and a flow-routing procedure consisting of a simple filter with a triangular distribution of weights [49]. The HBV-light model, developed at the University of Zurich, was used to simulate the hydrological process in this study [50].
Four statistics are used to indicate the accuracy of the hydrological model: Coefficient of determination (R2), Nash–Shutcliffe efficiency (NSE), Benchmark efficiency (BE) and the relative bias (BIAS) [51,52,53]. The purpose of these statistics is to provide a more comprehensive evaluation of model performance. The expressions are as follows:
R 2  = [ i=1 n ( Q obs ( i )   Q obs ¯ )( Q sim ( i )   Q sim ¯ ) ] 2 / i=1 n ( Q obs ( i )    Q obs ¯ ) 2 i=1 n ( Q sim ( i )   Q sim ¯ ) 2 .
N S E   =   1     i = 1 n ( Q o b s ( i )     Q s i m ( i ) ) 2 / i = 1 n ( Q o b s ( i )     Q o b s ¯ ) 2 ,
B E   =   1   i = 1 n ( Q o b s ( i )     Q s i m ( i ) ) 2 / i = 1 n ( Q o b s ( i )     Q b ( i ) ) 2 ,
B I A S   =   i = 1 n ( Q s i m ( i )     Q o b s ( i ) ) / i = 1 n Q o b s ( i ) ,
where n is the number of data points, Qobs(i) is the observed runoff (millimeters per day) at time step i, Qsim(i) is the simulated runoff (millimeters per day) at time step i, and Q o b s ¯ and Q s i m ¯ are the means of the observed and simulated values (millimeters per day), respectively. Qb(i) is the benchmark model discharge (millimeters per day) at time step i.

3. Results

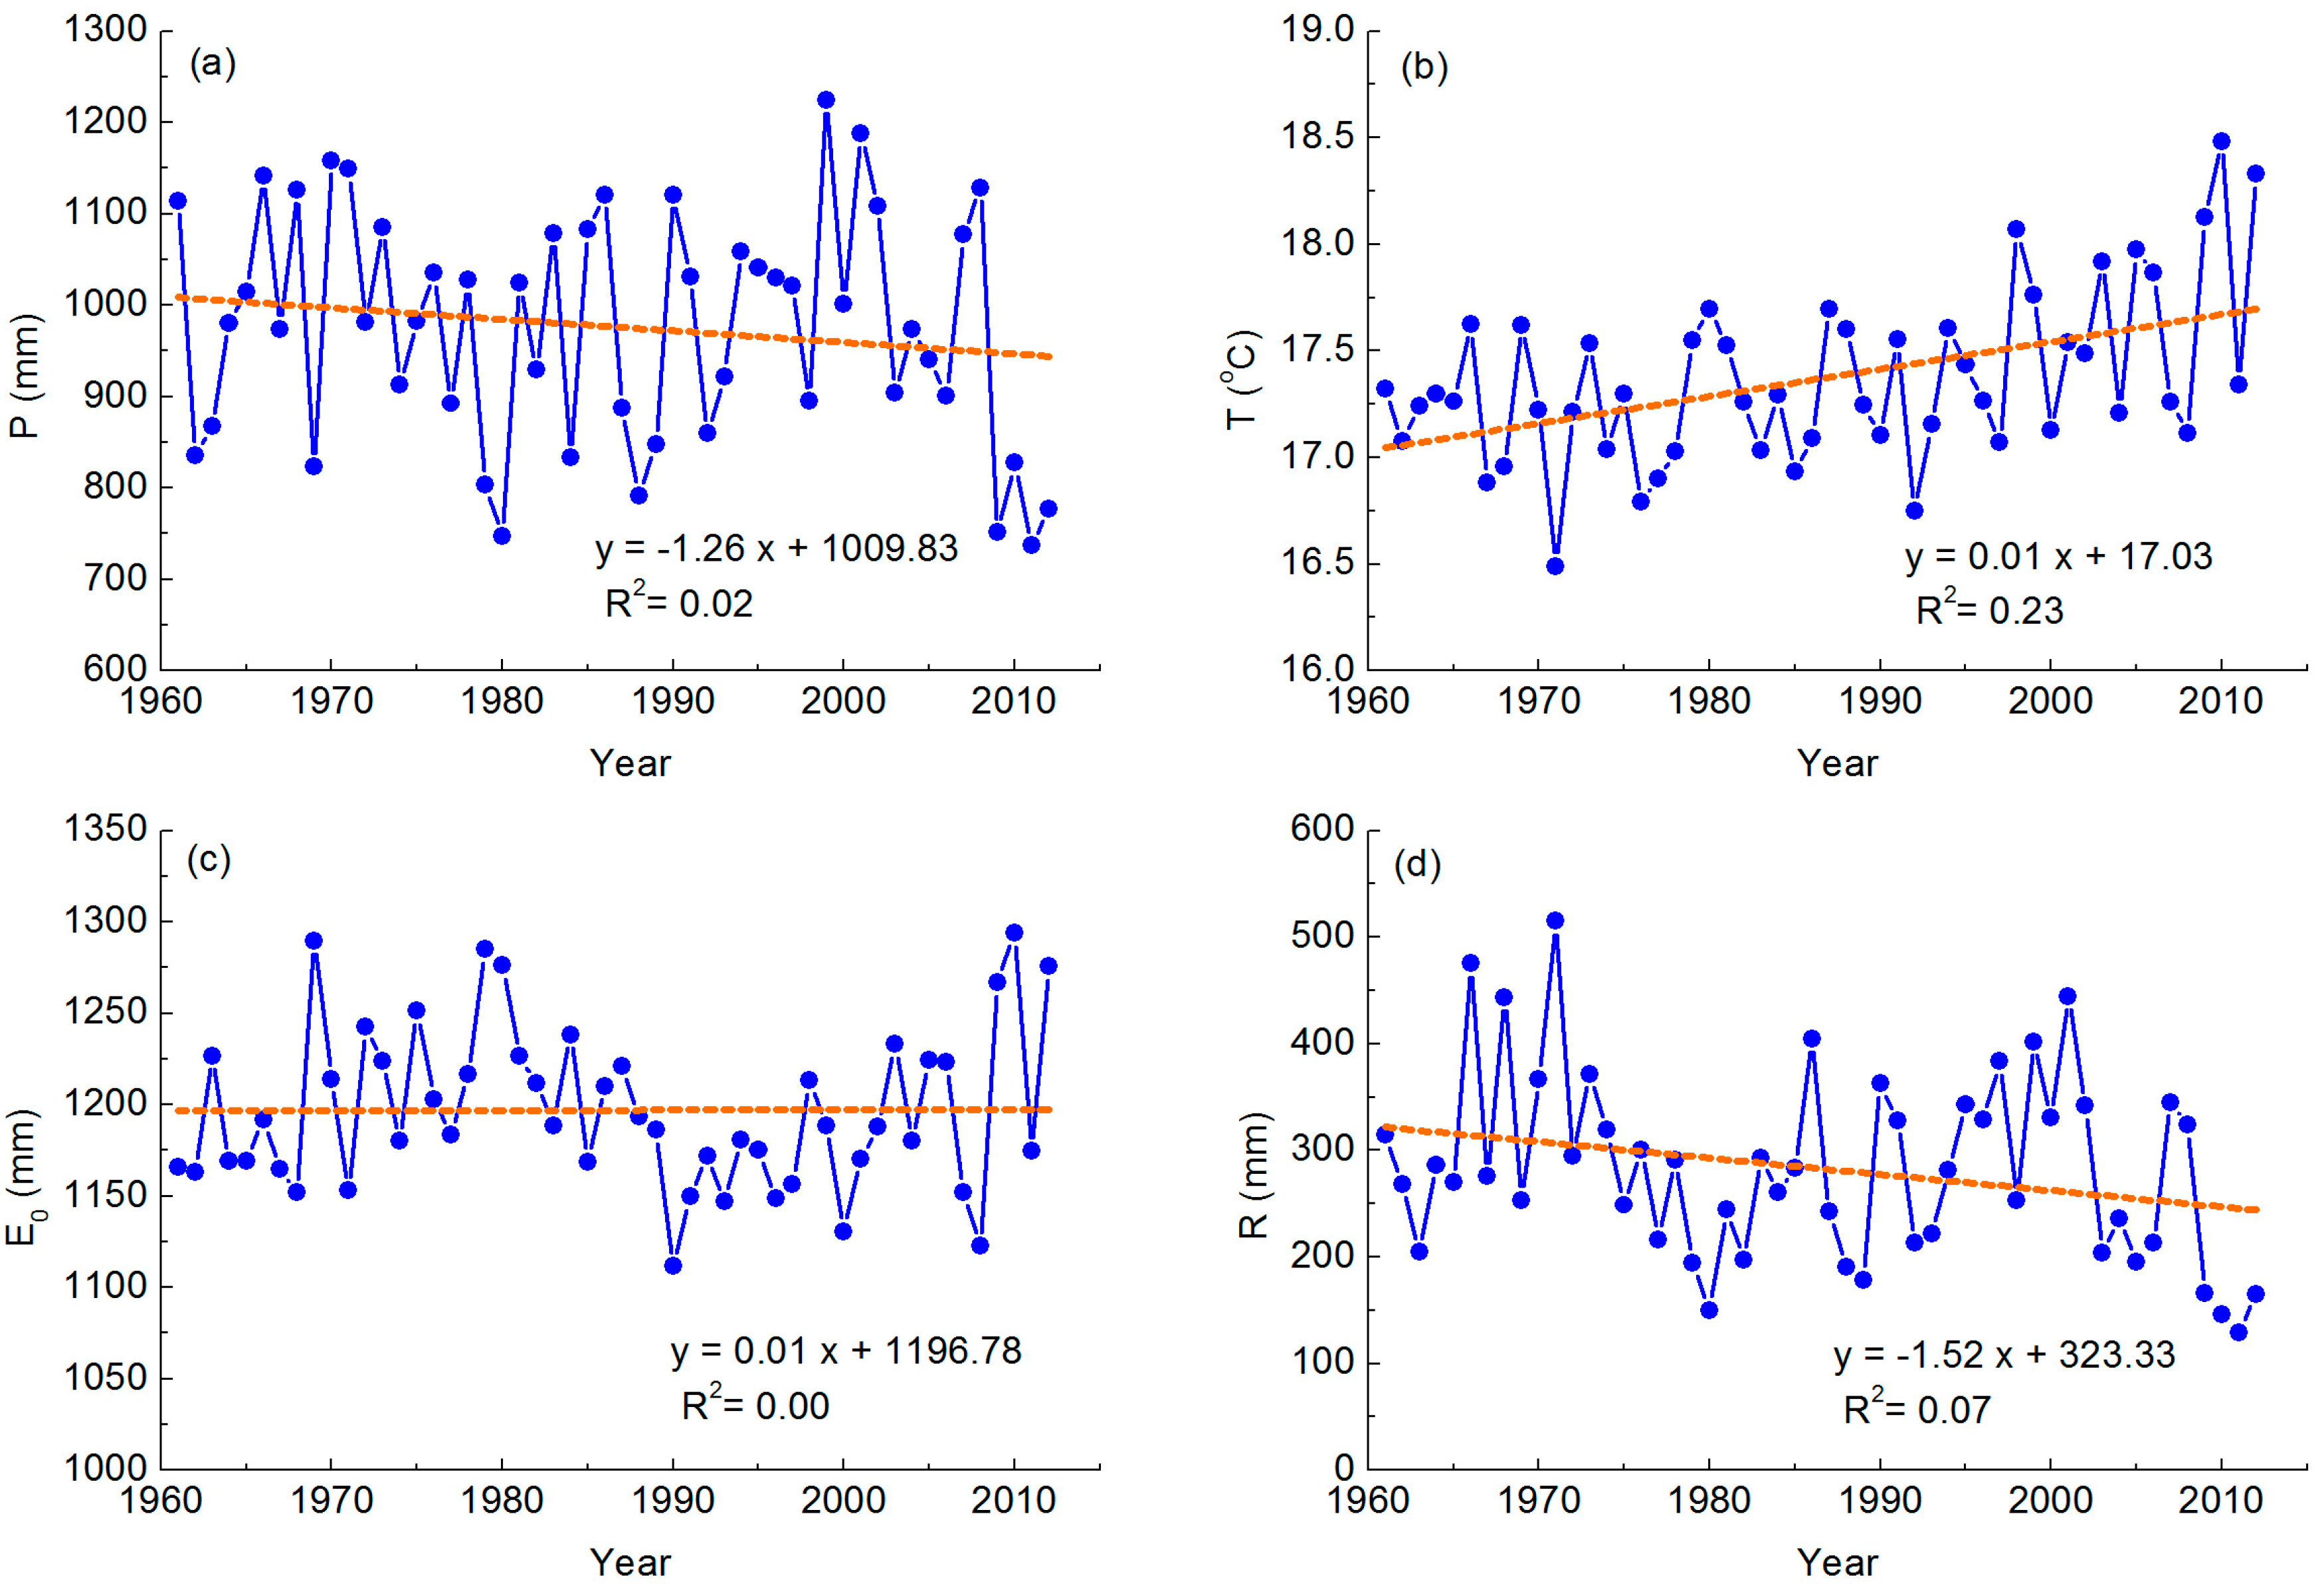
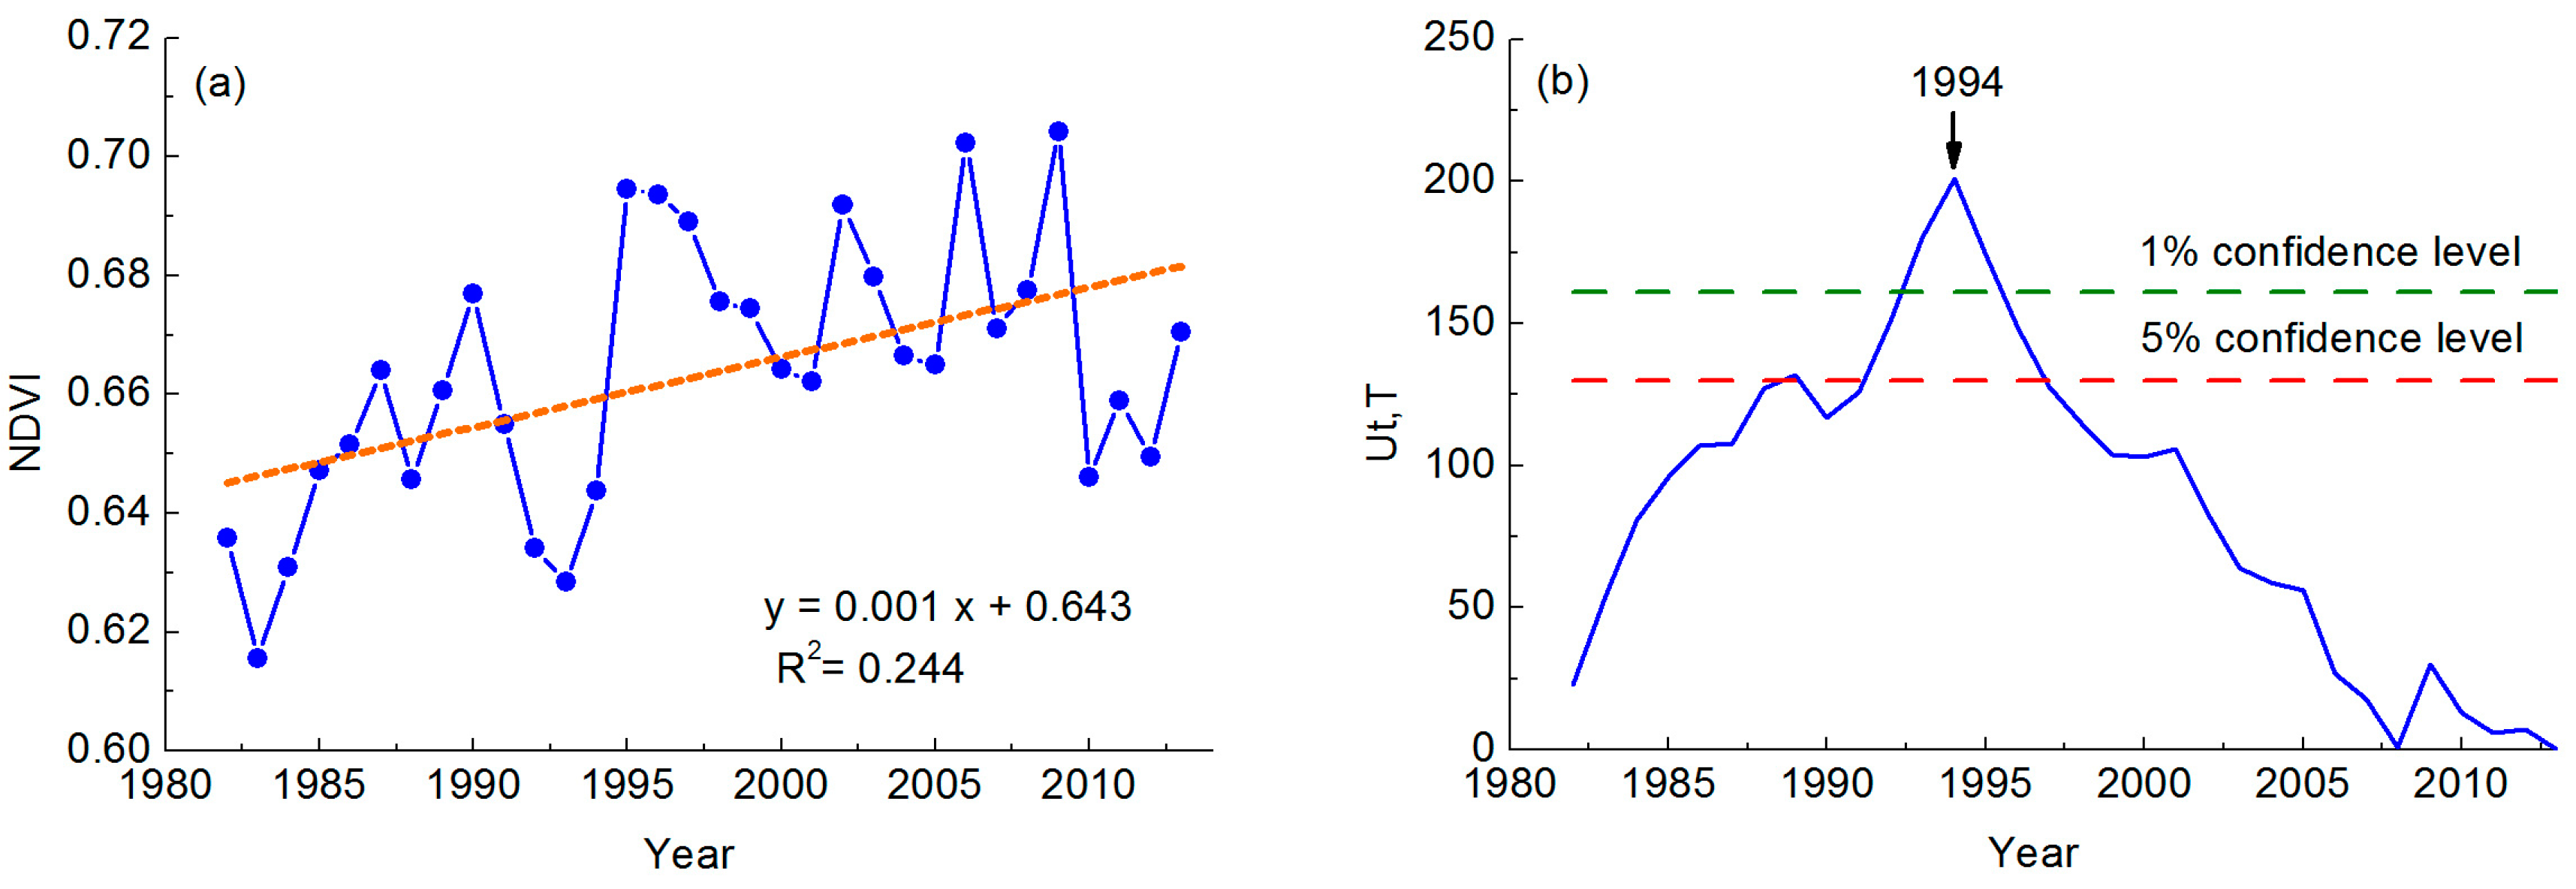
3.1. Change Trends of Meteorological and Hydrological Variables

The variations of annual precipitation (P), temperature (T), potential evapotranspiration (E0), and runoff (R) during 1961–2012 are presented in Figure 3. The trends, and their significance to the time series were detected using the Mann–Kendall test (Table 1). The mean annual P over 1961–2012 is approximately 976.42 mm, with a higher inter-annual variability, as shown in Table 1 and Figure 3a. The annual P showed a non-significant decreasing trend of 1.53 mm/year. The annual T showed a significant increasing trend of 0.01 °C/year for the whole period, with an average of 17.37 °C and a variation range of 16.49 °C to 18.48 °C, as shown in Table 1 and Figure 3b. The annual E0 varied from 1111.93 mm to 1293.72 mm, and had no significant trend during 1961–2012, as shown in Figure 3c. Figure 3d shows that the annual R presents high variability, ranging from 515 mm in 1971 to 129 mm in 2011. The annual R decreased by 1.57 mm/year at the 10% significance level (Table 1). The Pettitt’s test was applied to detect the change points of the hydro-meteorological series. The results showed that an abrupt change in annual R series occurred in 2002, with a significance level of 10%. Two change points in annual T series were detected in 1993 and 1997, with a significance level of 1%. However, no change points were detected for the annual P and E0 series.

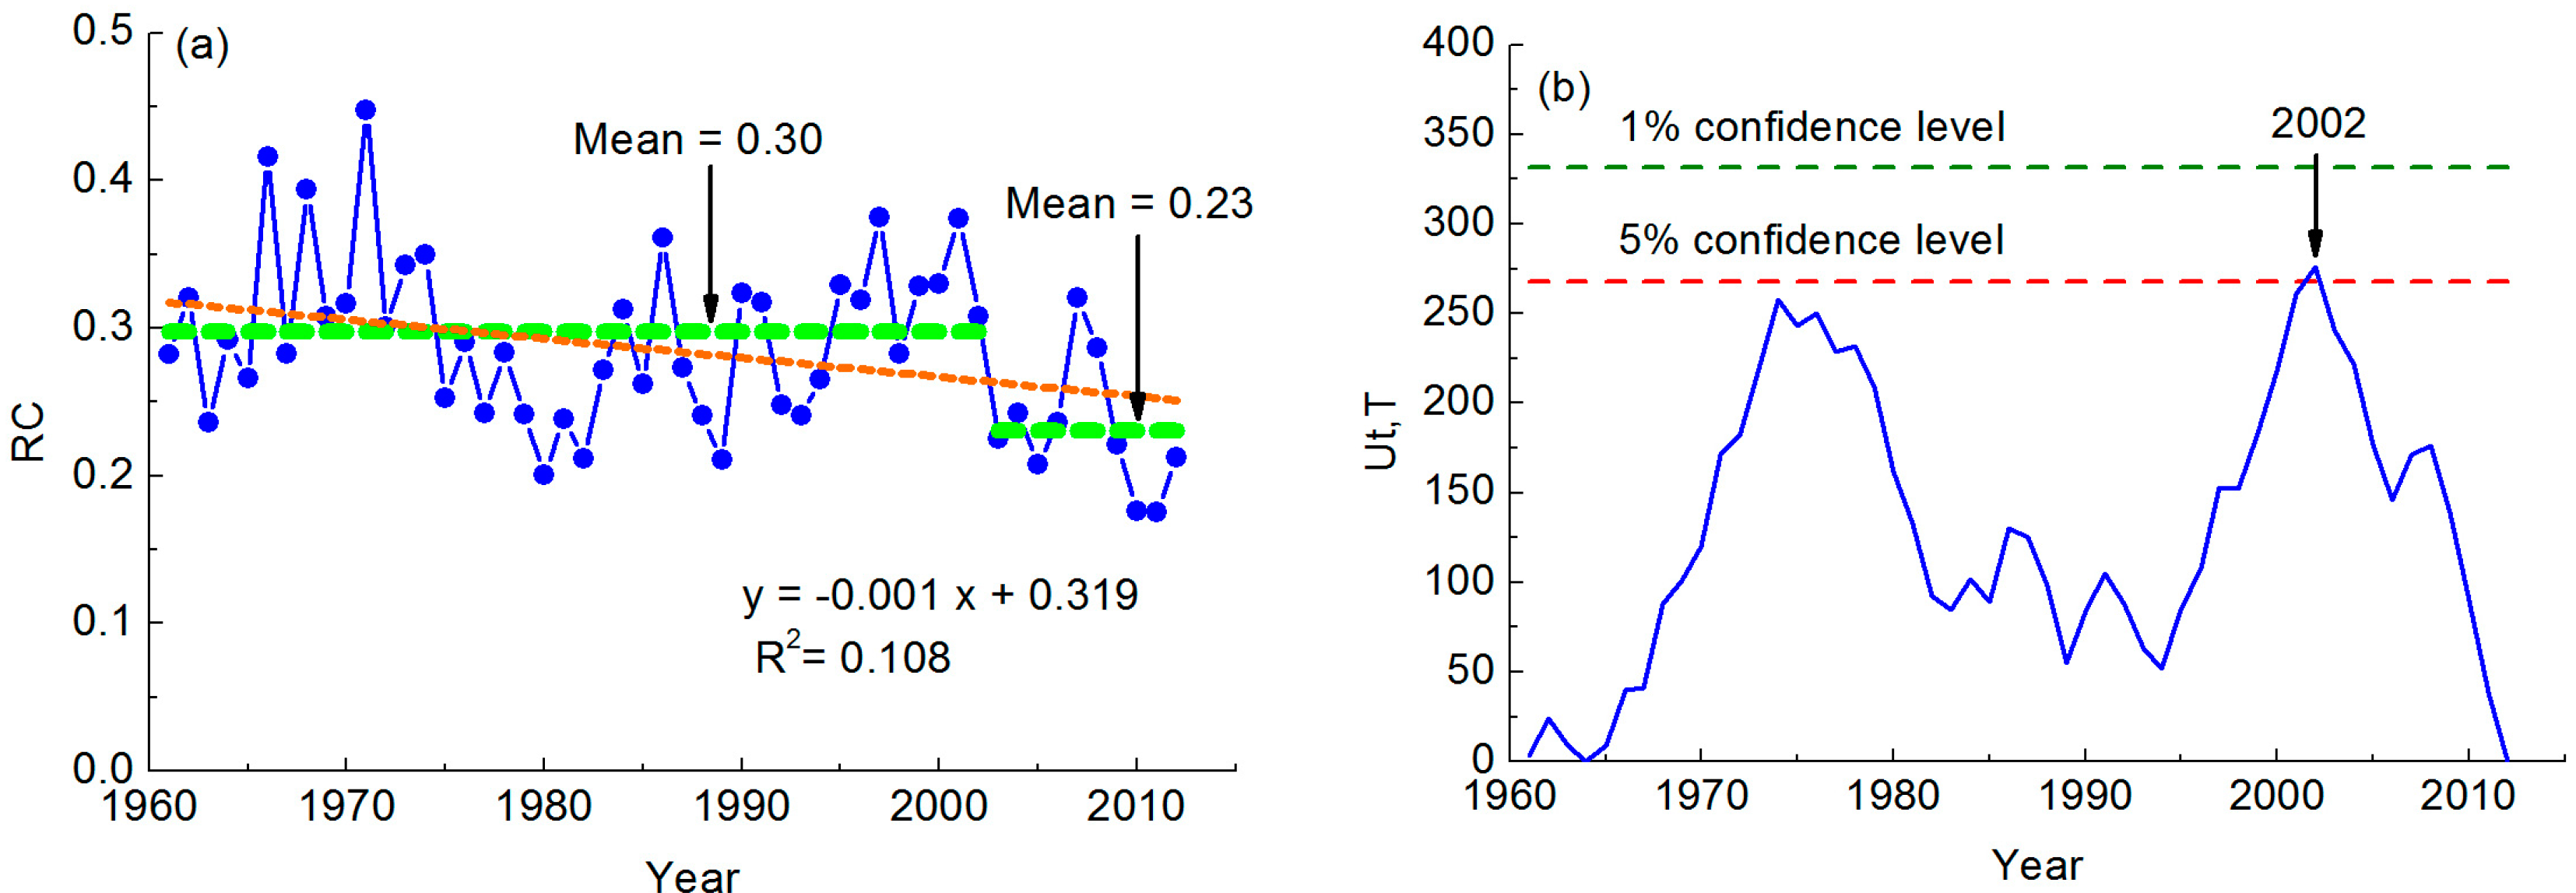
3.2. Change in the Precipitation-Runoff Relationship

The relationship between precipitation and runoff is a recapitulative description of the hydrological process [32]. The runoff coefficient (RC) is a simple index reflecting the relationship between precipitation and runoff, and may be a comprehensive index to describe the environment of a regional hydrological cycle, which is a useful measure for evaluating the effect of underlying surface change [17,54]. Figure 4 shows the trend and change point in annual RC series. Overall, the mean annual RC of the URRB was approximately 0.28, with a significant decreasing trend at the 5% significance level during 1961–2012 (Figure 4a). The Pettitt’s test was applied to detect the change points of the annual RC series. A change point was detected in 2002, with a significance level of 5% for the annual RC series (Figure 4b). The mean RCs were 0.30 and 0.23 over 1961–2002 and 2003–2012, respectively. Compared with the period of 1961–2002, the RC obviously decreases by 23% during 2003–2012. This implied that the ability of production flow of the catchment decreases, and that runoff generation might be impacted by underlying surface changes.
According to the analysis results of trends and change points, the evolution of annual runoff can be divided into a baseline period and an impacted period. The baseline period (1961–2002) is assumed as the natural period, during which time the effects of human activities on runoff were less recognized, while the impacted period (2003–2012) is assumed to have measurable effects of climate change and human activities on runoff. For the two periods, changes in mean annual P, T, E0 and R were calculated, as shown in Table 2. Compared with the baseline period, observed P and R decreased, respectively, by 9.28% and 29.13% in the impacted period; however, E0 increased by 1.83%, which is lower than that of P and R. The T increased by 0.48 °C from the baseline period to the impacted period. Based on the divided periods, the effects of climate variability and human activities on runoff can be separated by using hydrological sensitivity analysis, climate elasticity analysis, and hydrological simulation methods, respectively.

3.3. Hydrological Sensitivity Analysis

In the hydrological sensitivity method, the parameter w in the Fu equation, representing the catchment characteristics, was calibrated according to Equations (12) and (13), based on mean P, E0, and R in the baseline period; the obtained w value is 2.266. Based on the Equations (15) and (16), the sensitivity coefficients of runoff to P (∂R/P) and E0 (∂R/E0) were calculated as 0.598 and −0.247, respectively. The absolute value of ∂R/P is larger than that of ∂R/E0, revealing that runoff is more obvious sensitive to change in P than it is to change in E0. According to Equation (14), the effect of climate variability on runoff can be estimated. A P reduction of 92.31 mm resulted in a 55.19 mm decrease in runoff, while an E0 increase of 21.81 mm resulted in a 5.39 mm decrease in runoff. Thus, the combined effects of P and E0 lead to a runoff reduction of 60.58 mm.

3.4. Climte Elasticity Analysis

In the climate elasticity method, the parameter n in the Yang equation was estimated according to Equations (12) and (19), based on mean P, E0, and R in the baseline period; the obtained n value is 1.562. Using Equations (20) and (21), the elasticity coefficients of runoff to P (εP) and E0 (εE0) were calculated as 1.994 and −0.994, respectively. It indicates that a 10% decrease in P will cause a 19.94% decrease in R, and a 10% increase in E0 will cause a 9.94% decrease in R. Comparing the elasticity coefficients of runoff to P and E0, a stronger response of runoff to P than that to E0 are found, which is in consistent with the results from hydrological sensitivity analysis. According to Equation (18), the effect of climate variability on runoff can be estimated. A P reduction of 92.31 mm resulted in a 55.48 mm decrease in runoff, while an E0 increase of 21.81 mm resulted in a 5.45 mm decrease in runoff. Thus, a total of 60.93 mm in runoff reduction can be explained by climate variability.

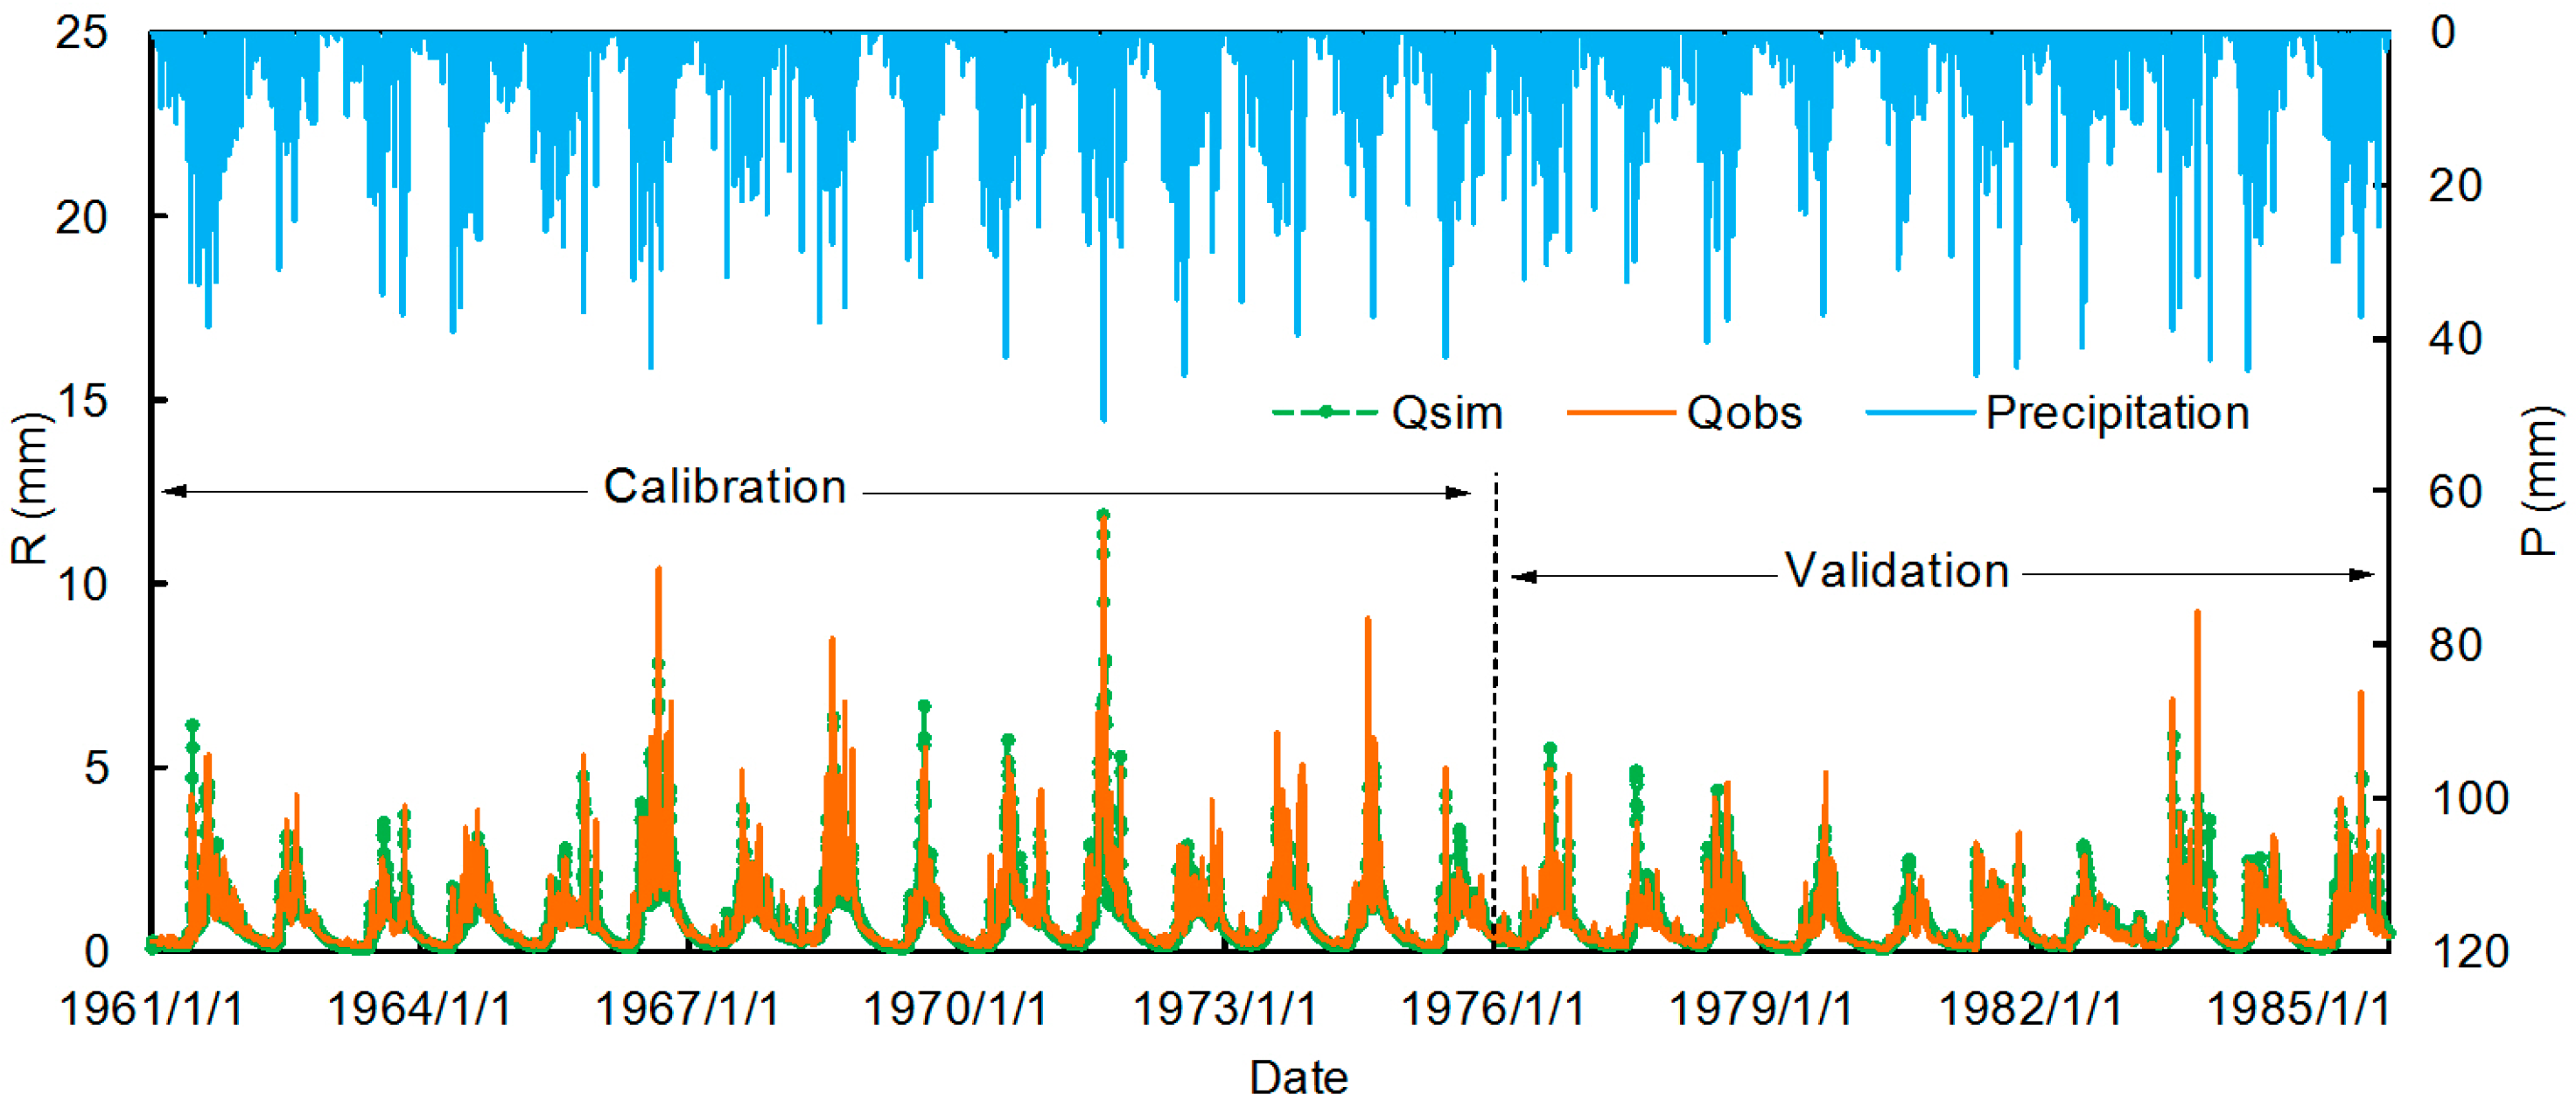
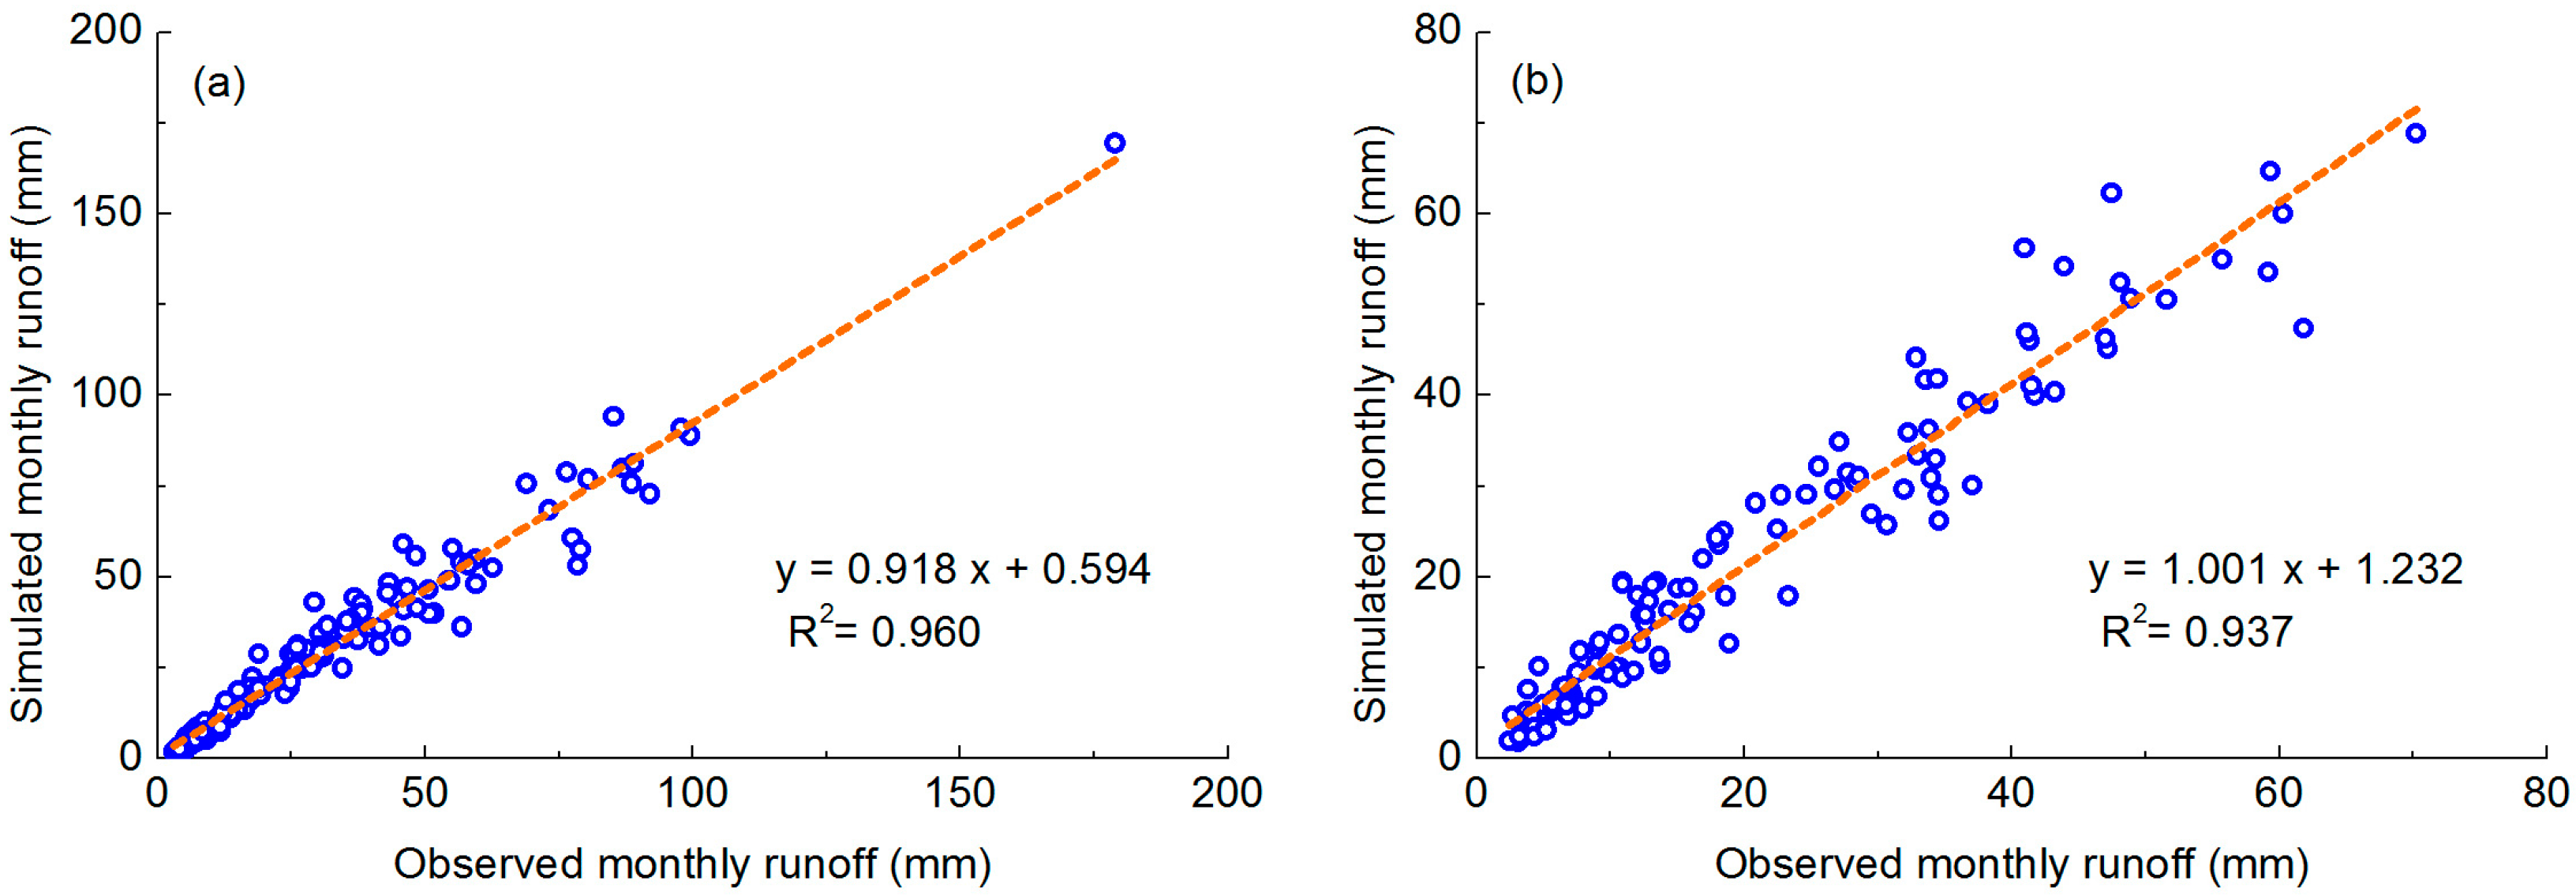
3.5. Hydrological Simulation

The URRB can be regarded as a natural catchment before the mid-1980s because there was little human activity in the area during this period. Therefore, the HBV-light model was first calibrated by using Automatic Genetic Algorithm Package (GAP) optimization and manual calibration based on the daily climatic and hydrologic data during the period of 1961–1975, and then validated for the period of 1976–1985. The statistics for evaluation of the hydrological model are shown in Table 3. The coefficients of determination (R2) and Nash–Shutcliffe efficiency (NSE) are greater than 0.8 in both calibration and validation periods, suggesting a satisfactory model performance [52]. The benchmark efficiencies (BE) are greater than 0.7, indicating the seasonality in discharge could be captured by the model. The relative bias (BIAS) is relative small (less than 7%) in both calibration and validation periods. Figure 5 and Figure 6 show the simulated and observed runoff during the calibration and validation periods. The results shown in Figure 5 and Figure 6 generally indicate a good match between the observed and simulated runoffs. These indicate that the HBV-light simulations can capture the temporal variations of runoff reasonably well in the URRB.
After the HBV-light model is benchmarked, meteorological data (P, T and E0) for the impacted period are used as input to simulated runoff with no consideration of human activities. According to Equation (22), the difference between the observed and simulated annual runoffs in the impacted period reflects the impact of human activities. The observed and simulated annual runoffs were 212.42 mm and 237.63 mm in the impacted periods, respectively. Therefore, human activities resulted in a 25.21 mm decrease in runoff. Compared to the 87.31 mm of actual runoff reduction, climate variability was responsible for a 62.10 mm reduction in runoff.

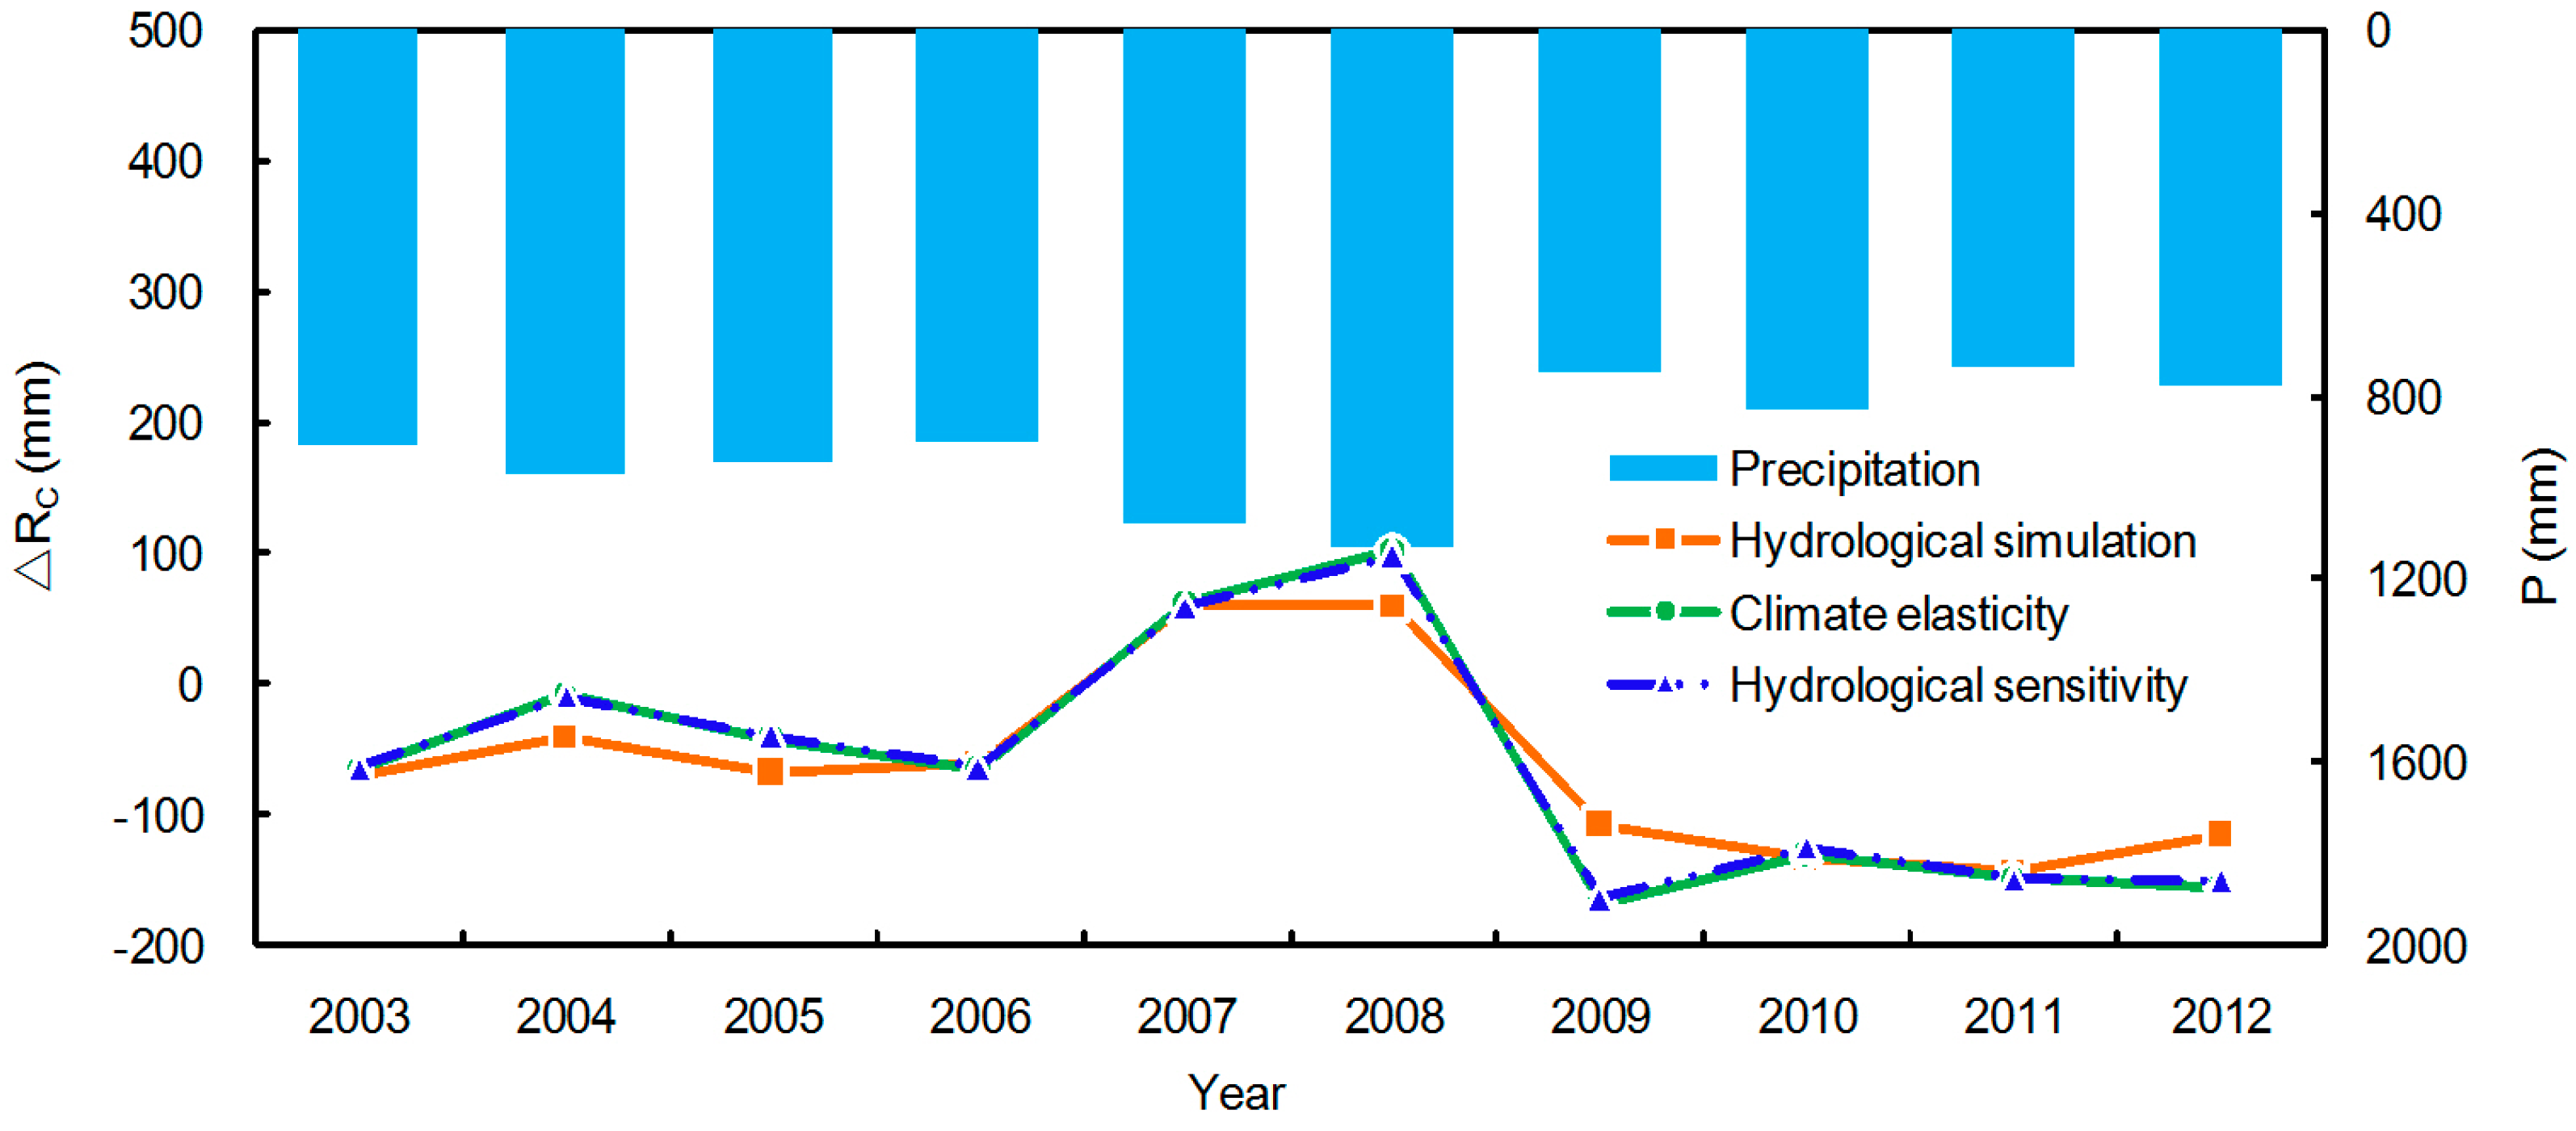
3.6. Contributions of Climate Variability and Human Activities to Runoff Decrease

With the simulated results from the three different methods, the effects of climate variability and human activities on runoff can be separated based on Equations (8)–(11), and the results are shown in Table 4. The hydrological sensitivity, climate elasticity, and hydrologic simulation methods provided similar estimates of the change in runoff for the impacted period, induced by climate variability and human activities. Climate variability should be responsible for 69%–71% of the reduction in annual runoff, and the 29%–31% runoff reduction is explained by human activities. The runoff reduction during the impacted period is mainly attributed to climate variability in the URRB; however, human activities also played an important role in runoff reduction.
Figure 7 presents the yearly time series of ΔRC for the impacted period, based on the hydrological sensitivity, climate elasticity, and hydrological simulation methods. ΔRC, estimated from the hydrological sensitivity and climate elasticity methods, are basically consistent. Although there are some differences in ΔRC estimated by hydrological simulation methods for some years, especially for years when precipitation was very high or low, the overall process of ΔRC presents similar estimates. Moreover, a positive effect of climate variability on runoff can be found when the annual precipitation is high. This phenomenon was also found in some earlier studies in other areas of China, for example, the Haihe River Basin [12] and the Weihe River Basin [30]. Precipitation is the main source of runoff in the URRB, and the relationship between P and R is closely related. Therefore, more surface runoff was produced when precipitation was high.

4. Discussion

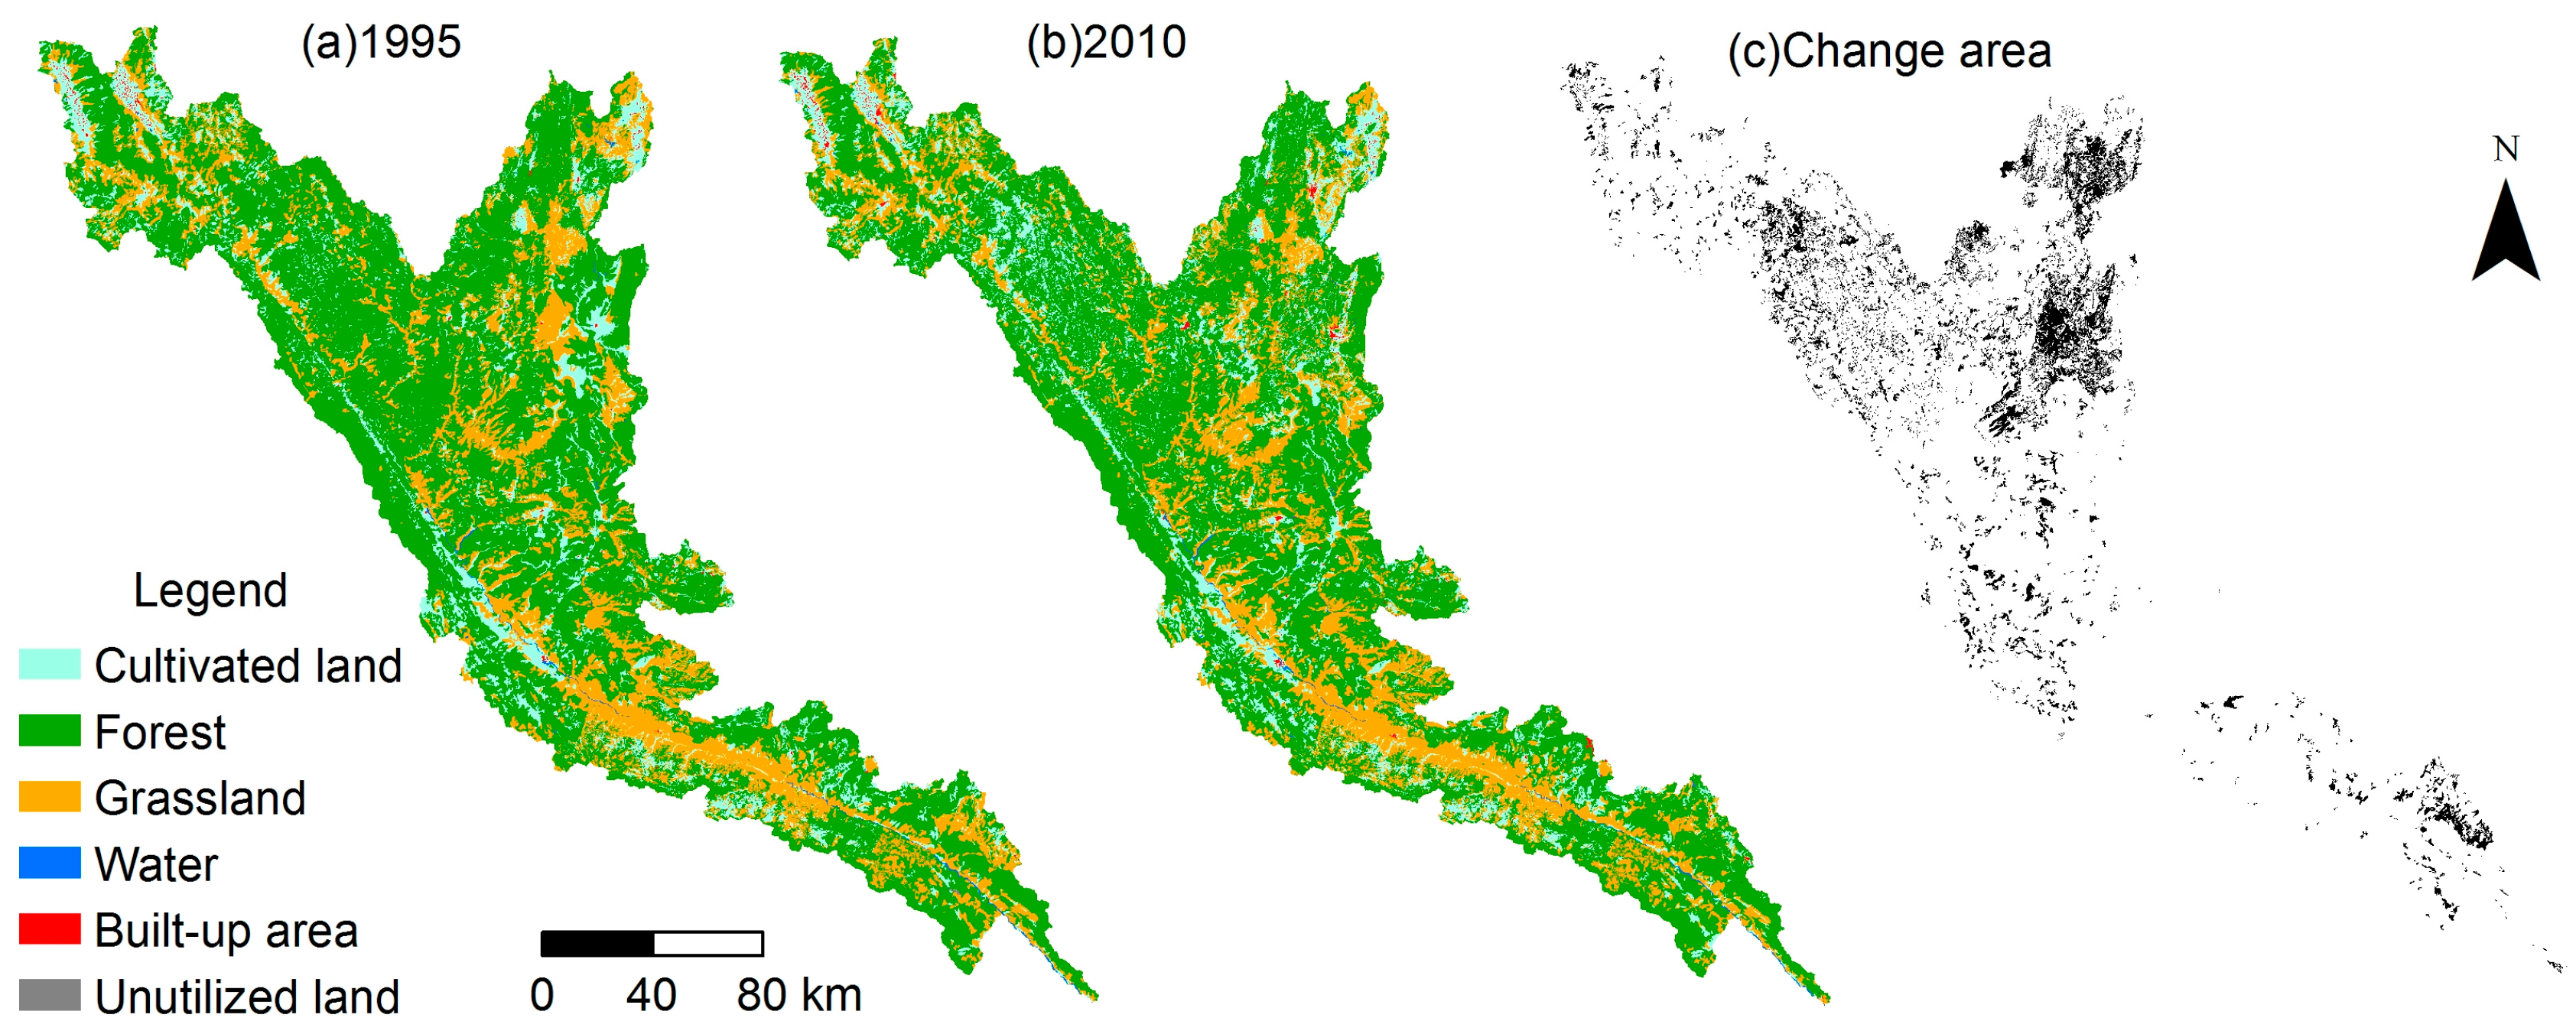
4.1. Effects of Human Activities on Runoff

The parameters w and n in the Fu and Yang equations, respectively, represent the catchment properties, which are mainly related to properties of soil, topography, and vegetation [43,46]. Since the changes of soil and topography are not obvious over a period of several decades, changes in the w and n values are mainly attributed to vegetation change, induced by climate change and local activities. The average w and n values in the impacted period are higher than those in the baseline period. Increases in w and n values mean an increase of vegetation [17,28]. In order to study vegetation change in the catchment, NDVI data from 1982 to 2013 was used to analyze the trend of change in vegetation. Annual NDVI increased significantly over the URRB during 1982–2013 (Figure 8a). A change point was detected in 1994, with a significance level of 1% for the annual NDVI series (Figure 8b). The NDVI increase may be attributed to soil and water conservation, and may also be partially due to climate variability, especially the increase in temperature. Overall, an increase of vegetation leads to an increase of evaporation and a decrease of runoff [28,44].
Human activities, which mainly include water engineering projects, agricultural irrigation, and increasing water demand, also have direct impacts on runoff changes. Since 2003, reservoirs were constructed for water storage and supply in order to meet an increasing demand for water. For example, at the mainstream of the Red River, the Nansha reservoir, with 0.265 billion m3 of storage, and the Madushan reservoir, with 0.551 billion m3 of storage, were built in 2006 and 2008, respectively. Reservoirs can result in enhancing the water-withdrawing capacity of the local population, and an increase in total evaporation from the reservoirs. Moreover, with the enlargement of the irrigation area in the catchment, dramatic increase in water demand has increased the amount of water drawn from rivers and reservoirs. With economic development and an increase in population, water demand by industries and domestic usage has increased, subsequently, resulting in a decrease in runoff.

4.2. Uncertainty of Methods

Uncertainty may come from the approximation in the framework to separate the effects of climate variability and human activities on runoff. The framework is based on the assumption that human activity is independent of climate change [12,23]. In fact, the effects of human activities and climate are inter-related. Bosshard et al. [55] proposed an ANOVA-based method to quantify the different uncertainty sources in hydrological climate-impact modeling, which will help to promote the understanding of interactions between terms. Moreover, there is also uncertainty in using change points to define the baseline period. One reason is that a change point can be the result of human activity or climate variability. Another reason is the fundamental assumption that, prior to the change point, human activity was negligible [9].
The hydrological sensitivity and climate elasticity methods denote the response of runoff to annual P and E0. However, runoff can be influenced by changes in other precipitation characteristics, such as seasonality, intensity, and concentration [12]. Furthermore, the HBV-light model easily satisfies the data requirement, but it does not simulate all physical processes of the hydrological cycle when compared with the distributed hydrological model. Although the model has satisfying results, the simulated annual runoff still had a slight difference when compared to the observed annual runoff. Some uncertainties in the simulation may arise from the model parameters [25]. Moreover, uncertainty exists in the limited hydro-meteorological data. The meteorological data from 11 stations used in this study might not be sufficient coverage for a mountainous catchment of 38,000 km2.
In the current study, the hydrological sensitivity, climate elasticity, and hydrologic simulation methods were independently executed and were based on different time scales, and their simulated results were compared with each other. These methods obtained very similar results for the effects of climate variability and human activity on runoff, which also reinforced the assessment of effects in this study.

5. Conclusions

This study quantifies the effects of climate variability and human activities on runoff changes in the upper catchment of the Red River Basin, China. The results indicated that annual runoff had a significant decreasing trend during the period of 1961–2012. A change point in the annual runoff coefficient occurred in 2002. Accordingly, the annual runoff series were divided into a baseline period (1961–2002) and an impacted period (2003–2012). Mean annual runoff in the impacted period decreased by 29.13% when compared to the baseline period. The hydrological sensitivity, climate elasticity, and hydrological simulation methods were used to separate the effects of climate variability from human activities. Climate variability was the dominant factor, accounting for 69%–71% of the reduction in annual runoff; human activities are responsible for 29%–31% of the runoff reduction. The results can provide a scientific basis for sustainable water resource planning and management in the catchment.

Acknowledgments

This work was funded by the National Natural Science Foundation of China (Grant 41301099), and the National Key Research and Development Program of China (Grant 2016YFA0601601). We are very grateful to the editors and anonymous reviewers for their valuable comments, which greatly improved the quality of the paper.

Author Contributions

Yungang Li conceived and designed the study, and contributed to the writing of the paper; Xue Li, Yueyuan Zhang and Liyan Yang participated in data processing; and Daming He reviewed the manuscript.

Conflicts of Interest

The authors declare no conflict of interest.

References

  1. Vörösmarty, C.J.; Green, P.; Salisbury, J.; Lammers, R.B. Global water resources: Vulnerability from climate change and population growth. Science 2000, 289, 284–288. [Google Scholar] [CrossRef] [PubMed]
  2. Milliman, J.D.; Farnsworth, K.L.; Jones, P.D.; Xu, K.H.; Smith, L.C. Climatic and anthropogenic factors affecting river discharge to the global ocean, 1951–2000. Glob. Planet. Chang. 2008, 62, 187–194. [Google Scholar] [CrossRef]
  3. Labat, D.; Goddéris, Y.; Probst, J.L.; Guyot, J.L. Evidence for global runoff increase related to climate warming. Adv. Water Resour. 2004, 27, 631–642. [Google Scholar] [CrossRef] [Green Version]
  4. Huntington, T.G. Evidence for intensification of the global water cycle: Review and synthesis. J. Hydrol. 2006, 319, 83–95. [Google Scholar] [CrossRef]
  5. Vitousek, P.M.; Mooney, H.A.; Lubchenco, J.; Melillo, J.M. Human domination of Earth’s ecosystems. Science 1997, 277, 494–499. [Google Scholar] [CrossRef]
  6. Brown, A.E.; Zhang, L.; McMahon, T.A.; Western, A.W.; Vertessy, R.A. A review of paired catchment studies for determining changes in water yield resulting from alterations in vegetation. J. Hydrol. 2005, 310, 28–61. [Google Scholar] [CrossRef]
  7. Scanlon, B.R.; Jolly, I.; Sophocleous, M.; Zhang, L. Global impacts of conversions from natural to agricultural ecosystems on water resources: Quantity versus quality. Water Resour. Res. 2007, 43. [Google Scholar] [CrossRef]
  8. Ma, Z.M.; Kang, S.Z.; Zhang, L.; Tong, L.; Su, X.L. Analysis of impacts of climate variability and human activity on streamflow for a river basin in arid region of northwest China. J. Hydrol. 2008, 352, 239–249. [Google Scholar] [CrossRef]
  9. Wang, X.X. Advances in separating effects of climate variability and human activity on stream discharge: An overview. Adv. Water Resour. 2014, 71, 209–218. [Google Scholar] [CrossRef]
  10. Li, Y.Y.; Chang, J.X.; Wang, Y.M.; Jin, W.T.; Guo, A.J. Spatiotemporal impacts of climate, land cover change and direct human activities on runoff variations in the Wei River Basin, China. Water 2016, 8. [Google Scholar] [CrossRef]
  11. Zeng, S.; Zhan, C.; Sun, F.; Du, H.; Wang, F. Effects of climate change and human activities on surface runoff in the Luan River Basin. Adv. Meteorol. 2015, 6, 1–12. [Google Scholar] [CrossRef]
  12. Wang, W.G.; Shao, Q.X.; Yang, T.; Peng, S.Z.; Xing, W.Q.; Sun, F.C.; Luo, Y.F. Quantitative assessment of the impact of climate variability and human activities on runoff changes: A case study in four catchments of the Haihe River basin, China. Hydrol. Process. 2013, 27, 1158–1174. [Google Scholar] [CrossRef]
  13. Li, F.Q.; Zhang, G.X.; Xu, Y.J. Separating the impacts of climate variation and human activities on runoff in the Songhua River Basin, Northeast China. Water 2014, 6, 3320–3338. [Google Scholar] [CrossRef]
  14. Dooge, J.C.I.; Bruen, M.; Parmentier, B. A simple model for estimating the sensitivity of runoff to long-term changes in precipitation without a change in vegetation. Adv. Water Resour. 1999, 23, 153–163. [Google Scholar] [CrossRef]
  15. Milly, P.C.D.; Dunne, K.A. Macroscale water fluxes 2. Water and energy supply control of their interannual variability. Water Resour. Res. 2002, 38. [Google Scholar] [CrossRef]
  16. Li, L.J.; Zhang, L.; Wang, H.; Wang, J.; Yang, J.W.; Jiang, D.J.; Li, J.Y.; Qin, D.Y. Assessing the impact of climate variability and human activities on streamflow from the Wuding River basin in China. Hydrol. Process. 2007, 21, 3485–3491. [Google Scholar] [CrossRef]
  17. Zhang, Y.F.; Guan, D.X.; Jin, C.J.; Wang, A.Z.; Wu, J.B.; Yuan, F.H. Analysis of impacts of climate variability and human activity on streamflow for a river basin in northeast China. J. Hydrol. 2011, 410, 239–247. [Google Scholar] [CrossRef]
  18. Chen, Z.S.; Chen, Y.N.; Li, B.F. Quantifying the effects of climate variability and human activities on runoff for Kaidu River Basin in arid region of northwest China. Theor. Appl. Climatol. 2013, 111, 537–545. [Google Scholar] [CrossRef]
  19. Zuo, D.P.; Xu, Z.X.; Wu, W.; Zhao, J.; Zhao, F.F. Identification of streamflow response to climate change and human activities in the Wei River Basin, China. Water Resour. Manag. 2014, 28, 833–851. [Google Scholar] [CrossRef]
  20. Yuan, Y.J.; Zhang, C.; Zeng, G.M.; Liang, J.; Guo, S.L.; Huang, L.; Wu, H.P.; Hua, S.S. Quantitative assessment of the contribution of climate variability and human activity to streamflow alteration in Dongting Lake, China. Hydrol. Process. 2016, 30, 1929–1939. [Google Scholar] [CrossRef]
  21. Schaake, J.C. From climate to flow. In Climate Change and U.S. Water Resources; Waggoner, P.E., Ed.; John Wiley: New York, NY, USA, 1990; pp. 177–206. [Google Scholar]
  22. Fu, G.; Charles, S.P.; Chiew, F.H.S. A two-parameter climate elasticity of streamflow index to assess climate change effects on annual streamflow. Water Resour. Res. 2007, 43. [Google Scholar] [CrossRef]
  23. Zheng, H.X.; Zhang, L.; Zhu, R.R.; Liu, C.M.; Sato, Y.; Fukushima, Y. Responses of streamflow to climate and land surface change in the headwaters of the Yellow River Basin. Water Resour. Res. 2009, 45. [Google Scholar] [CrossRef]
  24. Yang, H.B.; Yang, D.W. Derivation of climate elasticity of runoff to assess the effects of climate change on annual runoff. Water Resour. Res. 2011, 47. [Google Scholar] [CrossRef]
  25. Ma, H.; Yang, D.W.; Tan, S.K.; Gao, B.; Hu, Q.F. Impact of climate variability and human activity on streamflow decrease in the Miyun Reservoir catchment. J. Hydrol. 2010, 389, 317–324. [Google Scholar] [CrossRef]
  26. Xu, X.Y.; Yang, H.B.; Yang, D.W.; Ma, H. Assessing the impacts of climate variability and human activities on annual runoff in the Luan River basin, China. Hydrol. Res. 2013, 44, 940–952. [Google Scholar] [CrossRef]
  27. Yang, H.B.; Qi, J.; Xu, X.Y.; Yang, D.W.; Lv, H.F. The regional variation in climate elasticity and climate contribution to runoff across China. J. Hydrol. 2014, 517, 607–616. [Google Scholar] [CrossRef]
  28. Xu, X.Y.; Yang, D.W.; Yang, H.B.; Lei, H.M. Attribution analysis based on the Budyko hypothesis for detecting the dominant cause of runoff decline in Haihe basin. J. Hydrol. 2014, 510, 530–540. [Google Scholar] [CrossRef]
  29. Chiew, F.H.S.; Teng, J.; Vaze, J.; Post, D.A.; Perraud, J.M.; Kirono, D.G.C.; Viney, N.R. Estimating climate change impact on runoff across southeast Australia: Method, results, and implications of the modeling method. Water Resour. Res. 2009, 45. [Google Scholar] [CrossRef]
  30. Guo, Y.; Li, Z.J.; Amo-Boateng, M.; Deng, P.; Huang, P.N. Quantitative assessment of the impact of climate variability and human activities on runoff changes for the upper reaches of Weihe River. Stoch. Environ. Res. Risk Assess. 2014, 28, 333–346. [Google Scholar] [CrossRef]
  31. Tang, Y.; Tang, Q.; Tian, F.; Zhang, Z.; Liu, G. Responses of natural runoff to recent climatic variations in the Yellow River basin, China. Hydrol. Earth Syst. Sci. 2013, 17, 4471–4480. [Google Scholar] [CrossRef]
  32. Bao, Z.X.; Zhang, J.Y.; Wang, G.Q.; Fu, G.B.; He, R.M.; Yan, X.L.; Jin, J.L.; Liu, Y.L.; Zhang, A.J. Attribution for decreasing streamflow of the Haihe River basin, northern China: Climate variability or human activities? J. Hydrol. 2012, 460, 117–129. [Google Scholar] [CrossRef]
  33. Wang, G.Q.; Zhang, J.Y.; Yang, Q.L. Attribution of Runoff Change for the Xinshui River Catchment on the Loess Plateau of China in a Changing Environment. Water 2016, 8. [Google Scholar] [CrossRef]
  34. He, D.M.; Liu, J.; Hu, J.M.; Feng, Y.; Gan, S. Transboundary eco-security and its regulation system in the Longitudinal Range-Gorge Region. Chin. Sci. Bull. 2007, 52, 1–9. [Google Scholar] [CrossRef]
  35. Li, Y.G.; He, D.M.; Ye, C.Q. Spatial and temporal variation of runoff of Red River Basin in Yunnan. J. Geogr. Sci. 2008, 18, 308–318. [Google Scholar] [CrossRef]
  36. Li, X.; Li, Y.G.; He, J.N.; Luo, X. Analysis of variation in runoff and impacts factors in the Yuanjiang-Red River Basin from 1956 to 2013. Resour. Sci. 2016, 38, 1149–1159. (In Chinese) [Google Scholar]
  37. Li, Y.G.; He, J.N.; Li, X. Hydrological and meteorological droughts in the Red River Basin of Yunnan Province based on SPEI and SDI Indices. Prog. Geogr. 2016, 35, 758–767. (In Chinese) [Google Scholar]
  38. Allen, R.G.; Pereira, L.S.; Raes, D.; Smith, M. Crop Evapotranspiration: Guidelines for Computing Crop Water Requirements; FAO Irrigation and Drainage Paper No. 56; FAO: Rome, Italy, 1998. [Google Scholar]
  39. Kendall, M.G. Rank Correlation Methods; Griffin: London, UK, 1975. [Google Scholar]
  40. Pettitt, A.N. A non-parametric approach to the change-point problem. J. R. Stat. Soc. C-Appl. 1979, 28, 126–135. [Google Scholar] [CrossRef]
  41. Budyko, M.I. Climate and Life; Academic Press: New York, NY, USA, 1974. [Google Scholar]
  42. Fu, B.P. The calculation of the evaporation from land surface. Sci. Atmos. Sin. 1981, 5, 23–31. (In Chinese) [Google Scholar]
  43. Fu, B.P. On the calculation of evaporation from land surface in mountainous areas. Sci. Meteorol. Sin. 1996, 6, 328–335. (In Chinese) [Google Scholar]
  44. Zhang, L.; Dawes, W.R.; Walker, G.R. Response of mean annual evapotranspiration to vegetation changes at catchment scale. Water Resour. Res. 2001, 37, 701–708. [Google Scholar] [CrossRef]
  45. Yang, H.B.; Yang, D.W.; Lei, Z.D.; Sun, F.B. New analytical derivation of the mean annual water-energy balance equation. Water Resour. Res. 2008, 44. [Google Scholar] [CrossRef]
  46. Yang, D.W.; Shao, W.W.; Yeh, P.J.F.; Yang, H.B.; Kanae, S.; Oki, T. Impact of vegetation coverage on regional water balance in the nonhumid regions of China. Water Resour. Res. 2009, 45. [Google Scholar] [CrossRef]
  47. Bergström, S. The HBV Model: Its Structure and Applications; Swedish Meteorological and Hydrological Institute (SMHI): Norrköping, Sweden, 1992. [Google Scholar]
  48. Lindström, G.; Johansson, B.; Persson, M.; Gardelin, M.; Bergström, S. Development and test of the distributed HBV-96 hydrological model. J. Hydrol. 1997, 201, 272–288. [Google Scholar] [CrossRef]
  49. Seibert, J. Estimation of parameter uncertainty in the HBV model. Hydrol. Res. 1997, 28, 247–262. [Google Scholar]
  50. Seibert, J.; Vis, M.J.P. Teaching hydrological modeling with a user-friendly catchment-runoff-model software package. Hydrol. Earth Syst. Sci. 2012, 16, 5905–5930. [Google Scholar] [CrossRef]
  51. Legates, D.R.; McCabe, G.J. Evaluating the use of “goodness-of-fit” Measures in hydrologic and hydroclimatic model validation. Water Resour. Res. 1999, 35, 233–241. [Google Scholar] [CrossRef]
  52. Krause, P.; Boyle, D.P.; Bäse, F. Comparison of different efficiency criteria for hydrological model assessment. Adv. Geosci. 2005, 5, 89–97. [Google Scholar] [CrossRef]
  53. Schaefli, B.; Gupta, H.V. Do Nash values have value? Hydrol. Process. 2007, 21, 2075–2080. [Google Scholar] [CrossRef]
  54. Wang, Y.; Ding, Y.J.; Ye, B.S.; Liu, F.J.; Wang, J.; Wang, J. Contributions of climate and human activities to changes in runoff of the Yellow and Yangtze rivers from 1950 to 2008. Sci. China Earth Sci. 2013, 56, 1398–1412. [Google Scholar] [CrossRef]
  55. Bosshard, T.; Carambia, M.; Görgen, K.; Kotlarski, S.; Krahe, P.; Zappa, M.; Schär, C. Quantifying uncertainty sources in an ensemble of hydrological climate-impact projections. Water Resour. Res. 2013, 49, 1523–1536. [Google Scholar] [CrossRef]
Figure 1. Location of the upper catchment of the Red River Basin (URRB) and distribution of meteorological and hydrological stations.
Water 08 00414 g001
Figure 2. Land use maps in 1995 (a); 2010 (b); and change area (c) in the URRB.
Water 08 00414 g002
Figure 3. The variations of annual P (a); T (b); E0 (c); and R (d) in the URRB during 1961–2012.
Water 08 00414 g003
Figure 4. The variation of annual runoff coefficient series (a) and change point test of annual runoff coefficient series (b) in the URRB during 1961–2012.
Water 08 00414 g004
Figure 5. Comparison of the observed and simulated daily runoffs during the calibration and validation periods for the URRB.
Water 08 00414 g005
Figure 6. Scatter diagrams between observed and simulated monthly runoffs in the calibration (a) and validation periods (b) for the URRB.
Water 08 00414 g006
Figure 7. Time series of ΔRC, estimated by hydrological sensitivity, climate elasticity, and hydrological simulation methods in the URRB (2003–2012).
Water 08 00414 g007
Figure 8. The variation of annual Normalized Difference Vegetation Index (NDVI) series (a) and change point test of annual NDVI series (b) in the URRB during 1982–2013.
Water 08 00414 g008
Table 1. Mann–Kendall test for the annual P, T, E0 and R in the upper catchment of the Red River Basin (URRB) during 1961–2012.
VariablesMann–Kendall Trend Test
Mean ValueZ StatisticSignificance LevelSlope
P (mm)976.42−1.002NS−1.53
T (°C)17.372.9051%0.01
E0 (mm)1197.00−0.134NS−0.06
R (mm)282.94−1.77510%−1.57
Table 2. Changes in mean annual P, T, E0, and R during the two periods.
VariablesMean ValueMagnitudeRate (%)
1961–20022003–2012
P (mm)994.17901.87−92.31−9.28
T (°C)17.2817.760.482.78
E0 (mm)1192.801214.6221.811.83
R (mm)299.73212.42−87.31−29.13
Table 3. Performance of the hydrological model for the daily runoff simulation in the URRB.
PeriodNSER2BEBIAS (%)
Calibration (1961–1975)0.890.890.77−5.99
Validation (1976–1985)0.850.860.726.21
Table 4. Effects of climate variability and human activities on mean annual runoff for the impacted period, as estimated using different methods.
MethodsΔR (mm)ΔRC (mm)ΔRH (mm)ηC (%)ηH (%)
Hydrological Sensitivity−87.31−60.58−26.736931
Climate Elasticity−87.31−60.93−26.387030
Hydrological Simulation−87.31−62.10−25.217129

