
Altered Precipitation and Flow Patterns in the Dunajec River Basin

Institute of Engineering and Water Management, Department of Environmental Engineering, Cracow University of Technology, 31-155 Cracow, Poland
Water 2017, 9(1), 22; https://doi.org/10.3390/w9010022
Submission received: 19 November 2016
/
Revised: 21 December 2016
/
Accepted: 28 December 2016
/
Published: 3 January 2017
Abstract
:This study analyzes changes in long-term patterns of precipitation and river flow, as well as changes in their variability over the most recent 60 years (1956–2015). The study area is situated in the mountain basin of the Dunajec River, encompassing streams draining the Tatra Mountains in southern Poland. The focus of the study was to evaluate how regional warming translates into precipitation changes in the studied mountain region, and how changes in climate affect sub-regional hydrology. Monthly time series of precipitation measured at several sites were compared for two 30-year periods (1986–2015 versus 1956–1985). The significance of the difference between the periods in question was evaluated by means of the Wilcoxon signed rank test with the Bonferroni correction. The identified shifts in precipitation for 6 months are statistically significant and largely consistent with the revealed changes in river flow patterns. Moreover, significant differences in precipitation variability were noted in the study area, resulting in a significant decrease in the repeatability of precipitation over the most recent 30 years (1986–2015). Changes in the variability of the river flow studied were less visible in this particular mountain region (while significant for two months); however, the overall repeatability of river flow decreased significantly at the same rate as for precipitation.
1. Introduction
The circulation of water in a climate system is crucial to life on land. Changes in the water cycle associated with a global warming trend in air temperature are, therefore, of great importance worldwide. Natural climate variability across a wide range of timescales, with complex, nonlinear interactions within the climate system, including positive and negative feedbacks [1] (pp. 121, 127), implies that even crucial changes in the climate may, at first, occur sporadically and therefore will likely be statistically insignificant. This is particularly true of precipitation due to its large variability and intermittent character [2]. On the other hand, good management of water resources should be based on reliable information about predicted changes in water cycle on the basis of the changes already observed [3].
In this context, studies focusing on in situ observations that document changes in hydro-climatic variability in mountain regions seem to be particularly important. Typically, mountains with orographic precipitation and accumulated snow pack are crucial water source regions. Significant changes in the water cycle in such regions can produce far-reaching consequences for accessible water resources and freshwater availability or scarcity at a much larger scale, especially for lowland areas, therefore, informed decisions made on the basis of observed changes are vital for better water resources management and planning. In general, with higher temperatures in the wintertime, more precipitation occurs in the form of rain instead of snow. According to Trenberth and Asrar [2], higher temperatures in the wintertime over continents are expected to favor higher snowfall, while snow pack will melt quicker and sooner, resulting in a reduced amount of snow pack in the spring. Consequently, earlier run-off and changes in peak river flow are anticipated [2].
Complex topography and the resulting distribution of precipitation in mountain regions present an additional difficulty in quantifying changes in the water cycle. A review of climate change in the European Alps [4] shows that the observed warming trend in air temperature has strengthened since 1980, but changes in precipitation have been inhomogeneous, and largely dependent on the region, season, and time period studied. Moreover, recent changes in the frequency of heavy precipitation and floods in the Alpine-region do not go beyond large natural climate variability [4]. However, on the basis of regional climate simulations at a spatial resolution of 25 km, projected 21st century changes (2070–2099 versus 1970–1999) in Alpine precipitation include a decrease in the frequency of wet days in the summer accompanied by an increase in mean precipitation in the winter [5]. Concerning the Carpathian region, with its highest range (Tatra Mountains), the identified significant trend in annual mean surface temperature representing the entire area was found to be increasing, with a rate of change of 0.27 °C per decade (1961–2010); and for the period since 1981, a higher warming rate of 0.51 per decade has been identified [6]. Wind speed was found to decrease in every season, while relative sunshine duration increased. At the same time (1961–2010), Carpathian area precipitation shows no trends in annual and seasonal totals [6].
It seems, therefore, desirable to conduct more detailed analyses of precipitation patterns and their variability in mountain areas in order to gain insight into different aspects of potential hydrologic change at smaller, sub-regional, and local scales. For this reason, the present study focuses on monthly resolution and in situ observations made in the Carpathian basin encompassing the Tatra mountain region in Poland. The aim of this study was to examine changes in long-term patterns of precipitation (P) and river flow rates (Q) as well as changes in their variability and repeatability during the most recent 60 years (1956–2015) in the Dunajec River Basin—an important water source area of Poland. The main focus of the study was to assess how regional warming—occurring throughout the Carpathian region—translates into precipitation change at the catchment scale, and how changes in the climate affect sub-regional hydrologic cycles. Monthly time series, measured at several sites, were compared for two successive long-term periods. Statistical tests (i.e., Wilcoxon signed rank test with the Bonferroni correction) were then performed in order to assess the statistical significance of differences observed in patterns, variability, and repeatability of the precipitation and river flow studied. The results show a general consistency in significant changes for the precipitation and river flow in question.
2. Materials and Methods
2.1. Study Area and Data
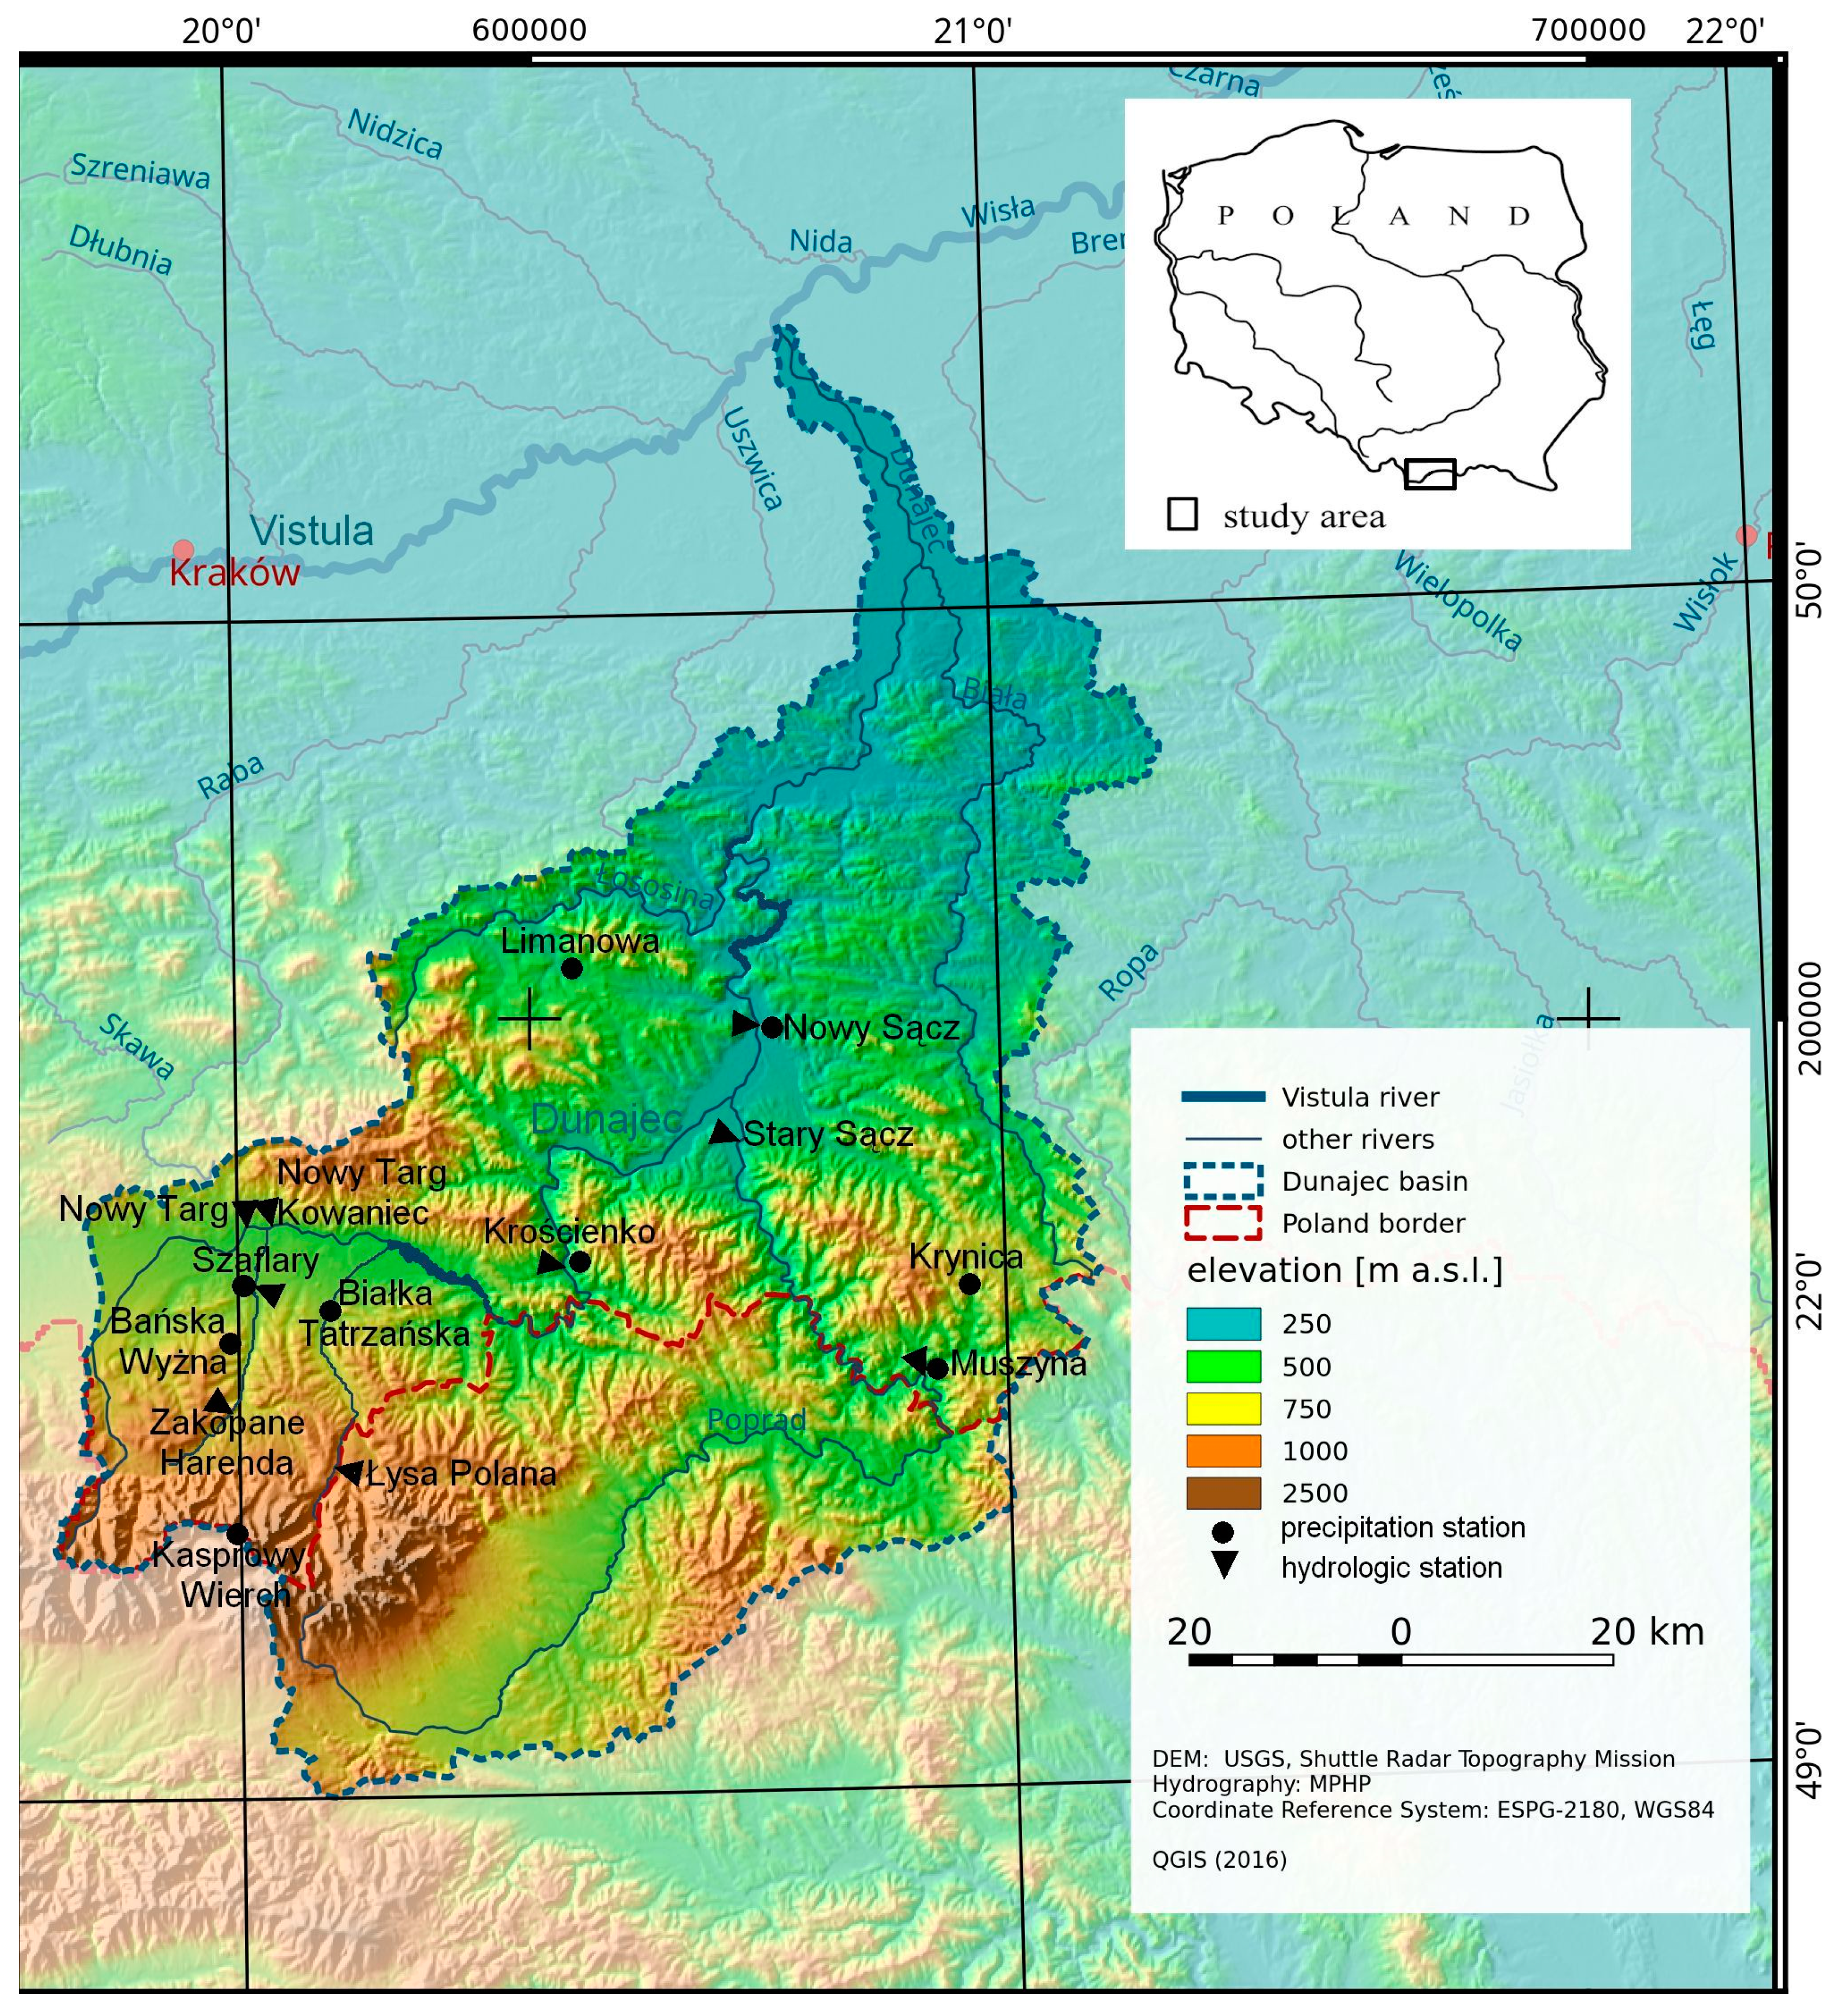
The Dunajec River Basin, with a total surface area of 6804 km2 [7], is located in southern Poland and in the northern part of Slovakia (Figure 1). The Dunajec River is a right-bank tributary of the upper Vistula River, which later discharges into the Baltic Sea. The source tributary—the Czarny Dunajec—originates in the Western Tatra Mountains. The upper Dunajec, and its largest tributary (Poprad River) originating in the Slovak part of the Tatra Mountains, drain water from both the Tatra and Podhale regions. The drainage basin is underlain by impermeable crystalline and metamorphic rocks as well as highly permeable aqueous carbonate rocks [8]. The highest peaks of the Tatra Mountains (2200–2655 m a.s.l.) are characterized by a cold climate, with an annual mean air temperature between −4 and −2 °C, and precipitation reaching 1800 mm a year (Table 1) [9] (pp. 33–34). In the lower-lying parts of the Dunajec catchment (280–750 m a.s.l.), the climate is temperate, with an annual mean air temperature between 6 and 8 °C and average annual precipitation reaching 800 mm. The land cover of the Dunajec Basin in the year 2012 [10] consisted mostly of agricultural and forested land (48% and 46%, respectively), and also developed land and water areas (5% and 1%, respectively). In the years 1935–1949, a complex of two reservoirs, Rożnów–Czchów, was built on the lower Dunajec River, approximately 27 km downstream of the Nowy Sącz gauging site [11]. Moreover, in the years 1994–1997, a complex of two reservoirs, Czorsztyn–Sromowce Wyżne, was constructed on the upper Dunajec, approximately 22 km upstream of the Krościenko gauging site [12].
The present study uses data from a complete observation series collected in the hydrologic years 1956–2015: November 1955–October 2015, in accordance with the Polish definition of a hydrologic year. Observed precipitation and river discharge at monthly resolution were made available for the present study by the Polish Institute of Meteorology and Water Management, and for the years 1956–1960, the data were obtained from Polish state precipitation yearbooks. Gauging sites and physiographic characteristics of the studied sub-catchments are described in Table 1 and Table 2, respectively. The highest-lying weather station providing data for this study was the mountaintop station of Mount Kasprowy Wierch (11,991 m a.s.l.), with mean annual precipitation at 1762.8 mm, while the lowest-lying station was Nowy Sącz (292 m a.s.l.), located in a mid-mountain basin, with mean annual precipitation of only 732.9 mm over the same time period (Table 1). The uppermost sub-catchments considered (Białka and Biały Dunajec rivers) are relatively small (approximately 60 km2 each), but very steep, with a mean catchment slope of 0.151 and 0.126, respectively (Table 2), which facilitates very fast water run-off. The considered precipitation series cover 60 years (1956–2015), while the available river discharge series cover the most recent 55 years (1961–2015).
2.2. Methods
After visual inspection of data compiled in a Microsoft® Excel 2007 spreadsheet, a quality check was performed in order to identify spurious values. Precipitation and discharge monthly series were tested for homogeneity. The point of homogenization was to identify break points and eliminate corresponding impacts of non-climate factors including changes in instruments, observation practices, and gauging site relocations, yet excluding natural phenomena [13] (p. 28), [14]. Alexandersson’s standard normalized homogeneity test (SNHT) [15] can be applied in the study of abrupt shifts in the mean value of observations. Potential change points detected should be carefully verified (i.e., by metadata) in order to obtain reliable break points [14]. In order to test the hypothesis that the monthly precipitation and river discharge series are homogenous, the SNHT test was used. The critical values of the SNHT test were obtained from Khaliq and Quarda [16] as nearly true critical values of the SNHT statistic for large samples. At the level of significance of 0.05, there were no grounds to reject the hypothesis of homogeneity of the monthly series considered.
Subsequently, owing to a stronger warming trend in surface temperature in the Carpathian region since the 1980s [6] and the available data, comparative analyses were conducted for data from the years 1986–2015 versus 1956–1985. Therefore, each precipitation time series was divided in half, covering two 30-year periods (1956–1985 and 1986–2015), and then arranged as the matrix Pij, where the index i (for row) represents a year, and the index j (for column) represents a month. Consequently, each river discharge series was divided into two parts covering the corresponding periods 1961–1985 and 1986–2015, and arranged as the matrix Qij. For each month of the year, that is for each column of the matrix Pij, multi-annual means (Equation (1)) and multi-annual coefficients of variation CV or the ratio of the standard deviation σ to the mean μ (Equation (2)) were calculated for precipitation, and analogously for river discharge (substituting Pij with Qij):
where N is the number of years. Next, a so-called coefficient of repeatability (CR), introduced in [17] for studying the repeatability of the process of river flow from year to year, was calculated (Equations (3) and (4)). CR is a ratio between CV calculated for long-term mean monthly values (Equation (1)) and the mean of CV values calculated separately for each given year (CV obtained for each row of the matrix Pij). Equation (3) implies that CR can equivalently be interpreted as a relative measure of variability. A value of CR close to 1 (0) indicates that the repeatability of the studied process from year to year is very high (low) [17].
Subsequently, the 2-sided signed rank test [18] was used to evaluate the significance of median differences in precipitation characteristics between the most recent 30-year period, 1986–2015, and the preceding 30-year period, 1956–1985. The nonparametric signed rank test uses both the signs of the differences and the ranks of the absolute values of these differences, provided that the differences are symmetrical, or equivalent, an additive difference between the two groups exists [19]. Multiple applications of the test (for each month of the year) requires that the adopted level of significance of the test α = 0.05 (for the entire year) be adjusted to α/12 = 0.0042 for each given month, according to the Bonferroni correction. Furthermore, the Hodges–Lehmann estimator (HLE), related to the signed rank test [20], was computed as the median of all possible pair-wise averages of the differences [19]. The line y = x + HLE, on a scatter-plot, illustrates the median difference in values between y and x; the data points (x, y) scatter around this line when an additive relationship between y and x exists [19]. Therefore, for each of the two groups of observations considered, such an additive difference was verified using a scatter-plot. Analogously as for precipitation, the significance of the median differences in river flow characteristics between the most recent 30-year period 1986–2015, and the preceding period, 1961–1985, was evaluated via the 2-sided signed rank test with the Bonferroni correction.
3. Results
3.1. Changes in Precipitation Patterns and Variability
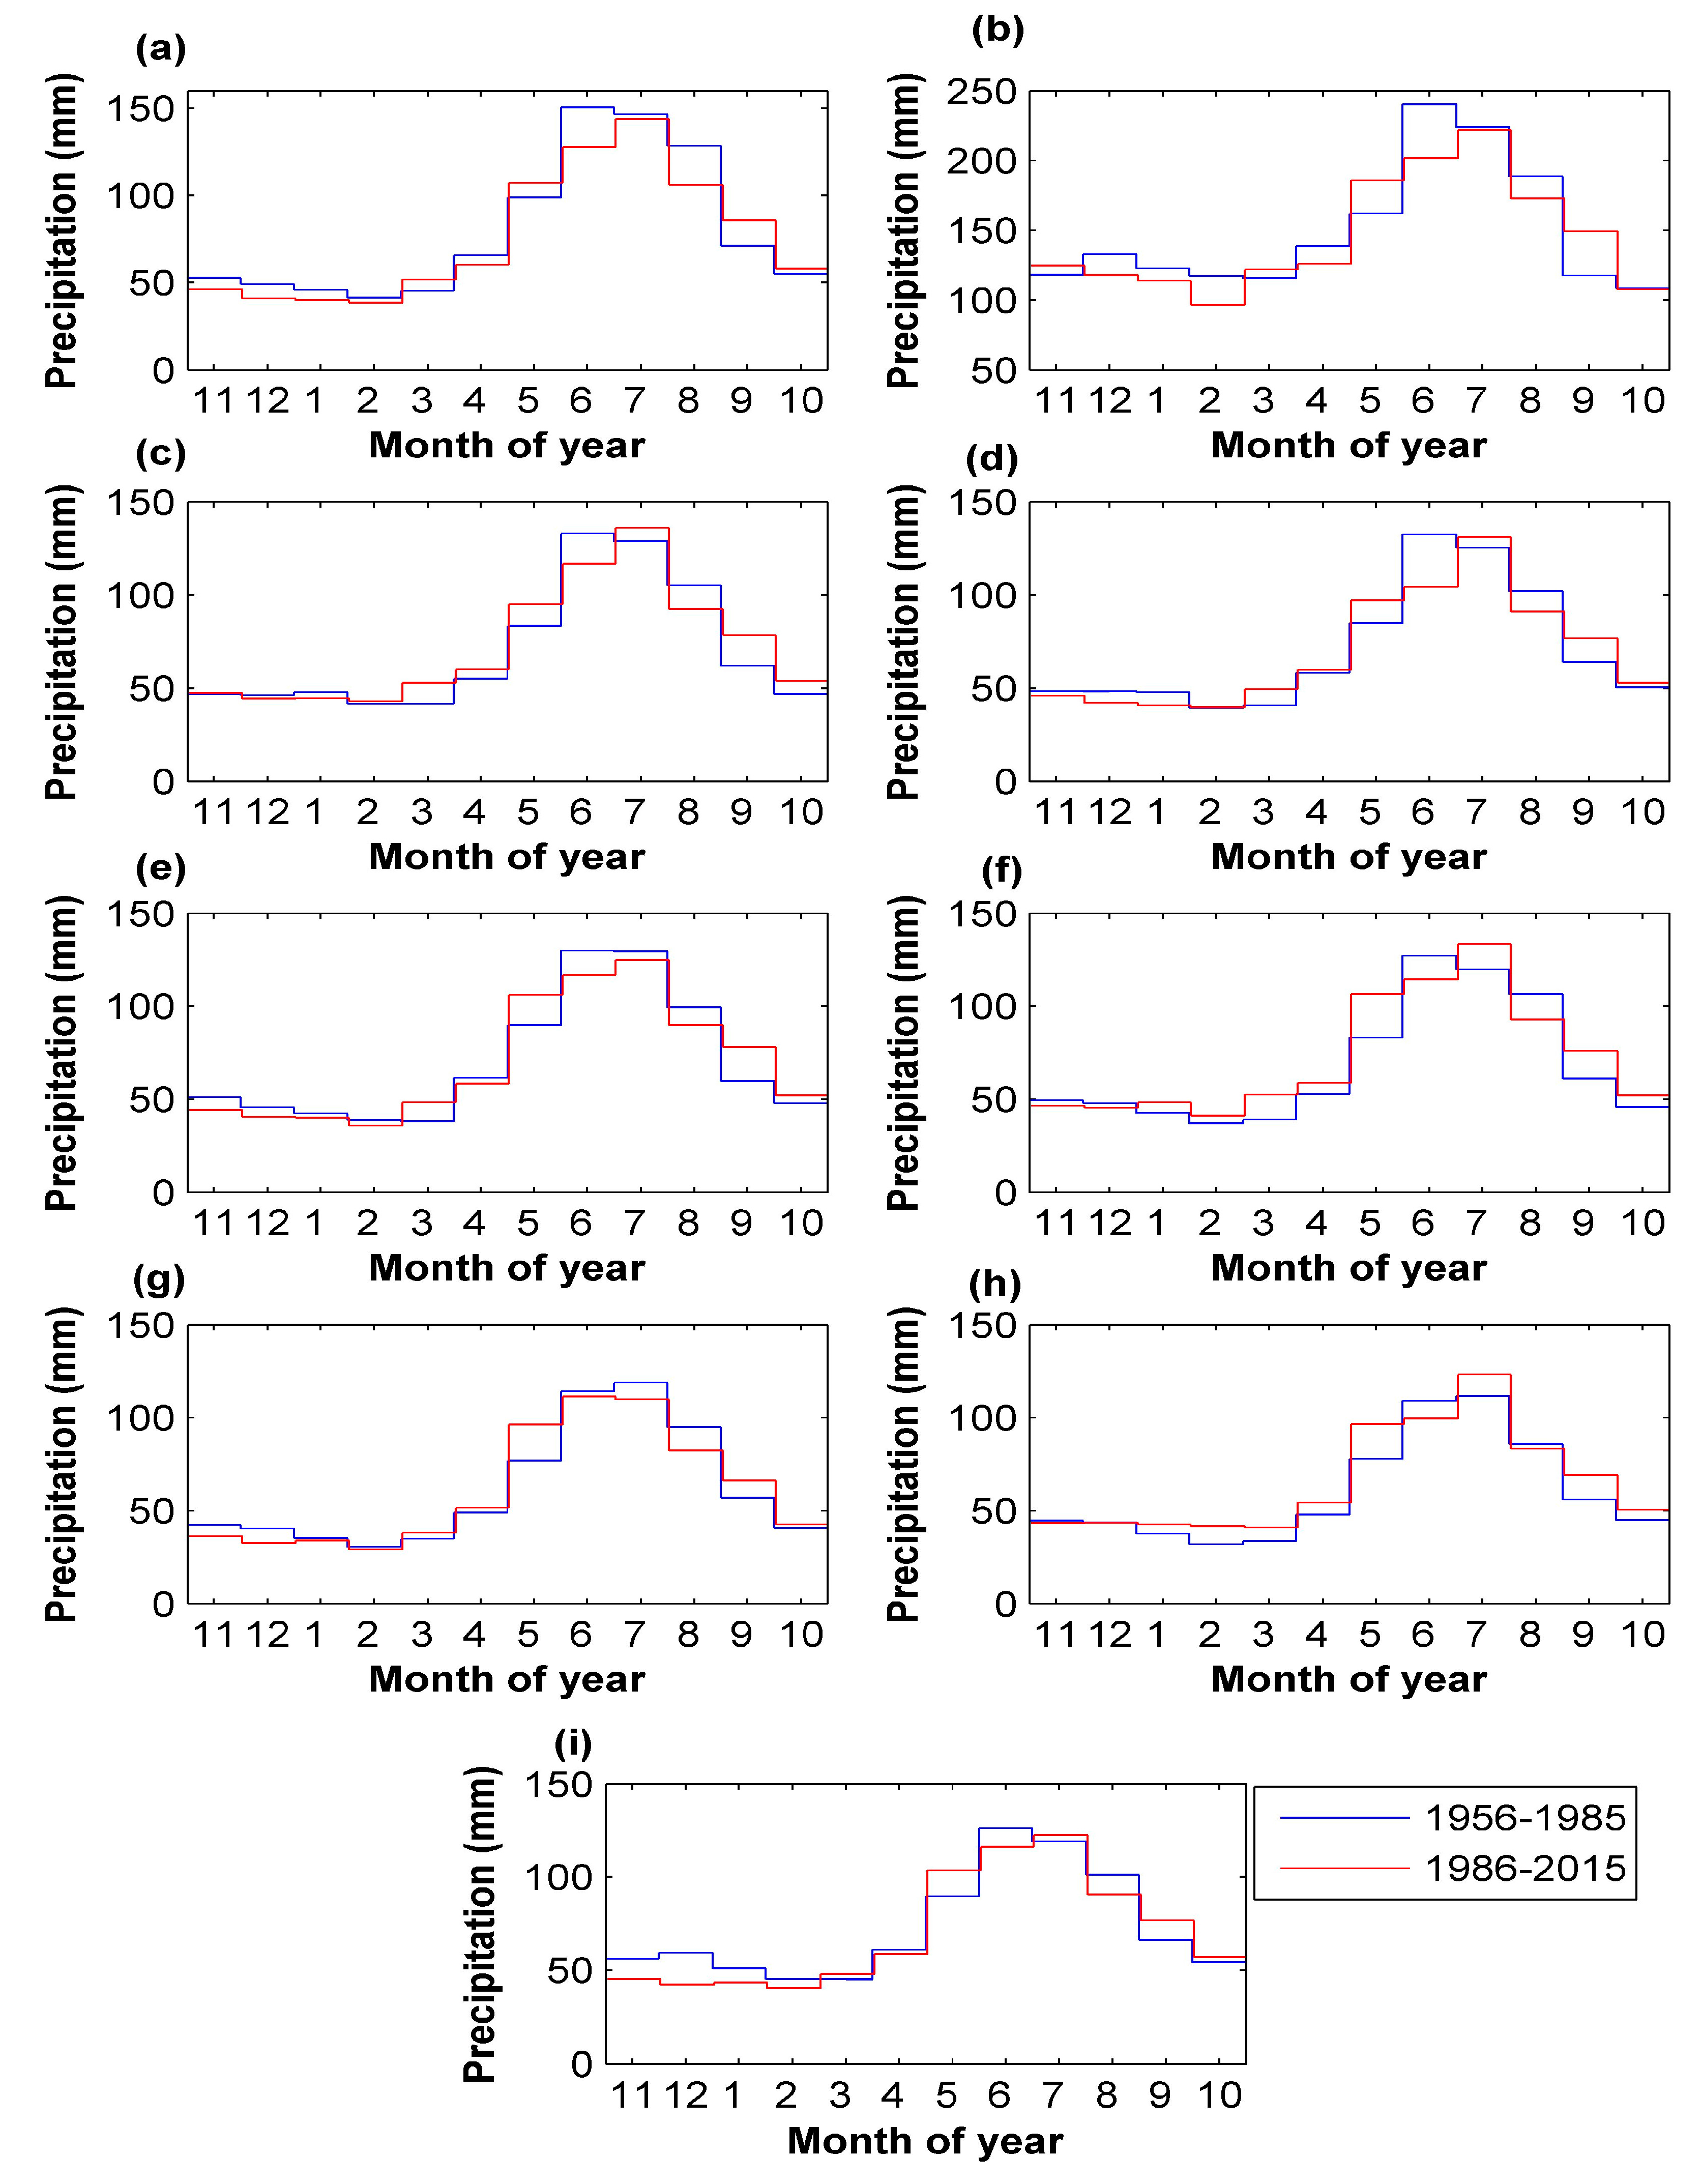
Figure 2 contrasts precipitation patterns for the 30-year periods 1986–2015 versus 1956–1985 examined for nine different sites in the study area. For the years 1956–1985, the period of high P lasts from May to August, and the highest P occurs in June and July. In the most recent 30 years (1986–2015), an increase in P in May and September is noticeable, which results in an extended period of high P (May–September), however, at the expense of decreased P in June and August. A detailed analysis of differences in precipitation for each month (Table 3), supported by the results of the Wilcoxon signed rank tests, shows all important changes in P patterns. Significant shifts in precipitation (p = 0.0039) involve 6 individual months, and affect mainly the summer months (May–June, August–September), but also December and March. The larger change concerns precipitation in May, June, and September. The median positive difference in P for May (16.3 mm) is compensated by the median negative difference in P for June (–16.1 mm), while the median difference in P for August (–12.3 mm) is compensated by the median difference in P for September (14.7 mm). Similar observations pertain to the other two months, but the significant shifts are smaller, with the median decrease in P for December (–6.6 mm) counterbalanced by the median increase in P for March (7.7 mm). Thanks to significant, but largely counterbalanced shifts in P between individual months, along with small, insignificant shifts in P in the remaining months of the year (Table 3), the resulting mean annual precipitation for the most recent 30 years (1986–2015) for the studied sites either decreased (the most at Kasprowy Wierch, Bańska Wyżna, and Krynica) or increased (the most at Muszyna, Krościenko, and Szaflary) or remained almost unchanged (at Limanowa and Nowy Sącz) (Table 1).
Figure 3 shows seasonal variations in precipitation for two subsequent 30-year time periods examined for nine sites in the study area. For the years 1956–1985, high variation in P occurs in January, February, and October; the coefficients of variation for these months are typically between 0.55 and 0.8. In the most recent 30 years (1986–2015), changes in the variability of P can be readily observed. Table 4 shows differences in the variability of precipitation for each month and the results of the Wilcoxon signed rank tests. Significant differences in CV (p = 0.0039) pertain to 4 individual months, with a median decrease in CV values for January and February (–0.0976 and –0.1507, respectively), along with a median increase in CV values for July and September (0.1516 and 0.1284, respectively). Hence, for September, a significant increase in the precipitation amount is accompanied by its slightly greater variation. On the other hand, an increased variation in P in July, the hottest month of the year, can increase the risk of extreme events, such as flooding or drought.
3.2. Changes in River Flow Patterns and Variability
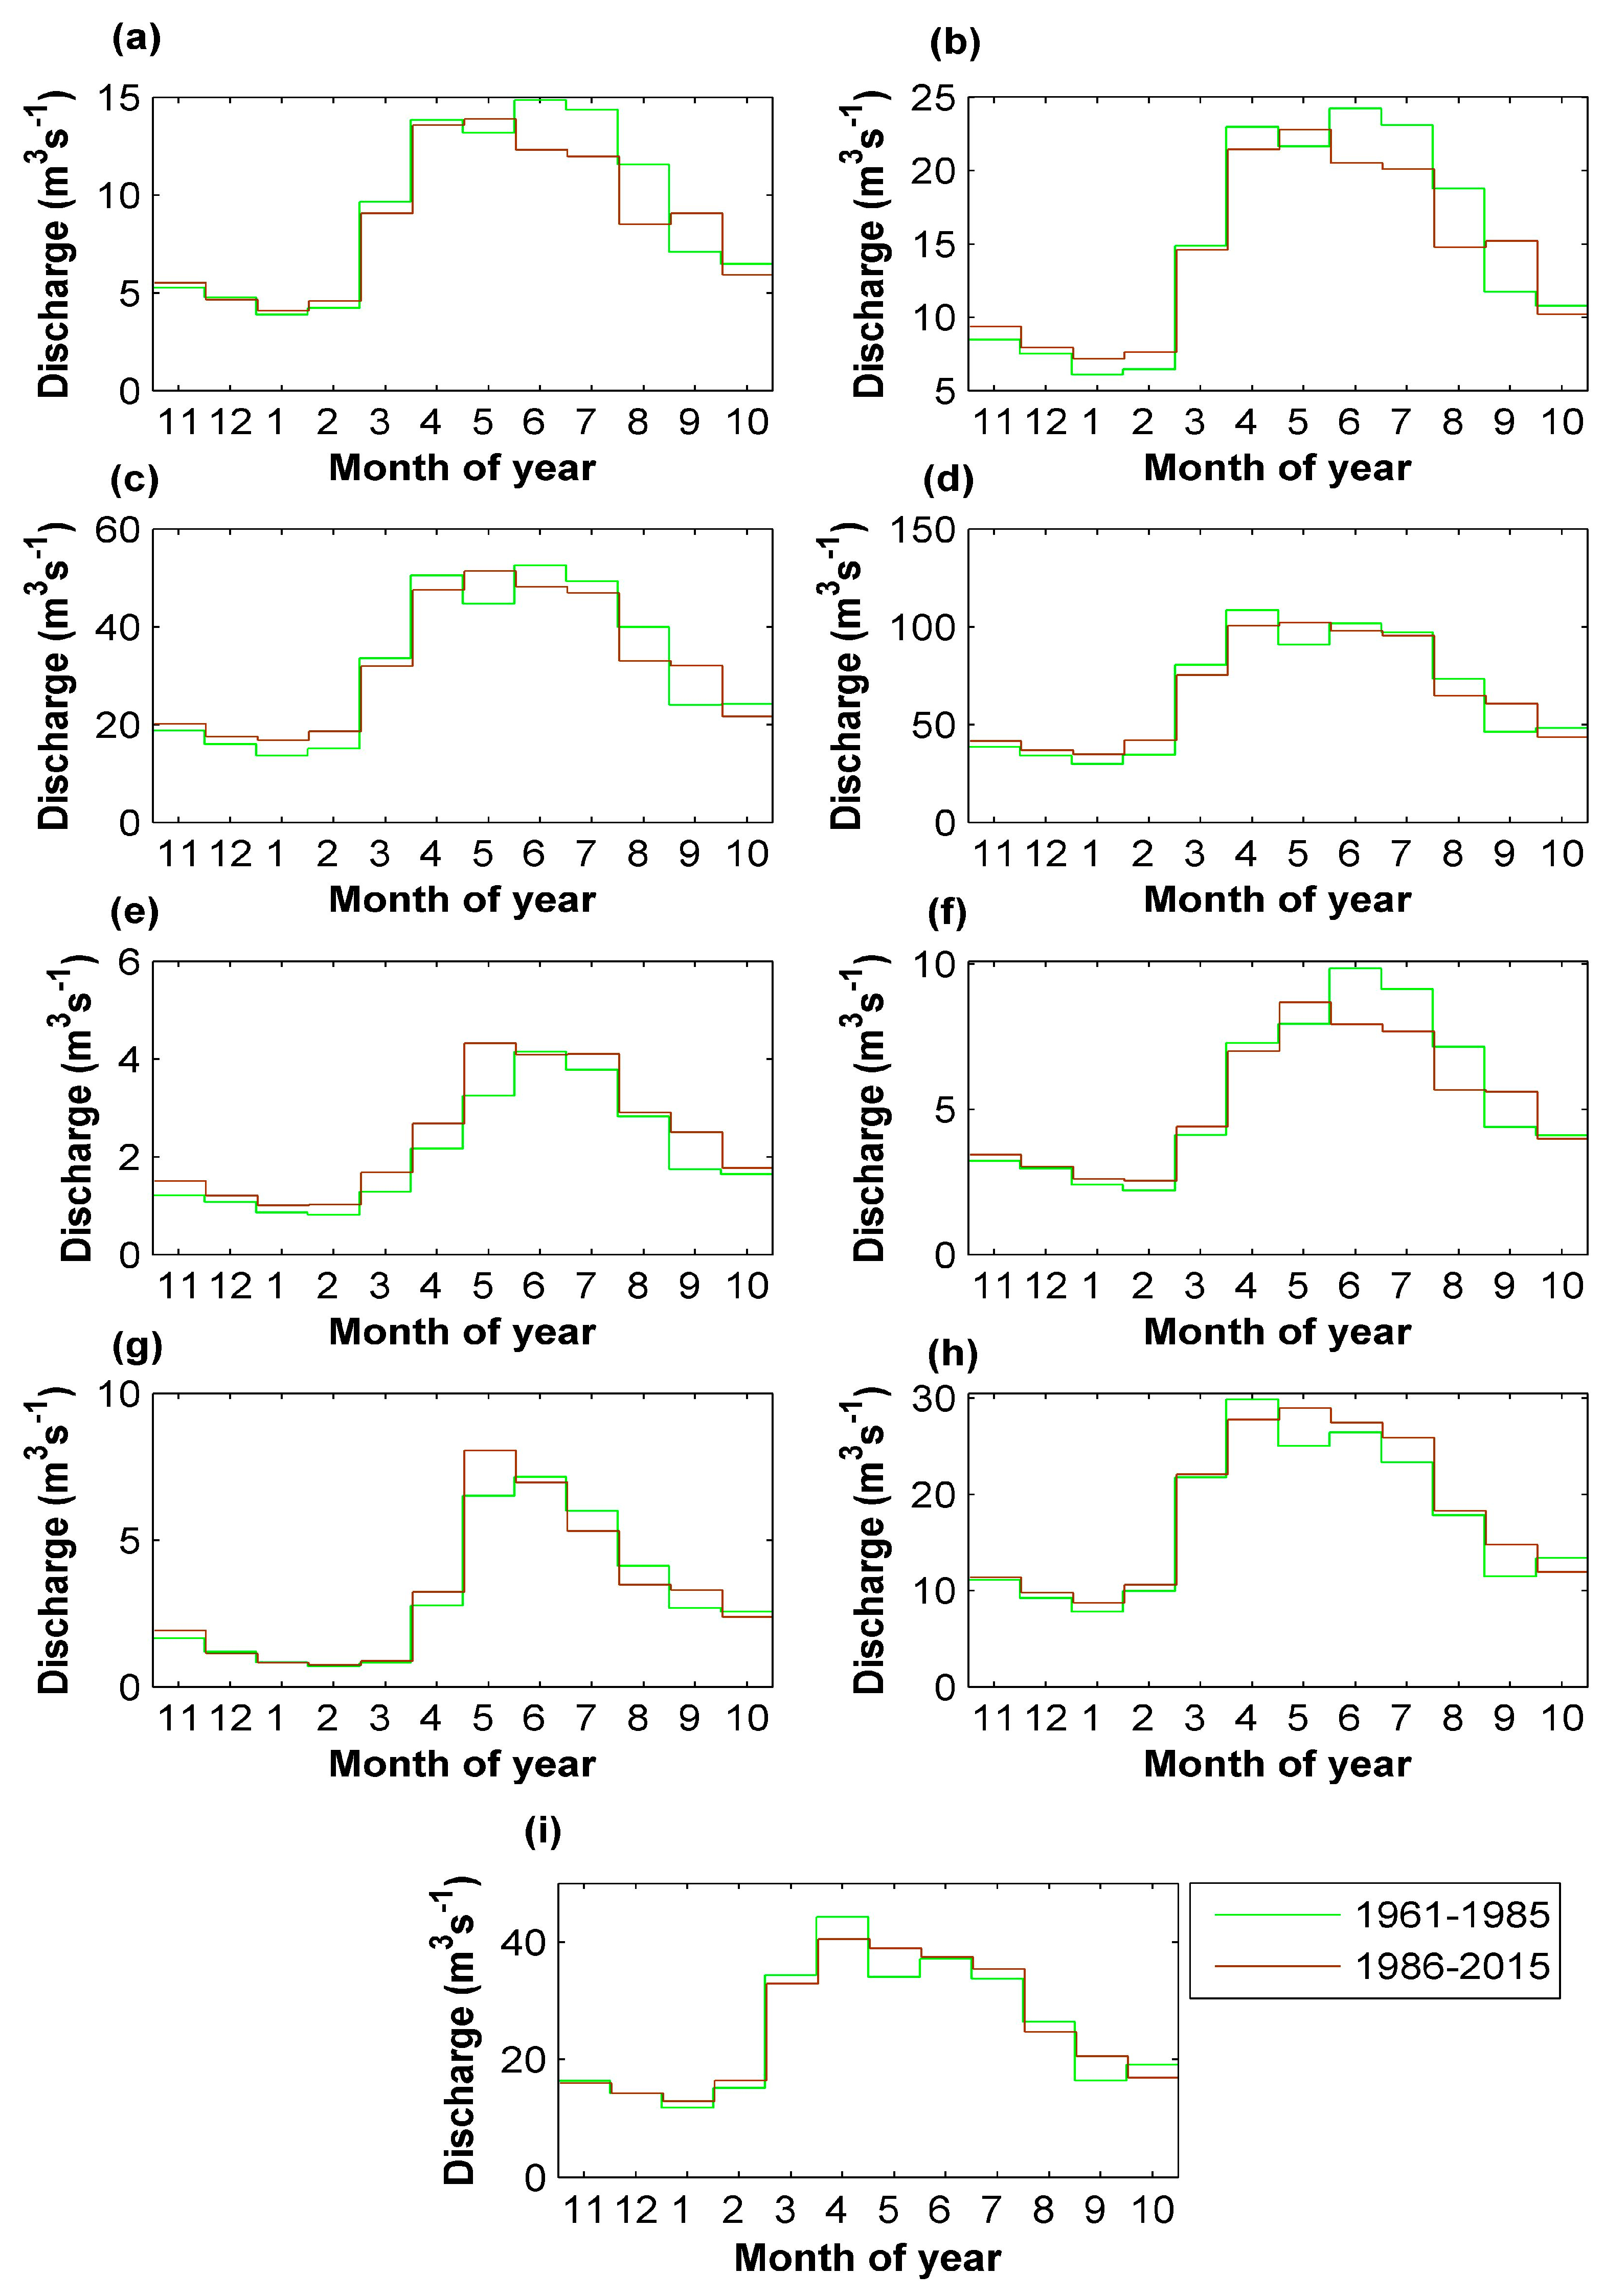
Figure 4 contrasts river flow patterns for the most recent 30 years, 1986–2015, with the period 1961–1985 observed at nine different sites in the studied sub-catchments of the Dunajec River. In the period 1961–1985, seasonal patterns are characterized by a period of high flow initiated in the spring (March–April) by meltwater flow, and prolonged to June–July(–August) by summer rainfall [17]. The period of low flow lasts from December to February. In the case of the uppermost sub-catchment of the Białka River, the high flow period is confined to May–July (Figure 4g). The analysis of differences in discharge for each month (Table 5) is supported by the results of the Wilcoxon signed rank tests. Significant changes in Q patterns (p = 0.0039) involve 3 individual months, with a median positive difference in Q for February (0.80 m3·s−1), May (2.96 m3·s−1), and September (3.30 m3·s−1). Thus, the main changes relate to river flow in May and September, and are in agreement with the identified, significant changes in precipitation for these months. For June and August, median (negative) differences in Q are not significant (p = 0.0742 and 0.0195, respectively), but are consistent with observed significant decreases in P. A smaller, significant positive difference in Q for February, together with a less important (p = 0.0078) positive difference in Q for January can likely be associated with higher air temperatures in these winter months (resulting in less frozen ground and more thawing) rather than higher precipitation (see Table 3).
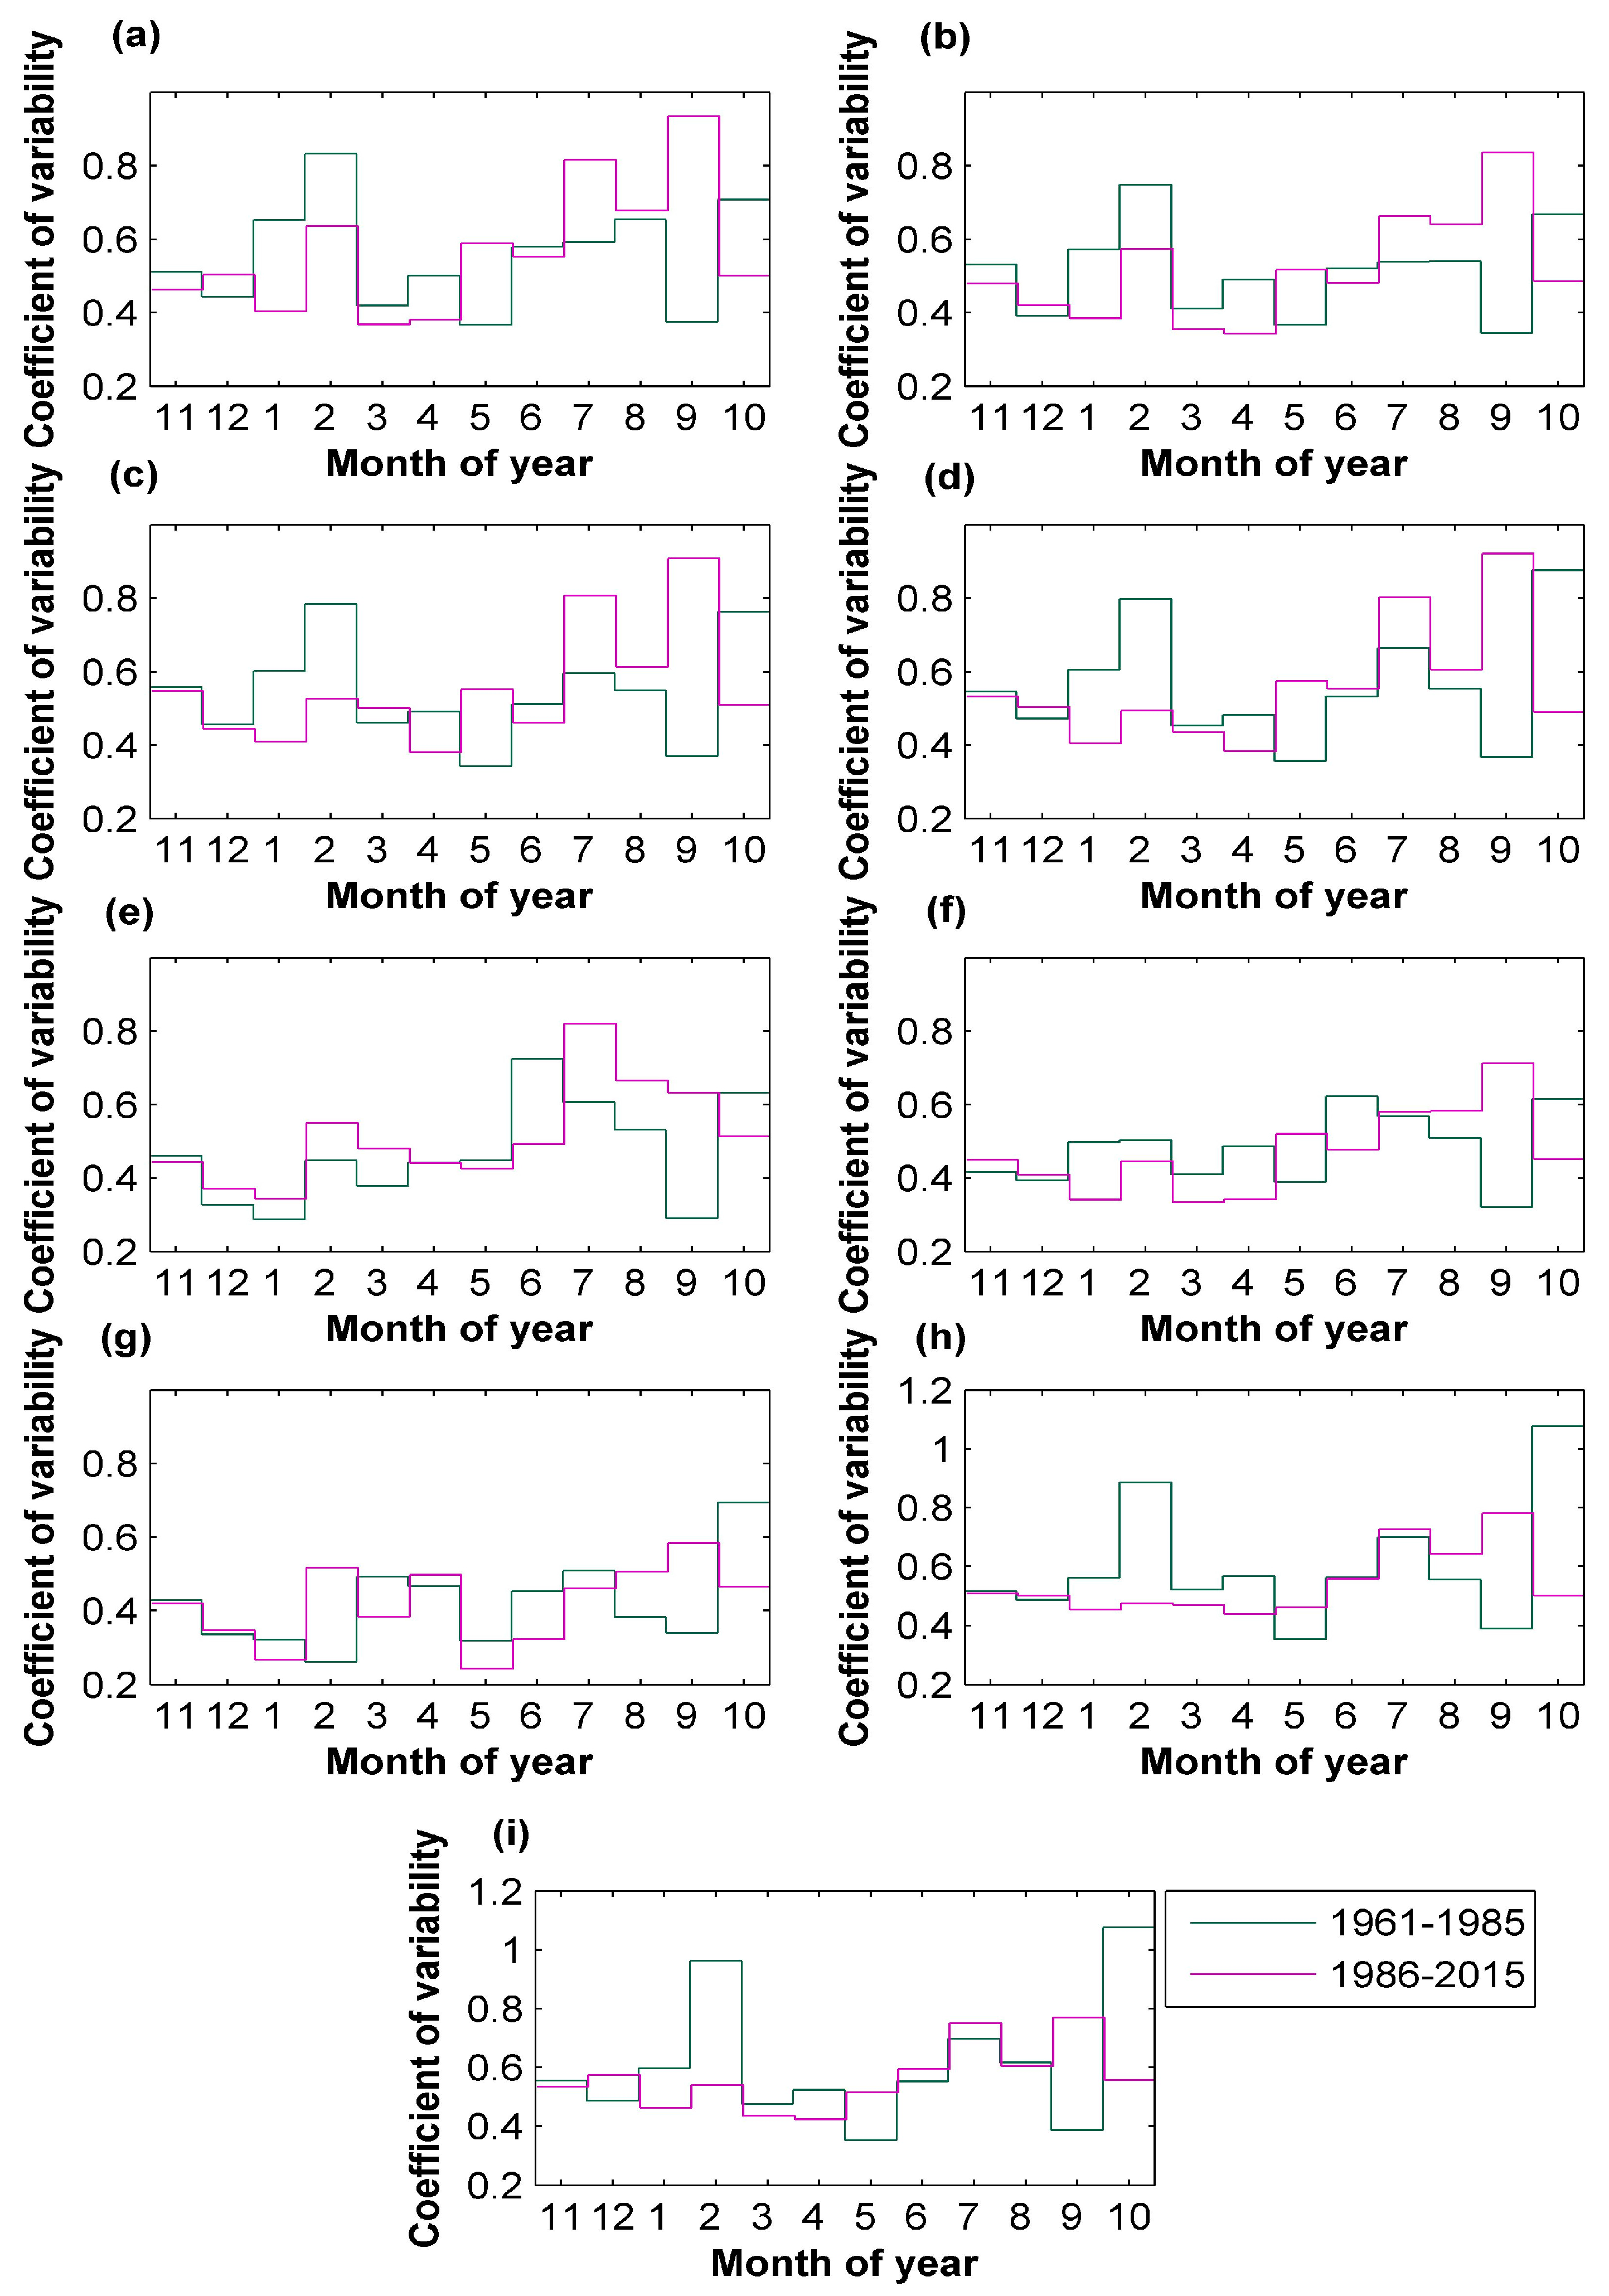
Figure 5 depicts the seasonal variation in discharge for the most recent 30 years, 1986–2015, versus the period 1961–1985, examined for nine sites in the studied sub-catchments of the Dunajec River. For the years 1961–1985, high variation of Q occurs in October, with CV values ranging from 0.6 to 1.1 (for the Poprad River), following the variation pattern of precipitation data. In the most recent 30 years (1986–2015), changes in the variation pattern of Q can be observed. Table 6 shows differences in the variation of discharge for each month, together with the results of the Wilcoxon signed rank tests. Significant differences in CV (p = 0.0039) relate to 2 individual months, with a median positive difference in CV values for September (0.4410), but negative for October (−0.2745). Therefore, for September, a significant, relatively high increase in discharge is accompanied by its much greater variability, consistently with the direction of changes in precipitation characteristics.
3.3. Changes in Repeatability
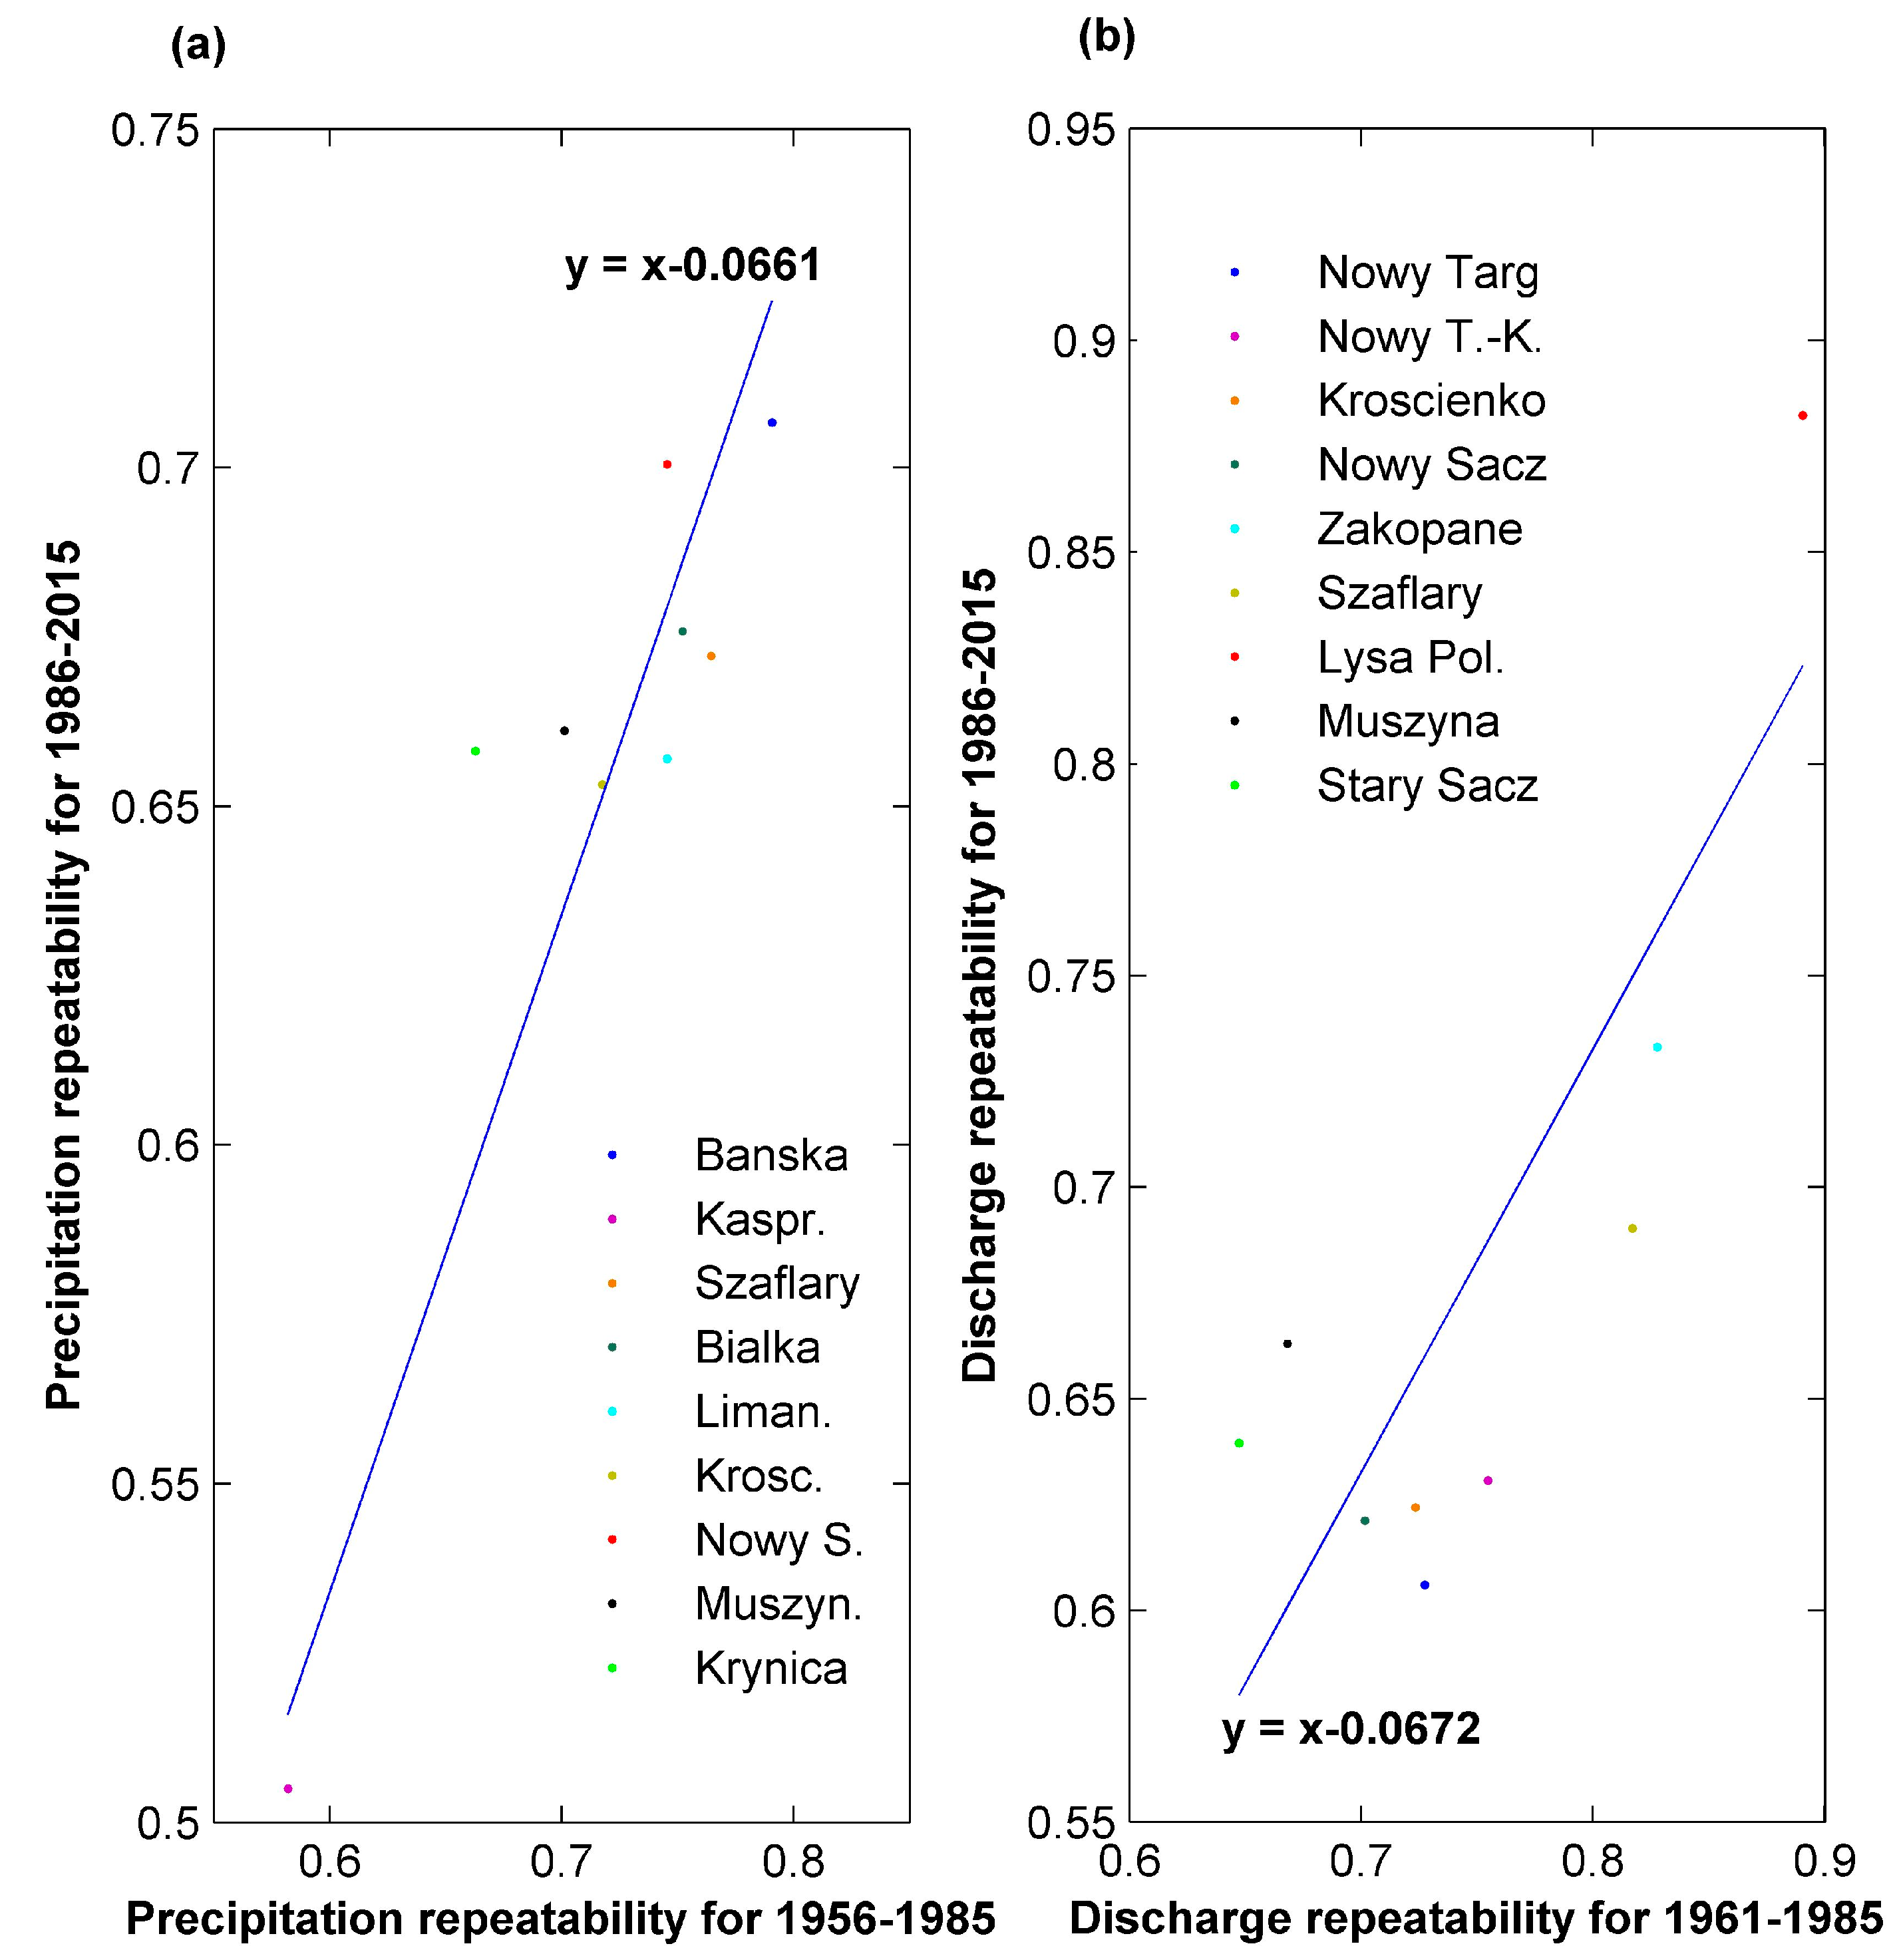
Table 7 lists values of the coefficient of repeatability calculated for P and Q over the considered periods, together with the results of the Wilcoxon signed rank tests. For the period 1956–1985, the repeatability of precipitation was moderately high, and depending on site, CR values ranged from 0.5820 at Kasprowy Wierch to 0.7067 at Bańska Wyżna. In the last 30 years (1986–2015), CR values have ranged from 0.5050 at Kasprowy Wierch to 0.7067 at Bańska Wyżna, with a significant median decrease in the precipitation repeatability (−0.0661), confirmed by the signed rank test (p = 0.0039), and shown in Figure 6a by the line y = x − 0.0661. The repeatability of the river flow studied is exceptionally high, especially for the Białka River (CR ≈ 0.90). For the period 1961–1985, CR values ranged from 0.6473 (Poprad River in Stary Sącz) to 0.8904 (Białka at Łysa Polana). In the most recent 30 years (1986–2015), the CR values of Q were within the range of 0.6061 (Czarny Dunajec in Nowy Targ) to 0.8824 (Białka at Łysa Polana), and the median decrease in repeatability (−0.0672) proved significant according to the Wilcoxon signed rank test (p = 0.0039). In Figure 6b, the median difference in the repeatability of the studied discharge between the last 30 years and the preceding period studied is illustrated by the line y = x − 0.0672. It can be observed that an additive relationship exists between the data points, as they scatter around the line. On the whole, for the last 30 years (1986–2015), the median repeatability of stream water flow in the sub-catchments of the Dunajec River has decreased significantly by a value (6.72%) comparable to that for precipitation (6.61%).
4. Discussion
According to the Intergovernmental Panel on Climate Change (IPCC) [1] (p. 126), climate is defined as the mean conditions, statistically described by the mean and variability of relevant quantities (such as surface temperature, precipitation and wind), and averaged over a period of time, typically 30 years, following the recommendation of the World Meteorological Organization [21], (p. 68). Climate change pertains to a change in the state of the climate, which can be identified (e.g., using statistical tests) by changes in the mean and/or the variability of its properties, which endures for an extended period of time (decades or longer) [1] (p. 126). The results of this research study concern significant differences in mean monthly precipitation and its variability, thus the mean conditions of precipitation. Therefore, identified differences in P between the last two consecutive 30-year periods (1986–2015 versus 1956–1985) can be interpreted as an important sign of ongoing changes (adjustments) in the sub-regional climate.
As the obtained results show, precipitation patterns have changed distinctively over the most recent 30 years, but the identified differences in P are (currently) discernible for individual months of the year, rather than on a seasonal or annual basis. Our results can help understand why this is happening. Although significant shifts in precipitation affect as many as 6 months of the year, they are largely compensating, as least for the 4341 km2 mountain sub-basin of the Dunajec River studied. Hence, on an annual basis (Table 1), precipitation for the most recent 30 years (1986–2015) either decreased (at four sites) or increased (at three sites) or remained almost unchanged (at two sites). Moreover, depending on the site, significant shifts in P between months agree in terms of direction, but vary in size (Table 3), indicating that local factors play a role in the resulting change [22]. Hence, it seems not surprising that significant linear trends in annual and seasonal area precipitation for the Carpathian region are (currently) absent, as shown in [6].
It seems also pertinent to mention the results of the analysis of areal mean monthly air temperature and precipitation over the period 1951–2000 for the lower lying territory of Poland [23]. As the authors point out [23], the identified upward trends in temperature in March and May as well as in precipitation in March can partly be explained by changes in the atmospheric circulation, with a greater role of the meridional component of the circulation during transitional seasons (spring, autumn). Additionally, a decrease of the summer precipitation contribution (June–August) to the annual total was also observed, but not proved as statistically significant [23]. This picture of identified changes is consistent with our findings regarding precipitation in March (an increase), June, and August (decreases). Moreover, markedly higher air temperatures in the last decade of the 20th century have been ascribed to both the impact of global warming, and snow cover–temperature feedback, due to diminished days with snow cover in the wintertime [23]. On the other hand, orographic precipitation results not only from cloud processes and larger-scale atmospheric circulation, but also from the interplay of atmospheric flow with orography [24], including transient interactions involving blocking, convection, and valley circulation [25]. Therefore, in mountain regions with substantial snowpack, predicting the effects of even minor changes in atmospheric circulation, or of even a slight increase in air temperature can present a challenge. Without comprehensive modeling, we can only presume that higher air temperature in the mountains will affect the distribution/amount of snow as well as affecting snow–temperature feedback.
The results of this study allow for assessing how regional warming translates into orographic precipitation change at the catchment scale. Such information can be useful for comparison with sub-regional modeling results, as models are required to improve understanding of the physical processes that govern orographic precipitation [26], which in turn improve simulations of precipitation. The assessment of how the resulting change in precipitation affects sub-regional hydrology is equally important, especially for planning adequate management of water resources, based on changes already observed [3]. The obtained results show that significant differences in Q patterns over the most recent 30 years (1986–2015 versus 1961–1985) involve only 3 individual months (in comparison with 6 months for P), implying the role of other factors in river run-off formation in this complex topography, including snow-pack and a considerable share of groundwater throughout the year [8]. However, main changes in Q for two months (May and September) are consistent with significant shifts in precipitation for these months.
Water resources in the Dunajec catchment, lying within the upper Vistula River Basin, are subject to the Regional Water Management Board in Cracow. It appears that the observed changes in precipitation patterns, with significant decreases in P in June and August, accompanied by less significant decreases in Q for these months, should be carefully studied by the Board in Cracow, as they indicate a possible water deficiency in these summer months, which may result in an increased risk of declines in agricultural production.
Regarding the variability and repeatability of the studied processes, significant differences in precipitation variability in the study area apply to 4 months, which results in a significant decrease in the repeatability of precipitation over the most recent 30 years (1986–2015). Changes in the variability of the river flow studied are less visible in this mountain region, while being significant for only two months. Nonetheless, over the last 30 years (1986–2015), the median repeatability of stream flow has decreased significantly by a value comparable to that for precipitation, which may contribute to hindering adequate water management. Overall, the results of this study show a general consistency in identified significant differences in patterns and repeatability for the precipitation and river flow in question; to a large extent, they are in agreement with the results obtained for neighboring basins of the Skawa and Raba rivers [27].
Acknowledgments
This work was supported by the Polish Ministry of Science and Higher Education (Grant No. Ś1/200/2016/DS task 4), including the costs to publish in open access. The author would like to thank Robert Szczepanek for his help in preparing one figure.
Conflicts of Interest
The author declares no conflict of interest. The founding sponsors had no role in the design of the study; in the collection, analyses, or interpretation of data; in the writing of the manuscript, and in the decision to publish the results.
References
- Intergovernmental Panel on Climate Change (IPCC). Climate Change 2013: The Physical Science Basis. Contribution of Working Group I to the Fifth Assessment Report of the Intergovernmental Panel on Climate Change; Stocker, T.F., Qin, D., Plattner, G.-K., Tignor, M., Allen, S.K., Boschung, J., Nauels, A., Xia, Y., Bex, V., Midgley, P.M., Eds.; Cambridge University Press: Cambridge, UK; New York, NY, USA, 2013. [Google Scholar]
- Trenberth, K.E.; Asrar, G.R. Challenges and opportunities in water cycle research: WCRP contributions. Surv. Geophys. 2014, 3, 515–532. [Google Scholar] [CrossRef]
- Hegerl, G.C.; Black, E.; Allan, R.P.; Ingram, W.J.; Polson, D.; Trenberth, K.E.; Chadwick, R.S.; Arkin, P.A.; Sarojini, B.B.; Becker, A.; et al. Challenges in quantifying changes in the global water cycle. Bull. Am. Meteorol. Soc. 2015, 96, 1097–1115. [Google Scholar] [CrossRef]
- Gobiet, A.; Kotlarski, S.; Beniston, M.; Heinrich, G.; Rajczak, J.; Stoffel, M. 21st century climate change in the European Alps—A review. Sci. Total Environ. 2014, 493, 1138–1151. [Google Scholar] [CrossRef] [PubMed]
- Rajczak, J.; Pall, P.; Schär, C. Projections of extreme precipitation events in regional climate symulations for Europe and the Alpine Region. J. Geophys. Res. 2013, 118, 3610–3626. [Google Scholar]
- Spinoni, J.; Szalai, S.; Szentimrey, T.; Lakatos, M.; Bihari, Z.; Nagy, A.; Nemeth, A.; Kovacs, T.; Mihic, D.; Dacic, M.; et al. Climate of the Carpathian Region in the period 1961–2010: Climatologies and trends of 10 variables. Int. J. Climatol. 2015, 35, 1322–1341. [Google Scholar] [CrossRef]
- Chełmicki, W. Location, classification and characteristics of the basin. In The Upper Vistula Basin, Part I; Dynowska, I., Maciejewski, M., Eds.; PWN: Warszawa-Kraków, Poland, 1991; pp. 15–29. (In Polish) [Google Scholar]
- Dynowska, I. Typy Reżimów Rzecznych w Polsce; Zeszyty Naukowe Uniwersytetu Jagiellońskiego: Kraków, Poland, 1972; (In Polish with English Summary). [Google Scholar]
- Kondracki, J. Carpathians; WSiP: Warsaw, Poland, 1978; (In Polish with English Summary). [Google Scholar]
- CLC 2012. Available online: http://land.copernicus.eu/pan-european/corine-land-cover (accessed on 4 October 2016).
- Hennig, J.; Hennig, I.; Roszkowski, A. Retention reservoirs. In The Upper Vistula Basin, Part II; Dynowska, I., Maciejewski, M., Eds.; PWN: Warszawa-Kraków, Poland, 1991; pp. 121–143. (In Polish) [Google Scholar]
- Bielak, B. Turystyka w Otoczeniu Zbiorników Zaporowych na Dunajcu. Available online: http://www.pg.geo.uj.edu.pl/documents/3189230/4676033/2007_117_13-28.pdf/00438a82-3286-4c67-aae6-5565dc7d5d30 (accessed on 30 December 2016).
- Aguilar, E.; Auler, I.; Brunet, M.; Peterson, T.C.; Wieringa, J. Guidance on Metadata and Homogenization. Available online: https://www.researchgate.net/publication/266866445_Guidance_on_Metadata_and_Homogenization (accessed on 20 December 2016).
- Toreti, A.; Kuglitsch, F.G.; Xoplaki, E.; Della-Marta, P.M.; Aguilar, E.; Prohom, M.; Luterbacher, J. A note on the use of the standard normal homogeneity test to detect inhomogeneities in climatic time series. Int. J. Climatol. 2011, 31, 630–632. [Google Scholar] [CrossRef]
- Alexandersson, H. A homogeneity test applied to precipitation data. Int. J. Climatol. 1986, 6, 661–675. [Google Scholar] [CrossRef]
- Khaliq, M.N.; Quarda, T.B.M.J. On the critical values of the standard normal homogeneity test (SNHT). Int. J. Climatol. 2007, 27, 681–687. [Google Scholar] [CrossRef]
- Chełmicki, W.; Skąpski, R.; Soja, R. The flow regime of Poland‘s Carpathian rivers. In Hydrologia Karpacka z Perspektywy Końca XX Wieku; Chełmicki, W., Soja, R., Eds.; PAN: Cracow, Poland, 1999; pp. 67–80, (In Polish with English Summary). [Google Scholar]
- Wilcoxon, F. Individual comparisons by ranking methods. Biometrics 1945, 1, 80–83. [Google Scholar] [CrossRef]
- Helsel, D.R.; Hirsch, R.M. Statistical Methods in Water Resources. Available online: https://pubs.usgs.gov/twri/twri4a3/ (accessed on 4 October 2016).
- Hollander, M.; Wolfe, A. Nonparametric Statistical Methods, 2nd ed.; John Wiley and Sons: New York, NY, USA, 1973. [Google Scholar]
- World Meteorological Organization (WMO). Characterizing Climate from Datasets. In Guide to Climatological Practices; WMO: Geneva, Switzerland, 2011; pp. 44–72. [Google Scholar]
- Betts, R.A. Implications of land ecosystem–atmosphere interactions for strategies for climate change adaptation and mitigation. Tellus B Chem. Phys. Meterol. 2007, 59, 602–615. [Google Scholar] [CrossRef]
- Degirmendžić, J.; Kożuchowski, K.; Żmudzka, E. Changes of air temperature and precipitation in Poland in the period 1951–2000 and their relationship to atmospheric circulation. Int. J. Climatol. 2004, 24, 291–310. [Google Scholar] [CrossRef]
- Sawyer, J.S. The physical and dynamical problems of orographic rain. Weather 1956, 11, 375–381. [Google Scholar] [CrossRef]
- Roe, G.H. Orographic precipitation. Annu. Rev. Earth Planet. Sci. 2005, 33, 645–671. [Google Scholar] [CrossRef]
- Minder, J.R.; Durran, D.R.; Roe, G.H.; Anders, A.M. The climatology of small-scale orographic precipitation over the Olympic Mountains: Patterns and processes. Q. J. R. Meteorol. Soc. 2008, 134, 817–839. [Google Scholar] [CrossRef]
- Kędra, M. Altered precipitation characteristics in the Polish Carpathian basins with implications for water resources. Clim. Res. Under review.
Figure 1.
Study area—the Dunajec catchment with observation stations used.

Figure 2.
Annual cycle of mean monthly precipitation for two subsequent 30-year periods at (a) Bańska Wyżna; (b) Kasprowy Wierch; (c) Szaflary; (d) Białka Tatrzańska; (e) Limanowa; (f) Krościenko; (g) Nowy Sącz; (h) Muszyna; and (i) Krynica. Between the time periods 1986–2015 and 1956–1985, significant differences in precipitation were identified for December, June, and August (decreases), as well as for March, May, and September (increases).

Figure 3.
Variability of precipitation for two subsequent 30-year periods at (a) Bańska Wyżna; (b) Kasprowy Wierch; (c) Szaflary; (d) Białka Tatrzańska; (e) Limanowa; (f) Krościenko; (g) Nowy Sącz; (h) Muszyna; and (i) Krynica. Between the time periods 1986–2015 and 1956–1985, significant differences in the variability of precipitation were identified for January and February (decreases), as well as for July and September (increases).
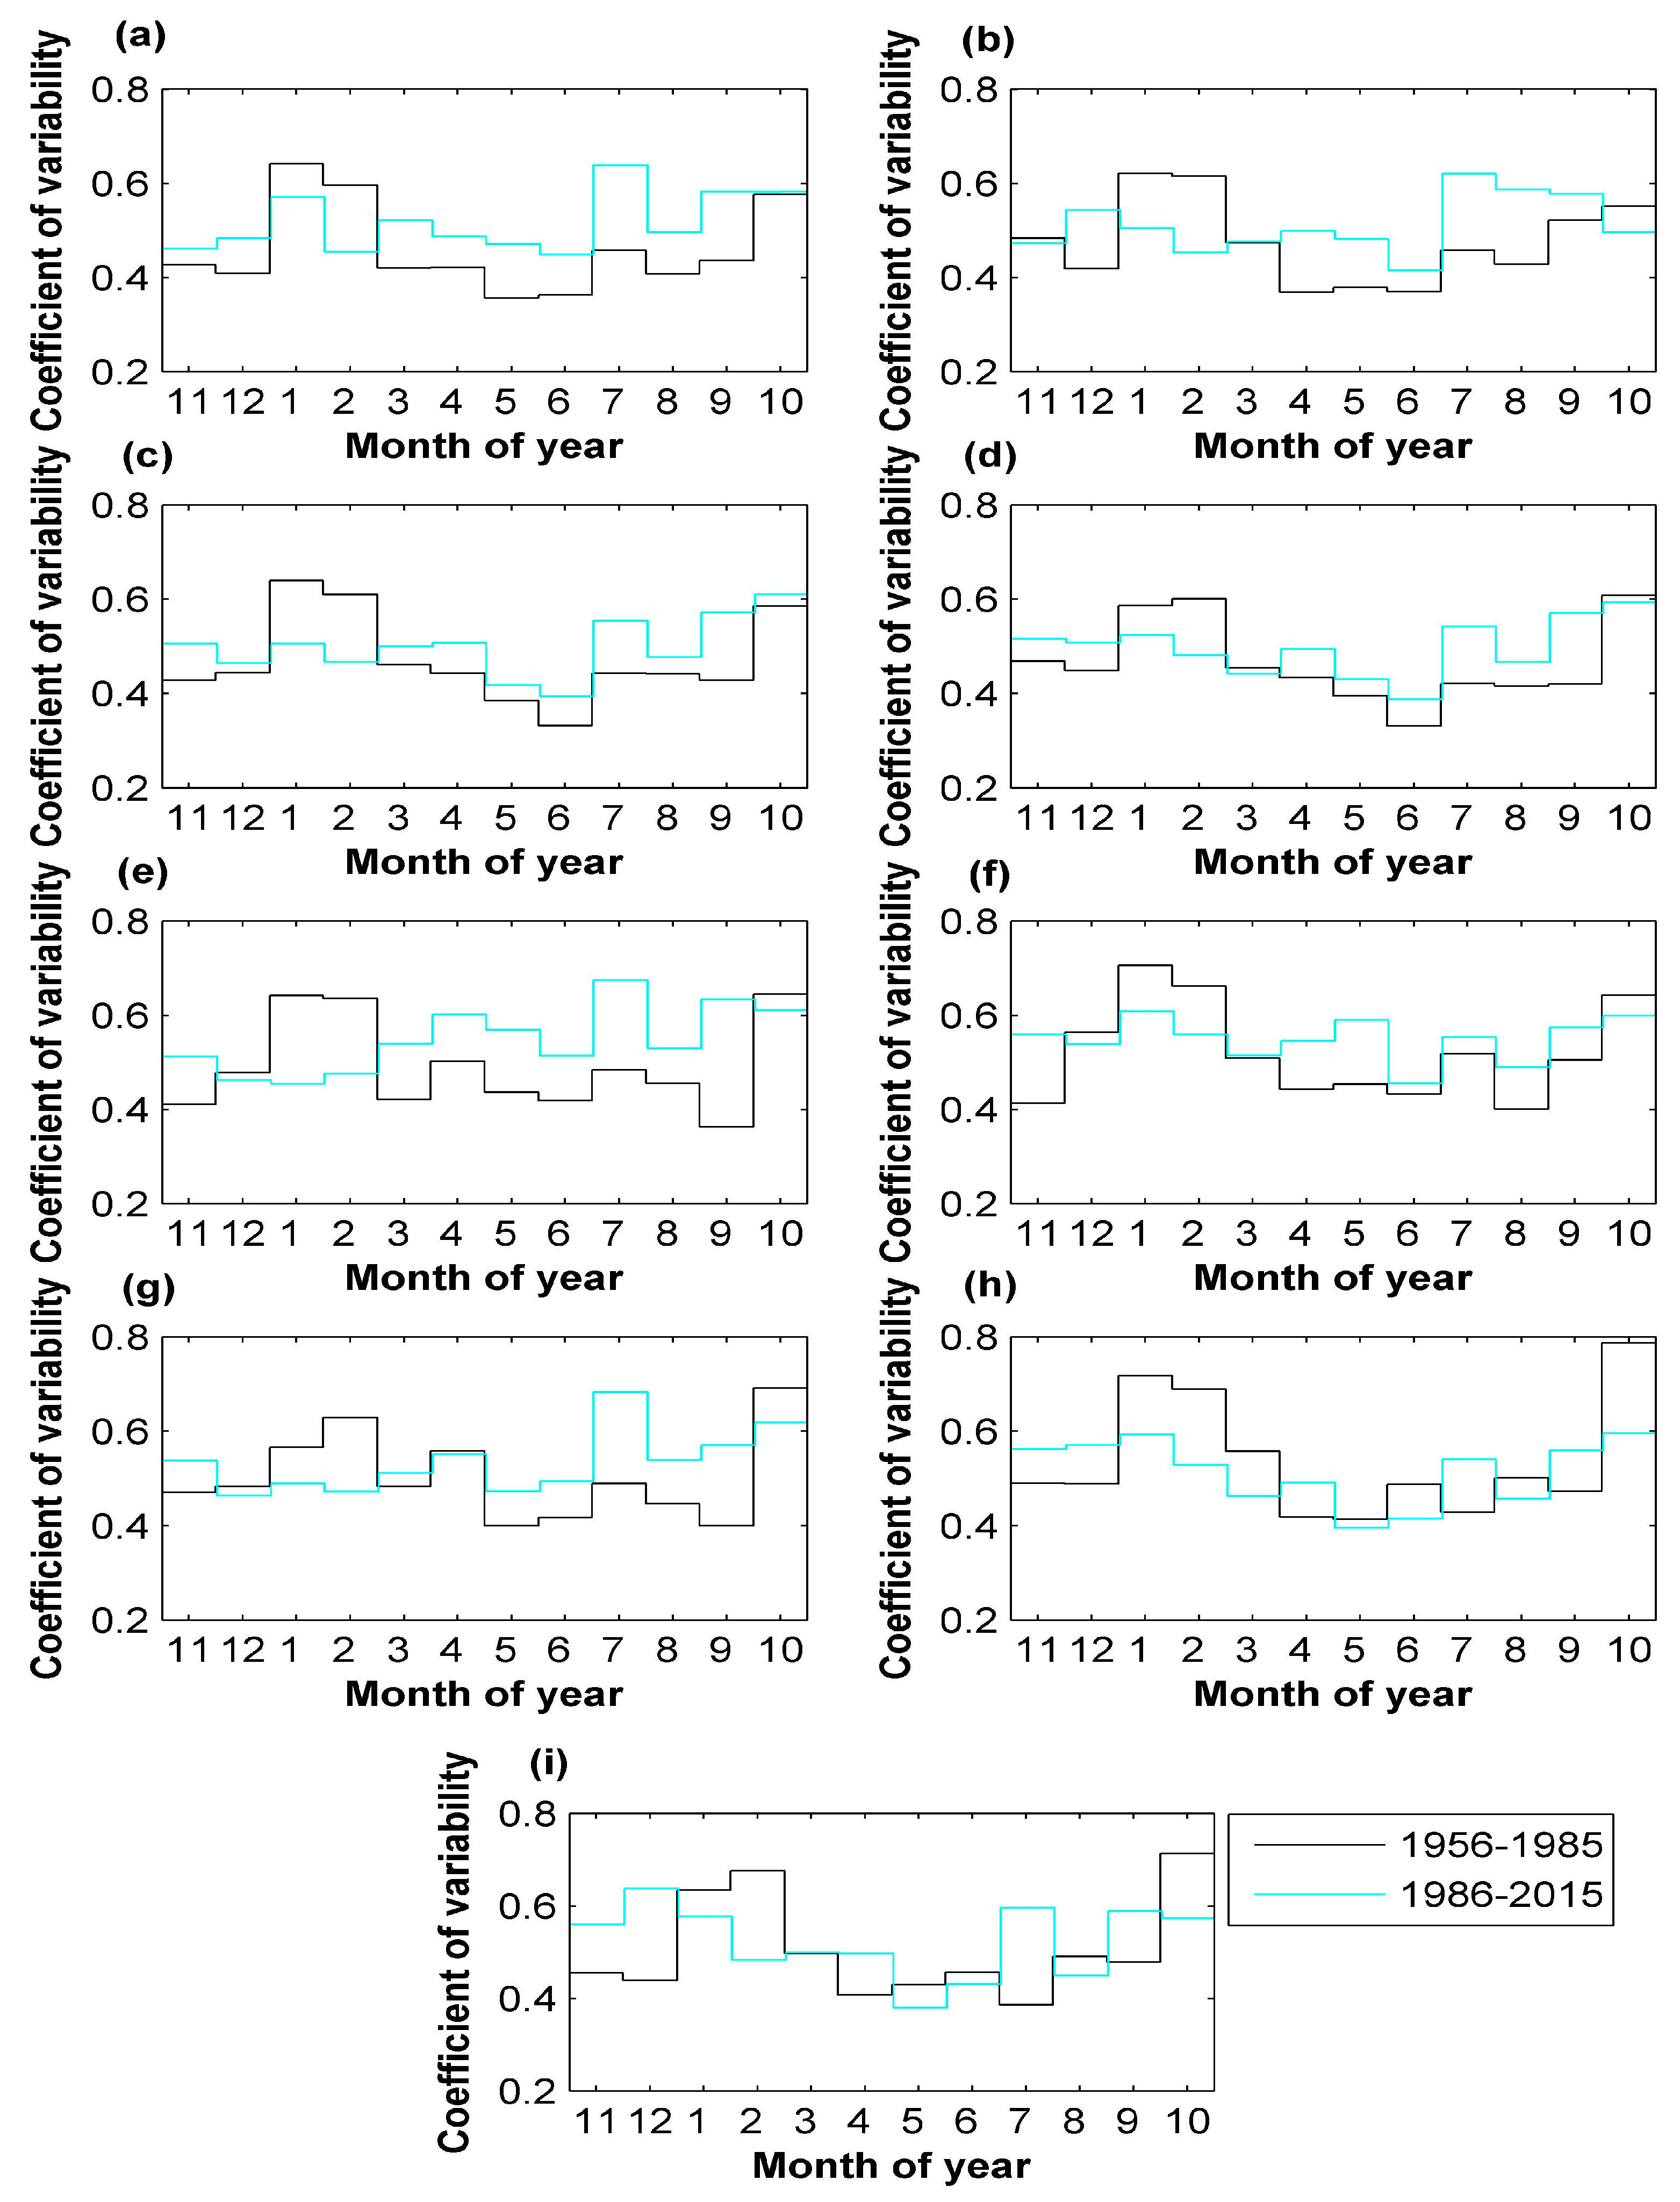
Figure 4.
Annual cycle of mean monthly discharge for two subsequent periods at (a) Nowy Targ; (b) Nowy Targ-Kowaniec; (c) Krościenko; (d) Nowy Sącz; (e) Zakopane-Harenda; (f) Szaflary; (g) Łysa Polana; (h) Muszyna; and (i) Stary Sącz. Between the time periods 1986–2015 and 1961–1985, significant increases in discharge were identified for February, May, and September.

Figure 5.
Variability of river flow for two subsequent periods at (a) Nowy Targ; (b) Nowy Targ-Kowaniec; (c) Krościenko; (d) Nowy Sącz; (e) Zakopane-Harenda; (f) Szaflary; (g) Łysa Polana; (h) Muszyna; and (i) Stary Sącz. Between the time periods 1986–2015 and 1961–1985, significant differences in the variability of river flow were identified for September (an increase) and for October (a decrease).

Figure 6.
Repeatability of the studied process of (a) precipitation and (b) river flow for two subsequent long-term periods at selected sites in the study area. Between the time periods 1986–2015 and 1956–1985, the median difference (a decrease of 0.0661) in the repeatability of precipitation was significant according to the Wilcoxon signed rank test. A similar finding is true for river discharge, with a median decrease in the repeatability of 0.0672 over the time period 1986–2015 in comparison with 1961–1985.

| Precipitation Station | Latitude (N) | Longitude (E) | Altitude (m a.s.l.) | Basin | Mean Annual Precipitation (mm) | ||
|---|---|---|---|---|---|---|---|
| 1956–2015 | 1956–1985 | 1986–2015 | |||||
| Bańska Wyżna | 49°23′03″ | 19°58′24″ | 896 | Biały Dunajec | 928.1 | 950.4 | 905.9 |
| Kasprowy Wierch | 49°13′57″ | 19°58′55″ | 1991 | Biały Dunajec | 1762.8 | 1786.2 | 1739.4 |
| Szaflary | 49°25′31″ | 20°01′35″ | 638 | Biały Dunajec | 851.5 | 838.4 | 864.7 |
| Białka Tatrzańska | 49°24′46″ | 20°06′18″ | 680 | Białka | 836.2 | 841.7 | 830.7 |
| Limanowa | 49°41′37″ | 20°25′06″ | 515 | Dunajec | 834.2 | 833.7 | 834.7 |
| Krościenko | 49°26′44″ | 20°25′54″ | 435 | Dunajec | 839.4 | 811.8 | 867.0 |
| Nowy Sącz | 49°37′38″ | 20°40′19″ | 292 | Dunajec | 732.9 | 735.2 | 730.6 |
| Muszyna | 49°20′59″ | 20°53′11″ | 445 | Poprad | 756.5 | 724.5 | 788.5 |
| Krynica | 49°24′28″ | 20°57′39″ | 582 | Poprad | 858.4 | 873.6 | 843.3 |
Table 2.
Physiographic characteristics of the studied river catchments [7].
| Basin/Streamflow Station | Basin Area (km2) | Min/Max Altitude (m a.s.l.) | Mean/Median 1 Altitude (m a.s.l.) | Mean Basin Slope (–) | Aspect | Mean Discharge (m3·s−1) | ||
|---|---|---|---|---|---|---|---|---|
| 1961–2015 | 1961–1985 | 1986–2015 | ||||||
| Czarny Dunajec/Nowy Targ | 432.0 | 581/2176 | 1379/757 | 0.043 | NE | 8.84 | 9.09 | 8.59 |
| Dunajec/NowyTarg-Kowaniec | 681.1 | 577/2301 | 1439/836 | 0.046 | NE | 14.51 | 14.72 | 14.31 |
| Dunajec/Krościenko | 1580.0 | 416/2628 | 1522/nd 2 | 0.040 | NE | 32.00 | 31.86 | 32.14 |
| Dunajec/Nowy Sącz | 4341.0 | 277/2655 | 1466/nd 2 | 0.031 | NE | 65.82 | 65.37 | 66.31 |
| Biały Dunajec/Zakopane-Harenda | 58.4 | 765/2096 | 1430/1046 | 0.126 | N | 2.23 | 2.07 | 2.40 |
| Biały Dunajec/Szaflary | 210.0 | 638/2301 | 1470/929 | 0.072 | N | 5.31 | 5.40 | 5.21 |
| Białka/Łysa Polana | 63.1 | 967/2628 | 1798/1594 | 0.151 | N | 3.13 | 3.08 | 3.19 |
| Poprad/Muszyna | 1514.2 | 445/2655 | 1550/nd 2 | 0.031 | NE | 17.71 | 17.27 | 18.14 |
| Poprad/Stary Sącz | 2071.0 | 295/2655 | 1475/nd 2 | 0.032 | NE | 25.36 | 25.21 | 25.52 |
Notes: 1 Median elevation is computed using a hypsometric curve; 2 not determined.
Table 3.
Difference in monthly precipitation (mm) between the most recent 30-year period (1986–2015) and the previous 30-year period (1956–1985). According to the Wilcoxon signed rank test with the Bonferroni correction, the median of the difference in precipitation for each month is significant at p < 0.0042.
| Precipitation Station | Nov. | Dec. | Jan. | Feb. | Mar. | Apr. | May | Jun. | Jul. | Aug. | Sep. | Oct. | Year |
|---|---|---|---|---|---|---|---|---|---|---|---|---|---|
| Bańska Wyżna | −6.7 | −8.1 | −5.9 | −3.0 | 6.5 | −5.7 | 8.3 | −22.7 | −2.6 | −22.5 | 14.7 | 3.1 | −44.5 |
| Kasprowy Wierch | 6.2 | −15.1 | −9.0 | −20.8 | 6.1 | −12.7 | 23.8 | −38.6 | −1.9 | −15.8 | 31.9 | −1.0 | −46.8 |
| Szaflary | 0.5 | −1.7 | −3.3 | 1.3 | 11.3 | 4.9 | 11.5 | −16.2 | 7.2 | −12.6 | 16.5 | 7.0 | 26.3 |
| Białka Tatrzańska | −2.4 | −6.2 | −7.2 | 0.2 | 8.9 | 1.5 | 12.4 | −28.4 | 5.7 | −10.8 | 12.8 | 2.5 | −11.0 |
| Limanowa | −6.9 | −5.0 | −2.3 | −3.1 | 10.2 | −3.1 | 16.3 | −13.2 | −4.8 | −9.5 | 18.3 | 4.1 | 1.0 |
| Krościenko | −3.2 | −2.7 | 5.8 | 4.2 | 13.4 | 6.0 | 23.4 | −12.6 | 13.7 | −13.8 | 14.9 | 6.2 | 55.2 |
| Nowy Sącz | −6.1 | −8.0 | −1.5 | −1.3 | 3.4 | 2.6 | 19.7 | −2.8 | −9.1 | −12.7 | 9.3 | 2.0 | −4.6 |
| Muszyna | −1.2 | −0.1 | 4.9 | 9.8 | 7.3 | 6.6 | 18.7 | −9.5 | 11.5 | −2.5 | 13.1 | 5.5 | 64.0 |
| Krynica | −10.9 | −17.2 | −7.7 | −5.5 | 2.9 | −2.4 | 13.9 | −9.9 | 3.6 | −10.7 | 10.3 | 2.7 | −30.3 |
| Signed rank | 7 | 0 | 9 | 17 | 0 | 21 | 0 | 0 | 14 | 0 | 0 | 1 | |
| p-value 1 | 0.0742 | 0.0039 | 0.1289 | 0.5703 | 0.0039 | 0.9102 | 0.0039 | 0.0039 | 0.3594 | 0.0039 | 0.0039 | 0.0078 | |
| HLE 2 | −3.6550 | −6.5950 | −3.3400 | −1.3100 | 7.6983 | 0.1467 | 16.2833 | −16.0750 | 2.2767 | −12.3283 | 14.6533 | 3.6050 | |
| Mean | −3.4 | −7.1 | −2.9 | −2.0 | 7.8 | −0.3 | 16.4 | −17.1 | 2.6 | −12.3 | 15.8 | 3.6 |
Notes: 1 Significant values are in bold; 2 the Hodges–Lehmann Estimator (HLE) is the median of all possible pair-wise averages of the differences [19].
Table 4.
Difference in the variability of monthly precipitation determined by the coefficient of variability between the most recent 30-year period (1986–2015) and the previous 30-year period (1956–1985). According to the Wilcoxon signed rank test with the Bonferroni correction, the median of the difference in variability of precipitation for each month is significant at p < 0.0042.
| Precipitation Station | Nov. | Dec. | Jan. | Feb. | Mar. | Apr. | May | Jun. | Jul. | Aug. | Sep. | Oct. |
|---|---|---|---|---|---|---|---|---|---|---|---|---|
| Bańska Wyżna | 0.0344 | 0.0745 | −0.0704 | −0.1420 | 0.1002 | 0.0656 | 0.1140 | 0.0858 | 0.1815 | 0.0885 | 0.1468 | 0.0061 |
| Kasprowy Wierch | −0.0107 | 0.1254 | −0.1166 | −0.1628 | 0.0031 | 0.1295 | 0.1024 | 0.0444 | 0.1624 | 0.1577 | 0.0571 | −0.0553 |
| Szaflary | 0.0770 | 0.0212 | −0.1337 | −0.1425 | 0.0379 | 0.0634 | 0.0335 | 0.0622 | 0.1104 | 0.0358 | 0.1434 | 0.0258 |
| Białka Tatrzańska | 0.0482 | 0.0588 | −0.0631 | −0.1200 | −0.0121 | 0.0612 | 0.0361 | 0.0571 | 0.1217 | 0.0519 | 0.1508 | −0.0147 |
| Limanowa | 0.1019 | −0.0164 | −0.1876 | −0.1594 | 0.1184 | 0.0993 | 0.1321 | 0.0952 | 0.1907 | 0.0742 | 0.2717 | −0.0348 |
| Krościenko | 0.1460 | −0.0251 | −0.0969 | −0.1028 | 0.0065 | 0.1033 | 0.1364 | 0.0223 | 0.0352 | 0.0892 | 0.0692 | −0.0442 |
| Nowy Sącz | 0.0675 | −0.0200 | −0.0767 | −0.1560 | 0.0282 | −0.0073 | 0.0737 | 0.0763 | 0.1923 | 0.0926 | 0.1718 | −0.0742 |
| Muszyna | 0.0723 | 0.0828 | −0.1248 | −0.1590 | −0.0953 | 0.0727 | −0.0194 | −0.0740 | 0.1125 | −0.0439 | 0.0858 | −0.1918 |
| Krynica | 0.1042 | 0.1988 | −0.0569 | −0.1927 | 0.0028 | 0.0901 | −0.0502 | −0.0260 | 0.2096 | −0.0411 | 0.1100 | −0.1402 |
| Signed rank | 1 | 7 | 0 | 0 | 11 | 1 | 5 | 8 | 0 | 5 | 0 | 4 |
| p-value 1 | 0.0078 | 0.0742 | 0.0039 | 0.0039 | 0.2031 | 0.0078 | 0.0391 | 0.0977 | 0.0039 | 0.0391 | 0.0039 | 0.0273 |
| HLE 2 | 0.0723 | 0.0520 | −0.0976 | −0.1507 | 0.0156 | 0.0803 | 0.0679 | 0.0493 | 0.1516 | 0.0625 | 0.1284 | −0.0497 |
Notes: 1 Significant values are in bold; 2 the Hodges–Lehmann Estimator (HLE) is the median of all possible pair-wise averages of the differences [19].
Table 5.
Difference in mean monthly discharge (m3·s−1) between the most recent 30-year period (1986–2015) and the previous period (1961–1985). According to the Wilcoxon signed rank test with the Bonferroni correction, the median of the difference in discharge for each month is significant at p < 0.0042.
| Catchment/Streamflow Station | Nov. | Dec. | Jan. | Feb. | Mar. | Apr. | May | Jun. | Jul. | Aug. | Sep. | Oct. |
|---|---|---|---|---|---|---|---|---|---|---|---|---|
| Czarny Dunajec/Nowy Targ | 0.24 | −0.12 | 0.19 | 0.35 | −0.58 | −0.27 | 0.71 | −2.54 | −2.39 | −3.06 | 1.98 | −0.56 |
| Dunajec/Nowy Targ-Kowaniec | 0.89 | 0.43 | 1.07 | 1.17 | −0.29 | −1.53 | 1.14 | −3.72 | −3.00 | −4.00 | 3.46 | −0.58 |
| Dunajec/Krościenko | 1.38 | 1.57 | 3.13 | 3.51 | −1.69 | −3.02 | 6.68 | −4.43 | −2.42 | −6.91 | 8.05 | −2.44 |
| Dunajec/Nowy Sącz | 2.84 | 2.77 | 5.00 | 7.29 | −5.30 | −7.93 | 11.43 | −3.85 | −1.88 | −8.65 | 14.56 | −4.64 |
| Biały Dunajec/Zakopane-Harenda | 0.29 | 0.12 | 0.14 | 0.20 | 0.40 | 0.51 | 1.07 | −0.06 | 0.32 | 0.08 | 0.75 | 0.12 |
| Biały Dunajec/ Szaflary | 0.22 | 0.05 | 0.20 | 0.33 | 0.27 | −0.30 | 0.74 | −1.92 | −1.45 | −1.48 | 1.22 | −0.11 |
| Białka/Łysa Polana | 0.25 | −0.06 | −0.01 | 0.04 | 0.06 | 0.47 | 1.54 | −0.18 | −0.69 | −0.63 | 0.61 | −0.17 |
| Poprad/Muszyna | 0.29 | 0.56 | 0.95 | 0.66 | 0.29 | −2.09 | 3.96 | 0.97 | 2.57 | 0.44 | 3.30 | −1.46 |
| Poprad/Stary Sącz | −0.35 | −0.02 | 1.10 | 1.26 | −1.49 | −3.69 | 4.85 | 0.31 | 1.67 | −1.74 | 4.11 | −2.31 |
| Signed rank | 6 | 9 | 1 | 0 | 12 | 7 | 0 | 7 | 13 | 3 | 0 | 2 |
| p-value 1 | 0.0547 | 0.1289 | 0.0078 | 0.0039 | 0.2500 | 0.0742 | 0.0039 | 0.0742 | 0.3008 | 0.0195 | 0.0039 | 0.0117 |
| HLE 2 | 0.5183 | 0.2749 | 0.9484 | 0.8015 | 0.8015 | −1.6118 | 2.9606 | −1.7706 | −1.0312 | −2.3992 | 3.2961 | −1.2084 |
Notes: 1 Significant values are in bold; 2 the Hodges–Lehmann Estimator (HLE) is the median of all possible pair-wise averages of the differences [19].
Table 6.
Difference in the variability of monthly discharge determined by the coefficient of variability between the most recent 30-year period (1986–2015) and the previous period (1961–1985). According to the Wilcoxon signed rank test with the Bonferroni correction, the median of the difference in variability of discharge for each month is significant at p < 0.0042.
| Catchment/Streamflow Station | Nov. | Dec. | Jan. | Feb. | Mar. | Apr. | May | Jun. | Jul. | Aug. | Sep. | Oct. |
|---|---|---|---|---|---|---|---|---|---|---|---|---|
| Czarny Dunajec/Nowy Targ | −0.0481 | 0.0605 | −0.2479 | −0.1972 | −0.0527 | −0.1198 | 0.2221 | −0.0270 | 0.2238 | 0.0238 | 0.5601 | −0.2068 |
| Dunajec/Nowy Targ-Kowaniec | −0.0507 | 0.0280 | −0.1876 | −0.1750 | −0.0564 | −0.1471 | 0.1493 | −0.0400 | 0.1248 | 0.1003 | 0.4918 | −0.1825 |
| Dunajec/Krościenko | −0.0095 | −0.0116 | −0.1926 | −0.2578 | 0.0395 | −0.1105 | 0.2089 | −0.0500 | 0.2111 | 0.0630 | 0.5382 | −0.2530 |
| Dunajec/Nowy Sącz | −0.0130 | 0.0307 | −0.1998 | −0.3042 | −0.0185 | −0.0985 | 0.2173 | 0.0208 | 0.1373 | 0.0516 | 0.5533 | −0.3850 |
| Biały Dunajec/Zakopane-Harenda | −0.0169 | 0.0450 | 0.0571 | 0.1017 | 0.1021 | −0.0007 | −0.0227 | −0.2320 | 0.2139 | 0.1351 | 0.3404 | −0.1191 |
| Biały Dunajec/Szaflary | 0.0319 | 0.0147 | −0.1562 | −0.0575 | −0.0751 | −0.1442 | 0.1302 | −0.1450 | 0.0124 | 0.0738 | 0.3911 | −0.1641 |
| Białka/Łysa Polana | −0.0092 | 0.0106 | −0.0548 | 0.2544 | −0.1094 | 0.0314 | −0.0767 | −0.1300 | −0.0481 | 0.1241 | 0.2439 | −0.2290 |
| Poprad/Muszyna | −0.0071 | 0.0155 | −0.1078 | −0.4111 | −0.0533 | −0.1299 | 0.1077 | −0.0050 | 0.0274 | 0.0873 | 0.3902 | −0.5775 |
| Poprad/Stary Sącz | −0.0205 | 0.0886 | −0.1350 | −0.4219 | −0.0394 | −0.1008 | 0.1626 | 0.0424 | 0.0526 | −0.0118 | 0.3824 | −0.5192 |
| Signed rank | 7 | 2 | 2 | 7 | 11 | 2 | 3 | 7 | 3 | 1 | 0 | 0 |
| p-value 1 | 0.0742 | 0.0117 | 0.0117 | 0.0742 | 0.2031 | 0.0117 | 0.0195 | 0.0742 | 0.0195 | 0.0078 | 0.0039 | 0.0039 |
| HLE 2 | −0.0138 | 0.0294 | −0.1502 | −0.1809 | −0.0394 | −0.1092 | 0.1397 | −0.0512 | 0.1132 | 0.0740 | 0.4410 | −0.2745 |
Notes: 1 Significant values are in bold; 2 the Hodges–Lehmann Estimator (HLE) is the median of all possible pair-wise averages of the differences [19].
Table 7.
The repeatability of monthly precipitation and discharge determined by the coefficient of repeatability. According to the Wilcoxon signed rank test, the median of the difference in repeatability between the most recent 30-year period (1986–2015) and the previous period is significant at p < 0.05.
| Precipitation Station | 1956–1985 | 1986–2015 | Catchment/Streamflow Station | 1961–1985 | 1986–2015 |
|---|---|---|---|---|---|
| Bańska Wyżna | 0.7907 | 0.7067 | Czarny Dunajec/Nowy Targ | 0.7274 | 0.6061 |
| Kasprowy Wierch | 0.5820 | 0.5050 | Dunajec/Nowy Targ-Kowaniec | 0.7547 | 0.6307 |
| Szaflary | 0.7644 | 0.6722 | Dunajec/Krościenko | 0.7233 | 0.6245 |
| Białka Tatrzańska | 0.7522 | 0.6758 | Dunajec/Nowy Sącz | 0.7016 | 0.6212 |
| Limanowa | 0.7455 | 0.6571 | Biały Dunajec/Zakopane-Harenda | 0.8275 | 0.7331 |
| Krościenko | 0.7175 | 0.6532 | Biały Dunajec/Szaflary | 0.8170 | 0.6903 |
| Nowy Sącz | 0.7456 | 0.7005 | Białka/Łysa Polana | 0.8904 | 0.8824 |
| Muszyna | 0.7012 | 0.6612 | Poprad/Muszyna | 0.6681 | 0.6631 |
| Krynica | 0.6628 | 0.6582 | Poprad/Stary Sącz | 0.6473 | 0.6396 |
| The Difference in Repeatability of Precipitation between 1986–2015 and 1956–1985 | The Difference in Repeatability of Discharge between 1986–2015 and 1961–1985 | ||||
| Signed rank | 0 | Signed rank | 0 | ||
| p-value 1 | 0.0039 | p-value 1 | 0.0039 | ||
| HLE 2 | −0.0661 | HLE 2 | −0.0672 | ||
Notes: 1 Significant values are in bold; 2 the Hodges–Lehmann Estimator (HLE) is the median of all possible pair-wise averages of the differences [19].
© 2017 by the author; licensee MDPI, Basel, Switzerland. This article is an open access article distributed under the terms and conditions of the Creative Commons Attribution (CC-BY) license (http://creativecommons.org/licenses/by/4.0/).
Share and Cite
MDPI and ACS Style
Kędra, M. Altered Precipitation and Flow Patterns in the Dunajec River Basin. Water 2017, 9, 22. https://doi.org/10.3390/w9010022
AMA Style
Kędra M. Altered Precipitation and Flow Patterns in the Dunajec River Basin. Water. 2017; 9(1):22. https://doi.org/10.3390/w9010022
Chicago/Turabian StyleKędra, Mariola. 2017. "Altered Precipitation and Flow Patterns in the Dunajec River Basin" Water 9, no. 1: 22. https://doi.org/10.3390/w9010022
Note that from the first issue of 2016, this journal uses article numbers instead of page numbers. See further details here.