1. Introduction
In 2015, 163,675 growers and farmers were reported to be marketing foods locally [
1]. The local foods movement has encouraged growers and farmers to diversify their farming practices and find additional market opportunities to expand their business. An increasingly popular method for farm diversification is aquaponics, which is an agricultural practice that involves the cultivation of crops in soilless (hydroponic) systems by fertilizing plants with nutrient-rich water from intensively cultured aquatic organisms such as fish [
2]. There are many benefits to aquaponic crop production when compared to conventional soil culture such as accelerated plant growth [
2], decreased production area requirements [
3], reduced water usage [
2], reduced environmental effluents [
2], reduced system production costs [
2], extended production season [
4], reduced soil-borne plant pathogens [
4], and diversification of farm products [
5].
Between 1998 and 2008, 46% of all foodborne illnesses reported were associated with fruits, vegetables, and nuts [
6]. Food safety is an increasingly important concern in the food supply globally, and very few food safety interventions within an aquaponics system are known. A main food safety concern with aquaponics is the cultivation of fruit and vegetable crops in water containing fish excreta and other organic matter including fish and plant particulate residuals.
E. coli O157:H7,
Salmonella, and
Listeria monocytogenes are the main foodborne pathogens that can be within the recirculating water system and have been shown to survive in these conditions [
7,
8]. Additionally, fish from non-reliable sources can introduce foodborne viruses and disease (e.g.,
Vibrio spp.) that are not commonly associated with fruits and vegetables [
9].
Food safety concerns related to aquaponics have emphasized the need for more research in food safety interventions such as UV-treatment [
10], ozonation [
11], and organic acids [
12]. The usage of ultraviolet light (UV-C) treatment in recirculating aquaculture has been suggested to reduce pathogen loads [
13] in the water column, without adding any chemicals into the water, thus maintaining fish health and decreasing the need for water exchange [
4]. Research with lettuce and UV treatment at 300–500 W∙s∙m
−2 showed total coliforms counts below 1 CFU∙g
−1 and a reduction in microbial loads higher than 99% with no significant difference in the productive traits of lettuce [
10]. In 1985, UV irradiation was shown to inactivate bacteria
Escherichia coli,
Salmonella typhi,
Shigella sonnei,
Streptococcus faecalis,
Staphylococcus aureus,
Bacillus subtilis spores, viruses poliovirus type 1, simian rotavirus SA11, the cysts of the protozoan
Acanthamoeba castellanii, as well as total coliforms and standard plate count microorganisms in effluent waste water at different intensities [
14]. This suggests that use of UV treatment in aquaponics could be a valid method to produce vegetables with high hygienic standards. The purpose of this study was to determine the current food safety status in an aquaponic system and how effective UV treatment would be as a food safety intervention.
2. Materials and Methods
2.1. Aquaponics Unit Design
The six aquaponics units were identical with respect to the same ratio of plants, water, and fish as a commercial unit [
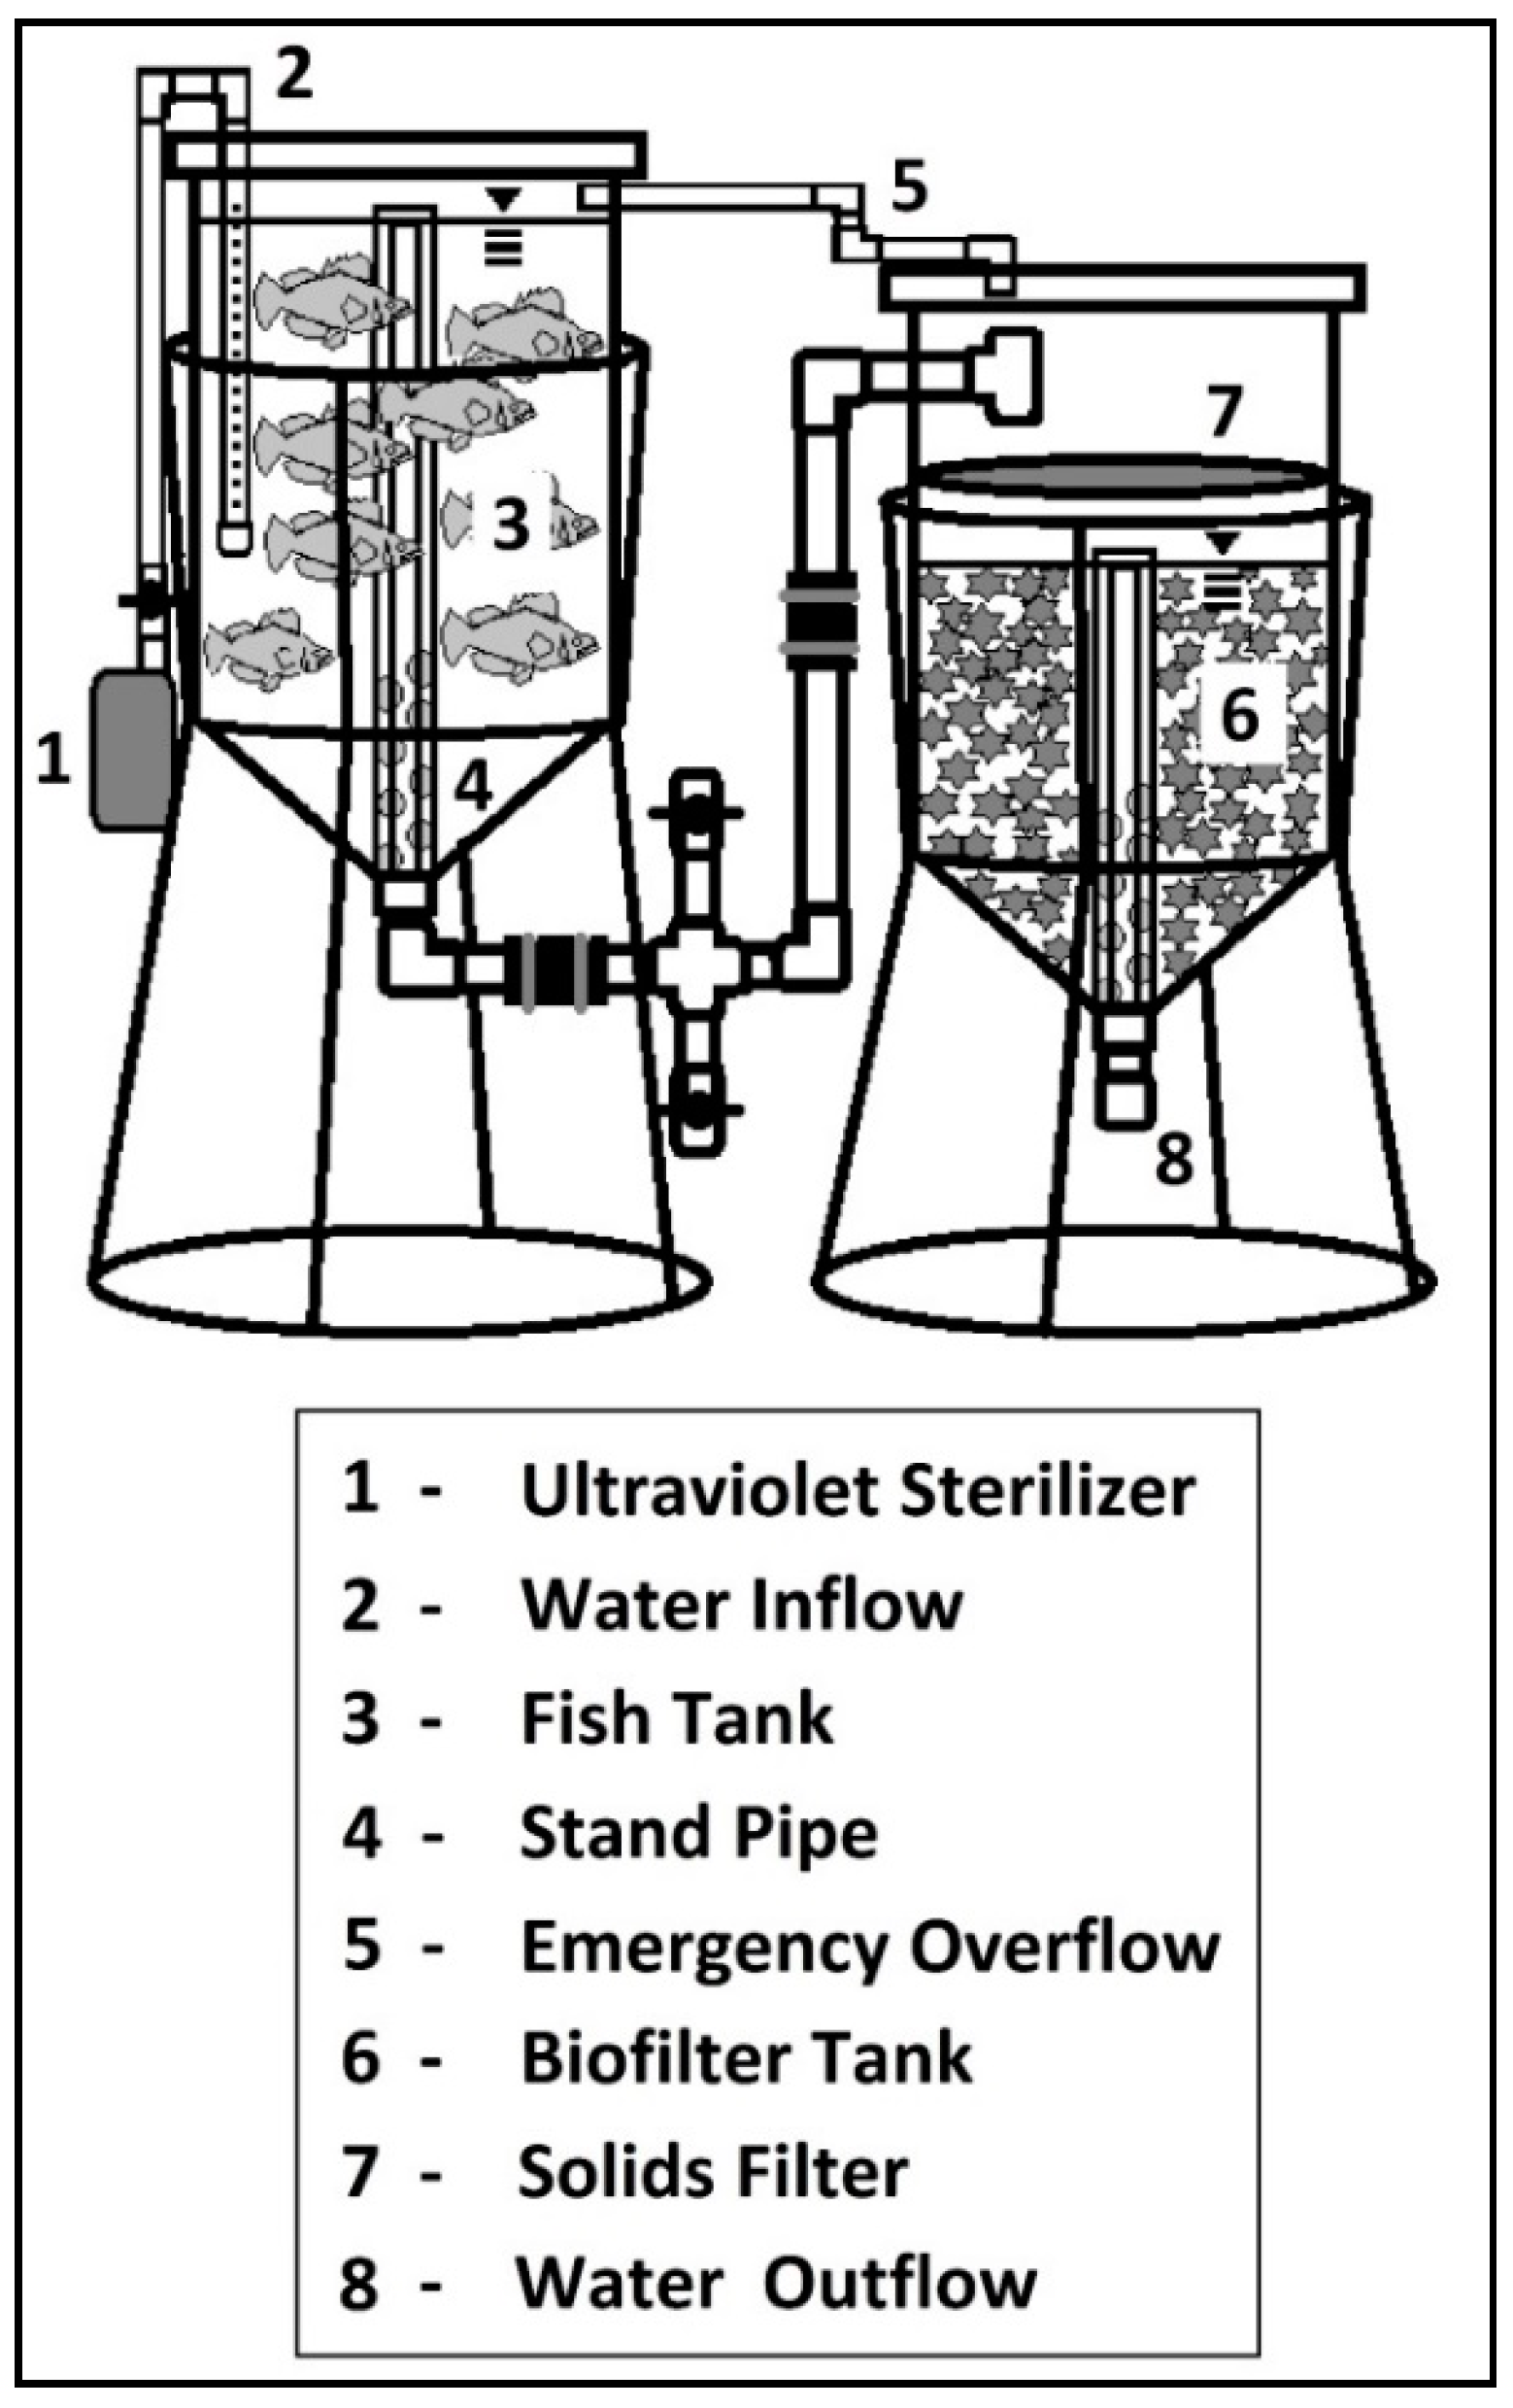
15]. There were three independent experimental units (systems) for each treatment. Each system consisted of a fish culture tank, solids filtration, biological filtration, a deep water hydroponic culture unit, an ultraviolet sterilizer, a submersible magnetic drive centrifugal pump, and a diaphragm style aerator with eight 15 cm air stones per system (
Figure 1 and
Figure 2). The water source of Ames, Iowa, used here was hard (~300 mg∙L
−1), with low to moderate alkaline concentrations (20–100 mg∙L
−1) and a basic pH of 8.8–9.4). It had a temperature between 14 and 18 °C, and contained chloramine as a microbial deterrent. The fish tank and solids/biofiltration tanks were 114 L high density polyethylene (HDPE) cone bottom tanks measuring 69 cm deep to the cone and 97 cm deep overall and a 45 cm diameter with a 45° conical bottom. The 760 L deep water hydroponic units consisted of a metal constructed frame, measuring 1.2 m wide, 2.4 m long, and 0.3 m deep, that was insulated with TekFoil (TEK Supply, Dyersville, IA, USA), a 3.8-cm-thick polystyrene insulation covered reflective bubble wrap, lined with a 12 mm rubber liner. The pumps used were 2082 L·h
−1 ActiveAqua Pumps (Grand Prairie, TX, USA) operated without pre-filters. Water was pumped through ValuTek, black braded utility hose that was 2.5 cm in diameter into the UV sterilizers. The UV sterilizers were TMC Vecton brand (Grants Pass, OR, USA) with a 15 W light (luminous flux of 900 lm/432.6 W∙s∙m
−2) output and rated for a 20.8 L∙min
−1 flow rate. This was recommended by the manufacturer based on flow rate, turnover, and size of the water system. Our flow rate of 20.8 L∙min
−1 fell under the 33 L·min
−1 maximum recommended for the Vecton 15 W with a turnover that was within 1.5 times per hour.
The UV system was located after the hydroponic unit so that UV would act on water after sufficient nutrients were taken up by the plants, thus reducing particles in the water. The addition of a filter prior to the UV system may be recommended if dirt or large particles are within the water. We found that the turbidity of the water was between 1 and 2.5 NTUs, which is clearer than water that passes through a 50 micron filter (typically 20 NTUs; data not presented). Based on these data, we did not utilize a filter prior to the UV treatment. Water flow rate into the fish tank was adjusted with a PVC ball valve. Directional water inflow into the fish tank was created using a 50 cm section of a 2.5-cm-diameter PVC pipe that was capped on the end. The water flowed out of 15, 6.4-mm-diameter holes drilled along a single plane to create a counter clockwise flow. A dual standpipe was created with 81-cm-tall section of 3.8-cm-diameter PVC pipe as a stand pipe and an 84-cm-tall external standpipe with holes cut in the bottom of it surrounding the standpipe. Two 15 cm air stones provided aeration and gas exchange in the fish culture tank. The water flowed by gravity into the mechanical filter screen, which consisted of 80% cover shade cloth that is 4 layers thick, then through an additional solids filter pad.
The biofilter was located directly below the mechanical filter screens and was filled with bio-balls, bio-barrels, and blocks of filter pad to provide an adequate surface area to harbor nitrogen-processing bacteria. The water depth in the biofilter was 51 cm, and constructed in the same manner as the fish tank. Two air stones were located in the biofilter tank to provide mixing and aeration. The water then flowed by gravity to the far end of the deep water hydroponic unit through a 3.8-cm-diameter PVC pipe with a tee at the end to then be exposed to the plants. Four air stones were located in each hydroponic unit. The water slowly flowed back to the opposite end of the hydroponic unit into the pump, which then completed the circuit. We performed a dye test before the study began to ensure uniform water circulation in the system. To establish the biological filtration system, four bio-barrels were added to each of the six replicated systems from a pre-established system to enhance their biological filtration performance. After a period of 4 weeks, water chemistry testing indicated that nitrifying bacteria populations had been established in each system and it was safe to add the fish.
2.2. Fish and Experimental Design
Juvenile barramundi (Lates calcarifer) were obtained from a local aquaculture nursery (Blairsburg, IA, USA). Upon arrival, the fish were acclimated to laboratory conditions for 18 days prior to the first sampling date and were fed with a Ziegler brand Finfish G 42-16 (Gardners, PA, USA) floating diet with a 2.5 mm diameter containing 42% proteins and 16% lipids. The experiment was conducted during the winter, from November 2014 to January 2015. At the beginning of the experiment, 10 fish with an average weight of 120–165 g were stocked in each of the six fish culture tanks. Each experimental treatment (UV treatment and control) was replicated three times with three independent units per treatment. The fish were fed twice daily at 8:00 and 18:00 h over the 118-day experiment. The daily feeding rate was about 3% of the total body weight or until the fish showed signs of satiation. Excess feed was removed. A daily record was kept of the feed offered. A 16 h photoperiod was maintained throughout the experiment by using the 400 W, high pressure sodium lamps from 06:00 to 22:00 h throughout the experiment.
Water temperature, dissolved oxygen, and pH were monitored daily using an HQ0d water quality probe (HACH, Ames, IA, USA). Water chemistry parameters were measured either once (alkalinity, hardness, carbon dioxide, chloride, iron) or twice (ammonia, nitrite, nitrate) weekly. The recommended levels were as follows: pH 6.5–7, dissolved oxygen above 10 mg∙L−1, ammonia below 1.0 mg∙L−1, nitrite below 1.0 mg∙L−1, chloride below 500 mg∙L−1, carbon dioxide below 5 mg∙L−1, water hardness between 100 and 300 mg∙L−1, and alkalinity between 40 and 300 mg∙L−1. If the levels fell outside of these recommendations, then a mitigation step was followed according to the parameter in question.
2.3. Crops and Experimental Design
Pelleted seeds of sweet basil (
Ocimum basilicum ‘Italian Large Leaf’) and bibb lettuce (
Lactuca sativa ‘Rex’) were obtained from Johnny’s Selected Seeds (Winslow, ME, USA). For each species, a single pelleted seed was placed in a 3.8 cm × 3.8 cm rockwool starter plug (Grodan A-OK; Farmtek, Dyersville, IA, USA) in numbers sufficient to supply the floating rafts (8 rafts per system) on a weekly basis for the duration of the study. Seedlings were irrigated daily with tap water supplemented with water-soluble fertilizer under the greenhouse conditions previously described. The 8 floating rafts were 60 cm × 60 cm × 3.8 cm and had either 9 (4 rafts) or 16 (4 rafts) holes on 20 or 15 cm spacings for lettuce or basil, respectively. Seedlings were transplanted 14 days after sowing into their appropriate rafts and inserted into the system at the distal end of the influent water from the biological filter (
Figure 1). Each week, a new cohort of plants was germinated, and the next set of seedlings was transplanted into the system. The older plants were moved one space closer to the influent end of the floating raft hydroponic unit. Finally, after four weeks (28 days), the plants and roots were harvested from the system. This weekly cycle continued for the duration of this 118-day study based on a normal growth cycle for the barramundi fish.
2.4. Microbiological Analysis
Two heads of lettuce, or two bunches of basil, and 1 L of water was collected randomly from each of the six systems per sampling period (Days 0, 28, 42, 54, 63, 76, 88, 102, and 188). For lettuce, a random sample of 10 g was taken and added to 90 mL of 1% peptone (HiMedia, Mumbai, India) into a sterile stomacher bag. For basil, a random sample of 5 g was taken and added to 45 mL of 1% peptone and added to a sterile stomacher bag. For water, a random 10 mL sub sample was added to 90 mL of 1% peptone and added to a sterile stomacher bag. For the fish samples, swabs (Biomerieux, Marcy-l’Etoile, France) were taken on both sides of the body surface including gills and alimentary canals using a 10 × 5 cm2 sterile template and added to 10 mL of a 1% peptone test tube. Individual samples were homogenized either in a stomacher or vortex and enumerated using coliform/E. coli Petrifilm™ (3M, St. Paul, MN, USA). Duplicate samples were used. Coliform and E. coli levels were enumerated using 3M Petrifilm E. coli/Coliform Count Plate™ (3M Microbiology Products, Minneapolis, MN, USA), following label directions (detection limit of <10 CFU·g−1 or <1 CFU·mL−1 or <0.1 CFU·cm−2). Plates were incubated at 35 °C and observed for changes at 24 and 48 h. Interpretation of the Petrifilm followed E. coli/Coliform Petrifilm label directions and AOAC Official Method 991.14. Blue to red-blue colonies associated with gas were counted as E. coli coliform colonies. Red colonies associated with gas were counted as coliform colonies. Further analysis was conducted on the samples for the presence of E. coli O157:H7 and Salmonella spp. using ELISA (color change assay) system (3M™ Tecra, St. Paul, MN, USA) and 0157 latex agglutination for confirmation (Oxoid/Remel, Hants, UK), as per manufacturer’s instructions. Samples were processed through a series of enrichment and selection methods prior to the ELISA (detection limit: 1–5 cells/25 g of sample) test to reduce the presence of false positive samples. Twenty-five grams of lettuce and basil samples and 25 mL of water and fish swab samples were added to 225 mL of EC Broth (3M™ Tecra, Minneapolis, MN, USA) with a 5% novobiocin supplement (MP, Salon, OH, USA) and incubated at 42 ± 1 °C for 15–24 h. This enrichment was used for ELISA analysis (E. coli 0157 detection). Same quantities of samples were incubated in 225 mL of Universal Pre-Enrichment Broth (DIFCO, Sparks, MD, USA) at 36 °C for 24 h. Following incubation, 0.5 mL of sample was transferred into 10 mL of TT broth (Hajna) broth (DIFCO, Sparks, MD, USA) and 0.1 mL into 10 mL RV broth (DIFCO, Detroit, MI, USA) and incubated at 36 ± 0.5 °C for 22–24 h. Following incubation, 1 mL of each were transferred to 10 mL of M Broth (HiMedia, Mumbai, India) and incubated at 36 ± 0.5 °C for 22–24 h. This enrichment was used for ELISA analysis (Salmonella detection).
These rapid detection kits are approved by the U.S. Food and Drug Administration (FDA) for use on food samples. Aerobic plate counts were obtained in duplicate for each of the six systems, at suitable dilutions of BPW enrichment, incubated at 36 °C for 48 h, using media made from Total Plate Count Agar (HiMedia, Mumbai, India).
2.5. Statistical Analysis
This study was conducted between November 2014 and February 2015 and experiments were conducted in triplicate (3 UV and 3 No-UV (control)). Statistical analyses were performed using SAS 9.3 (SAS Institute, Inc., Cary, NC, USA). Microbial counts were obtained for basil, lettuce, and water samples on Days 0, 28, 42, 54, 63, 76, 88, 102, and 118 in duplicate for each of the six UV/control systems, and data were analyzed using the least square means method. Direct swabs of fish (5 different fish from each unit) were taken on Days 0 and 118 in duplicate for microbial studies. The effects of the day and treatment were studied for aerobic plate counts and coliform counts. Combinatorial effects of the day and treatment were also studied. All statistical analyses were conducted at a 95% level of confidence (p < 0.05).
3. Results
Water quality parameters. The water quality parameters were recorded throughout the experiment and were as follows (means ± SD): temperature: 23.2 ± 5.2 °C; dissolved oxygen: 8.1 ± 1.0 mg∙L−1; pH: 7.7 ± 1.0; ammonia: 0.5 ± 0.2 mg∙L−1; nitrite: 0.33 ± 0.33 mg∙L−1; chloride: 250 ± 100 mg∙L−1; carbon dioxide: 0.25 ± 0.2 mg∙L−1; water hardness: 200 ± 100 mg∙L−1; alkalinity: 104 ± 4 mg∙L−1.
Pathogenic microbial status of the basil, lettuce, and water. There were no detectable levels of E. coli coliforms, E. coli O157:H7, or Salmonella spp. found in any of the lettuce, basil, or water samples over the 118-day study period.
Aerobic plate counts of the basil, lettuce, and water. Table 1 displays the aerobic plate counts in the basil, lettuce, and water samples over the 118-day study. There is a general trend of increasing aerobic plate counts (1 to 3 log
10 CFU·mL
−1) from Day 0 to Day 63 and a decrease in aerobic plate counts (1 to 3 log
10 CFU·mL
−1) from Day 63 to Day 118 of the trial for the basil, lettuce, and water samples. There were no environmental changes between Day 0 and Day 63 samples, as determined by water temperatures and chemistry (ammonia, nitrite, nitrate, alkalinity, pH, or dissolved oxygen levels, data not shown); therefore, these differences can be attributed to normal environmental flora variations.
There was no significant difference between the UV and No-UV units for aerobic counts with the basil and water samples throughout the study (
p > 0.05). There was a significant difference in the aerobic plate count in lettuce samples between the UV and No-UV treatments during the 118-day study (
p < 0.05;
Table 1). Specifically, UV treatment had a significantly higher aerobic count (0.24 log
10 CFU·g
−1) for Day 63 than No-UV treatment. When the control treatment systems were evaluated alone, Day 63 showed a significantly higher in aerobic count (0.65–3.30 log
10 CFU·g
−1) than other days (0, 28, 42, 54, 76, 88, 102, or 118), and Day 76 had a significantly higher aerobic count (1.74–2.65 log
10 CFU·g
−1 than Days 42 and 118. When the UV treatment systems were evaluated alone, Day 63 had a significantly higher aerobic count (1.09–2.83 log
10 CFU·g
−1) than other days (0, 28, 42, 54, 76, 88, 102, or 118).
When the UV and No-UV treatments were combined (
Table 2), the lettuce samples had a significant increase in aerobic plate counts (0.55–3.01 log
10 CFU·g
−1 and 1.25–2.05 log
10 CFU·g
−1, respectively) between Days 54 and 76. There were no significant changes in the water quality for the basil or water samples when the UV and No-UV treatments were combined throughout the 118 days (data not shown).
Coliform counts of the basil, lettuce, and water. There was no significant difference between the UV and No-UV units in general for coliform counts in general (lettuce, basil, and water samples) (
p > 0.05).
Table 3 displays the coliform counts for the basil, lettuce, and water samples over the 118-day study. There was a significant increase in coliform counts (0.61–2.12 log
10 CFU·g
−1) observed in all the samples (basil, lettuce, and water) on Day 28 of the trial when compared to all the other days. There was a significant decrease (0.24–1.87 log
10 CFU·g
−1) in the coliform counts in all samples on Day 76 when compared with Days 28, 42, and 54 (
p < 0.05), which had a significant increase in coliform counts (0.50–1.78 log
10 CFU·g
−1) on Day 88 for all the samples. With the water sample, there was a significant decrease in coliform counts (1.13–1.67 log
10 CFU·g
−1) between Days 88 and 118 of the trial in the presence and absence of UV treatment. It must be noted that there were no significant temperature or environmental changes on Day 76 during the study; therefore, these differences can be attributed to normal environmental flora variations.
Microbial status of fish. There were no
E. coli coliforms,
E. coli O157:H7, or
Salmonella spp. found in any of fish samples over the 118-day study period.
Table 1 and
Table 3 display the aerobic plate counts and coliform counts for the barramundi fish on Days 0 and 118 of the trial. There was a significant increase of aerobic counts (0.65 log
10 CFU·g
−1) in the fish sample with the presence and absence of UV on Days 0 and 118 (
p > 0.05). There was no significant increase or decrease in the coliform counts on Days 0 and 118 in the presence or absence of UV treatments. Aerobic plate counts above 10
7 CFU·g
−1 are seen as unacceptable for fish and produce [
16]. Fecal coliforms (
E. coli) above 500 CFU·g
−1 in fish and produce are also seen as unacceptable [
16]. Fecal coliforms are an indicator of poor water supply and poor sanitation practices [
17]. Within this study, our counts remained below the APC, coliform, and fecal coliform limit, indicating our system had good sanitation conditions and the food is safe for consumption, but the high variability in the microbial counts requires additional research to solidify the theory of normalization in the system.
4. Discussion
If zoonotic pathogens were introduced into the system, the risk for foodborne illness from the fish and/or food crop would be higher [
18]. There have been multiple foodborne outbreaks with
E. coli and
Salmonella associated with fruits and vegetables that have been attributed to water sources [
19]. Absences of these pathogens within this study indicate that they were not externally introduced into the system, highlighting good hygiene and sanitation practices throughout the study. Effective usage of UV treatment has been suggested to reduce the abundance of many bacterial pathogens suspended in water in aquaponic operations, and thus reduce the probability of cross contamination between water and plant tissue [
13,
20,
21,
22]. Gonazalez-Alanis (2011) found that use of UV within the aquaponics system with lettuce, spinach, and tilapia was able to reduce fecal and total coliforms significantly (UV levels was not provided) [
23]. Our results show high variation in the aerobic plate counts and coliform counts and that UV was not effective at reducing both aerobic and coliform counts on the lettuce, basil, water, and fish samples when compared to the control system (
Table 1,
Table 2 and
Table 3). So why was our treatment not effective in our system? Potential answers include the addition of filtration/screening, the reduction in microbial community within the system, and the use of higher intensity UV units.
Timmons and Ebeling (2007) suggest that the water should be filtered through a 50 μm screen prior to exposure to UV irradiation to improve UV efficacy in a recirculating aquaculture system [
4]. Within this model system, there was no filtration system at 50 μm because our preliminary data showed that our flow rate and water utilization provided clearer (turbidity) water (1–2.5 NTUs) than the use of a 50 μm screen (typically 20 NTUs). Even with our low turbidity levels in the water entering the UV unit, the use of filtration may help with the effectiveness of the UV technology. Pantanella (2012) found that the use of two commercial 25 W lamps of ultraviolet light (UV) sterilizers with a 100 L clarifier and 25 L filtering tank within an aquaponics system with lettuce and tilapia was effective in reducing coliform by 3 logs; however, depending on the water quality, different UV intensities are needed [
24]. UV systems with a light output as high as 36 W have been used in recirculating aquaculture systems [
25]. Our unit was only at a 15 W light output based on the manufacturer’s recommendation for a flow rate of 20.8 L·min
−1 and the stability of nutrients in the system. Flocculation and chemical precipitation using lime, alum, or ferric chloride, the method most commonly used by municipalities can be extended to aquaponics if modified for living systems [
26]. This method could clarify the circulating water allowing for deeper penetration of UV rays, but these substances would need to be monitored to ensure that the change in pH would not affect the plants or fish units through additional research. The last potential answer is in regard to microbial community within the aquaponics units. Our system had a general trend of microbial increase within the study period followed by a decrease after 76 days (
Table 2 and
Table 3). We attribute the fluctuation pattern within both the hydroponic and aquaponic units to normal microbial community changes. Schreier, Mirzoyan, and Saito (2010) explain that the biological filtration systems rely on the interaction between microbial communities, and their environment, as a consequence of nutrient input (fish waste output) and, as such, are not easily controlled [
27]. The inconsistent patterns and variability between and amongst treatments observed in the microbial counts in our study is likely due to these dynamic ecosystem interactions that occur in a living system like aquaponics. The biosolids and rich microbial community within aquaponic units was critical to producing the ideal growing conditions for both crops and fish. If these biosolids and microbial communities are disrupted, poor growth rates and a lack of nutrients for crops and fish may result [
28]. Additionally, a recirculating aquaculture system’s water management is critical to ensure the health of fish and/or continuous crop production [
28]. To maintain homogeneity, a greater understanding of the life support processes that make up the biological filtration systems is required. High microbial populations within the water may be interfering with the effectiveness of the UV technology.
The original aquaponic model was based on a “balanced” or “coupled” style aquaponic system. This model uses a single direction of water flow from the fish, through the filters, through the plants, and back to the fish. This model necessitates a balance of nutrients and the elimination of pesticides and therapeutants in order to promote the fish, plants, and beneficial bacteria that are critical to system functionality. Thus, it was prudent in the design of these systems to install some relatively innocuous, yet proven effective, form of water sterilization. Because there had been no replicated research on small-scale aquaponic systems available in the literature prior to this project’s inception, design constraints were derived from the closest known field of research—aquaculture. In recirculating aquaculture system design, it is common to place the UV sterilizer into the system after the mechanical and biological filters, the sump, and the water pump, and immediately before the water enters the fish culture tank. That is the design principle that was used in the creation of these systems. The UV sterilizer was operated as close to the manufacturer’s specifications as possible given the nuances of the prototype systems that were designed specifically for this study.
Research conducted in parallel to the timeline of this experiment has given insight to the proper design of an aquaponics system. Personal communications with Sarah Taber (Aquaponics Association, 30 November 2016) revealed that much of the food safety risk for humans is located in the hydroponic component of the system. Much of the bacterial growth in a deep water culture unit is located on the plant roots that are suspended in the water, according to Taber (personal communication). Improved filtration of the water for greater water clarity as well as more powerful UV sterilizers could be employed.
The delicate nature of a balanced system creates challenges for aquaponic producers; therefore, other methods of aquaponic operation have been created. The more robust “decoupled” aquaponic design segregated fish and plant production systems (aquaculture and hydroponics, respectively) and allowed more flexibility for the producer to treat the fish and plants separately without causing harm to other components of the system. Since the time of this research, the systems have been adapted to improve solid settling by installing a radial flow settling chamber. The systems have been successfully used to grow plants hydroponically, but have not yet contained fish. Fine-tuning water flow rates and flow dynamics of the system is a priority for avoiding potential water clarity issues. Potential system designs that could be used in future iterations include a decoupled concept, in which the water discharged from the recirculating aquaculture system during routine filter cleaning could flow one direction into a sump that would be pumped to the hydroponic unit where it is fully utilized by the plants and never returned to the aquaculture unit. This practice would allow the installation of a more powerful sterilization method (e.g., ozone, hydrogen peroxide, peracetic acid, and sodium hypochlorite) to completely kill all life before the water reaches the plants, thus improving food safety. Another option could be to install the UV sterilizer between the biological filter and the hydroponic unit, or have multiple UV units at different points in the system.
This study found that the UV treatment used in our model aquaponic unit was not effective in reducing coliform and aerobic plate counts. Clarification of the water or reducing the flow rate might improve the penetration of UV or increasing the intensity of the radiation may control microbial populations to a greater extent. Future studies can be conducted to determine the relationship between turbidity and smaller filters, microbial density, and the intensity of the UV to improve the ability of this technology to be used as a food safety intervention.


 and
and 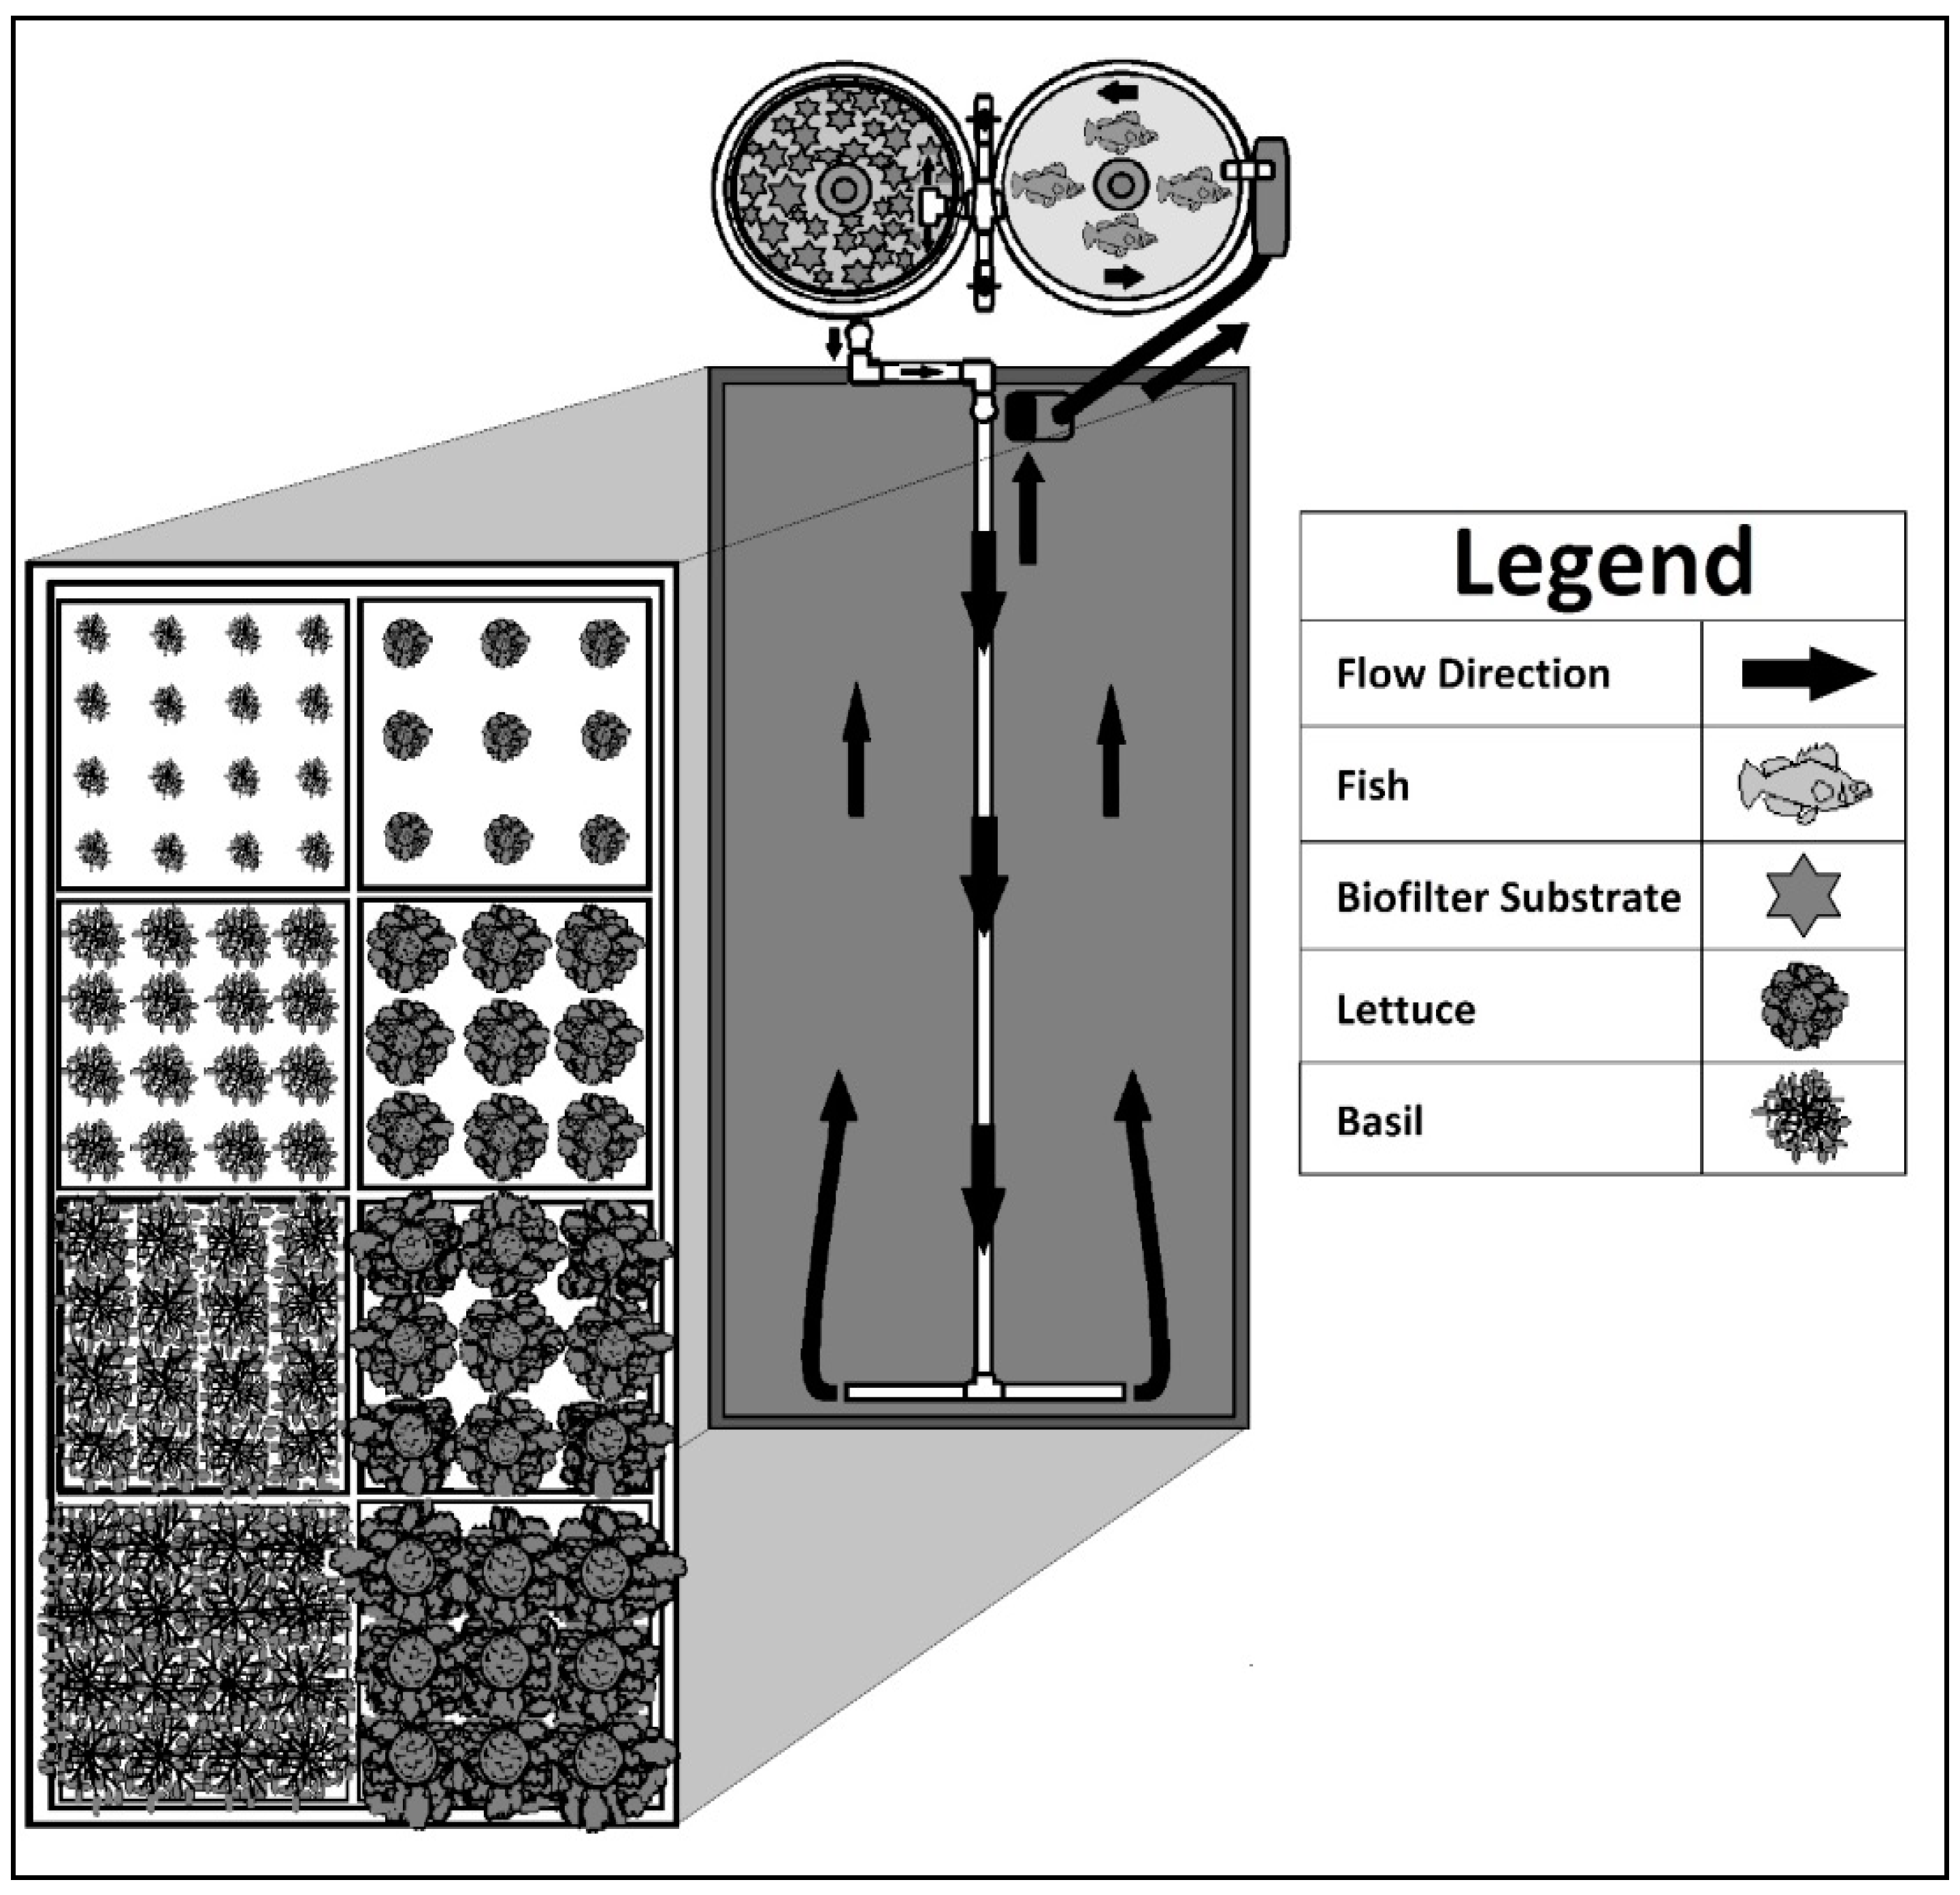
