1. Introduction
Artificial recharge is a common tool to increase the total available water in a study area. The use of recharge wells in MAR (Managed Aquifer Recharge) as a tool of IWRM (Integrated Water Resources Management) is widely known. The increasing demand for water in many regions around the world has led to the implementation of artificial recharge tools as part of the IWRM concept.
There are many reasons to carry out artificial recharge methods [
1,
2] as listed below:
to increase the water budget of the aquifer
to improve the water quality in the aquifer
to use the aquifer for seasonal storage
to prevent seawater intrusion by creating freshwater barriers
to inject surplus water during periods of low demand
There are two main techniques of injecting water underground. One technique is to spill water onto the surface through infiltration ponds, trenches, and similar methods. The second technique is to inject water through a single injection well or through a dual-purpose well. This article will deal with the well technique only and will focus on the new artificial recharge concept that is now being implemented in Israel.
During the period between 1960 and 1980, dozens of wells were drilled in Israel for the injection of surplus water from the Sea of Galilee [
3]. Some wells were designed as dual-purpose wells, enabling the recharge of surplus water during the winter and pumping during periods of high demand [
4].
There were many obstacles in the recharging process, and after a few years of operation most of the recharge wells were abandoned.
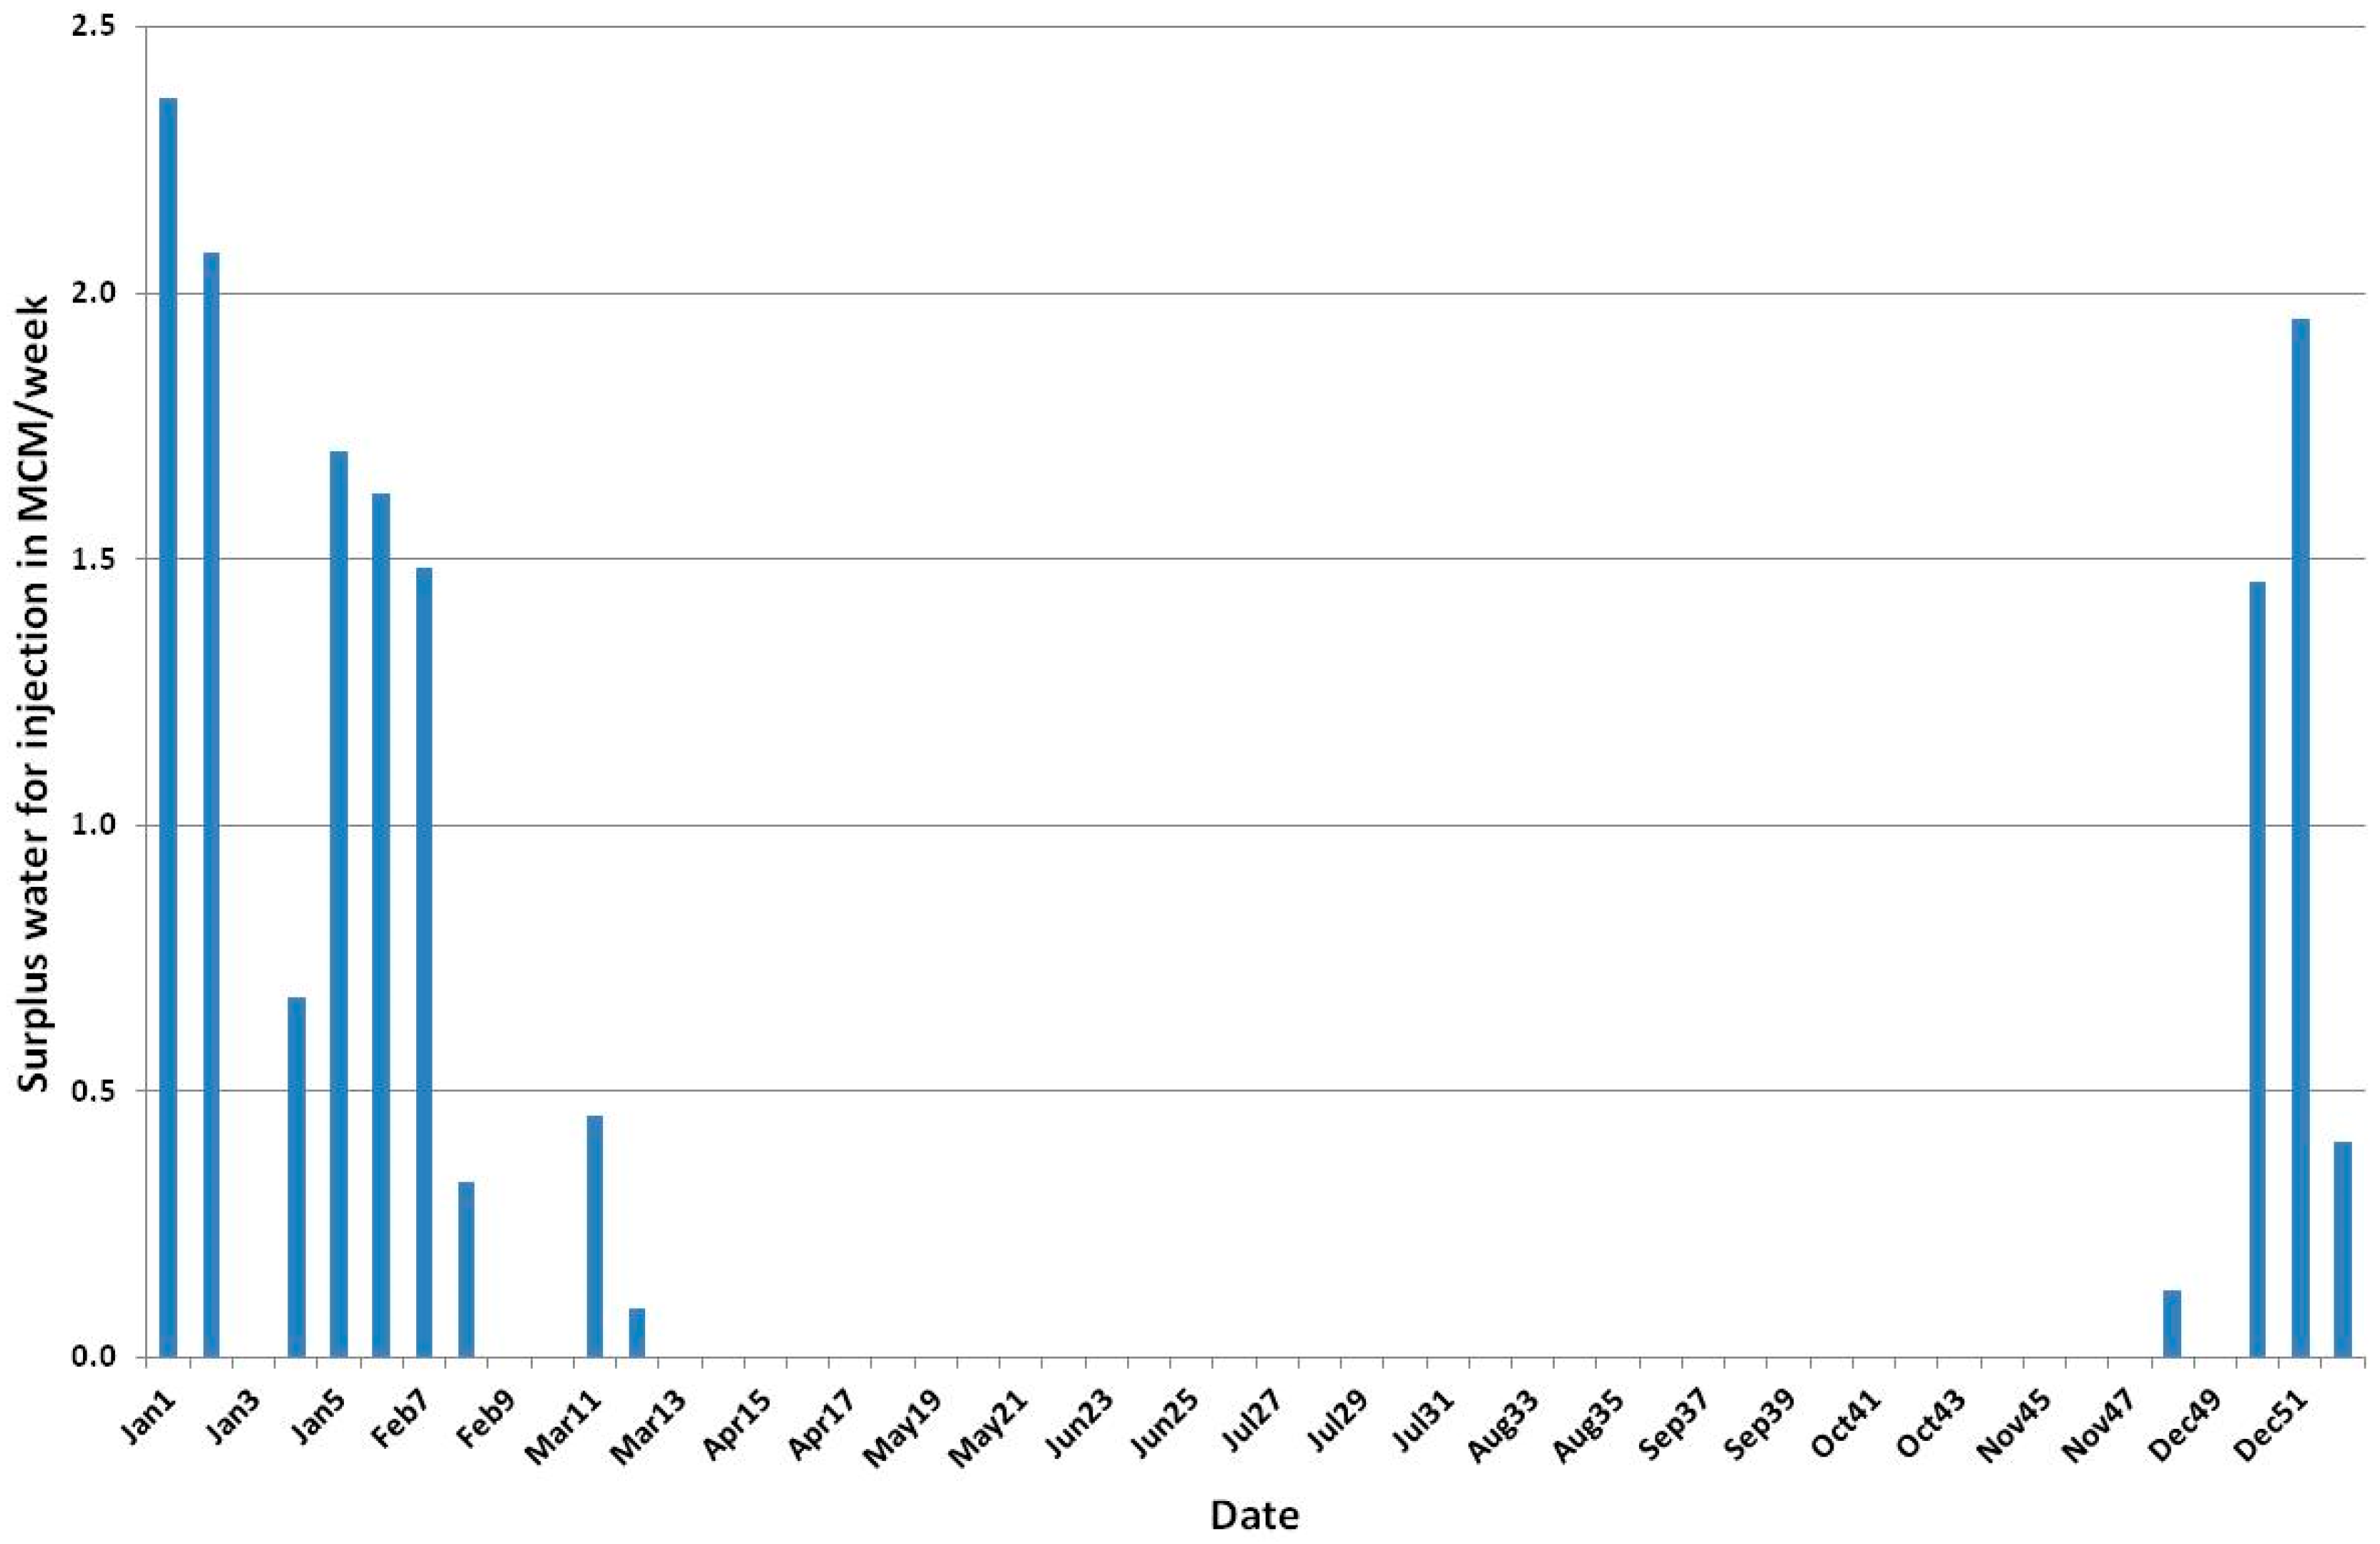
Since 2005, the water sector in Israel has changed dramatically. The incorporation of several sea water desalination plants along the Mediterranean coast currently produce about 600 Million Cubic Meters/year (MCM/year) of desalinated water (Israel Water Authority data) that is transferred to the Israel National Water Carrier (NWC) for drinking purposes. Today, desalinated water provides up to 50% of the annual drinking water supply. The additional water creates surplus conditions in the NWC during periods of low demand. Throughout these periods (mainly during the winter and weekends), there is a surplus of desalinated water for short periods of time (hours) that the system does not have the capability to store in open surface reservoirs. The surplus volume varies between a few hundred thousand cubic meters to several million cubic meters.
Figure 1 shows typical weekly water surplus in the NWC in an average year.
In Israel, the surplus water can be injected into a few existing infiltration ponds that were constructed specifically to inject run-off, in several abounded quarries that were adjusted to store and to infiltrate surplus water from the NWC, and through injection wells.
The major advantage in using recharge wells is the ability to locate them in places where the subsurface geology is not suitable for infiltration ponds (for example, the existence of clay layers close to ground surface), in small and dense areas, in confined aquifers, and in areas close to the water supply networks. Yet, the main disadvantage is the low injection rate per well and the need for many recharge wells in the event the total injection amount is high (hundred thousand cubic meters per well).
2. Artificial Recharge in Israel
Previously, surplus water was injected into the sandstone layers of the coastal aquifer and into the limestone and dolomite layers of the Western Mountain aquifer (Yarkon-Taninim Basin). Today, the injection target is the coastal aquifer only.
Between the 1960s and the 1980s the percussion method was the main drilling technique for recharge wells in the coastal aquifer. Only a few were drilled using the reverse circulation method. Currently the drilling method of injection and production wells in the coastal aquifer uses the reverse circulation method only.
The production sections of the dual-purpose wells and of the recharge wells that were drilled in the past showed a variety of differences in their technical profiles. There were differences in screen type and screen diameter: some were made from galvanized steel and others from stainless steel. The diameter of the screen pipe varied between 8″ and 12¼″ with differences in the slot width. There were also differences in the type and size of the gravel pack. Some wells had only gravel pack outside their screen section and others contained a basket filled with gravel together with common gravel pack. In addition, the length of the open section was different. In some wells the open section was in the lower part of the well and in others the open section extended from the static water level down to the bottom of the well.
There was no documentation that explains the considerations (geological, hydrological, technical) that were behind the decisions in the design and construction of each injection well.
The water for injection through wells at that period came from two sources:
Monitoring of the injection parameters show that the injection wells suffered from a decrease in their absorption rate (an expression that is equal to specific discharge in pumping wells) due to clogging on the screen slots [
4].
In wells that injected water into the coastal aquifer (sand and sandstone layers with some clay beds [
5]) the specific absorption capacity decreased up to one-third during the recharge season. In the limestone-dolomite aquifer the reduction in the specific absorption capacity was very small [
6,
7,
8].
The injection results showed that dual-purpose wells were more effective than single-purpose injection wells because in dual-purpose wells redevelopment and backwashing from the accumulated solid and organic contaminants were relatively easy since the pump already existed in the well.
Redevelopment of the recharge well at the end of the recharge season was the way to restore the specific discharge. However, on switching from recharge to pumping, the water pumped during the first few hours (in general 2–10 h) contained excessive bacteria growth from the screens. In some wells the amount of water that was pumped out during the redevelopment was greater than the amount that was injected into the wells.
As mentioned above, between the 1960s and 1980s, the source of injection water was from the Sea of Galilee (Lake Kinneret). At that time, the lake water contained high percentages of suspended organic material. Today, there is a large, modern filtration plant for the National Water Carrier that removes organic matter before the water is supplied to the customers. Therefore, we presume that clogging by organic material will not be a problem any time in the near future.
Throughout that period, the means to bypass reduction in the absorption rate in the injection wells in the Coastal aquifer was to use groundwater from the limestone dolomite aquifer as a source for the injection activities. This water was clean and without organic material. In order to keep the water balance in the limestone dolomite aquifer stable, water from the Sea of Galilee was injected into this aquifer. The changing of the injection water source enabled an increase in the absorption rate in the recharge wells at the Coastal aquifer.
Looking at that data retrospectively, our opinion is that poor water quality (the effect of high organic matter in the water) and inadequate technical structure of the injection wells was why many wells were declared abandoned and the injection into the sandstone aquifer failed after a few years of operation.
In order to re-evaluate the feasibility and profitability of recharge wells as part of a general MAR policy to handle excess water, “Mekorot; the Israel National Water Company Ltd. (Tel-Aviv, Israel)”, designed and built two full scale pilot sites. Each pilot contains production, recharge, and two observation wells in one yard. The recharge wells were designed specifically to enable high flow rates to maximize the volume that can be recharged during a relatively short period of time by a minimum number of wells.
Attention was also given to the design of the recharge equipment and to the necessity to prevent air bubbles from entering the aquifer together with the recharged water [
9,
10]. Pumping tests were conducted to evaluate the hydrological conditions of the aquifer, the effect of the technical design of the recharge wells, the recharge capacity and its changes with time, the effect of air bubbles on clogging, as well as the need for a back-flushing routine [
9,
10].
In parallel, we carried out an additional pilot in an open transparent pipe that focused on the relationship between flow rate, depth of injection point, and creation of air bubbles and their movement toward the screen (drainage point at the bottom of the transparent pipe).
3. Pilot Test Description
Recently in Israel, the water source for recharge has been surplus desalinated water. This water does not contain any organic matter, has very stable chemical composition, stable temperature, low turbidity, and low inorganic suspended solids. We assume that with this kind of water quality, we can ignore the appearance of chemical and biological clogging, and can focus on the mechanical processes such as clogging by air bubbles.
3.1. Air Bubble Pilot
A major form of mechanical clogging is air entrainment. The dissolved or suspended gas (air) has chemical and physical functions in the aquifer. The presence of small air bubbles inside the pores may cause blockage of the aquifer and reduce water percolation into the aquifer.
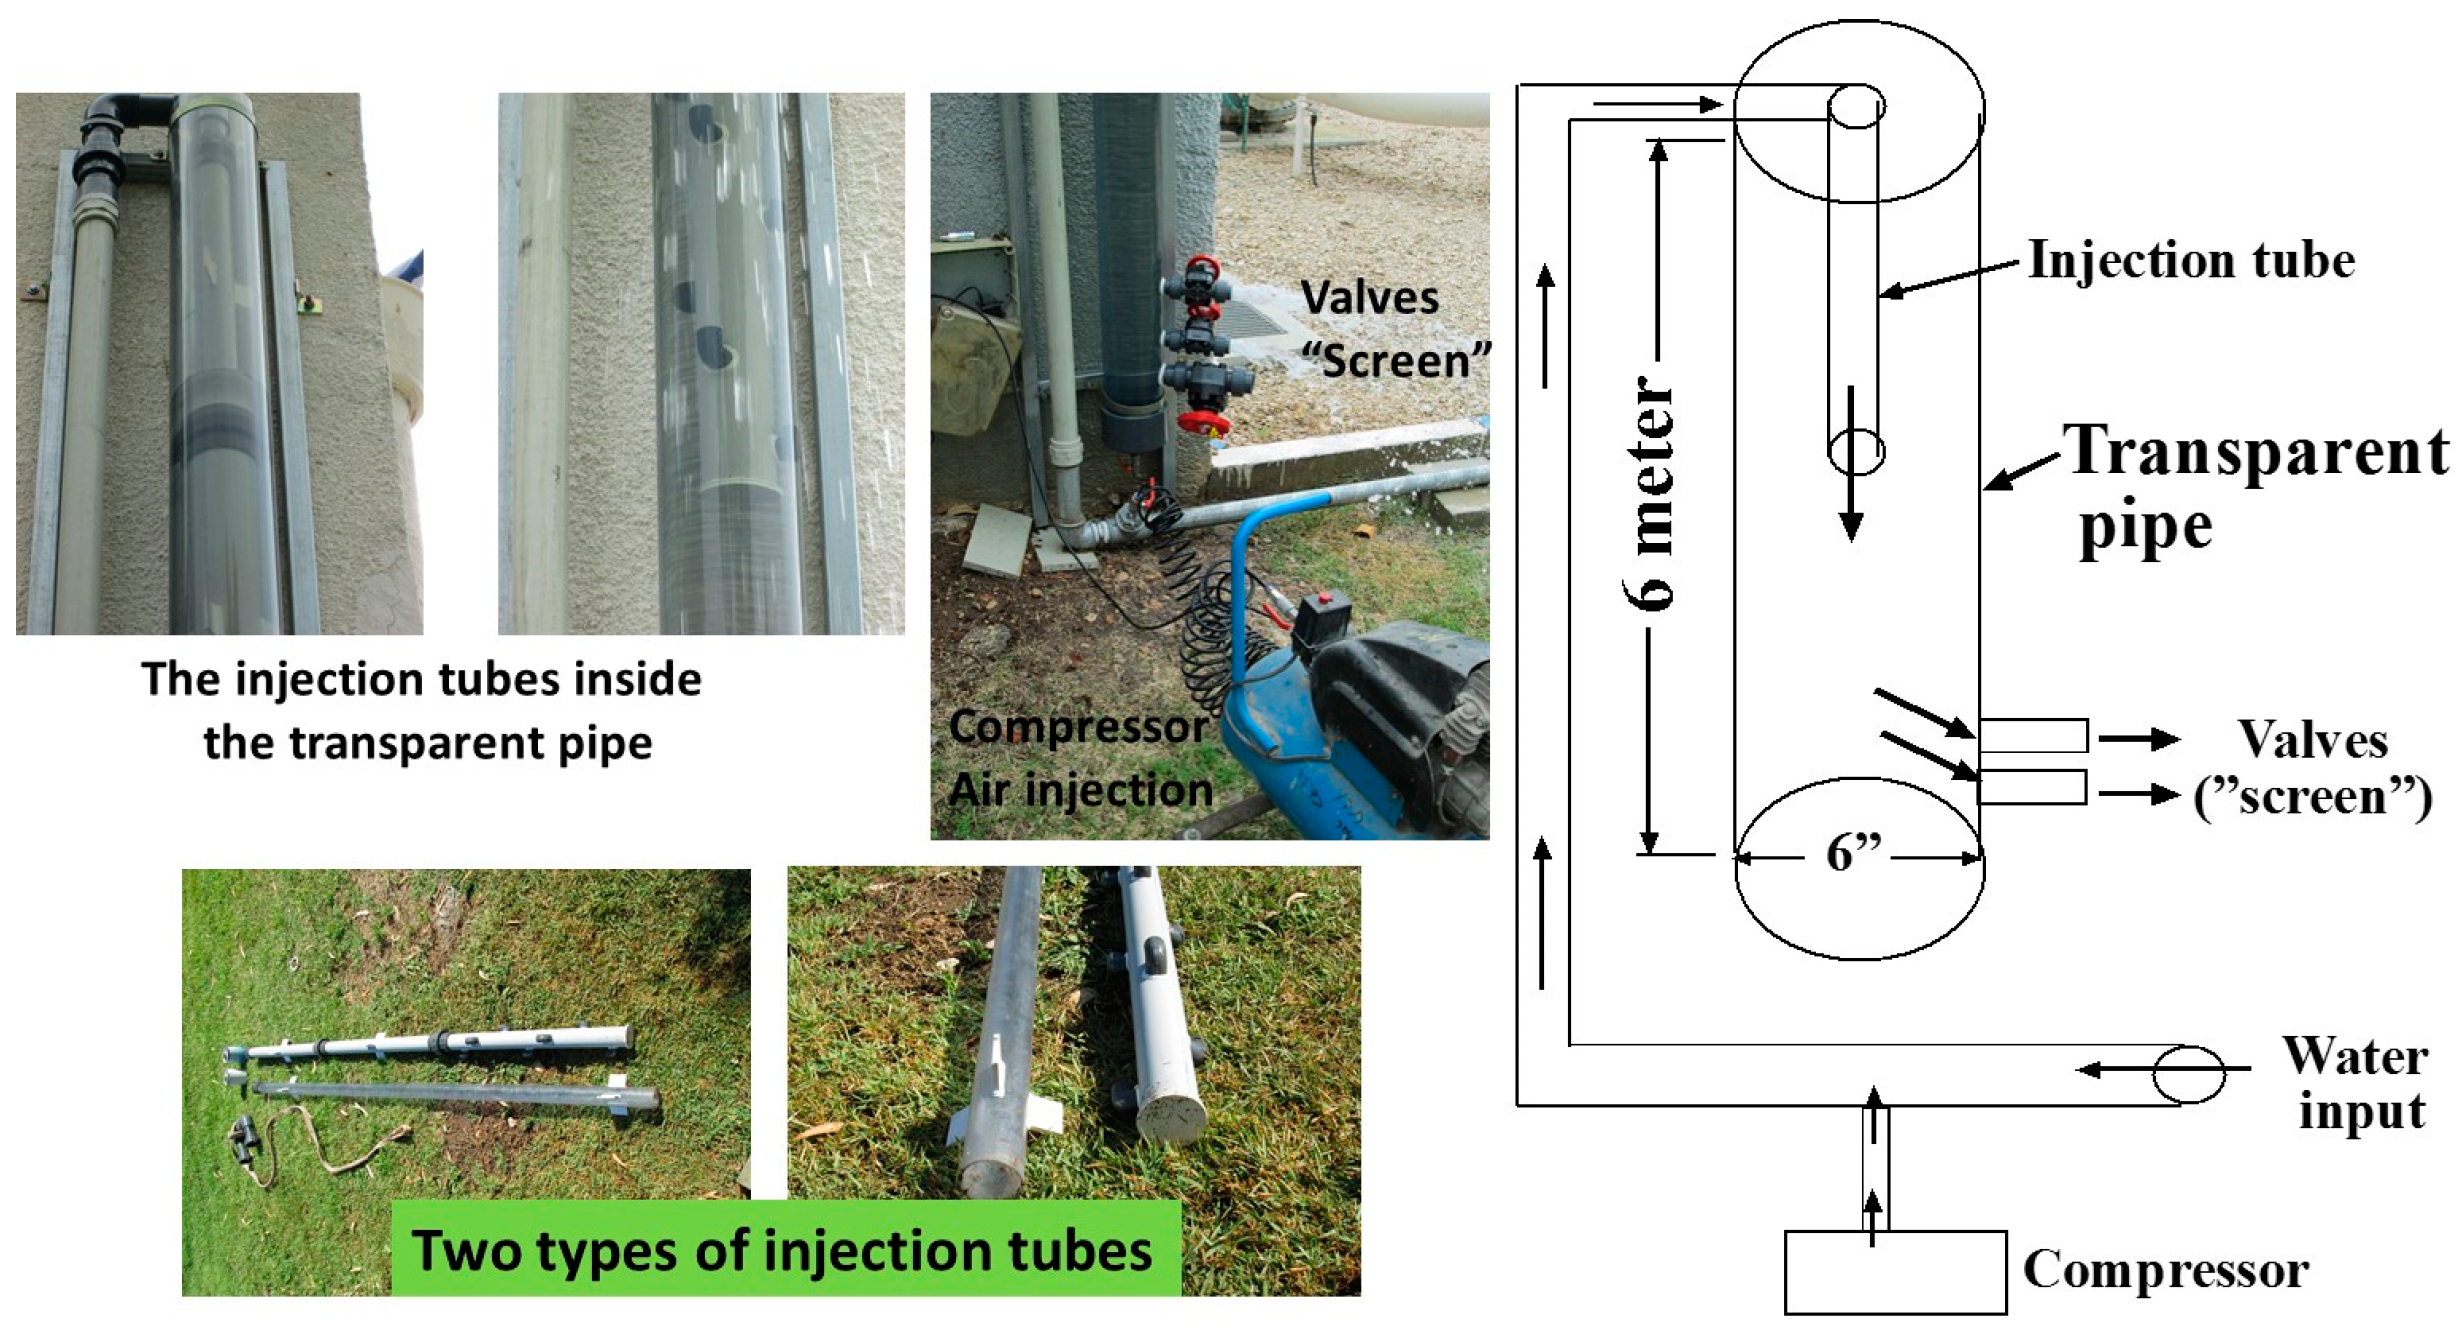
Therefore, we decided to build a pilot to simulate the movement of the air bubbles in a well. The pilot consists of a transparent pipe 6-m length and 6″ diameter (
Figure 2) and several valves at the bottom of the pipe. The valves represent the screen section and allow control of the flow discharge. Inside the 6″ transparent pipe, we inserted the injection pipe. We constructed two types of injection tubes: the first was a regular pipe where the exit of the water was located at the bottom of the tube (
Figure 2), and the second had the bottom closed so the water was forced to exit via a number of 1″ pipes with the openings facing upwards (
Figure 2). The idea in the second tube was to enable the air bubbles to move upward in the opposite direction to the water flow.
The injection discharge was 6–10 m
3/hour at a pressure of 4 atmospheres, which was the pressure in the regional water system. The temperature was constant. The air was injected artificially into the system by a compressor (
Figure 2).
3.2. Pumping and Recharge Wells Pilot
The objective was to construct a pilot on a larger scale that included production and recharge wells with some observation wells in between.
The first stage was to select the drilling technique, the screen diameter, length of the screen, and the monitoring system. Study of the failures of the “old” recharge wells in Israel and from other cases in the world [
9,
10] led to the decision to drill two separate wells (one for production and one for recharging). The separation between the pumping and injection wells allowed us to continue operating the pumping well in the event the injection well became clogged (see
Section 2).
Fundamentally, the drilling procedure of a recharge well is quite similar to that of a production well when both of them are drilled in the same formation. We would also expect that both wells would have similar hydrological characteristics. In practice, this is not the case. The effectiveness of a recharge well is often significantly lower than a production well. Recharge wells are more sensitive to clogging and a decrease in the absorption rate (an expression that is equal to a specific rate in pumping wells). For this reason, it is very important to design the drilling profile of the recharge wells carefully, and therefore we established a drilling guideline for a recharge well that includes several critical points:
Drilling technique: Reverse circulation and/or percussion method.
Drilling mud: In the aquifer section, to use water or biodegradable drilling fluids.
Diameter of pipes: Large diameter (14″) of the casing and the screen. Long screen section starting a few meters below the static water table.
Gravel pack: Well sorted, mainly quartz with very low content of carbonate fragments. Glass beads are highly recommended.
Observation point in the recharge well: Inserting a small diameter pipe between the outside casing and the inside casing for water level measurement during the recharge.
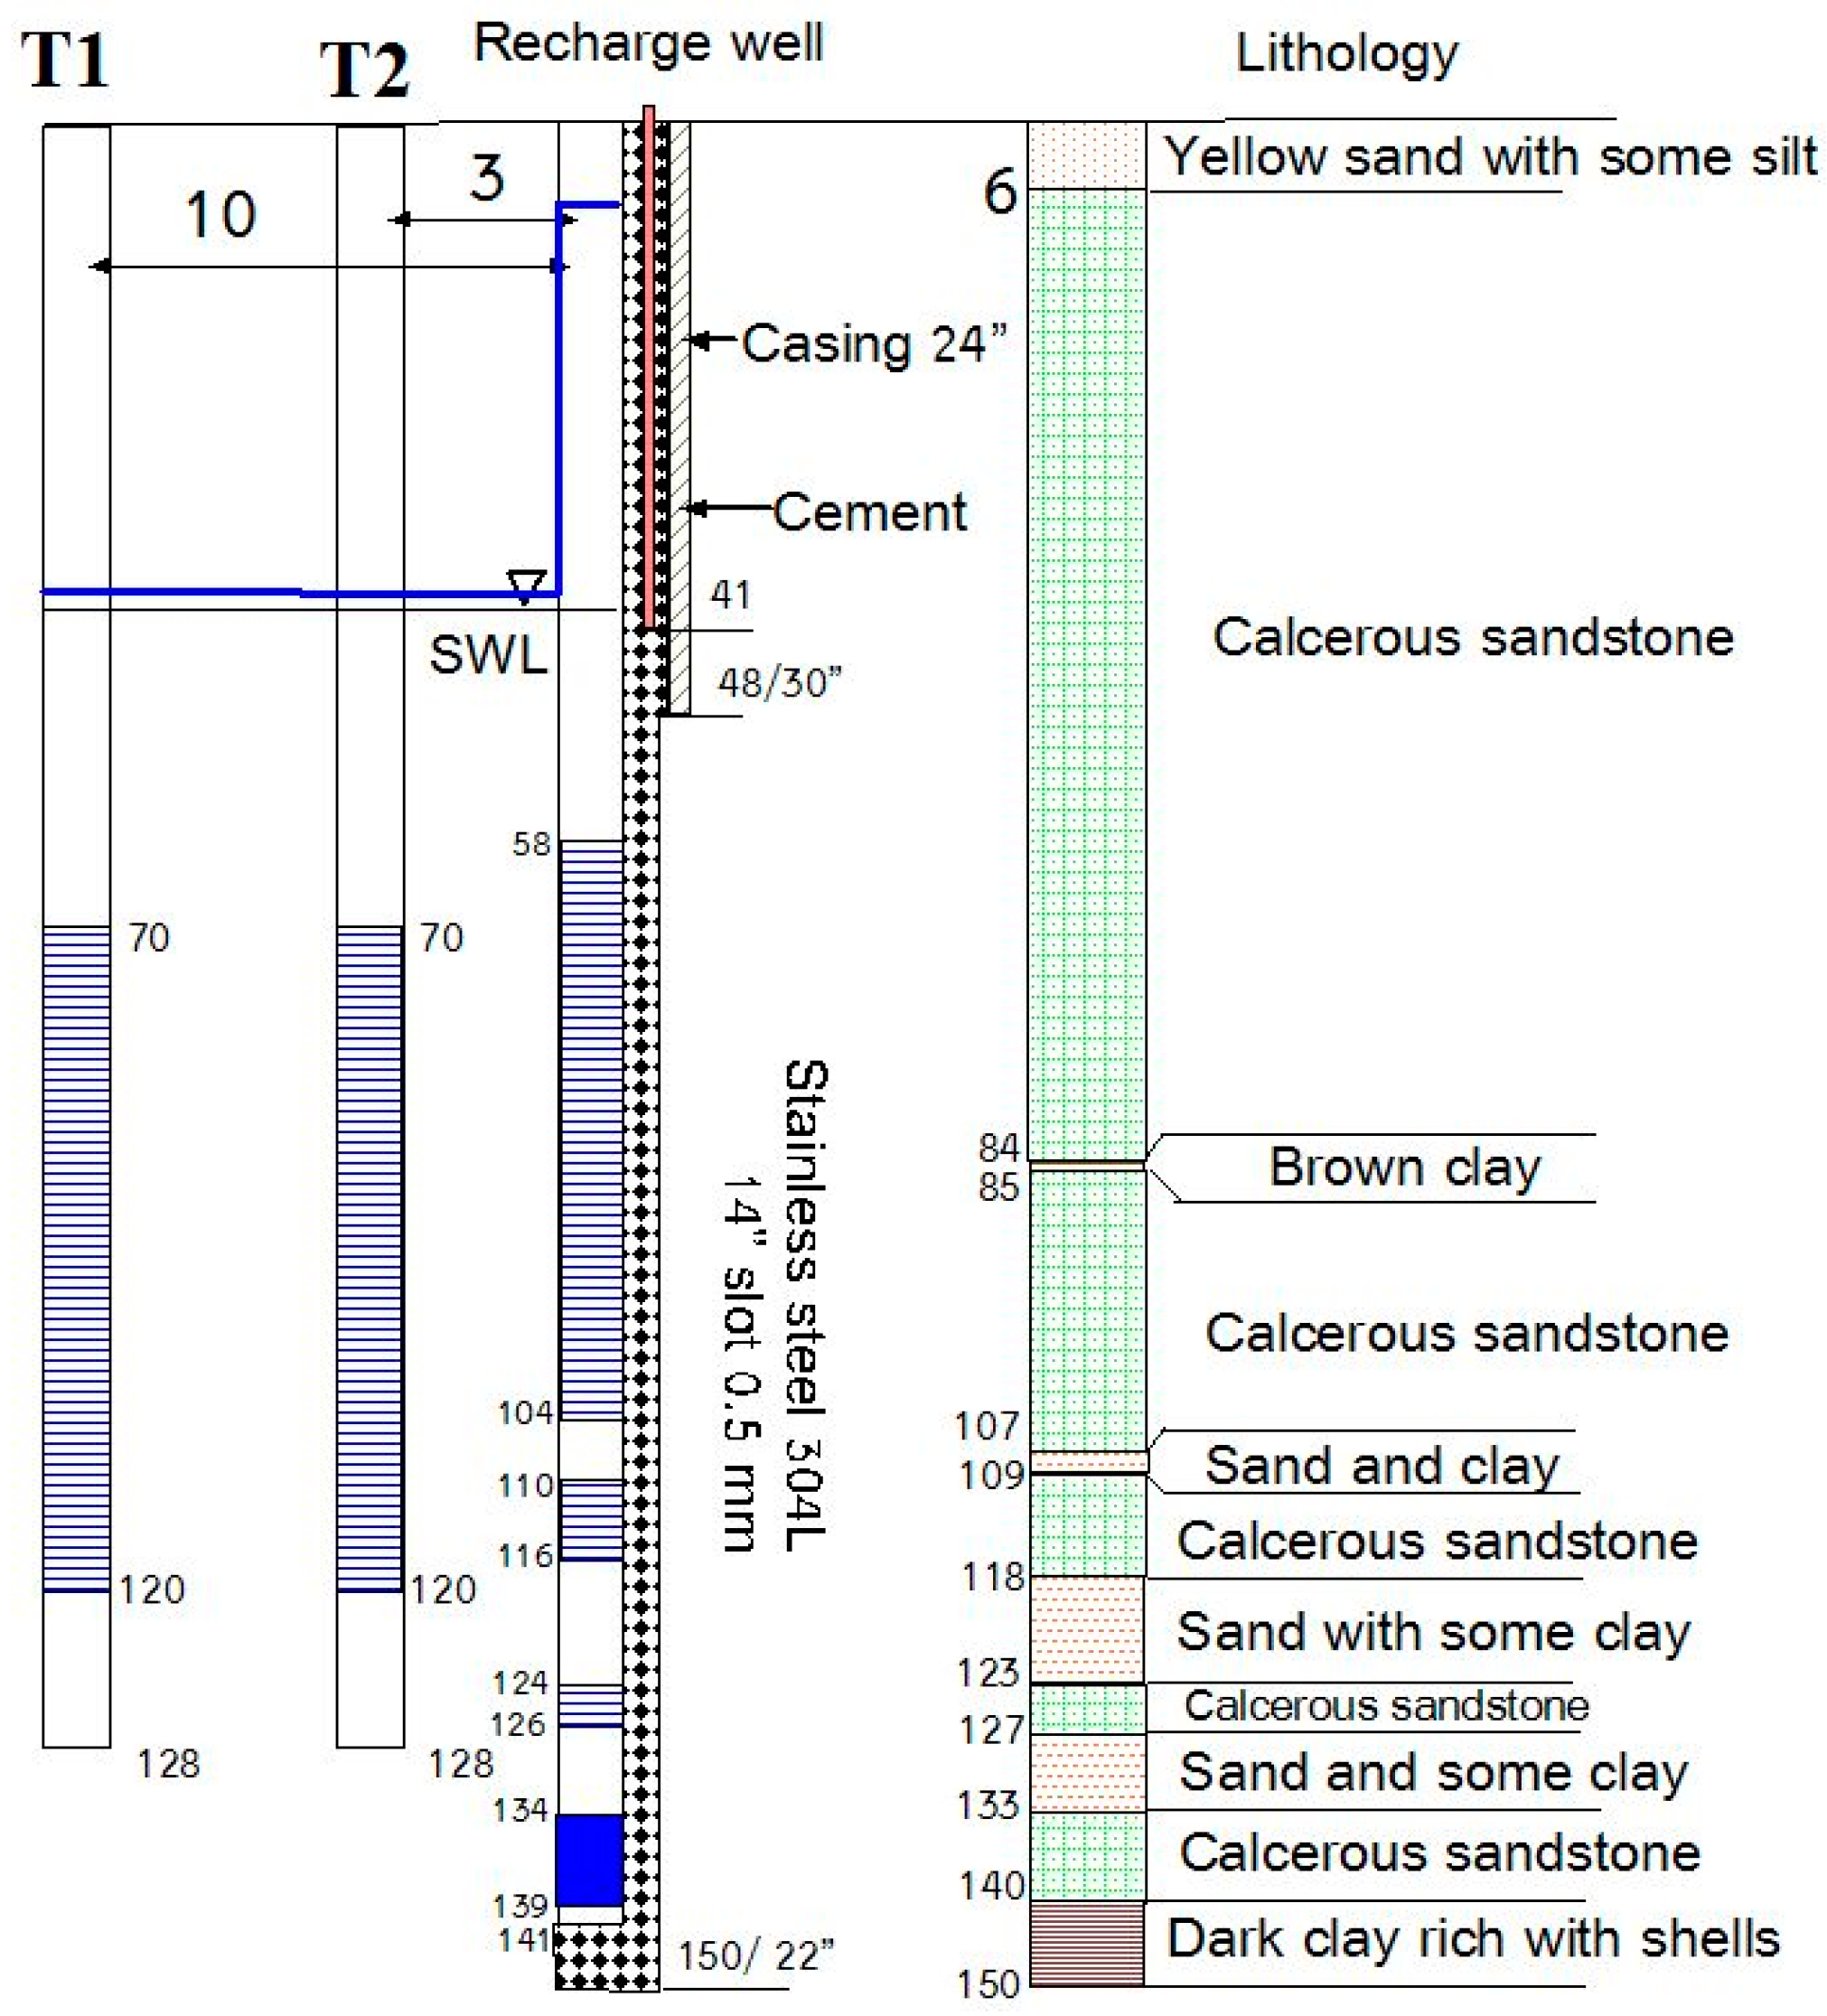
Observation wells: Drilling two observation wells. One well located about 3 m from the recharge well and the second about 10 m from the recharge well. The pumping well was located at a distance of about 20 m from the recharge well and acted as an additional monitoring well during the recharge tests. The two observation wells were drilled to the same depth as the recharge well and their screens were located on the same level as in the recharge well.
The production well was equipped with a 16″ casing and screen. The length of the screen section in the production well is shorter than in the recharge well because it takes into consideration the dynamic drawdown and the depth of the pump.
Figure 3 shows the technical profile of the production (pumping) and the recharge wells in the pilot site.
4. Results
4.1. Pumping and Injection Tests
The field work in the pumping and recharge wells pilot began with the development of the pumping well followed by pumping tests. The water level in the recharge well and the nearby observation wells were measured during the pumping test.
The next step was to develop the recharge well and to conduct pumping tests similar to the pumping tests in the pumping wells. Afterwards, an injection test was carried out. The results of the tests are presented in
Table 1.
The results in
Table 1 were calculated by AQTESOLV Pro for Windows [
11]. The results show that, in general, there are differences in the specific rate between the pumping and the recharge wells. What is more interesting are the differences in the parameters between the pumping test and the injection test
in the recharge well despite both being conducted in the same well.
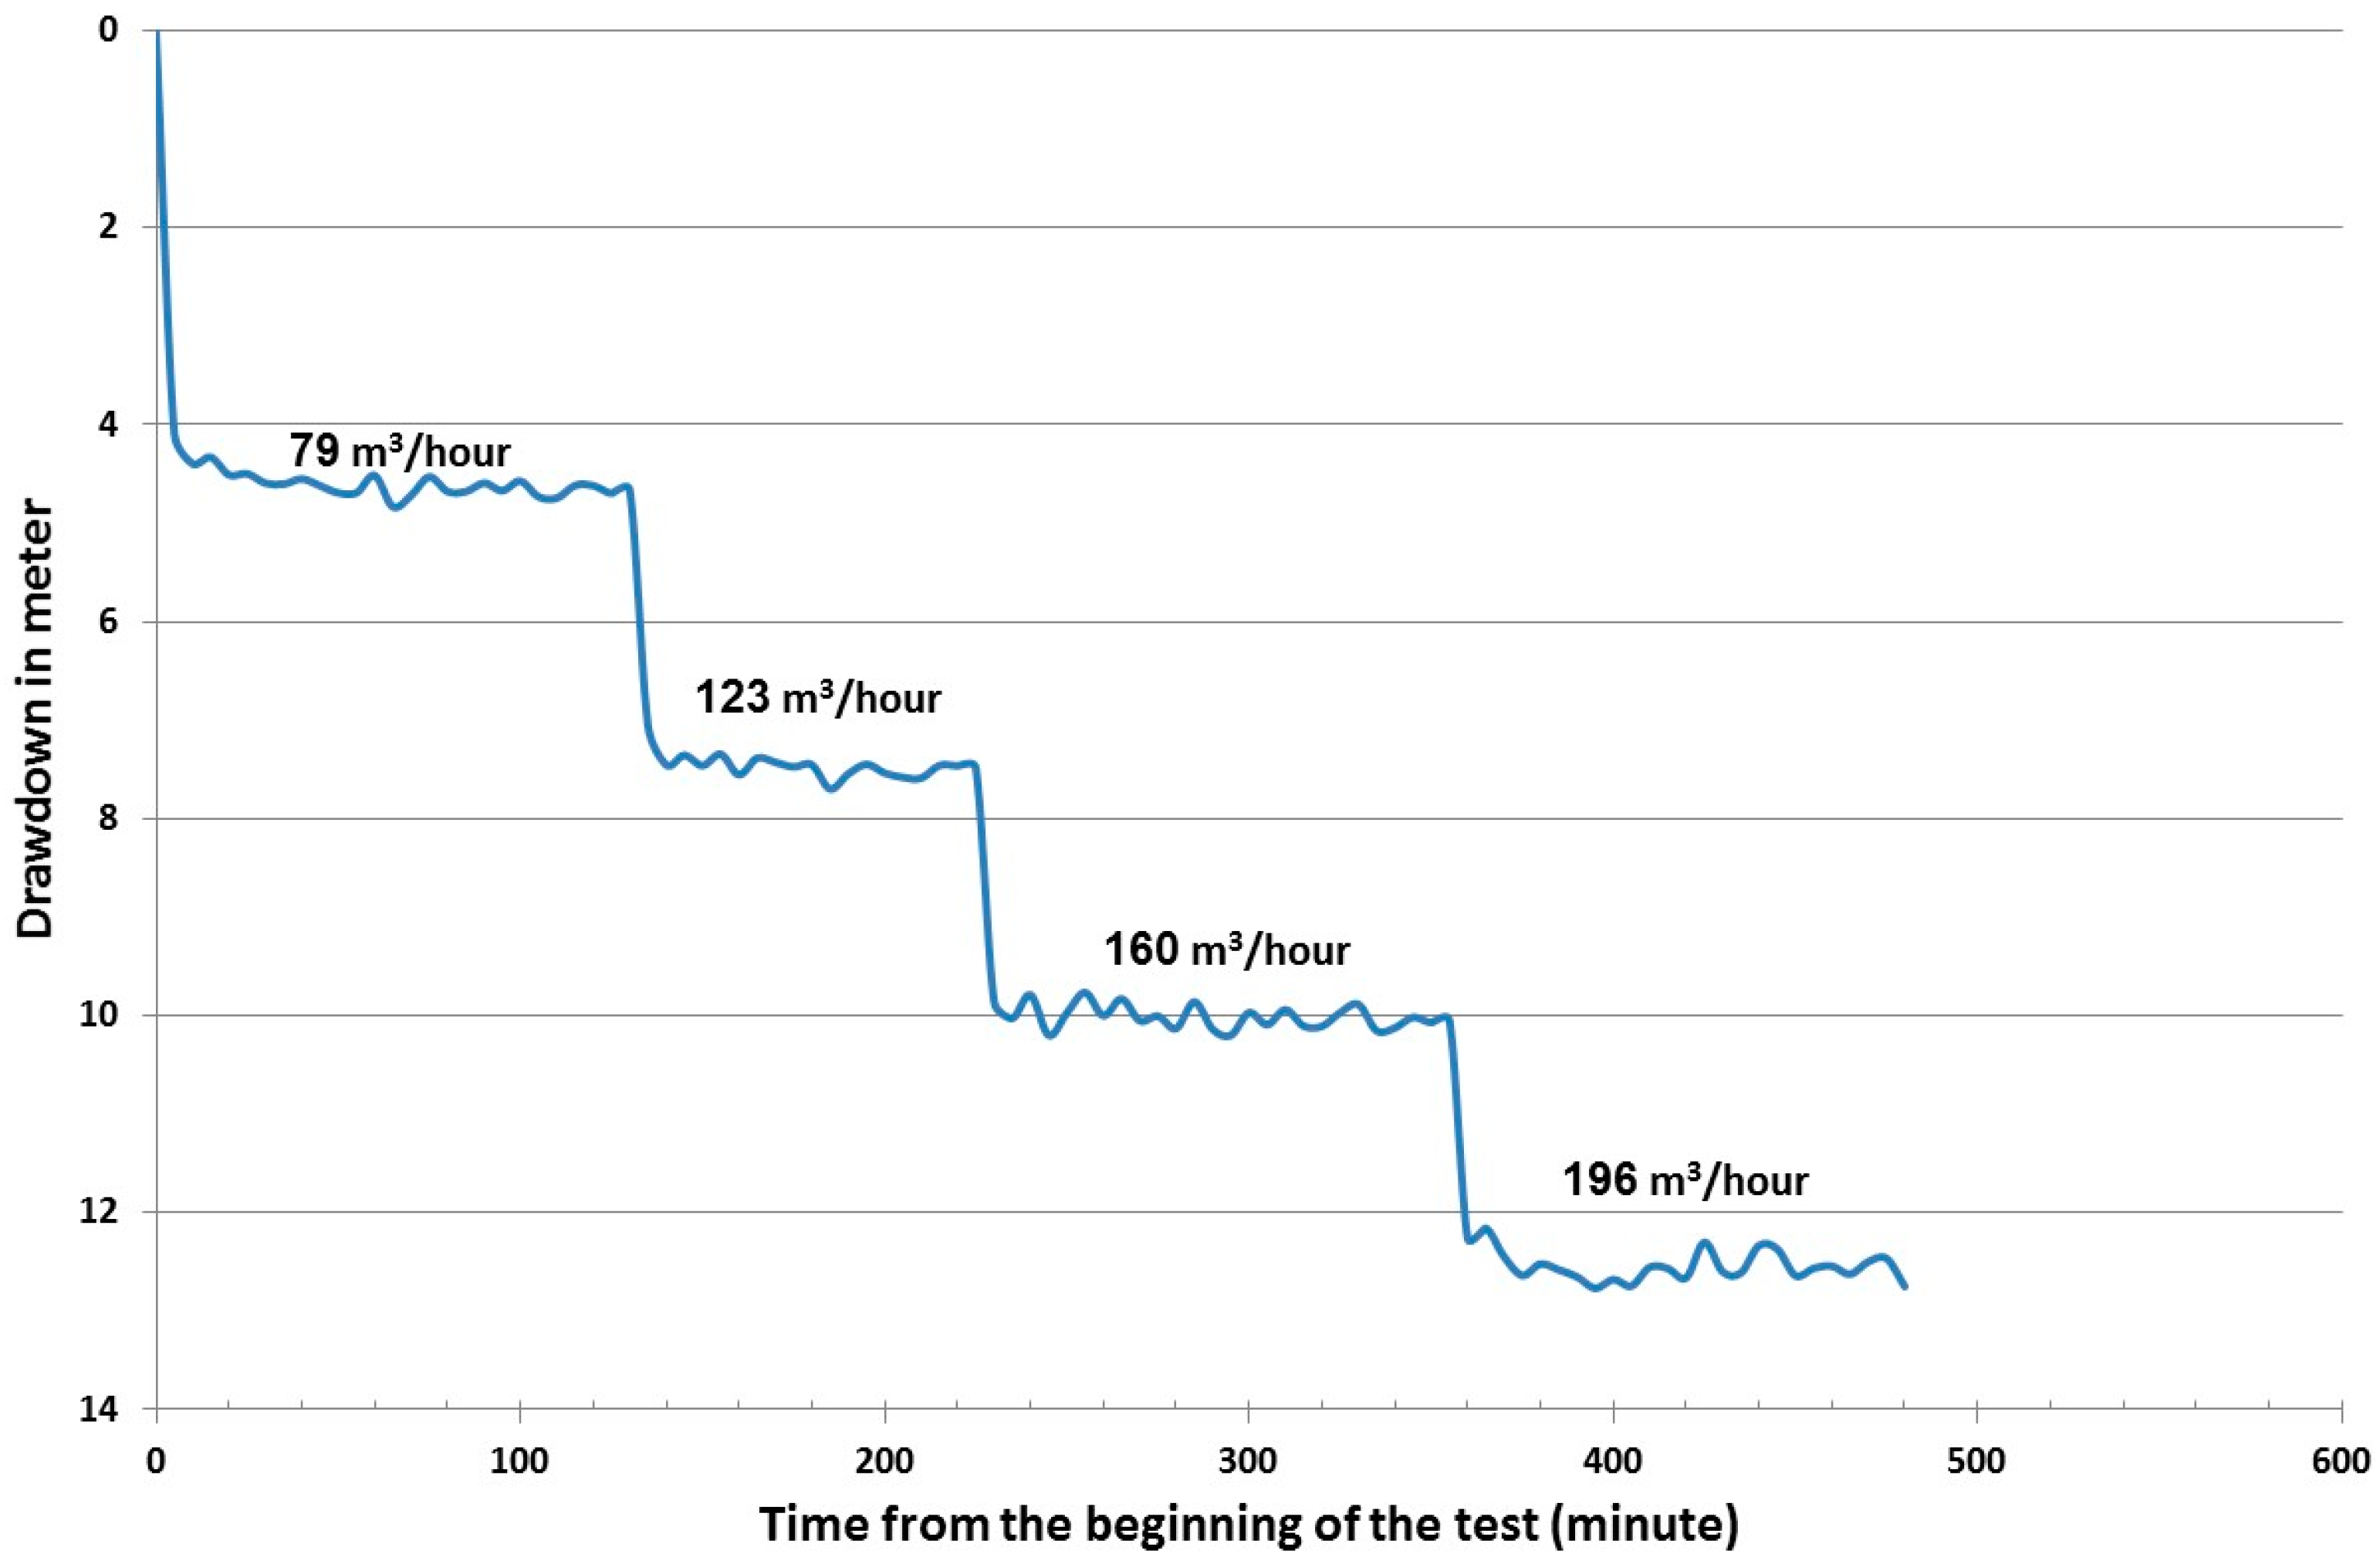
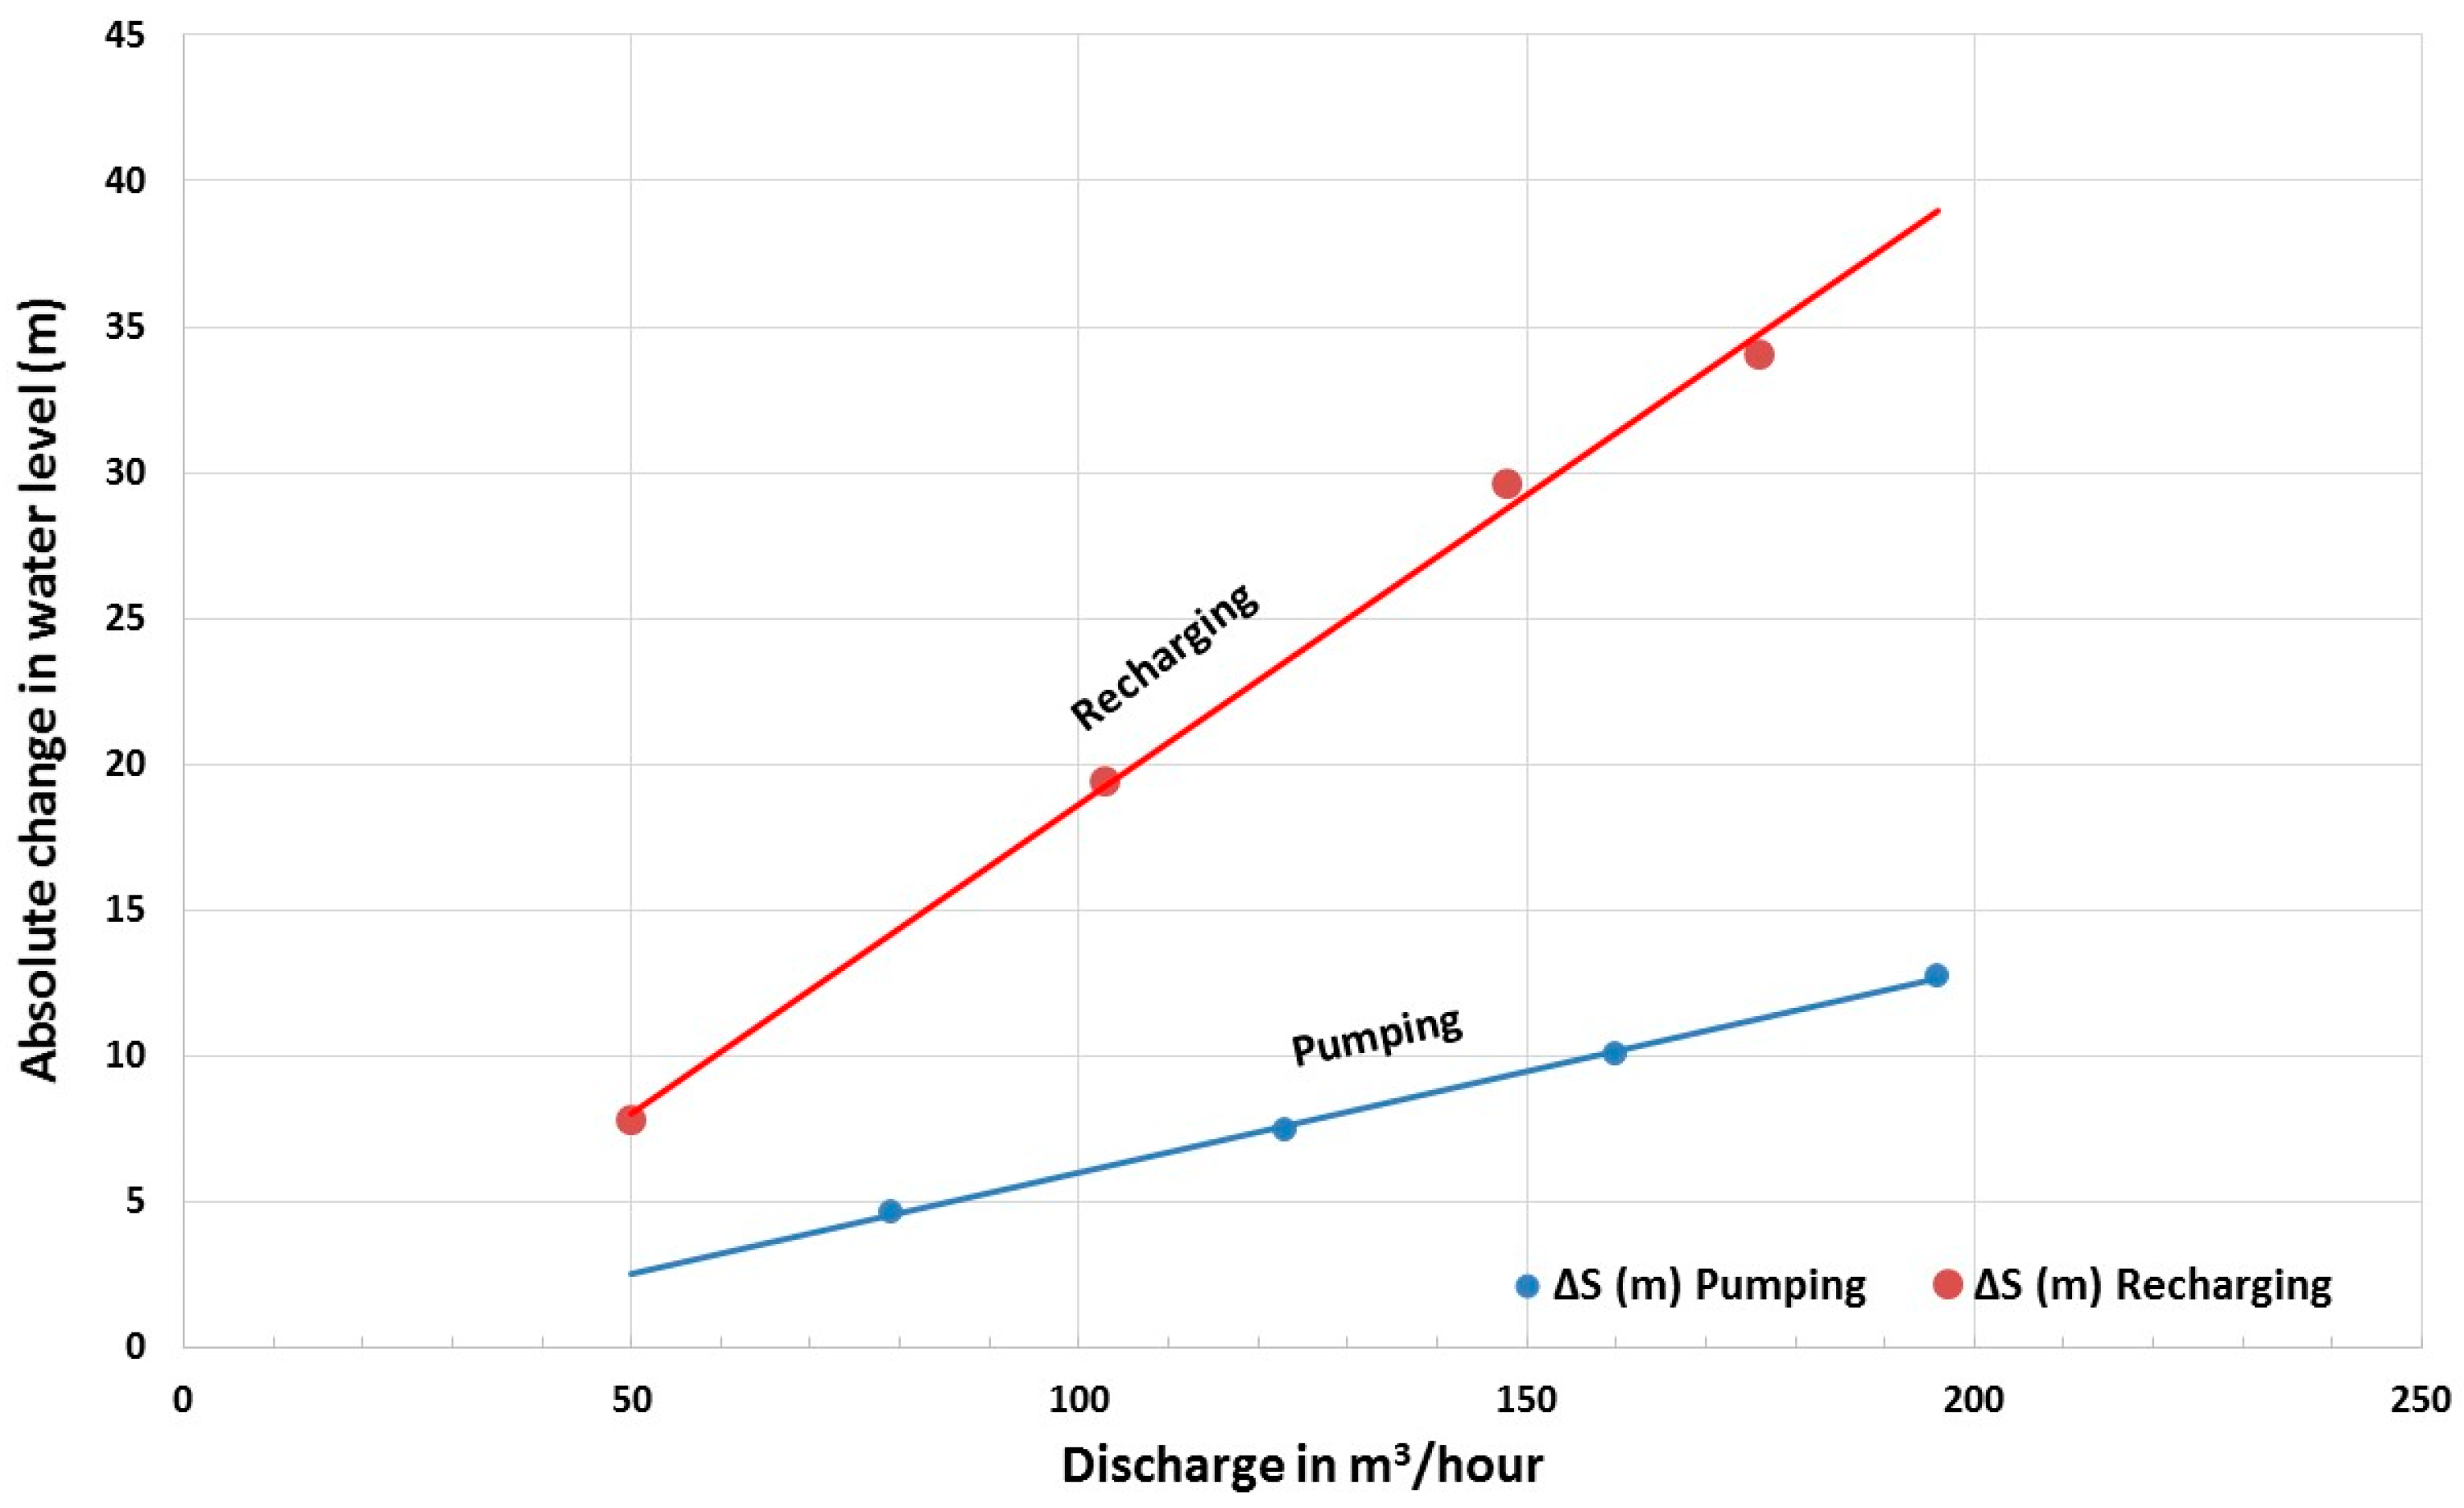
When we compare the hydraulic properties during the pumping and injection tests in the recharge well, we see that the rise of the water level during the injection test is greater than the drawdown during the pumping test (
Figure 4 and
Figure 5) and the specific rate (absorption rate in the injection test) during the injection test was reduced sharply (
Figure 6) to about one third of the specific rate in the pumping test.
The water source for the injection test was water from the regional pipeline that passes close to the well yard fence. The water is a mixture of desalinated water and water from the Western Mountain aquifer (dolomite-limestone aquifer). The electrical conductivity varied between 0.3 and 0.8 mS/cm, but most of the time it was between 0.6 and 0.7 mS/cm. The turbidity was 0.8–1.0 NTU. The Langelier index of the injection water varied between 0.02 and 0.2 (slightly corrosive).
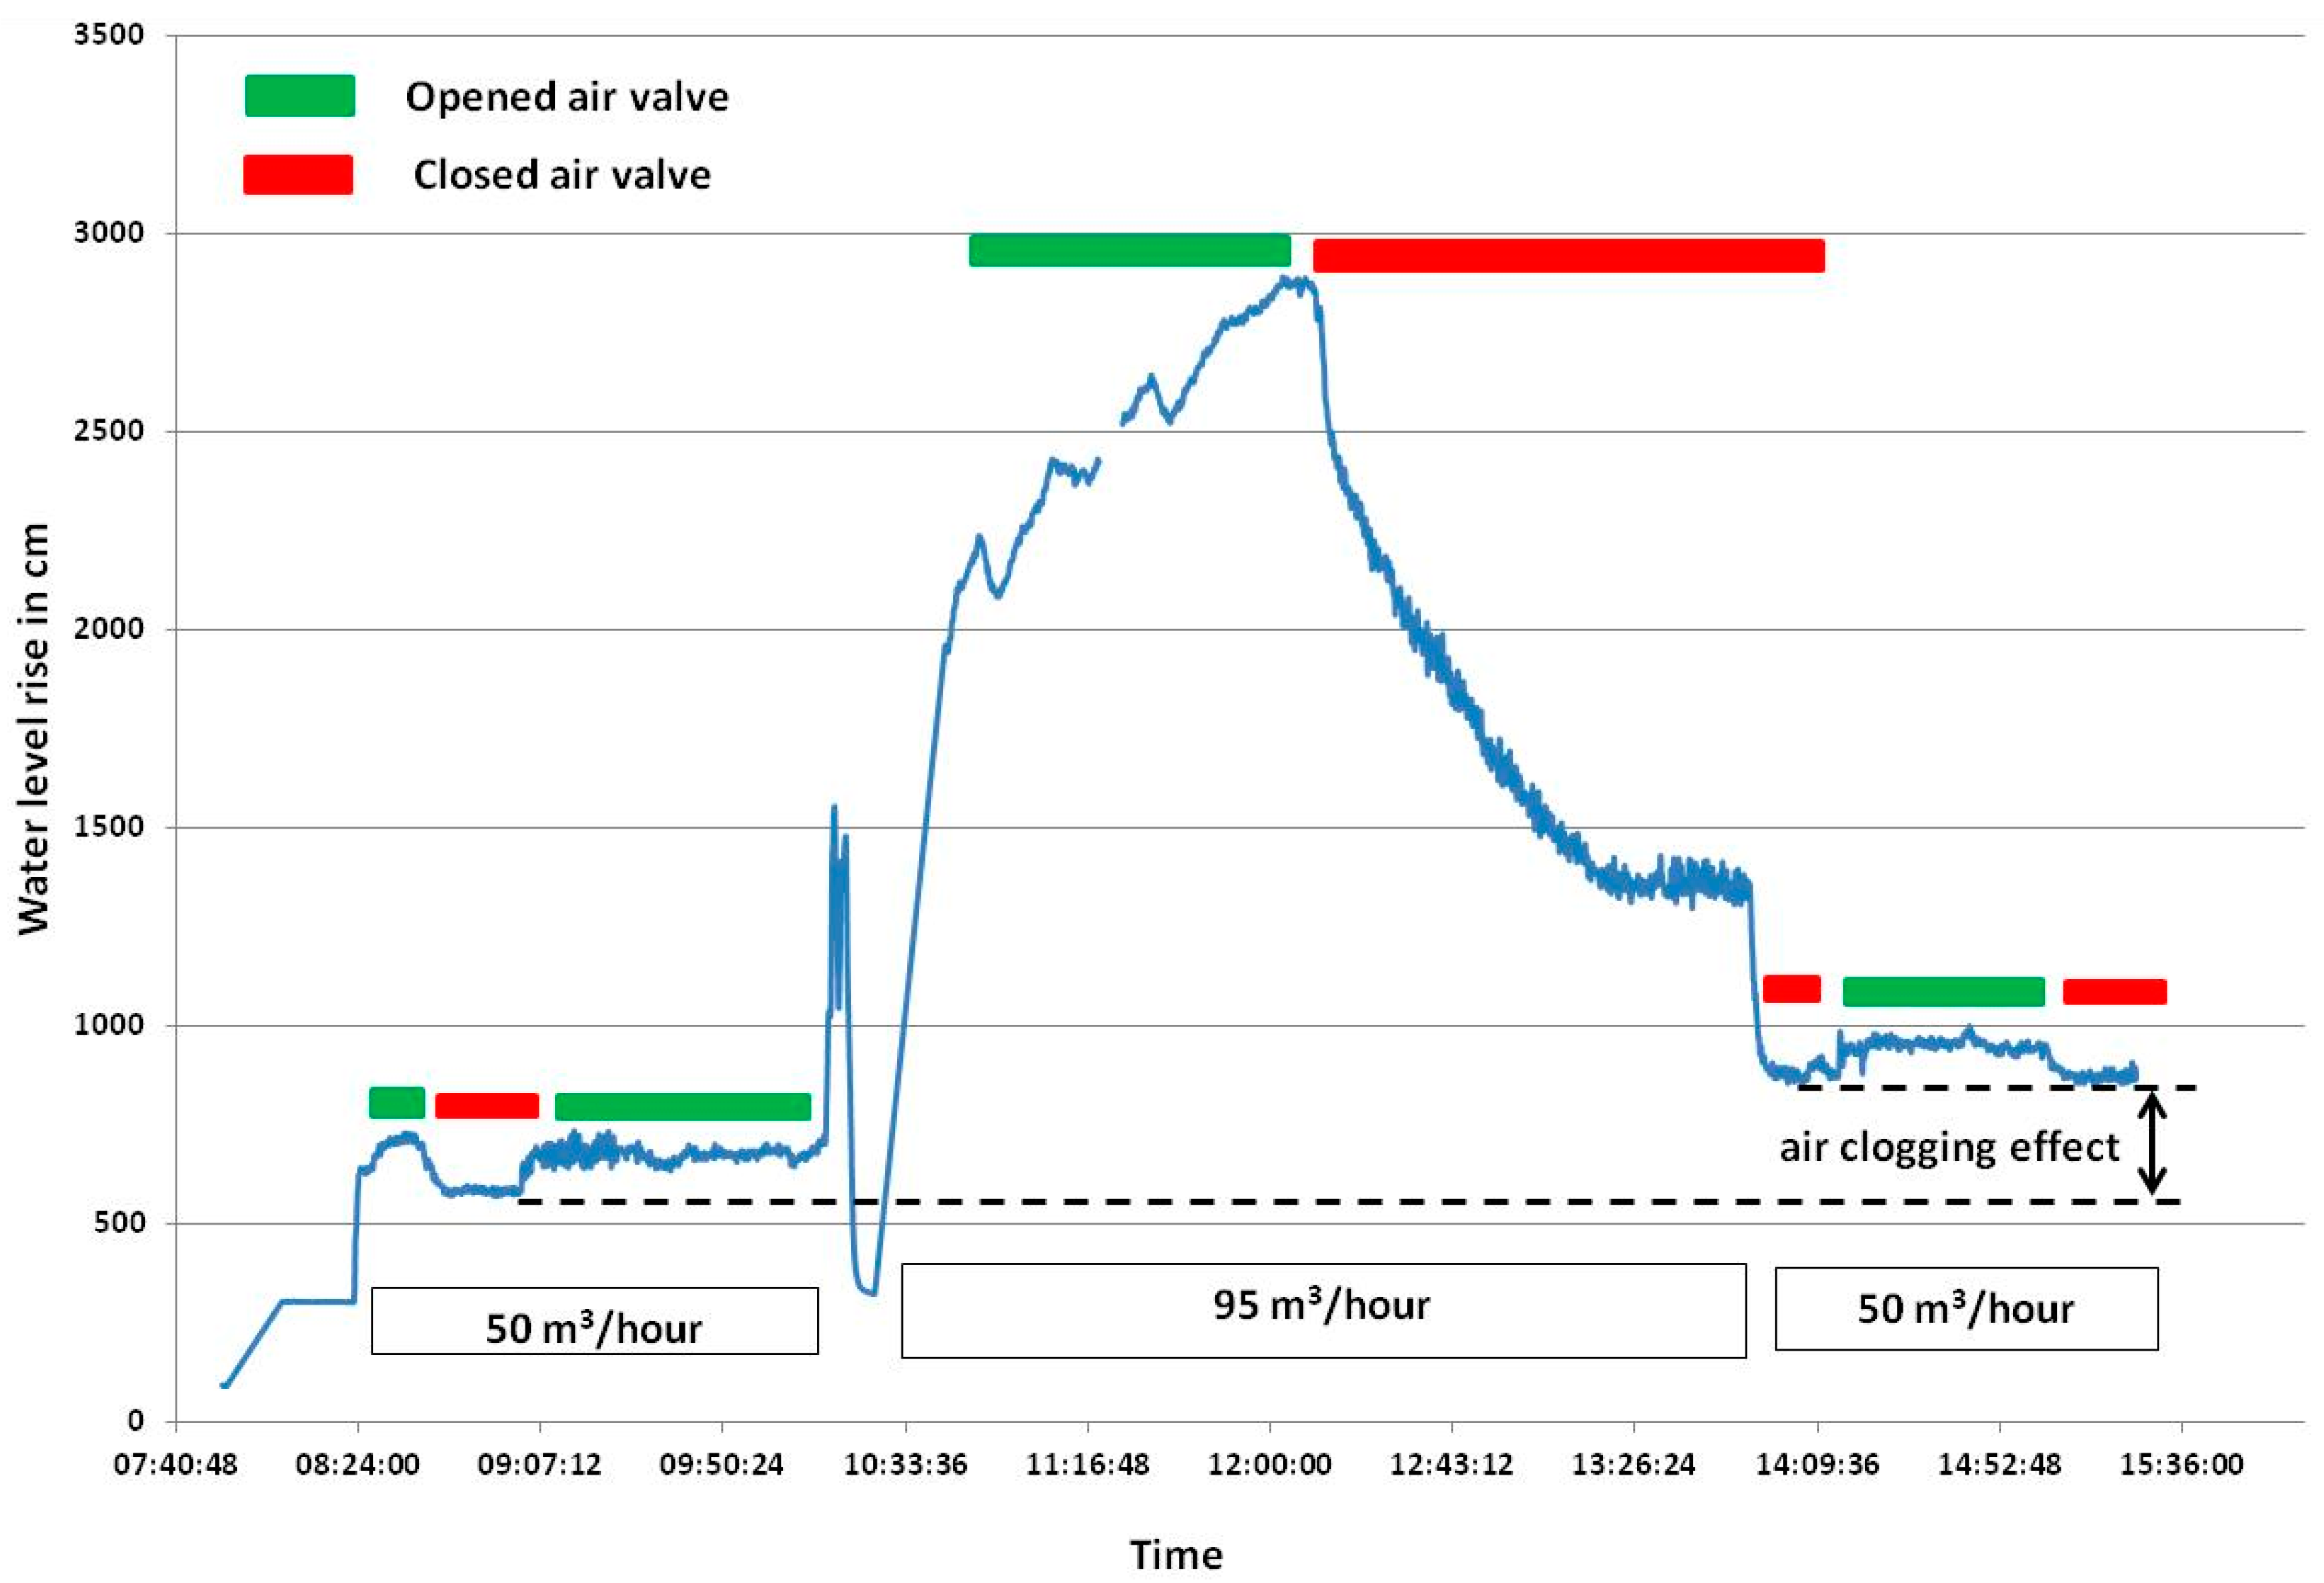
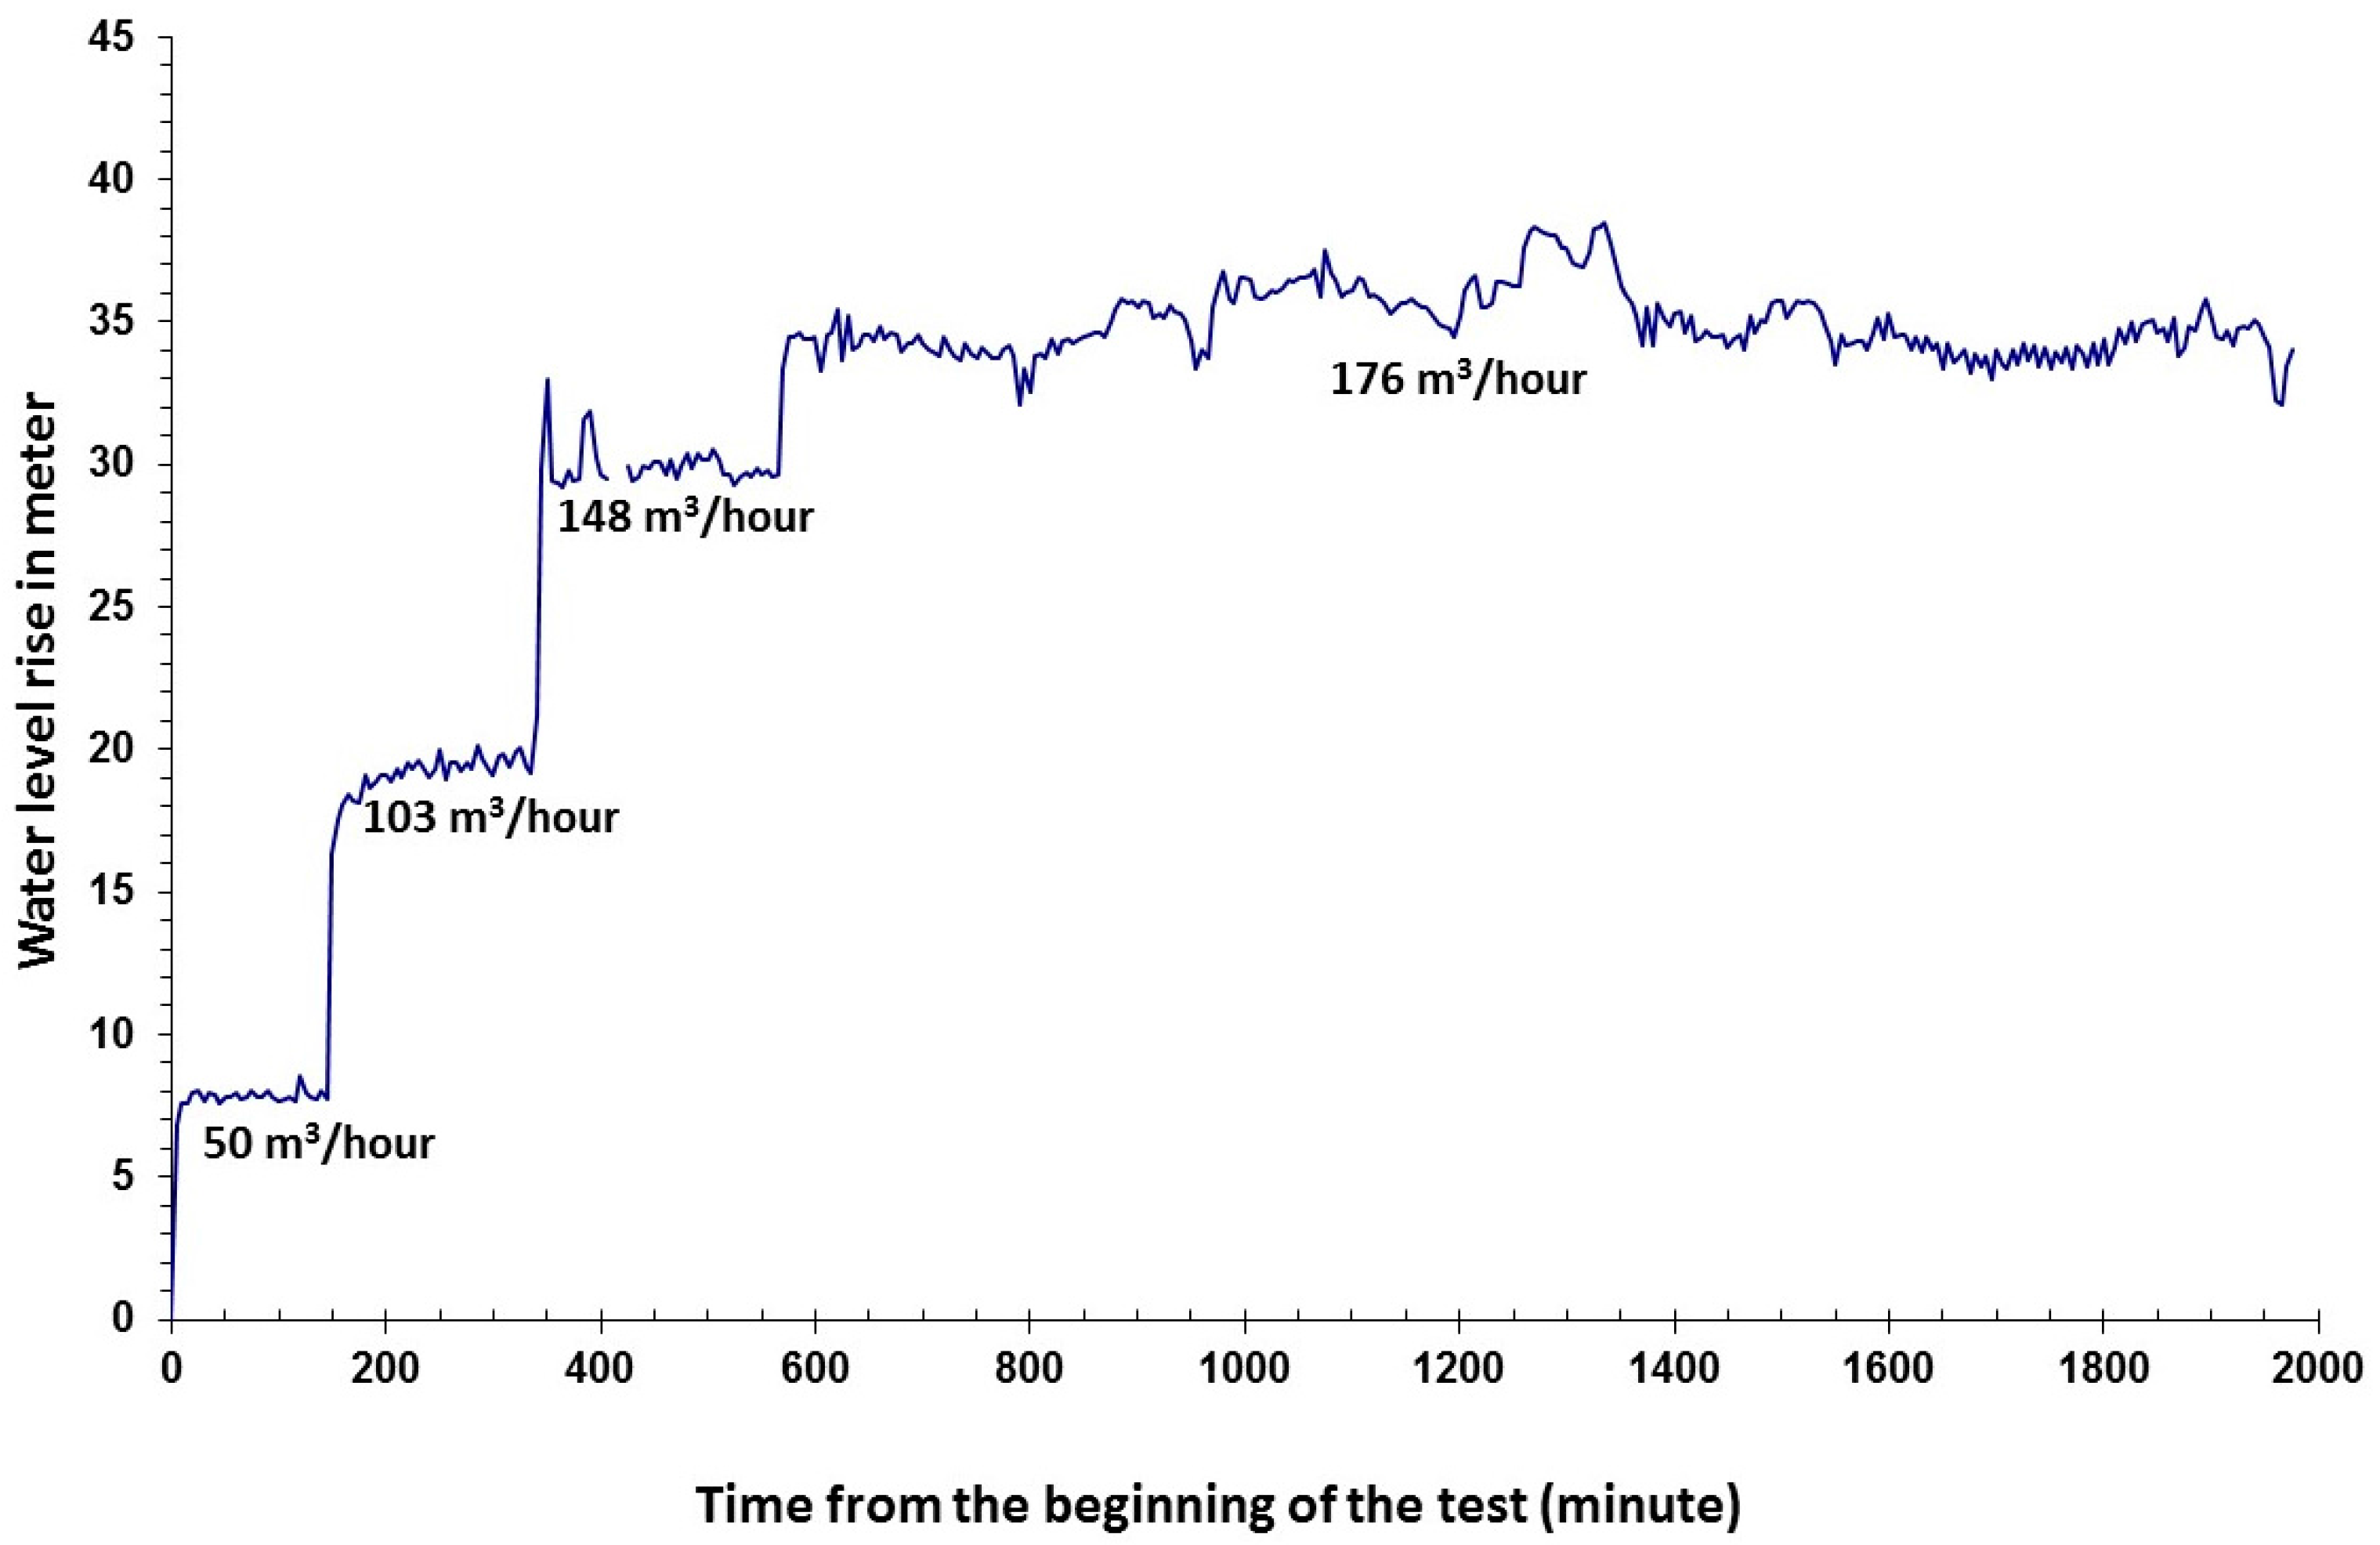
During the injection test we also examined the effect of the air entrainment on the injection rate by checking the differences in the rise of the water level during injection with air and without air. The air was introduced into the injection well through the air release valve.
Opening the valve during the injection created vacuum conditions (Venturi effect) and a mixture of water and air entered the well, as can be seen in
Figure 7. Increasing the hourly discharge from 50 m
3/hour to 95 m
3/hour together with the opened air valve raised the water level immediately by approximately 22 m in 90 min. During injection at 103 m
3/hour the water level rose by around 19 m (
Figure 5). This means that the presence of air in the injected water added about 3 m. Similar results were received when comparing the measurements at the same discharge (50 m
3/hour) with the closed valve (
Figure 7). In this experiment, the air clogging added about 2.6 m to the 6 m rising at 50 m
3/hour.
Another point that we can learn from these results is in regards to the huge reduction in the hydraulic parameters during the injection test in comparison to the pumping test (
Figure 6). Calculating the weight of B (aquifer loss) and C (well loss) coefficients from the total dynamic drawdown at 150 m
3/hour (
Table 2) shows that during the pumping test the aquifer loss coefficient contributed 87.5% to the total drawdown, and only 12.5% came from the well loss coefficient. This indicates that the well was constructed properly. On the other hand, during the injection test the “contribution” of the well loss coefficient increased to 25% from the total rising, and the aquifer loss coefficient was reduced to 75%.
4.2. Air Bubble Pilot Tests
The air bubble pilot consisted of a six meter 6″ transparent pipe (
Figure 2) and several valves at the bottom of the pipe that represented the screen section. For the injection tests we used two types of injection tubes. The first injection tube was a regular pipe where the water exit was located at the bottom of the tube, while in the second injection tube the bottom was closed and the water exited via several 1″ pipes with the openings facing upwards (
Figure 2).
It was observed that during the flow, small dissolved air bubbles began to develop immediately at the beginning of the flow before we introduced air artificially. We also observed that there was a separation between large and medium-sized bubbles, and smaller bubbles. The smaller air bubbles moved downward toward the valves and the large and medium-sized air bubbles moved upward to the dynamic water table.
We saw that the separation of bubbles (large and small) was qualitatively better with the regular tube (water exit at the bottom). In the second tube (drainage points facing upward), the air bubbles at first were large to medium that rose upward. However, after a few minutes of flow, we could see small bubbles drop down and drain through the opening valves.
This implies that the configuration of the injection pipe with the opening drainage points facing upward does not resolve the problem of the smaller air bubbles. We are concerned that in a real injection operation there would be an accumulation of the smaller air bubbles that can cause a clogging problem on the well screen.
Therefore, we decided to continue the pilot with the first type of injection pipe during injection; we observed that when the water level dropped and reached a few centimeters above the bottom of the injection pipe, turbulent conditions developed and large amounts of air bubbles of all sizes were created. The amount of air bubbles increased when the water level continued to drop below the bottom of the injection pipe and large air bubbles reached the valves. On a practical level, this means that such an injection method begins to clog in a very short time on the screen and possibly in the gravel pack as well. The solution is to keep the injection pipe filled with water and saturated all the time (the water level should be a few meters above the bottom). The general way to achieve this is to install a control flow valve (an orifice valve type) at the bottom of the injection pipe. However, this will not totally eradicate the clogs created by the smaller air bubbles.
The main outcomes from the experiences in the air bubble pilot are:
There is a critical level of about 1.5 m above the injection point, where above it, the vortex effect and the creation of air bubbles is reduced to a minimum.
During the injection, different sizes (from larger to smaller) of air bubbles are created.
The larger air bubbles tend to move mainly upward but the smaller air bubbles move downward to the drainage valves with the injected water as dissolved air.
It does not appear possible to totally remove the smaller bubbles (the dissolved air).
Another important factor is the distance between the injection point and the top of the screen. If the injection point is too close to the top of the valves (the screen), the potential to have air clogging the screen and in the gravel pack increases.
5. Discussion
During the injection period, the water levels in the recharge well and in the two nearby observation wells were measured continuously. The distance of the observation wells from the recharge well was 3 m and 10 m, respectively. With an injection rate of about 176 m
3/hour, the water level inside the recharge well was raised by around 34 m, while in the observation wells it was raised by 2.67 m to 1.73 m, respectively.
Figure 8 shows the course of the water level in the recharge and observation wells during the recharge test.
We can see that during injection, the rising cone (an expression similar to depression cone) is totally different to the theoretical cone of depression that we would expect in a regular pumping test. What we saw in the recharge test is that the major rising occurs inside the injection well, while in the observation wells (3 m and 10 m from the recharge well) the rising of the water level was very small (
Figure 9).
When comparing the aquifer and the well loss coefficients of the two tests in the recharge well (
Table 2), we can see that the aquifer loss coefficient (B) in the recharge test is 2.68 times greater than during the pumping test, and the well loss coefficient (C) is about 6.09 times greater than during the pumping test.
We assume that the increases in the aquifer and in the well coefficients are a result of two processes that are occurring simultaneously. The high aquifer loss coefficient (B) in the recharge test is due to the injected water that flows from the inside of the well towards the aquifer layers. It requires an injection pressure to overcome the aquifer pressure and the pore water pressure that the injected water is supposed to replace during injection [
12,
13]. The high value of the well loss coefficient (C) indicates that the screen is partly clogged during the injection. Based on the air bubble pilot results and the injection tests, we assumed that the screen (and maybe part of the gravel pack) was partly sealed by air clogging during the injection.
The expression of these two mechanisms (injection pressure to overcome the aquifer pressure and the pore water pressure) is the high water level inside the recharge well compared to the small water level rise in the observation wells (
Figure 8 and
Figure 9).
In the air bubble pilot, we saw that it is not possible to eliminate the smaller air bubbles (dissolved air) that are created during the injection process, even when the injection pipe is fully saturated. The injection test with opened and closed valve indicates that the air clogging process is very rapid, as shown in
Figure 7. Injection of 95 m
3/hour together with the opened air valve raised the water level immediately by around 22 m in 90 min. Comparing the rising of the water level at the same discharge (50 m
3/hour) in the closed valve (before and after the injection of 95 m
3/hour together with the opened air valve) shows that air clogging added about 2.6 m to the 6 rising in 50 m
3/hour.
6. Conclusions
The increasing demand for water in many regions around the world has led to the implementation of tools such as artificial recharge as part of IWRM (Integrated Water Resources Management).
Since 2005, the water sector in Israel has changed dramatically due to the establishment of several seawater desalination plants along the Mediterranean Coast. During low demand periods (mainly in the winter and weekends), there is a surplus of desalinated water for short periods of time (hours) that the system does not have the capability to store. The surplus water can be injected in a few existing infiltration ponds that were specifically constructed to inject runoff, in several abandoned quarries, and through injection wells. The main advantages of using injection wells is the ability to locate them in places where the subsurface geology is not suitable for infiltration ponds, in confined aquifer, in small and dense areas, and in areas close to the water supply network.
Most of the injection wells that were drilled in Israel in the past have been abandoned primarily because of the poor quality of the injection water, and secondly because of the problematic technical structure. Therefore, the new recharge wells were designed and constructed in a way that enable high flow rates and reduce the clogging effect.
Two pilots were conducted in parallel. One pilot focused on the relationship between flow rate, depth of injection, and creation of air bubbles, and a second pilot included a pumping well, recharge well, and two nearby observation wells. The second pilot was conducted in order to evaluate the hydrological conditions of the aquifer, the effect of the new technical design on the injection rate, and the clogging process.
Pumping and injection tests that were conducted in the recharge well showed a huge reduction in the hydraulic parameters in the injection test compared to the pumping test despite both tests being conducted at the same well. We assume that there are two mechanisms that are operating together that caused the reduction in the aquifer coefficients during the recharge event. The first mechanism is the injection pressure that needs to overcome the aquifer pressure and the pore water pressure, and the second mechanism is the pressure that the injected water needs to overcome the clogging process that occurs on the screen and in the gravel. The expression of these two mechanisms is the high water level inside the recharge well compared to the lower water level in the nearby observation wells.
The air bubble pilot indicated that it is not possible to remove the smaller air bubbles (dissolved air) that are created during the injection process, even when the injection pipe is fully saturated. The injection test with opened and closed valves indicates that the clogging process is very rapid and appears just after injection.
On a practical level, it is important to keep the injection pipe filled with water and saturated all the time (the water level should be a few meters above the injection point). The general way to achieve this is to install a control flow valve (an orifice valve type) at the bottom of the injection pipe. However, this will not totally eradicate the creation of the smaller air bubbles and the clogging caused by them.
This research gives good insight into the injection mechanism through wells and is essential for any further development of injection facilities and for operation and management protocols.


