
Evaluation of TRMM Product for Monitoring Drought in the Kelantan River Basin, Malaysia


Abstract
:1. Introduction
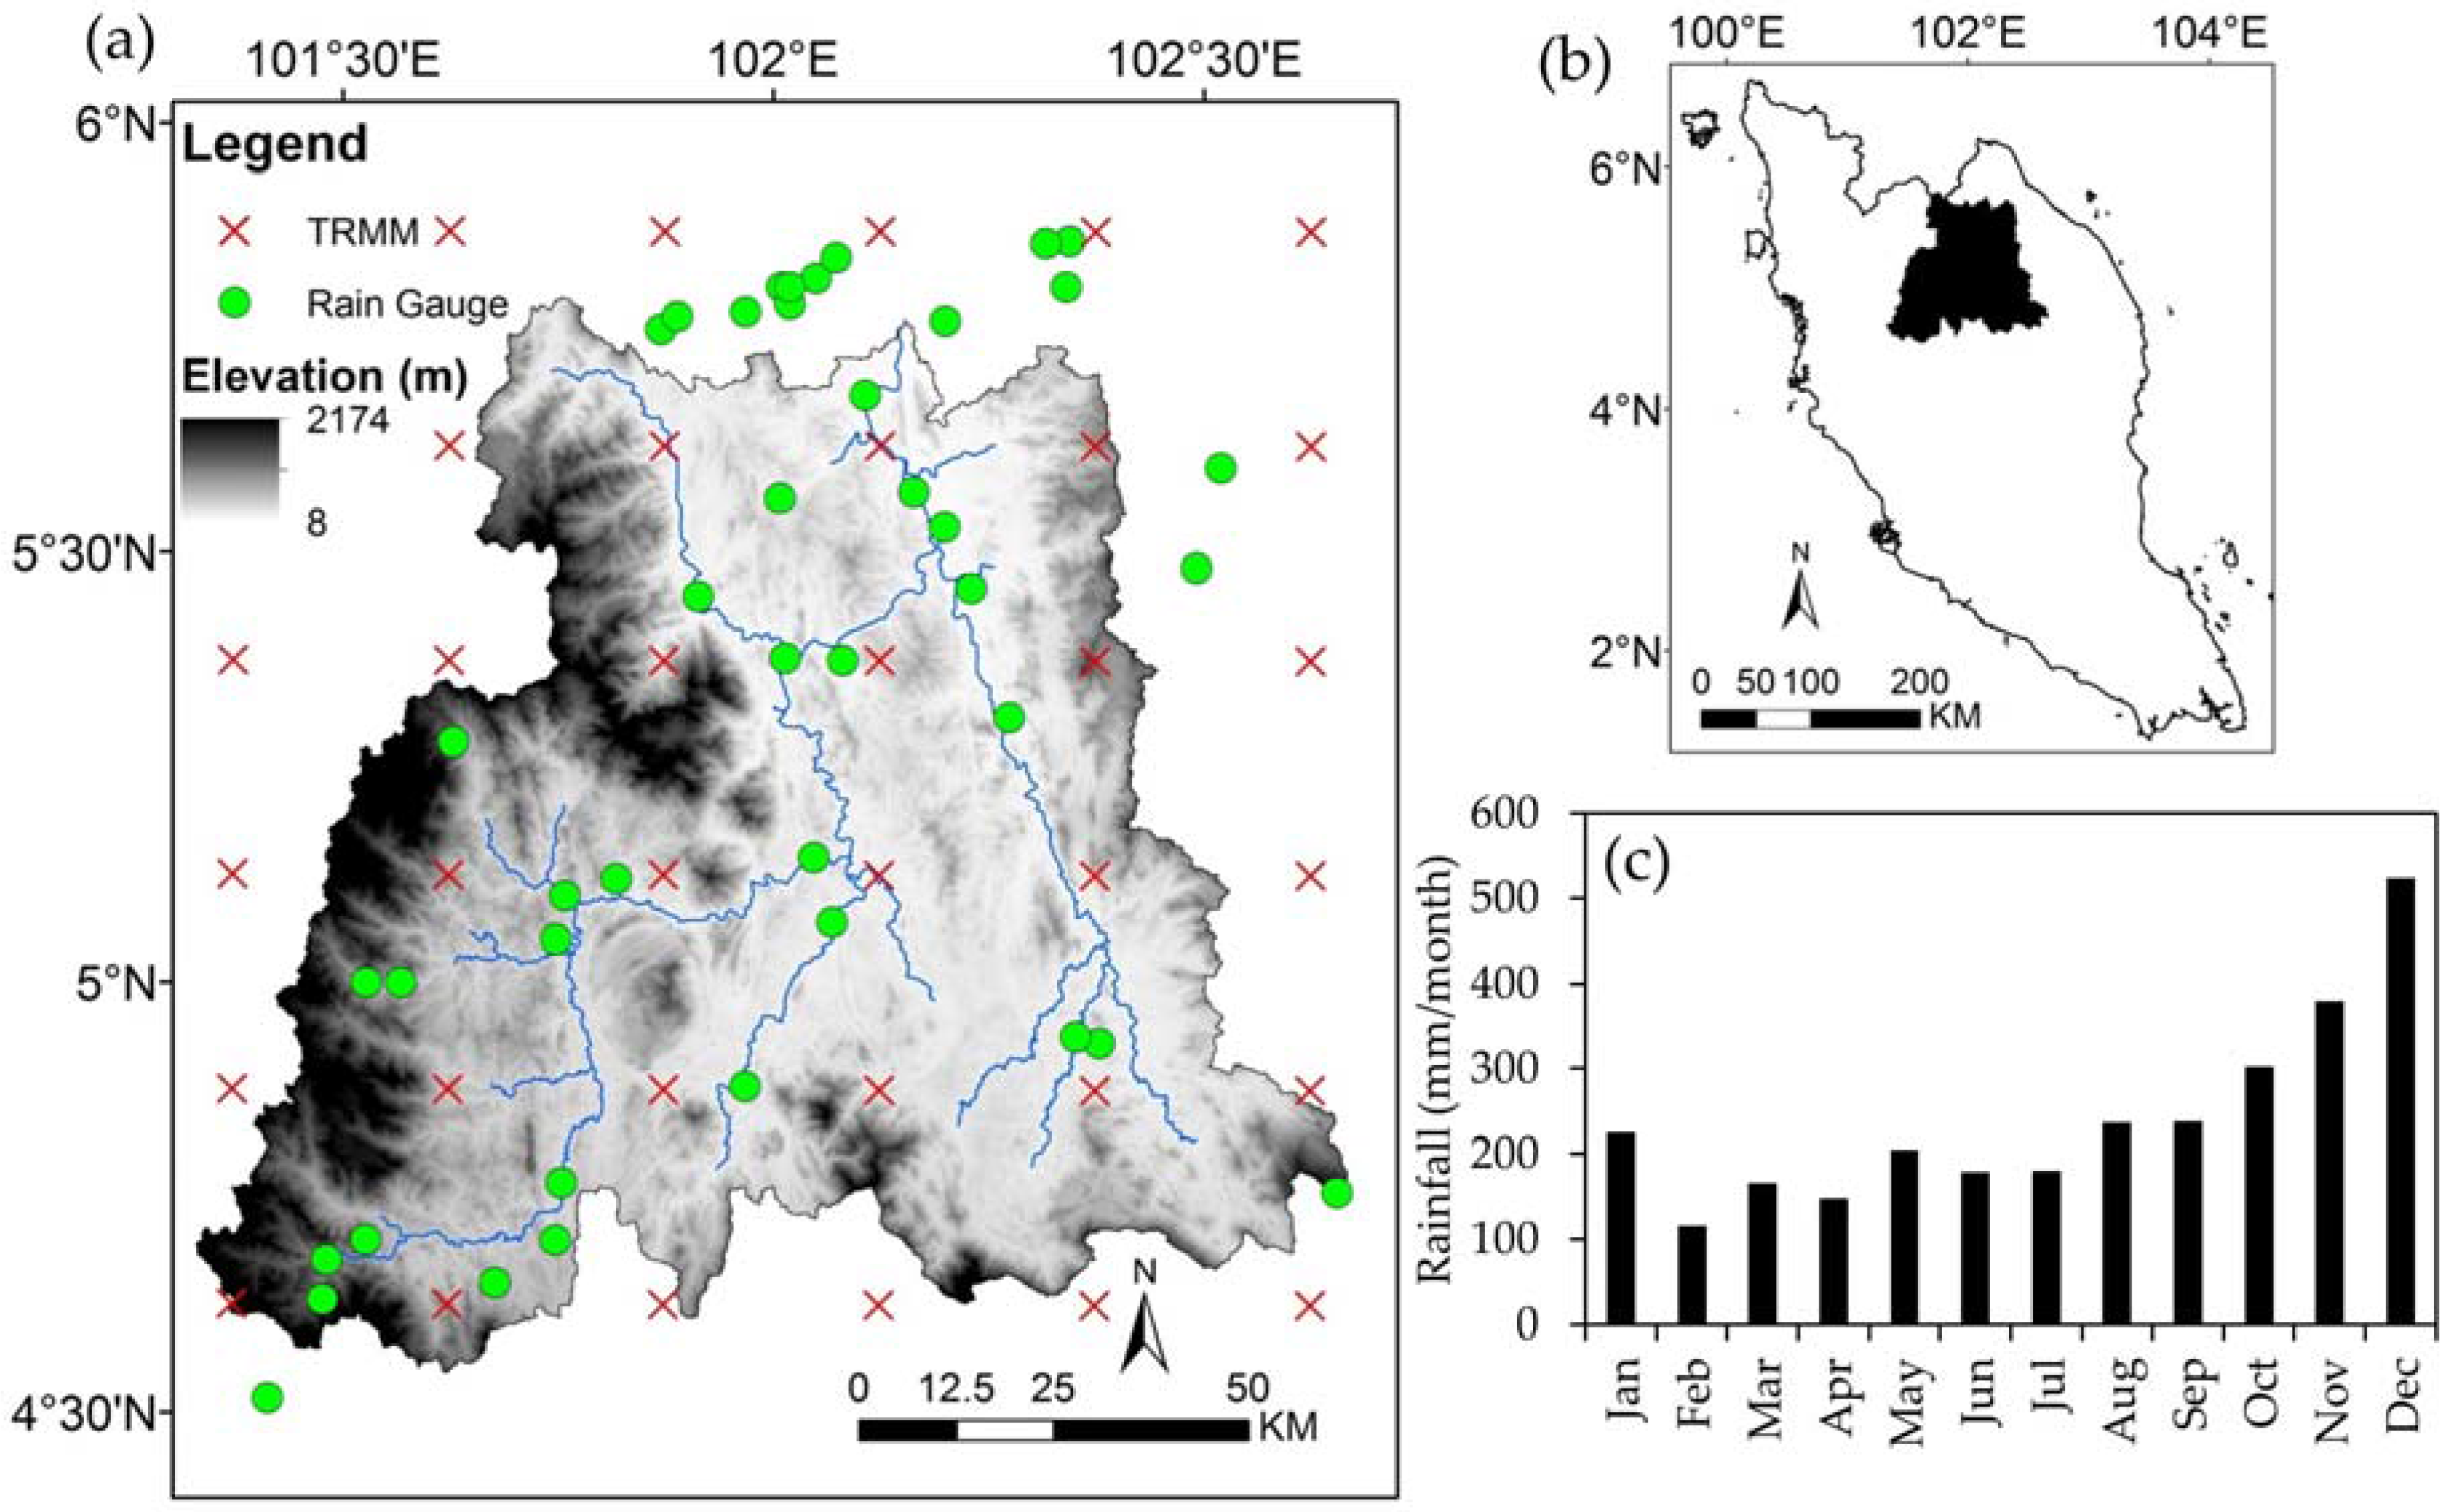
2. Study Area
3. Materials and Methods
3.1. Precipitation Data
3.2. Standardized Precipitation Index
3.3. Validation Process
3.4. Statistical Analysis
4. Results and Discussion
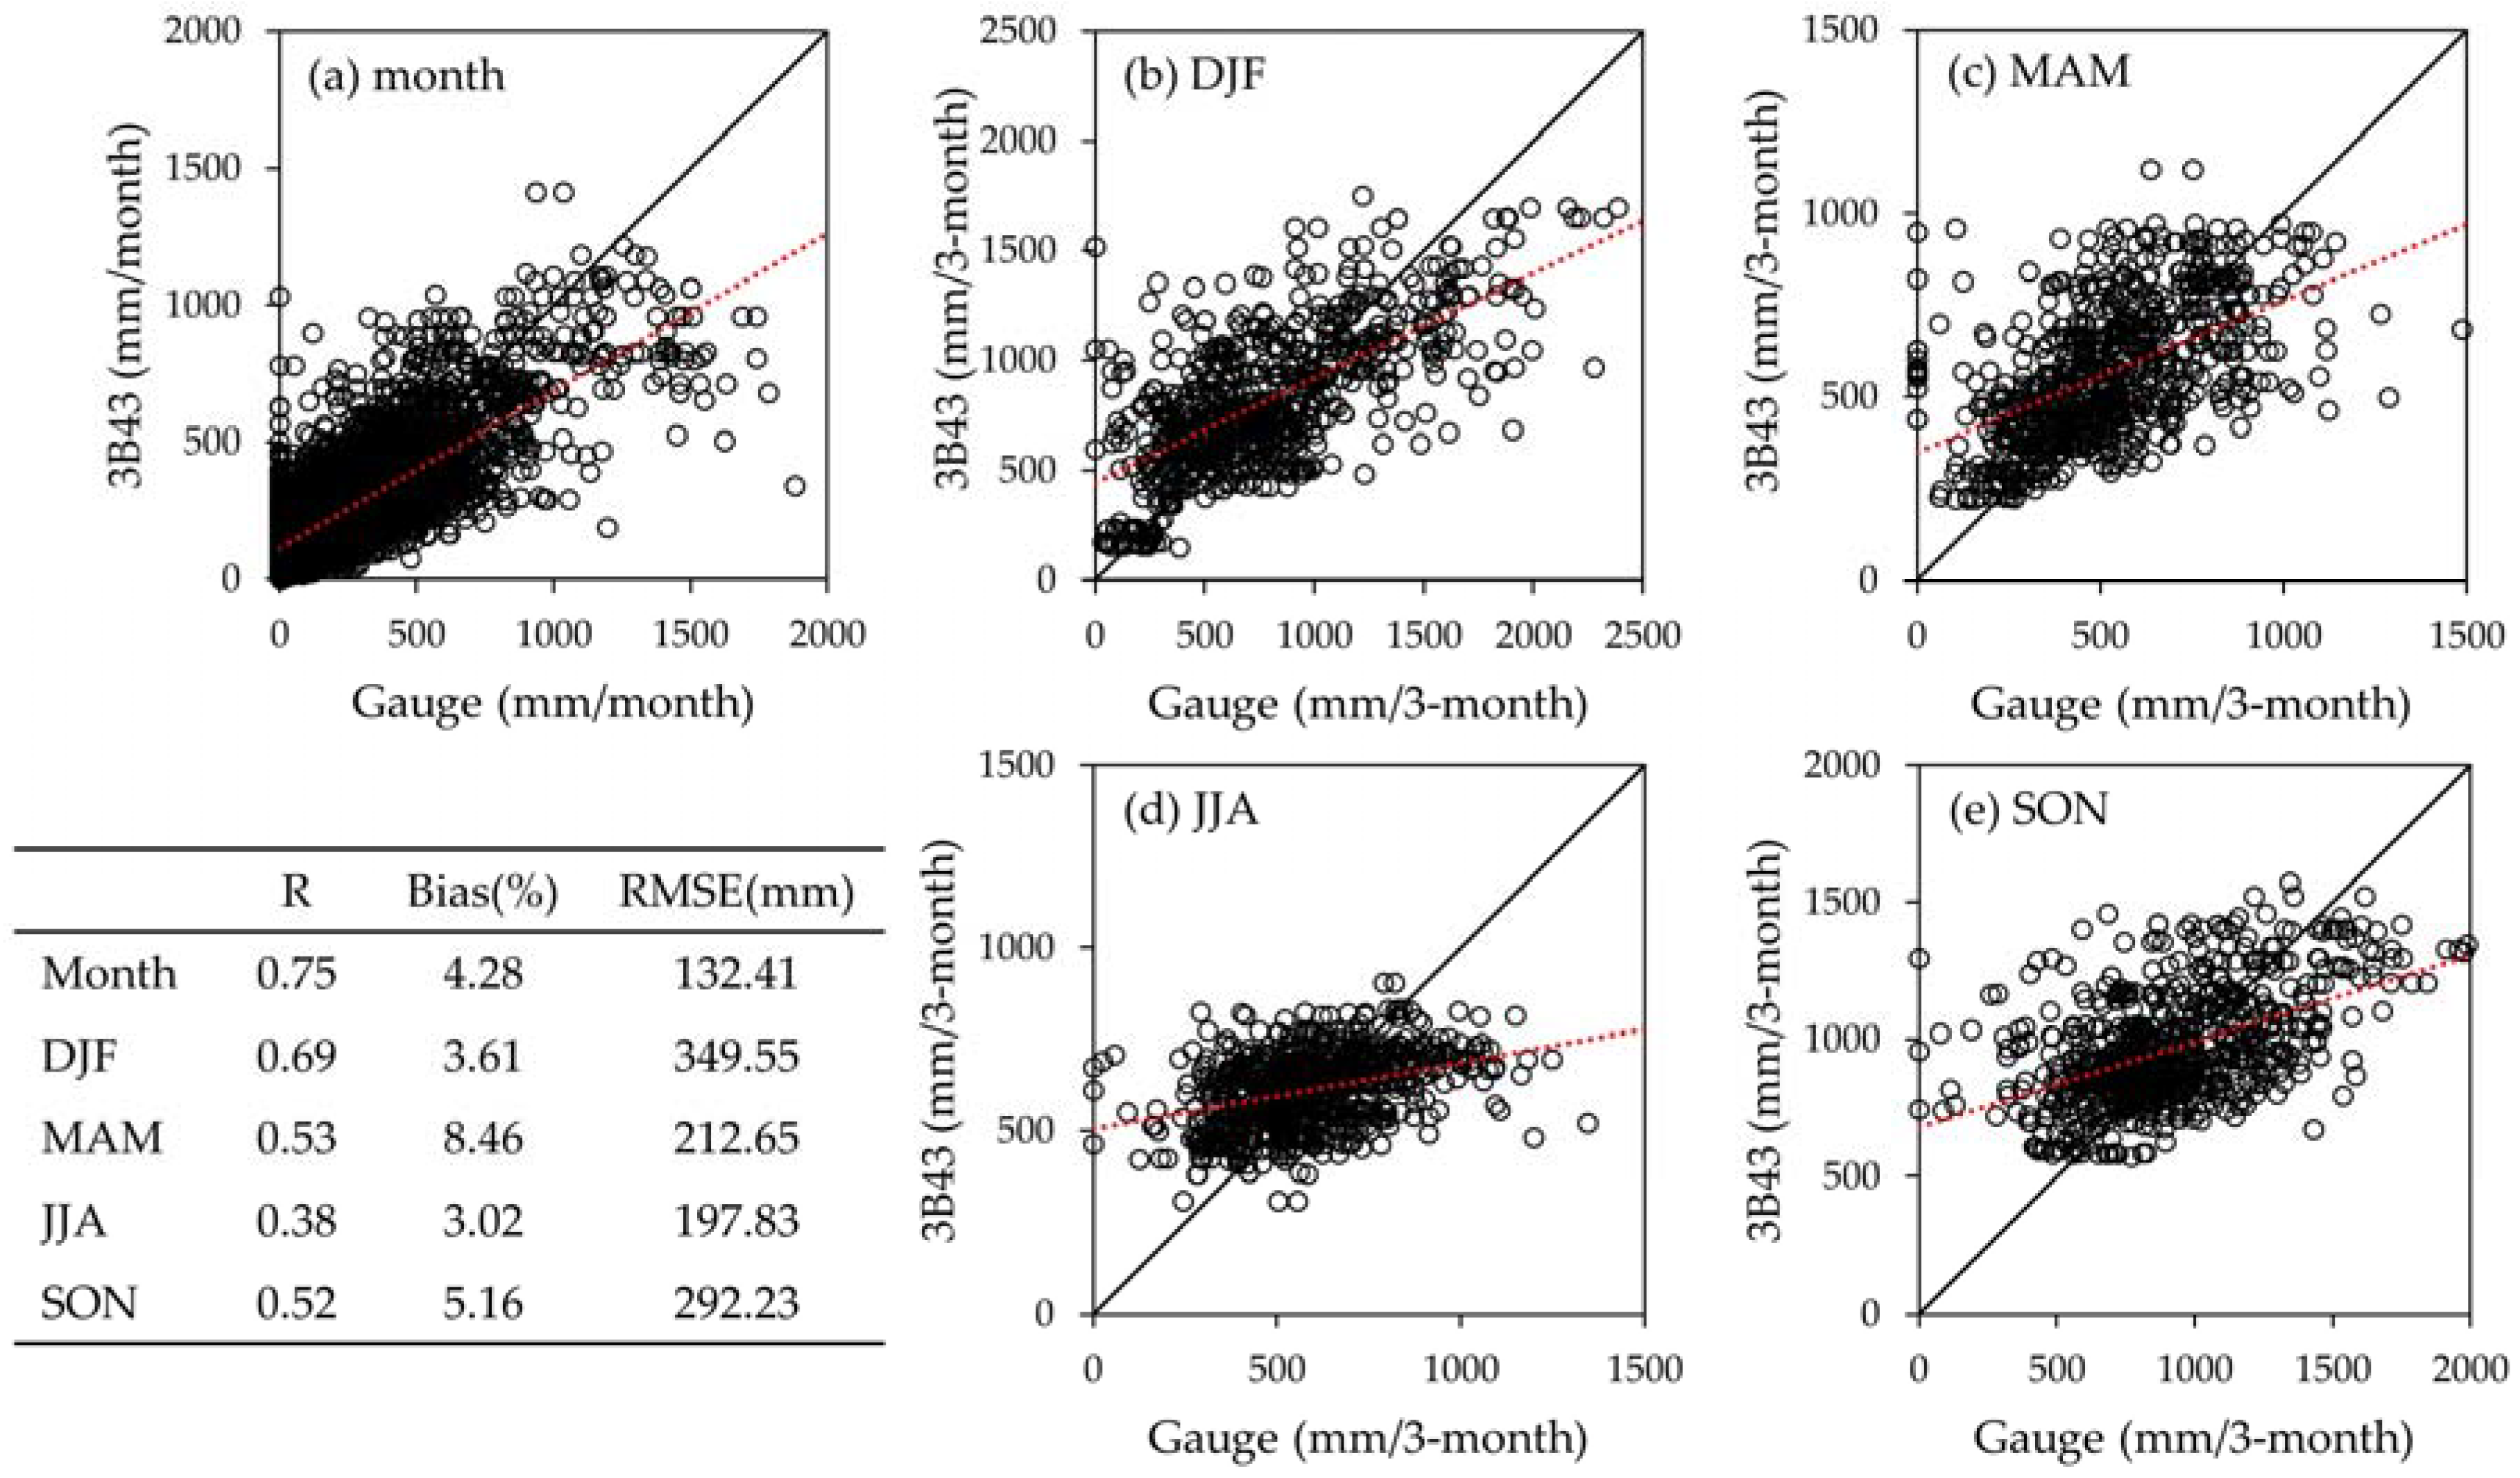
4.1. Overall Assessment
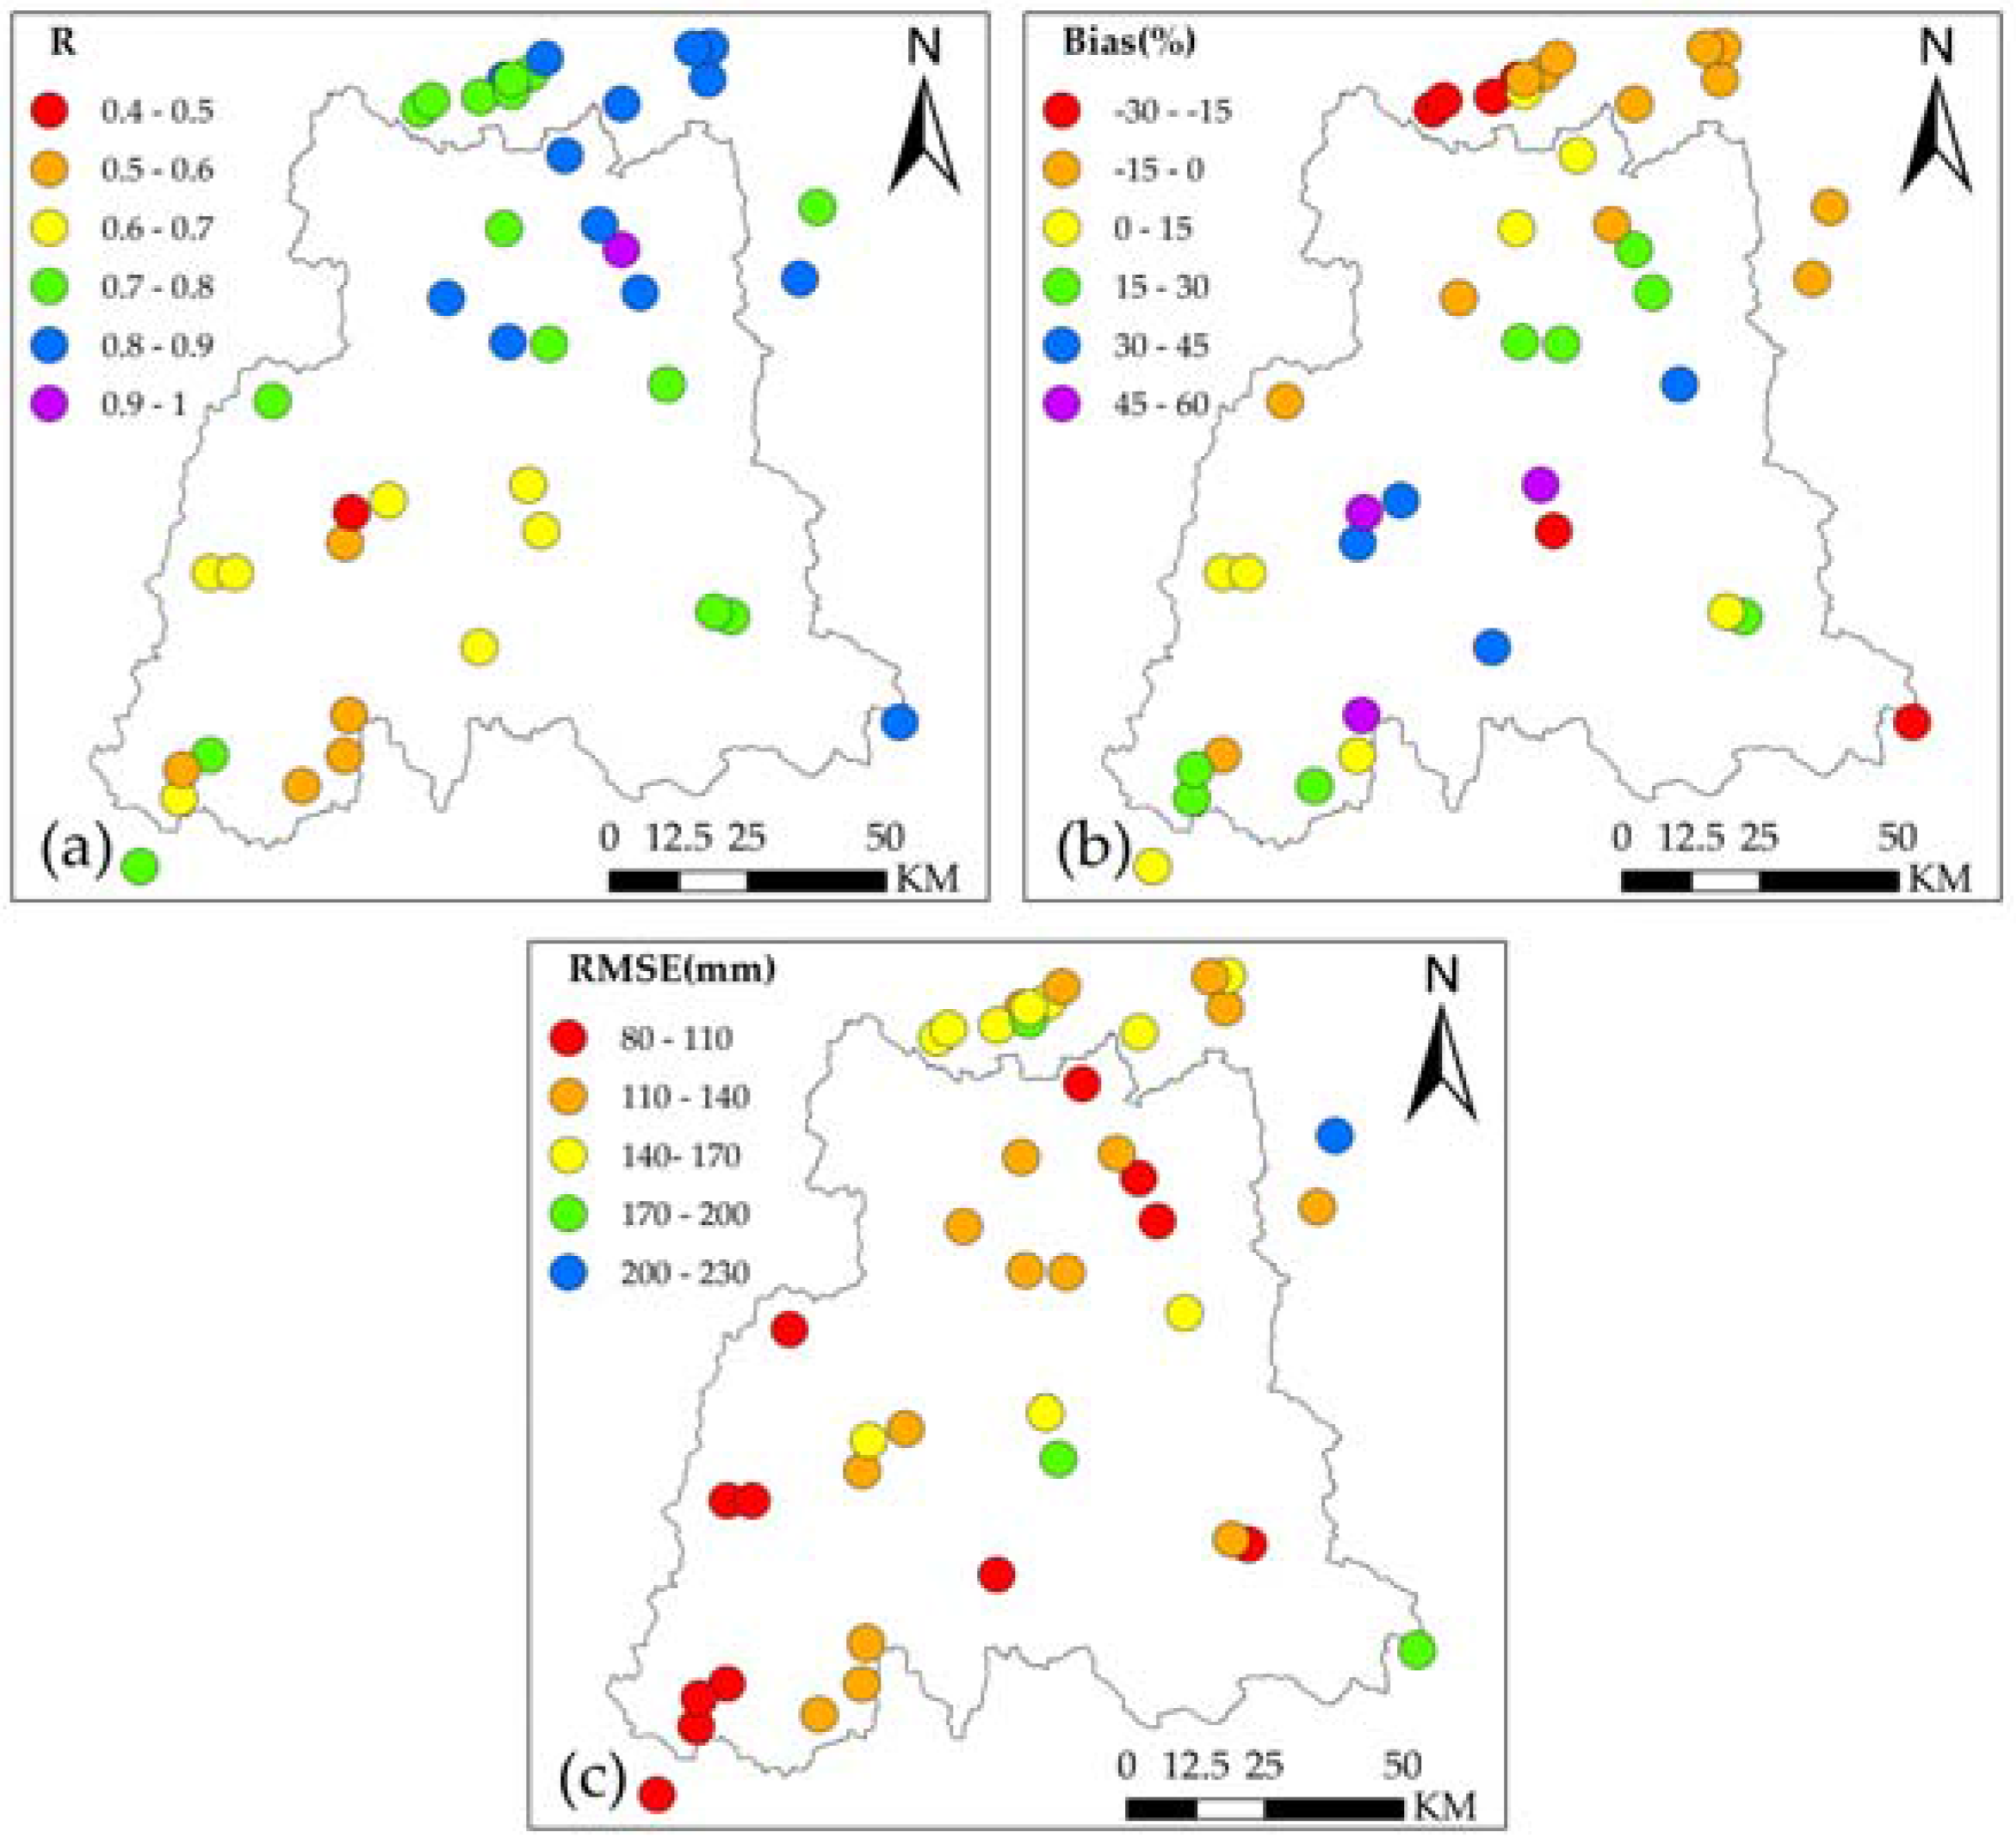
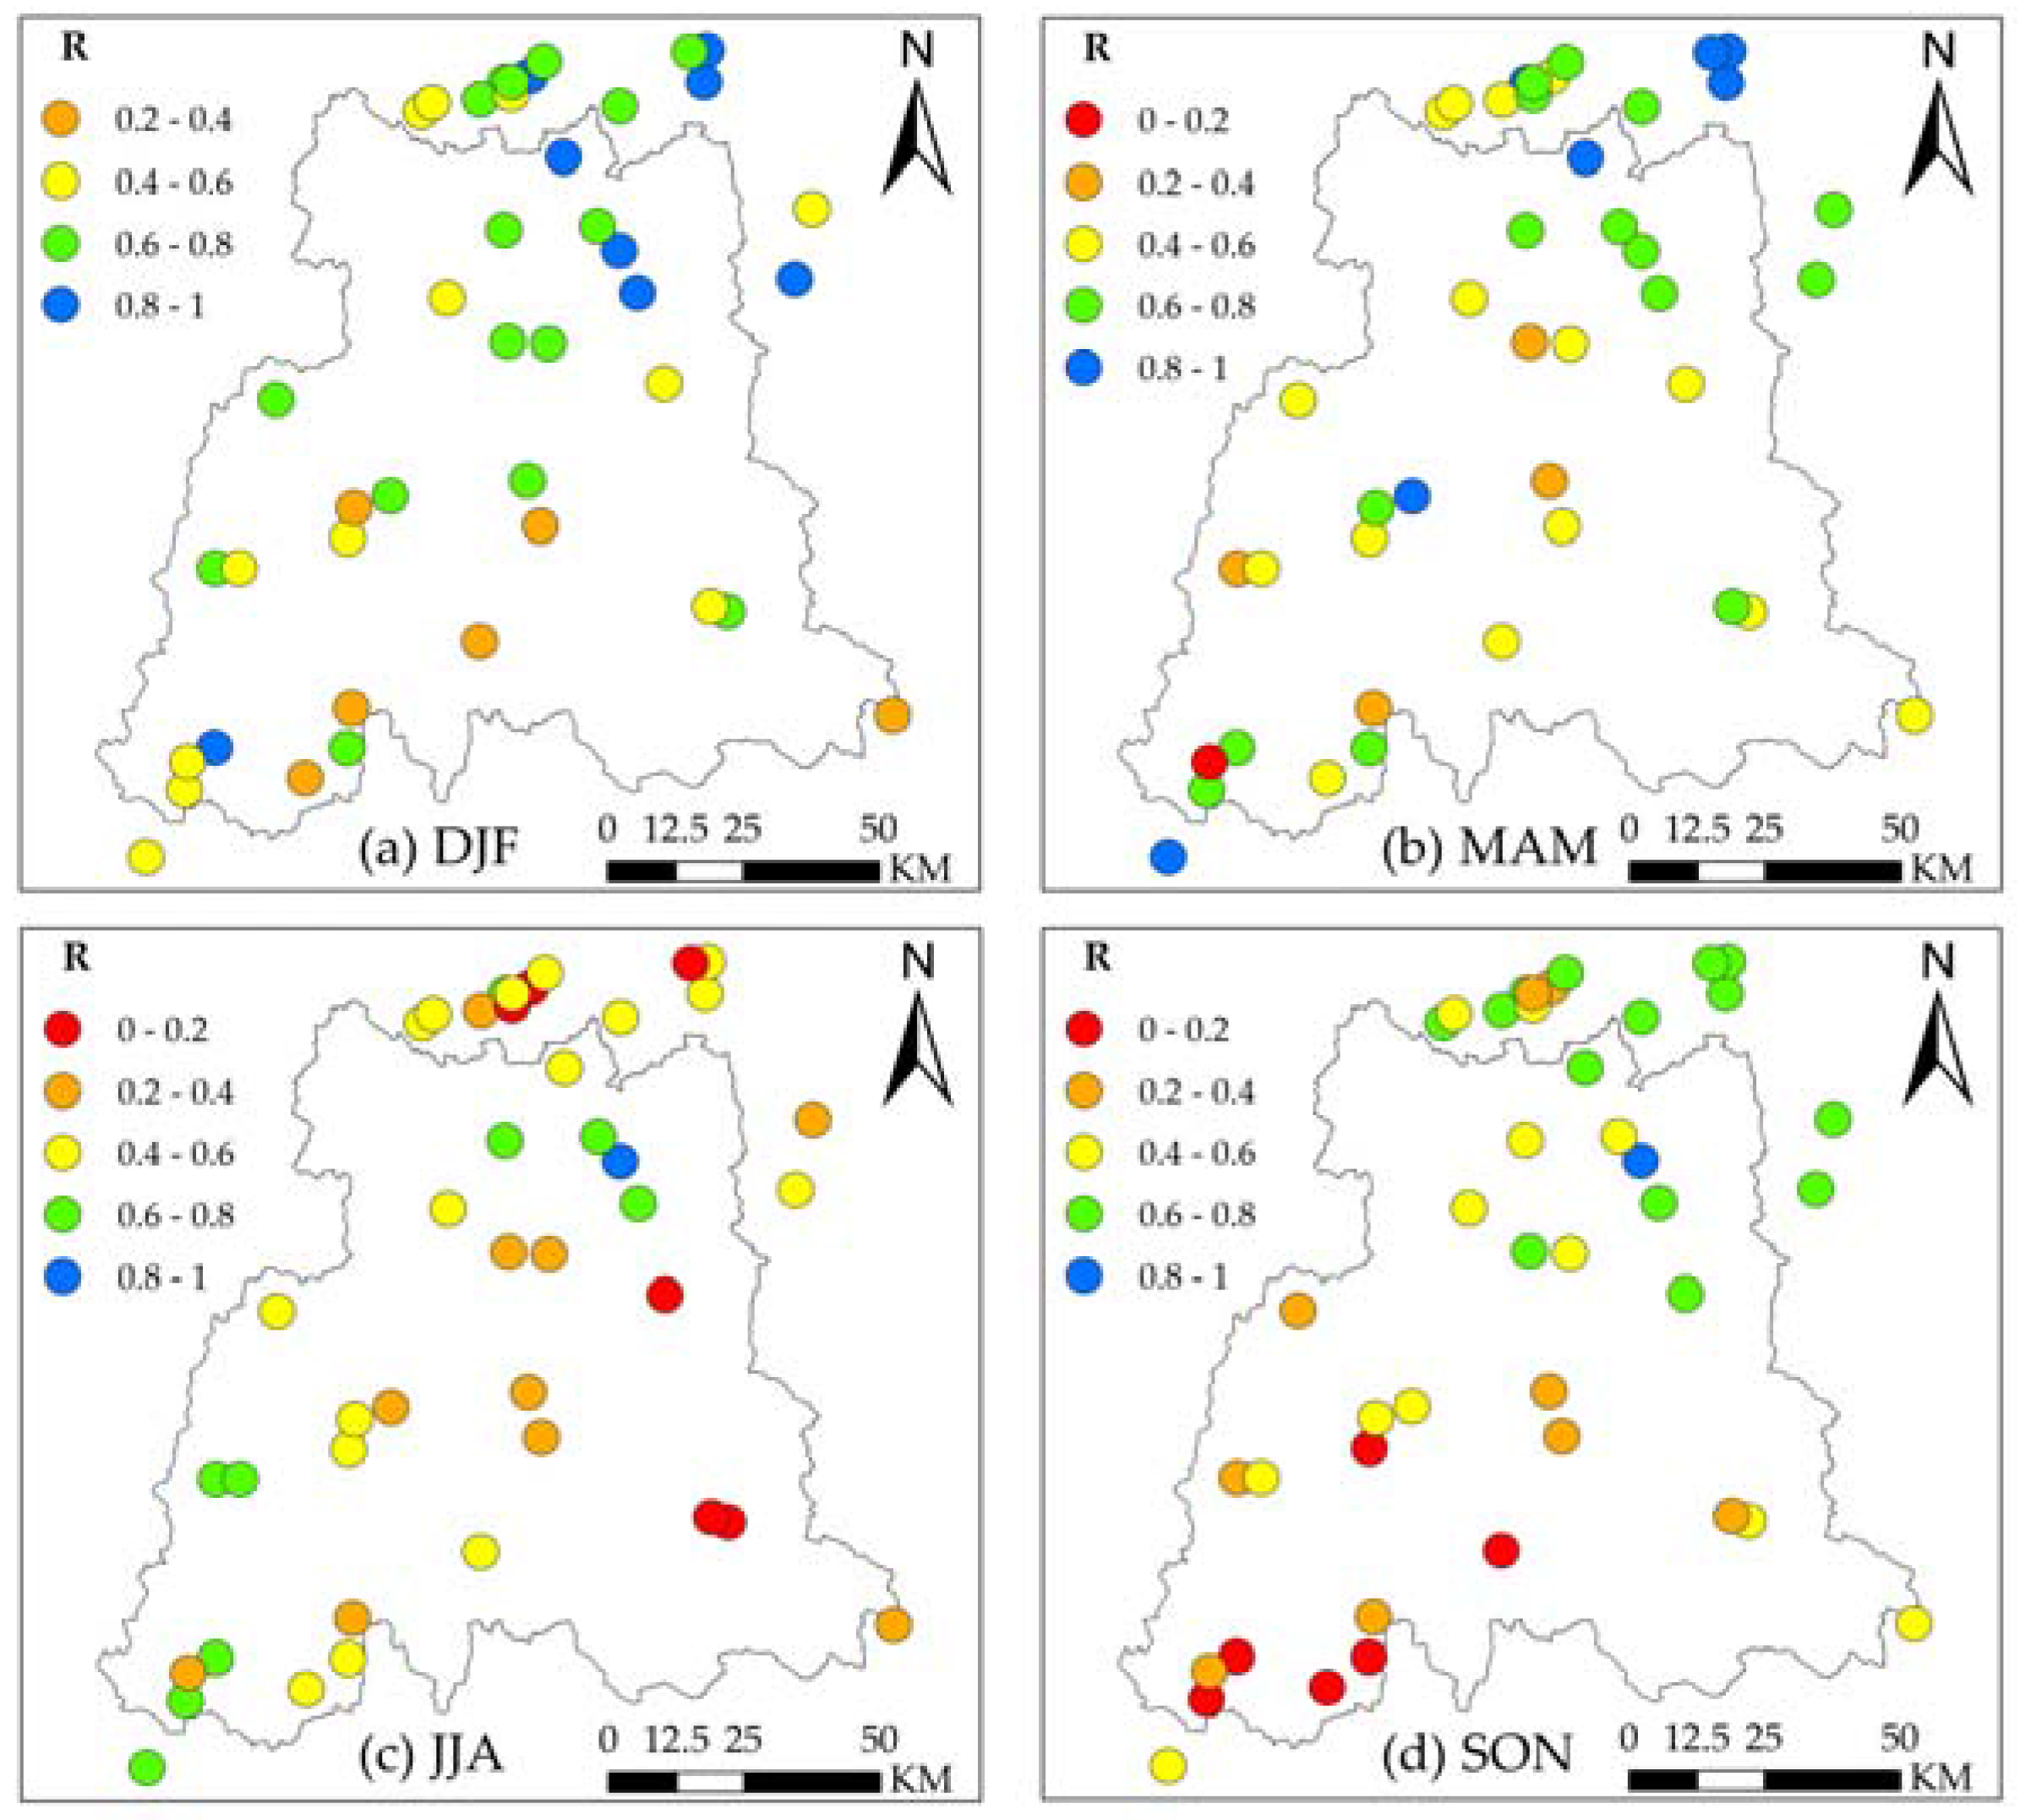
4.2. Spatial Assessment
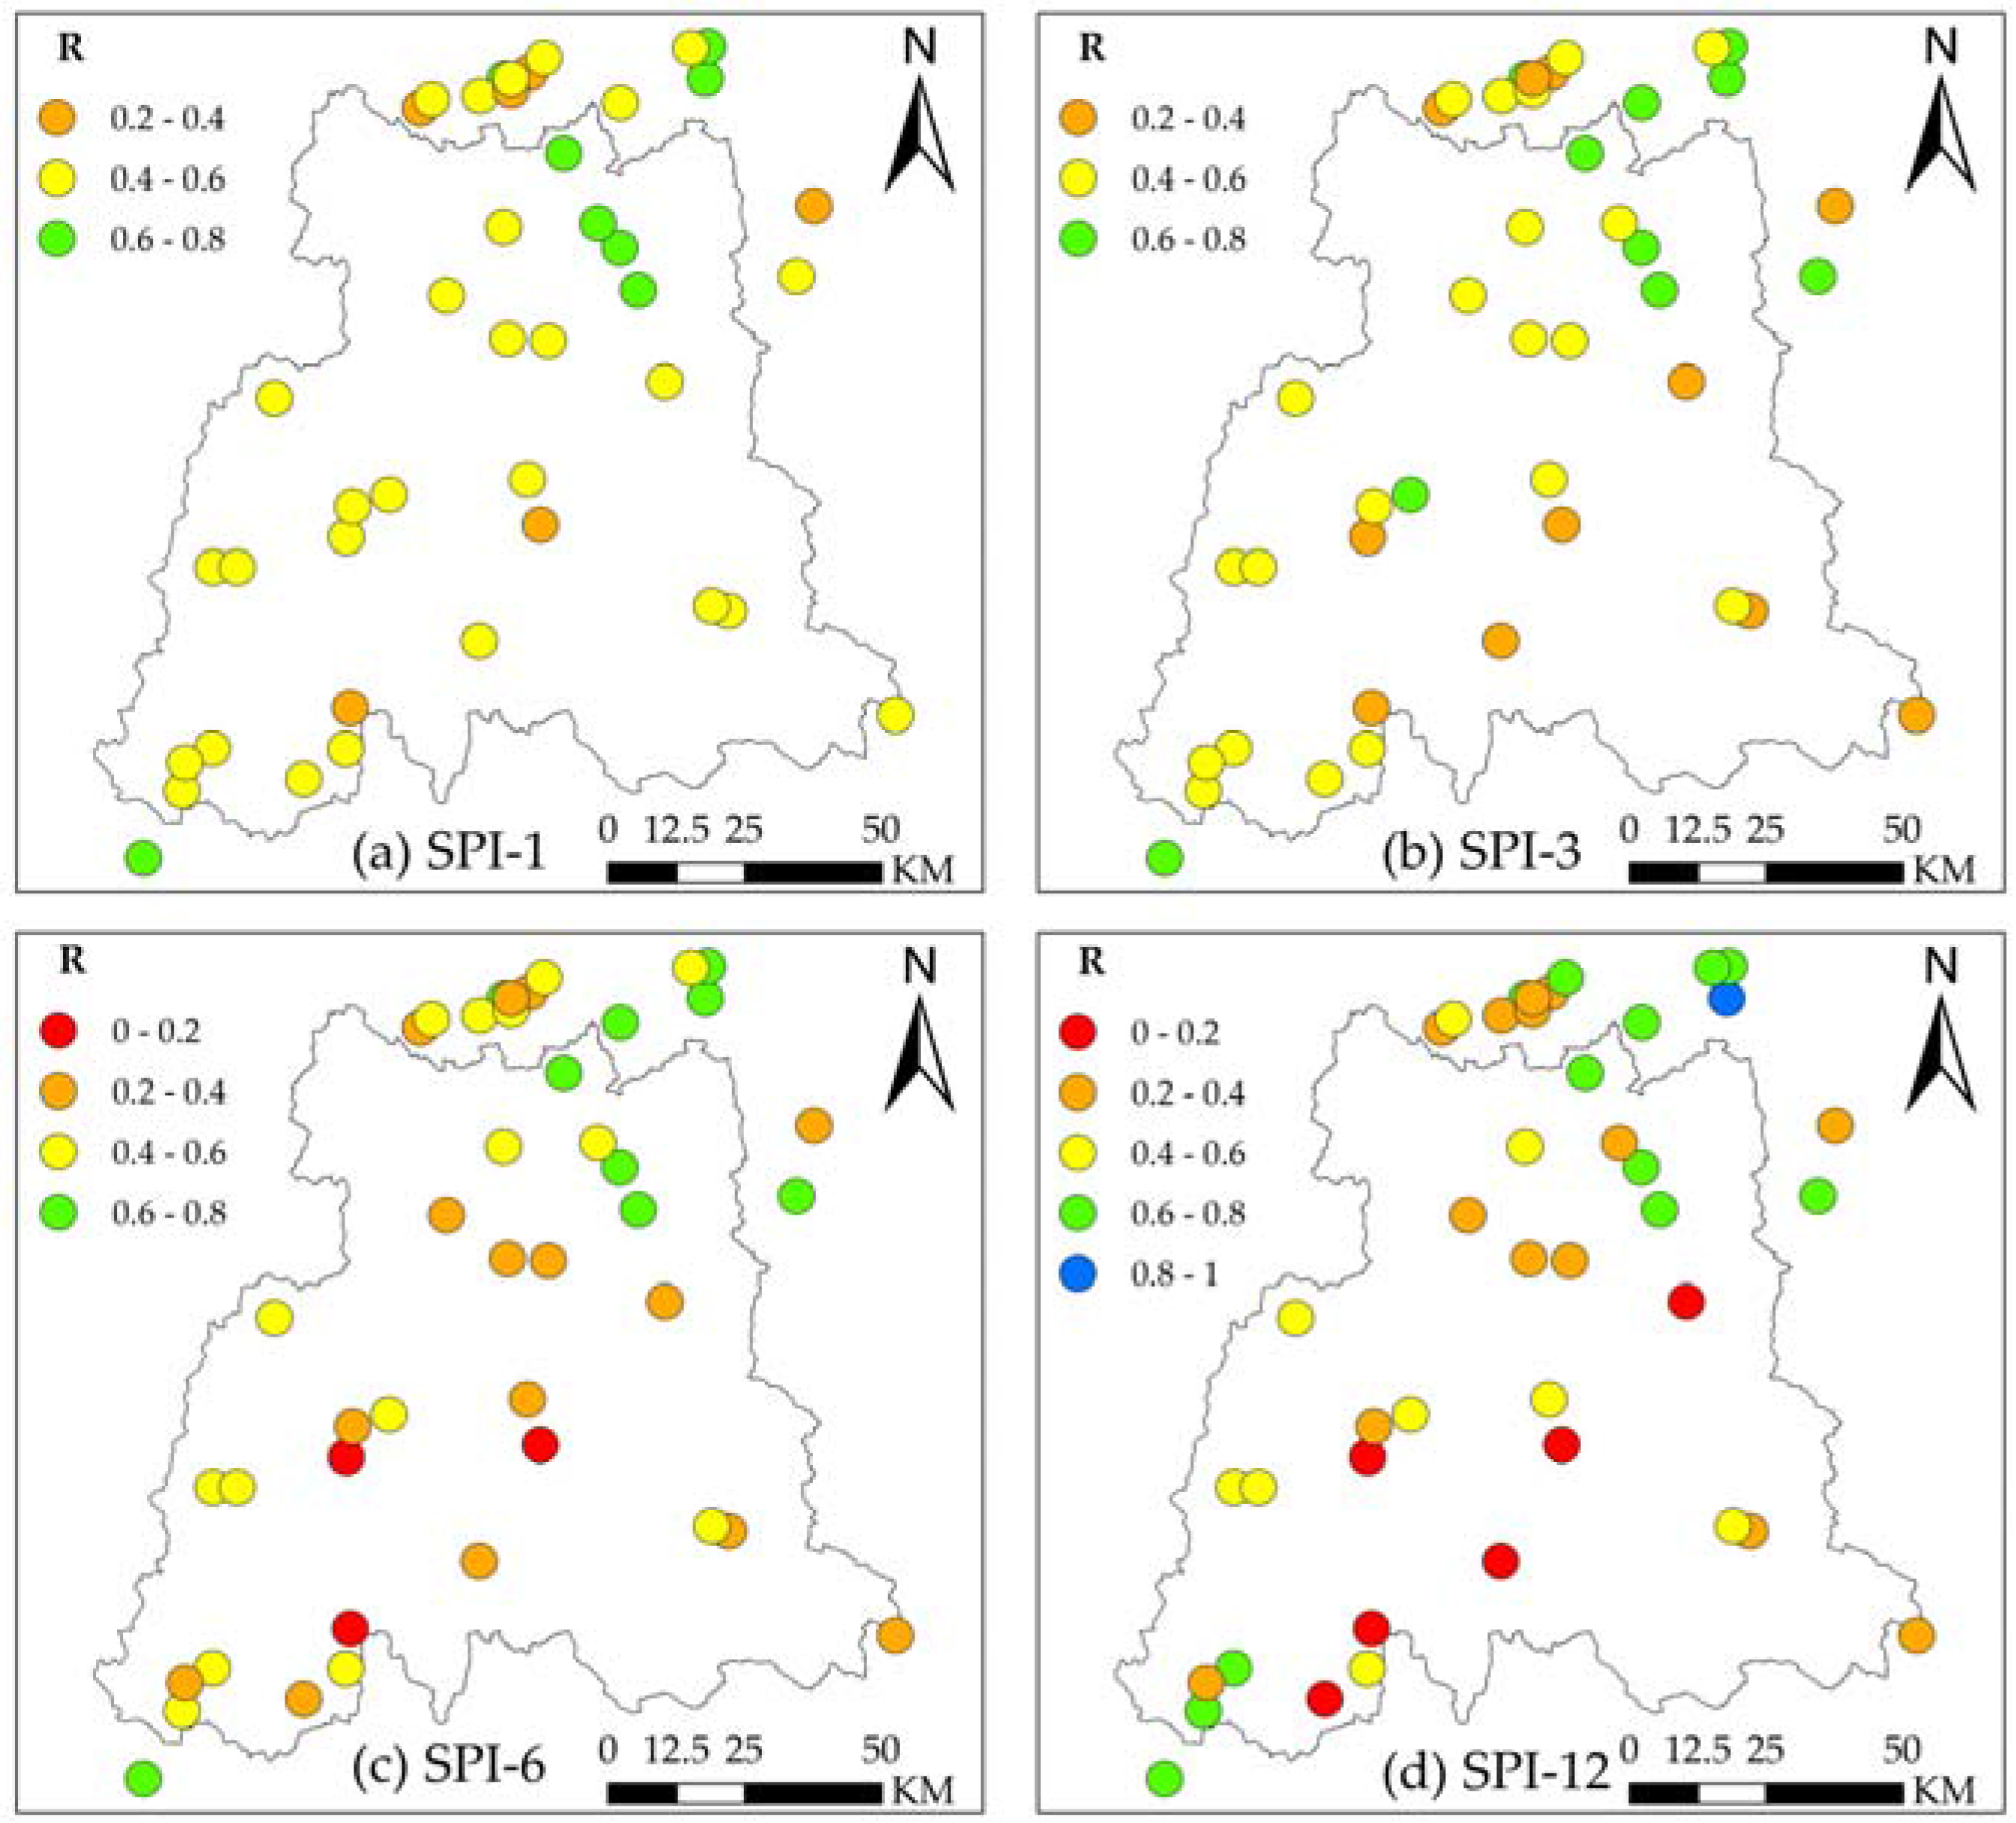
4.3. SPI Validation
4.4. The Drought 2014
5. Conclusions
- (1)
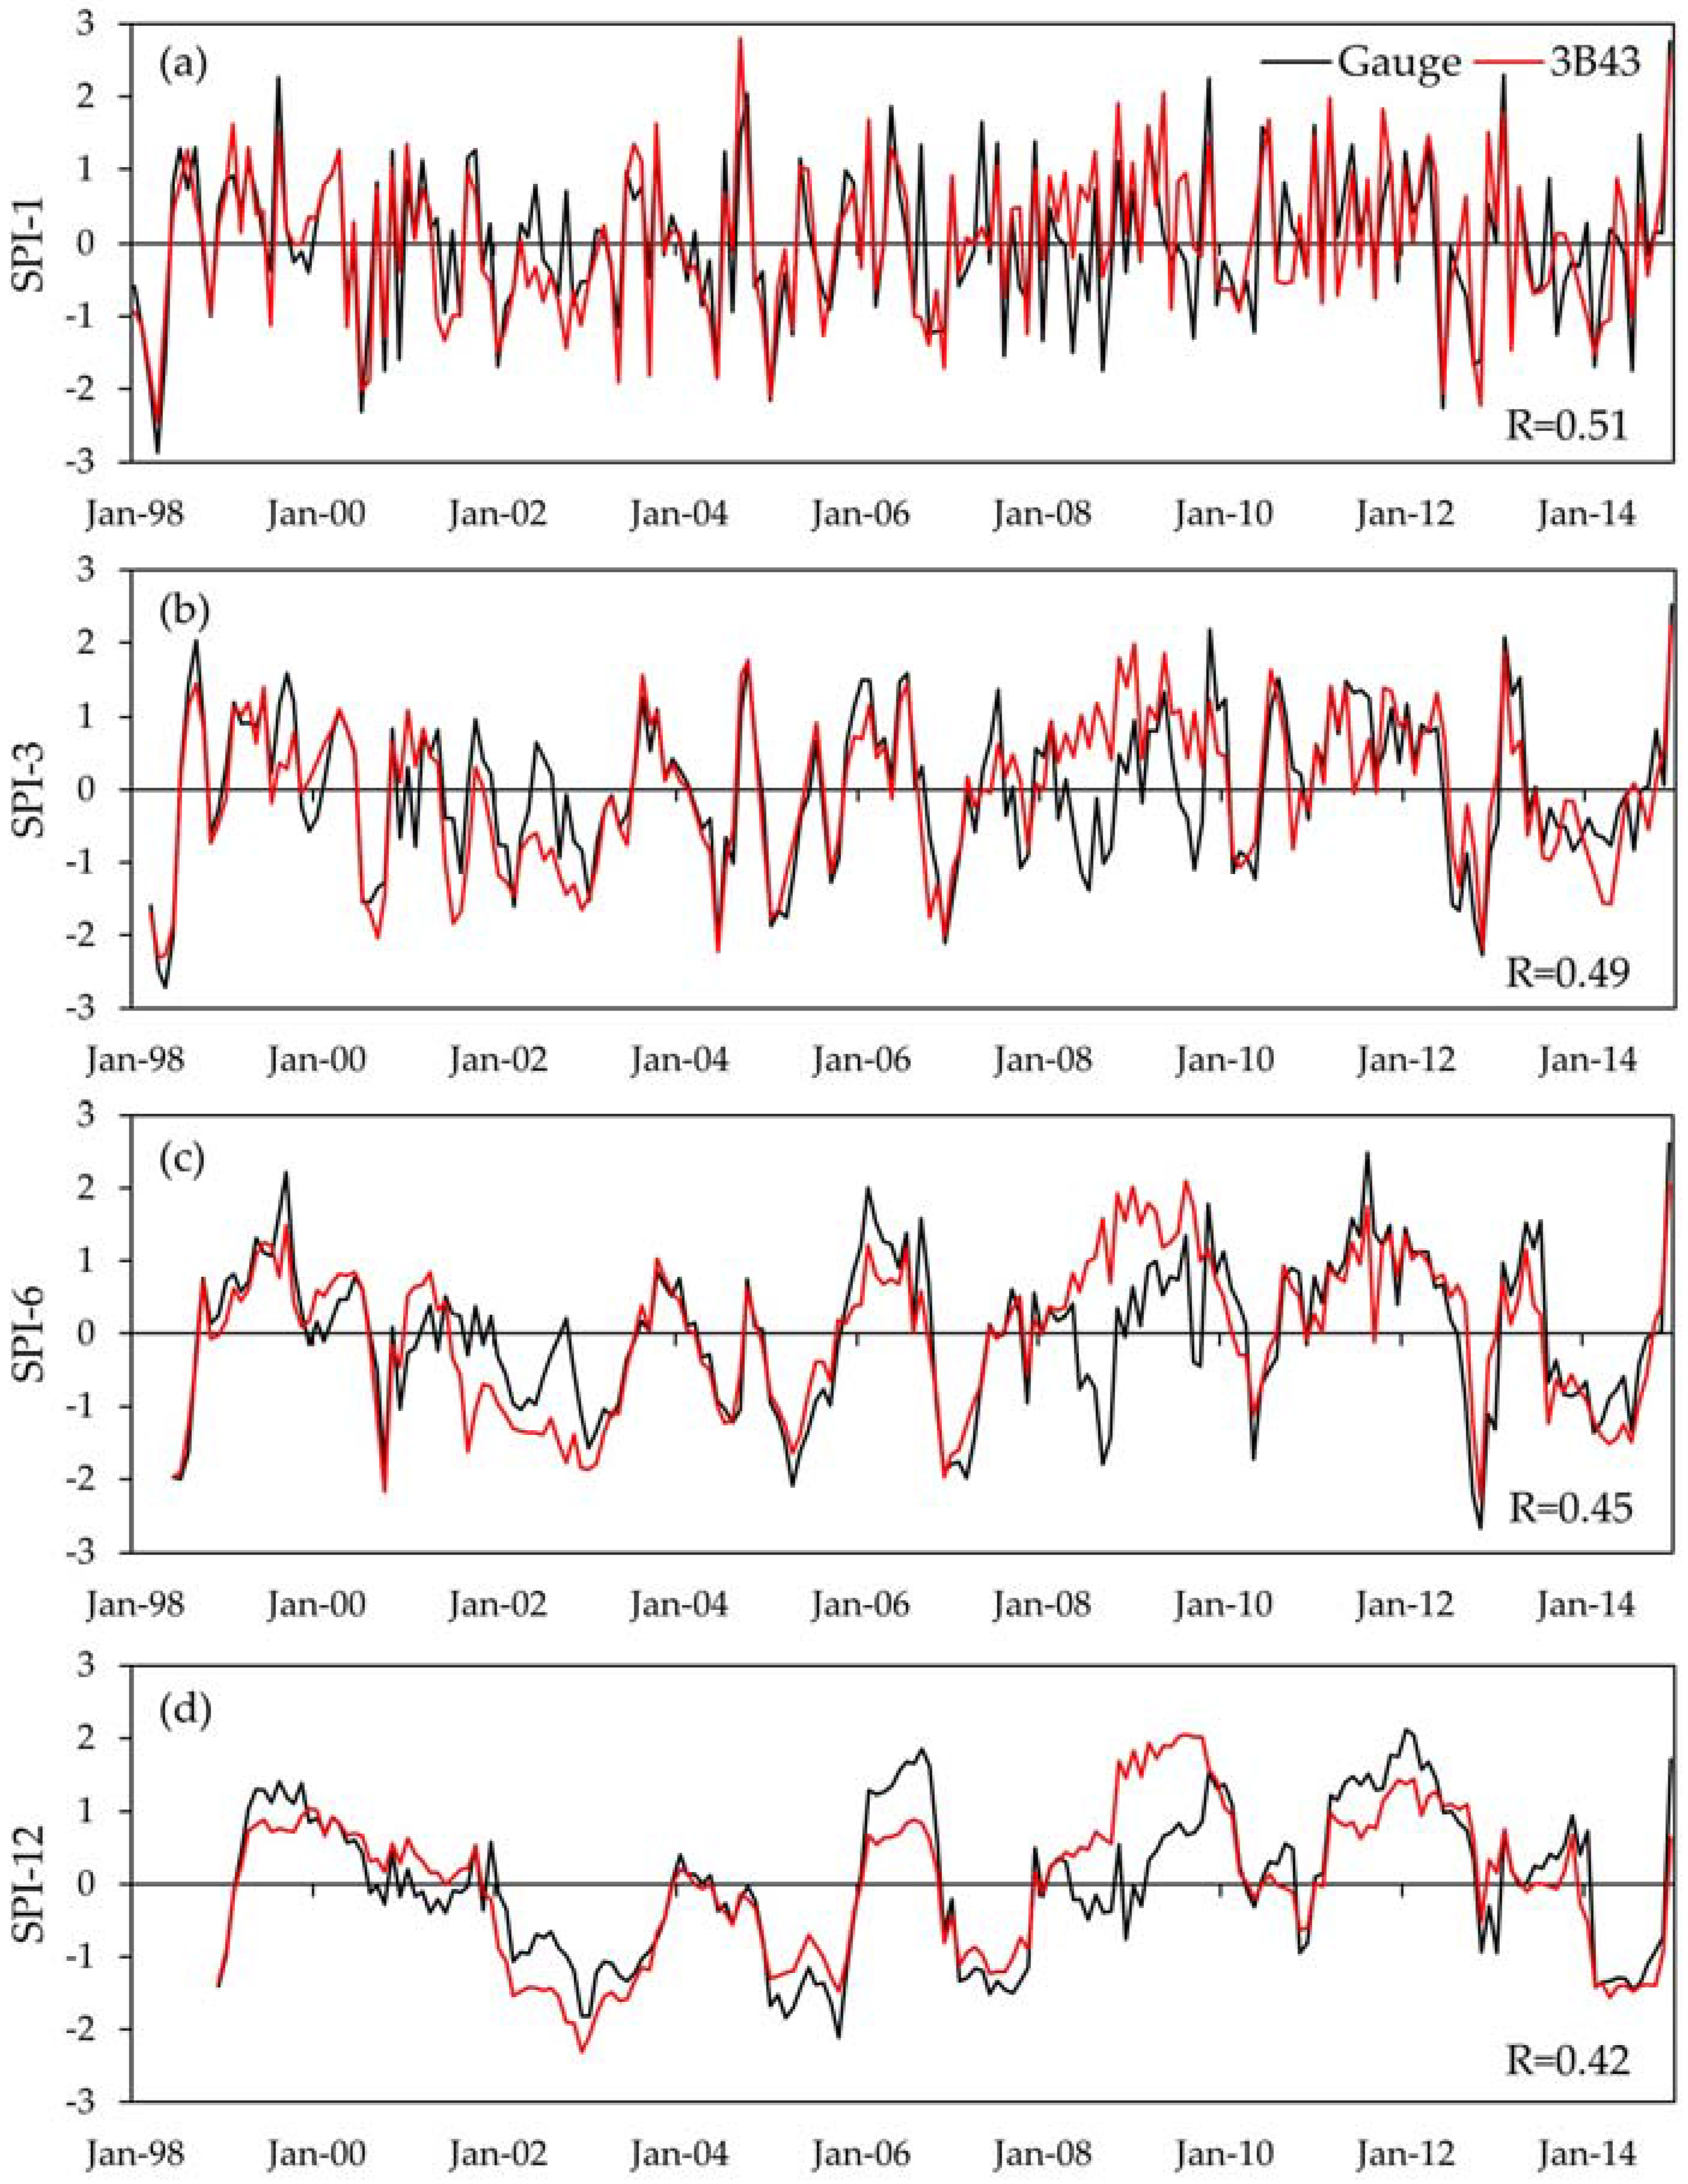
- The TMPA-3B43 performed well in estimating monthly precipitation over the KRB, with slight overestimations in total precipitation amount. Overall, the TMPA-3B43 showed better estimation during the northeast monsoon (wet season) compared to the southwest monsoon (dry season).
- (2)
- A distinct spatial pattern can be found for the R and bias in monthly and seasonal precipitation assessment. Better correlation between the TMPA-3B43 and ground-based observations can be observed in the northern and north-eastern parts of the basin. Larger bias was found in central, southern and south-eastern regions which are characterized by high topography.
- (3)
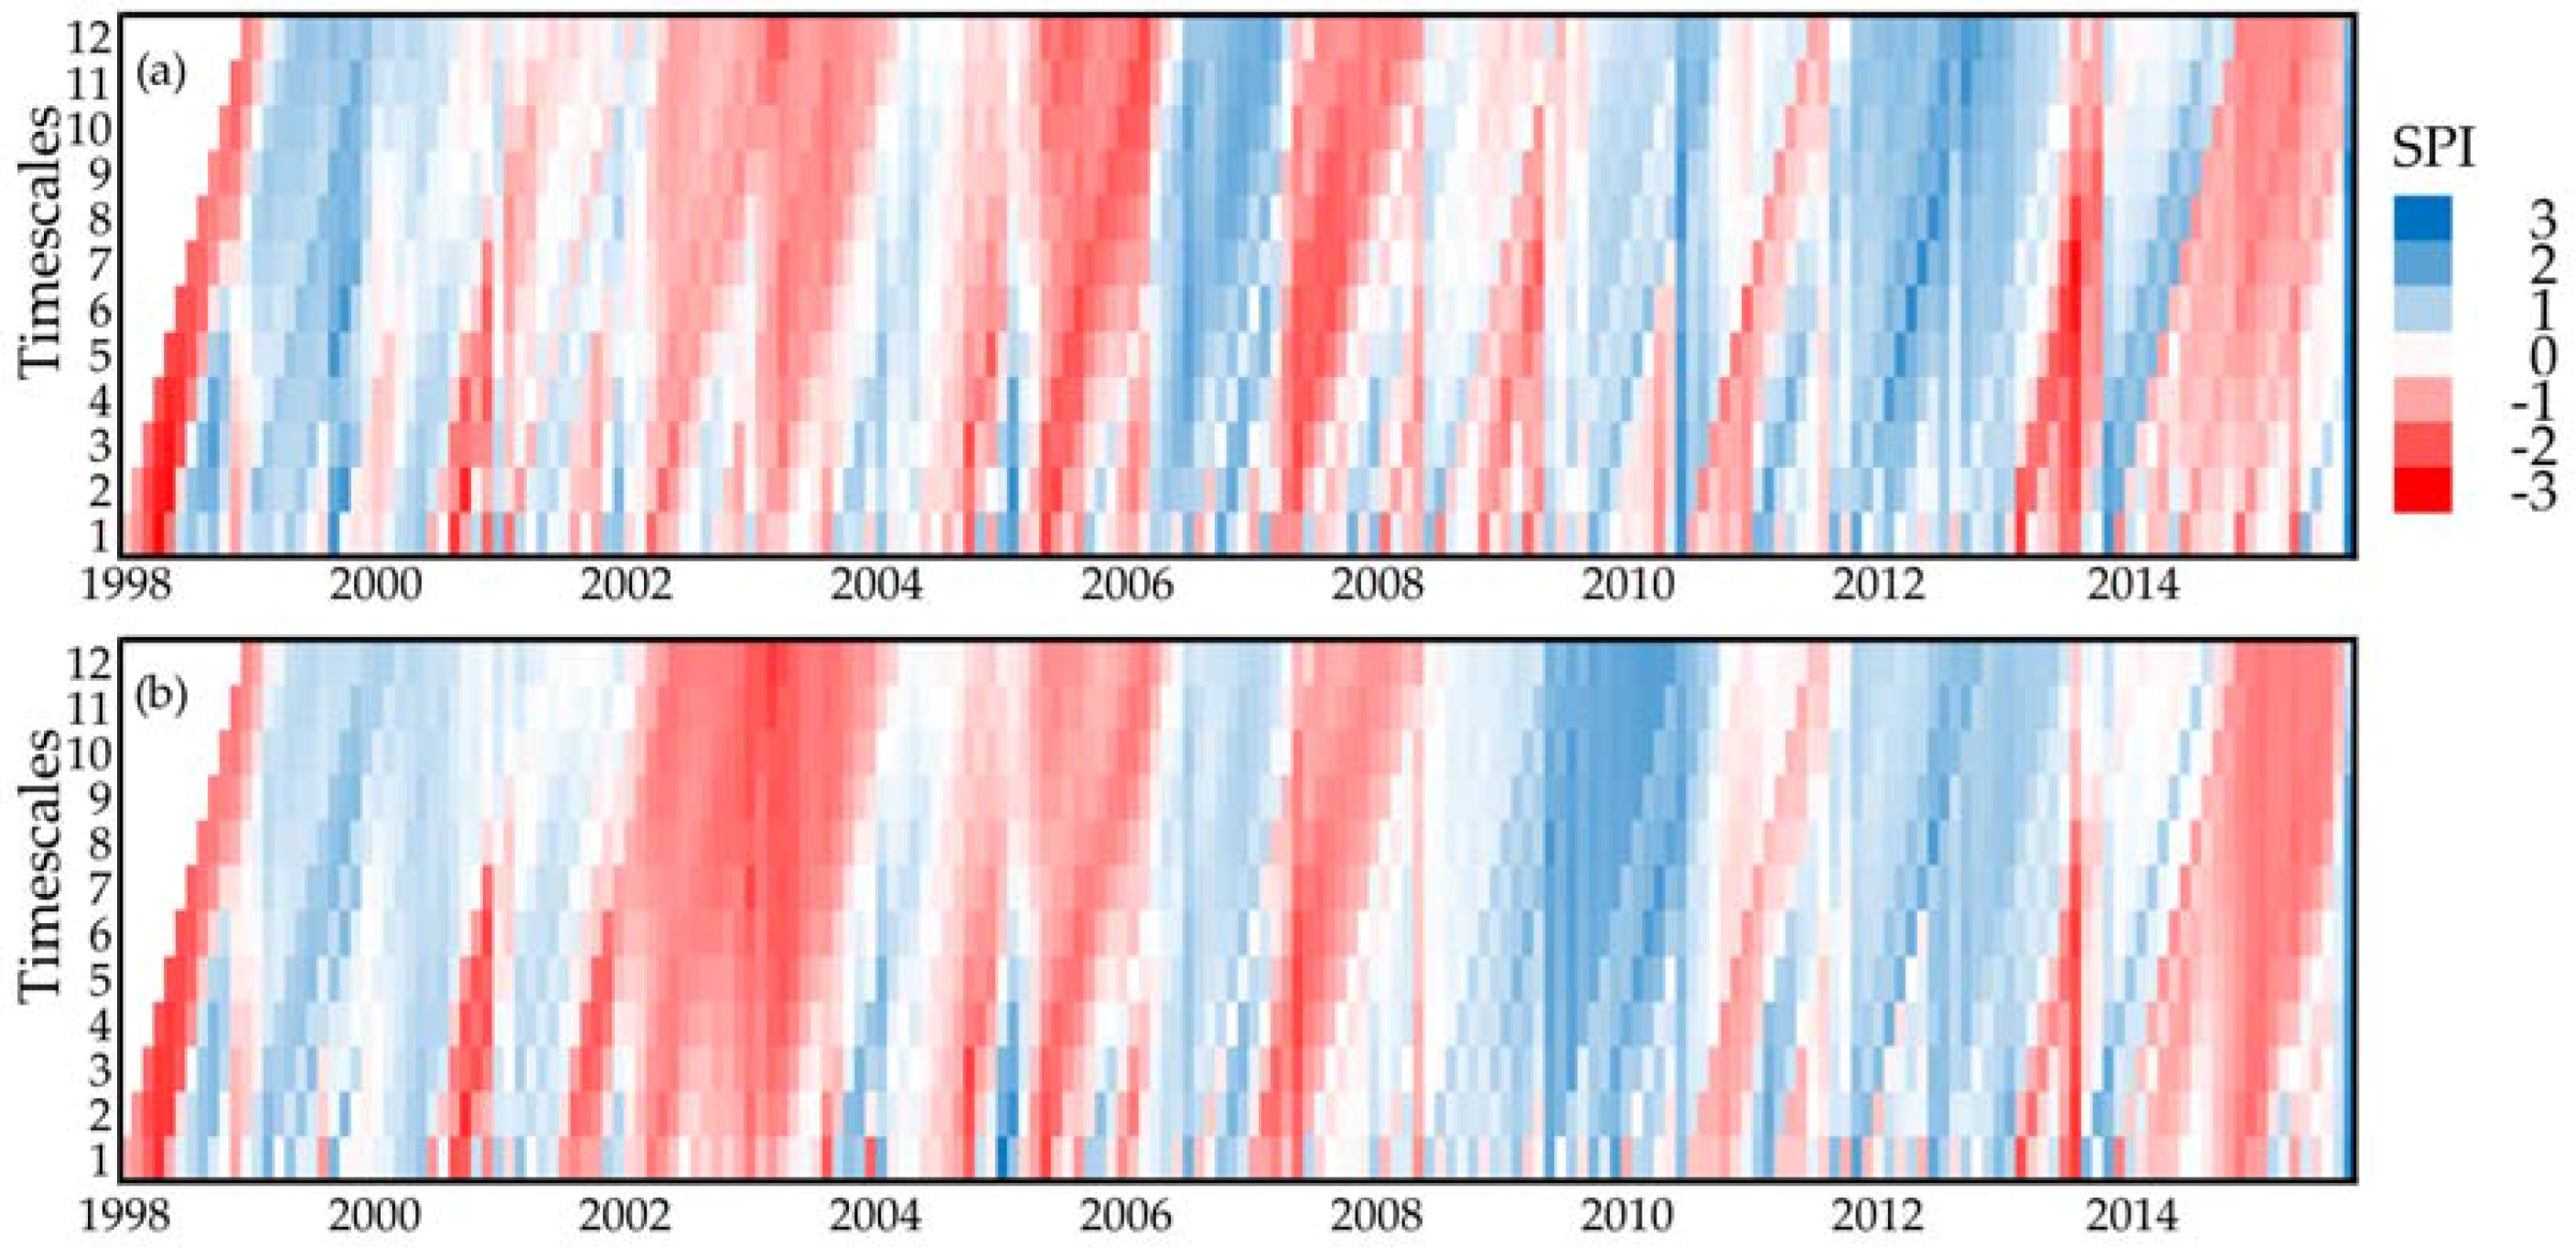
- The reliability of the TMPA-3B43 in SPI measurement decreases with longer time-scales (e.g., twelve months), showing that the product is more suitable to assess short-term meteorological droughts in Malaysia. Moreover, the drought events measured by the TMPA-3B43 are more intense than the observations one.
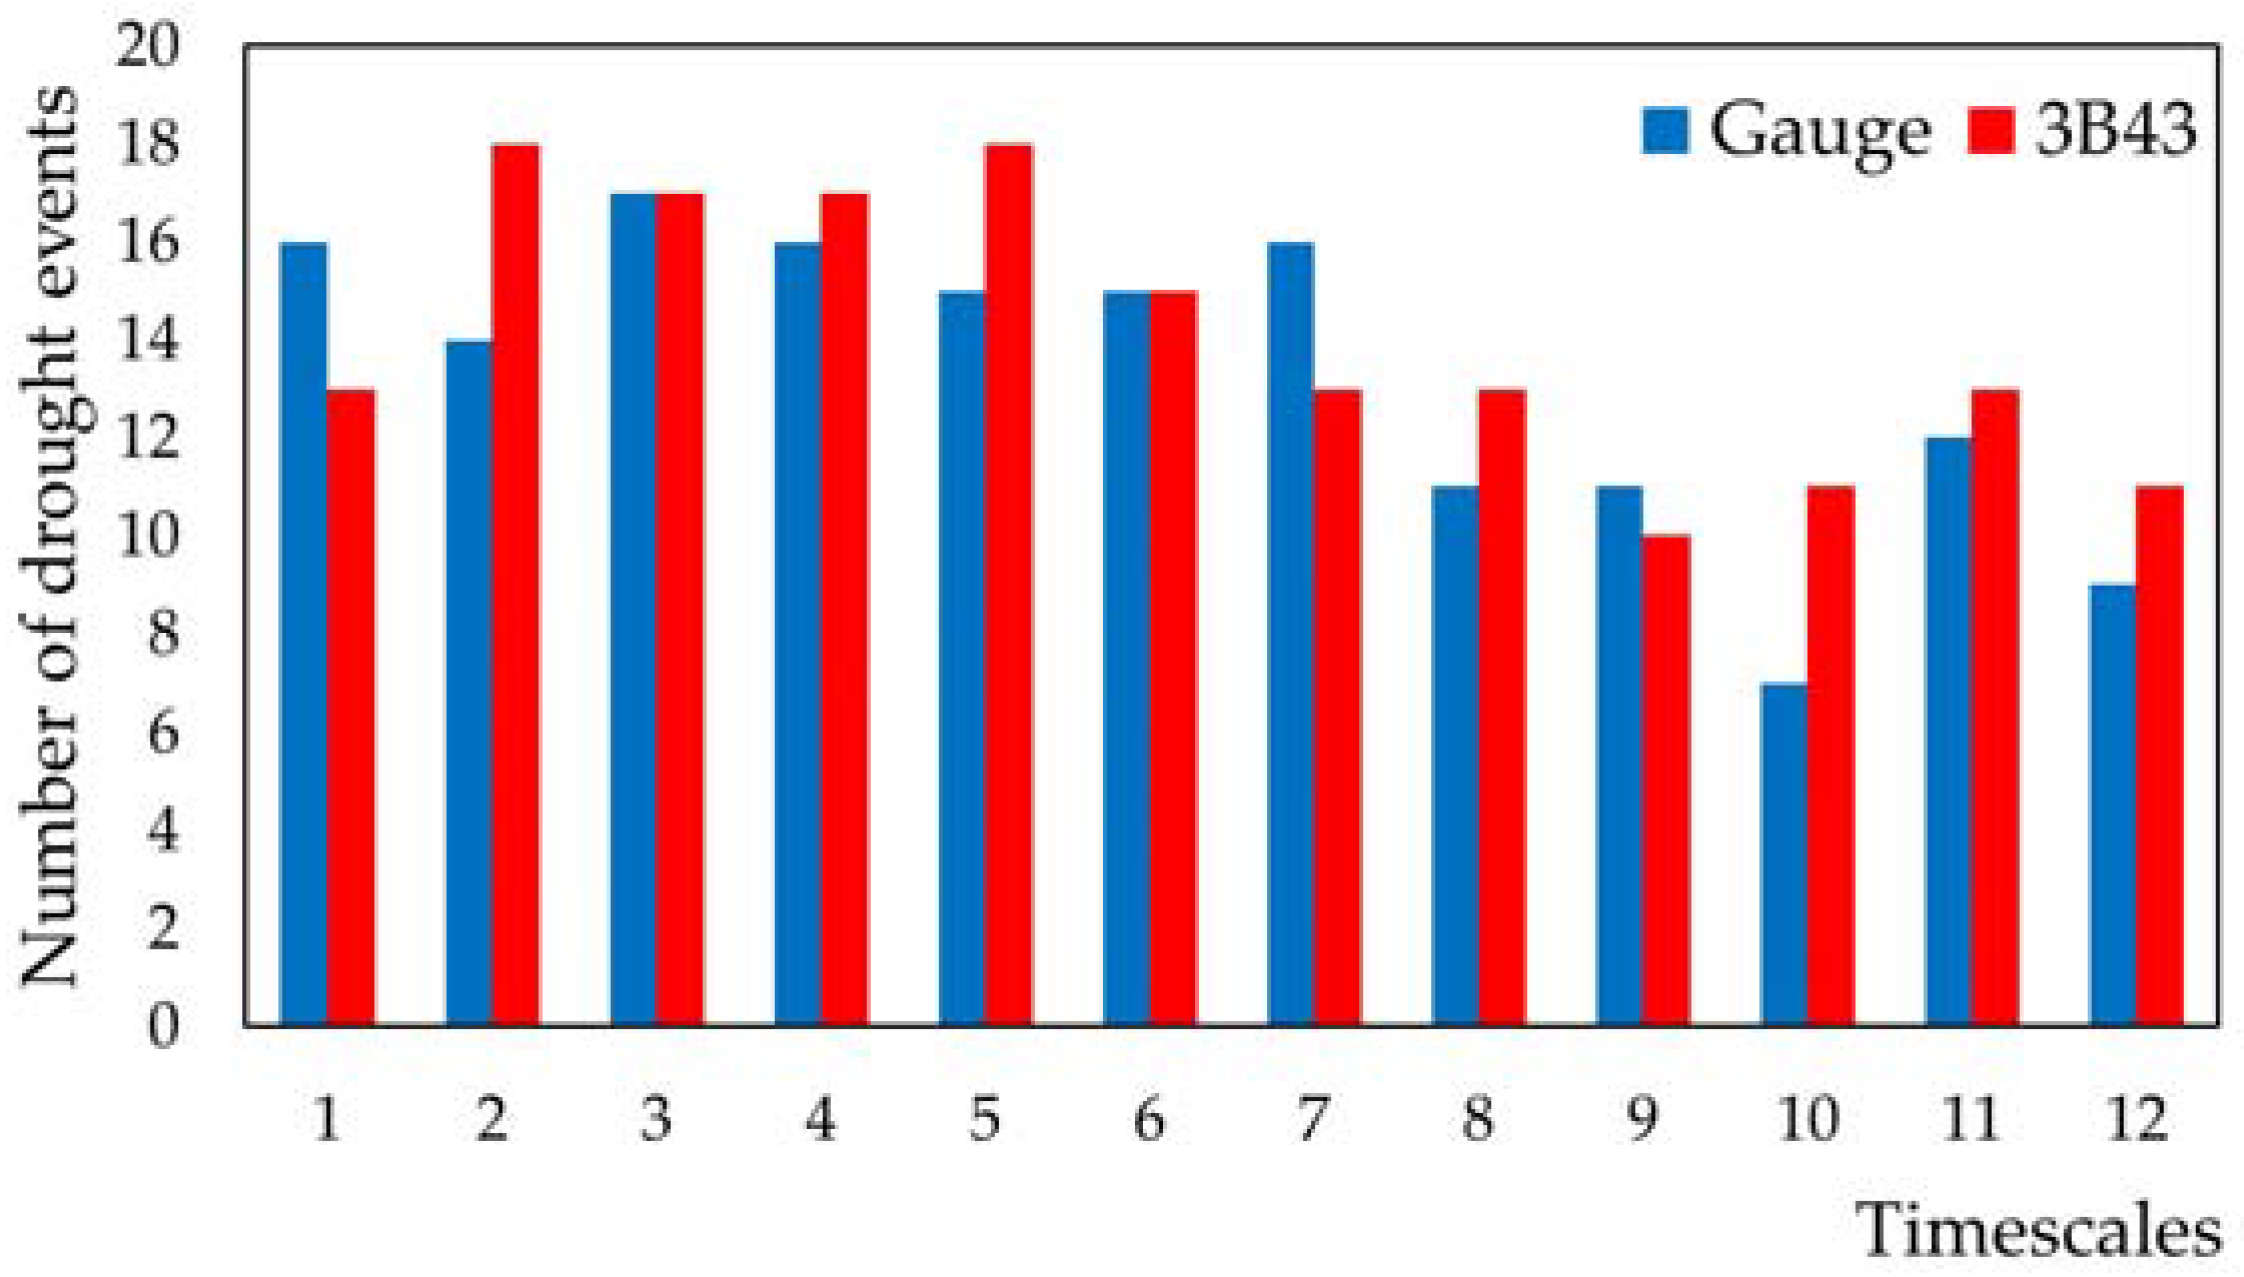
- (4)
- More severe drought events were found at shorter SPI time-scales (e.g., SPI-1). The TMPA-3B43 matched well in identifying most of the drought events in the KRB at various time-scales, except for the 2008–2009 period. However, the same number of drought events was observed at the SPI-3 and SPI-6 time-scales.
Supplementary Materials
Acknowledgments
Author Contributions
Conflicts of Interest
References
- Dai, A.G. Drought under global warming: A review. Wiley Interdiscip. Rev. Clim. Chang. 2011, 2, 45–65. [Google Scholar] [CrossRef]
- Bonal, D.; Burban, B.; Stahl, C.; Wagner, F.; Hérault, B. The response of tropical rainforests to drought—Lessons from recent research and future prospects. Ann. For. Sci. 2016, 73, 27–44. [Google Scholar] [CrossRef] [PubMed] [Green Version]
- Tan, M.L.; Ficklin, D.L.; Ibrahim, A.L.; Yusop, Z. Impacts and uncertainties of climate change on streamflow of the Johor River Basin, Malaysia using a CMIP5 General Circulation Model ensemble. J. Water Clim. Chang. 2014, 5, 676–695. [Google Scholar] [CrossRef]
- Laan-Luijkx, I.T.; Velde, I.R.; Krol, M.C.; Gatti, L.V.; Domingues, L.G.; Correia, C.S.C.; Miller, J.B.; Gloor, M.; Leeuwen, T.T.; Kaiser, J.W.; et al. Response of the Amazon carbon balance to the 2010 drought derived with carbontracker South America. Glob. Biogeochem. Cycles 2015, 29, 1092–1108. [Google Scholar] [CrossRef]
- Corlett, R.T. The impacts of droughts in tropical forests. Trends Plant Sci. 2016, 21, 584–593. [Google Scholar] [CrossRef] [PubMed]
- Thomas, J.; Prasannakumar, V. Temporal analysis of rainfall (1871–2012) and drought characteristics over a tropical monsoon-dominated state (Kerala) of India. J. Hydrol. 2016, 534, 266–280. [Google Scholar] [CrossRef]
- Lewis, S.L.; Brando, P.M.; Phillips, O.L.; van der Heijden, G.M.F.; Nepstad, D. The 2010 Amazon drought. Science 2011, 331, 554. [Google Scholar] [CrossRef] [PubMed]
- Nakagawa, M.; Tanaka, K.; Nakashizuka, T.; Ohkubo, T.; Kato, T.; Maeda, T.; Sato, K.; Miguchi, H.; Nagamasu, H.; Ogino, K.; et al. Impact of severe drought associated with the 1997–1998 El Nino in a tropical forest in Sarawak. J. Trop. Ecol. 2000, 16, 355–367. [Google Scholar] [CrossRef]
- Field, R.D.; van der Werf, G.R.; Fanin, T.; Fetzer, E.J.; Fuller, R.; Jethva, H.; Levy, R.; Livesey, N.J.; Luo, M.; Torres, O.; et al. Indonesian fire activity and smoke pollution in 2015 show persistent nonlinear sensitivity to El Nino-induced drought. Proc. Natl. Acad. Sci. USA 2016, 113, 9204–9209. [Google Scholar] [CrossRef] [PubMed]
- Marengo, J.A.; Alves, L.M.; Soares, W.R.; Rodriguez, D.A.; Camargo, H.; Riveros, M.P.; Pabló, A.D. Two contrasting severe seasonal extremes in tropical South America in 2012: Flood in amazonia and drought in northeast Brazil. J. Clim. 2013, 26, 9137–9154. [Google Scholar] [CrossRef]
- McKee, T.B.; Doesken, N.J.; Kleist, J. The relationship of drought frequency and duration to time scales. In Proceedings of the 8th Conference on Applied Climatology, Anaheim, CA, USA, 17–22 January 1993; American Meteorological Society: Anaheim, CA, USA, 1993; pp. 179–183. [Google Scholar]
- Chen, J.F.; Huang, Z.Y.; Jin, Q.J. SPI-based drought characteristics analysis and prediction for Xiqiao station in Yunnan province, China. Disaster Adv. 2012, 5, 1260–1268. [Google Scholar]
- Karavitis, C.A.; Alexandris, S.; Tsesmelis, D.E.; Athanasopoulos, G. Application of the Standardized Precipitation Index (SPI) in Greece. Water 2011, 3, 787–805. [Google Scholar] [CrossRef]
- Rahman, M.R.; Lateh, H. Meteorological drought in bangladesh: Assessing, analysing and hazard mapping using SPI, GIS and monthly rainfall data. Environ. Earth Sci. 2016, 75, 1–20. [Google Scholar] [CrossRef]
- Li, C.; Wang, R. Recent changes of precipitation in Gansu, northwest China: An index-based analysis. Theor. Appl. Climatol. 2016, 1–16. [Google Scholar] [CrossRef]
- Tan, M.L.; Ibrahim, A.L.; Duan, Z.; Cracknell, A.P.; Chaplot, V. Evaluation of six high-resolution satellite and ground-based precipitation products over Malaysia. Remote Sens. 2015, 7, 1504–1528. [Google Scholar] [CrossRef]
- Worqlul, A.W.; Maathuis, B.; Adem, A.A.; Demissie, S.S.; Langan, S.; Steenhuis, T.S. Comparison of rainfall estimations by TRMM 3B42, MPEG and CFSR with ground-observed data for the Lake Tana Basin in Ethiopia. Hydrol. Earth Syst. Sci. 2014, 18, 4871–4881. [Google Scholar] [CrossRef]
- Piani, C.; Weedon, G.P.; Best, M.; Gomes, S.M.; Viterbo, P.; Hagemann, S.; Haerter, J.O. Statistical bias correction of global simulated daily precipitation and temperature for the application of hydrological models. J. Hydrol. 2010, 395, 199–215. [Google Scholar] [CrossRef]
- Serrat-Capdevila, A.; Merino, M.; Valdes, J.; Durcik, M. Evaluation of the performance of three satellite precipitation products over Africa. Remote Sens. 2016, 8, 836. [Google Scholar] [CrossRef]
- Maggioni, V.; Meyers, P.C.; Robinson, M.D. A review of merged high-resolution satellite precipitation product accuracy during the Tropical Rainfall Measuring Mission (TRMM) era. J. Hydrometeorol. 2016, 17, 1101–1117. [Google Scholar] [CrossRef]
- Chen, F.; Li, X. Evaluation of IMERG and TRMM 3B43 monthly precipitation products over mainland China. Remote Sens. 2016, 8, 472. [Google Scholar] [CrossRef]
- Tao, H.; Fischer, T.; Zeng, Y.; Fraedrich, K. Evaluation of TRMM 3B43 precipitation data for drought monitoring in Jiangsu province, China. Water 2016, 8, 13. [Google Scholar] [CrossRef]
- De Jesus, A.; Brena-Naranjo, J.A.; Pedrozo-Acuna, A.; Yamanaka, V.H.A. The use of TRMM 3B42 product for drought monitoring in Mexico. Water 2016, 8, 18. [Google Scholar] [CrossRef]
- Li, X.H.; Zhang, Q.; Ye, X.C. Dry/wet conditions monitoring based on TRMM rainfall data and its reliability validation over Poyang Lake Basin, China. Water 2013, 5, 1848–1864. [Google Scholar] [CrossRef]
- Zeng, H.W.; Li, L.J.; Li, J.Y. The evaluation of TRMM multisatellite precipitation analysis (TMPA) in drought monitoring in the Lancang River Basin. J. Geogr. Sci. 2012, 22, 273–282. [Google Scholar] [CrossRef]
- Okonkwo, C.; Demoz, B.; Onyeukwu, K. Characteristics of drought indices and rainfall in Lake Chad Basin. Int. J. Remote Sens. 2013, 34, 7945–7961. [Google Scholar] [CrossRef]
- Vernimmen, R.R.E.; Hooijer, A.; Aldrian, E.; van Dijk, A. Evaluation and bias correction of satellite rainfall data for drought monitoring in Indonesia. Hydrol. Earth Syst. Sci. 2012, 16, 133–146. [Google Scholar] [CrossRef] [Green Version]
- Paridal, B.R.; Collado, W.B.; Borah, R.; Hazarika, M.K.; Sarnarakoon, L. Detecting drought-prone areas of rice agriculture using a MODIS-derived soil moisture index. GISci. Remote Sens. 2008, 45, 109–129. [Google Scholar] [CrossRef]
- Yaduvanshi, A.; Srivastava, P.K.; Pandey, A.C. Integrating TRMM and MODIS satellite with socio-economic vulnerability for monitoring drought risk over a tropical region of India. Phys. Chem. Earth Parts A/B/C 2015, 83–84, 14–27. [Google Scholar] [CrossRef]
- Tan, M.L.; Ibrahim, A.B.; Cracknell, A.P.; Yusop, Z. Changes in precipitation extremes over the Kelantan River Basin, Malaysia. Int. J. Climatol. 2016, in press. [Google Scholar] [CrossRef]
- Yusof, F.; Hui-Mean, F.; Suhaila, J.; Yusof, Z. Characterisation of drought properties with bivariate copula analysis. Water Resour. Manag. 2013, 27, 4183–4207. [Google Scholar] [CrossRef]
- Hashim, M.; Reba, N.M.; Nadzri, M.I.; Pour, A.B.; Mahmud, M.R.; Mohd Yusoff, A.R.; Ali, M.I.; Jaw, S.W.; Hossain, M. Satellite-based run-off model for monitoring drought in Peninsular Malaysia. Remote Sens. 2016, 8, 633. [Google Scholar] [CrossRef]
- Becker, A.; Schneider, U.; Meyer-Christoffer, A.; Ziese, M.; Finger, P.; Stender, P.; Heller, A.; Breidenbach, J.N. GPCC Report for Years 2009, 2010 and 2011. Available online: https://www.dwd.de/EN/ourservices/gpcc/reports_publications/home_reports_publications.html (accessed on 11 August 2016).
- Huffman, G.J.; Adler, R.F.; Bolvin, D.T.; Gu, G.J.; Nelkin, E.J.; Bowman, K.P.; Hong, Y.; Stocker, E.F.; Wolff, D.B. The TRMM Multisatellite Precipitation Snalysis (TMPA): Quasi-global, multiyear, combined-sensor precipitation estimates at fine scales. J. Hydrometeorol. 2007, 8, 38–55. [Google Scholar] [CrossRef]
- Goddard Earth Sciences Data and Information Services Center. Available online: http://mirador.gsfc.nasa.gov (accessed on 8 July 2016).
- National Drought Mitigation Center. Available online: http://drought.unl.edu/monitoringtools/downloadablespiprogram.aspx (accessed on 25 July 2016).
- Thiemig, V.; Rojas, R.; Zambrano-Bigiarini, M.; Levizzani, V.; De Roo, A. Validation of satellite-based precipitation products over sparsely gauged African river basins. J. Hydrometeorol. 2012, 13, 1760–1783. [Google Scholar] [CrossRef]
- Wang, W.; Lu, H.; Yang, D.W.; Sothea, K.; Jiao, Y.; Gao, B.; Peng, X.T.; Pang, Z.G. Modelling hydrologic processes in the Mekong River Basin using a distributed model driven by satellite precipitation and rain gauge observations. PLoS ONE 2016, 11, e0152229. [Google Scholar] [CrossRef] [PubMed]
- Yang, Y.; Luo, Y. Evaluating the performance of remote sensing precipitation products CMORPH, PERSIANN, and TMPA, in the arid region of northwest China. Theor. Appl. Climatol. 2014, 118, 429–445. [Google Scholar] [CrossRef]
- Khan, S.I.; Hong, Y.; Gourley, J.J.; Khattak, M.U.K.; Yong, B.; Vergara, H.J. Evaluation of three high-resolution satellite precipitation estimates: Potential for monsoon monitoring over Pakistan. Adv. Space Res. 2014, 54, 670–684. [Google Scholar] [CrossRef]
- Dembélé, M.; Zwart, S.J. Evaluation and comparison of satellite-based rainfall products in Burkina Faso, West Africa. Int. J. Remote Sens. 2016, 37, 3995–4014. [Google Scholar] [CrossRef]
- Tangang, F.T.; Juneng, L. Mechanisms of Malaysian rainfall anomalies. J. Clim. 2004, 17, 3616–3622. [Google Scholar] [CrossRef]
- Tan, M.L.; Ficklin, D.L.; Dixon, B.; Ibrahim, A.L.; Yusop, Z.; Chaplot, V. Impacts of DEM resolution, source, and resampling technique on SWAT-simulated streamflow. Appl. Geogr. 2015, 63, 357–368. [Google Scholar] [CrossRef]
- Yang, X.Q.; Yong, B.; Hong, Y.; Chen, S.; Zhang, X.H. Error analysis of multi-satellite precipitation estimates with an independent raingauge observation network over a medium-sized humid basin. Hydrol. Sci. J. 2016, 61, 1813–1830. [Google Scholar] [CrossRef]
- Mahmud, M.R.; Numata, S.; Matsuyama, H.; Hosaka, T.; Hashim, M. Assessment of effective seasonal downscaling of TRMM precipitation data in Peninsular Malaysia. Remote Sens. 2015, 7, 4092–4111. [Google Scholar] [CrossRef]
- Pipunic, R.C.; Ryu, D.; Costelloe, J.F.; Su, C.H. An evaluation and regional error modeling methodology for near-real-time satellite rainfall data over Australia. J. Geophys. Res. Atmos. 2015, 120, 767–783. [Google Scholar] [CrossRef]
- Adeyewa, Z.D.; Nakamura, K. Validation of TRMM radar rainfall data over major climatic regions in Africa. J. Appl. Meteorol. 2003, 42, 331–347. [Google Scholar] [CrossRef]
- Curtarelli, M.P.; Renno, C.D.; Alcantara, E.H. Evaluation of the tropical rainfall measuring mission 3B43 product over an inland area in Brazil and the effects of satellite boost on rainfall estimates. J. Appl. Remote Sens. 2014, 8, 083589. [Google Scholar] [CrossRef]
- Duan, Z.; Liu, J.; Tuo, Y.; Chiogna, G.; Disse, M. Evaluation of eight high spatial resolution gridded precipitation products in Adige Basin (Italy) at multiple temporal and spatial scales. Sci. Total Environ. 2016, 573, 1536–1553. [Google Scholar] [CrossRef] [PubMed]
- Wolff, D.B.; Marks, D.A.; Amitai, E.; Silberstein, D.S.; Fisher, B.L.; Tokay, A.; Wang, J.; Pippitt, J.L. Ground validation for the Tropical Rainfall Measuring Mission (TRMM). J. Atmos. Ocean. Technol. 2005, 22, 365–380. [Google Scholar] [CrossRef]
- Dinku, T.; Ceccato, P.; Grover-Kopec, E.; Lemma, M.; Connor, S.J.; Ropelewski, C.F. Validation of satellite rainfall products over East Africa’s complex topography. Int. J. Remote Sens. 2007, 28, 1503–1526. [Google Scholar] [CrossRef]
- Hirpa, F.A.; Gebremichael, M.; Hopson, T. Evaluation of high-resolution satellite precipitation products over very complex terrain in Ethiopia. J. Appl. Meteorol. Climatol. 2010, 49, 1044–1051. [Google Scholar] [CrossRef]
- Wu, H.; Hayes, M.J.; Wilhite, D.A.; Svoboda, M.D. The effect of the length of record on the standardized precipitation index calculation. Int. J. Climatol. 2005, 25, 505–520. [Google Scholar] [CrossRef]
- Huffman, G.J.; Bolvin, D.T. TRMM and Other Data Precipitation Data Set Documentation. 2014. Available online: https://pmm.nasa.gov/data-access/downloads (accessed on 11 August 2016). [Google Scholar]
- Schneider, U.; Becker, A.; Finger, P.; Meyer-Christoffer, A.; Rudolf, B.; Ziese, M. GPCC Full Data Reanalysis Version 7.0 at 1.0°: Monthly Land-Surface Precipitation from Rain-Gauges Built on GTS-Based and Historic Data; Global Precipitation Climatology Centre: Offenbach am Main, Germany, 2015. [Google Scholar]
- Zhao, L.; Wu, J.J.; Fang, J. Robust response of streamflow drought to different timescales of meteorological drought in Xiangjiang River Basin of China. Adv. Meteorol. 2016, 8, 1634787. [Google Scholar] [CrossRef]
- Tan, M.L.; Ibrahim, A.L.; Yusop, Z.; Duan, Z.; Ling, L. Impacts of land-use and climate variability on hydrological components in the Johor River Basin, Malaysia. Hydrol. Sci. J. 2015, 60, 873–889. [Google Scholar] [CrossRef]
- Karl, T.R.; Nicholls, N.; Ghazi, A. Clivar/GCOS/WMO workshop on indices and indicators for climate extremes workshop summary. Clim. Chang. 1999, 42, 3–7. [Google Scholar] [CrossRef]


| Class | SPI Value |
|---|---|
| extremely wet | SPI ≥ 2 |
| severely wet | 1.5 ≤ SPI < 2 |
| moderately wet | 1 ≤ SPI < 1.5 |
| near-normal | −1 < SPI < 1 |
| moderately dry | −1.5 < SPI ≤ −1 |
| severely dry | −2 < SPI ≤ −1.5 |
| extremely dry | ≤−2 |
| Methods/Unit | Equation |
|---|---|
| Root Mean Square Error (RMSE)/mm | |
| Pearson Linear Correlation Coefficient (R) | |
| Relative Bias (Bias)/% |
© 2017 by the authors; licensee MDPI, Basel, Switzerland. This article is an open access article distributed under the terms and conditions of the Creative Commons Attribution (CC-BY) license (http://creativecommons.org/licenses/by/4.0/).
Share and Cite
Tan, M.L.; Tan, K.C.; Chua, V.P.; Chan, N.W. Evaluation of TRMM Product for Monitoring Drought in the Kelantan River Basin, Malaysia. Water 2017, 9, 57. https://doi.org/10.3390/w9010057
Tan ML, Tan KC, Chua VP, Chan NW. Evaluation of TRMM Product for Monitoring Drought in the Kelantan River Basin, Malaysia. Water. 2017; 9(1):57. https://doi.org/10.3390/w9010057
Chicago/Turabian StyleTan, Mou Leong, Kok Chooi Tan, Vivien P. Chua, and Ngai Weng Chan. 2017. "Evaluation of TRMM Product for Monitoring Drought in the Kelantan River Basin, Malaysia" Water 9, no. 1: 57. https://doi.org/10.3390/w9010057