Article

Hydrogeochemistry and Genesis Analysis of Thermal and Mineral Springs in Arxan, Northeastern China

School of Water Resources and Environment, China University of Geosciences (Beijing), Beijing 100083, China
*
Authors to whom correspondence should be addressed.
Water 2017, 9(1), 61; https://doi.org/10.3390/w9010061
Submission received: 26 September 2016 / Revised: 12 January 2017 / Accepted: 13 January 2017 / Published: 19 January 2017

Abstract

:
In this work, the hydrogeochemistry and environmental isotopic compositions of thermal and mineral springs in Arxan, northeastern China, were used to assess the genesis of the thermal system hosted by deep-seated faults. The reservoir temperature was calculated using the mineral saturation index and geothermometers. According to isotopic analysis, the spring water was of meteoric origin. Sixteen springs in the Arxan geothermal system with outlet temperatures ranging from 10.9 to 41.0 °C were investigated. The water samples can be classified into four groups by using a Piper diagram. The aquifer in which the Group I and Group III samples were obtained was a shallow cold aquifer of the Jurassic system, which is related to the local groundwater system and contains HCO3–Ca·Na groundwater. The Group II and Group IV samples were recharged by deeply circulating meteoric water with HCO3–Na and HCO3·SO4–Na·Ca groundwater, respectively. The springs rise from the deep basement faults. The estimated thermal reservoir temperature is 50.9–68.8 °C, and the proportion of shallow cold water ranges from 54% to 87%. A conceptual flow model based on hydrogeochemical results and hydrogeological features is given to describe the geothermal system of the Arxan springs.

1. Introduction

The Arxan springs are located along the deep fault of Arxan, one of the richest geothermal resource regions in Inner Mongolia, Northeast China, and include both thermal and mineral springs. The thermal springs have temperatures ranging between 25 and 42 °C, and the springs with temperatures lower than 25 °C are defined as mineral springs [1]. The thermal and mineral springs in the study area are characterized by different chemical compositions and have temperatures ranging from 22.3 to 41.0 °C. The area where these springs are found is small, and this type of area is very rare in China and globally.
Numerous studies have demonstrated the hydrogeochemical characteristics and genesis of the thermal and/or mineral springs in the geothermal system [2,3]. For example, Zaher et al. established a conceptual model based on numerical simulations to determine the origins and sources of heat in thermal springs with varied temperatures in Egypt [4]. Mao et al. determined the chemical and isotopic compositions of thermal and mineral springs in the Dongguan Basin of southern China and assessed how the hydrothermal system was controlled by deep-seated faults [5]. The characteristics of the thermal and cold water and the formation of the geothermal system within a 16 km2 area in western Turkey were determined by Pasvanoğlu in 2012, who indicated that the heat source was likely related to volcanic activity [6]. Katsanou et al. classified the thermal springs and mineral springs in northwest Greece into three groups based on different temperatures and chemical compositions and determined the functions and the origins of the springs [7]. However, few studies have reported the genesis of both thermal and mineral springs similar to those occurring in Arxan.
The first studies of the Arxan thermal springs began as early as the 1970s [8,9]. In this study, the geothermal structure and hydrogeological conditions of the Arxan springs, including the features of the temperature field and the geothermal reservoir of the geothermal system, were investigated, and their geothermal and geophysical characteristics and heat sources were briefly described. In general, thermal springs are associated with various heat sources, such as magma intrusion [2,10], radioactivity and tectogenesis [4,11,12]. Controversy exists regarding the heat sources of the Arxan thermal springs. Some authors [13,14] believe that the thermal springs are of meteoric origin and are heated by magma chambers. In contrast, other authors [15] believe that precipitation flows along the fault and is heated by the terrestrial heat flow and that the formation of thermal springs with low–medium temperatures results from the mixing of deep thermal water and shallow cold water.
However, these previous studies only partially describe the hydrochemical characteristics of the thermal springs and the formation of the Arxan geothermal system. The genesis of both the thermal and mineral springs and the relationship between the thermal springs and groundwater in this type of geothermal system have not been thoroughly investigated. The different mixing ratios of the thermal springs have also not been quantitatively analyzed. Thus, further research must be conducted to understand the genesis of the Arxan geothermal system.
In this study, the chemical and isotopic features of the Arxan springs are characterized. The temperatures of the geothermal reservoir and the hot–cold water mixing ratios of the Arxan springs were estimated. Furthermore, a conceptual model of the local groundwater route was developed to better understand the occurrence of both thermal and mineral springs in this geothermal system. The research results offer guidance for using Arxan springs and provide new insights into the processes that control the hydrochemical features of the thermal and mineral springs and the genesis and flow patterns of this type of geothermal system.

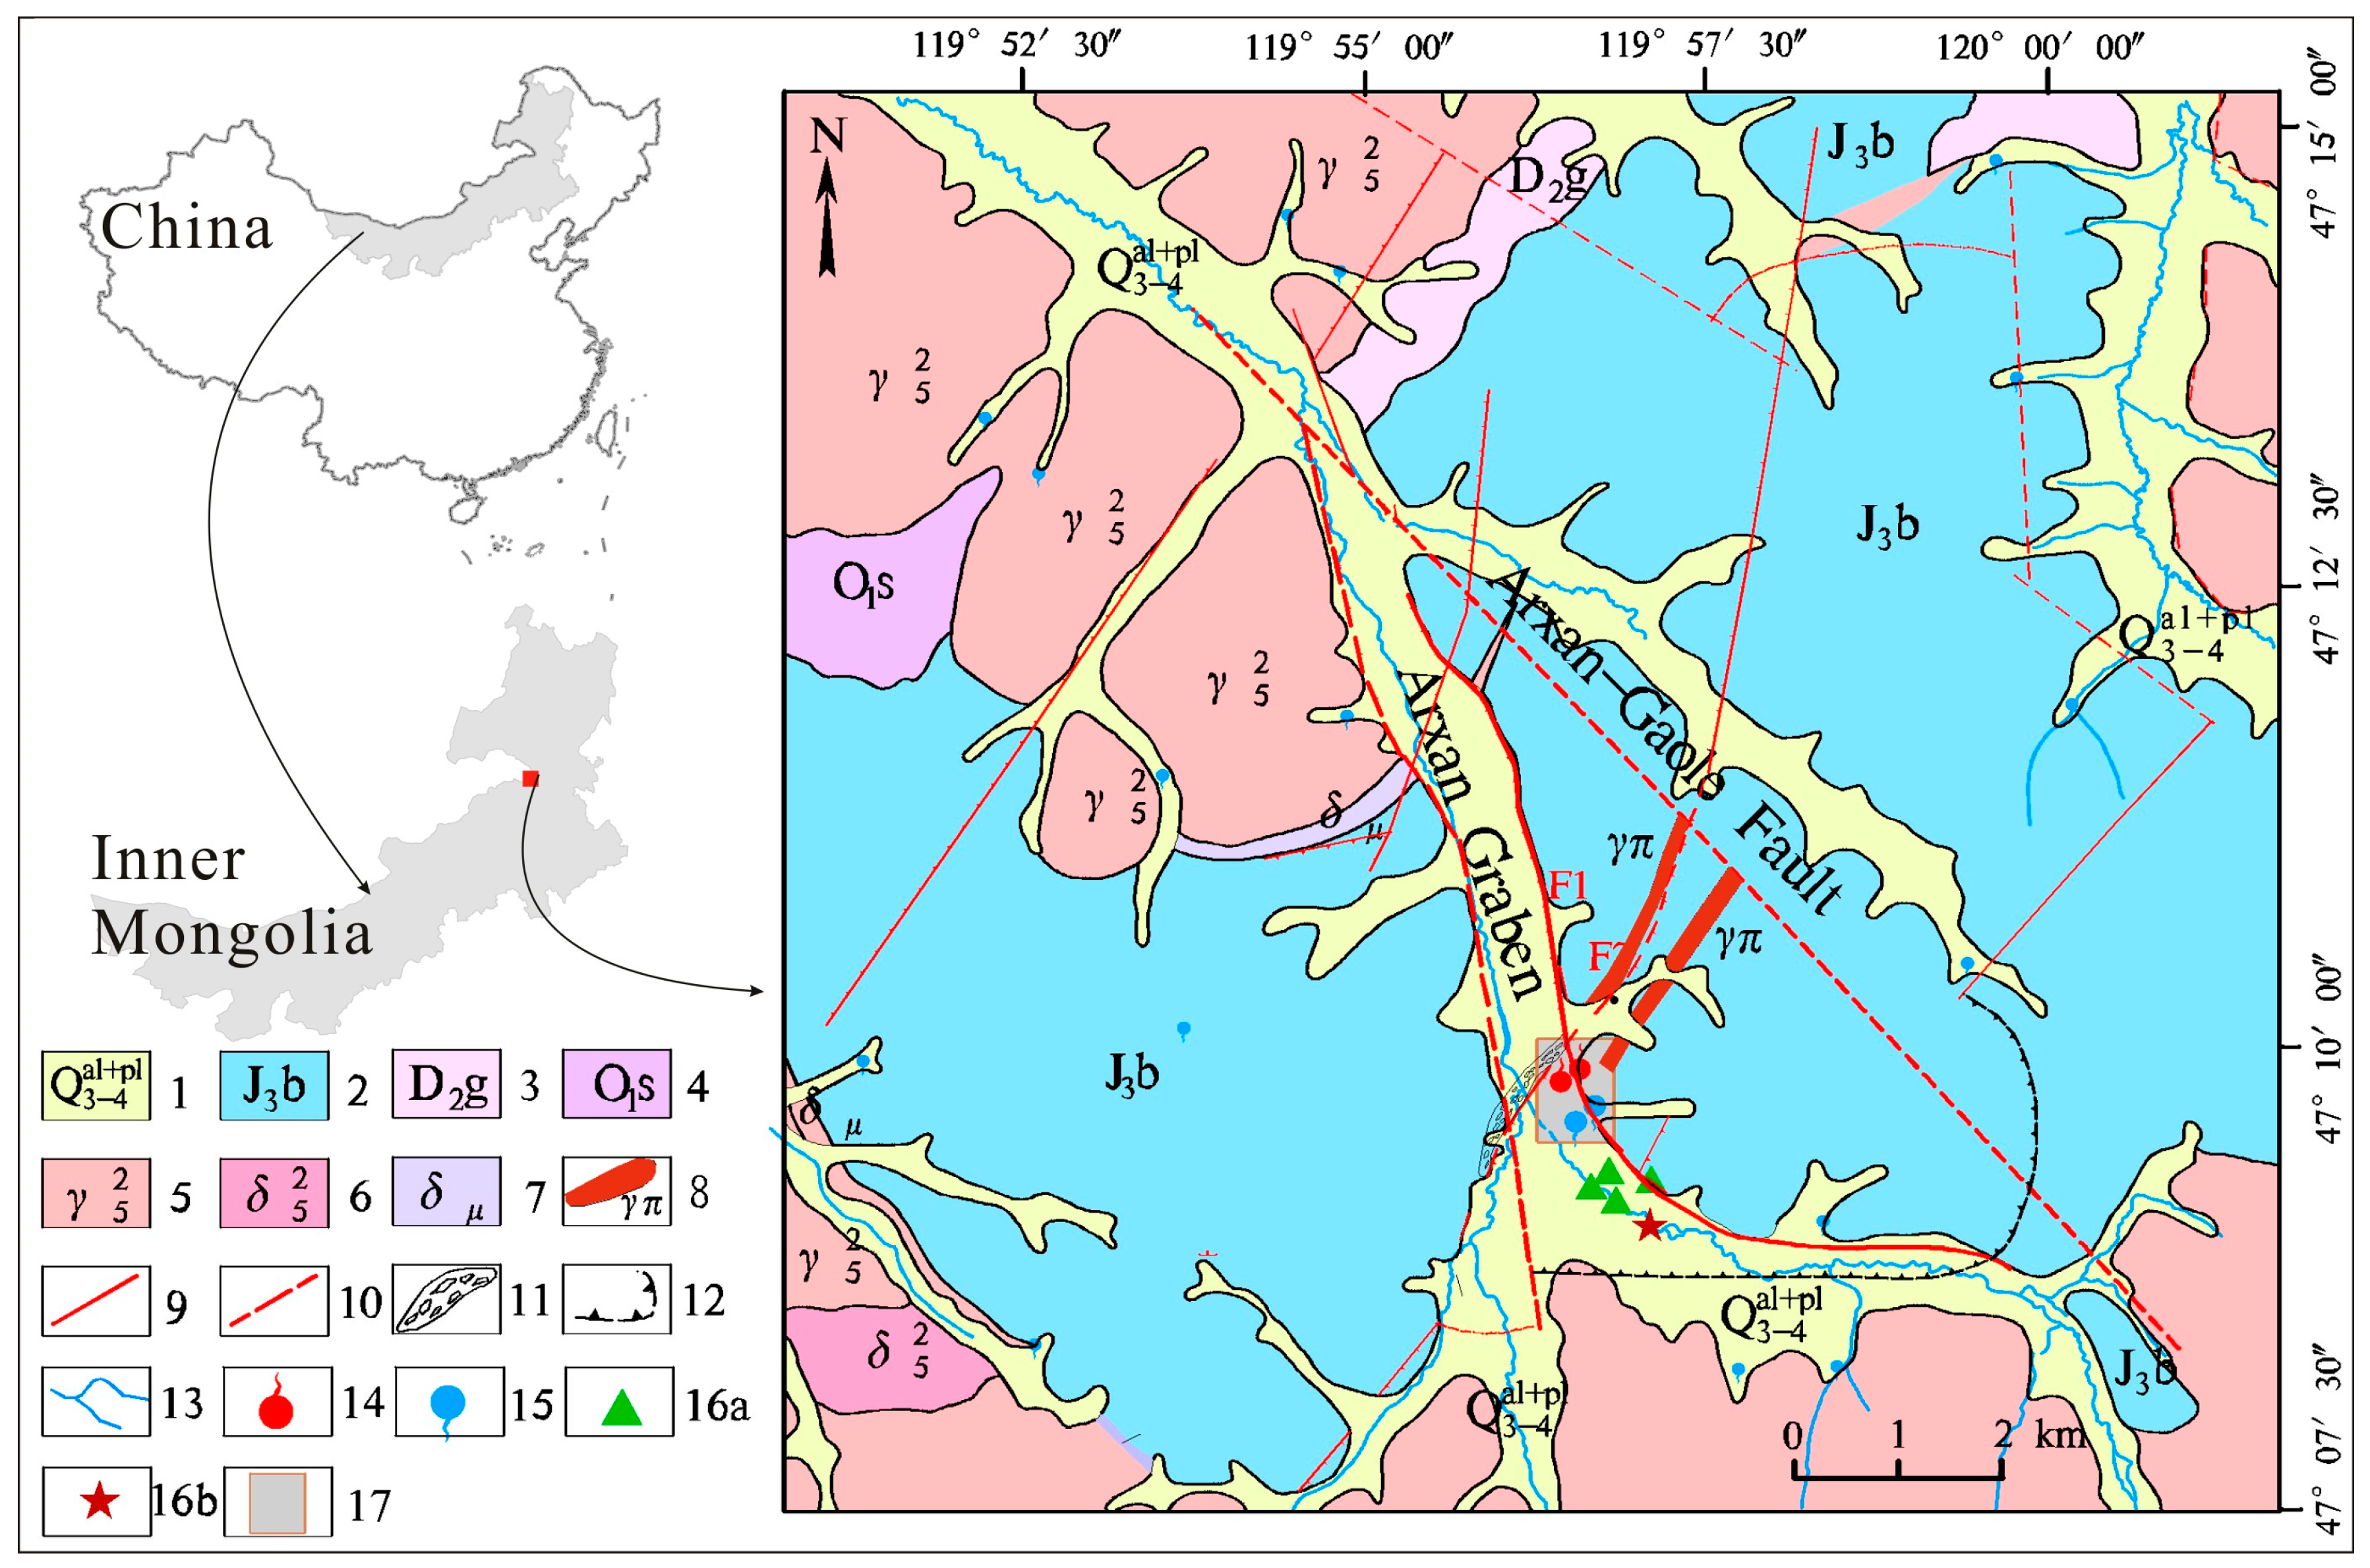
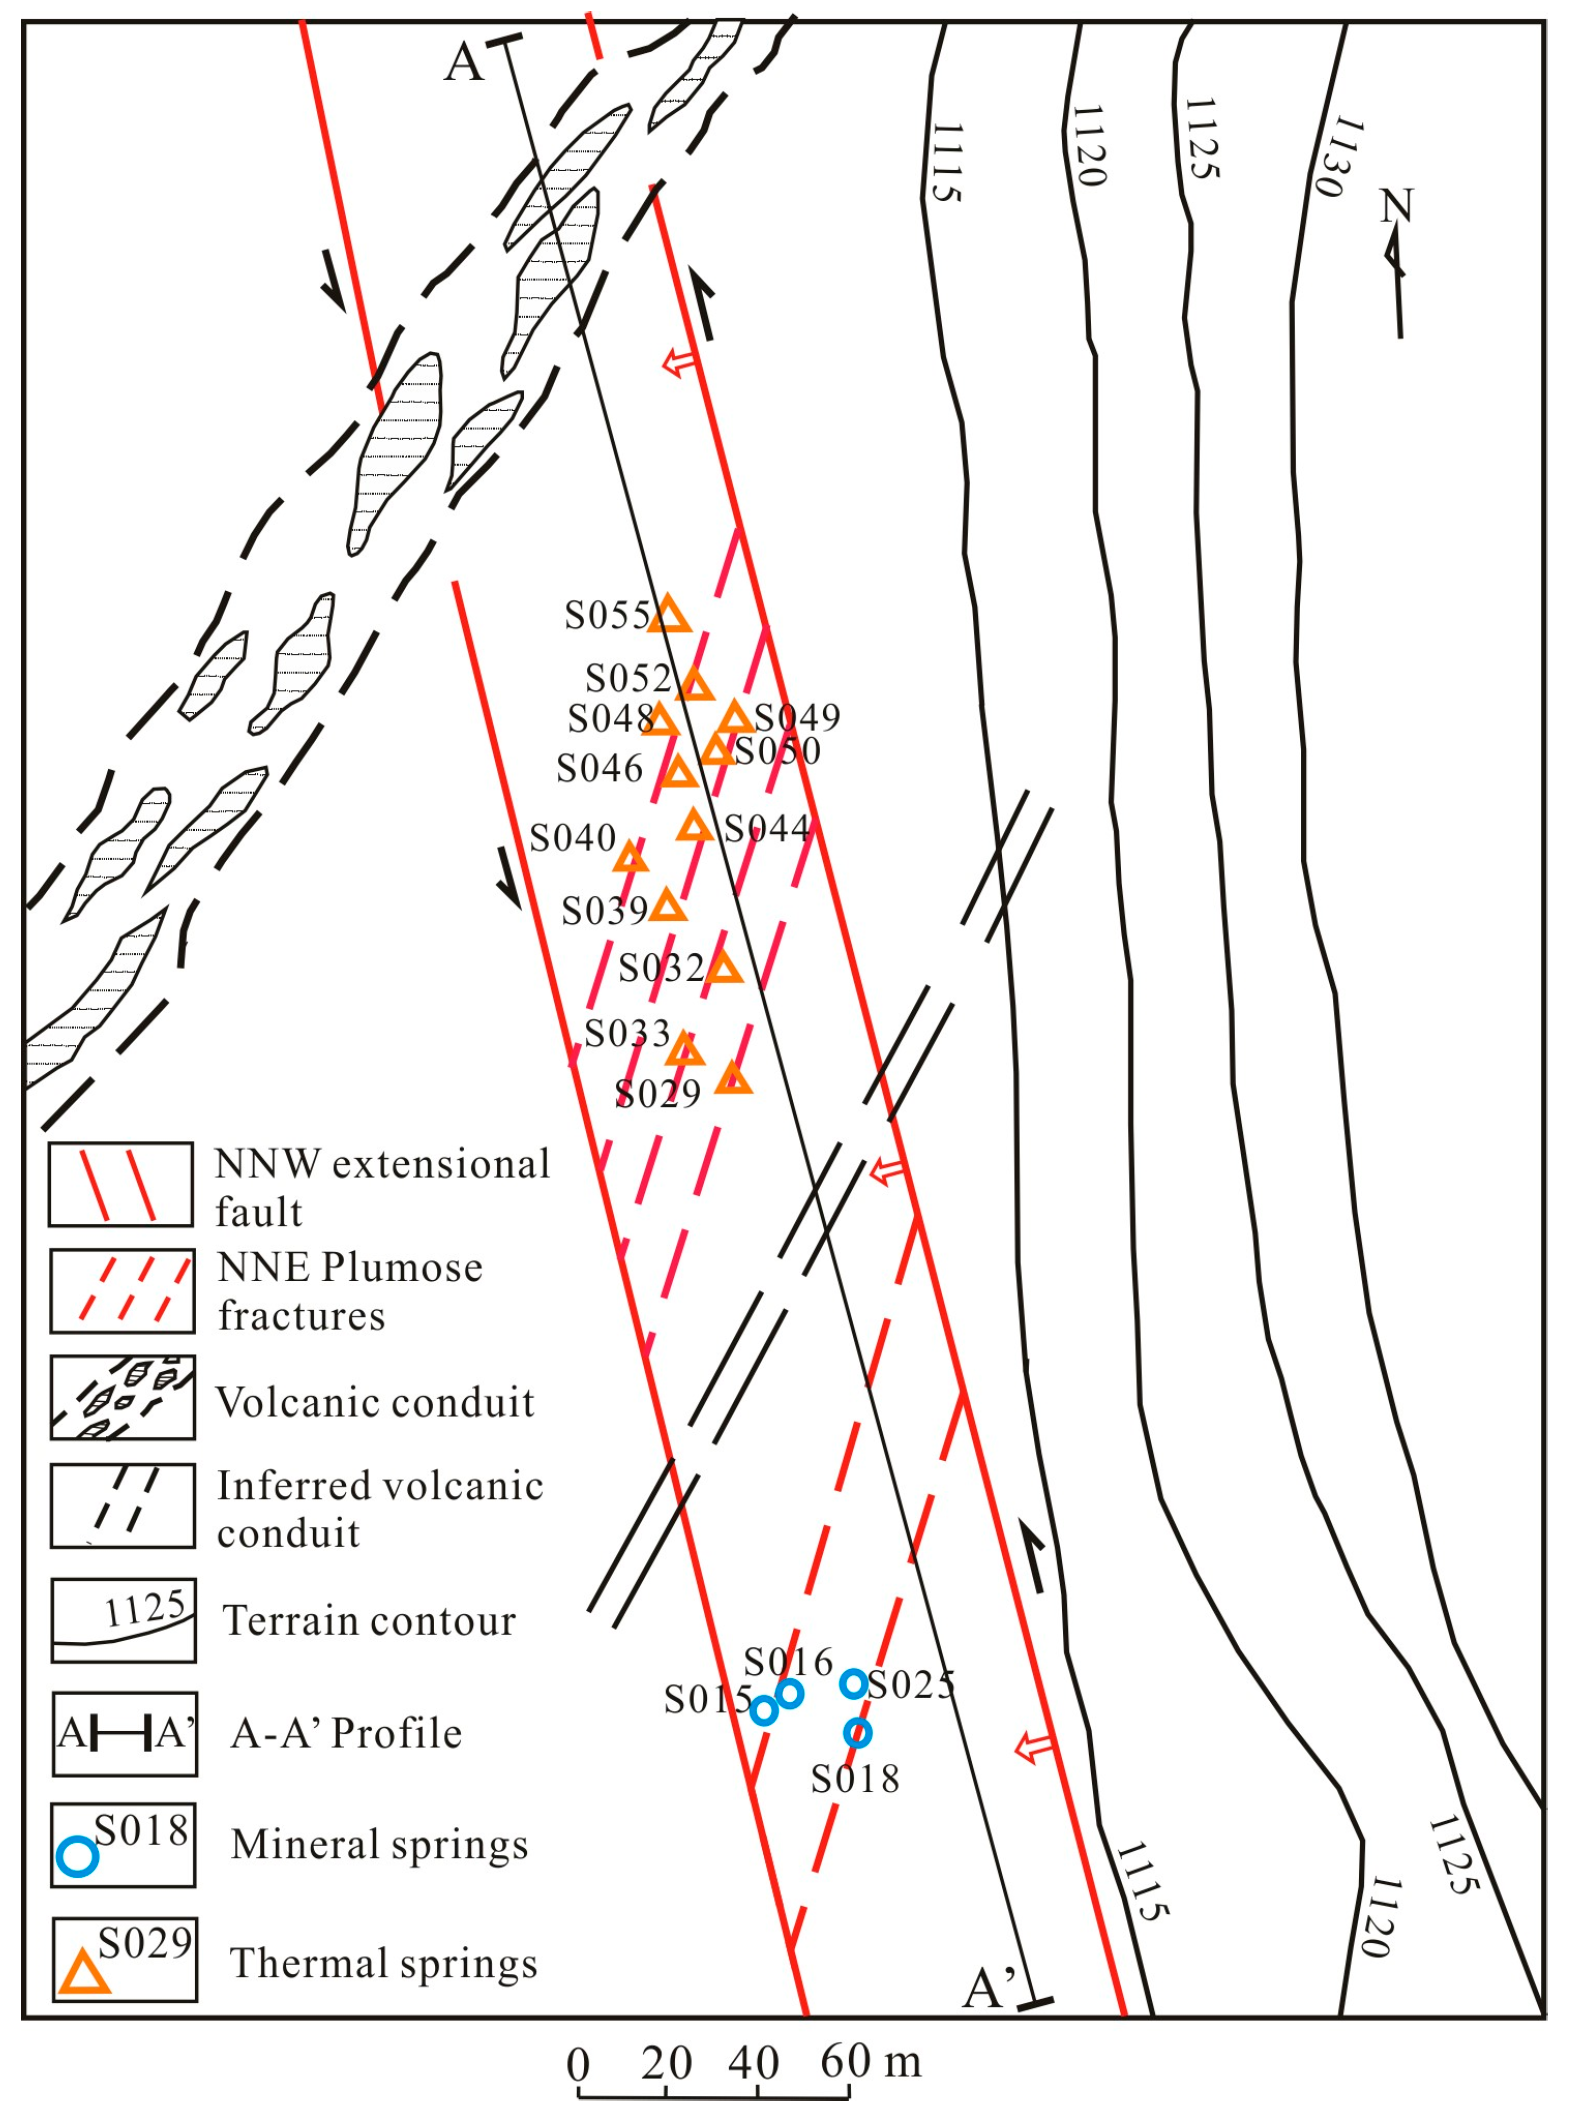
2. Geological and Hydrogeological Setting

The study area is located in Arxan, northeastern China (Figure 1), and the main landforms are middle mountains and valleys. The elevation of the highest mountain in this study area is 1275 m, and the climate of the study area is mainly characterized as temperate monsoon, with a mean temperature of 1.0 °C. The rainy season occurs from June to August, with a mean annual precipitation of approximately 450 mm and a mean evaporation of 1116 mm/a. The Arxan River is the main body of surface water in the study area. A cluster of thermal and mineral springs occurs within an area of 0.035 km2. The total length of this area is approximately 700 m, and the total width of the area is between 40 and 60 m [14].
Paleozoic, Mesozoic and Cenozoic rocks are exposed in the study area (Figure 1), and the basement rocks are magmatic rocks. Two broad stages of geological activity (i.e., the Late Ordovician–Mid-Devonian and the Mid-Jurassic–Early Cretaceous) had a significant effect on the regional strata and geological structure [15]. Magma was found to intrude up until the Mid-Jurassic period. The body of igneous rock is elongated towards the northeast, and is 1.5 km wide and 1.7 km deep [8]. Granite is the most widely outcropping type of bedrock, accounting for more than 20% of the bedrock in Arxan.
The study area is located in the tectonic unit of the Mongolian arcuate structure and the Neocathaysian uplift zone. The main deep active faults that control the geological tectonics are the Arxan–Gaole conjugate NNE (North-North-East)- and NNW (North-North-West)-trending faults. The deep-seated fault formed by a series of tectonic activities and from continuous stratigraphic deposition. The tectonic evolution in Arxan exhibits a latitudinal sequence, i.e., from an NW (North-West) system to a new Cathaysian system. Generally, the Arxan thermal springs are controlled by the NNW extensional fracture (F1) and NNE compressive fracture (F2), which are located in the central part of the caldera. The NNE fault is a volcanic conduit filled with acidic lava and can be considered as an impermeable wall. The faults extend for 10 km, with an inclination ranging from 70° to 80° [9].
As shown in Figure 2, the Arxan springs are located along the compressive plumose fracture and are divided into six bands. The temperature of the springs ranges from 10.9 to 41.0 °C. Two hydrostratigraphic groups can be classified according to the different types of the aquifer media and lithology [14]. Group I is composed of sand and gravel of Quaternary strata, is rich in pore water, and is distributed in the Arxan River valley. The specific yield of Group I is 55 m3/(h·m), and the groundwater depth ranges between 0 and 3 m. Most mineral springs (Group I) that exist here have water temperatures lower than 10.0 °C. The water temperature fluctuates seasonally, and the amount of spring discharge is approximately 30 m3/day. Some wells in the deeper part of the spring are artesian wells, and the shallow groundwater samples were taken from this aquifer (Group III). Group II is the main local hydrostratigraphic group composed of tuff and breccia of Jurassic strata, i.e., the most widely outcropping rocks. The bedrock fissure aquifer consists of a weathered fissure pore water aquifer with a sedimentary thickness ranging from 3 to 8 m and a fault fissure confined aquifer. Most of the thermal springs (Group II) in this aquifer occur where the joint fissure is well developed. The water temperature of Group II ranges from 22.3 to 41.0 °C, and the spring discharge ranges from 5 to 192 m3/day. A deep groundwater sample (Group IV) was also taken from this aquifer.
Groundwater recharge is generally considered to result from precipitation and the leakage of water from springs and the spring-fed river. Groundwater flows from the southwest to northeast along the main flow path and eventually discharges into the Arxan River.

3. Materials and Methods

The spring samples were collected in the study area during October 2015. Twenty sets of samples, including 16 from the springs, 3 from the shallow groundwater and 1 from the deep groundwater, were collected in polyethylene bottles for hydrochemical and environmental isotopic analysis. The water temperature (T), pH and dissolved oxygen (DO) were measured in situ using a multi-parameter instrument (Multi 350i/SET, Munich, Germany), and the dissolved solids and isotopic compositions were determined in the laboratory. The hydrochemical compositions (K+, Na+, Ca2+, Mg2+, Cl, SO42−, HCO3) were measured at the Fourth Institute of Hydrogeology and Engineering Geology of Inner Mongolia based on China’s national standards for the examination of natural mineral water for drinking [16] The major cation (K+, Na+, Ca2+, Mg2+) concentrations were determined by using inductively coupled plasma-mass spectrometry (Agilent 7500ce ICP-MS, Tokyo, Japan), and the major anion contents (Cl, SO42−) were determined using spectrophotometry (PerkinElmer Lambda 35, Waltham, MA, USA). The total dissolved solids (TDS) and HCO3 contents were determined by using acid-gravimetric analysis and base titration, respectively. The differences between the cation–anion balances of all samples were less than 5%.
δ18O, δ2H and tritium analyses were conducted at the Analytical Laboratory of the Beijing Research Institute of Uranium Geology. The 18O and 2H compositions were determined using the standard dioxide–water equilibrium method and the zinc reaction method, respectively. The stable isotopic ratios were measured based on isotope ratio mass spectrometry by using a Finnigan MAT 253 (Thermo Fisher Scientific, Waltham, MA, USA) with an analytical precision of ±0.2‰ for δ18O and ±2‰ for δ2H. The standard is the Vienna Standard Mean Ocean Water (VSMOW). The tritium concentrations in the samples were determined using electrolytic enrichment and the liquid scintillation technique based on China’s national standards for the examination of tritium [17]. The measurement accuracy for 3H ranges between ±0.3 and ±0.5 tritium units (TU).

4. Results and Discussion

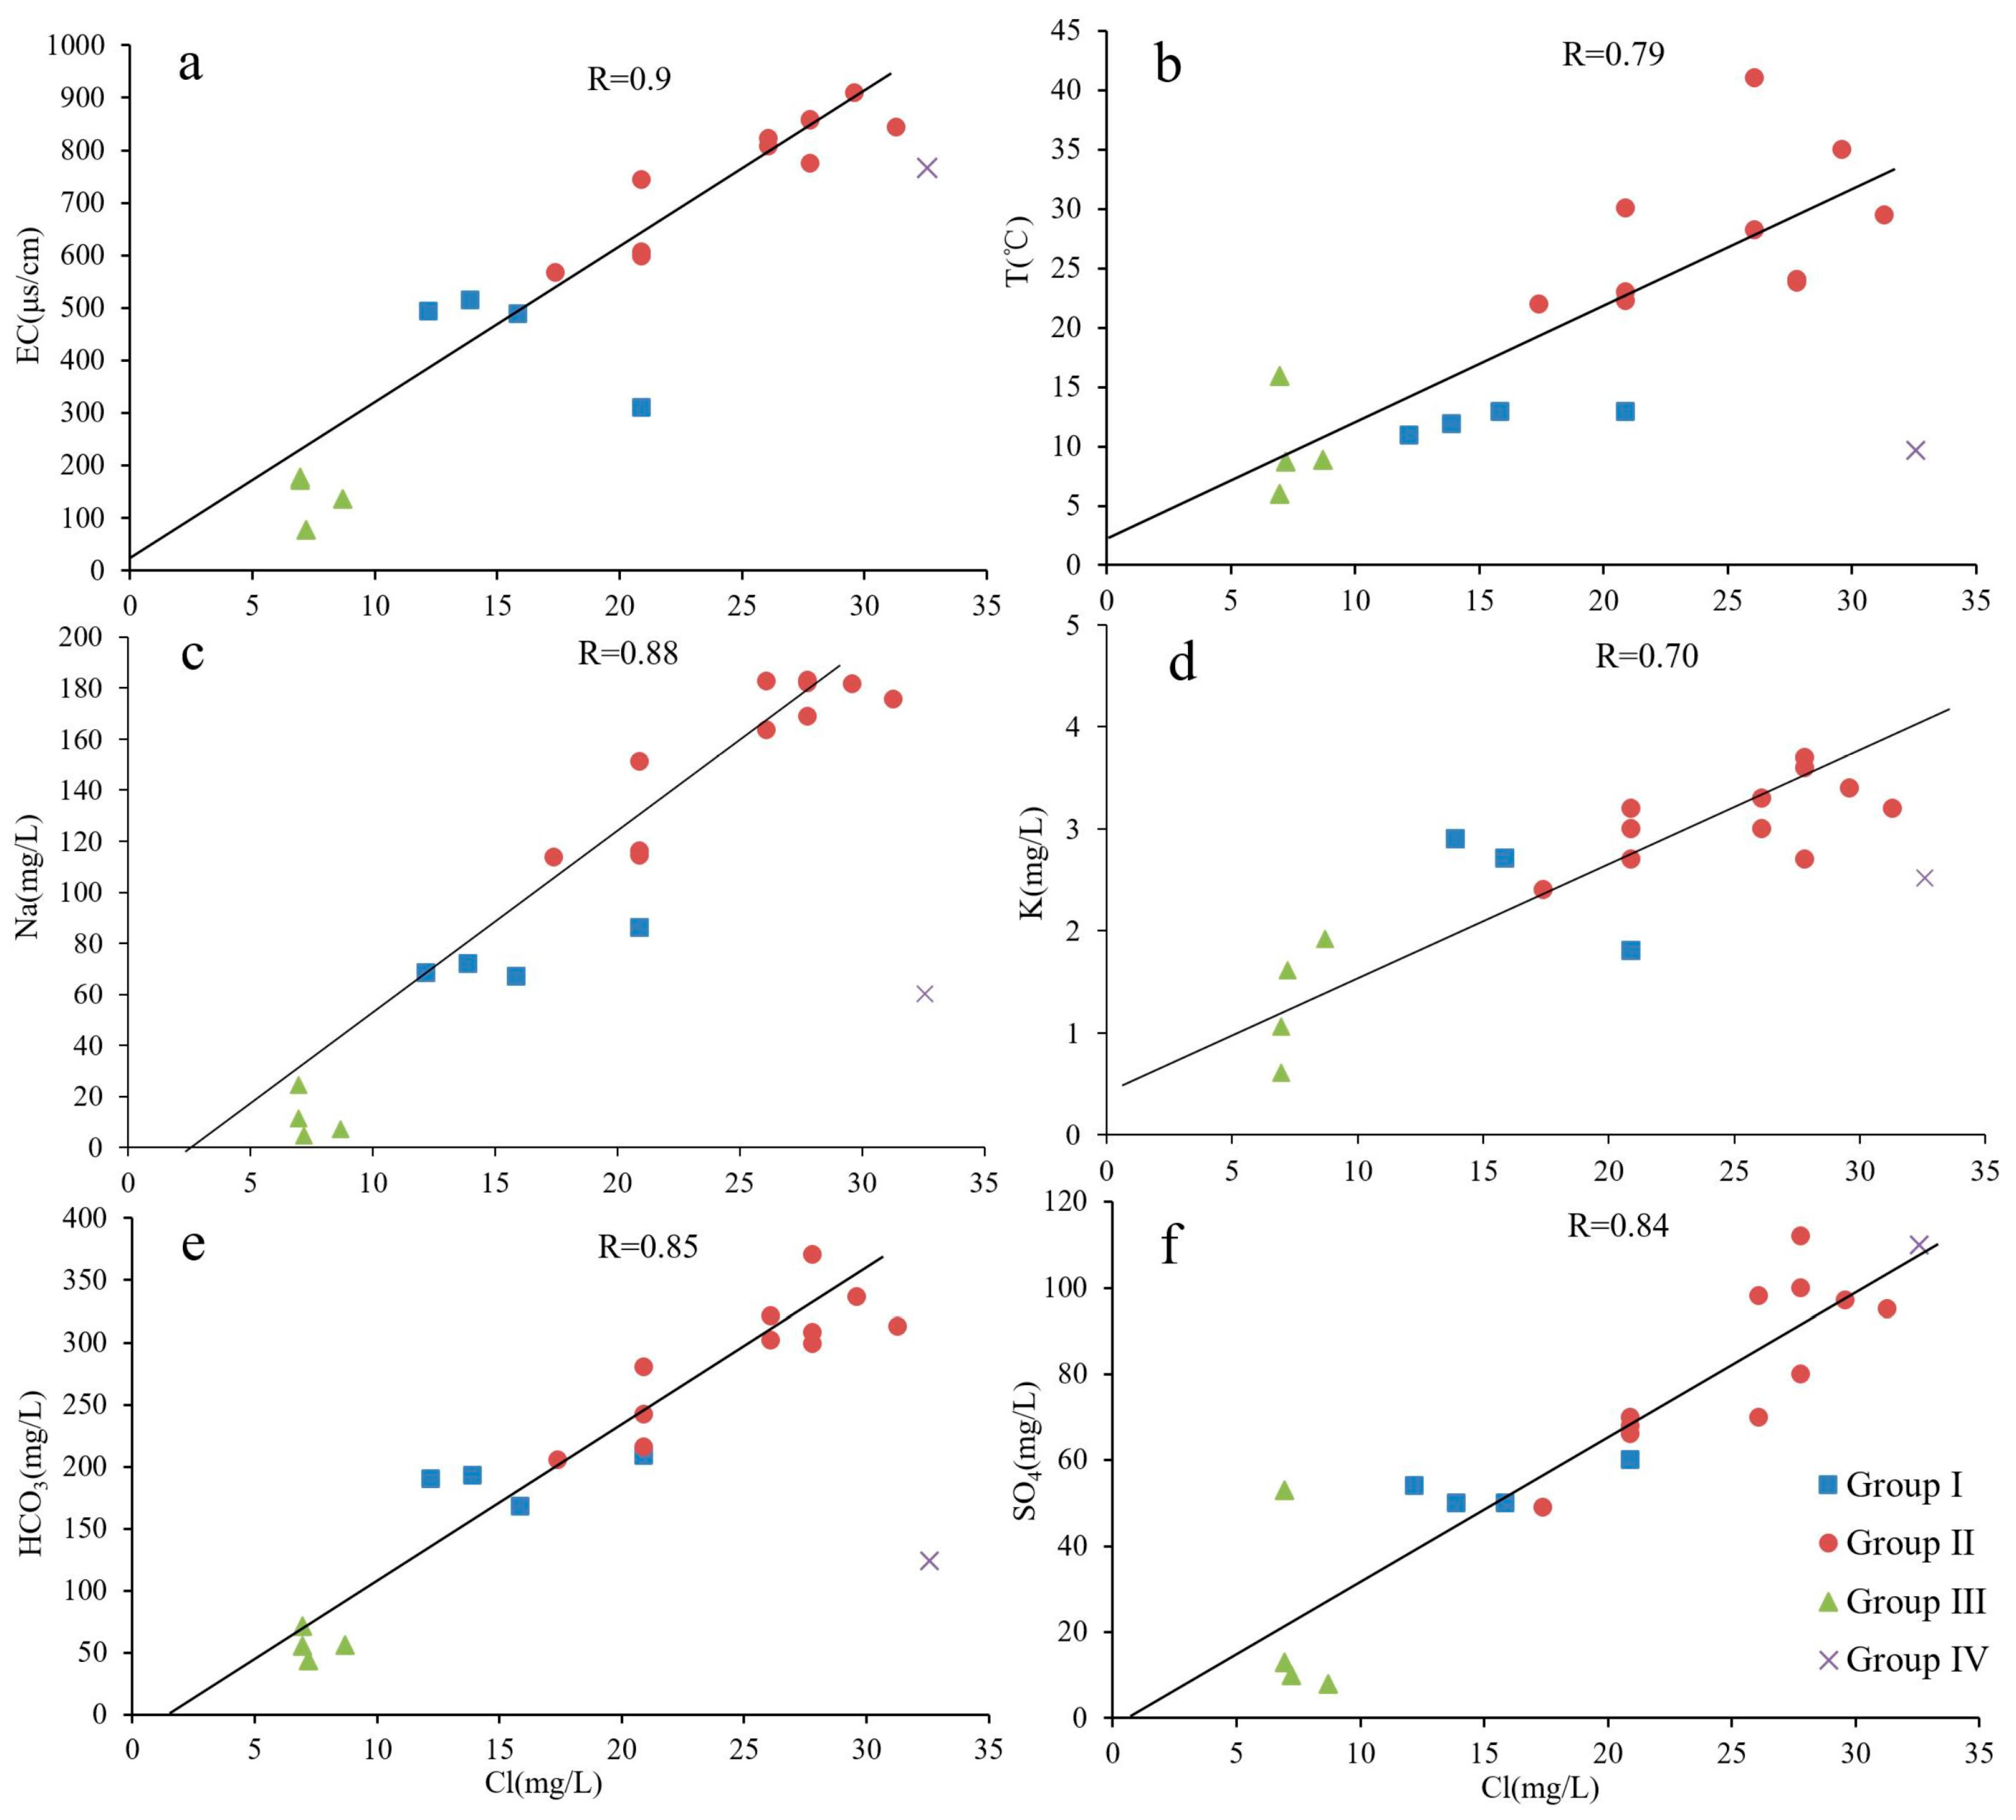
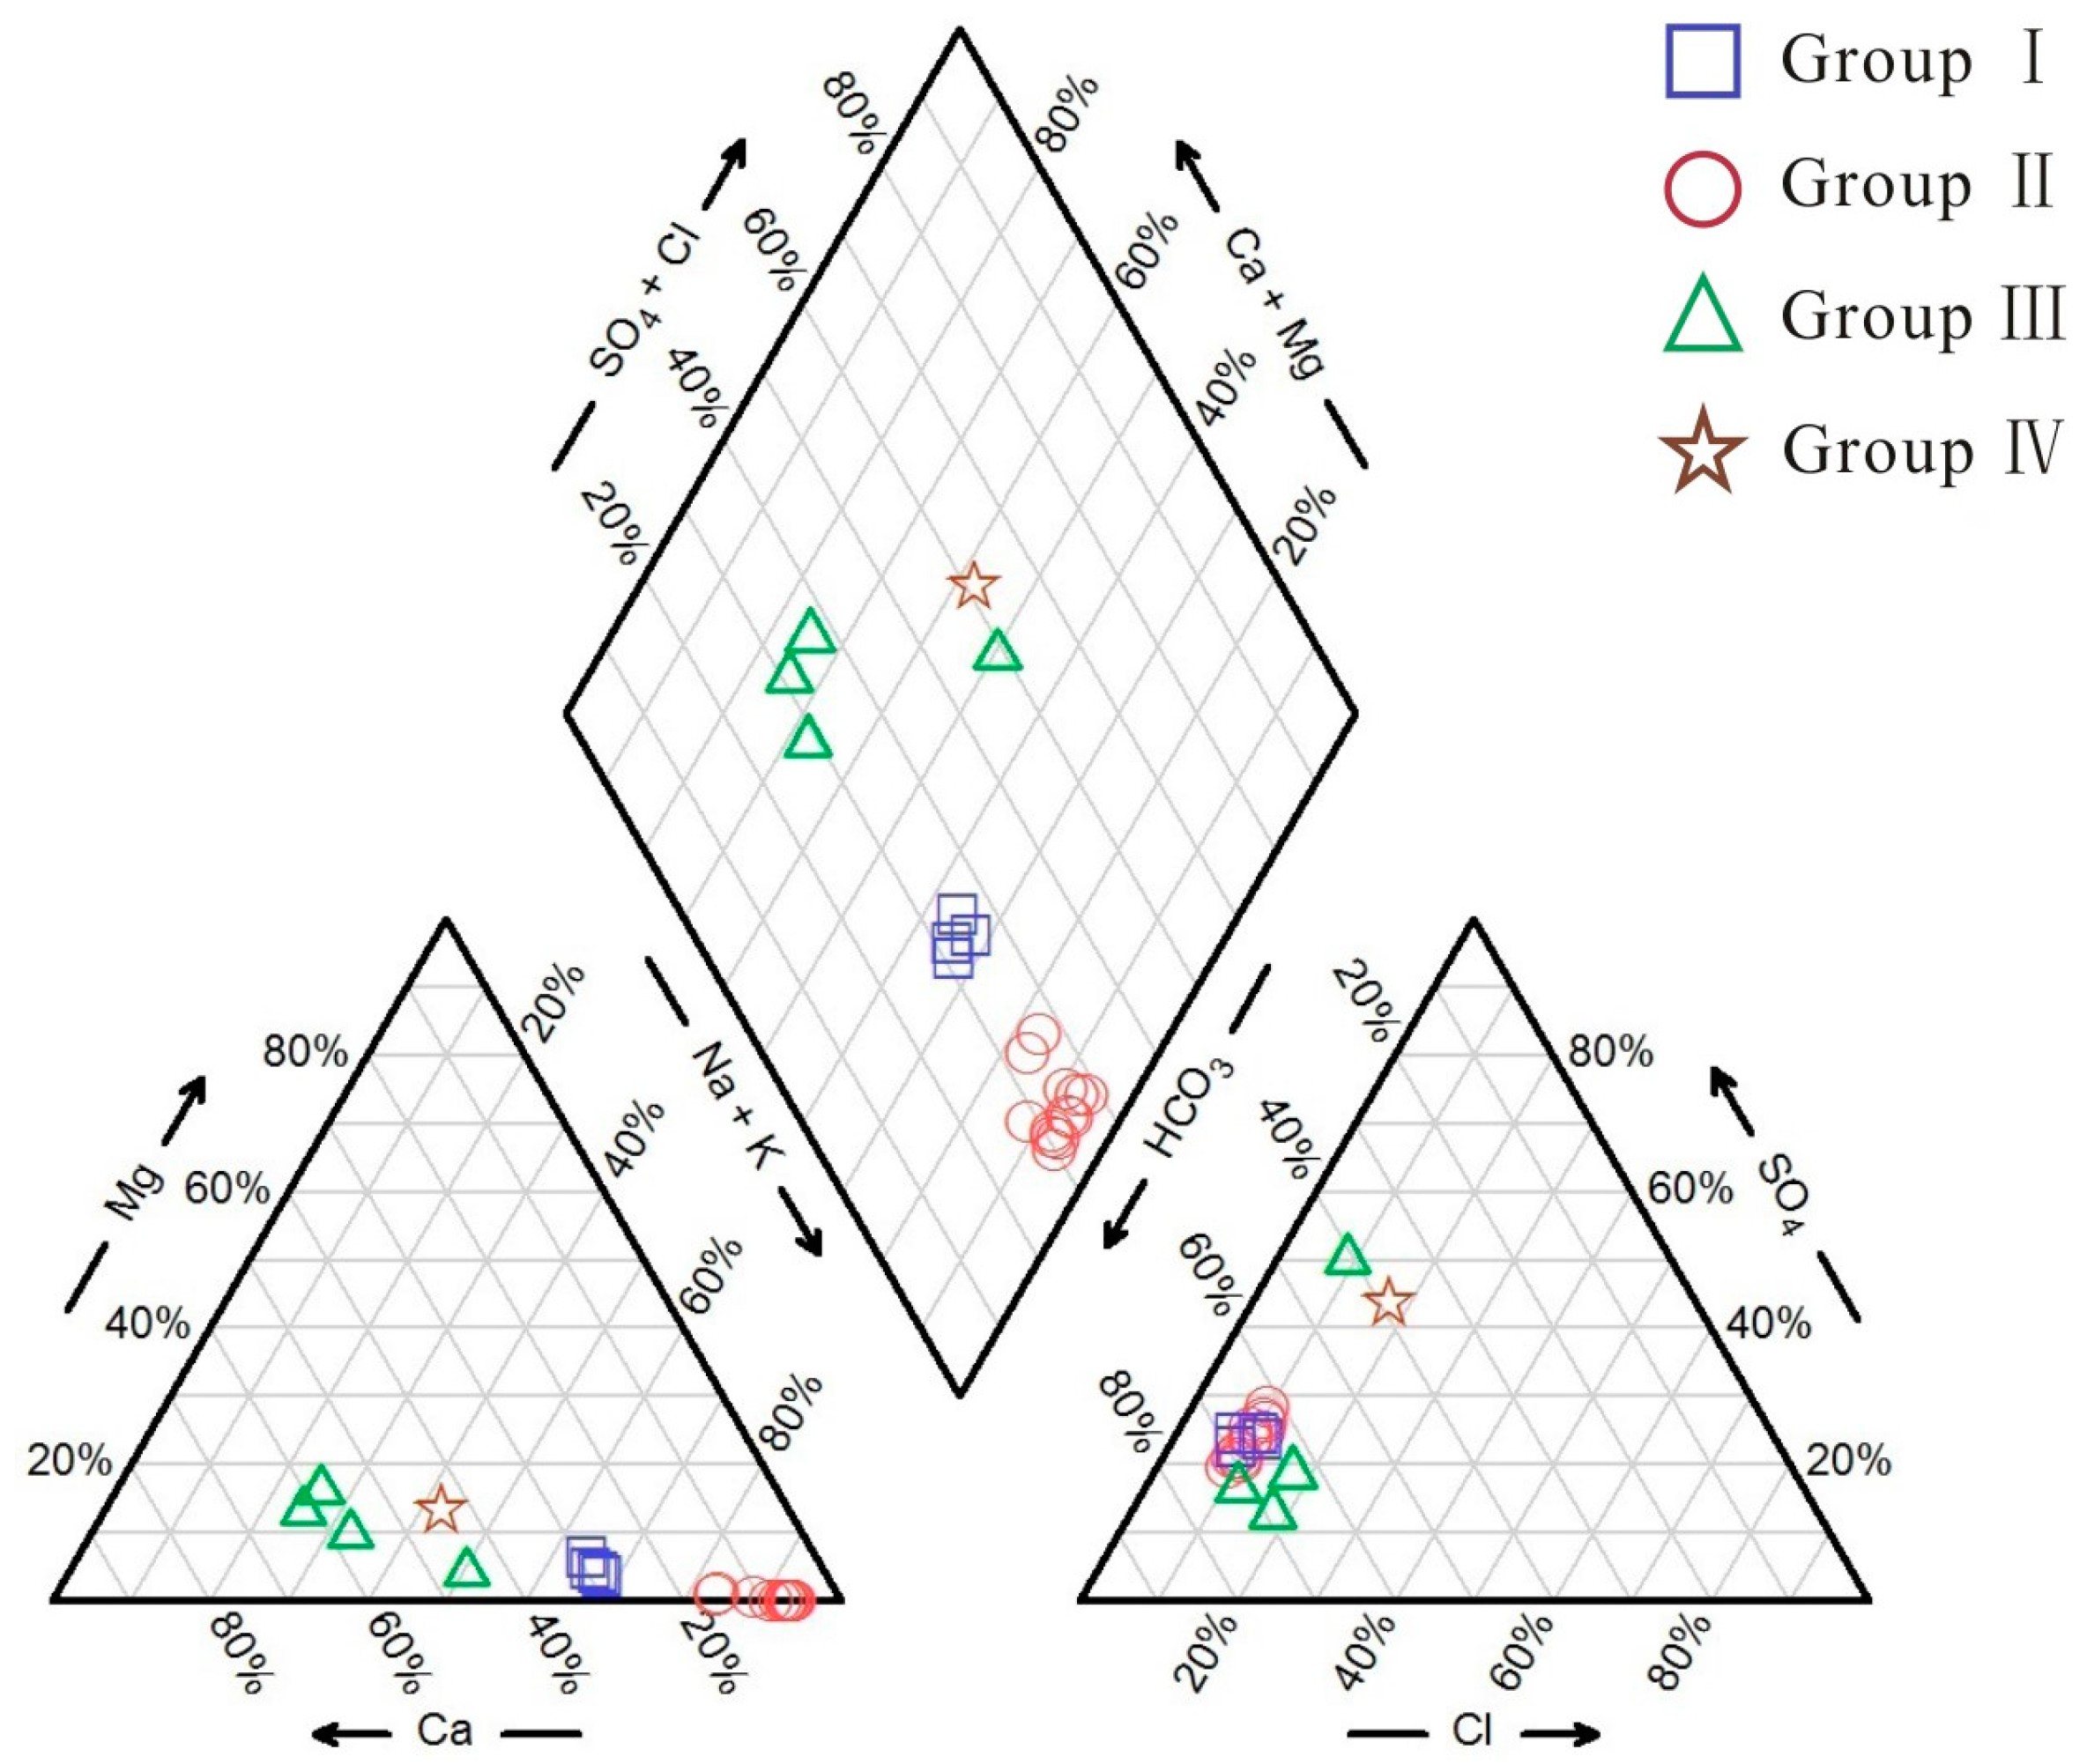
4.1. Hydrochemical Characteristics

The samples from the thermal springs (Group II) were obtained near each other because the distance between any two springs was less than 10 m; however, the output temperatures of the springs ranged from 22.3 to 41.0 °C. The temperatures of the mineral springs (Group I) were relatively consistent, ranging between 10.9 and 12.9 °C. The Group II samples were weakly alkaline, with pH values ranging from 7.2 to 7.9, and the Group I samples and most of the shallow groundwater samples (Group III) had low pH values. The electrical conductivities (EC) of the Group I and Group III samples ranged from 310 to 515 μS/cm and from 77 to 177 μS/cm, respectively, and were generally lower than the ECs of Group II (567–909 μS/cm) and Group IV (766 μS/cm) samples. The dissolved oxygen (DO) content were relatively high in the mineral springs (73–144 mg/L) and shallow groundwater (65–242 mg/L) when compared with the content in the thermal springs (5.8–87 mg/L) and deep groundwater (192 mg/L).
The main anion in all of the water samples was HCO3, and high Cl and SO42− contents were observed in the Group II and Group IV samples. The main cations were Na+ and Ca2+, and additional Mg2+ was detected in the Group I and Group III samples (Table 1). According to Figure 3, Group I mainly consisted of HCO3–Ca·Na water, whereas Group II mainly consisted of HCO3–Na water. The shallow groundwater samples (Group III) had chemical characteristics that were similar to those of Group I, i.e., Group III samples mainly consisted of HCO3–Ca·Na and HCO3·SO4–Ca·Na water according to the Piper diagram (Figure 3).
The relatively high concentrations of DO in the Group I samples were related to shallow circulation and a rapid renewal rate. The Group II thermal water samples had a distinct outlet temperature and EC, which were higher in the Group II samples than in the Group I samples. This finding showed that the Group II thermal water samples had a slightly longer residence time than the Group I thermal water samples. The Ca and Mg concentrations of Group II ranged from 8.2 to 19 mg/L and from 0.01 to 0.87 mg/L, respectively. The relatively low Ca and Mg concentrations mainly resulted from cation exchange because the Ca and Mg supplied from calcite dissolution were removed from the solution while Na remained in excess. The Group II samples were also characterized by high Na+ (114–183 mg/L), HCO3 (206–371 mg/L) and Cl (17–31 mg/L) concentrations, and the DO content was between 5.8 and 87.1 mg/L and was lower than that observed for the Group I samples, which were influenced by the deep circulation of groundwater in the aquifer. Group III, which had a higher DO content (65–242 mg/L), was mainly recharged by shallow groundwater rich in atmospheric oxygen and had TDS and ECs ranging from 85 to 175 mg/L and from 77 to 177 μS/cm, respectively, indicating a short circulation time. The deep groundwater (Group IV) consisted of HCO3·SO4–Na·Ca water. The high TDS content and low DO concentration implied relatively longer circulation and resident times, similar to the Group II samples.
Chloride displays conservative behavior and can be used as a tracer in geothermal systems [18]. Some major ions and ionic ratios plotted against the Cl content are shown in Figure 4. Strong positive correlations are observed in the EC vs. Cl (R-value of 0.9) and T vs. Cl (R-value of 0.79) plots (Figure 4a,b), implying the mixing of thermal and mineral water. Also, good correlations exist between Na and Cl (R = 0.88) and between K and Cl (R = 0.7) (Figure 4c,d), suggesting the progressive reaction of water with feldspar in the geothermal system, and the ion contents are considered as independent indicators of the residence time [19]. Thus, the residence time of the samples increased from Group III to Group I, Group II and Group IV. The strong correlations of HCO3 vs. Cl (R = 0.85) and SO4 vs. Cl (R = 0.84) indicate that the thermal water was diluted by shallow cold water (Figure 4e,f) [20].
The ionic ratios of the water samples were calculated as shown in Table 2. The mean Na/Cl ratio increased from Group III to Group IV, Group I and Group II. The mean K/Cl ratios of the Groups I and III samples were larger than those of the Groups II and IV samples. The mean Ca/Mg ratios of the Group II samples were greater than those of the other groups. The mean SO4/Cl ratios generally increased from Group III, to Group II, Group IV and Group I, while the HCO3/Cl ratio generally increased as follows: Group IV < Group III < Group II < Group I.
Due to the water–rock interactions (dissolution of Na-feldspar and K-feldspar, respectively), the high Na/Cl and K/Cl ratios indicated a longer and deeper circulation path. The Ca/Mg ratio of the thermal water was higher than that of the cold water, indicating Mg depletion due to the occurrence of clay minerals [21]. The SO4/Cl ratios were lower in the thermal water than in the cold water, which was related to the loss of S through the precipitation of sulfides or sulfates [20]. The HCO3/Cl ratios in the thermal water were higher than those in the cold water, indicating mixing between ascending thermal water and shallow cold water [10] as well as a shorter circulation path and faster groundwater cycle [19].

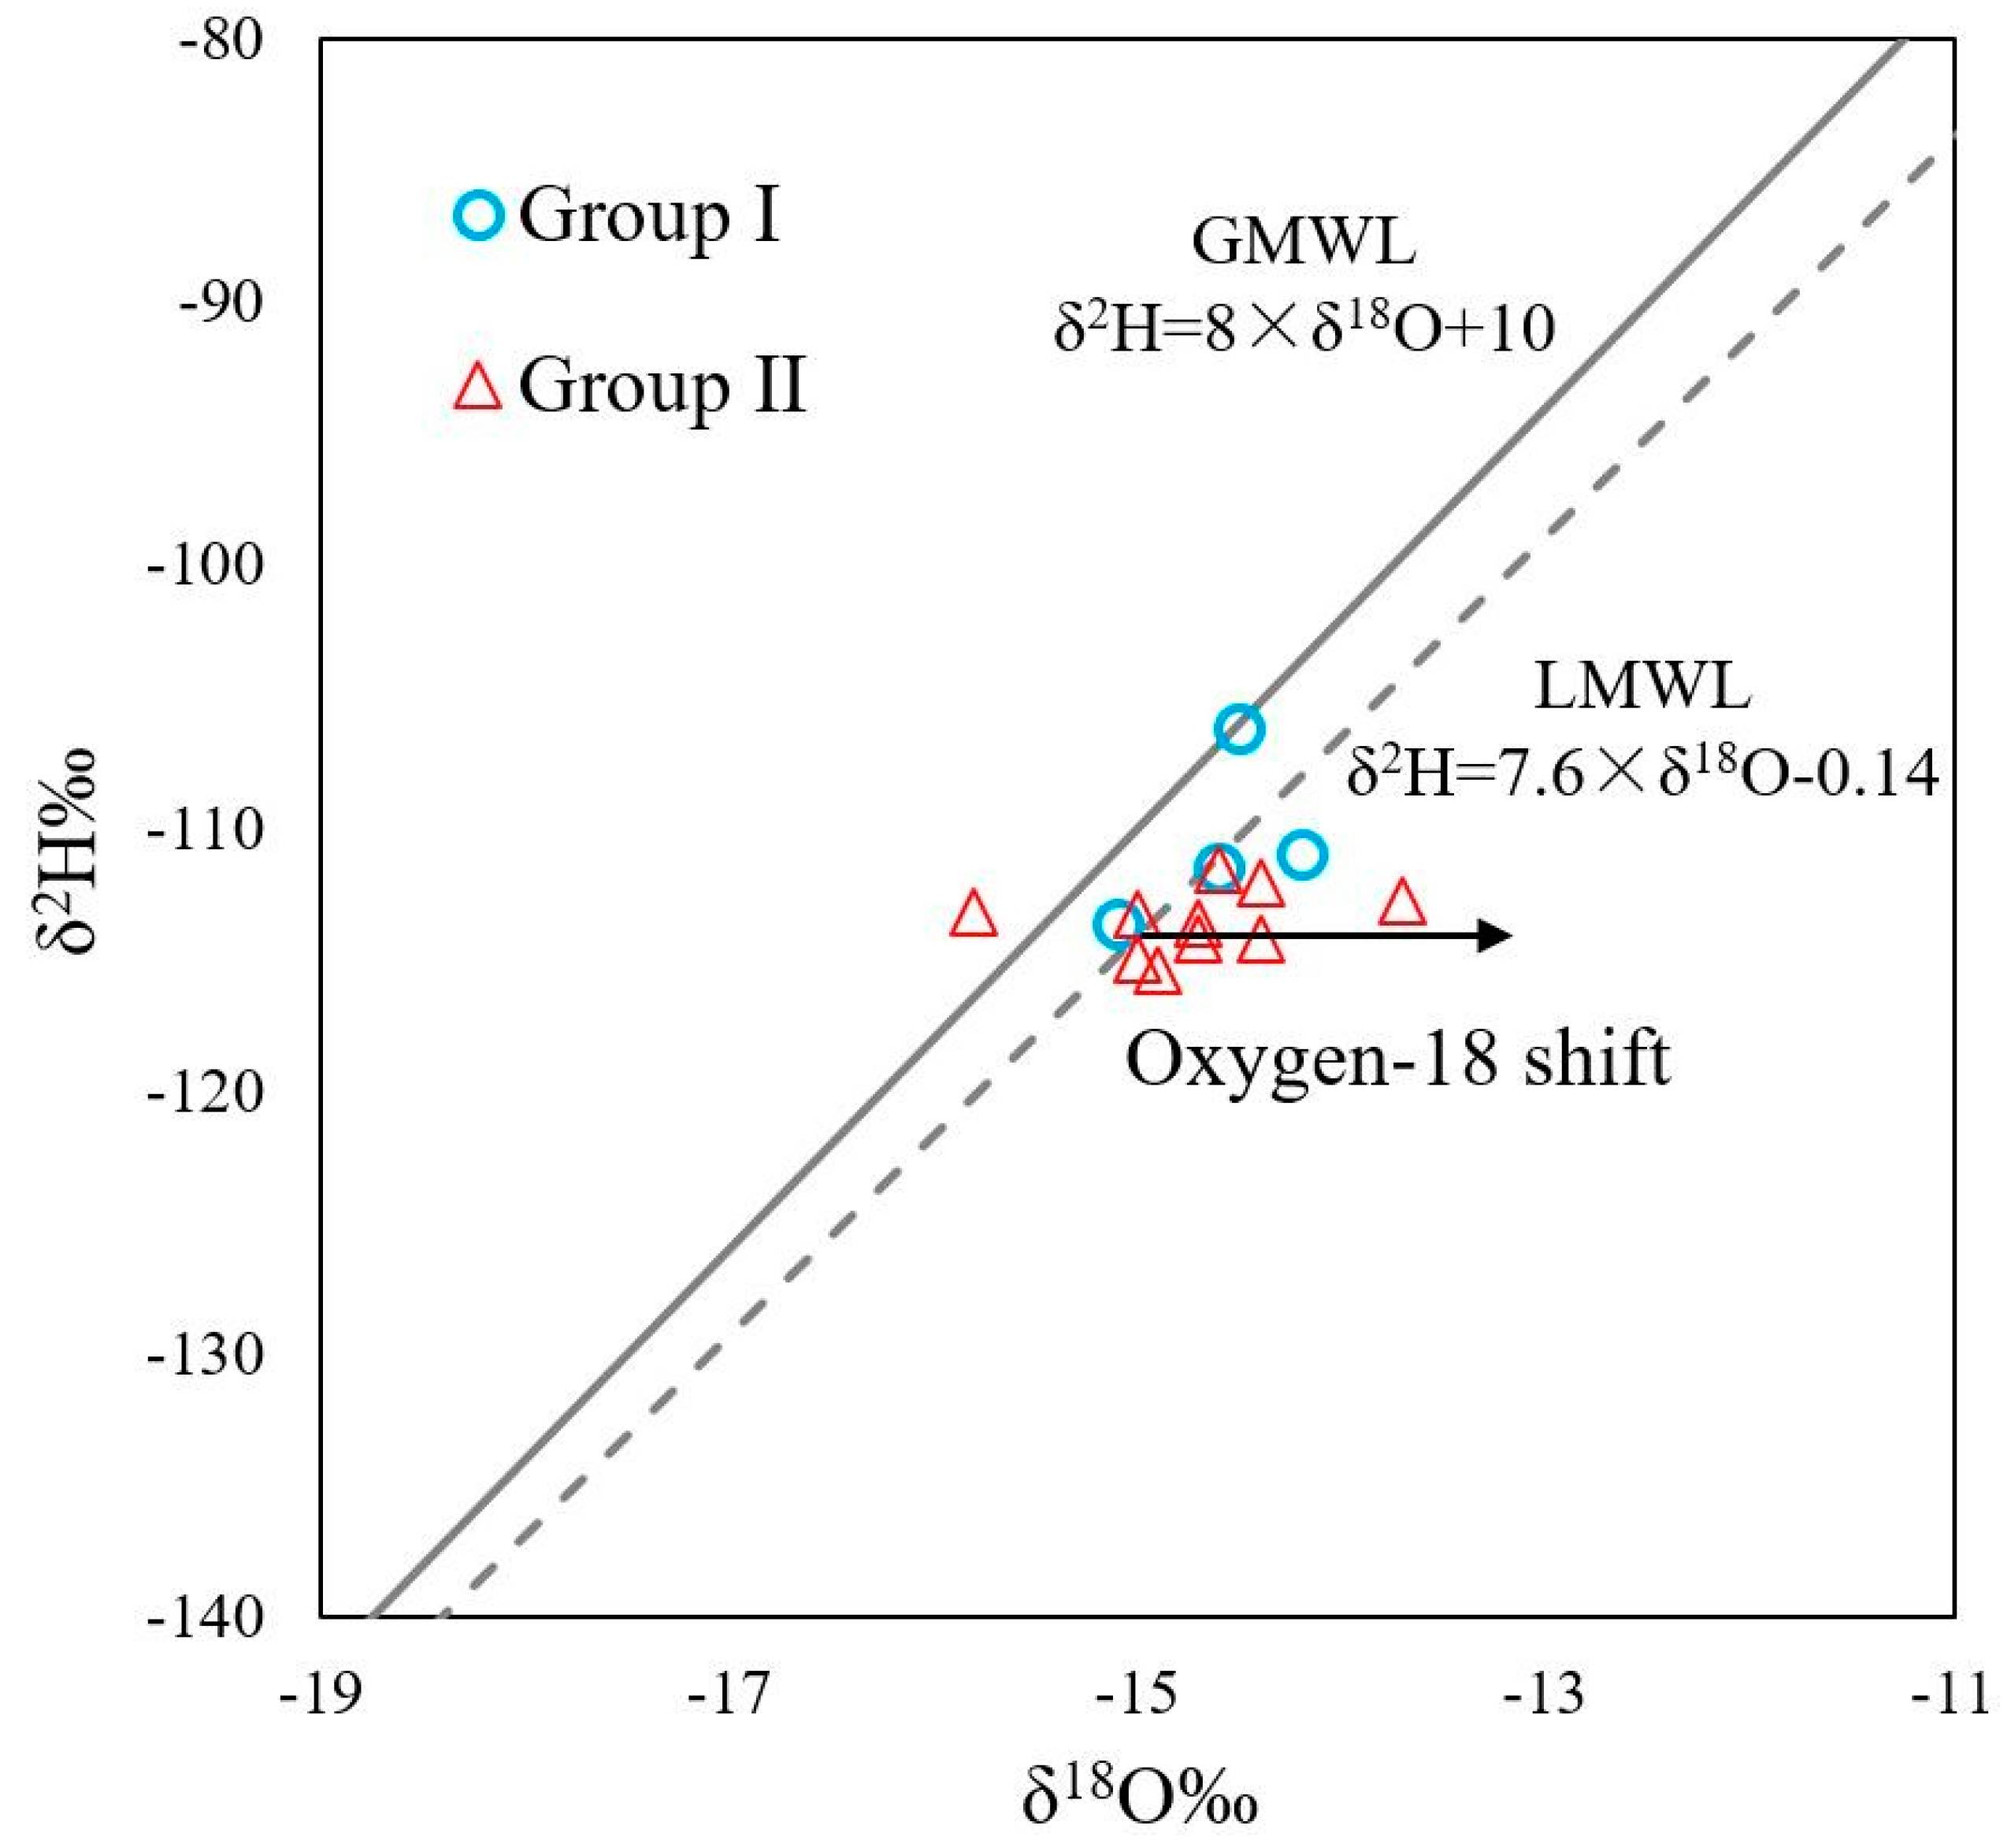
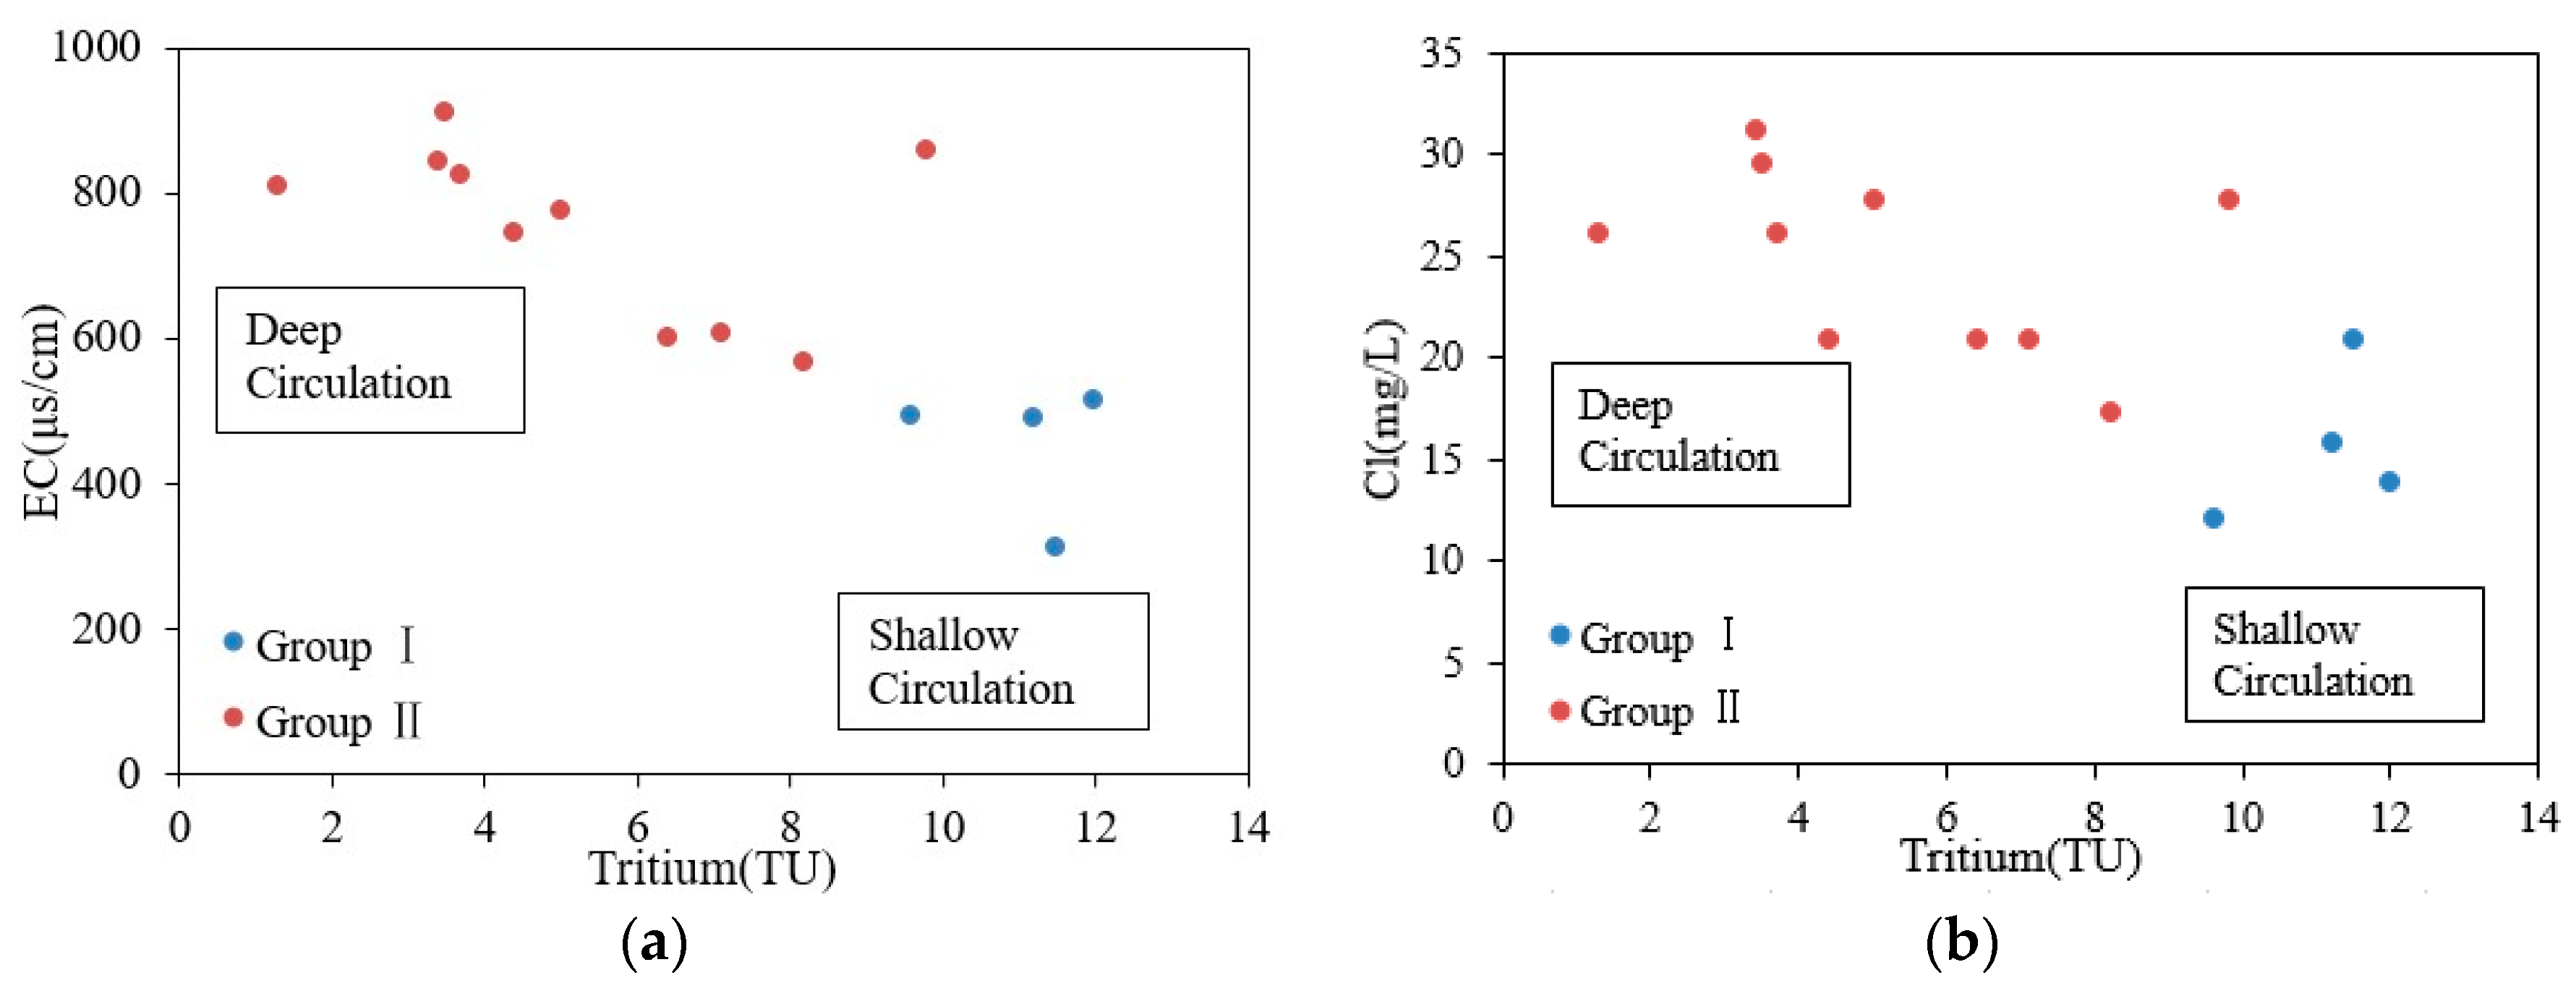
4.2. Source of Recharge

The linear relationship between the 2H and 18O contents of meteoric water can be used to identify the origins of spring water [22] and estimate the recharge elevation. According to data obtained from previous studies, the recharge elevation of the spring samples is approximately 1012 m. The mean δ18O value of precipitation is −7.1‰, and the elevation gradient of δ18O for meteoric water is −4.95‰ per hundred meters [23]. The isotope data ranges from −118.3‰ to −111.5‰ for 2H and from −16.0‰ to −14.2‰ for 18O with respect to the VSMOW (Table 1). The mean δ18O value of precipitation is −7.1‰.
The relationship between the δ18O and δ2H of the springs is shown in Figure 5 with the Global Meteoric Water Line (GMWL) [24] and Local Meteoric Water Line (LMWL) [25]. As shown in Figure 5, all the water samples fall near the GMWL and the LMWL, implying that the spring water is of meteoric origin. A significant 18O shift occurred in the thermal springs in the study area, indicating partial isotopic equilibrium under a high reservoir temperature. The 18O value of the thermal springs is higher, which results from dissolution from the surrounding rocks [26,27].
The isotopic composition of the thermal water was affected by various factors, including latitude, temperature and elevation. According to previous studies, the equation proposed by Dansgaard for the relationship between surface air temperature and δ18O in northern hemisphere and high latitude zone is as follows [28]:
δ18O = 0.69t − 13.6
where t is the mean air temperature in the recharge area (°C).
While the relationship between elevation and δ18O was analyzed using the following equation:
H = (δG − δP)/K + h
where H is the elevation of the recharge area (m), h is the elevation of the water samples (m), δG is the δ18O value of the samples (‰), δP is the mean δ18O value of precipitation (‰), and K is the elevation gradient of δ18O for meteoric water (‰/100 m) [23]. Consequently, the mean air temperature in the recharge area was approximately −1.7 °C. The mean recharge elevation was calculated to vary between 1160 and 1186 m, and the surrounding middle mountains were all at the inferred elevation for recharge.
The groundwater residence time and mixing of water in geothermal systems were analyzed using tritium values [23]. As shown in Table 1, the tritium values of Group I ranged between 9.6 ± 0.5 and 11.5 ± 0.5 TU, and the tritium values of Group II ranged from 1.3 ± 0.4 to 9.8 ± 0.5 TU. Tritium contents below 1 TU suggest an ancient (older than 60 years of age) groundwater source, whereas values above 1 TU represent a modern (younger than 60 years of age) groundwater source [29]. Thus, the tritium values varying from 1.3 to 11.5 TU indicated a mixture of modern and old groundwater when ascending towards the surface [30,31].
The EC–tritium graph (Figure 6a) shows the existence of water from different origins. Group I shows high tritium and low EC values, indicating shallow circulating water, whereas Group II has relatively low tritium and high EC values and is considered deep circulating water.
Differences were observed between the two groups due to the mixing of shallow groundwater and deep circulating water at different ratios [32]. Meanwhile, the long residence time of groundwater was also related to low permeability or deep circulation. The Cl–tritium relationship can also be used to distinguish between shallow and deep circulating water. The Group I water samples consisted of shallow circulating water according to the high tritium and low chloride values (Figure 6b), whereas the Group II water samples belonged to deep circulating water [33].
Consequently, the shallow circulation of groundwater probably results in a short residence time, whereas long residence times may be related to deep groundwater circulation [34]. Thus, we can infer that the Group I samples occur in the shallow cold aquifer related to the local groundwater system, whereas the thermal springs of Group II rising from the deep groundwater system are recharged by deeply circulating meteoric water and are heated by the geothermal reservoir. Meanwhile, the reservoir temperature of the thermal springs is higher than the discharge temperature, and the reservoir temperatures of the thermal springs can be estimated using geothermometers.

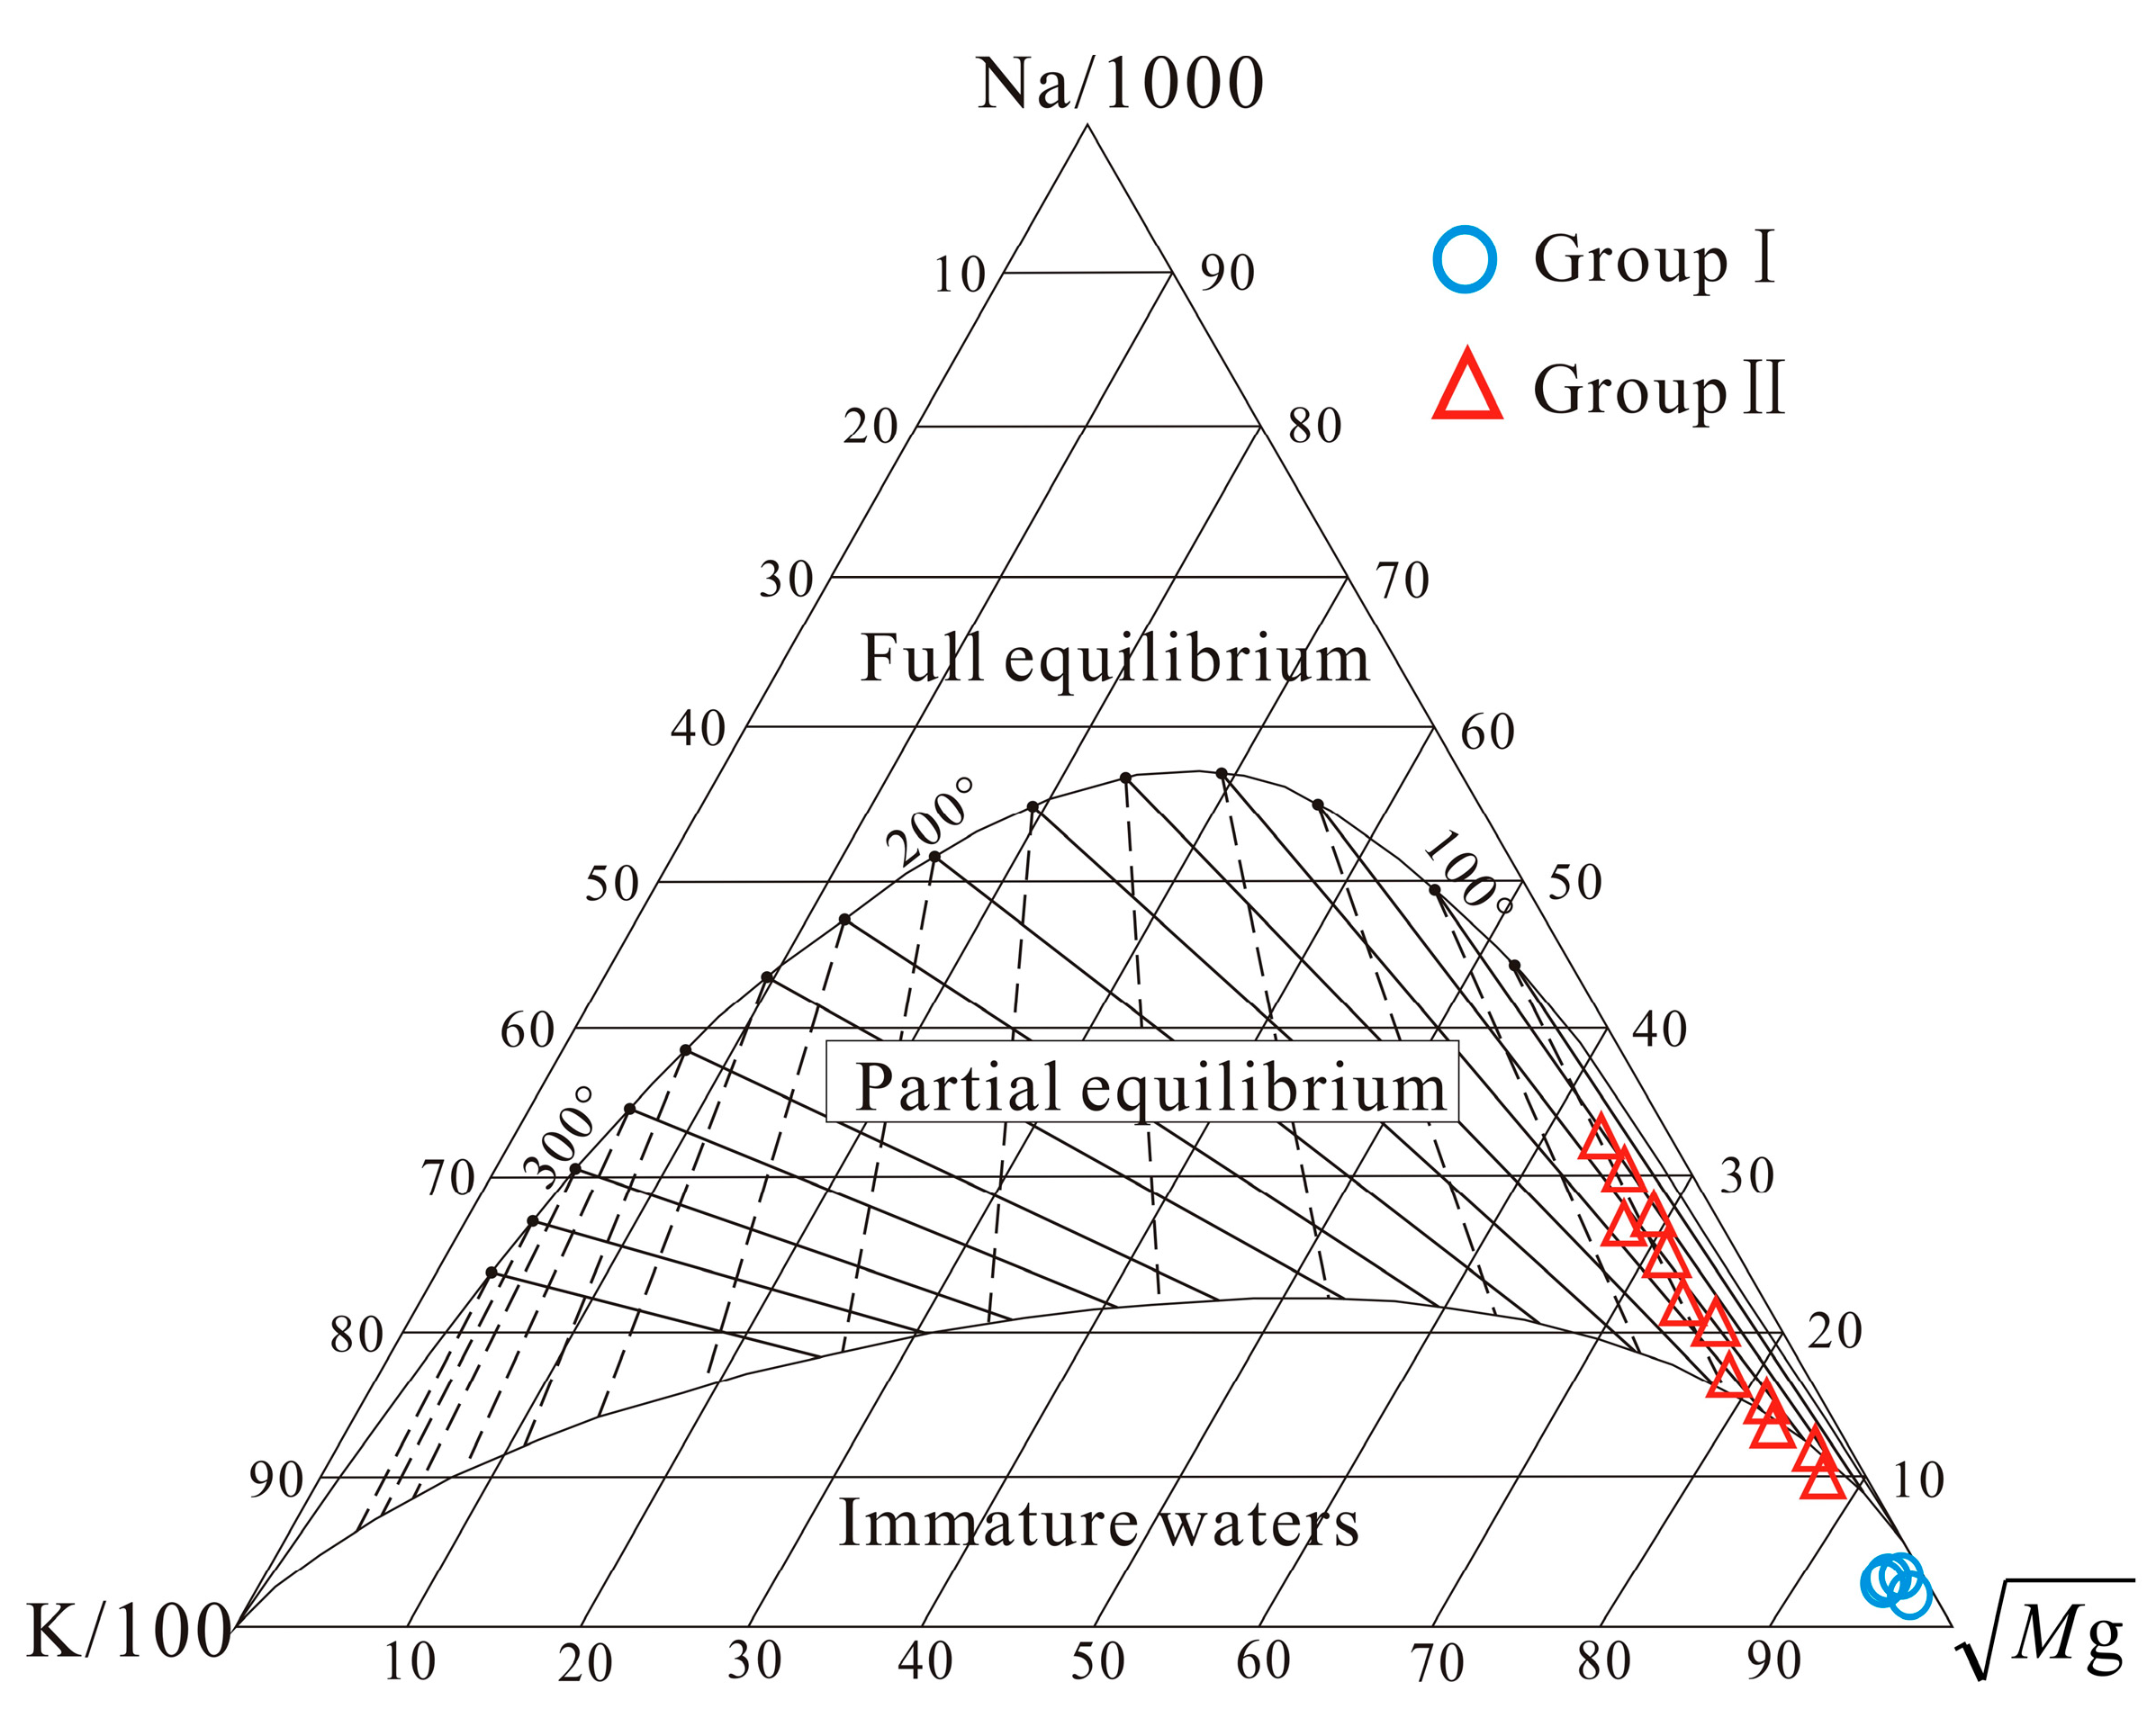
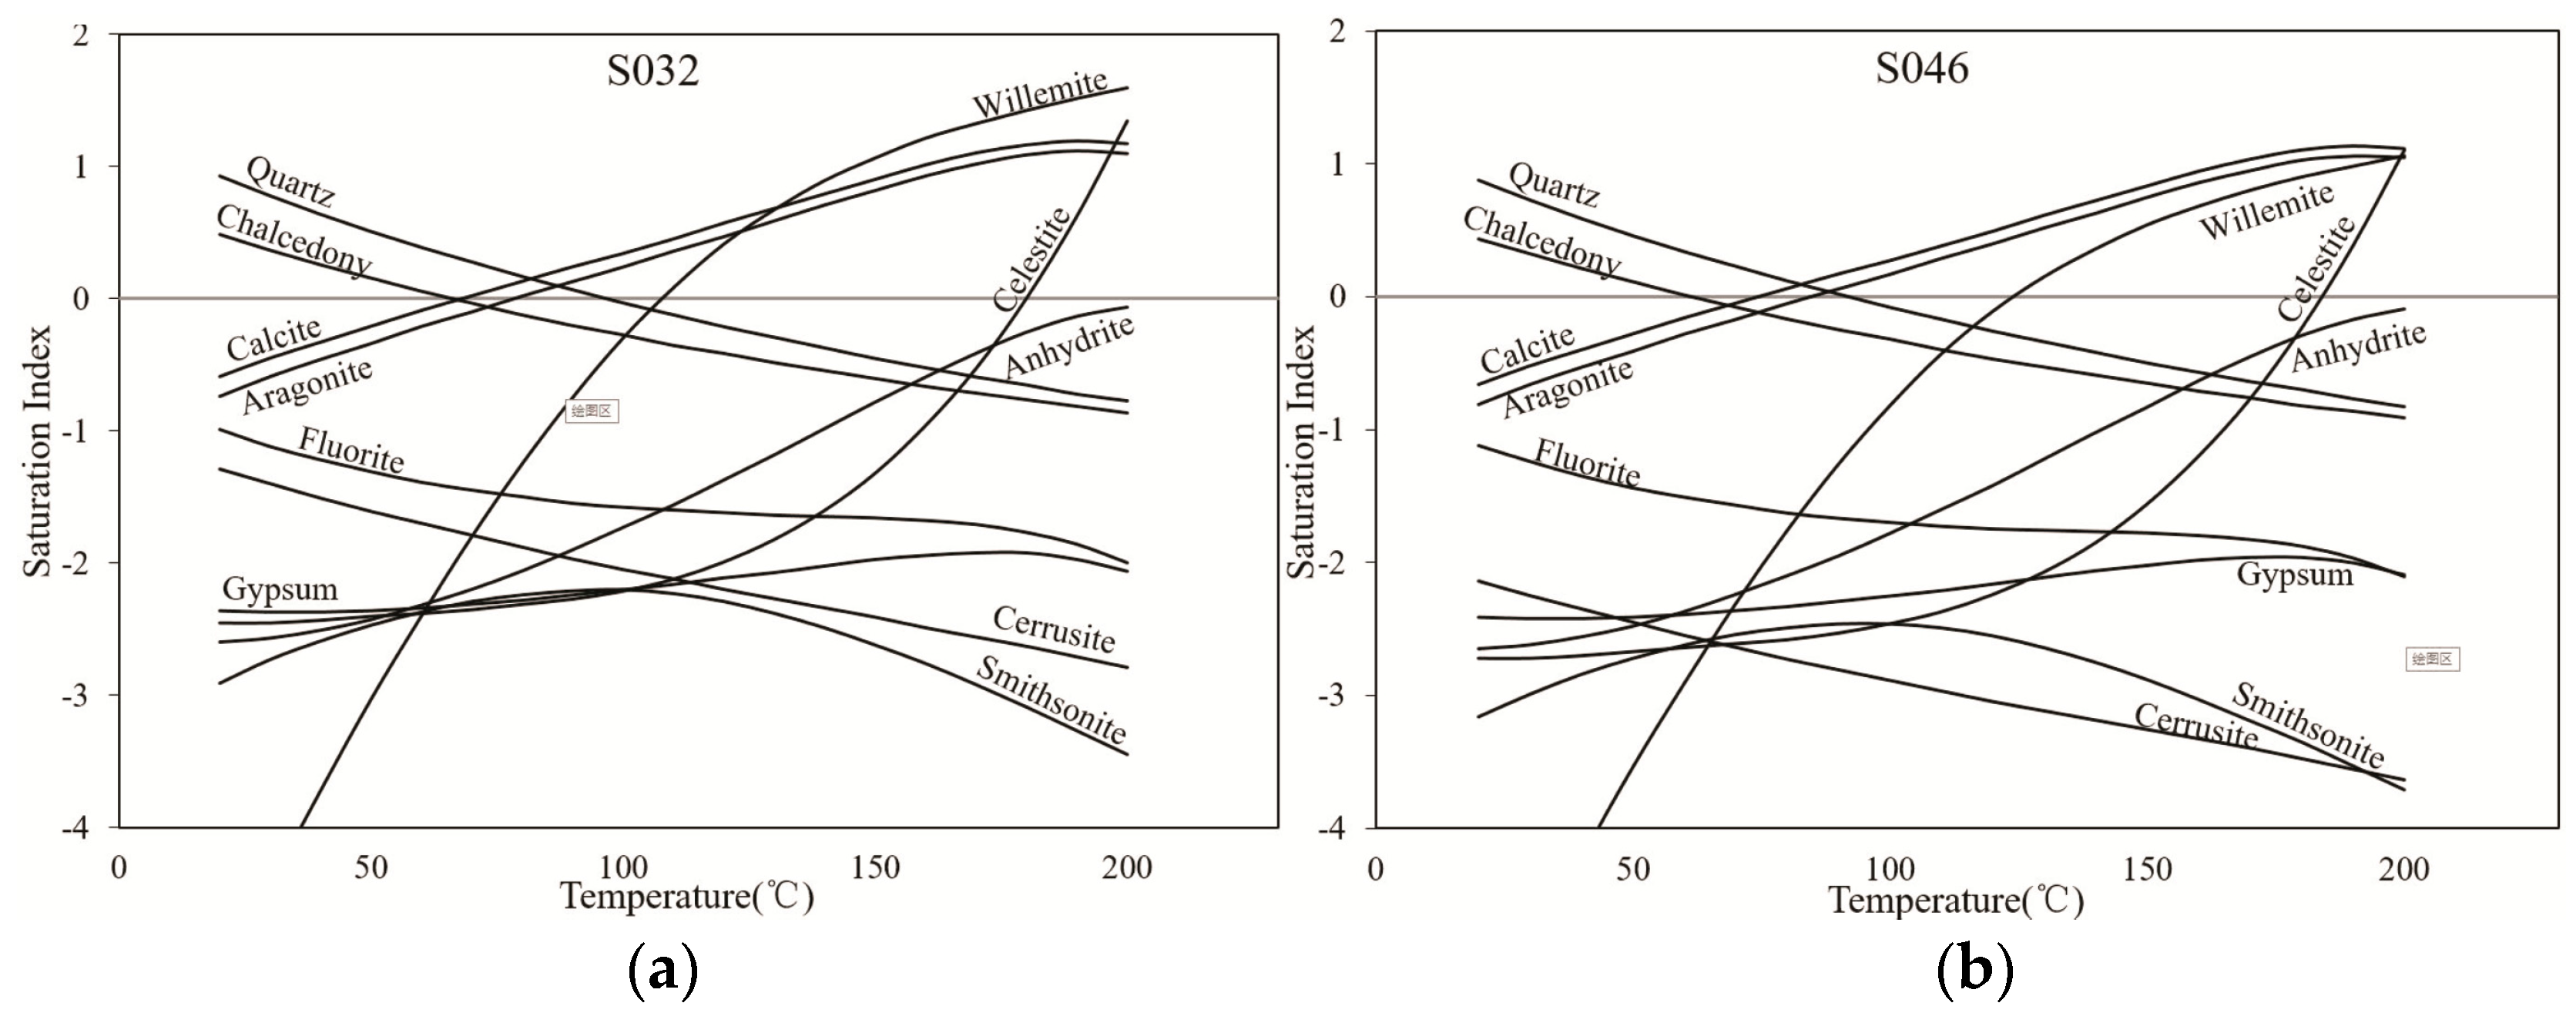
4.3. Hydrogeochemical Thermometry

Silica geothermometers, cation geothermometers, multimineral equilibrium geothermometers, etc., are widely used to estimate the temperatures of thermal reservoirs related to thermal springs [35,36,37]. The reservoir temperatures of the Arxan thermal springs were calculated by using Na–K, K–Mg, Chalcedony and Quartz geothermometers (Table 3).
The results from the different methods show little agreement, with uncertainty mainly resulting from the mixing of thermal water with shallow cold water and the lack of full equilibrium. Meanwhile, because each geothermometer has its own limitations [38,39,40], it is necessary to attain water–rock equilibrium in the geothermal reservoir and to select an appropriate estimation method according to the chemical characteristics of the thermal springs determined by the Na–K–Mg1/2 diagram (Figure 7) [10].
As shown in Figure 7, the mineral springs contain immature water, and the data points of the thermal springs fall in the partially equilibrated water field. The data suggest the occurrence of processes such as re-equilibrium and mixing with cold water, implying that the geothermal water temperatures changed to a greater extent during their re-equilibrium processes [10,41]. Thus, the most suitable geothermometer was the silica geothermometer [10].
The solubility of most minerals in geothermal water varies with temperature. To further estimate the temperature of a reservoir, the mineral that controls the geothermal fluid system must be identified.
Mineral equilibrium calculations are used to estimate mineral reactivity in geothermal systems. A saturated index (SI) of zero shows a saturated solution relative to the solid, whereas a positive SI indicates an oversaturated solution, and a negative SI indicates an under-saturated solution. The saturation indices for many common minerals and for many of the measured outlet temperatures were calculated using the program PHREEQC [42,43] under the assumption that no conductive cooling occurred (Table 4). The equilibrium state between minerals and water is temperature-dependent. The saturation indices were recalculated to estimate the equilibrium states of the hydrothermal minerals under different temperatures (Figure 8).
All water samples were under-saturated with respect to anhydrite, aragonite, calcite, dolomite, gypsum, halite and amorphous silica but oversaturated with respect to chalcedony and quartz. Consequently, chalcedony and quartz have greater solubility in water at the pH values and output water temperatures measured in situ. Atmospheric aqueous CO2 resulted in the release of calcite and aragonite during tuff formation, which is the dominant host rock. The SI of calcite increased from Group III (mean value at −1.40) to Group I (mean value at −0.84), Group II (mean value at −0.50) and Group IV(mean value at −0.08), indicating that the circulation depth and residence time increased.
If the equilibrium lines of a series of estimated minerals converge, the temperature most likely corresponds to the reservoir temperature [44]. As shown in Figure 8, the SIs with respect to chalcedony, calcite, aragonite and quartz minerals tended to converge to zero; therefore, the convergence temperature that reached the equilibrium state ranged from 60 to 80 °C. The large convergence temperature was related to the mixing of shallow cold water and deep thermal water [45]. The equilibrium curves of chalcedony converge between the convergences ranges implied that the equilibrium between thermal water and silica was controlled by chalcedony [30]. Consequently, the estimated reservoir temperatures of the thermal springs by chalcedony geothermometer were reliable , and ranged from 50.9 to 68.8 °C (Table 3) [46].
However, the ascending thermal springs from the deep geothermal reservoir may be cooled by conductive heat loss when travelling through cooler rocks and become mixed with shallow cold water. Based on the above analysis, the difference between the outlet temperatures of the thermal springs mainly resulted from the different mixing ratios of shallow cold water.

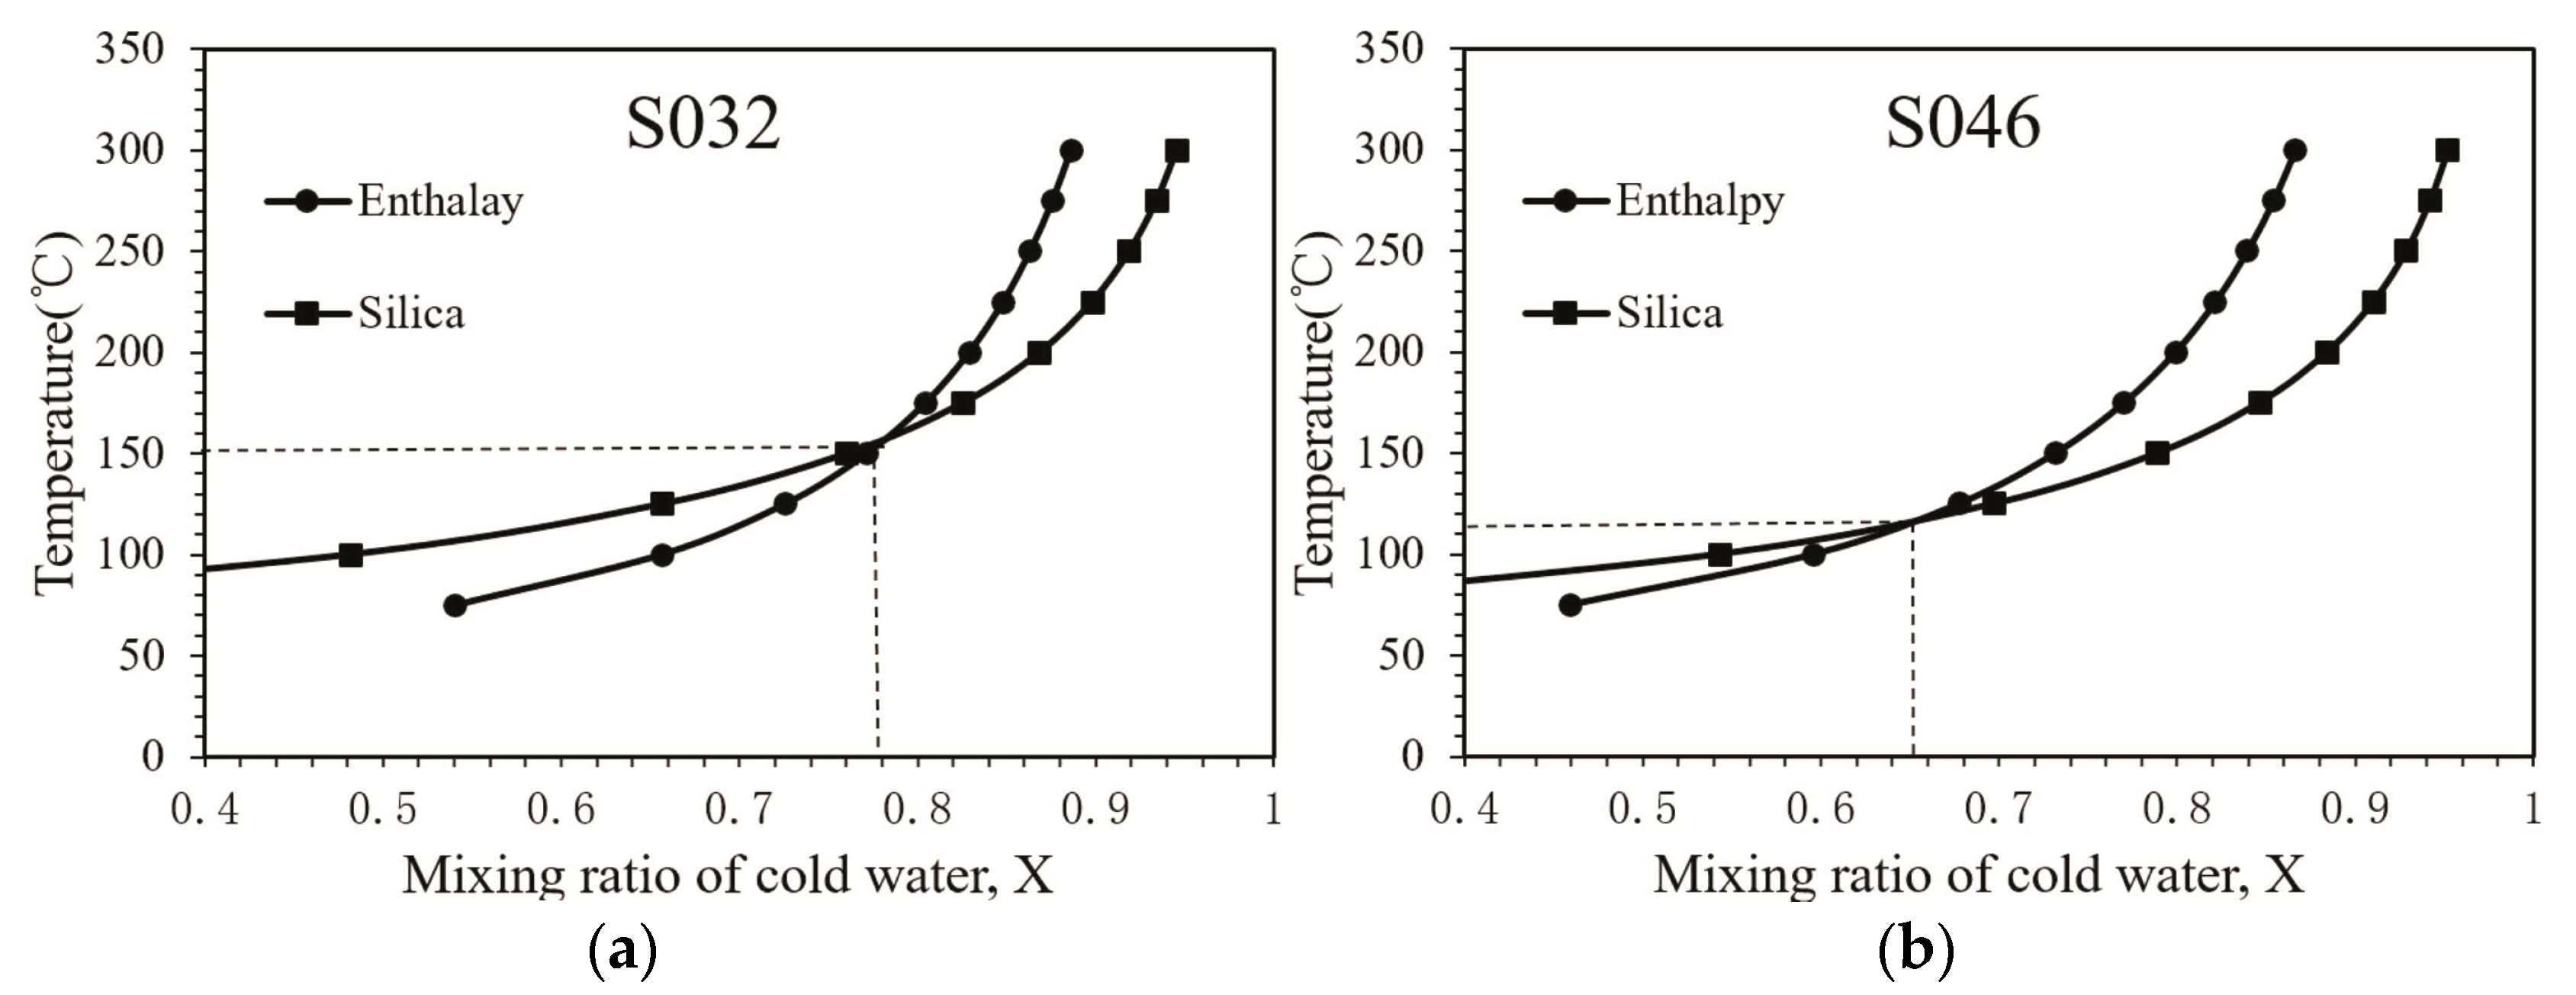
4.4. Mixing of Cold and Thermal Water

The silica-enthalpy method [47] can be used to evaluate the shallow cold water components of mixed water and the reservoir temperatures. The mean temperature of the shallow cold water was assumed to equal the annual mean temperature (1 °C), and the SiO2 concentration was 3 mg/L. Using S046 as an example, the temperature was 41.0 °C and the SiO2 concentration was 40 mg/L. Based on the steam table [48], the enthalpies of the thermal water and cold water were 171.7 and 4.2 kJ/kg, respectively. The intersection point of the mixing line with the solubility curve for chalcedony resulted in an enthalpy of 239 kJ/kg, and the silica content was 62 mg/L in the deep thermal groundwater; thus, the calculated reservoir temperature of the springs was 82–165 °C, which was higher than the temperatures calculated by using the chalcedony geothermometers (50.9~68.8 °C). The overestimated temperatures probably resulted from the occurrence of conductive cooling.
The thermal water temperature and the mixing ratio of cold and thermal water can be estimated based on the chemical contents of the samples. To determine the two unknowns, the two following equations can be solved [49]:
{ H c X + H T ( 1 - X ) = H S SiO 2 C X + SiO 2 T ( 1 - X ) = SiO 2 S
where HC is the enthalpy of the cold water (J), HT is the enthalpy of the deep thermal water (J), HS is the enthalpy of the spring water (J), SiO2C is the SiO2 concentration of the cold groundwater (mg/L), SiO2T is the SiO2 concentration of the deep thermal water (mg/L), SiO2S is the SiO2 concentration of the springs (mg/L), and X is the mixing ratio of cold water with the deep thermal water.
The enthalpy is a function of temperature [50]; thus, X1 can be calculated at different temperatures as follows:
X 1 = H T - H S H T - H C X 2 = SiO 2 T - SiO 2 S SiO 2 T - SiO 2 C
This equation can be solved by using the graphical method, in which S032 and S046 are employed as the representative samples. In Figure 9, X1 is the curve labelled enthalpy, and X2 is the curve labelled silica. The point of intersection of the two curves provides the fraction of cold water and the estimated temperature of the deep thermal water component. The results showed that the proportions of cold water for S032 and S046 were 0.78 and 0.65, respectively.
The ratios of cold water mixing and reservoir temperature are shown in Table 5. The reservoir temperatures of the geothermal springs ranged from 82.0 to 165.0 °C, and the ratios of cold water mixing ranged from 0.54 to 0.87. Although some springs had high reservoir temperatures, i.e., up to 165.0 °C, the outlet temperatures were relatively low due to different amounts of cold water mixing.

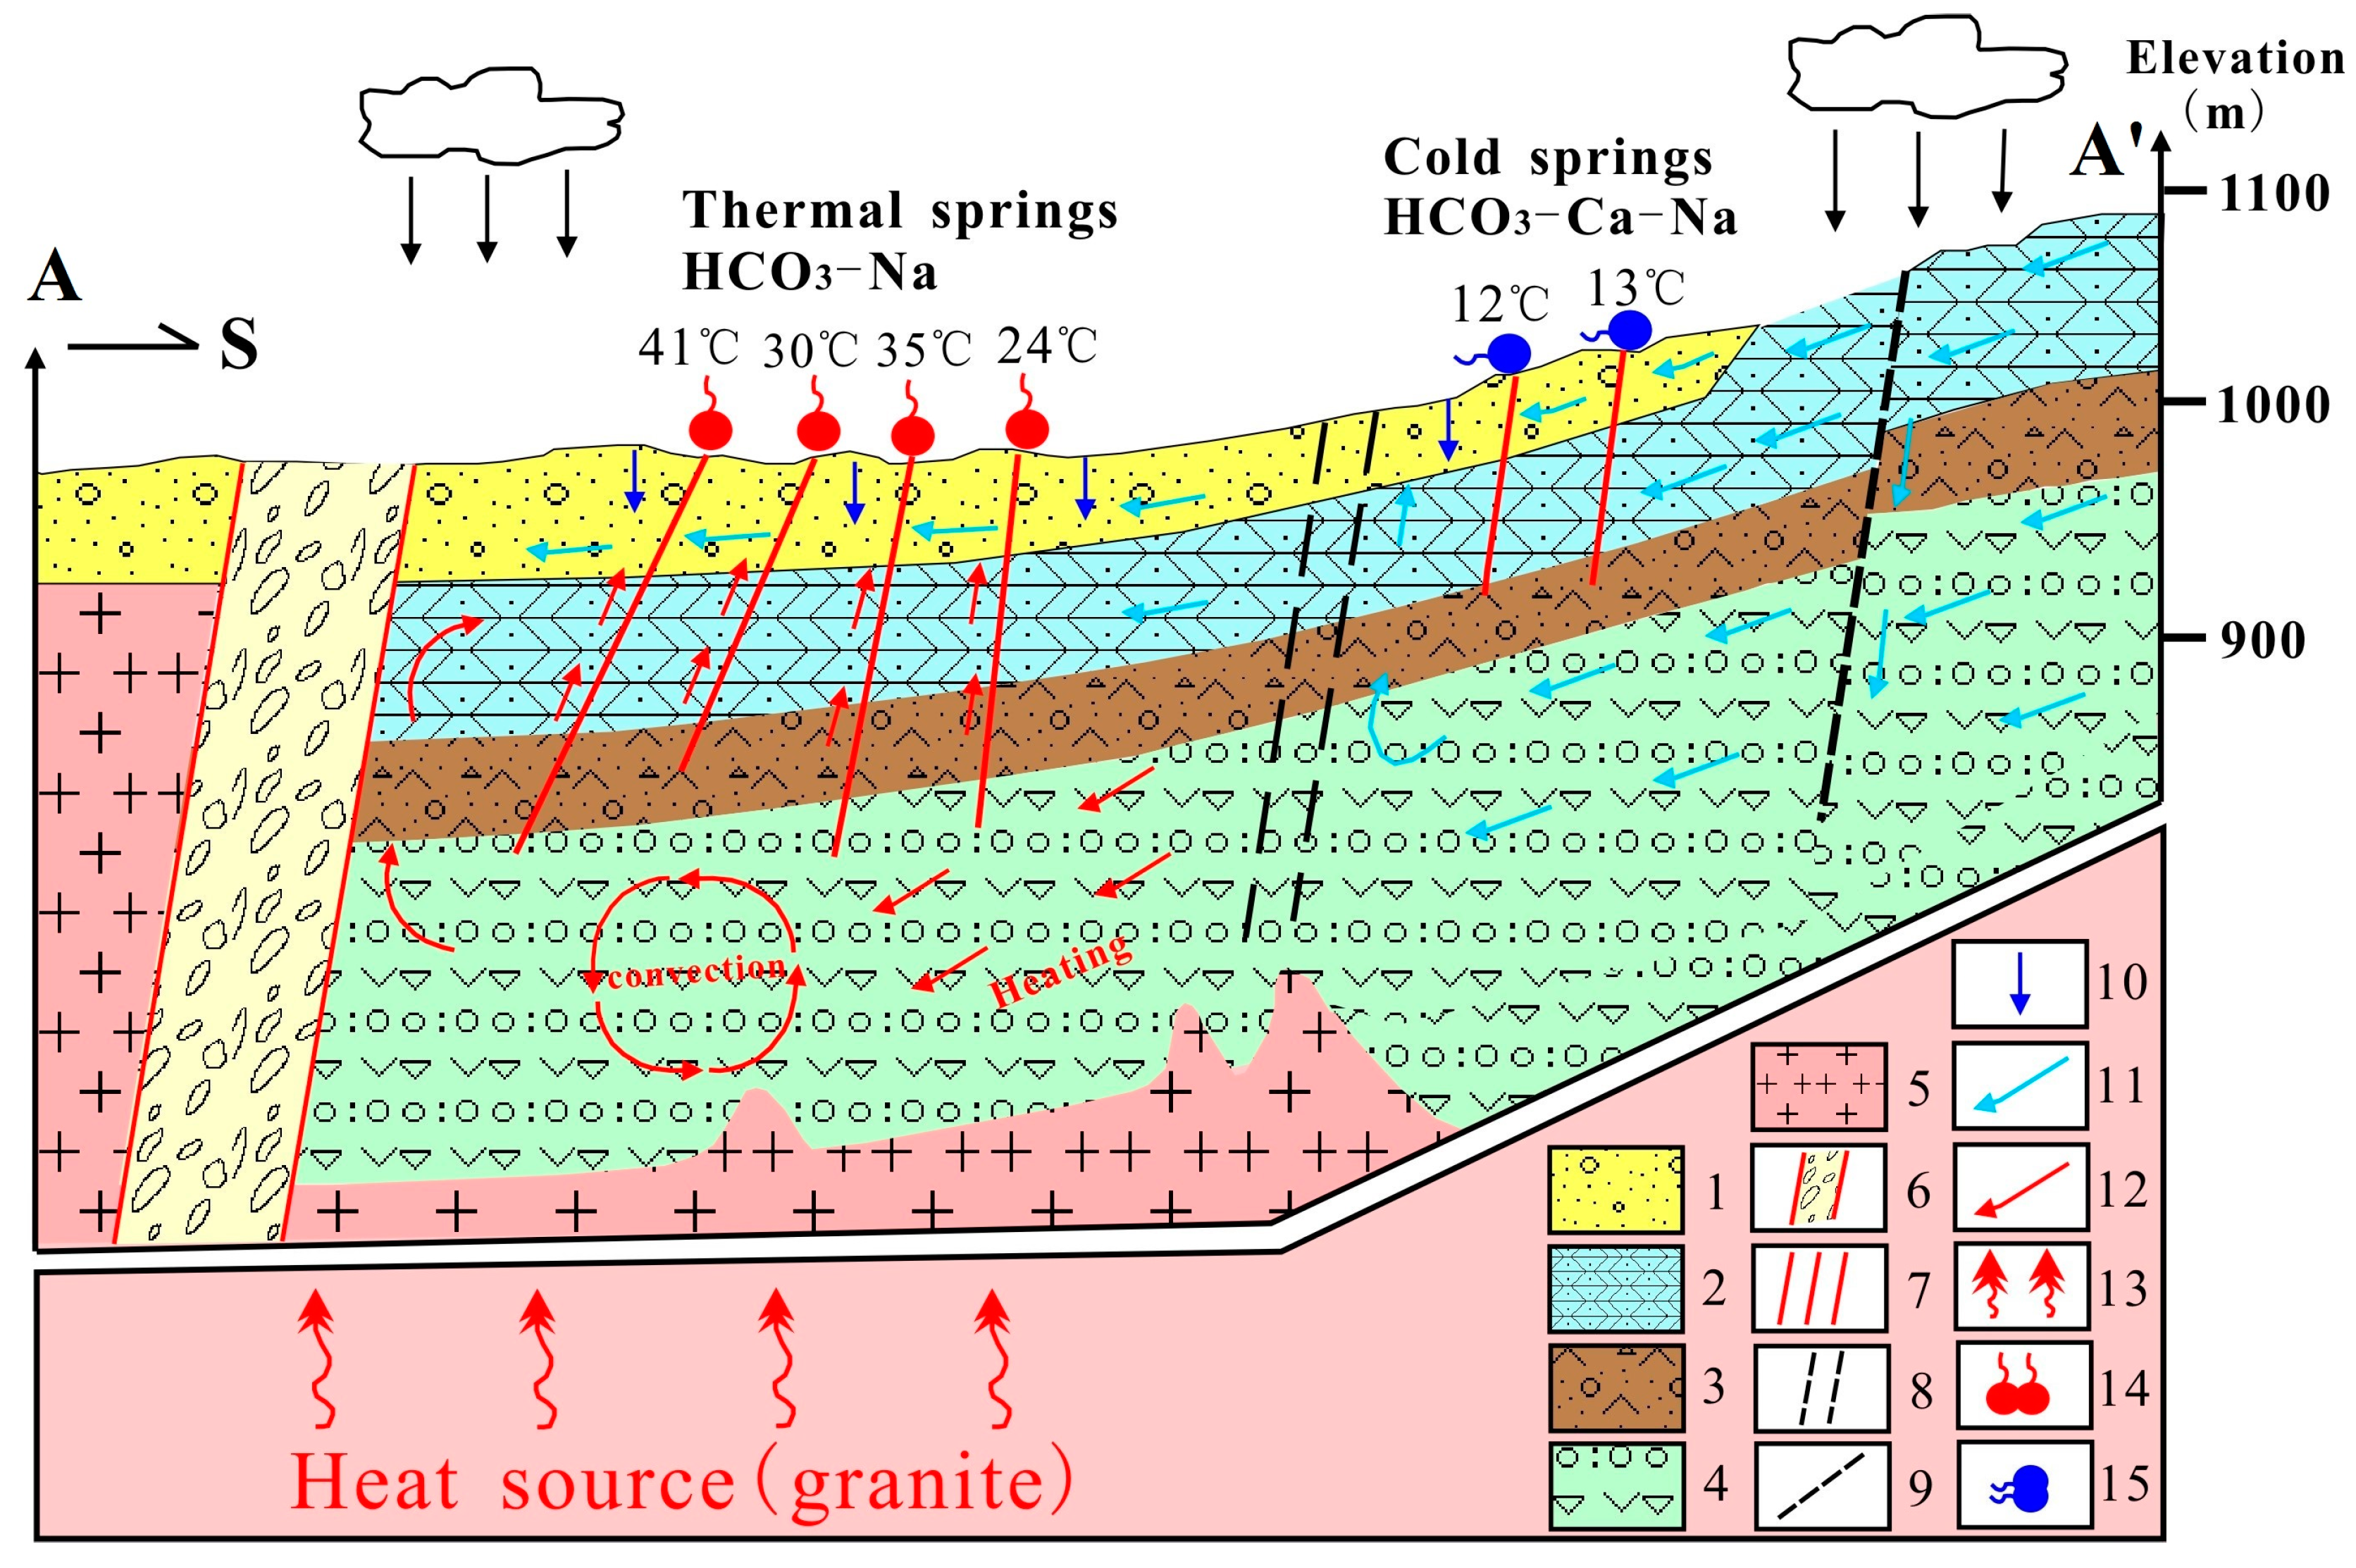
4.5. Conceptual Model of the Geothermal System

A conceptual model for the circulation of meteoric water along deep fractures based on the hydrogeological features of the Arxan geothermal system is shown in Figure 10.
The Arxan springs are recharged by infiltrating meteoric water, and the northern extensional faults might be the main conduits for the geothermal water flow. The thermal water circulates along the NNW-SSE (South-South-East) fracture and the fault system. The groundwater emerges from thermal springs along the geothermal system. After being heated at greater depths, the thermal water rises through the major bounding faults and plumose fractures and then flows towards the center of the Arxan graben and mixes with shallow cold water as it ascends towards the surface. The vertical transport between aquifers is promoted by the NNW trending faults and a series of plumose fractures (Figure 2 and Figure 10), which form the graben structures of the basin. The occurrence of both thermal and mineral springs is probably related to the inferred volcanic conduit. The aquifer in which the mineral springs occur is a shallow groundwater system, and the thermal springs occur in the confined aquifer of the Jurassic system. The springs rise from the deep basement faults as hot fluid, and the different temperatures of the thermal springs are related to the different mixing ratios of shallow cold water.

5. Conclusions

The hydrogeochemical characteristics and genesis of the thermal and mineral springs hosted by deep-seated faults were determined. Different hydrogeochemical and environmental isotopic compositions are related to different hydrogeological systems. Twelve thermal springs exist with temperatures ranging between 22.3 and 41.0 °C, and the main type of water in the springs is HCO3-Na. The mineral springs contain HCO3–Ca·Na water and have temperatures ranging from 10.9 to 12.9 °C.
Strong correlations between some ionic ratios in the thermal water implied that the water–rock interactions were enhanced. The thermal water was oversaturated with respect to silica minerals (chalcedony and quartz) and under-saturated with respect to carbonate (aragonite and calcite) at the outlet temperatures. Based on the Na–K–Mg1/2 diagram, the mineral springs contain immature water and the thermal springs contain partially equilibrated water. Considering the uncertainties associated with using chemical geothermometers, the estimated reservoir temperatures varied from 50.9 to 68.8 °C according to the chalcedony geothermometer and the saturation index method.
The hydrochemical and isotopic compositions of the water were used to establish a conceptual flow model. The δ18O, δ2H and tritium values implied that the thermal springs were of deep circulating meteoric origin, whereas the mineral springs were derived from shallow circulating water. The water was considered to originate from the infiltration of precipitation through faults and fracture zones to the deep hot reservoir. The thermal water ascended along hydrothermal pathways, and the different outlet temperatures of the thermal springs were caused by conductive cooling and different mixing ratios of shallow cold water, which was estimated to have contributions of approximately 54%–87%. These results can be combined with a hydrogeological model to reveal the characteristics of the geothermal system in Arxan and provide new insights into the processes that control the hydrochemical properties of the thermal and mineral springs and the genesis and flow patterns of the geothermal system.

Acknowledgments

This research was supported by the Fundamental Research Funds for the Central Universities (No. 2652016020) and the project “Hydrogeology survey and spring water resources evaluation in Arxan Geopark” from the Arxan Geopark Authority. Special thanks are extended to Zhi Liu, Hongzhi Yu of the Arxan Geopark Authority, Mingzhong Tian and Lulin Wang of China University of Geosciences (Beijing), and Wei Zhao, Hanmo Wang of the Fourth Institute of Hydrogeology and Engineering Geology of Inner Mongolia for their help in the field survey and sampling. We also thank the Analytical Laboratory of Fourth Institute of Hydrogeology and Engineering Geology of Inner Mongolia for the chemical analysis, and the Analytical Laboratory of Beijing Research Institute of Uranium Geology for the isotope analysis.

Author Contributions

Qiulan Zhang, Yali Cui and Jingli Shao conceived and designed the research direction; Yong Xiao, Pengzhang and Jingxing Liu did the field work and collected the water samples; Xiaomin Gu analyzed the data and wrote the paper. All authors read and approved the final manuscript.

Conflicts of Interest

The authors declare no conflicts of interest.

References

  1. Zhou, X. Groundwater Science Monographs; Geology Publishing House: Beijing, China, 2010; pp. 104–105. (In Chinese) [Google Scholar]
  2. Minissale, A.; Mattash, M.A.; Vaselli, O.; Tassi, F.; Al-Ganad, I.N.; Selmo, E.; Shawki, N.M.; Tedesco, D.; Poreda, R.; Ad-Dukhain, A.M.; et al. Thermal springs, fumaroles and gas vents of continental Yemen: Their relation with active tectonics, regional hydrology and the country’s geothermal potential. Appl. Geochem. 2007, 22, 799–820. [Google Scholar] [CrossRef]
  3. De Filippis, L.; Billi, A. Morphotectonics of fissure ridge travertines from geothermal areas of Mammoth Hot Springs (Wyoming) and Bridgeport (California). Tectonophysics 2012, 548–549, 34–48. [Google Scholar] [CrossRef]
  4. Zaher, M.A.; Saibi, H.; Nishijima, J.; Fujimitsu, Y.; Mesbah, H.; Ehara, S. Exploration and assessment of the geothermal resources in the Hammam Faraun hot spring, Sinai Peninsula, Egypt. J. Asian Earth Sci. 2012, 45, 256–267. [Google Scholar] [CrossRef]
  5. Mao, X.; Wang, Y.; Zhan, H.; Feng, L. Geochemical and isotopic characteristics of geothermal springs hosted by deep-seated faults in Dongguan Basin, Southern China. J. Geochem. Explor. 2015, 158, 112–121. [Google Scholar] [CrossRef]
  6. Pasvanoğlu, S. Hydrogeochemical study of the thermal and mineralized waters of the Banaz (Hamamboğazi) area, western Anatolia, Turkey. Environ. Earth Sci. 2012, 65, 741–752. [Google Scholar] [CrossRef]
  7. Katsanou, K.; Siavalas, G.; Lambrakis, N. The thermal and mineral springs of Aitoloakarnania Prefecture: Function mechanism and origin of groundwater. Environ. Earth Sci. 2012, 65, 2351–2364. [Google Scholar] [CrossRef]
  8. Cai, J.; Chu, Y.; Guo, H. The distribution and charactistics of Arxan geothermal sturcture. Heilongjiang Sci. Technol. Water Conserv. 2008, 36, 61–62. (In Chinese) [Google Scholar]
  9. Qi, F.; Zhang, F.; Lu, S.; Sun, Y. The geothermal geological features of Arxan mountains. Jilin Geol. 2012, 31, 109–112. (In Chinese) [Google Scholar]
  10. Giggenbach, W.F. Geothermal solute equilibria-derivation of Na-K-Mg-Ca geoindicators. Geochim. Cosmochim. Acta 1988, 52, 2749–2765. [Google Scholar] [CrossRef]
  11. Guo, F.; Fan, W.; Li, C.; Zhao, L.; Li, H.; Yang, J. Multi-stage crust–mantle interaction in SE China: Temporal, thermal and compositional constraints from the Mesozoic felsic volcanic rocks in eastern Guangdong–Fujian provinces. Lithos 2012, 150, 62–84. [Google Scholar] [CrossRef]
  12. Mottl, M.J.; Seewald, J.S.; Wheat, C.G.; Tivey, M.K.; Michael, P.J.; Proskurowski, G.; McCollom, T.M.; Reeves, E.; Sharkey, J.; You, C.F.; et al. Chemistry of hot springs along the Eastern Lau Spreading Center. Geochim. Cosmochim. Acta 2011, 75, 1013–1038. [Google Scholar] [CrossRef]
  13. Li, J.; Guo, H. The Geological Characteristics and Formation of Arxan Geothermal system. Heilongjiang Land Resour. 2012, 8, 47. (In Chinese) [Google Scholar]
  14. Tang, S. Characteristics of the Late Jurassic Volcanic System in Arxan and the Formation Mechanism of Arxan Hot Springs. Jilin Geol. 1984, 3, 54–64. (In Chinese) [Google Scholar]
  15. Han, X.; Jin, X.; Sun, C. Geothermal Structure of Aershan Hot Springs, Inner Mongolia. AC TA Geosci. Tia Sin. 2001, 22, 259–264. (In Chinese) [Google Scholar]
  16. GB/T8538-2008. Drinking Natural Mineral Water; China Standards Press: Beijing, China, 2008.
  17. GB12375-1990. Analytical Method of Tritium in Water; China Standards Press: Beijing, China, 1990.
  18. Michard, G. Behaviour of major elements and some trace elements (Li, Rb, Cs, Sr, Fe, Mn, W, F) in deep hot waters from granitic areas. Chem. Geol. 1990, 89, 117–134. [Google Scholar] [CrossRef]
  19. Han, D.M.; Liang, X.; Jin, M.G.; Currell, M.J.; Song, X.F.; Liu, C.M. Evaluation of groundwater hydrochemical characteristics and mixing behavior in the Daying and Qicun geothermal systems, Xinzhou Basin. J. Volcanol. Geotherm. Res. 2010, 189, 92–104. [Google Scholar] [CrossRef]
  20. Shakeri, A.; Moore, F.; Kompani-Zare, M. Geochemistry of the thermal springs of Mount Taftan, southeastern Iran. J. Volcanol. Geotherm. Res. 2008, 178, 829–836. [Google Scholar] [CrossRef]
  21. Müller, G. Diagenesis in Argillaceous Sediments. Dev. Sedimentol. 1967, 8, 127–177. [Google Scholar]
  22. Schäffer, R.; Sass, I. The thermal springs of Jordan. Environ. Earth Sci. 2013, 72, 171–187. [Google Scholar] [CrossRef]
  23. Wang, H. An Introduction to Isotopic Hydrogeology; Geological Publishing House: Beijing, China, 1991; p. 191. [Google Scholar]
  24. Craig, H. Isotopic Variation in Meteoric Waters. Science 1961, 133, 1702–1703. [Google Scholar] [CrossRef] [PubMed]
  25. Chen, J.S.; Sun, X.X.; Gu, W.Z.; Tan, H.B.; Rao, W.B.; Dong, H.Z.; Liu, X.Y.; Su, Z.G. Isotopic and hydrochemical data to restrict the origin of the groundwater in the Badain Jaran Desert, Northern China. Geochem. Int. 2012, 50, 455–465. [Google Scholar] [CrossRef]
  26. Ma, Z.; Yu, J.; Su, Y.; Xie, J.; Jia, X.; Hu, Y. δ18O shifts of geothermal waters in the central of Weihe Basin, NW China. Environ. Earth Sci. 2009, 59, 995–1008. [Google Scholar] [CrossRef]
  27. Capasso, G.; Dongarrà, G.; Favara, R.; Hauser, S.; Valenza, M. Isotope composition of rain water, well water and fumarole steam on the island of Vulcano, and their implications for volcanic surveillance. J. Volcanol. Geotherm. Res. 1992, 49, 147–155. [Google Scholar] [CrossRef]
  28. Dansgaard, W. Stable isotopes in precipitation. Tellus 1964, 16, 436–468. [Google Scholar] [CrossRef]
  29. Thomas, J.; Rose, T. Environmental Isotopes in Hydrogeology; Boca Raton Fla Lewis Publishers: Boca Raton, FL, USA, 1997; Volume 80, p. 532. [Google Scholar]
  30. Fournier, R.O. Chemical geothermometers and mixing models for geothermal systems. Geothermics 1977, 5, 41–50. [Google Scholar] [CrossRef]
  31. Ravikumar, P.; Somashekar, R.K. Environmental Tritium (3 H) and hydrochemical investigations to evaluate groundwater in Varahi and Markandeya river basins, Karnataka, India. J. Environ. Radioact. 2011, 102, 153–162. [Google Scholar] [CrossRef] [PubMed]
  32. Günay, G. Hydrology and hydrogeology of Sakaryabaşı Karstic springs, Çifteler, Turkey. Environ. Geol. 2006, 51, 229–240. [Google Scholar] [CrossRef]
  33. Çelmen, O.; Çelik, M. Hydrochemistry and environmental isotope study of the geothermal water around Beypazarı granitoids, Ankara, Turkey. Environ. Geol. 2009, 58, 1689–1701. [Google Scholar] [CrossRef]
  34. Gultekin, F.; Hatipoglu, E.; Ersoy, A.F. Hydrogeochemistry, environmental isotopes and the origin of the Hamamayagi-Ladik thermal spring (Samsun, Turkey). Environ. Earth Sci. 2011, 62, 1351–1360. [Google Scholar] [CrossRef]
  35. Stanley, W.D. Geothermal systems, principles and case histories. Earth-Sci. Rev. 1982, 18, 91–92. [Google Scholar] [CrossRef]
  36. Zhang, X.; Guo, Q.; Li, J.; Liu, M.; Wang, Y.; Yang, Y. Estimation of reservoir temperature using silica and cationic solutes geothermometers: A case study in the Tengchong geothermal area. Chin. J. Geochem. 2015, 34, 233–240. [Google Scholar] [CrossRef]
  37. Spycher, N.; Peiffer, L.; Sonnenthal, E.L.; Saldi, G.; Reed, M.H.; Kennedy, B.M. Integrated multicomponent solute geothermometry. Geothermics 2014, 51, 113–123. [Google Scholar] [CrossRef]
  38. Verma, M. Silica solubility geothermometers for hydrothermal systems. In Proceedings of the 10th International Symposium on Water–Rock Interaction, WRI-10, Villasimius, Italy, 10–15 July 2001.
  39. Dulanya, Z.; Morales-Simfors, N.; Sivertun, Å. Comparative study of the silica and cation geothermometry of the Malawi hot springs: Potential alternative energy source. J. Afr. Earth Sci. 2010, 57, 321–327. [Google Scholar] [CrossRef]
  40. Pope, L.A.; Hajash, A.; Popp, R.K. An experimental investigation of the quartz, Na-K, Na-K-Ca geothermometers and the effects of fluid composition. J. Volcanol. Geotherm. Res. 1987, 31, 151–161. [Google Scholar] [CrossRef]
  41. Baioumy, H.; Nawawi, M.; Wagner, K.; Arifin, M.H. Geochemistry and geothermometry of non-volcanic hot springs in West Malaysia. J. Volcanol. Geotherm. Res. 2015, 290, 12–22. [Google Scholar] [CrossRef]
  42. PHREEQC; version 2.12.5; (Computer File) Water Chemistry, Computer Programs Geochemistry; U.S. Geological Survey: Denver, CO, USA, 1999.
  43. Surveys, G. User’s Guide to PHREEQC—A Computer Program for Speciation, Reaction-Path, Advective-Transport, and Inverse Geochemical Calculations; U.S. Geological Survey: Denver, CO, USA, 1995.
  44. Tole, M.P.; Ármannsson, H.; Zhong-He, P.; Arnórsson, S. Fluid/mineral equilibrium calculations for geothermal fluids and chemical geothermometry. Geothermics 1993, 22, 17–37. [Google Scholar] [CrossRef]
  45. Liu, Y.; Zhou, X.; Deng, Z.; Fang, B.; Tsutomu, Y.; Zhao, J.; Wang, X. Hydrochemical characteristics and genesis analysis of the Jifei hot spring in Yunnan, southwestern China. Geothermics 2015, 53, 38–45. [Google Scholar] [CrossRef]
  46. Arnórsson, S. The use of mixing models and chemical geothermometers for estimating underground temperatures in geothermal systems. J. Volcanol. Geotherm. Res. 1985, 23, 299–335. [Google Scholar] [CrossRef]
  47. Truesdell, A.; Fournier, R. Procedure for estimating temperature of a hot-water component in a mixed water by using a plot of dissolved silica versus enthalpy. J. Res. U.S. Geol. Surv. 1977, 5, 49–52. [Google Scholar]
  48. Keenan, J.H.; Keyes, F.G.; Hill, P.H.; Moore, J.G. Steam tables. J. Appl. Mech. 1978, 37, 567. [Google Scholar] [CrossRef]
  49. Gupta, H.K.; Roy, S. Geothermal Energy: An Alternative Resource for the 21st Century; Elsevier Science & Technology: Amsterdam, The Netherlands, 2006. [Google Scholar]
  50. Fournier, R.O.; Truesdell, A.H. An empirical Na-K-Ca geothermometer for natural waters. Geochim. Cosmochim. Acta 1973, 37, 1543–1550. [Google Scholar] [CrossRef]
Figure 1. Map of the study area: 1, gravel, sand and clay (Quaternary); 2, tuff and breccia (Jurassic); 3, conglomerate and killas (Devonian); 4, glutenite and argillaceous siltstone (Ordovician); 5, granite (Yanshanian); 6, quartz diorite (Yanshanian); 7, dioritic porphyrite (Yanshanian); 8, granite dyke; 9, fault; 10, inferred fault; 11, volcanic conduit; 12, caldera; 13, rivers; 14, thermal springs; 15, mineral springs; 16, sampling points of the shallow (a) and deep (b) groundwater; and 17, study area.
Water 09 00061 g001
Figure 2. Location of the spring samples and the profile (A-A’) of the study area.
Water 09 00061 g002
Figure 3. Piper diagram showing the hydrochemical compositions of the samples.
Water 09 00061 g003
Figure 4. Plots of ion contents vs. chloride contents in the thermal and mineral water in Arxan (a) EC vs. Cl; (b) T vs. Cl; (c) Na vs. Cl; (d) K vs. Cl; (e) HCO3 vs. Cl; and (f) SO4 vs. Cl.
Water 09 00061 g004
Figure 5. δ2H vs δ18O plot for water samples and the Global Meteoric Water Line (GMWL) and Local Meteoric Water Line (LMWL).
Water 09 00061 g005
Figure 6. Plots of the tritium contents for water samples against the hydrochemical parameters of (a) EC (μS/cm) and (b) Cl (mg/L).
Water 09 00061 g006
Figure 7. Triangular diagram of Na–K–Mg1/2.
Water 09 00061 g007
Figure 8. Mineral equilibrium diagram of the sampling points (a) S032 and (b) S046 as representatives of thermal water.
Water 09 00061 g008
Figure 9. Relationship between the temperature and the mixing ratio of cold water for (a) S032 and (b) S046.
Water 09 00061 g009
Figure 10. Conceptual model of the Arxan geothermal system: 1, gravel, sand and clay (Quaternary); 2, rhyolitic tuff (Jurassic); 3, tuffaceous conglomerate (Jurassic); 4, tuffaceous breccia (Jurassic); 5, granite (Yanshanian); 6, volcanic conduit; 7, plumose fractures; 8, inferred volcanic conduit; 9, caldera; 10, precipitation infiltration direction; 11, cold water flow direction; 12, geothermal fluid flow direction; 13, heat flux; 14, thermal springs; and 15, mineral springs.
Water 09 00061 g010
Table 1. Results of the chemical analysis of the samples. n.a., not analyzed; T, water temperature; TDS, total dissolved solids; EC, electrical conductivities; DO, dissolved oxygen.
No.T (°C)pHTDS (mg/L)EC (μS/cm)DO (mg/L)Na (mg/L)K (mg/L)Ca (mg/L)Mg (mg/L)Cl (mg/L)SO4 (mg/L)HCO3 (mg/L)SiO2 (mg/L)δ18O (‰SMOW)δ2H (‰SMOW)Tritium (TU)
Group I
S01510.97.229549373685.8282.79125419029−14.2−1119.6 ± 0.5
S01611.97.029451594722.9272.43145019329−15.1−113.612.0 ± 0.5
S01812.97.1382310144861.8344.72216020932−14.6−111.511.5 ± 0.5
S02512.97.027948876672.7251.97165016832−14.5−106.211.2 ± 0.5
Group II
S03322.07.3345567561142.48.20.1174920635−15.0−115.08.2 ± 0.5
S03923.07.2380606581143.2180.9217021632−14.4−112.17.1 ± 0.5
S04022.37.2403598651163.0190.8216824232−15.4−113.26.4 ± 0.4
S05023.87.5572857831833.6190.87288037139−14.6−111.69.8 ± 0.5
S05524.07.9505858871693.7110.142810029944n.a.n.a.n.a.
S02924.07.4536775311822.7100.012811230838−15.0−113.35.0 ± 0.4
S05228.27.4505823451643.3110.09267030247−14.7−113.63.7 ± 0.4
S04929.57.5548843381763.2150.00319531338−14.4−114.23.4 ± 0.4
S04430.17.4446744401512.78.70.03216628041−13.7−112.84.4 ± 0.4
S04834.07.5463760251553.29.20.03247530245n.a.n.a.n.a.
S03235.07.45569095.91823.4110.23309733645−14.9−115.43.5 ± 0.4
S04641.07.45308075.81833.0100.01269832140−14.7−114.21.3 ± 0.4
Group III
Z0016.06.817517792250.6201.096.9535521n.a.n.a.n.a.
Z00215.96.617317365121.1191.936.9137224n.a.n.a.n.a.
Z0038.98.213613624271.9162.708.785618n.a.n.a.n.a.
Z0048.77.385772194.51.6111.480.1104417n.a.n.a.n.a.
Group IV
Z0059.77.8768766192602.55510.33311012530n.a.n.a.n.a.
Table 2. Mean ionic ratios of the water samples.
SamplesNa/Cl (Mean)K/Cl (Mean)Ca/Mg (Mean)SO4/Cl (Mean)HCO3/Cl (Mean)
Mineral springs (Group I)4.80.210.33.512.5
Thermal springs (Group II)6.30.195.13.311.6
Shallow groundwater (Group III)1.70.210.33.07.7
Deep groundwater (Group IV)1.80.15.33.43.8
Table 3. Estimated reservoir temperature (°C) using chemical geothermometers.
SampleTemperature (°C)Na–KK–MgChalcedonyQuartz No-Steam LossQuartz-Max, Steam Loss
S03322.0107.487.654.985.988.7
S03923.0102.168.850.982.185.4
S04022.3116.768.950.982.185.4
S05023.8103.471.759.990.692.8
S05524.0108.195.265.695.997.5
S02924.091.9100.158.789.491.8
S03235.0101.086.566.797.098.4
S04430.1100.0108.462.292.894.7
S04641.095.5127.061.191.793.8
S04834.0106.2113.266.797.098.4
S04929.5100.9130.058.789.491.8
S05228.2104.698.268.898.9100.1
Table 4. Saturation index of the water samples.
No.AnhydriteAragoniteCalciteChalcedonyDolomiteGypsumHaliteQuartzSiO2(a)
Group I
S015−2.41−0.88−0.730.41−2.29−2.15−7.610.88−0.48
S016−2.45−1.04−0.890.39−2.67−2.19−7.530.87−0.49
S018−2.31−0.89−0.740.42−2.16−2.05−7.290.89−0.46
S025−2.47−1.13−0.980.42−2.89−2.22−7.500.89−0.46
Group II
S033−2.96−1.15−1.010.35−3.62−2.73−7.260.79−0.50
S039−2.49−0.87−0.720.30−2.43−2.26−7.190.74−0.55
S040−2.49−0.82−0.670.31−2.41−2.26−7.180.75−0.54
S050−2.47−0.32−0.170.38−1.36−2.24−6.880.81−0.47
S055−2.60−0.30−0.150.42−1.87−2.37−6.910.86−0.42
S029−2.59−0.73−0.590.36−3.85−2.37−6.880.80−0.48
S032−2.54−0.53−0.390.31−0.88−2.37−7.210.71−0.49
S044−2.83−0.77−0.630.33−3.32−2.62−7.070.74−0.5
S046−2.55−0.52−0.390.2−0.84−2.41−6.910.58−0.59
S048−2.64−0.57−0.430.32−2.92−2.56−7.020.73−0.49
S049−2.48−0.42−0.280.3−4.35−2.28−6.840.72−0.52
S052−2.74−0.68−0.540.41−2.78−2.53−6.940.83−0.42
Group III
Z001−2.48−1.93−1.770.33−4.75−2.22−8.270.82−0.58
Z002−3.08−1.93−1.780.26−4.31−2.84−8.610.72−0.61
Z003−3.34−0.61−0.460.22−1.58−3.09−8.710.70−0.68
Z004−3.35−1.75−1.590.20−3.97−3.10−10.840.69−0.70
Group IV
Z005−1.88−0.24−0.080.44−0.78−1.63−6.970.91−0.46
Table 5. Estimated reservoir temperature and cold water mixing ratio.
No.Outlet Temperature (°C)Reservoir Temperature (°C)Mixing Ratio of Cold Water
S04641.082.00.54
S03322.0114.00.83
S04022.393.00.79
S03923.087.00.76
S05023.8136.00.86
S02924.0122.00.83
S05524.0165.00.87
S05228.2150.00.84
S04929.5103.00.74
S04430.1118.00.78
S04834.0122.00.76
S03235.01160.72

