
Herbivory of Omnivorous Fish Shapes the Food Web Structure of a Chinese Tropical Eutrophic Lake: Evidence from Stable Isotope and Fish Gut Content Analyses


Abstract
:1. Introduction
2. Methods
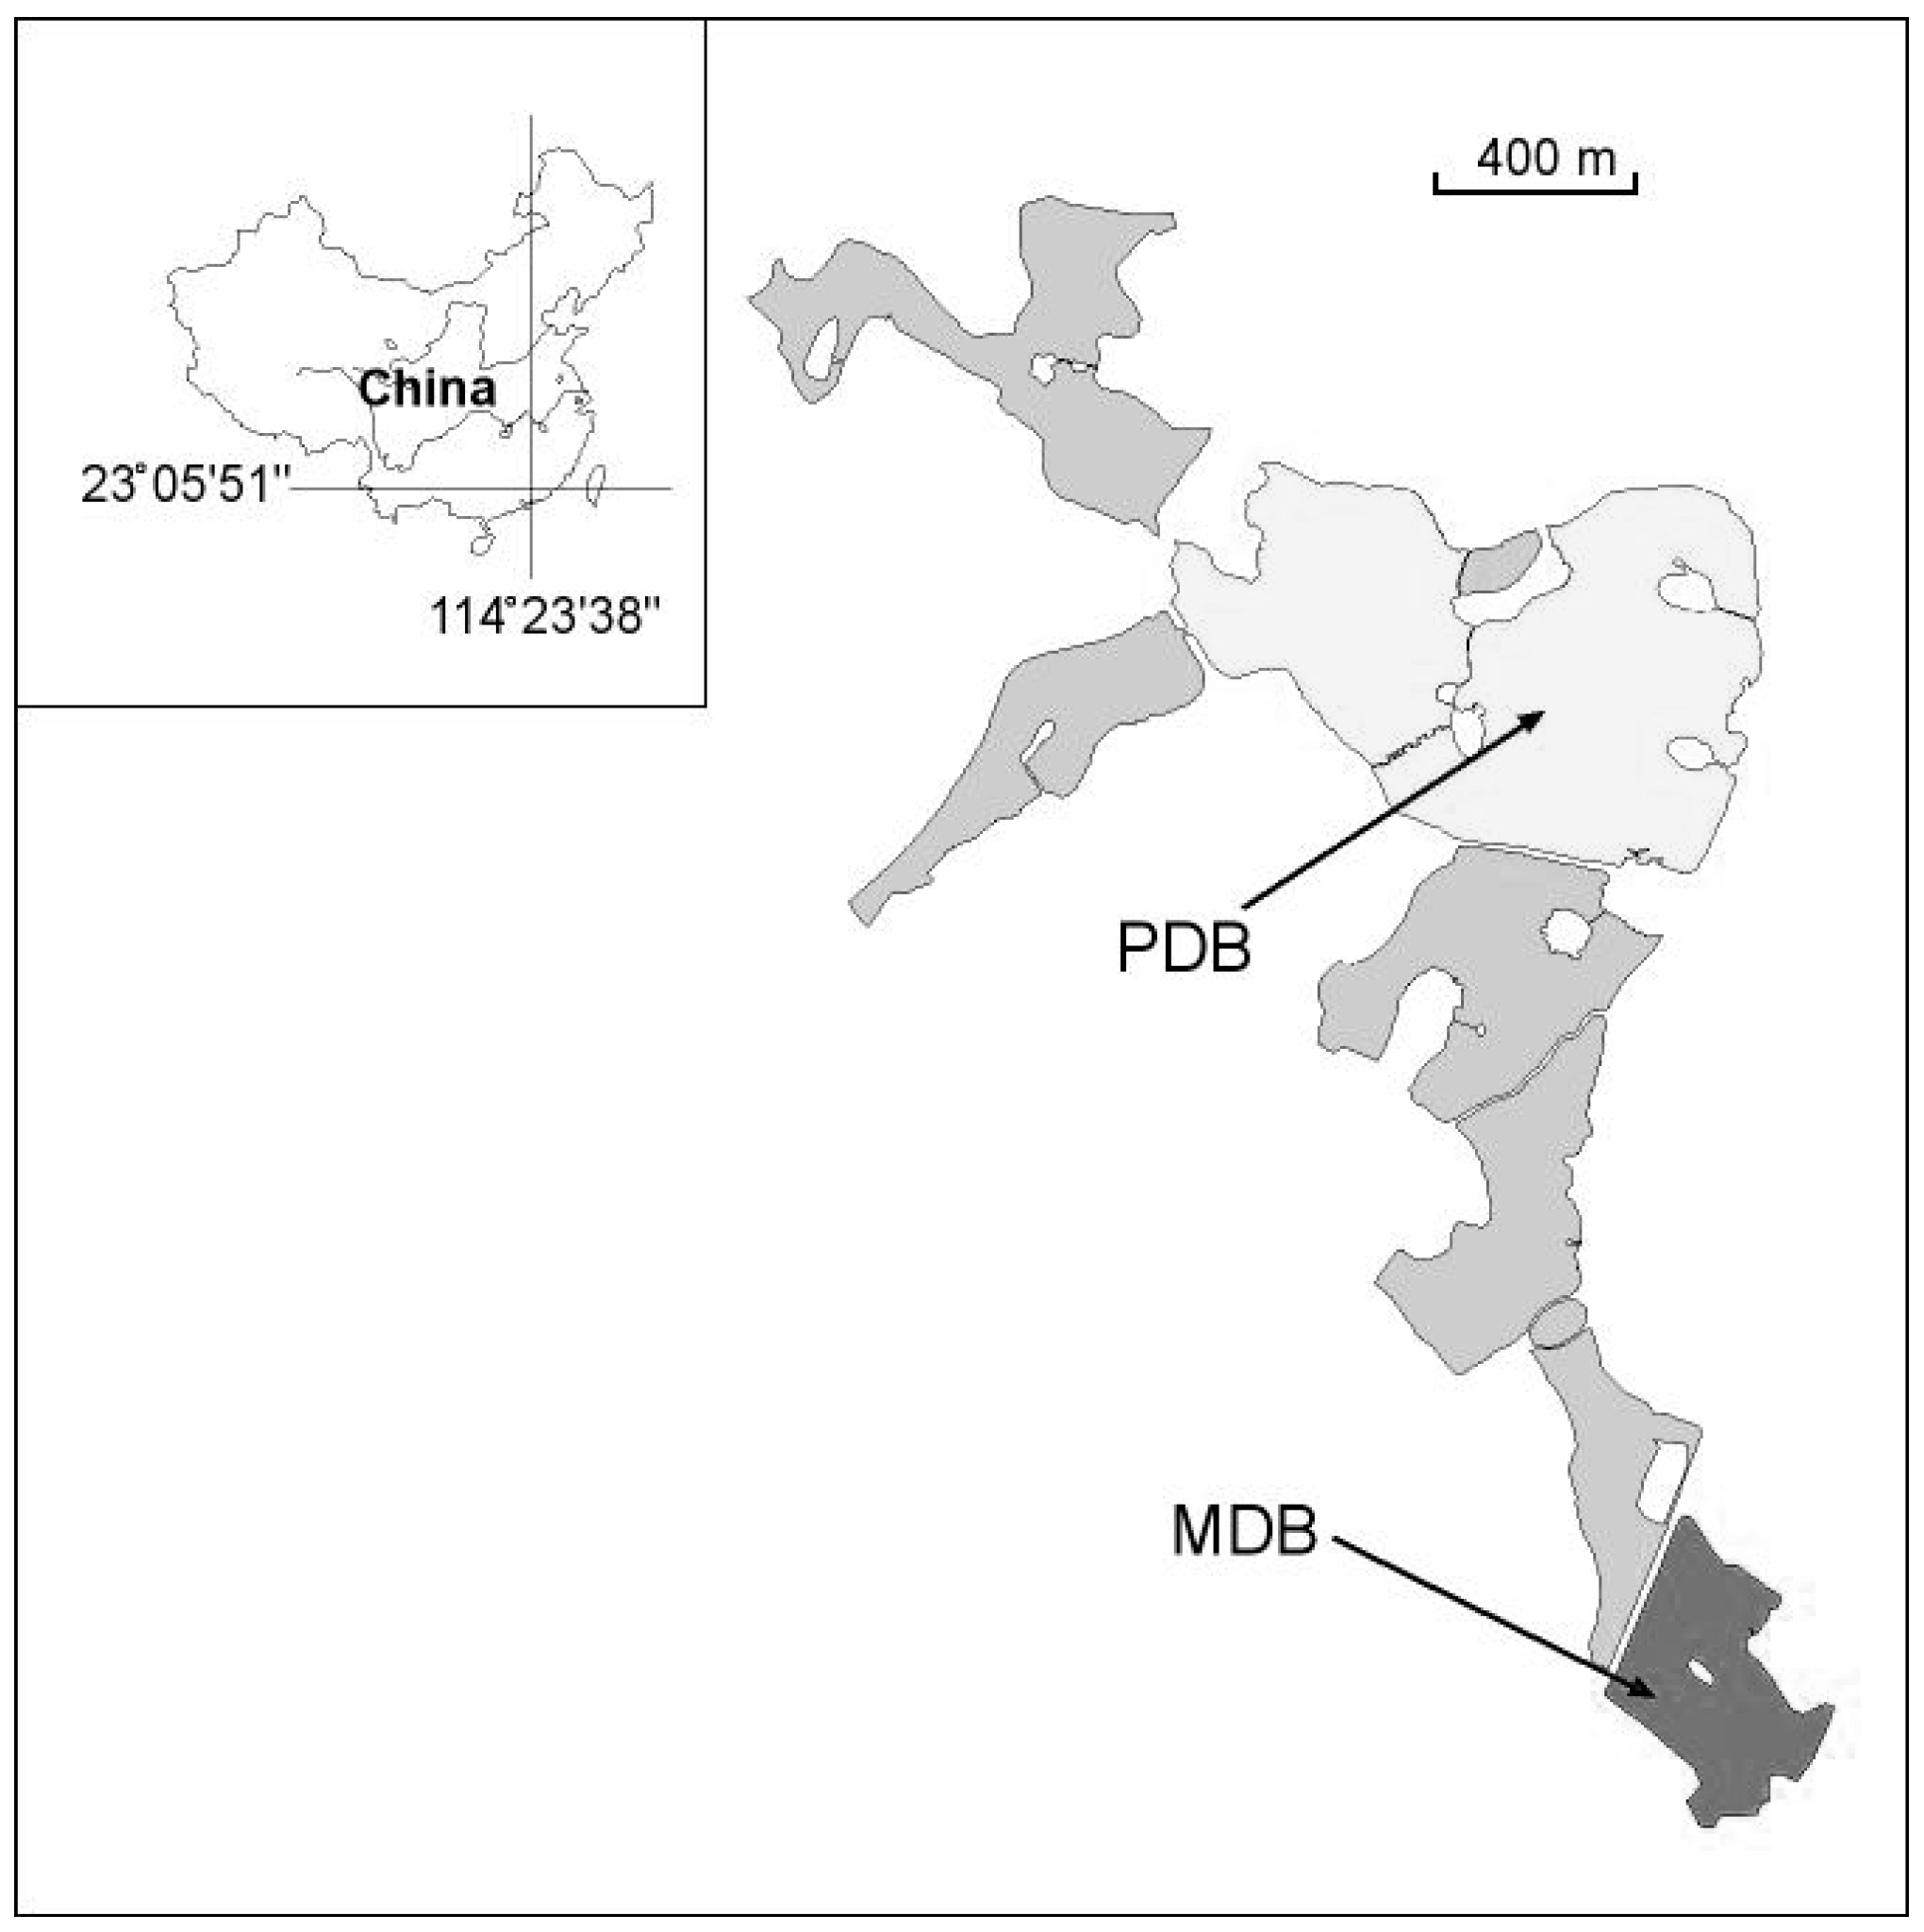
2.1. Study Site
2.2. Sample Collection
2.3. Stable Isotope Analyses
2.4. Gut Content Analyses of Crucian Carp
2.5. Data Analysis of the Food Web
2.6. Estimation of Diet Composition
2.7. Statistics Analysis
3. Results
3.1. Food Web Structure Analysis
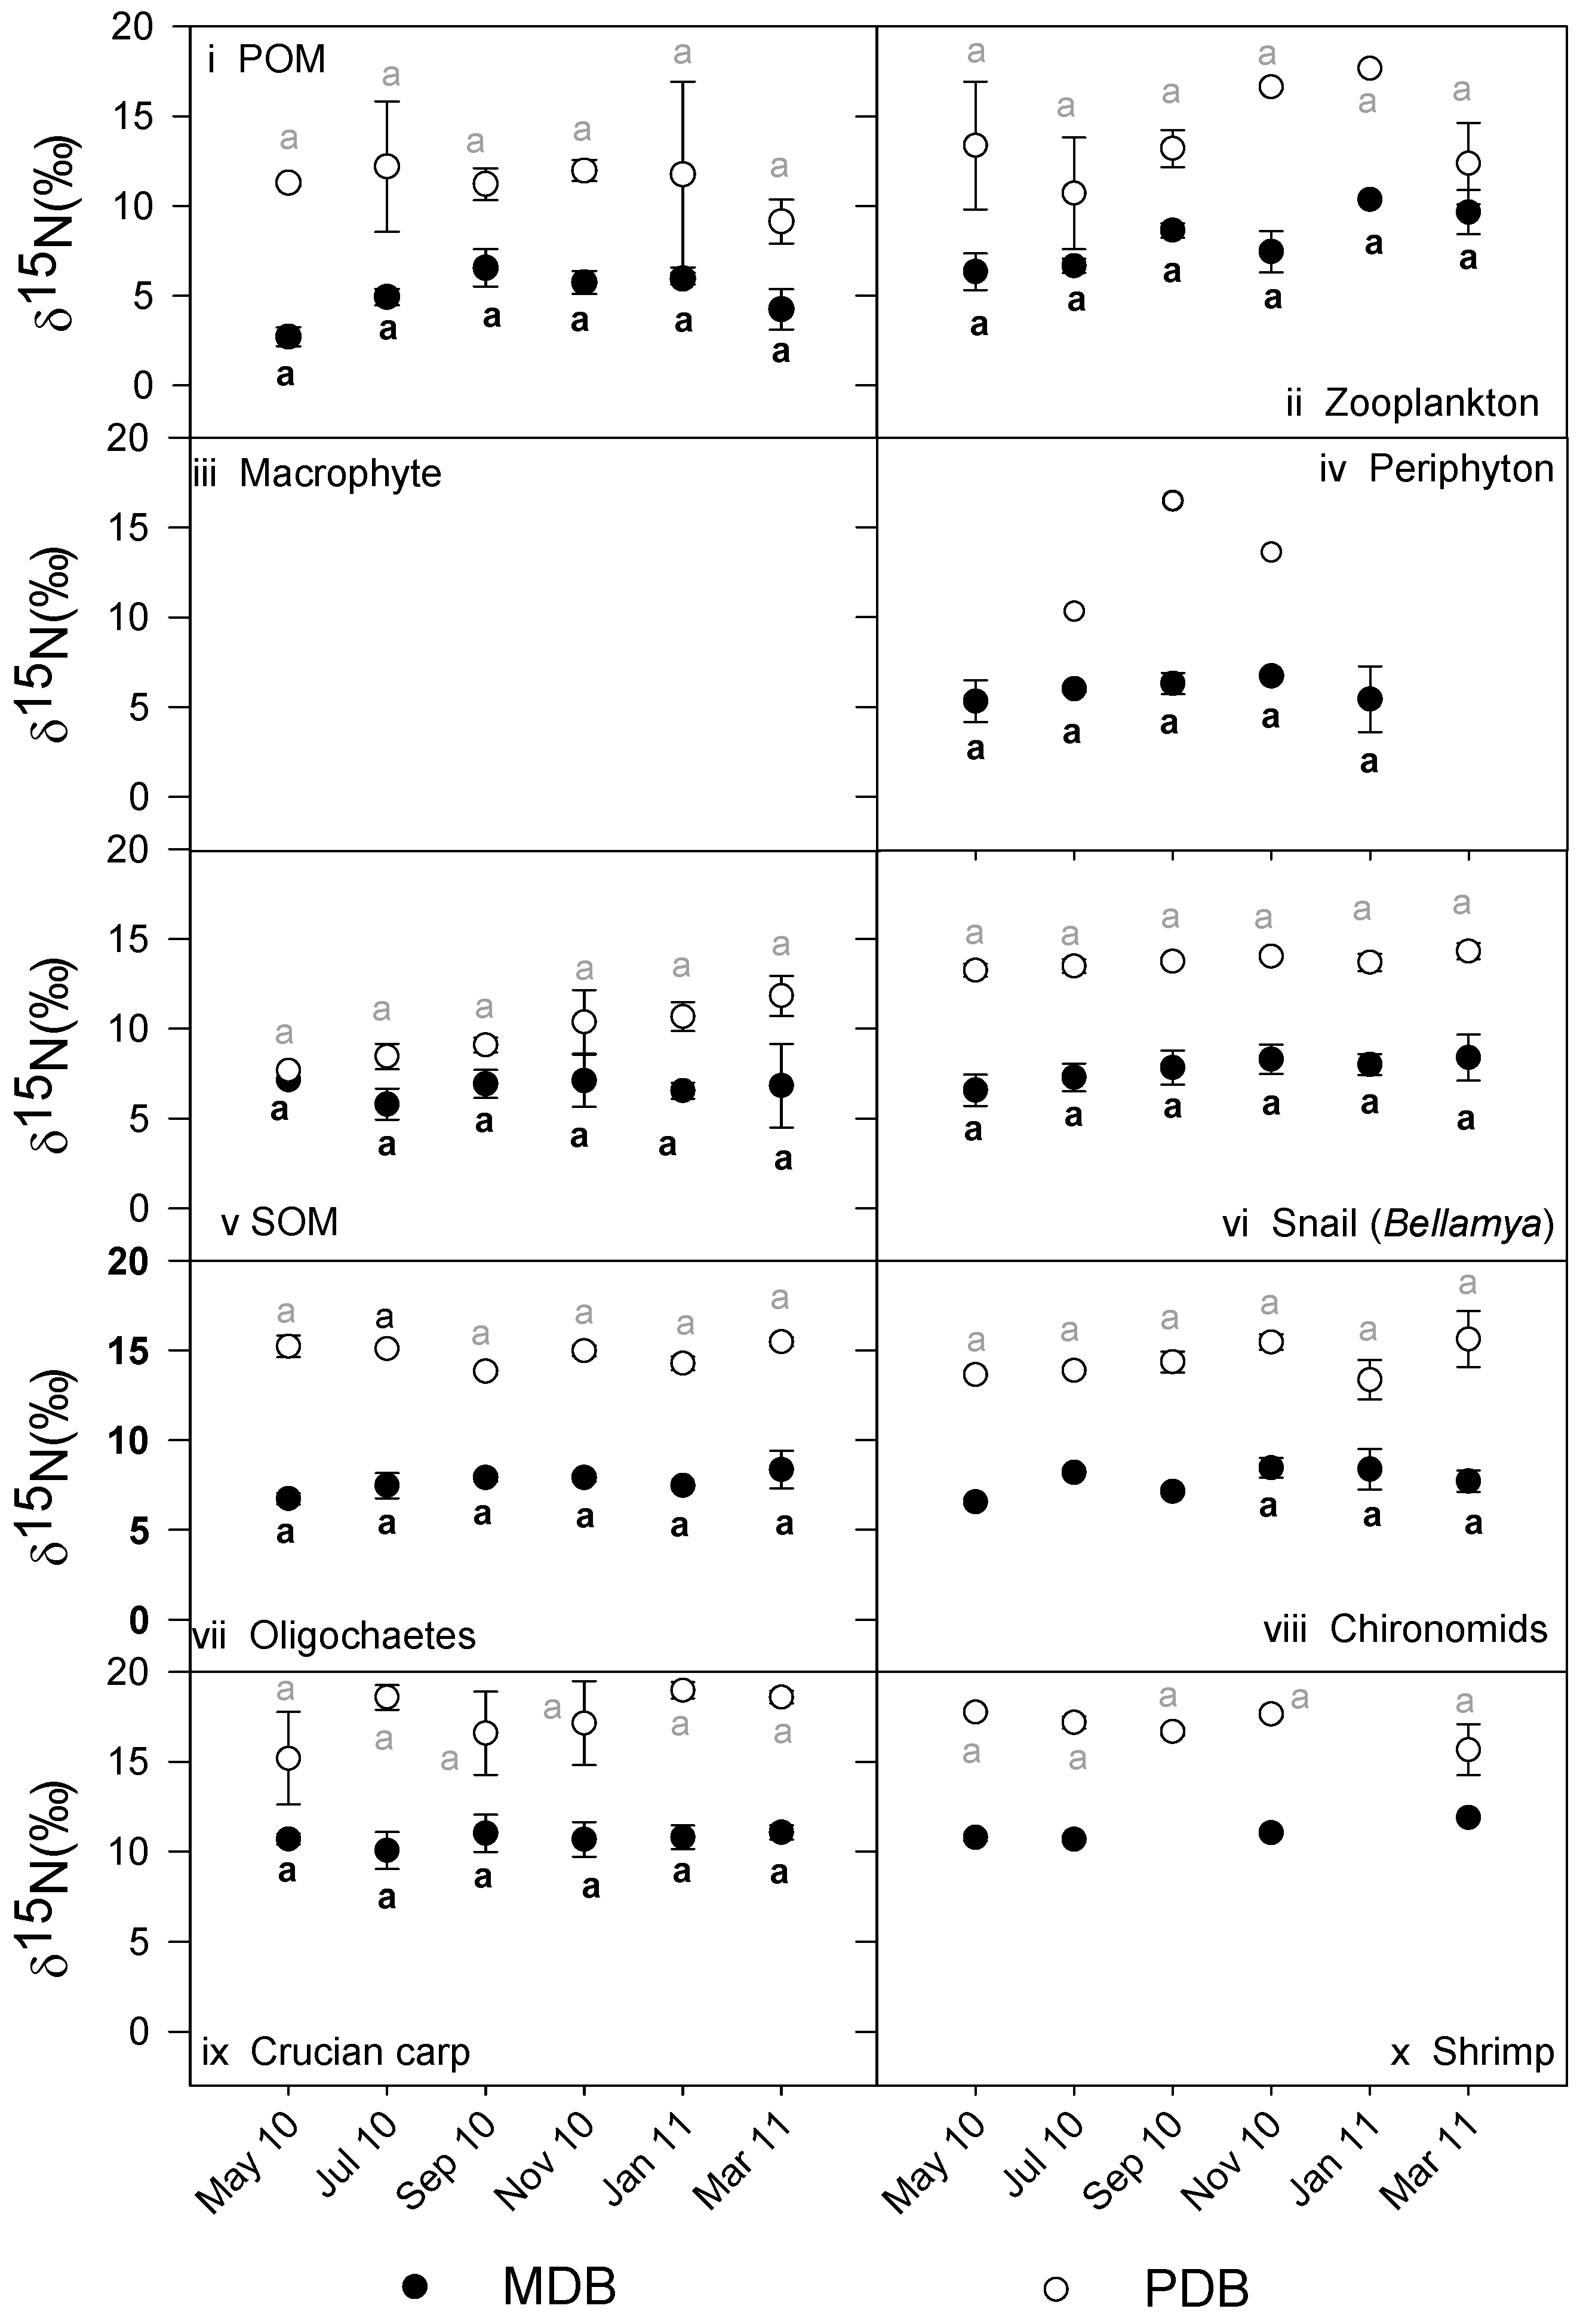
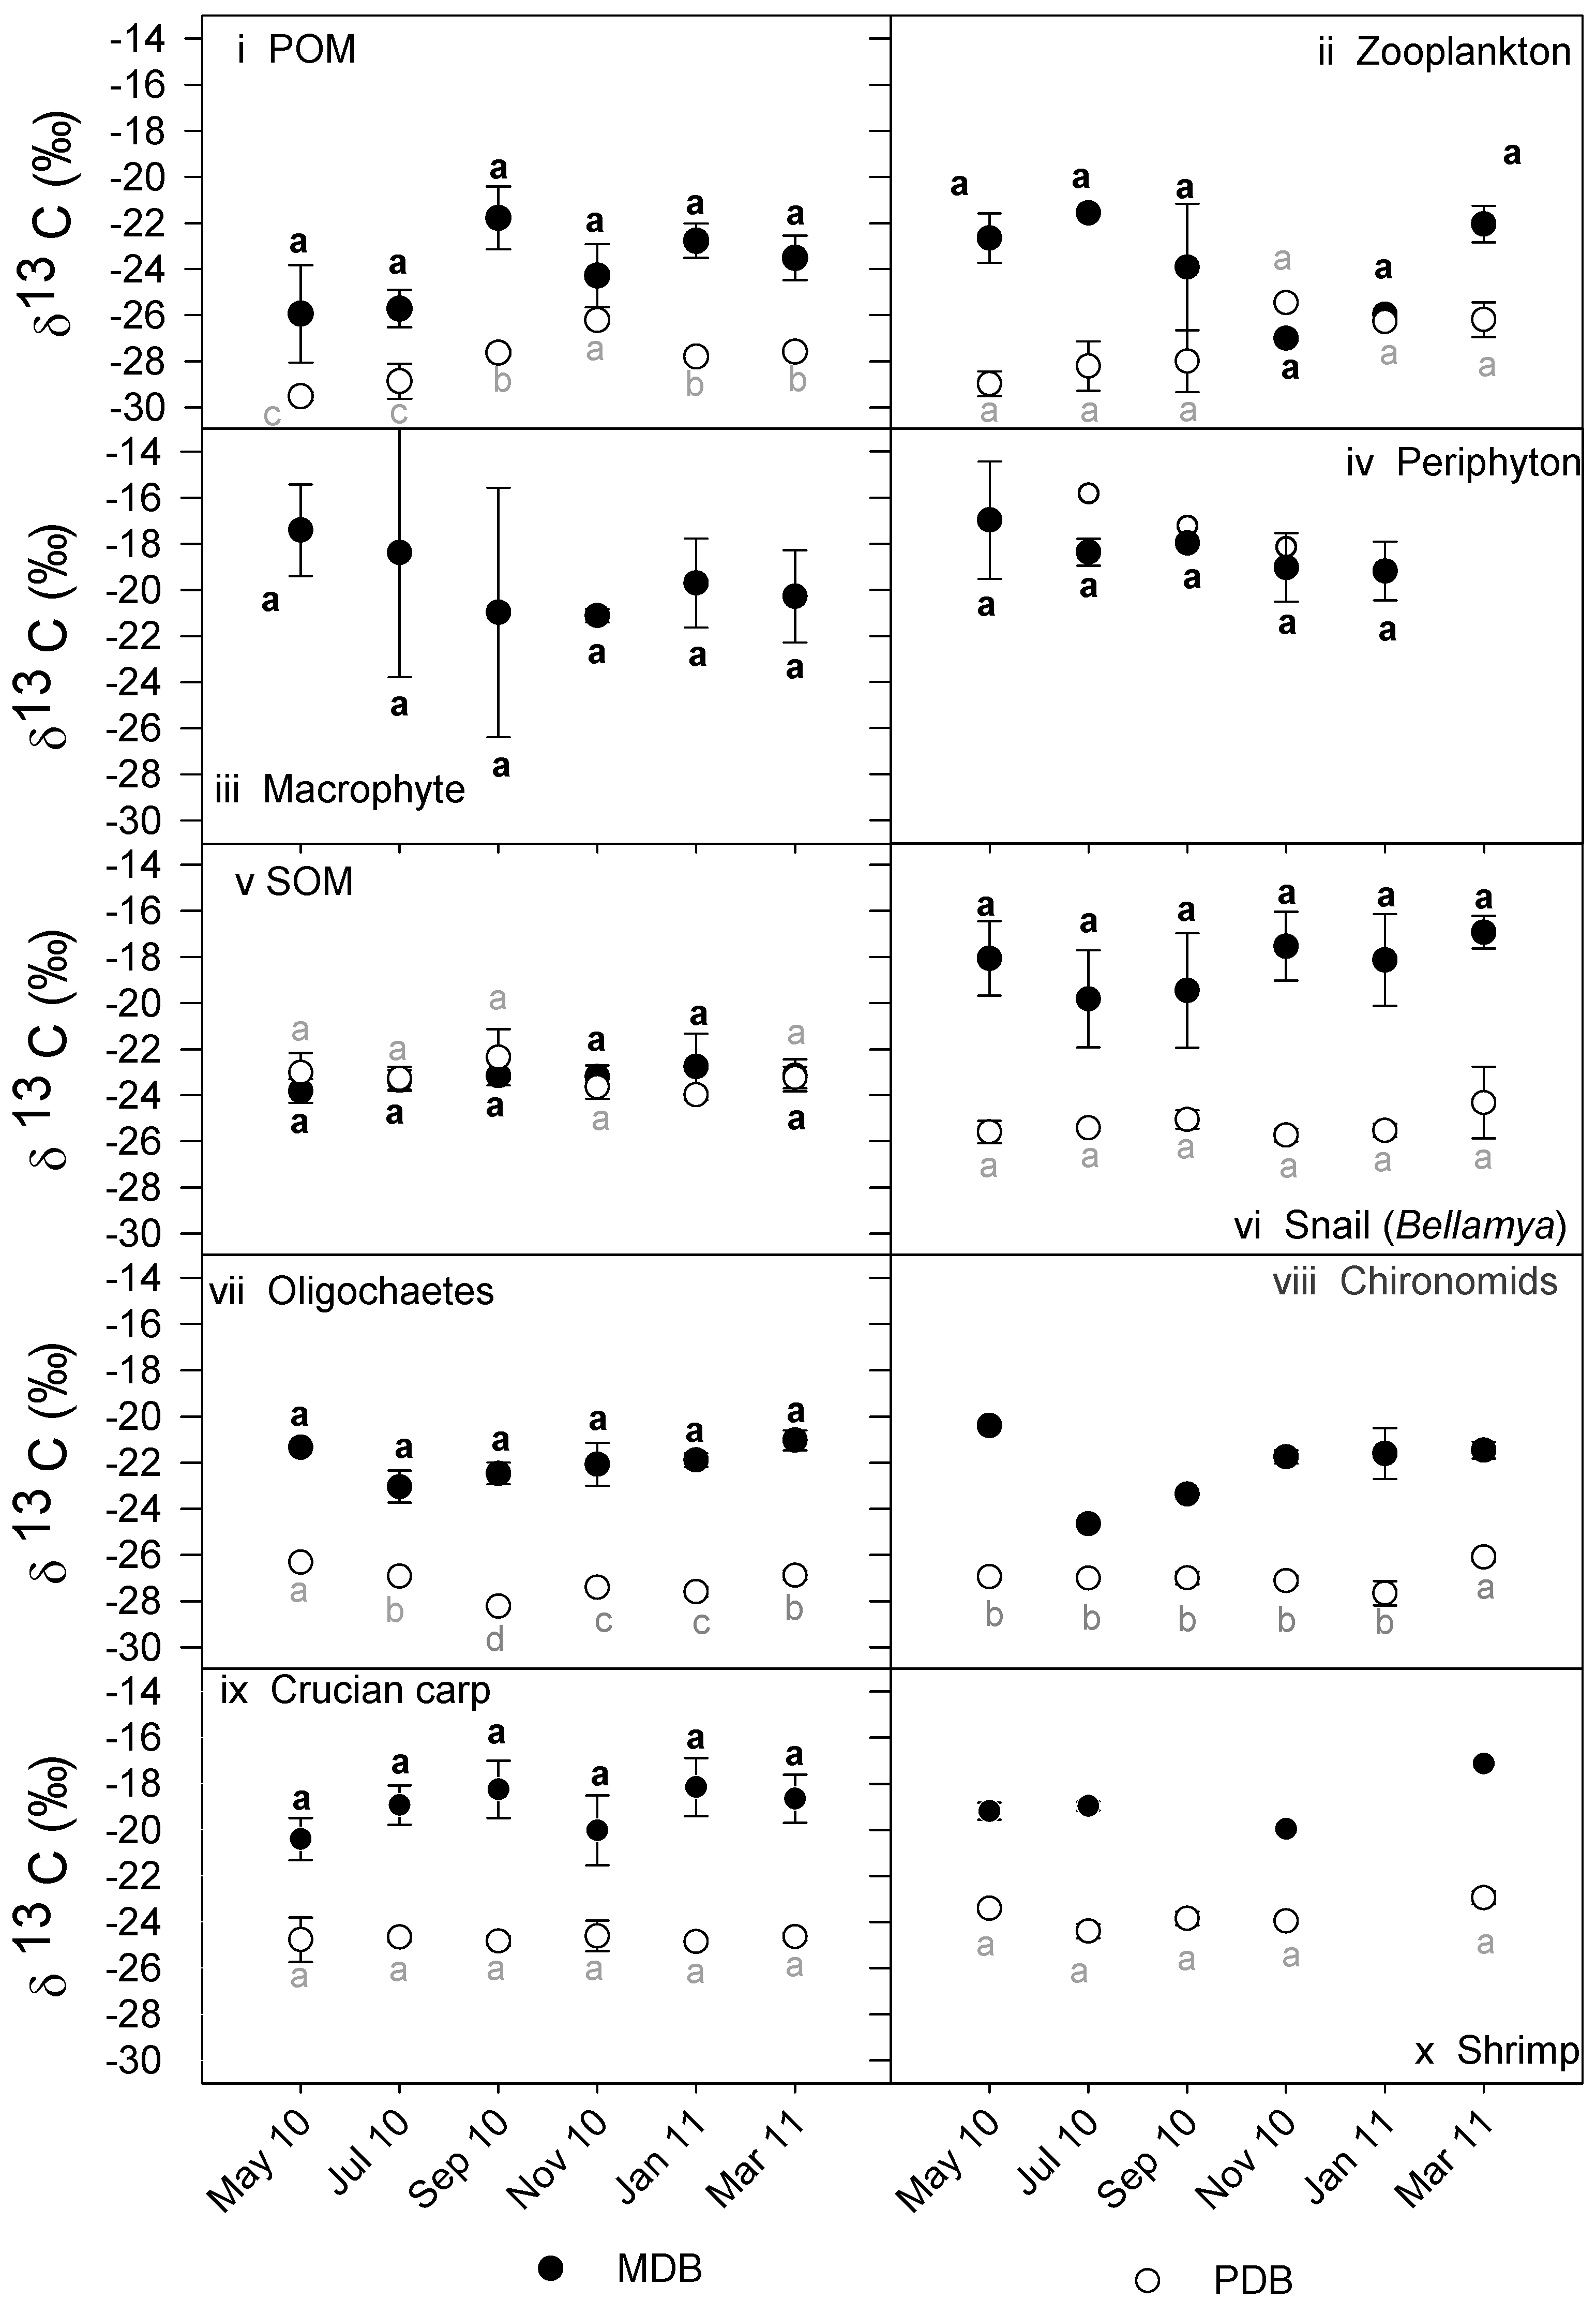
3.2. δ13C and δ15N Values of Basal Food Resources and Consumers
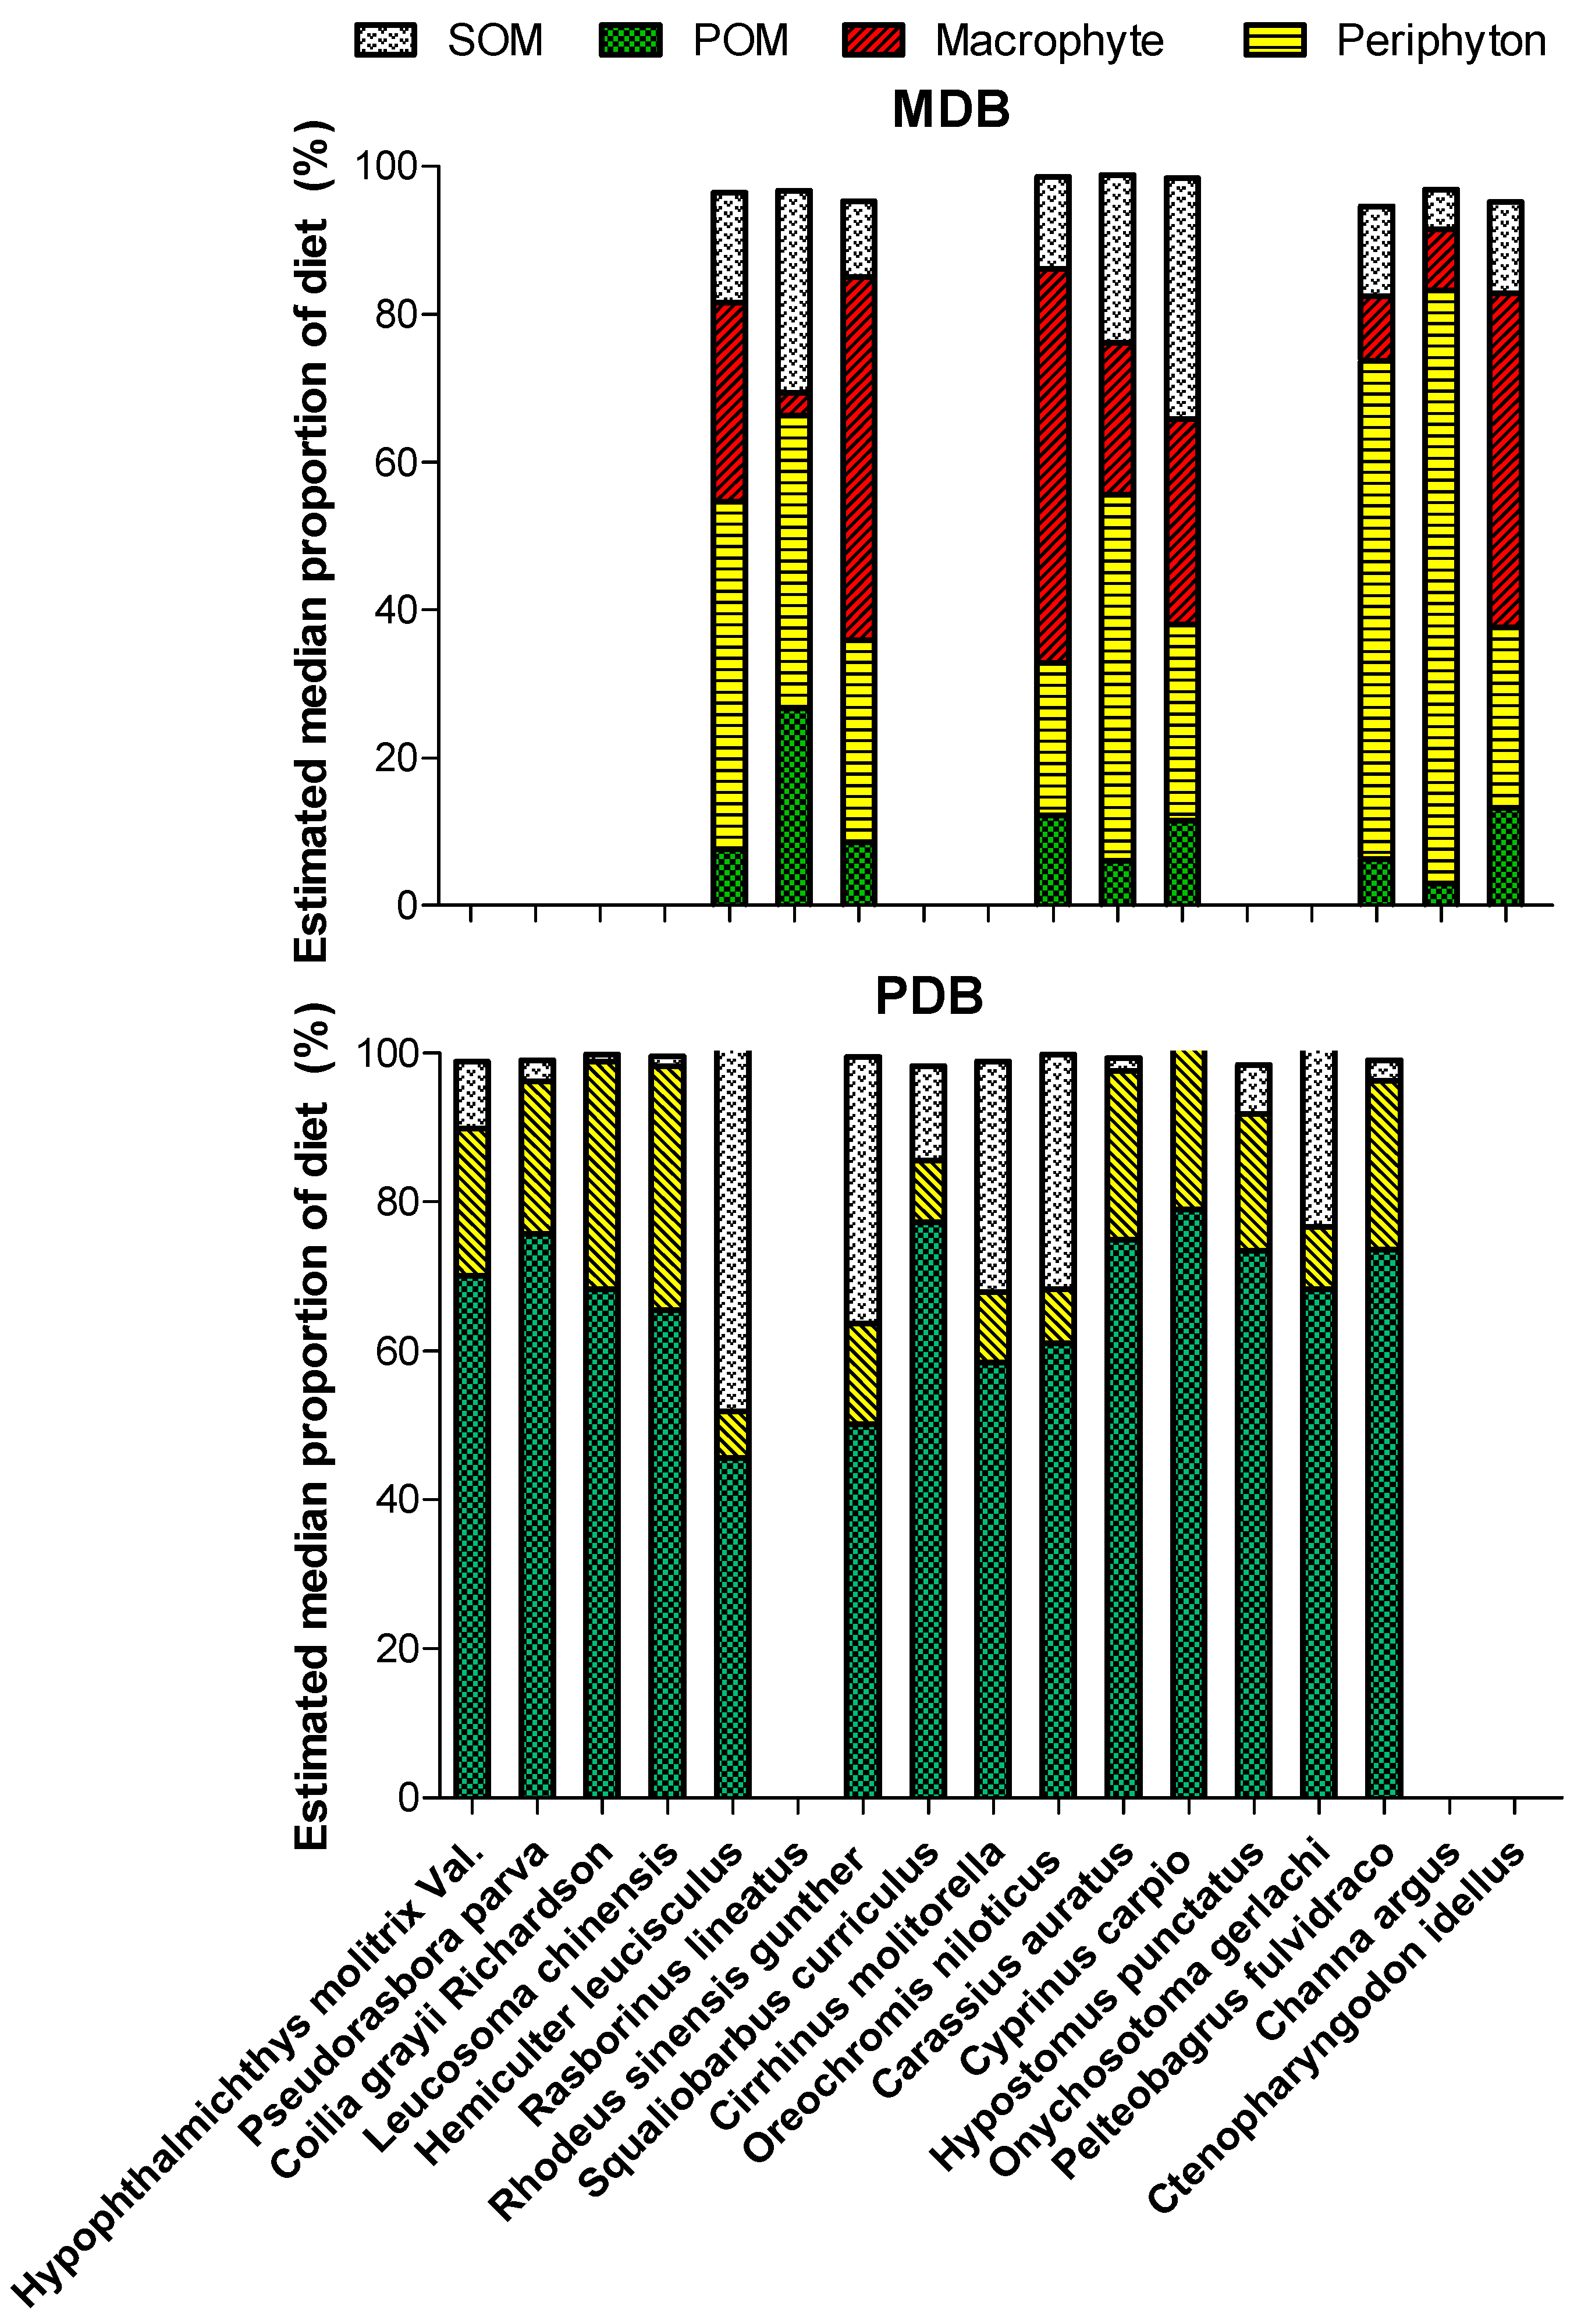
3.3. Basal Production Sources Fueling the Fish
3.4. Diet of Crucian Carp
4. Discussion
5. Conclusions
Acknowledgments
Author Contributions
Conflicts of Interest
Appendix A

| Trophic Groups | Species | MDB | PDB | ||||
|---|---|---|---|---|---|---|---|
| N (%) | W (%) | F (%) | N (%) | W (%) | F (%) | ||
| Planktivores | Hypophthalmichthys molitrix Val. | 1.8 | 33.5 | 83.3 | |||
| Pseudorasbora parva | 1.1 | 0.3 | 66.7 | ||||
| Coilia grayii Richardson | 74.9 | 6.8 | 100.0 | ||||
| Leucosoma chinensis | 2.0 | 0.6 | 83.3 | ||||
| Omnivore-planktivores | Danioninae | 0.0 | 0.0 | 0.0 | 0 | 0 | 0 |
| Hemiculter leucisculus | 0.4 | 0.1 | 16.7 | 3.4 | 8.2 | 100.0 | |
| Rasborinus lineatus | 10.8 | 5.0 | 50.0 | 0 | 0 | 0 | |
| Rhodeus sinensis gunther | 1.8 | 0.1 | 33.3 | 0.1 | <0.1 | 16.7 | |
| Omnivore-benthivores | Squaliobarbus curriculus | 0.0 | 0.0 | 0.0 | 0.2 | 2.0 | 33.3 |
| Cirrhinus molitorella | 0.1 | 1.4 | 16.7 | 0.2 | 5.3 | 16.7 | |
| Oreochromis niloticus | 0.2 | 1.1 | 16.7 | 2.2 | 5.9 | 83.3 | |
| Carassius auratus | 80.6 | 61.5 | 100.0 | 2.8 | 19.6 | 100.0 | |
| Cyprinus carpio | 1.8 | 18.7 | 83.3 | 0.5 | 4.8 | 50 | |
| Hypostomus punctatus | 0.7 | 4.2 | 50 | ||||
| Onychosotoma gerlachi | 9.3 | 5.6 | 33.3 | ||||
| Piscivores | Pelteobagrus fulvidraco | 0.6 | 1.8 | 33.3 | 0.5 | 2.6 | 83.3 |
| Channa argus | 3.4 | 6.8 | 100.0 | 0 | 0 | 0 | |
| Ictalurus punctatus | 0.0 | 0.0 | 0.0 | 0 | 0 | 0 | |
| Herbivores | Ctenopharyngodon idellus | 0.2 | 3.4 | 16.7 | 0 | 0 | 0 |
| Parameters | n | Tot. av. δ13C in MDB | Tot. av. δ13C in PDB | p | Tot. av. δ15N in MDB | Tot. av. δ15N in PDB | p |
|---|---|---|---|---|---|---|---|
| POM | 7,7 | −24.1 ± 1.5 | −27.9 ± 1.1 | ** | |||
| Macrophytes | 7,- | −17.8 ± 1.8 | - | 5.5 ± 1.2 | - | ||
| Periphyton | 7,3 | −19.2 ± 1.7 | −17.3 ± 1.1 | NS | 6.3 ± 2.2 | 13.7 ± 2.6 | ** |
| Phytoplankton | 7,7 | −28.8 ± 5.3 | −30.6 ± 5.4 | NS | |||
| Copepods | 7,5 | −24.1 ± 2.0 | −26.6 ± 1.3 | * | 8.3 ± 1.4 | 14.9 ± 2.3 | ** |
| Cladocerans | 1,4 | −24.0 | −28.4 ± 1.0 | - | 5.2 | 10.2 ± 1.5 | - |
| Total zooplankton | 7,7 | −23.7 ± 2.0 | −27.1 ± 1.3 | * | 8.2 ± 1.5 | 13.7 ± 2.5 | ** |
| Bellamya spp. | 6,6 | −18.3 ± 1.0 | −25.3 + 0.5 | ** | 7.7 ± 0.7 | 13.7 ± 0.4 | ** |
| Angulyagra polyzonata | 3,6 | −21.0 ± 1.1 | −25.7 ± 0.1 | ** | 7.7 ± 0.3 | 14.1 ± 0.5 | ** |
| Radix sp. | 2,2 | −16.5 ± 1.3 | −18.9 ± 1.5 | NS | 5.7 ± 0.4 | 13.7 ± 2.1 | ** |
| Pomacea canaliculata | -,2 | −25.7 ± 0.9 | - | 11.9 ± 0.6 | - | ||
| Anodonta spp. | 2,- | −22.6 ± 1.0 | - | 8.2 ± 0.4 | - | ||
| Shrimps | 4,4 | −18.8 ± 1.2 | −23.7 ± 0.6 | ** | 11.1 ± 0.5 | 17.0 ± 0.9 | ** |
| Dragonfly larvae | 2,- | −20.4 ± 1.4 | - | 8.9 ± 0.4 | - | ||
| Damselfly larvae | 4,2 | −19.7 ± 1.5 | −27.3 ± 0.1 | ** | 8.8 ± 0.4 | 13.8 ± 1.2 | ** |
| Crabs | -,4 | −23.4 ± 0.9 | - | 13.3 ± 1.7 | - | ||
| Leeches | -,1 | −19.0 | - | 14.1 | - | ||
| Oligochaeta | 6,6 | −22.0 ± 0.7 | −27.2 ± 0.7 | ** | 7.6 ± 0.6 | 14.8 ± 0.6 | ** |
| Chironomidae larvae | 6,6 | −22.2 ± 1.5 | −27.0 ± 0.5 | ** | 7.7 ± 0.8 | 14.4 ± 1.0 | ** |
| Hypophthalmichthys molitrix | -,3 | −24.5 ± 0.4 | - | 16.1 ± 0.6 | - | ||
| Pseudorasbora parva | -,4 | −24.9 ± 0.2 | - | 17.5 ± 0.3 | - | ||
| Coilia grayii Richardson | -,6 | −24.3 ± 0.3 | - | 19.2 ± 0.8 | - | ||
| Leucosoma chinensis | -,4 | −24.2 ± 0.4 | - | 19.3 ± 0.4 | - | ||
| Hemiculter leucisculus | 2,6 | −18.6 ± 0.2 | −24.0 ± 0.3 | ** | 10.9 ± 0.8 | 13.8 ± 1.0 | ** |
| Rasborinus lineatus | 3,- | −21.6 ± 1.3 | - | 11.5 ± 0.2 | - | ||
| Rhodeus sinensis gunther | 2, 2 | −18.4 ± 2.5 | −23.7 ± 0.7 | ** | 9.9 ± 0.5 | 14.3 ± 1.6 | ** |
| Squaliobarbus curriculus | -,2 | −25.5 ± 1.0 | - | 15.3 ± 0.9 | - | ||
| Cirrhinus molitorella | -,2 | −24.3 ± 1.0 | - | 13.9 ± 2.2 | - | ||
| Oreochromis niloticus | 2,5 | −18.3 ± 0.8 | −24.6 ± 0.8 | ** | 8.8 ± 0.3 | 14.1 ± 1.1 | ** |
| Carassius auratus | 6,6 | −19.1 ± 0.9 | −24.7 ± 0.1 | ** | 10.7 ± 0.4 | 17.6 ± 1.5 | ** |
| Cyprinus carpio | 5,2 | −19.8 ± 1.0 | −25.4 ± 0.2 | ** | 10.0 ± 0.5 | 16.9 ± 0.1 | ** |
| Hypostomus punctatus | -,3 | −24.8 ± 0.3 | 16.6 ± 0.5 | - | |||
| Onychosotoma gerlachi | -,1 | −24.8 ± 1.0 | 14.2 ± 1.6 | - | |||
| Pelteobagrus fulvidraco | 2,- | −19.0 ± 1.3 | −24.6 ± 0.2 | ** | 12.0 ± 0.4 | 17.1 ± 1.2 | ** |
| Channa argus | 6,- | −18.0 ± 0.7 | 12.3 ± 0.9 | - | |||
| Ctenopharyngodon idellus | 1,- | −18.5 ± 0.3 | 8.5 ± 0.1 | - |
References
- Van Donk, E.; Grimm, M.P.; Gulati, R.D.; Breteler, J.P.G.K. Whole-lake food-web manipulation as a means to study community interactions in a small ecosystem. Hydrobiologia 1990, 200, 275–289. [Google Scholar] [CrossRef]
- Meijer, M.L.; de Boois, I.; Scheffer, M.; Portielje, R.; Hosper, H. Biomanipulation in shallow lakes in the Netherlands: An evaluation of 18 case studies. Hydrobiologia 1999, 408, 13–30. [Google Scholar] [CrossRef]
- Backer, S.D.; Teissier, S.; Triest, L. Stabilizing the clear-water state in eutrophic ponds after biomanipulation: Submerged vegetation versus fish recolonization. Hydrobiologia 2012, 689, 161–176. [Google Scholar] [CrossRef]
- Moss, B. Engineering and biological approaches to the restoration from eutrophication of shallow lakes in which aquatic plant communities are important components. Hydrobiologia 1990, 200–201, 367–377. [Google Scholar] [CrossRef]
- Scheffer, M.; Hosper, S.H.; Meijer, M.L.; Moss, B.; Jeppesen, E. Alternative equilibria in shallow lakes. Trends Ecol. Evol. 1993, 8, 275–279. [Google Scholar] [CrossRef]
- Schriver, P.; Bøgestrand, J.; Jeppesen, E.; Søndergaard, M. Impact of submerged macrophytes on fish-zooplankton-phytoplankton interactions: Large-scale enclosure experiments in a shallow eutrophic lake. Freshw. Biol. 1995, 33, 255–270. [Google Scholar] [CrossRef]
- Jeppesen, E.; Søndergaard, M.; Søndergaard, M.; Christoffersen, K. The Structuring Role of Submerged Macrophytes in Lakes; Springer: New York, NY, USA, 1998. [Google Scholar]
- Jeppesen, E.; Lauridsen, T.L.; Mitchell, S.F.; Christoffersen, K.; Burns, C.W. Trophic structure in the pelagial of 25 shallow New Zealand lakes: Changes along nutrient and fish gradients. J. Plankton Res. 2000, 22, 951–968. [Google Scholar] [CrossRef]
- Jeppesen, E.; Peder Jensen, J.; Søndergaard, M.; Lauridsen, T.; Landkildehus, F. Trophic structure, species richness and biodiversity in Danish lakes: Changes along a phosphorus gradient. Freshw. Biol. 2000, 45, 201–218. [Google Scholar] [CrossRef]
- Jeppesen, E.; Søndergaard, M.; Mazzeo, N.; Meerhoff, M.; Branco, C.; Huszar, V.; Scasso, F. Lake restoration and biomanipulation in temperate lakes: Relevance for subtropical and tropical lakes. In Restoration and Management of Tropical Eutrophic Lakes; Reddy, M.V., Ed.; Science Publishers Inc.: Enfield, NH, USA, 2005; pp. 331–359. [Google Scholar]
- Genkai-Kato, M. Macrophyte refuges, prey behaviour and trophic interactions: Consequences for lake water clarity. Ecol. Lett. 2007, 10, 105–114. [Google Scholar] [CrossRef] [PubMed]
- Rawcliffe, R.; Sayer, C.D.; Woodward, G.; Grey, J.; Davidson, T.A.; Iwan Jones, J. Back to the future: Using palaeolimnology to infer long-term changes in shallow lake food webs. Freshw. Biol. 2010, 55, 600–613. [Google Scholar] [CrossRef]
- Sentis, A.; Gémard, C.; Jaugeon, B.; Boukal, D.S. Predator diversity and environmental change modify the strengths of trophic and non-trophic interactions. Glob. Chang. Biol. 2016, 1–12. [Google Scholar] [CrossRef]
- Iglesias, C.; Meerhoff, M.; Johansson, L.S.; González-Bergonzoni, I.; Mazzeo, N.; Pacheco, J.P.; Teixeira-de Mello, F.; Goyenola, G.; Lauridsen, T.L.; Søndergaard, M.; et al. Stable isotope analysis confirms substantial differences between subtropical and temperate shallow lake food webs. Hydrobiologia 2016, 784, 111–113. [Google Scholar] [CrossRef]
- Clements, K.D.; Raubenheimer, D.; Choat, J.H. Nutritional ecology of marine herbivorous fishes: Ten years on. Funct. Ecol. 2009, 23, 79–92. [Google Scholar] [CrossRef]
- González-Bergonzoni, I.; Meerhoff, M.; Davidson, T.A.; Teixeira-de Mello, F.; Baattrup-Pedersen, A.; Jeppesen, E. Meta-analysis shows a consistent and strong latitudinal pattern in fish omnivory across ecosystems. Ecosystems 2012, 15, 492–503. [Google Scholar] [CrossRef]
- Penttinen, O.P.; Holopainen, I.J. Seasonal feeding activity and ontogenetic dietary shifts in crucian carp, Carassius carassius. Environ. Biol. Fishes 1992, 33, 215–221. [Google Scholar] [CrossRef]
- Doupé, R.G.; Knott, M.J.; Schaffer, J.; Burrows, D.W.; Lymbery, A.J. Experimental herbivory of native Australian macrophytes by the introduced Mozambique tilapia Oreochromis mossambicus. Aust. Ecol. 2010, 35, 24–30. [Google Scholar] [CrossRef]
- Rao, W.; Ning, J.; Zhong, P.; Jeppesen, E.; Liu, Z. Size-dependent feeding of omnivorous Nile tilapia in a macrophyte-dominated lake: Implications for lake management. Hydrobiologia 2015, 749, 125–134. [Google Scholar] [CrossRef]
- Gao, J.; Liu, Z.; Jeppesen, E. Fish community assemblages changed but biomass remained similar after lake restoration by biomanipulation in a Chinese tropical eutrophic lake. Hydrobiologia 2014, 724, 127–140. [Google Scholar] [CrossRef]
- Yu, J.; Liu, Z.; He, H.; Zhen, W.; Guan, B.; Chen, F.; Li, K.Y.; Zhong, P.; Teixeira-de Mello, F.; Jeppesen, E. Submerged macrophytes facilitate dominance of omnivorous fish in a subtropical shallow lake: Implications for lake restoration. Hydrobiologia 2016, 775, 97–107. [Google Scholar] [CrossRef]
- Mao, Z.G.; Gu, X.H.; Zeng, Q.F.; Gu, X.K.; Li, X.G.; Wang, Y.P. Production sources and food web of a macrophyte-dominated region in Lake Taihu, based on gut contents and stable isotope analyses. J. Gt. Lake Res. 2014, 40, 656–665. [Google Scholar] [CrossRef]
- Blindow, I.; Andersson, G.; Hargeby, A.; Johansson, S. Long-term pattern of alternative stable states in two shallow eutrophic lakes. Freshw. Biol. 1993, 30, 159–167. [Google Scholar] [CrossRef]
- Meerhoff, M.; Clemente, J.M.; Teixeira-de Mello, F.; Iglesias, C.; Pedersen, A.R.; Jeppesen, E. Can warm climate-related structure of littoral predator assemblies weaken the clear water state in shallow lakes? Glob. Chang. Biol. 2007, 13, 1888–1897. [Google Scholar] [CrossRef]
- Jeppesen, E.; Meerhoff, M.; Holmgren, K.; González-Bergonzoni, I.; Teixeira-de Mello, F.; Declerck, S.A.J.; De Meester, L.; Søndergaard, M.; Lauridsen, T.L.; Bjerring, R.; et al. Impacts of climate warming on lake fish community structure and potential effects on ecosystem function. Hydrobiologia 2010, 646, 73–90. [Google Scholar] [CrossRef]
- Blancher, E.C., II. Zooplankton-trophic state relationships in some north and central Florida lakes. Hydrobiologia 1984, 109, 251–263. [Google Scholar] [CrossRef]
- Pinto-Coelho, R.; Pinel-Alloul, B.; Méthot, G.; Havens, K.E. Crustacean zooplankton in lakes and reservoirs of temperate and tropical regions: Variation with trophic status. Can. J. Fish. Aquat. Sci. 2005, 62, 348–361. [Google Scholar] [CrossRef]
- Shapiro, J.; Wright, D.I. Lake restoration by biomanipulation: Round Lake, Minnesota, the first two years. Freshw. Biol. 1984, 14, 371–383. [Google Scholar]
- Carpenter, S.R.; Kitchell, J.F.; Hodgson, J.R. Cascading trophic interactions and lake productivity. BioScience 1985, 35, 634–639. [Google Scholar] [CrossRef]
- Mcqueen, D.J.; Post, J.R.; Mills, E.L. Trophic relationships in freshwater pelagic ecosystems. Can. J. Fish. Aquat. Sci. 1986, 43, 1571–1581. [Google Scholar] [CrossRef]
- Lodge, D.M. Macrophyte-gastropod associations: Observations and experiments on macrophyte choice by gastropods. Freshw. Biol. 1985, 15, 695–708. [Google Scholar] [CrossRef]
- Diehl, S. Fish predation and benthic community structure: The role of omnivory and habitat complexity. Ecology 1992, 73, 1646–1661. [Google Scholar] [CrossRef]
- Vadeboncoeur, Y.; Jeppesen, E.; Vander Zanden, M.J.; Schierup, H.H.; Christoffersen, K.; Lodge, D.M. From Greenland to green lakes: Cultural eutrophication and the loss of benthic pathways in lakes. Limnol. Oceanogr. 2003, 48, 1408–1418. [Google Scholar] [CrossRef]
- Xu, J.; Wen, Z.; Ke, Z.; Zhang, M.; Zhang, M.; Guo, N.; Hansson, L.-A.; Xie, P. Contrasting energy pathways atthe community level as a consequence of regime shifts. Oecologia 2014, 175, 231–241. [Google Scholar] [CrossRef] [PubMed]
- Xu, D.; Cai, Y.; Jiang, H.; Wu, X.; Leng, X.; An, S. Variations of food web structure and energy availability of shallow lake with long-term eutrophication: A case study from lake Taihu, China. Clean Soil Air Water 2016, 44, 1306–1314. [Google Scholar] [CrossRef]
- Jeppesen, E.; Søndergaard, M.; Lauridsen, T.L.; Davidson, T.A.; Liu, Z.; Mazzeo, N.; Trochine, C.; Özkan, K.; Jensen, H.S.; Trolle, D.; et al. Biomanipulation as a restoration tool to combat eutrophication: Recent advances and future challenges. Adv. Ecol. Res. Glob. Chang. Multispecies Syst. 2012, 47, 411–487. [Google Scholar]
- Liu, Z.; Zhong, P.; Zhang, X.F.; Ning, J.; Larsen, S.E.; Jeppesen, E. Successful restoration of a tropical shallow eutrophic lake: Strong bottom-up but weak top-down effects recorded. In Australia–China Wetland Network Research Partnership, Proceedings of the Australia–China Wetland Network Research Partnership Symposium, Nanjing, China, 23–28 March 2014; Kattel, G., Ed.; Collaborative Research Network, Federation University Australia: Mt. Helen, Australia, 2014; pp. 78–86. [Google Scholar]
- Jeppesen, E.; Jensen, J.P.; Søndergaard, M.; Fenger-Grøn, M.; Bramm, M.E.; Sandby, K.; Møller, P.H.; Rasmussen, H.U. Impact of fish predation on cladoceran body weight distribution and zooplankton grazing in lakes during winter. Freshw. Biol. 2004, 49, 432–447. [Google Scholar] [CrossRef]
- Li, C.H. Eutrophication and Restoration of Huizhou West Lake; Guangdong Science Press: Guangdong, China, 2009. (In Chinese) [Google Scholar]
- De Kluijver, A.; Ning, J.; Liu, Z.; Jeppesen, E.; Middelburg, J.J. Macrophyte and periphyton carbon subsidies to bacterioplankton and zooplankton in a shallow, eutrophic lake in tropical China. Limnol. Oceanogr. 2015, 60, 375–385. [Google Scholar] [CrossRef]
- Jin, X.C.; Tu, Q.Y. The Standard Methods for Observation and Analysis in Lake Eutrophication, 2nd ed.; Chinese Environmental Science Press: Beijing, China, 1990. (In Chinese) [Google Scholar]
- American Public Health Association (APHA). Standard Methods for the Examination of Water and Wastewater, 20th ed.; APHA: Washington, DC, USA, 1998. [Google Scholar]
- Pan, J.H.; Zhong, L.; Zheng, C.Y.; Wu, H.L.; Liu, J.H. The Freshwater Fishes of Guangdong Province; Guangdong Science Technology Press: Guangzhou, China, 1991. (In Chinese) [Google Scholar]
- Wang, J.J. Fauna Sinica, Rotifer; Science Press, Academia Sinica: Beijing, China, 1965. (In Chinese) [Google Scholar]
- Chiang, S.C.; Du, N.S. Fauna Sinica, Crustacea, Freshwater Cladocera; Science Press, Academia Sinica: Beijing, China, 1979. (In Chinese) [Google Scholar]
- Sheng, J.R. Fauna Sinica, Crustacea, Freshwater Copepoda; Science Press, Academia Sinica: Beijing, China, 1979. [Google Scholar]
- Huang, X.F. Survey, Observation and Analysis of Lake Ecology Standards; Press China: Beijing, China, 1999. (In Chinese) [Google Scholar]
- Layman, C.A.; Arrington, D.A.; Montaña, C.G.; Post, D.M. Can stable isotope ratios provide for community wide measures of trophic structure? Ecology 2007, 88, 42–48. [Google Scholar] [CrossRef]
- Layman, C.A.; Quattrochi, J.P.; Peyer, C.M.; Allgeier, J.E. Niche width collapse in a resilient top predator following ecosystem fragmentation. Ecol. Lett. 2007, 10, 937–944. [Google Scholar] [CrossRef] [PubMed]
- Jackson, A.L.; Inger, R.; Parnell, A.C.; Bearhop, S. Comparing isotopic niche widths among and within communities: SIBER–Stable Isotope Bayesian Ellipses in R. J. Anim. Ecol. 2011, 80, 595–602. [Google Scholar] [CrossRef] [PubMed]
- Layman, C.A.; Araujo, M.S.; Boucek, R.; Hammerschlag-Peyer, C.M.; Harrison, E.; Jud, Z.R.; Matich, P.; Rosenblatt, A.E.; Vaudo, J.J.; Yeager, L.A. Applying stable isotopes to examine food-web structure: An overview of analytical tools. Biol. Rev. 2012, 87, 545–562. [Google Scholar] [CrossRef] [PubMed]
- Moore, J.W.; Semmens, B.X. Incorporating uncertainty and prior information into stable isotope mixing models. Ecol. Lett. 2008, 11, 470–480. [Google Scholar] [CrossRef] [PubMed]
- Jackson, A.L.; Inger, R.; Bearhop, S.; Parnell, A. Erroneous behaviour of MixSIR, a recently published Bayesian isotope mixing model: A discussion of Moore and Semmens (2008). Ecol. Lett. 2009, 12, E1–E5. [Google Scholar] [CrossRef] [PubMed]
- Semmens, B.X.; Moore, J.W.; Ward, E.J. Improving Bayesian isotope mixing models: A response to Jackson et al. (2009). Ecol. Lett. 2009, 12, E6–E8. [Google Scholar] [CrossRef] [PubMed]
- Post, D.M. Using stable isotopes to estimate trophic position: Models, methods, and assumptions. Ecology 2002, 83, 703–718. [Google Scholar] [CrossRef]
- Rooney, N.; Mccann, K.; Gellner, G.; Moore, J.C. Structural asymmetry and the stability of diverse food webs. Nature 2006, 442, 265–269. [Google Scholar] [CrossRef] [PubMed]
- Wolkovich, E.M.; Allesina, S.; Cottingham, K.L.; Moore, J.C.; Sandin, S.A.; De Mazancourt, C. Linking the green and brown worlds: The prevalence and effect of multichannel feeding in food webs. Ecology 2014, 12, 3376–3386. [Google Scholar] [CrossRef]
- Liu, Z. Diet of the zooplanktivorous icefish neosalanx pseudotaihuensis Zhang. Hydrobiologia 2001, 459, 51–56. [Google Scholar] [CrossRef]
- Sha, Y.C.; Su, G.H.; Zhang, P.Y.; Zhang, H.; Xu, J. Diverse dietary strategy of lake anchovy coilia ectenes taihuensis in lakes with different trophic status. J. Ichthyol. 2015, 55, 866–873. [Google Scholar] [CrossRef]
- Beisner, B.E.; Mccauley, E.; Wrona, F.J. The influence of temperature and food chain length on plankton predator prey dynamics. Can. J. Fish. Aquat. Sci. 1997, 54, 586–595. [Google Scholar]
- Petchey, O.L.; Mcphearson, P.T.; Casey, T.M.; Morin, P.J. Environmental warming alters food-web structure and ecosystem function. Nature 1999, 402, 69–72. [Google Scholar] [CrossRef]
- Pujoni, D.G.F.; Maia-Barbosa, P.M.; Fragoso, C.R.; Nes, E.H.V. Effects of food web complexity on top-down control in tropical lakes. Ecol. Mod. 2016, 320, 358–365. [Google Scholar] [CrossRef]
- Woodland, R.J.; Evrand, V.; Clarke, R.H.; Cook, P.L.M. Niche-dependent trophic position distributions among primary, secondary and tertiary consumers. Oikos 2016, 125, 556–565. [Google Scholar] [CrossRef]
- Tessier, C.; Cattaneo, A.; Pinel-Alloul, B.; Galanti, G.; Morabito, G. Biomass, composition and size structure of invertebrate communities associated to different types of aquatic vegetation during summer in Lago di Candia (Italy). J. Limnol. 2004, 63, 190–198. [Google Scholar] [CrossRef]
- Cremona, F.; Planas, D.; Lucotte, M. Biomass and composition of macroinvertebrate communities associated with different types of macrophyte architectures and habitats in a large fluvial lake. Fundam. Appl. Limnol./Arch. Hydrobiol. 2008, 171, 119–130. [Google Scholar] [CrossRef]
- Boll, T.; Johansson, L.S.; Lauridsen, T.L.; Landkildehus, F.; Davidson, T.A.; Søndergaard, M.; Andersen, F.; Jeppesen, E. Changes in benthic macroinvertebrate abundance and lake isotope (C, N) signals following biomanipulation: An 18-year study in shallow Lake Vaeng, Denmark. Hydrobiologia 2012, 686, 135–145. [Google Scholar] [CrossRef]
- Wootton, J.T.; Oemke, M.P. Latitudinal differences in fish community trophic structure, and the role of fish herbivory in a Costa Rican stream. Environ. Biol. Fishes 1992, 35, 311–319. [Google Scholar] [CrossRef]
- Ibañez, C.; Belliard, J.; Hughes, R.M.; Irz, P.; Kamdem-Toham, A.; Lamouroux, N.; Tedesco, P.A.; Oberdorff, T. Convergence of temperate and tropical stream fish assemblages. Ecography 2009, 32, 658–670. [Google Scholar] [CrossRef]
- Mendonça, R.; Kosten, S.; Lacerot, G.; Mazzeo, N.; Roland, F.; Ometto, J.P.; Paz, E.A.; Bove, C.P.; Bueno, N.C.; Gomes, J.H.C. Bimodality in stable isotope composition facilitates the tracing of carbon transfer from macrophytes to higher trophic levels. Hydrobiologia 2013, 710, 205–218. [Google Scholar] [CrossRef]
- Yoshioka, T.; Wada, E.; Hayashi, H. A stable isotope study on seasonal food web dynamics in a eutrophic lake. Ecology 1994, 75, 835–846. [Google Scholar] [CrossRef]
- Tarvainen, M.; Vuorio, K.; Sarvala, J. The diet of ruffe Gymnocephalus cernuus (L.) in northern lakes: New insights from stable isotope analyses. J. Fish Biol. 2008, 72, 1720–1735. [Google Scholar] [CrossRef]
- Guzzo, M.M.; Haffner, G.D.; Sorge, S.; Rush, S.A.; Fisk, A.T. Spatial and temporal variabilities of δ13C and δ15N within lower trophic levels of a large lake: Implications for estimating trophic relationships of consumers. Hydrobiologia 2011, 675, 41–53. [Google Scholar] [CrossRef]
- Werner, E.E.; Gilliam, J.F. The ontogenetic niche and species interactions in size-structured populations. Ann. Rev. Ecol. Syst. 1984, 15, 393–426. [Google Scholar] [CrossRef]
- Paszkowski, C.A.; Tonn, W.M.; Holopainen, I.J. An experimental study of body size and food size relations in crucian carp, Carassius carassius. Environ. Biol. Fishes 1989, 24, 275–286. [Google Scholar] [CrossRef]


| Parameters | MDB | PDB | p-Values |
|---|---|---|---|
| Area (ha) | 12 | 57 | |
| Secchi depth (cm) | 117(97–137) | 34(25–45) | <0.01 |
| Total nitrogen (mg·L−1) | 0.79(0.49–1.30) | 1.45(0.53–1.94) | <0.05 |
| Total phosphorus (mg·L−1) | 0.024(0.017–0.031) | 0.110(0.092–0.123) | <0.01 |
| Total suspended solids (mg·L−1) | 3.6(2.2–5.6) | 34.9(24.5–49.8) | <0.01 |
| Chlorophyll a (mg·L−1) | 0.012(0.005–0.033) | 0.040(0.034–0.055) | <0.01 |
| Submerged macrophytes (g·DW·m−2) | 255(213–346) | 0 | |
| Fish catch per unit effort (CPUE) (g·net−1·2 h−1) | |||
| Planktivores | 0 | 1489(426–3164) | |
| Omnivores | 1893(588–4310) | 2014(1336–2920) | n.s. |
| Piscivores | 185(82–288) | 104(46–237) | n.s. |
| Herbivores | 88(0–439) | 0 | |
| Total fish | 2151(1009–4571) | 3608(1872–5014) | n.s. |
| Parameters | Total (Fish + Invertebrates) | Fish | ||
|---|---|---|---|---|
| MDB | PDB | MDB | PDB | |
| TA | 39.5 | 41.4 | 6.8 | 6.5 |
| CR | 7.6 | 9.5 | 3.6 | 1.8 |
| NR | 7.1 | 9.1 | 3.8 | 5.5 |
| CD | 2.5 | 2.5 | 1.4 | 1.7 |
| MNND | 1.0 | 0.6 | 0.9 | 0.4 |
| SDNND | 0.8 | 0.6 | 0.6 | 0.3 |
| Gut Contents | MDB (%) BL: 10.8(7–14.4) | PDB (%) BL: 18.3(11.8–22.2) |
|---|---|---|
| Vallisneria | 100 | - |
| Algae | 100 | - |
| Cladocerans | 100 | - |
| Copepods | 28.6 | - |
| Rotifers | 57.1 | - |
| Snails | 28.6 | - |
| Chironomids and oligochaetes | 71.4 | 71.4 |
| Detritus | 100 | 100 |
© 2017 by the authors; licensee MDPI, Basel, Switzerland. This article is an open access article distributed under the terms and conditions of the Creative Commons Attribution (CC BY) license (http://creativecommons.org/licenses/by/4.0/).
Share and Cite
Gao, J.; Zhong, P.; Ning, J.; Liu, Z.; Jeppesen, E. Herbivory of Omnivorous Fish Shapes the Food Web Structure of a Chinese Tropical Eutrophic Lake: Evidence from Stable Isotope and Fish Gut Content Analyses. Water 2017, 9, 69. https://doi.org/10.3390/w9010069
Gao J, Zhong P, Ning J, Liu Z, Jeppesen E. Herbivory of Omnivorous Fish Shapes the Food Web Structure of a Chinese Tropical Eutrophic Lake: Evidence from Stable Isotope and Fish Gut Content Analyses. Water. 2017; 9(1):69. https://doi.org/10.3390/w9010069
Chicago/Turabian StyleGao, Jian, Ping Zhong, Jiajia Ning, Zhengwen Liu, and Erik Jeppesen. 2017. "Herbivory of Omnivorous Fish Shapes the Food Web Structure of a Chinese Tropical Eutrophic Lake: Evidence from Stable Isotope and Fish Gut Content Analyses" Water 9, no. 1: 69. https://doi.org/10.3390/w9010069