Regional Climate Change Impacts on Irrigation Vulnerable Season Shifts in Agricultural Water Availability for South Korea


1
Department of Bioresources and Rural Systems Engineering, Hankyong National University, Anseong 17579, Korea
2
Institute of Agricultural Environmental Science, Hankyong National University, Anseong 17579, Korea
3
Institute on the Environment, University of Minnesota, Minneapolis, MN 55108, USA
4
United States Department of Agriculture (USDA)-Agricultural Research Service (ARS) Environmental Microbial & Food Safety Laboratory, Beltsville Agricultural Research Center, Beltsville, MD 20705, USA
5
Oak Ridge Institute of Science and Engineering, Oak Ridge, TN 37830, USA
6
Department of Rural Systems Engineering and Research Institute for Agriculture and Life Science, Seoul National University, Seoul 151742, Korea
*
Author to whom correspondence should be addressed.
Water 2017, 9(10), 735; https://doi.org/10.3390/w9100735
Submission received: 10 August 2017
/
Revised: 22 September 2017
/
Accepted: 25 September 2017
/
Published: 26 September 2017
Abstract
:Reservoirs are principal water resources that supply irrigation water to paddy fields and play an important role in water resources management in South Korea. For optimal irrigation reservoir operation and management, it is necessary to determine the duration of irrigation water shortages. Management of reservoir operation and irrigation scheduling should take into consideration essential variables that include the water supply in a reservoir and the water demand in the associated irrigation district. The agricultural water supply and demand show different patterns based on the variability and uncertainty of meteorological and hydrological phenomena. The duration of excessive water supply can be quantitatively determined through analysis of deviations and changes in the timing of agricultural water supply and demand. In this study, we introduce an approach to assess the vulnerable seasons of paddy irrigation to enable more effective operation and management of reservoirs. The vulnerable seasons were evaluated through comparison of the potential water supply capacity and irrigation water requirements based on water budget analysis via a time series change analysis. We have assessed the changing in the total duration and duration shifts of the vulnerable irrigation seasons for four agricultural reservoirs using past observed data (1981–2010) from meteorological stations maintained by the Korea Meteorological Administration (KMA) and projected climate change scenarios (2011–2100) as depicted by the Representative Concentration Pathways (RCPs) emission scenarios. For irrigation vulnerable seasons under both the RCP 4.5 and RCP 8.5 scenarios, the results showed periods of significant increases in which total vulnerable seasons compared to the historical period; the longest duration of vulnerability occurred during the 2071–2100 period under the RCP 8.5. Identification of the vulnerable seasons for paddy irrigation can be applied in agricultural water management to more effectively manage reservoir operation during irrigation periods with climate changes.
1. Introduction
Global climate change projections strongly suggest that over future decades, global temperatures will continue to rise, and that spatio-temporal patterns of temperature and precipitation will shift [1]. It is well-known that anthropogenic climate change has a large impact on moisture and heat transfer, which influence weather elements changing patterns [2]. These changes, in turn, may significantly affect demand for irrigation water, as well as water availability, via changes to soil and surface water balances based on evapotranspiration, effective precipitation, and surface runoff [3,4]. For these reasons, it is important to estimate quantitatively the anticipated effects of climate change on irrigation water requirements [5]. Previous work has reported significant changes in precipitation and temperature that may be associated with impacts to irrigation water demand in the past, present, and future on global and regional scales [6,7,8,9,10,11]. To ensure sustainability, irrigation vulnerability assessment and adaptation strategies based on estimates of changing irrigation demand are necessary.
Reservoirs are the principal sources that supply irrigation water to paddy fields, and thus serve as major storage reservoirs of excess water for later periods of drought. The demand for irrigation water is projected to increase based on the expansion of under-irrigated agricultural areas and urbanization. As a consequence of agricultural and socioeconomic development over the past several decades, the demand for irrigation water has increased, and evaluation of water-supply vulnerability is crucial because of the uncertainties associated with climate change. The underlying operation of irrigation reservoirs for paddy field agriculture is spatio-temporally variable with changes to irrigation-vulnerable seasons. Therefore, because of limited water supplies, the importance of effective management of water availability for irrigation has increased [12,13,14].
Appropriate management of reservoir operation and irrigation scheduling is essential to increase the overall efficiency of reservoir irrigation systems. Irrigation scheduling models have been developed to establish planned procedures for efficient distribution of irrigation water [15,16,17]. In the past several decades, substantial research has been conducted using reservoir optimization models to identify optimal operating strategies and irrigation scheduling, and several methodologies have been developed to optimize allocation [18,19,20,21]. Irrigation scheduling for a variety of crops in cases of limited water supply has been extensively studied and applied [22,23,24]. To determine optimal irrigation procedures and scheduling for reservoir operation, the duration of the irrigation water shortage must be specified.
The most important aspect of reservoir management is ensuring that the appropriate quantities of water are released to irrigation districts at the appropriate times. Performance evaluations of reservoir operation are critical, and may be particularly difficult because of increasing demand and the unreliability of stream flow [25,26,27,28,29]. Traditional assessments of irrigation reservoir operation, including observations of meteorological parameters and reservoir water level, are adopted during drought periods. These methods have limitations, however, and often present difficulties in explaining water shortages because different irrigation districts have different paddy field properties and irrigation reservoir sizes. To effectively supply irrigation water despite periods of drought, methods that account for changes in water supply and demand should be systematized, and adaptation strategies should include responses for supply and demand management [30,31,32].
South Korea’s rural regions are highly vulnerable to water deficits in irrigation districts because of seasonal variations in precipitation [33]. Because agriculture is the main sector of water use in South Korea, the estimation of the agricultural water demand with the changing environment is essential for long-term water resources planning and management [34,35]. To estimate agricultural water supply and demand, numerous variables must be considered including weather, types of crops, soil types, growing conditions, cultivation methods, and the ratios of watersheds to their respective watershed areas [36,37,38]. However, changes in the duration of the water supply conditions occur because of the variability and uncertainty of meteorological and hydrological phenomena. Temporal characteristics including frequency, duration, and intensity of water shortages, and the amounts and fluctuations of agricultural water supply and demand are among the strategic problems that show different patterns in reservoirs. The duration of excessive water supply conditions can be quantified through analysis of deviation and changes in the timing of water supply and demand. The primary purpose of this study is to develop an approach to assess the vulnerable seasons of paddy irrigation for effective management of reservoirs based on patterns of change in water supply and irrigation water requirements.
For this study, we have developed an alternative approach to evaluate agricultural water supply and demand to identify vulnerable seasons when paddy irrigation will rely on uncertain water resources. This method may be useful for decision-making in agricultural water management. The objectives of this study are (1) to estimate the water supplies of reservoirs and the demand in irrigation districts based on water budget analysis, (2) to compare water supply and demand associated with changing patterns, (3) to determine which irrigation seasons are vulnerable and require reservoir management and irrigation scheduling, and (4) to analyze shifts in vulnerable irrigation seasons associated with climate change.
2. Materials and Methods
2.1. Study Area Description
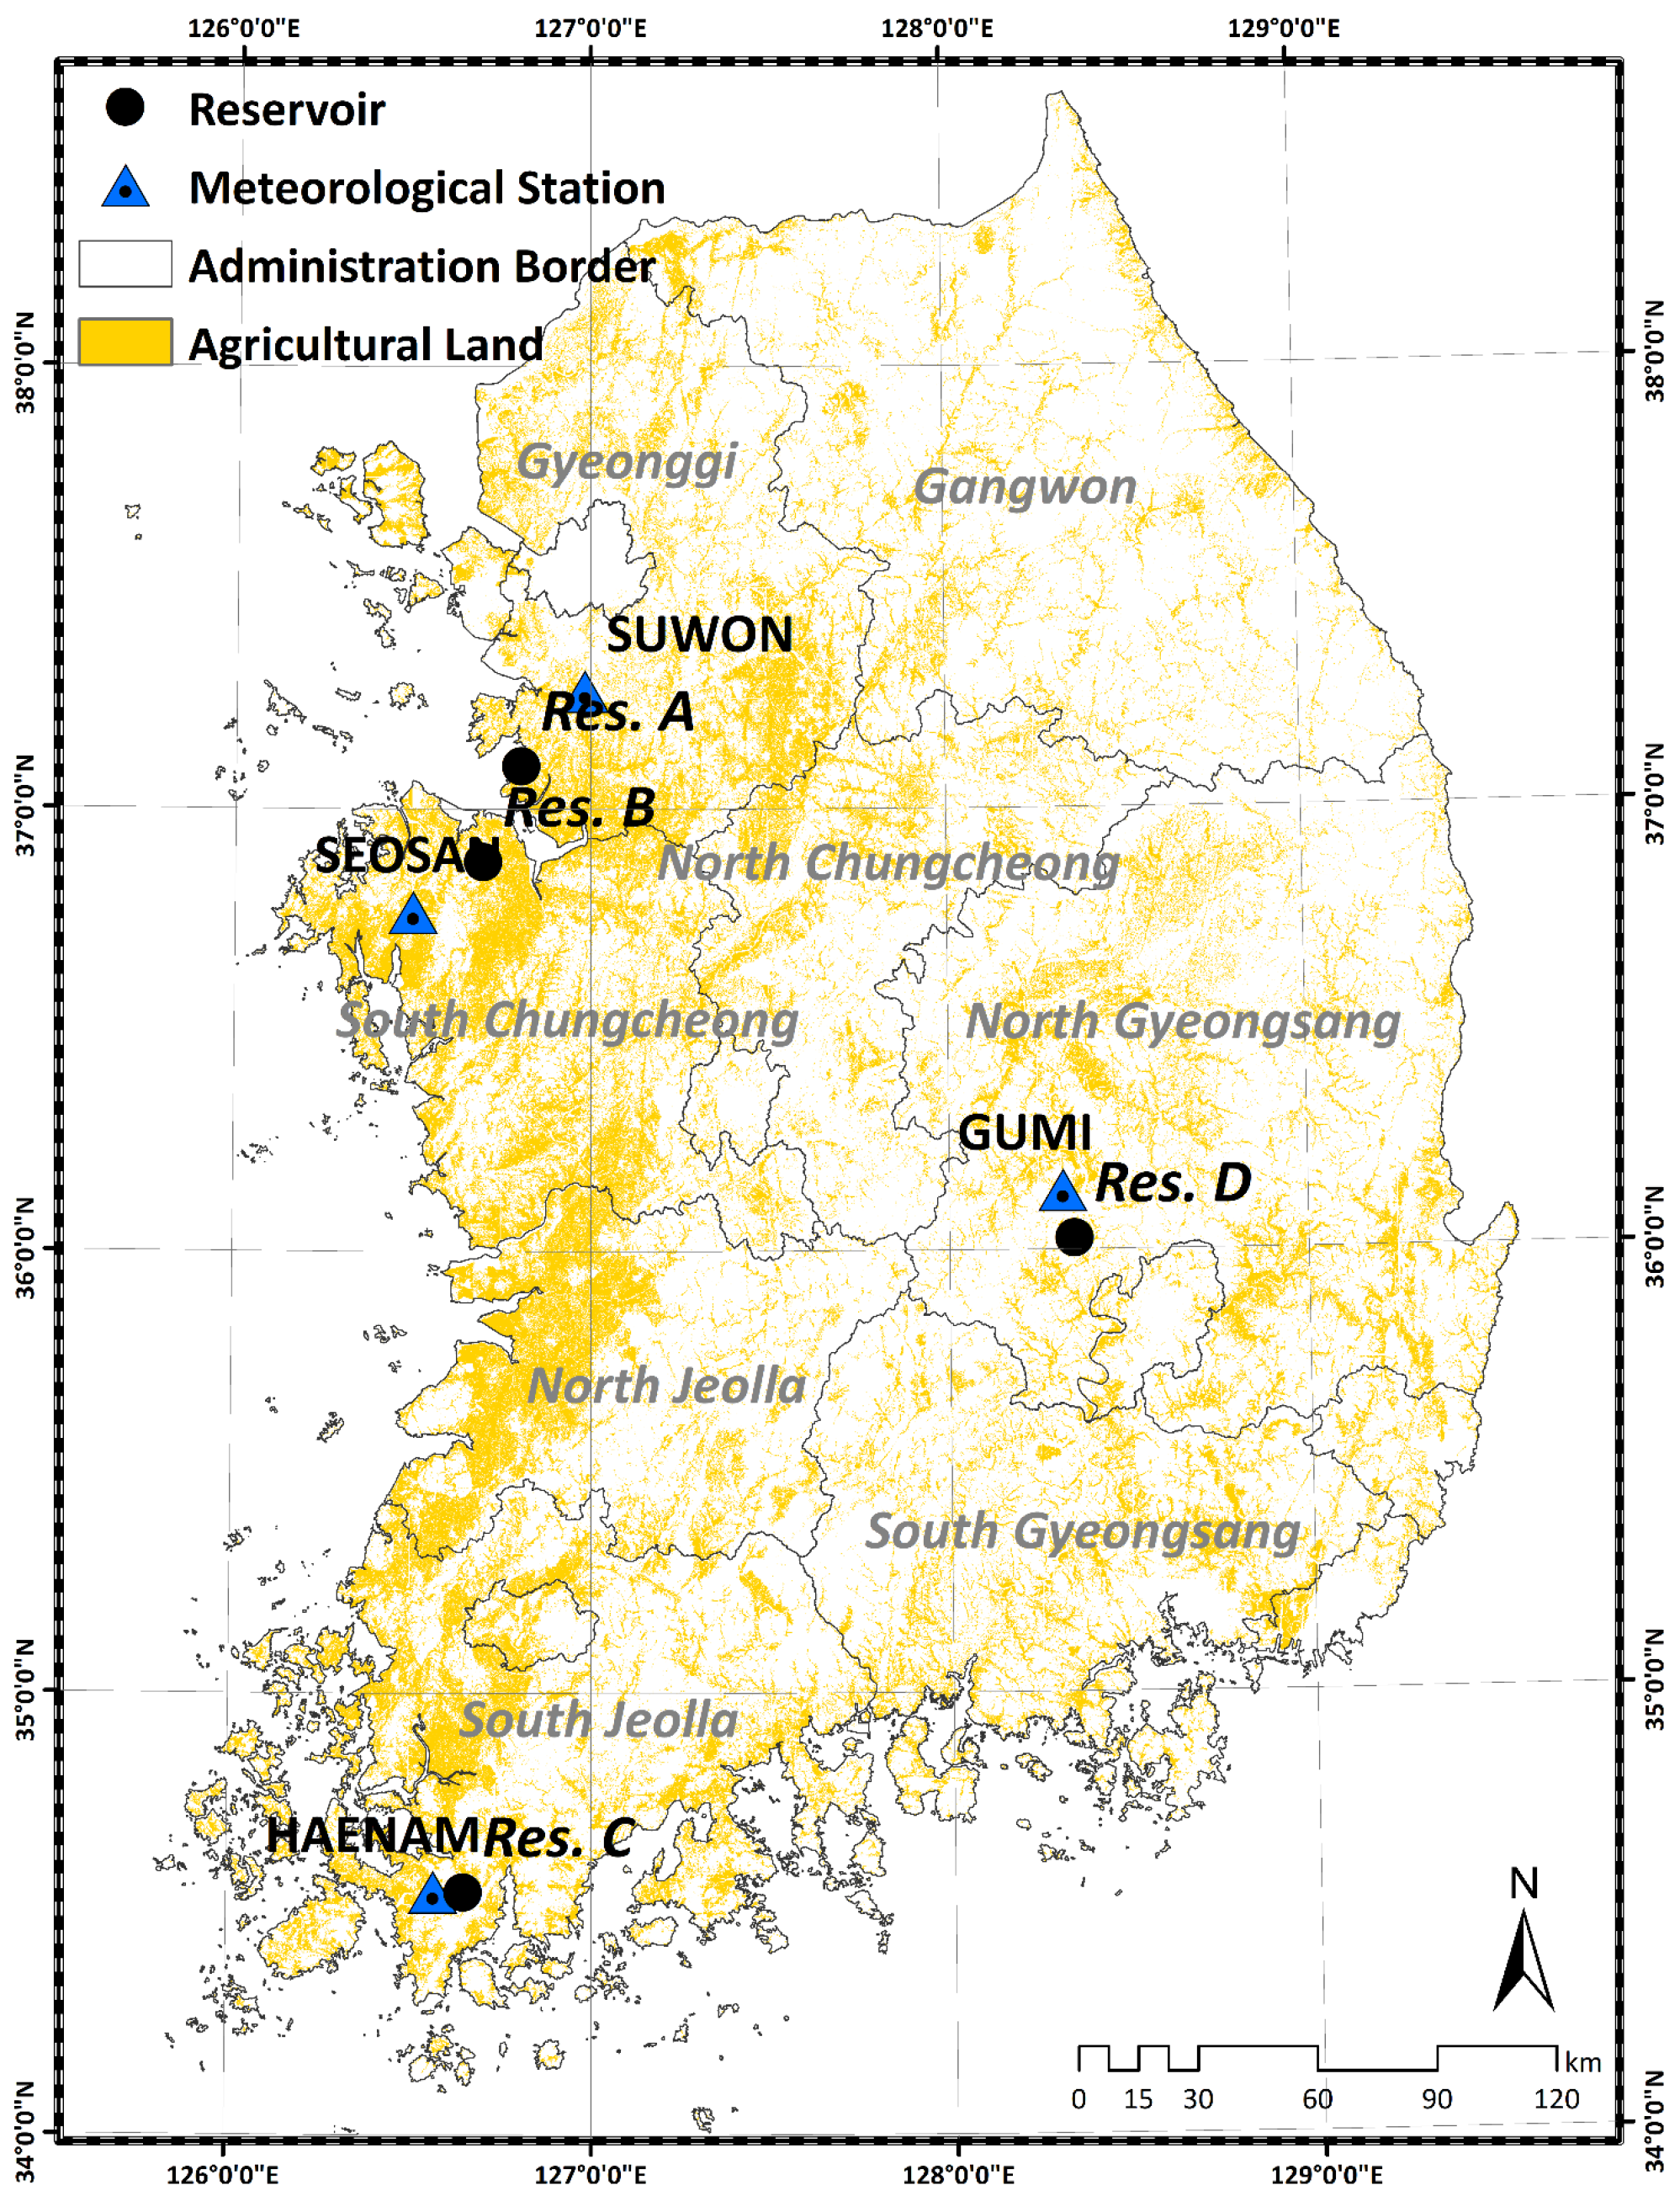
Agricultural water withdrawal constitutes approximately 47% of total water consumptive use in South Korea; this water is mostly used for paddy irrigation via irrigation canals. South Korea’s main agricultural crop is rice grown in paddies. The total cultivated rice paddy area in South Korea was 924,000 ha in 2012, which accounts for approximately 53.2% of the total area of South Korean farmland [39]. These paddies provide 5,632,000 MT of rice to the Korean economy; Korea produces 0.8% of the global supply of rice (FAO STAT, http://faostat.fao.org). The methodology described in this study was implemented in target reservoirs with typical characteristics: four reservoirs managed by the Korean Rural Community and Agriculture Corporation (KRC), with design frequencies of drought of less than 10 years, were selected to compare the impacts of climate change to paddy irrigation in vulnerable seasons. The characteristics of the selected reservoirs, including effective water storage capacity, watershed area, irrigated area, meteorological station, and the design frequency of drought for each reservoir, are provided in Table 1. Two reservoirs, Myeoku (Res. A) and Songak (Res. B), are located in the central region of the country between 36° and 38° N. The other two, Baekho (Res. C) and Duman (Res. D), are located in the southern region between 34° and 36° N as shown in Figure 1.
2.2. Data Collection of Historical and Representative Concentration Pathway Climate Change Scenarios
Scenarios that represent a range of future climate changes as projected by the Intergovernmental Panel on Climate Change (IPCC) Representative Concentration Pathways (RCPs) were used for this study. Researchers of the Korea Meteorological Administration (KMA) and the National Institute of Meteorological Research (NIMR) produced part of the fifth phase of the Coupled Model Intercomparison Project (CMIP5) and the Coordinated Regional Climate Downscaling Experiment (CORDEX) simulations using the Hadley Centre Global Environmental Model (HadGEM) series of models [40]. The KMA produced the regional climate projections and the atmospheric regional climate model HadGEM3-RA using the dynamical downscaling method with a coupled atmosphere–ocean general circulation model (GCM), HadGEM2-AO (version 2 of the atmosphere–ocean coupled model of the Hadley Centre Global Environment Model). Projected climate change data from a high-resolution (1 km) climate change scenario were generated using a statistical downscaling technique by applying PRISM (Parameter-elevation Regressions on Independent Slopes Model) [41,42,43] during two RCP scenarios for 2011 to 2100. The historical data used are the observed data from the period from 1981 to 2010. The downscaled climate projections from the RCP 4.5 and 8.5 scenarios were created for the next 90 years in the intervals 2011–2040, 2041–2070 and 2071–2100, as shown in Table 2. Daily meteorological data, including daily maximum and minimum temperatures, precipitation, solar radiation, relative humidity and sunshine duration for the selected KMA weather stations were obtained.
2.3. Vulnerable Irrigation Season Modeling with Climate Change
A method for irrigation reservoir management generally has two components: analysis of water supply in the watershed and analysis of water demand in the irrigation district. Water supply–demand balance schemes for different regions are developed based on site-specific parameters such as differences in geological characteristics and hydrological conditions. Uncertainty of the supply influences agricultural water management in irrigation districts because of seasonal variations in precipitation. It is important to understand reservoir operations associated with the timing of the water supply, as well as methods for deciding the amount of water a rice paddy requires, taking into consideration both the growth stages of rice and reservoir storage volume. To effectively manage reservoir operations, an approach should be developed that includes a method to define the vulnerable seasons of paddy irrigation based on the relationship between the supply and demand of agricultural water.
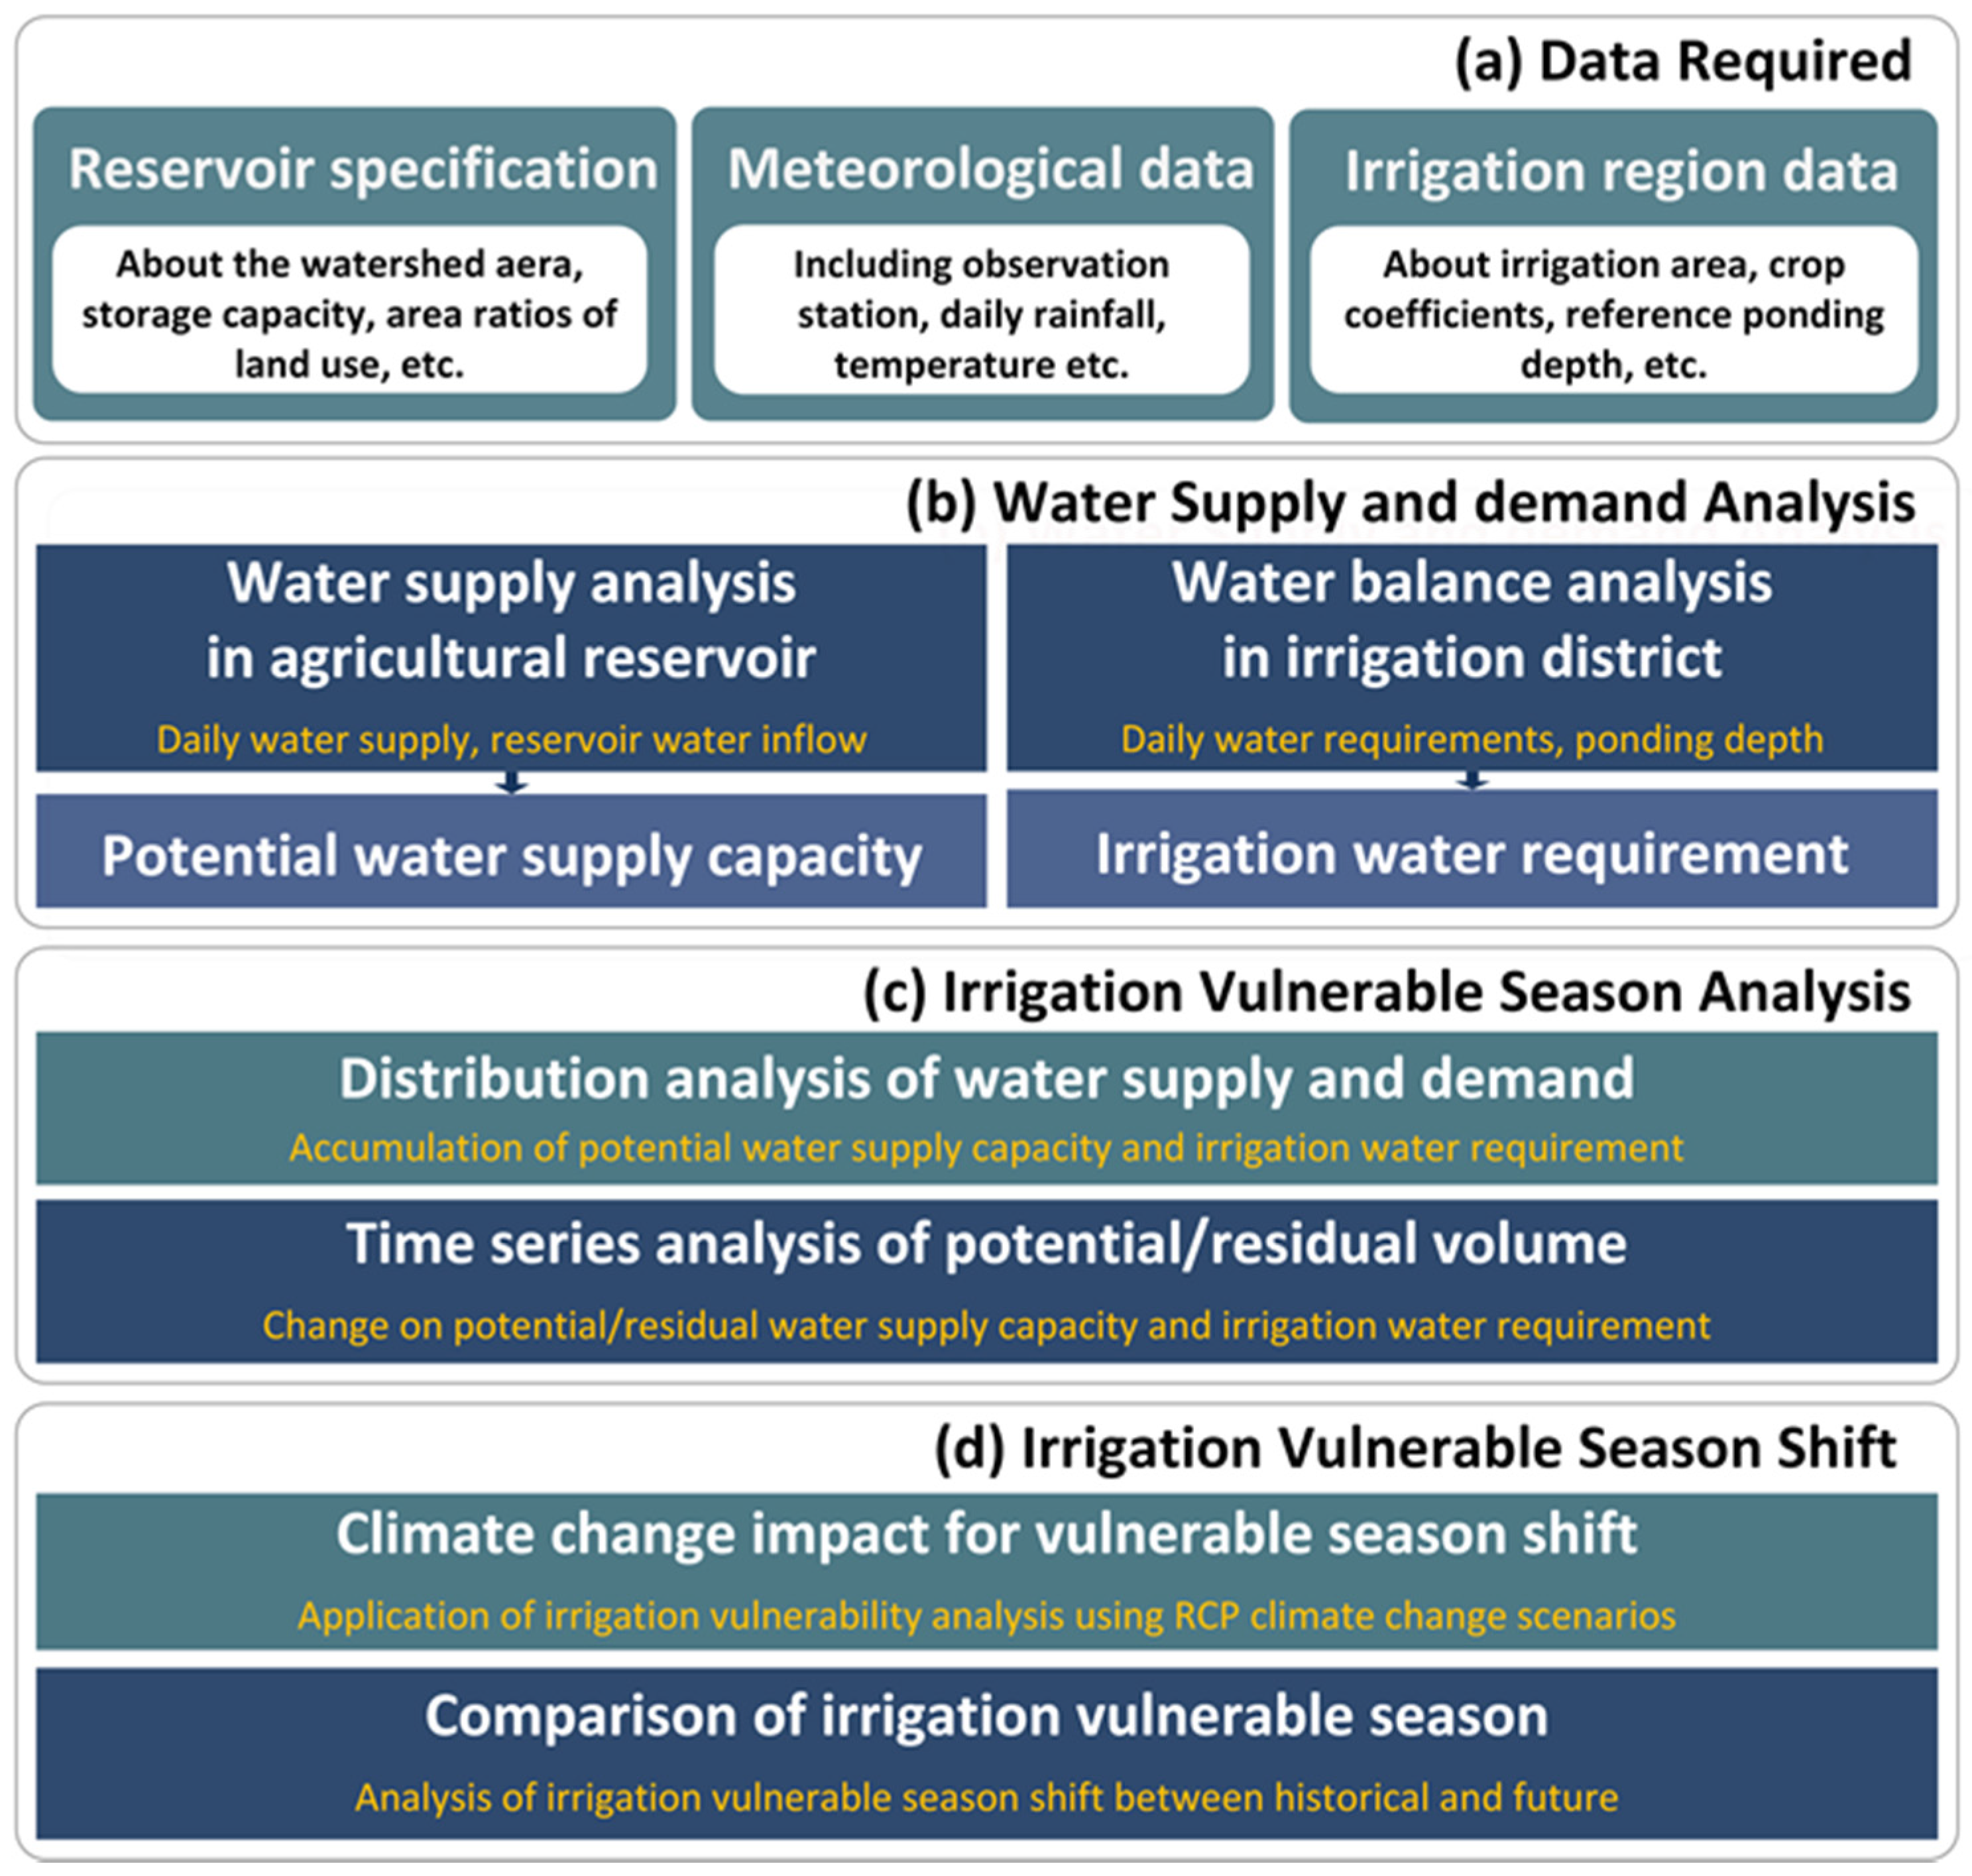
We have developed a schematic diagram to illustrate this concept, as shown in Figure 2. There are two elements to the assessment of vulnerable seasons: the potential water supply capacity and the irrigation water requirements. Water supply analysis of reservoirs and water balance analysis of an irrigation district must account for the inflow from the watershed and the release into the irrigation district based on the reservoir specifications, meteorological data and irrigation region. Irrigation vulnerability can be evaluated using distribution analysis of the accumulation volume of the potential water supply capacity and the irrigation water requirements, as well as change time-series analysis of the potential irrigation capacity [44,45]. Therefore, for a more objective method of evaluating agricultural water availability, it is recommended to analyze shifts in the vulnerable seasons for paddy irrigation. These models were applied to the study areas for current conditions and for a set of climate change scenarios to take into consideration the management period analysis for the reservoirs and support policy decisions for reservoir management.
2.4. Water Resources Balance Model for Reservoirs
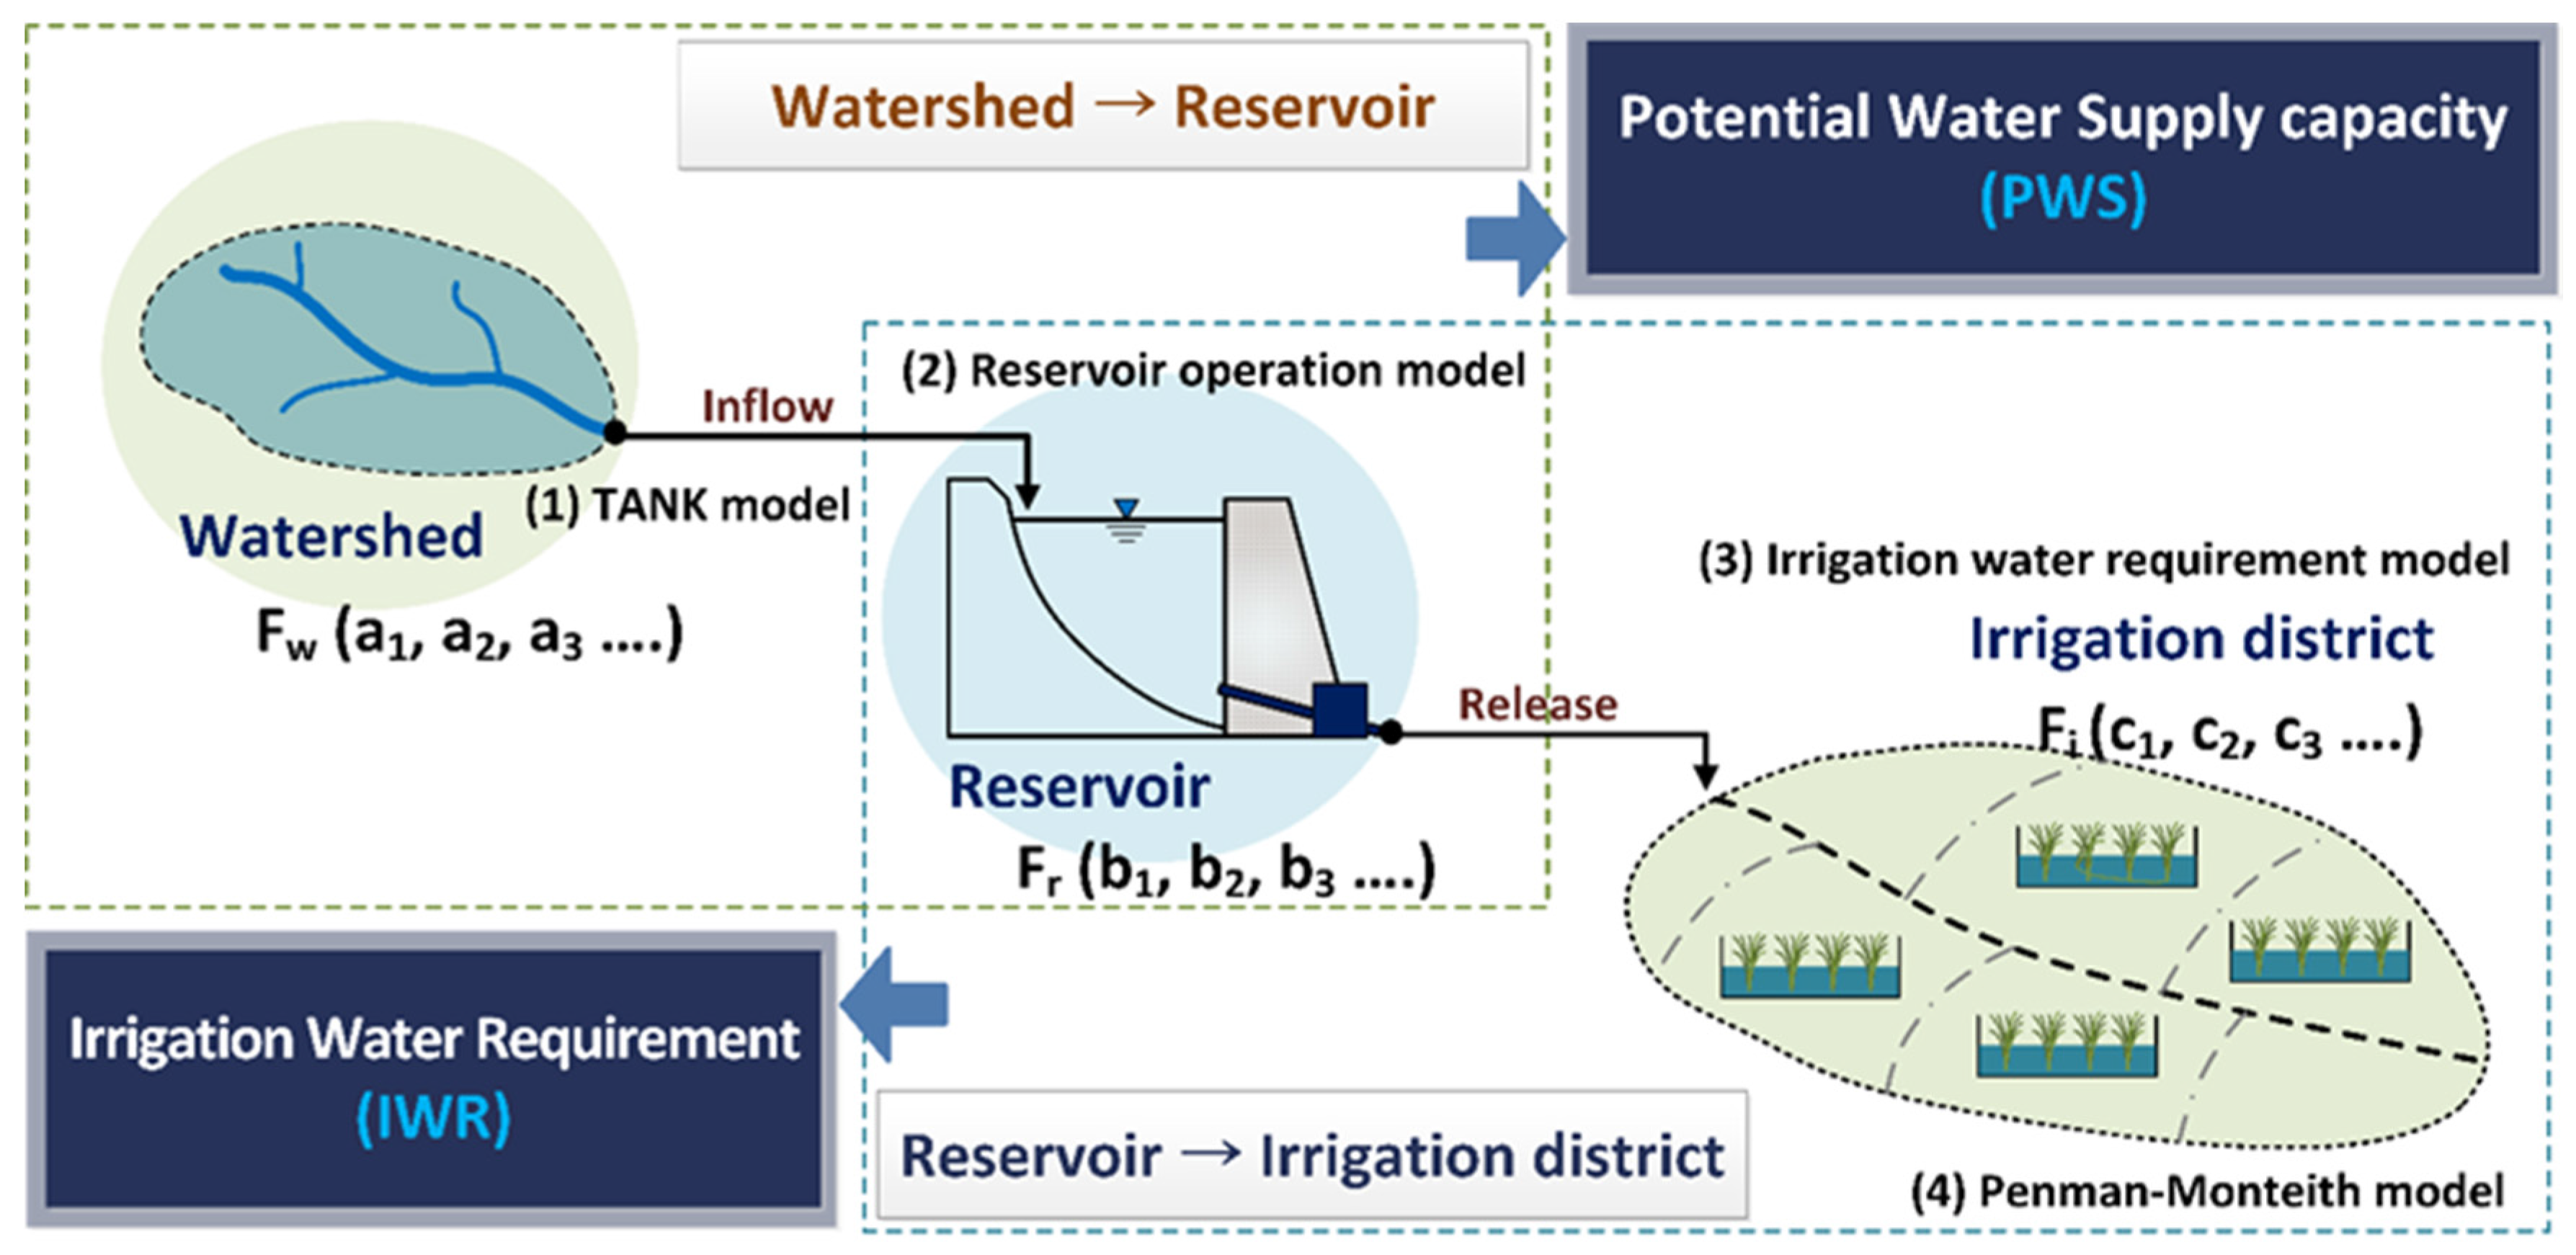
An agricultural water supply-and-demand system for each reservoir, which consists of a watershed, irrigation reservoir and an irrigation district, was used in this study. This system comprises three components including rainfall–runoff models for the watersheds, reservoir operation models for the reservoirs and paddy water requirement models for the irrigation districts. The agricultural water supply capacity of a reservoir is typically determined based on the available supply, and accounts for water inflow into the basin in the reservoir, water supply by the irrigation facilities and water demand of the irrigated districts. For more accurate estimation of irrigation water supply and demand, reservoir operation and irrigation water demand are often estimated using the water balance concept [46,47]. Three sets of constraints were considered for this study: the water balance of a reservoir based on evaporation loss, the limitations on available water and the restrictions imposed based on the reservoir capacity. The demand for irrigation and the water supply capacity for reservoir are influenced by changing meteorological and hydrological conditions such as precipitation, temperature, potential and actual evapotranspiration and runoff in the watershed. The water balance is determined by collecting various data including observed meteorological data, cultivated land distribution data, and farming practice data. In this study, regional agricultural water resources depend on the irrigation districts of the reservoirs, for which the quantity of available water is calculated using an agricultural water resources balance model, which includes a rainfall–runoff model, an irrigation water requirement model and a reservoir operation model, as shown in Figure 3.
2.5. Reservoir Operation Model
Reservoir operation modeling can be conducted based on the amount of available reservoir storage, which is determined from the water demand in irrigation districts and water supply analyses using reservoir water balance modeling. Models that simulate agricultural water systems have been developed to estimate the daily water demand of paddy fields and the inflow into watersheds in the reservoir. Reservoir operation analysis, with a water balance simulation model, has been used to identify the threshold value for the amount of water harvested and the reservoir storage capability to satisfy a defined irrigation demand [49,50].
A water balance analysis of each reservoir was performed using the Daily Irrigation Reservoir Operation Model (DIROM). The DIROM simulates daily inflow and the release rate for an irrigation reservoir based on the tank model (a typical conceptual rainfall–runoff model) [51] to estimate inflow into the reservoir and watershed runoff using watershed area and land-use as watershed characteristic factors. The data used in the daily water balance models for the irrigation reservoirs were categorized into the following three groups: meteorological data, irrigation regional data and reservoir specifications data. This model must incorporate a hydrologic model that simulates the inflow from the watershed and the release to the irrigation district to effectively manage the water stored in the reservoir during an irrigation season. The daily available water storage in a reservoir is defined as the difference between the current storage and dead storage, which can be estimated with the following equation:
where RS is the available reservoir storage, RI is the reservoir inflow based on the tank model, RP is the rainfall to the reservoir surface, INT is the intake water supply used by irrigation districts, RF is the overflow through the sluice gates, RO is any other loss, such as percolation and dam seepage, RE is evaporation loss and t is a daily time index. RI is estimated from the modified tank model whereby simulated runoff data are used as daily inflow measurements for the reservoir operation model. The tank model has been widely used in Japan, Korea and many other countries in Asia for flood forecasting, watershed modeling, and reservoir operation from an unmeasured watershed [52]. In the case of the small-sized watershed in South Korea, a modified three-layer tank is widely used when the basin lag time is short and the hydrograph recession slope is steep [53].
RS(t) = RS(t − 1) + RI(t) + RP(t) − (INT(t) + RF(t) + RO(t) + RE(t))
For the present study, the runoff of a watershed was estimated based on the characteristics of reservoirs in South Korea. For this method, the parameters are estimated using an empirical formula with variables for watershed area and ratios of land use such as paddy fields, uplands, and forests, based on the characteristics of reservoirs in South Korea (Ministry of Agriculture and Forestry) [54]. INT depends on the daily water requirements, including the water delivery required to offset conveyance losses, and the irrigation efficiency, for which 20% of the amount released is used, as suggested by [54]. RO was not considered for this study because this amount is very small and has little effect on the water balance. RE was calculated by applying a pan coefficient ranging from 0.6 to 0.8 to estimate pond water surface evaporation, as proposed by [55].
2.6. Irrigation Water Requirement Model
Previous researchers have developed simulations of the water demand of individual crops based on soil type and stressed the development of appropriate scheduling procedures for timely supply of irrigation water to fields [56,57]. Irrigation management requires decisions about how much water and area should be allocated to crops in different regions or parts of regions of the allocation planning area based on water availability [58]. It is therefore important to develop an optimal allocation plan and corresponding water release schedule for irrigation management.
The agricultural water demand of a region is considered to be the primary factor for assessing current water use and future water requirements. Irrigation water requirements can be quantitatively estimated using simulation models, and vary according to the balance between precipitation and evapotranspiration and the resulting fluctuations in soil moisture [59,60]. Irrigation water demand is usually estimated based on the method suggested by [61]. For irrigation, a traditional method for estimating water demand of a crop is to determine the depth of water needed to compensate for the water lost through daily evapotranspiration and effective rainfall based on water balance models. In rice paddy cultivation, the irrigation water demand model is essentially determined as a function of evapotranspiration, infiltration, effective rainfall and drainage. Therefore, to estimate irrigation water requirement for the paddies of the target agricultural land, the following parameters were calculated: the reference crop evapotranspiration, crop coefficient, crop evapotranspiration, water allowances for land preparation, net irrigation and the actual irrigation water demand based on both the irrigation method and application efficiency.
Agricultural water demand is defined as the net water demand for crop cultivation and the value determined for daily crop evapotranspiration. The water requirements of the irrigation districts are defined by agricultural consumption, primarily of irrigation water lost to evapotranspiration as calculated using the Penman–Monteith equation. Therefore, the irrigation water requirements are defined by the accumulation value of paddy field consumption during the growing stages of the crops. The paddy field water balance model was developed to estimate daily water requirements of by paddy fields, including the water needed for transplanting and the minimum release to maintain canal flow. Daily water requirements are defined as the pending water depth of required water that is lost through crop evapotranspiration, and can be simulated using meteorological and farming practice data with the following equation [62]:
where NetIWR is the daily net irrigation water requirement, PD is the reference ponding water depth for each growth stage, D is the ponding water depth, ETc is crop evapotranspiration, DP is deep percolation, defined as 5 mm/day as suggested by [54] for Korea, ER is the effective rainfall and t is a daily time index. All of these parameters are in units of mm. Irrigation water is supplied for a controlled reference ponding water depth for each growth stage based on the effective root zone of a single layer of rice, as shown in Table 3. The period for paddy field crop irrigation is from the beginning of May to the end of September.
NetIWR(t) = PD(t) − D(t − 1) + ETc(t) + DP(t) − ER(t)
Estimation of evapotranspiration is important for assessing the amount and the timing of irrigation needed to ensure adequate crop growth [18]. The consumptive use of water, ETc, is determined from the reference crop evapotranspiration, which is computed with the FAO (Food and Agriculture Organization of the United Nations) Penman–Monteith method [66] using the ten-day crop coefficients for rice paddy, which are related to crop characteristics and stages of crop growth. Values for the crop coefficients of rice during crop establishment, development, mid-season and maturity stages were assumed to be 1.05, 1.10, 1.10 and 0.95, respectively [54,63]. Deep percolation (DP) is downward movement of water through the saturated soil layer. In paddy fields, infiltration refers to deep percolation because all layers of soil are assumed to be saturated. Through field experimentation, the Rural Research Institute of the KRC has determined that in several basins, the average infiltration rate ranges from 5.0 to 5.6 mm/day [67]. For this study, the daily DP of the paddy fields was assumed to be 5.0 mm/day.
Finally, effective rainfall (ER), the quantity of rainfall absorbed into the soil and available for crop growth, except for water lost as surface runoff during irrigation, is derived based on the relationship between ponding water depth and the amount of rainfall. ER amounts during the irrigation season depend on the amount of rainfall, rainfall intensity, soil infiltration rate, topography, antecedent soil moisture and water management, and were calculated to simulate ponding water depth [68]. This method has been used for agricultural irrigation facilities designed by the KRC, and yields an ER of 0 mm when rainfall is less than 5 mm, 80% for between 5 mm and 80 mm of rainfall and 64 mm for more than 80 mm of rainfall [54].
2.7. Elements of the Irrigation Vulnerability Assessment Model
Seasonal irrigation vulnerability is characterized by two main components and the relationship between them: irrigation water requirements of an irrigation district and the potential water supply capacity of the watershed. The potential water supply capacity during the irrigation season can be assessed by identifying the relative capacity between inflow from the watershed and release into the irrigation districts. This value can be determined from the accumulation value of the difference between the inflow and overflow in the watershed. The potential water supply capacity and the irrigation water requirements can be defined as the accumulation value of the agricultural water requirements of the irrigation district and the runoff in the watershed with regard to the crop growth stages as follows:
where PWS is the potential water supply capacity, RWI is the reservoir inflow equal to RI (reservoir inflow based on the tank model), RF is the reservoir overflow through the sluice gates, IWR is the irrigation water requirements, PWR is the paddy field water requirements equal to NetIWR, t is the unit of a daily time index and n is the end of an irrigation period.
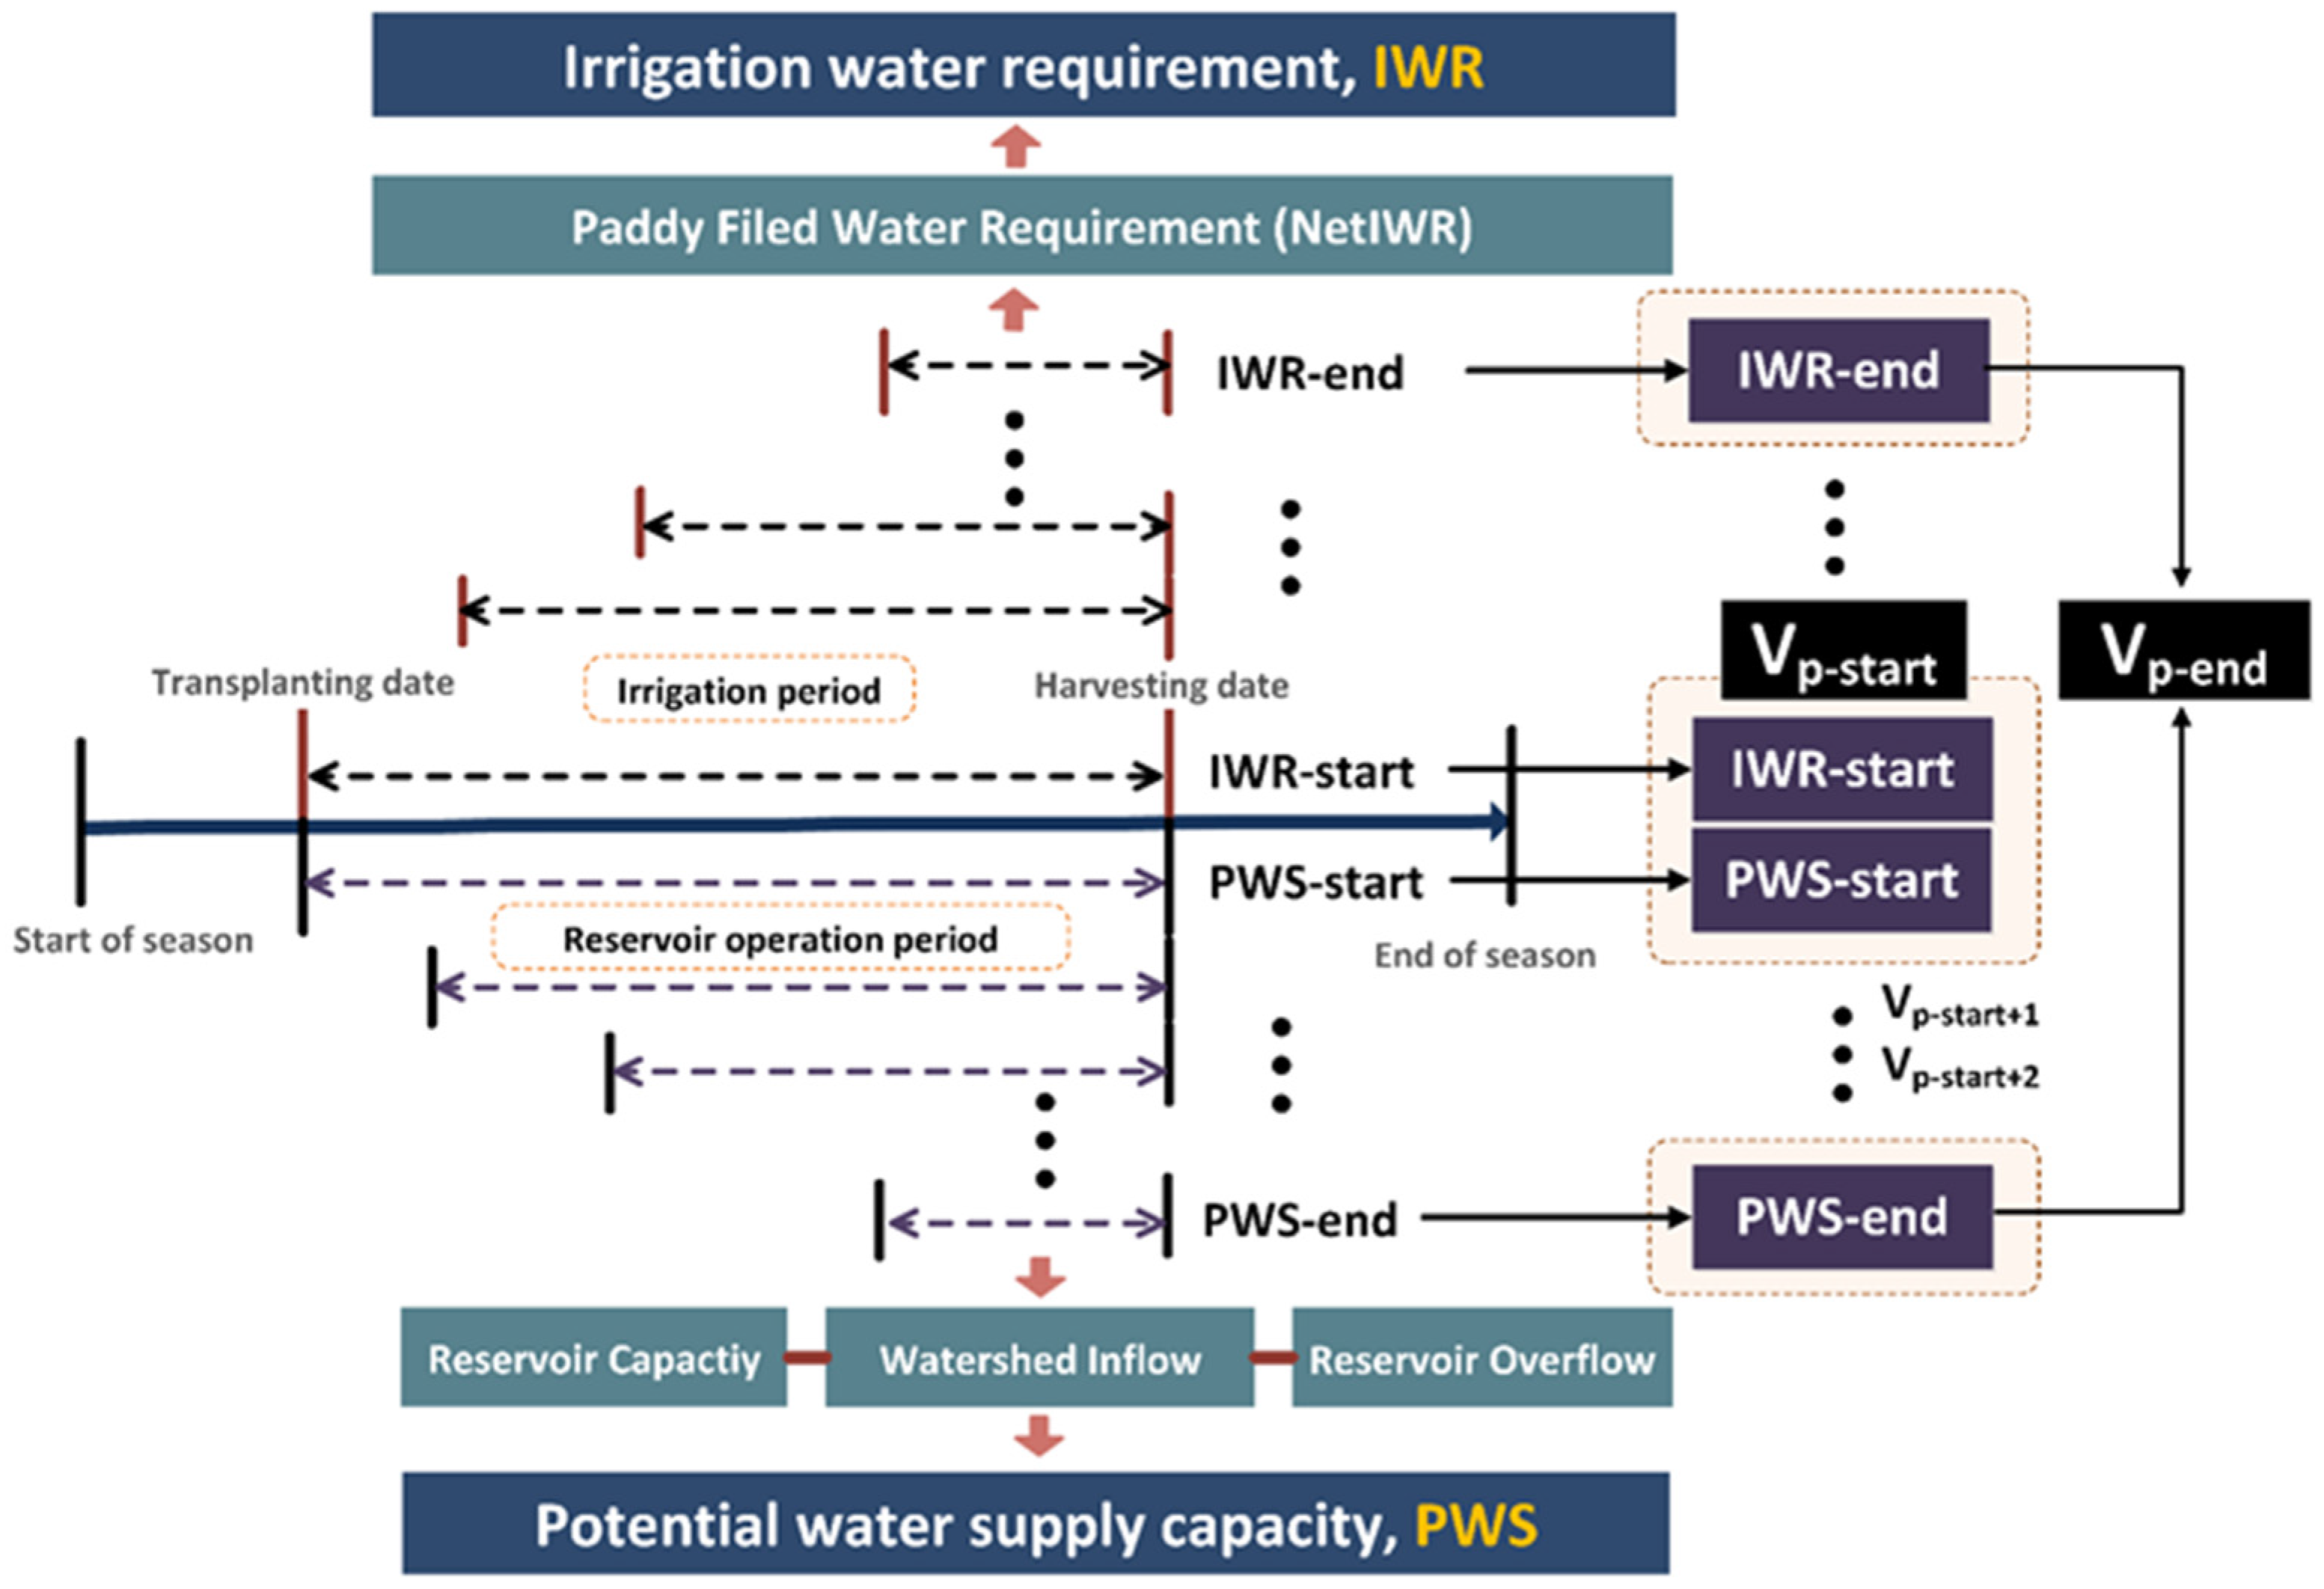
The PWS of a reservoir is defined as the difference between the sum of inflows from the watershed and the amount of reservoir overflow during the irrigation period. The IWR is estimated as the cumulative value of paddy field water demand during the irrigation period from the daily water balance equation. In this study, the duration assessment of irrigation vulnerabilities was dependent upon the available cumulative PWS and IWR, which were sequentially calculated from the beginning to the end of the irrigation period, as shown in Figure 4. The period of irrigation and reservoir operation was from the transplantation date to the harvest date. The irrigation vulnerability at time t is defined as the quantitative comparison of the cumulative PWS and IWR from time t to the end of the irrigation period. The cumulative PWS and IWR are equal to the amount of the residual values of the cumulative PWS and IWR over the entire irrigation period. For example, the first irrigation vulnerability assessment from the beginning of the irrigation period was used as the total of the cumulative PWS and IWR over the entire irrigation period. These two sets represent the volume of the potential supply at the beginning of the irrigation period. Using the method described above, irrigation vulnerability factors, which are defined as PWS and IWR, were calculated from the beginning to the end of the irrigation period.
2.8. Definition of the Vulnerable Seasons of Paddy Irrigation
To quantitatively assess irrigation vulnerabilities, the patterns of change of inflow into the watershed and irrigation water requirements must be estimated and compared with the irrigation demand requirements and the patterns of the available water supply. Agricultural water management must account for temporal variations and the relationship between the PWS and IWR. The vulnerable irrigation seasons of a reservoir must be analyzed in terms of the relationship between the available reservoir storage and the water demand of the paddy fields. In order to estimate seasonal irrigation vulnerability, defined as the patterns of change between supply and demand, the distribution of the PWS and the IWR must be determined, as shown in Figure 5.
The points in the figure represent the distribution of values for the two parameters, daily PWS and IWR. The volume of the potential values at the start point (Vp-start) indicates that the first elements result in the assessment of irrigation vulnerability at the beginning of an irrigation period based on the total cumulative PWS and IWR. As irrigation progresses, the values and distribution of the residual PWS and IWR are changed. For example, the volume of potential values at the tenth point (Vp-10) indicates that the tenth element result of the vulnerability assessment used the cumulative PWS and IWR for ten days from the beginning of the irrigation period to the end of the irrigation period. Using the method described above, irrigation vulnerability assessments from the beginning to the end of the irrigation period were performed, and these results are shown as the distribution of points in Figure 5. From the start to the end of irrigation, the temporal variation in the potential volume is explained based on the irrigation vulnerability assessment. In other words, the changing patterns, inclination and variation of the potential volume can be analyzed as durations of irrigation vulnerability.
A variety of interpretations of the slope can be described based on the irrigation vulnerability assessment results, as shown in Table 4. An inclination of 45° indicates that the values of the PWS and IWR are identical, and therefore that the irrigation water supply is appropriate. A slope of less than 45° indicates excessive irrigation. Because this study assumes an appropriate water supply, situations with excessive water do not appear in the results. In contrast, a slope of more than 45° indicates a shortage of irrigation water caused by insufficient precipitation and reduced inflow into the watershed.
3. Results and Discussion
3.1. Analysis of Climate Change Variability
Table 5 shows changes in meteorological variables such as annual precipitation and average temperature across four meteorological stations from a historical period (1981–2010) and RCP scenarios for three periods: the 2025s, 2055s, and 2085s. For annual precipitation under the RCP 4.5 scenario, the results show a significant increase from 23.6% (in the 2025s), to 30.2% (2055s), and then 39.7% (by the 2085s) compared to the historical period. Similarly, annual precipitation under the RCP 8.5 scenario increased from 21.7% (in the 2025s), to 34.5% (2055s), and then 40.5% (by the 2085s). Meanwhile, for the changes in average temperature under the RCP 8.5 scenario, the results indicate a sharp increase first by 9.2% (in the 2025s), then by 23.4% (2055s), and then 40.3% (by the 2085s). The average temperatures under the RCP 4.5 were also higher, by 7.4% (in the 2025s), 15.0% (2055s) and 19.8% (by the 2085s). An important result here is that there is an increasing trend for both the annual precipitation and the average temperature toward the end of the 2085s. Overall, there is an apparent linear trend (with a significant increase) toward long-term climate change in these future scenarios. Significantly higher precipitation and temperature, by approximately 40% in the 2085s, are predicted under both RCPs.
The average temperature in the 2085s under the RCP 8.5 was higher than that for other RCP, with a predicted increase of more than approximately 40% compared to the historical period. For the 2025s, precipitation was projected to increase an average of 20.0% in the central region and 25.4% in the southern region compared to historical data. During the 2055s and 2085s, precipitation was predicted to increase an average of 30.3% and 38.2% in the central region, and 34.4% and 42.0% in the southern region. Based on these results, the rate of increase in precipitation was found to be higher in the southern region than in the central region.
3.2. Analysis of Agricultural Water Supply and Demand Balance
Table 6 shows changes in individual model variables such as RI, RF, ETc, and ER across four reservoirs from a historical period (1981–2010) and RCP scenarios for three periods: the 2025s, 2055s, and 2085s. As shown in Table 7, changes to the annual potential water supply capacity and the irrigation water requirements of the four reservoirs were estimated. Compared to the historical period, the average rates of changes of the PWS under the RCP 4.5 scenario were increases of 3.3% (2025s), 2.0% (2055s) and 4.7% (2085s). However, the average rates of changes of the IWR under the RCP 4.5 scenario were increases of 5.2% (2025s) and 3.1% (2085s) higher, and a decrease of 4.1% (2055s). The average rates of changes of the IWR under the RCP 8.5 scenario showed increases of 3.2% (2025s), 7.8% (2055s), and 4.0 % (2085s). The PWS and IWR in the central region increased continually toward the end of the 2085s under the RCP 8.5, while the PWS and IWR in the southern region peaked in the 2055s and declined slightly in the 2085s under the RCP 8.5 scenario. The reservoir that showed the largest rate of change was Res. A. The patterns of changes of the water supply and demand elements were not uniform, but different for each reservoir. Despite the projected increases in precipitation and temperature in the predicted results of the model, the PWS and IWR did not increase in some cases because of several factors, such as the volume of overflow based on limited reservoir storage capacity, differences in water requirements of paddies caused by changes in the rainfall season, and the variability of the climate.
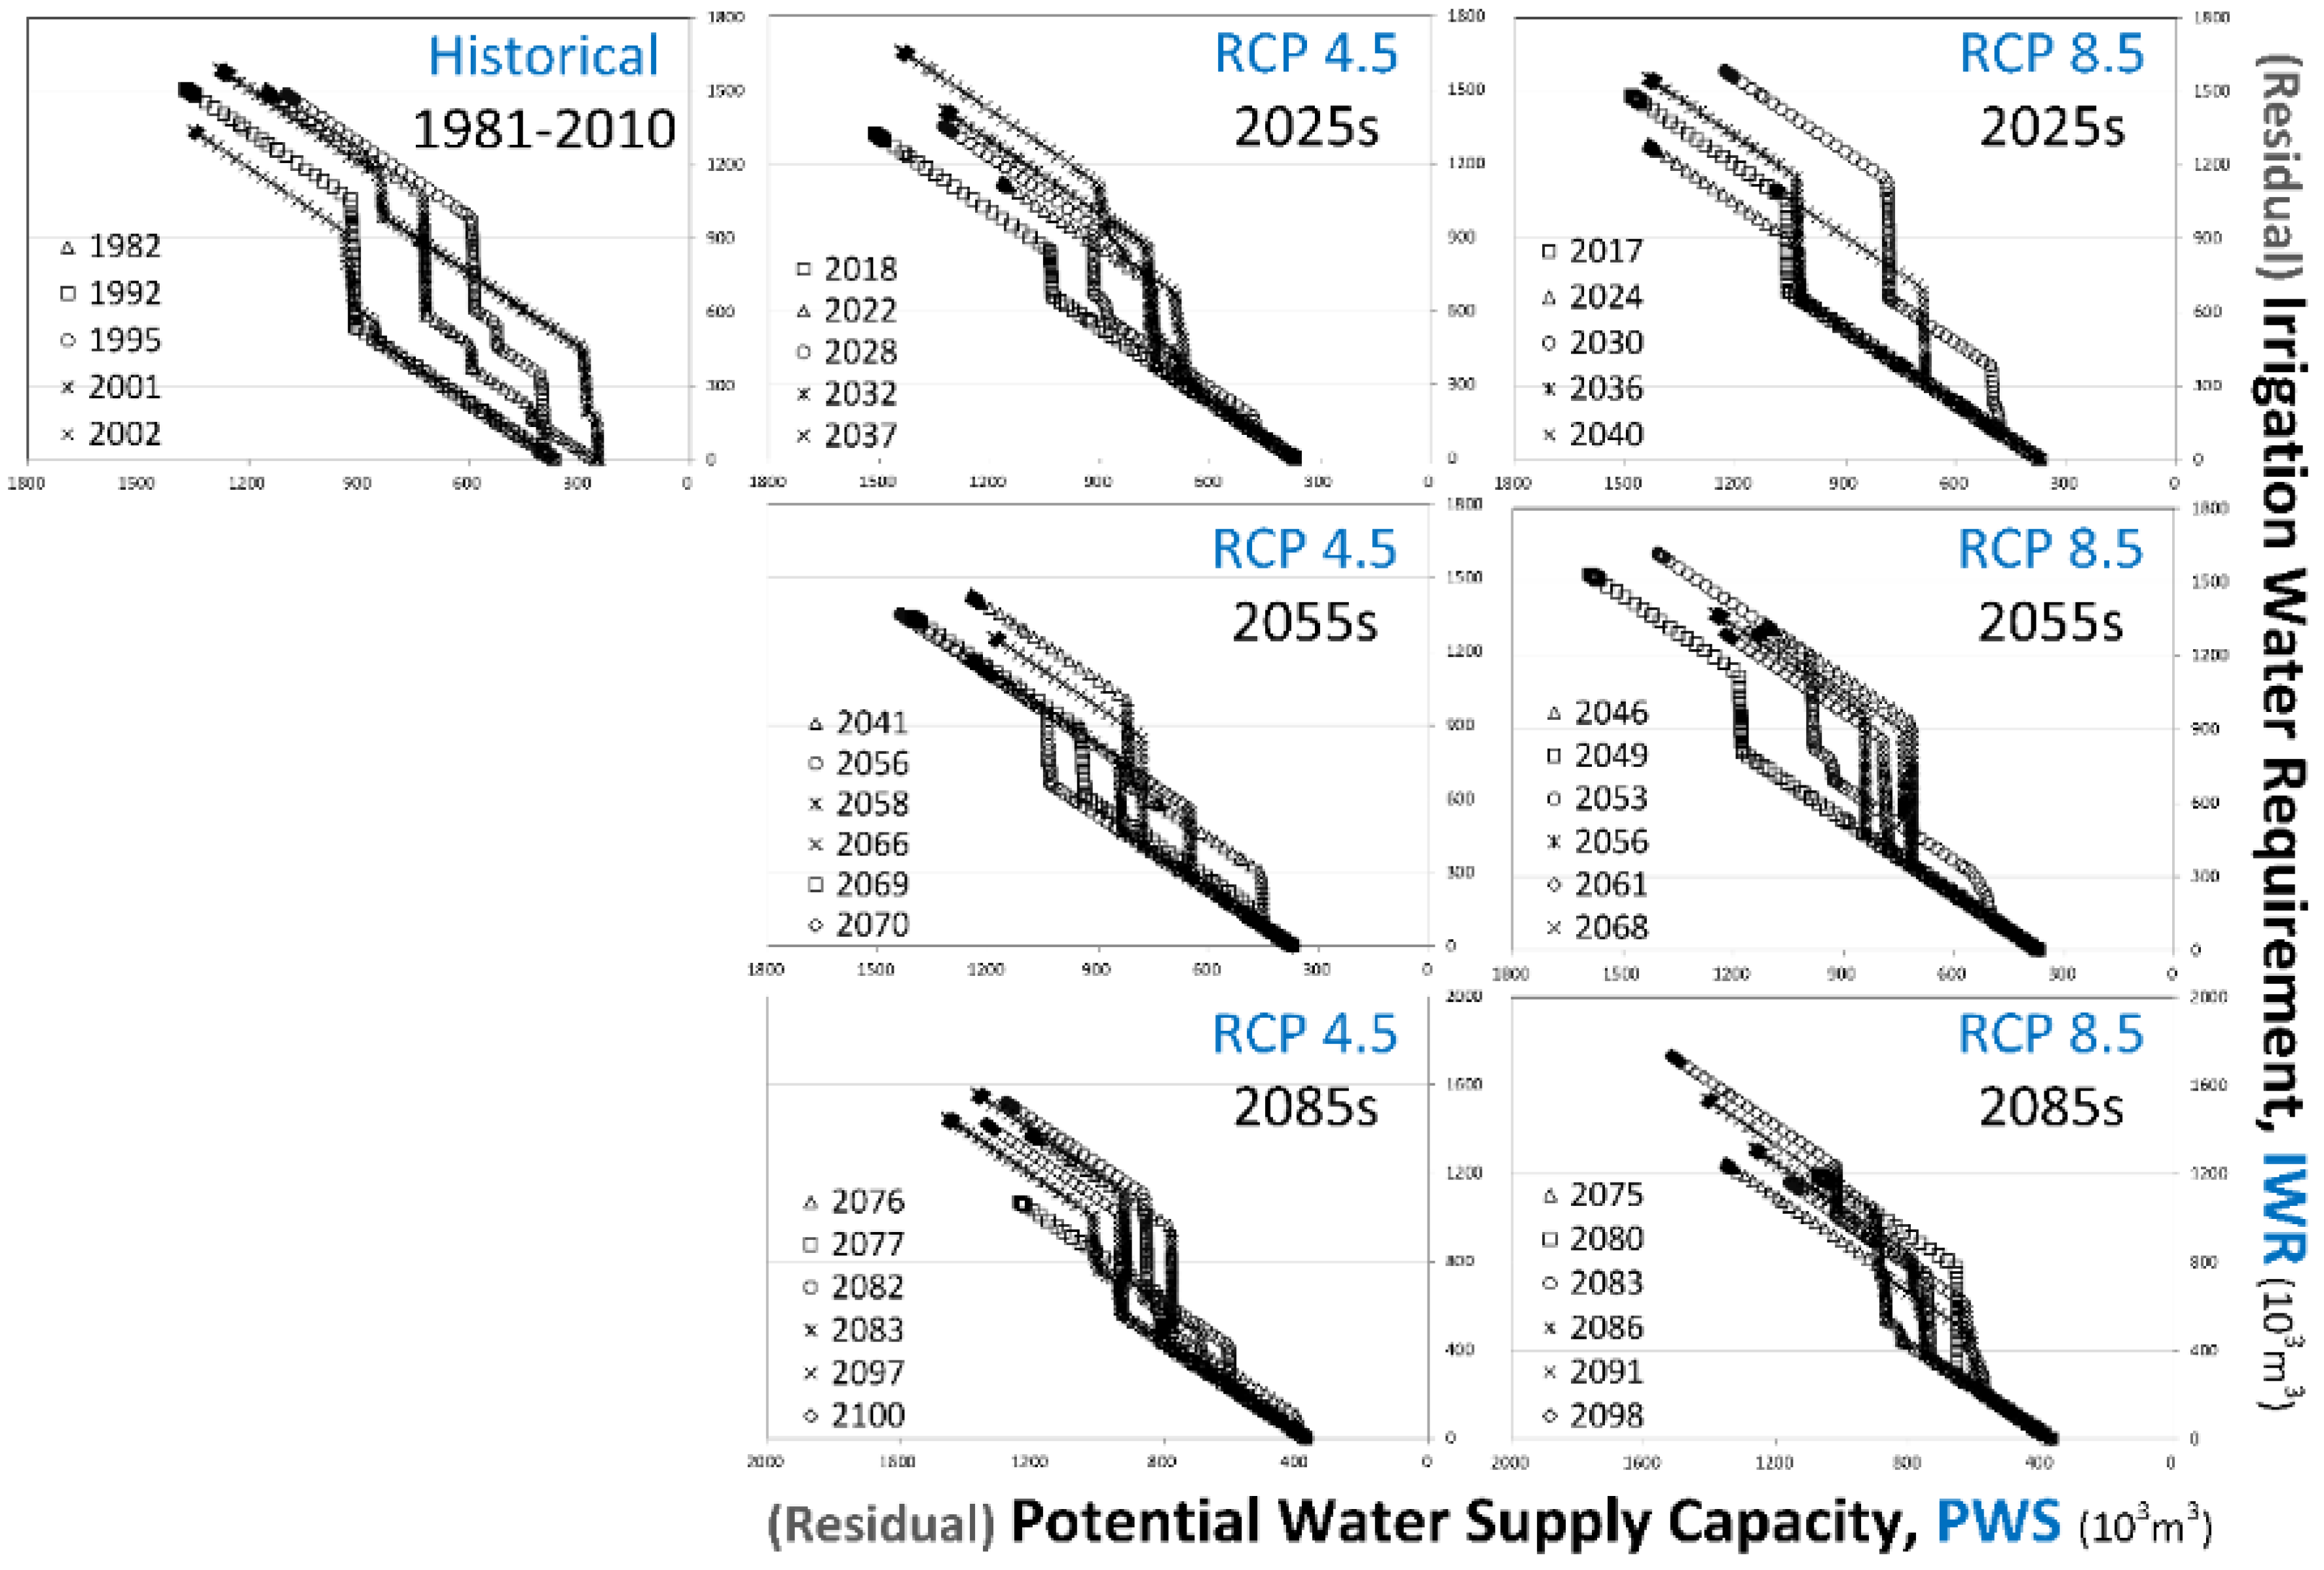
3.3. Assessment of the Vulnerable Seasons of Paddy Irrigation
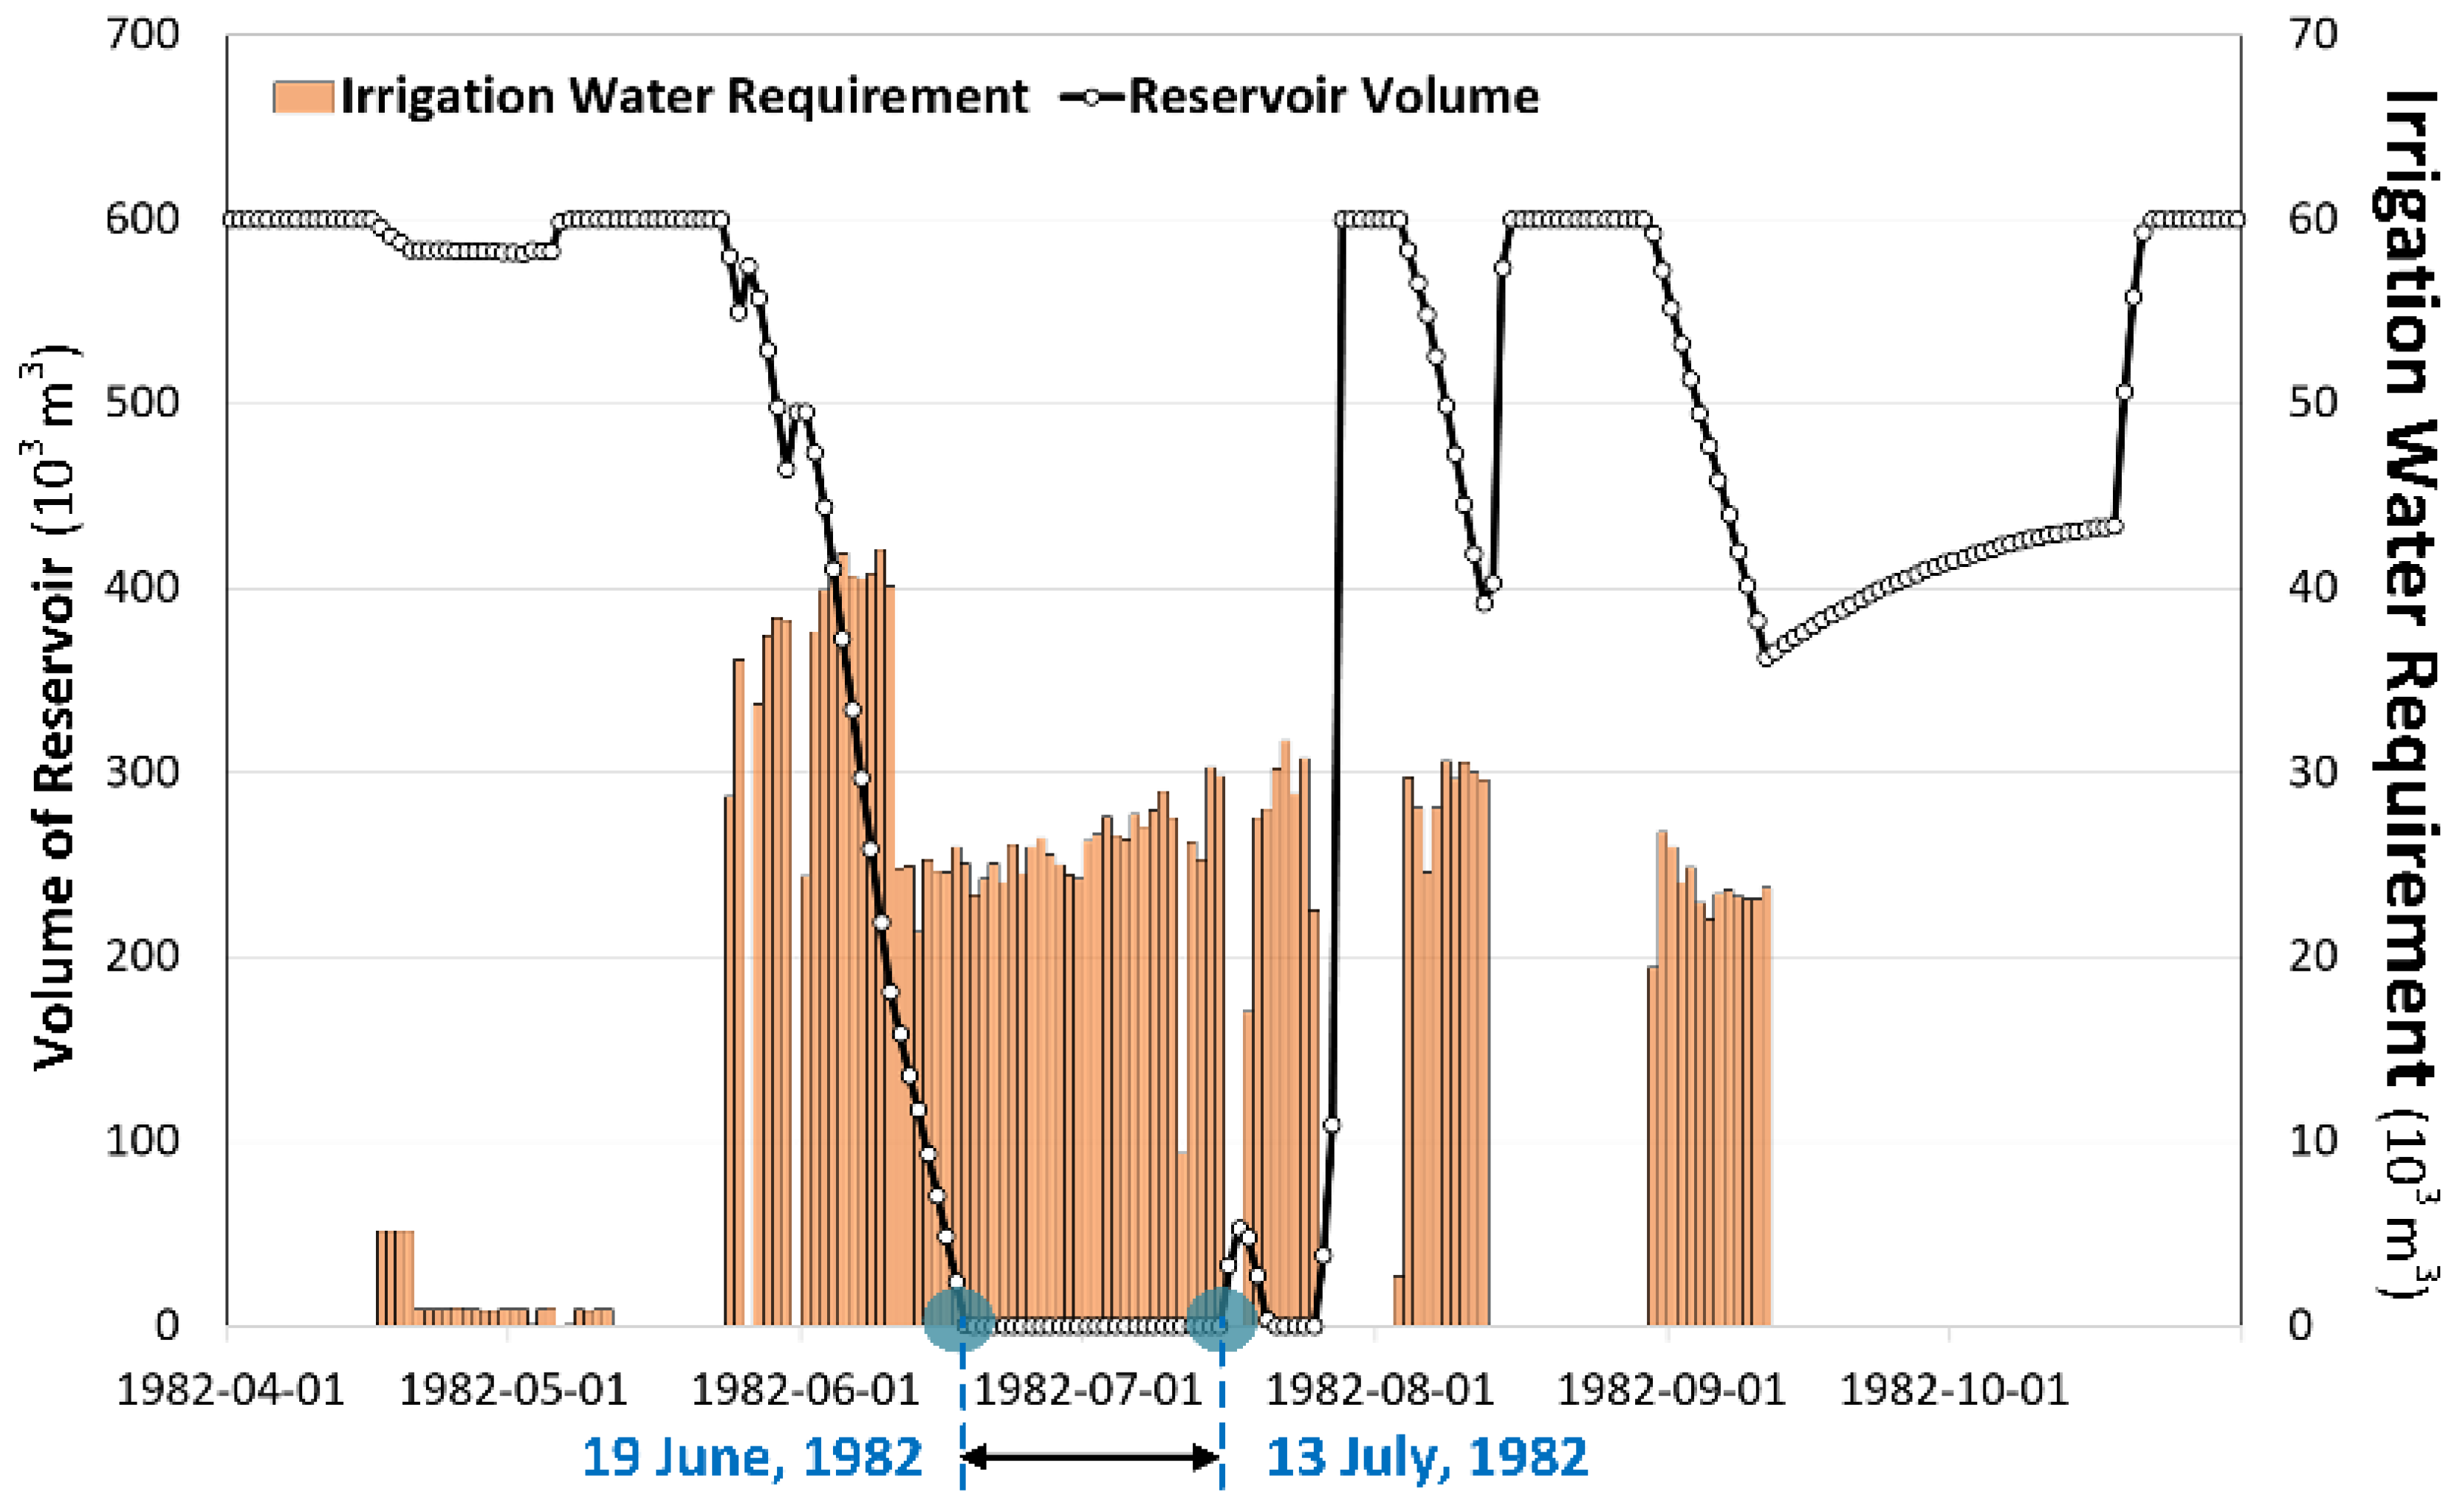
The patterns of change between the PWS and IWR were evaluated to the end of the irrigation period based on time flow. Figure 6, Figure 7, Figure 8 and Figure 9 illustrate the changes in distribution of the PWR and IWR for Res. A and Res. D, as determined for the drought year between the historical period and future period. The results for the other two reservoirs are not shown. Investigation of the historical drought conditions confirmed that severe/extreme droughts had occurred, mainly in the central and southern regions of South Korea in 1982–1983, 1994–1995, 2000–2002, and 2008–2009 [69,70]. The modeled future drought years are defined as the five years with the lowest cumulative precipitation of each future period: the 2025s, 2055s, and 2085s. The x-axis represents the PWS of the reservoir, and the y-axis represents the IWR of the irrigated area. Each point shows the values of the accumulated PWS and IWR from the beginning of an irrigation period (27 April) to the end of that irrigation period (30 September). The duration of irrigation water supply inadequacy caused by a lack of watershed inflow during drought years can be evaluated using a slope greater than 45°. The increase occurs because the objective values of the IWRs in irrigated districts were not supplied for this period, which caused the lack of PWS for the reservoirs, as shown in Figure 7. During these periods, a slope of more than 45° indicates a shortage of irrigation water from reservoir caused by insufficient precipitation and reduced inflow into the watershed. For example, the slope based on the changes in distribution of PWR and IWR increased rapidly between 19 June and 13 July 1982 (25 days) and between 5 June and 17 June 2001 (13 days) for Res. A, as shown in Figure 6 and Figure 7. The estimated vulnerable seasons for paddy irrigation adequately reproduced the historical drought events as either extremely dry or severely dry periods. The results for Res. D in other drought years also produced similar historical drought events, as expected. These results suggest that seasons of irrigation vulnerability of reservoirs are suitable drought evaluation criteria for application in South Korea.
Based on this approach, periods of sudden increases in slope were defined as vulnerable intervals for irrigation and were applied to each reservoir, including the drought years in the future periods. The changes in vulnerable seasons for different drought years were not uniform. However, for vulnerable seasons under both the RCP 4.5 and RCP 8.5 scenarios, the results showed periods of significant increases in which the slope decreased compared to the historical period. The key result here is that there is a notable increase in the trend of vulnerable seasons under the RCP 8.5 scenario compared to the RCP 4.5 scenario. Although there are differences in the vulnerable seasons of each period, the longest duration of vulnerability occurred during the 2085s under the RCP 8.5 scenario. These results can be applied in agricultural water management to more effectively manage reservoir operation during irrigation periods with climate changes.
3.4. Shifts of Vulnerable Irrigation Seasons under Climate Change
When considering the future, it is of particular importance to analyze changes in the total duration and duration shifts of the vulnerable irrigation seasons because these changes may have major effects on agricultural water and reservoir management. The first parameter evaluated was the total duration of the vulnerable irrigation seasons, and the overall sum of the periods in which the slope decreases was determined. Table 8 shows the changes in the total duration of the vulnerable irrigation seasons during drought years in the recent historical period (1981–2010) and the three 30-year periods, the 2025s, 2055s and 2085s, under the RCP 4.5 and 8.5 scenarios. In the case of the vulnerable durations of Res. B, for example, the results showed a significant increase from 24 days in the historical period to 25 days (in the 2025s), to 27 days (2055s), and then 34 days (2085s) under the RCP 4.5, and from 26 days (in the 2025s), to 31 days (2055s), and then 37 days (2085s) under the RCP 8.5. Compared to the historical period, the average vulnerable duration for the four reservoirs increased by 20.7% (2085s in RCP 4.5), 27.6% (2055s in RCP 8.5) and 29.9% (2085s in RCP 8.5). Although the vulnerable duration decreased during the 2025s compared to the historical period, overall, the results of the average vulnerable duration continually increased toward the end of the 2085s for almost all reservoirs.
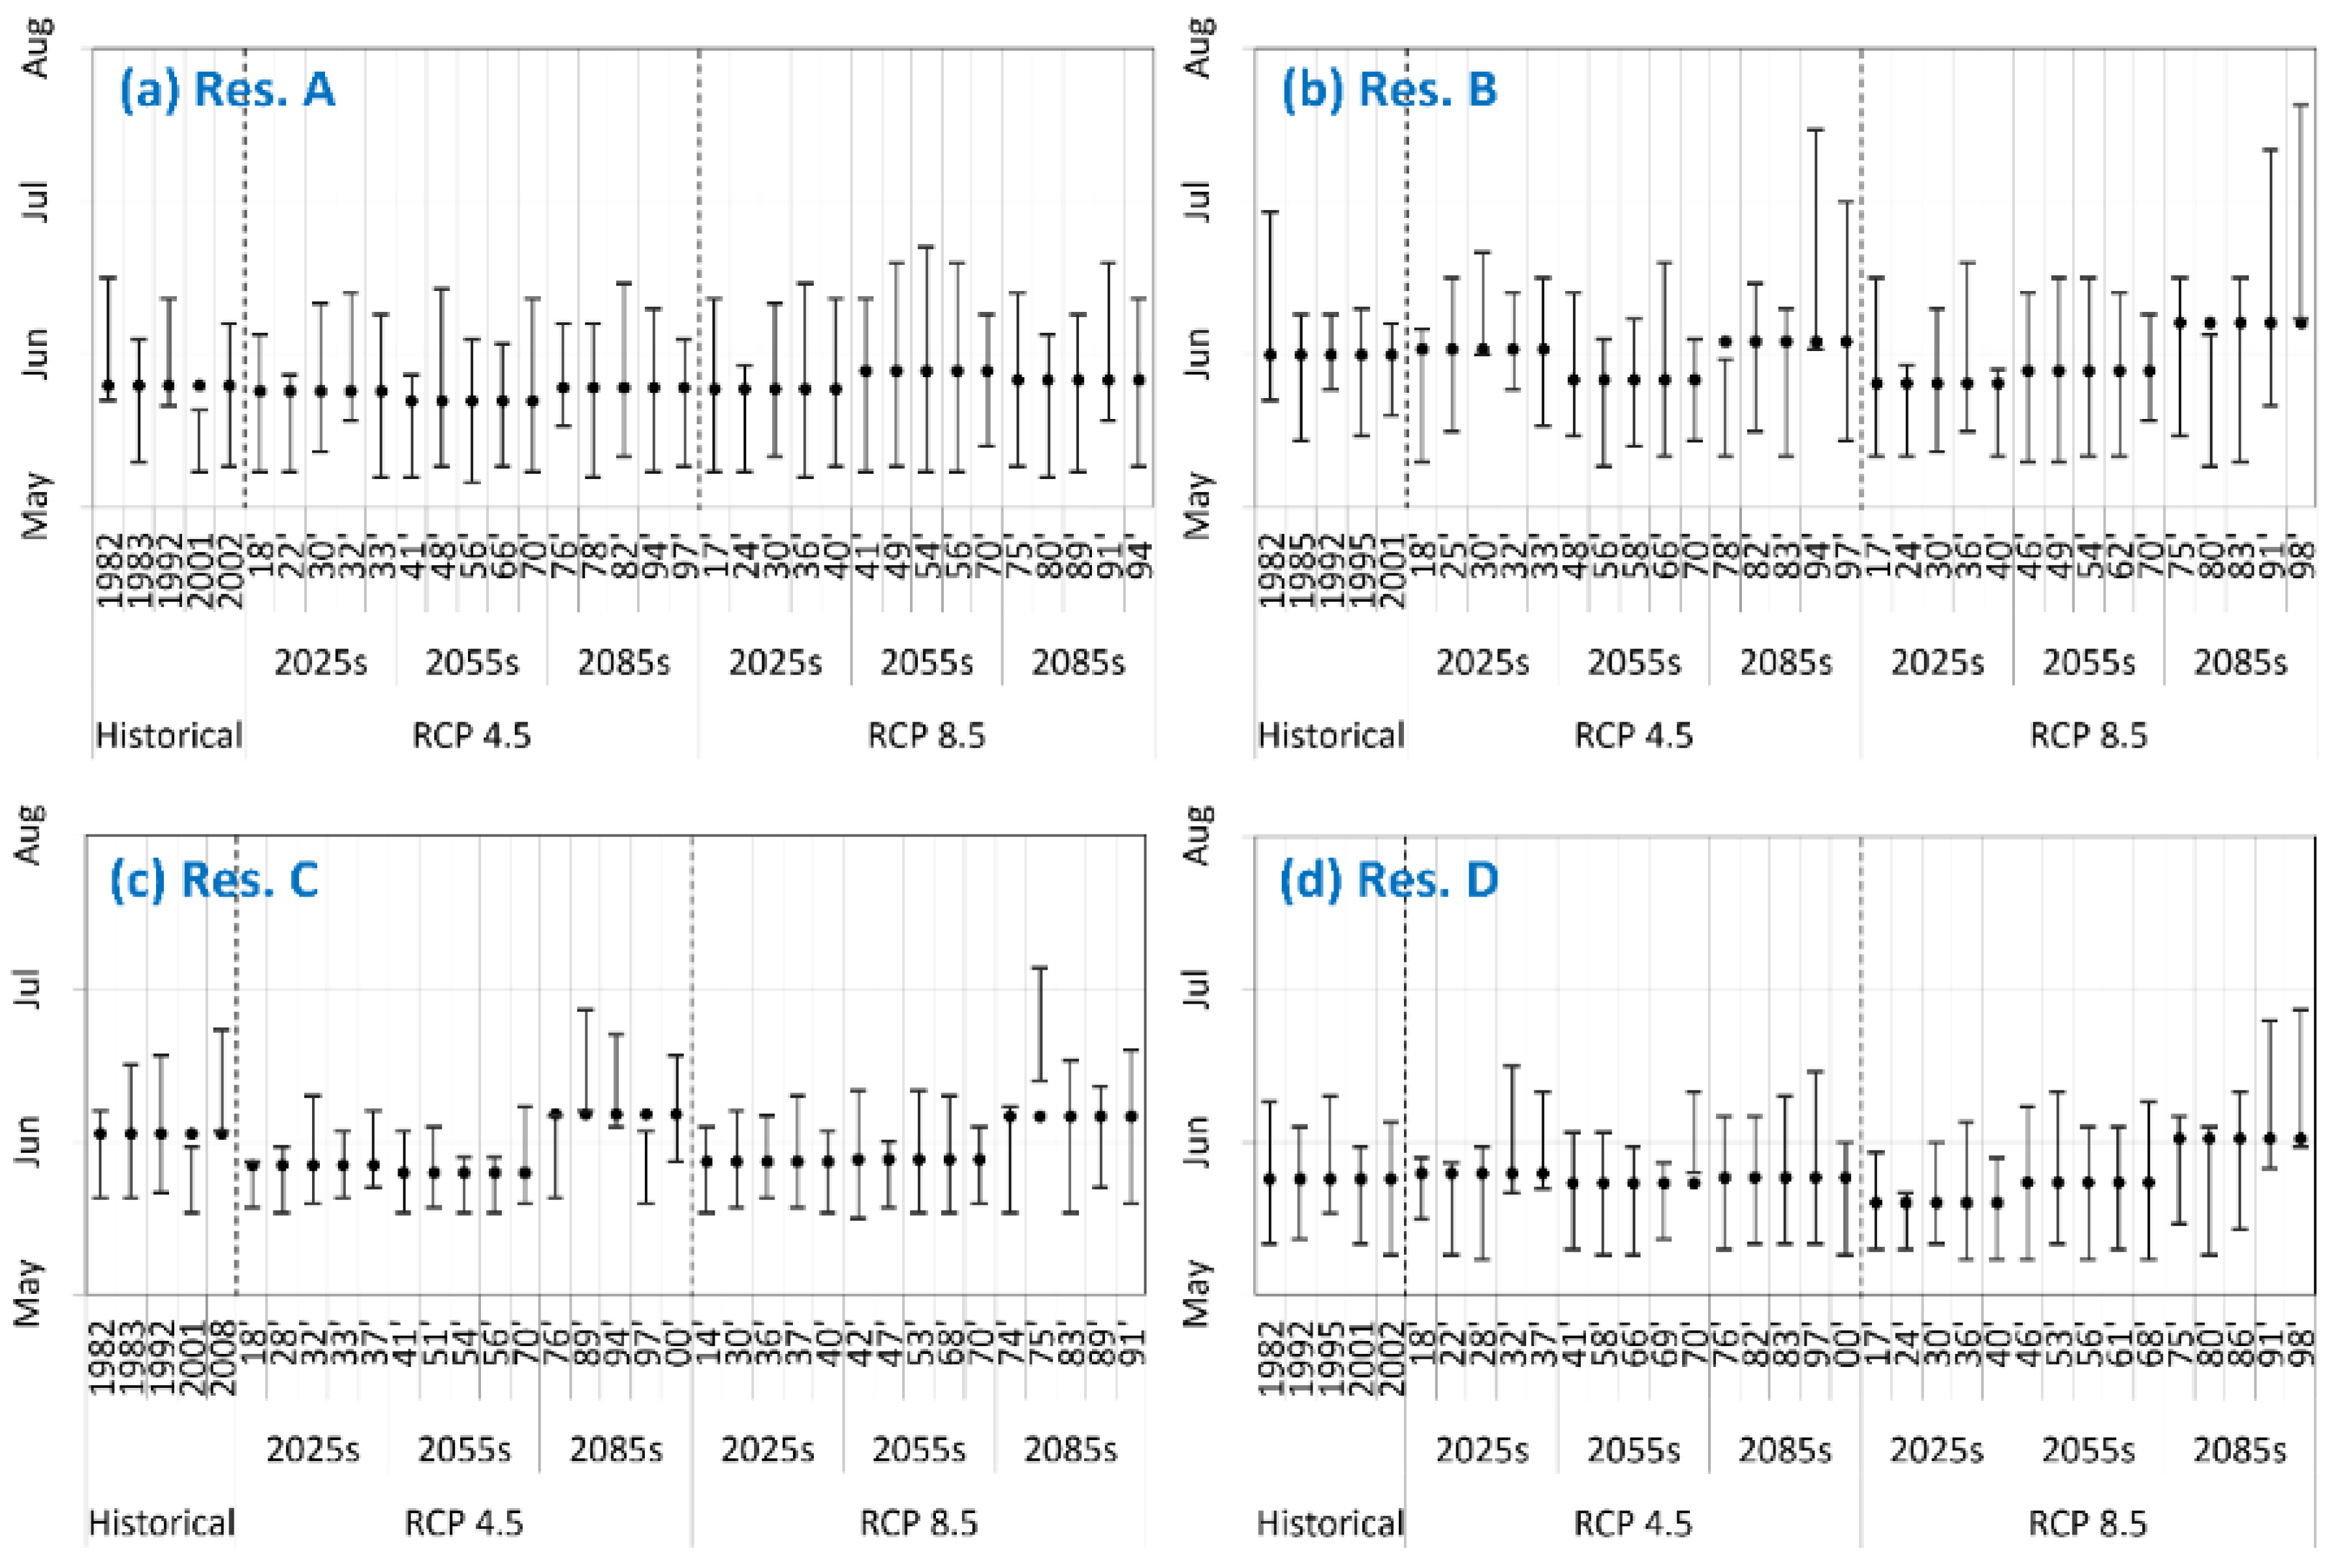
The results of the temporal changes in the predicted shifts in vulnerable irrigation seasons under climate scenarios are summarized in Figure 10. The x-axis represents drought years, and the y-axis represents the vulnerable seasons of paddy irrigation. Shifts in the vulnerable irrigation seasons are affected by increasing irrigation water requirements and closely correlated with climate change. For example, in the case of Res. A, the results show a significant increase in vulnerable periods toward the end of 2085s under both the RCP 4.5 and 8.5 scenarios. However, for the other three reservoirs, the vulnerable seasons are predicted to shift during the 2085s from the last ten days of May and the first ten days of June to the first ten days of June and the last ten days of July in Res. B, and from the last ten days of May and the first ten days of June to the first ten days of June and the last ten days of June in Res. C and Res. D. The most significant shifts were predicted to occur in the 2085s under both the RCP 4.5 and 8.5 scenarios.
4. Conclusions
Reservoirs play an important role in water resource management in South Korea, but traditional reservoir operation is managed using only observed meteorological data and historical reservoir water levels. Effective management of reservoirs and optimal irrigation scheduling can be achieved by evaluating the vulnerability of water supply and demand and by applying methods to assess irrigation vulnerability assessment that account for the uncertainty of seasonal variations in precipitation, stream flow and irrigation water requirements. The durations of irrigation water shortages must be specified for periods of scheduled irrigation in a reservoir-irrigation system to determine optimal irrigation management.
We propose an alternative approach that can be used to manage reservoir operation effectively, as well as a concept for defining the vulnerable seasons for paddy irrigation based on the interactive relationship between the distribution of the water supply in reservoir and the demand of an irrigation district. The assessment of vulnerable seasons for paddy irrigation is based on the water balance modeling of water supply and demand, and calculation of the availability of agricultural water resources. With this approach, irrigation vulnerability can be assessed using a distribution analysis of the accumulation volume of the potential water supply and the irrigation water requirements, as well as with a change time-series analysis of the potential irrigation capacity volume in reservoirs. Our primary objective was to identify the vulnerable irrigation seasons to provide relevant guidelines and coordinate decisions about reservoir operation and management to improve the effectiveness of irrigation scheduling, even though irrigation districts have different characteristics such as paddy field properties and the size of irrigation reservoirs.
The irrigation vulnerability assessment approach developed in this study will help decision makers understand the characteristics of water supply and demand that determine irrigation vulnerability duration during irrigation periods. Knowing the vulnerable seasons of paddy irrigation can assist decision makers in developing and implementing plans to improve agricultural water management through more timely, effective and efficient assessment and response activities. Information about the vulnerable seasons of paddy irrigation can be used for effective and intensive water management that takes into consideration irrigation vulnerability associated with climate change, which further helps improve decision making and supports policymaking for agricultural water management.
Acknowledgments
This research was supported by Korea Institute of Planning and Evaluation for Technology in Food, Agriculture, Forestry and Fisheries (IPET) through Advanced Production Technology Development Program, funded by Ministry of Agriculture, Food and Rural Affairs (MAFRA) (316022-03-1-HD040). The views expressed in this paper are those of the authors and do not necessarily reflect the views of IPET and MAFRA or any of its sub-agencies. Finally, the authors would like to thank the editor, and anonymous reviewers who took the time to review and provide guidance on this paper.
Author Contributions
Won-Ho Nam conceived and developed the model components, performed data collection/model, and prepared the manuscript. Taegon Kim and Eun-Mi Hong contributed to the results and discussion; edited the manuscript and recommended several amendments ultimately leading to the final version. Jin-Yong Choi advised on the work and critically reviewed the paper. The final manuscript has been approved by all authors.
Conflicts of Interest
The authors declare no conflict of interest.
References
- Intergovernmental Panel on Climate Change (IPCC). Working group I contribution to the fifth assessment report of the Intergovernmental Panel on Climate Change. In Climate Change 2013: The Physical Science Basis; Stocker, T.F., Qin, D., Plattner, G.-K., Tignor, M., Allen, S.K., Boschung, J., Nauels, A., Xia, Y., Bex, V., Midgley, P.M., Eds.; Cambridge University Press: Cambridge, UK; New York, NY, USA, 2013. [Google Scholar]
- Trenberth, K.E.; Dai, A.; Rasmussen, R.M.; Parsons, D.B. The changing character of precipitation. Bull. Am. Meteorol. Soc. 2003, 84, 1205–1217. [Google Scholar] [CrossRef]
- Doll, P. Impact of climate change and variability on irrigation requirements: A global perspective. Clim. Chang. 2002, 54, 269–293. [Google Scholar] [CrossRef]
- Wada, Y.; Wisser, D.; Eisner, S.; Florke, M.; Gerten, D.; Haddeland, I.; Hanasaki, N.; Masaki, Y.; Portmann, F.T.; Stacke, T.; et al. Multimodel projections and uncertainties of irrigation water demand under climate change. Geophys. Res. Lett. 2013, 40, 4626–4632. [Google Scholar] [CrossRef]
- Brumbelow, K.; Georgakakos, A. Consideration of climate variability and change in agricultural water resources planning. J. Water Resour. Plan. Manag. 2007, 133, 275–285. [Google Scholar] [CrossRef]
- Minville, M.; Brissette, F.; Leconte, R. Impacts and uncertainty of climate change on water resource management of the Peribonka river system (Canada). J. Water Resour. Plan. Manag. 2010, 136, 376–385. [Google Scholar] [CrossRef]
- Shahid, S. Impact of climate change on irrigation water demand of dry season Boro rice in northwest Bangladesh. Clim. Chang. 2011, 105, 433–453. [Google Scholar] [CrossRef]
- Karamouz, M.; Ahmadi, B.; Zahmatkesh, Z. Developing an agricultural planning model in a watershed considering climate change impacts. J. Water Resour. Plan. Manag. 2013, 139, 349–363. [Google Scholar] [CrossRef]
- Feng, S.; Hu, Q.; Huang, W.; Ho, C.H.; Li, R.; Tang, Z. Projected climate regime shift under future global warming from multi-model, multi-scenario CMIP5 simulations. Glob. Planet. Chang. 2014, 112, 41–52. [Google Scholar] [CrossRef]
- Mainuddin, M.; Kirby, M.; Chowdhury, R.A.R.; Shah-Newaz, S.M. Spatial and temporal variations of, and the impact of climate change on, the dry season crop irrigation requirements in Bangladesh. Irrig. Sci. 2015, 33, 107–120. [Google Scholar] [CrossRef]
- Johannsen, I.M.; Hengst, J.C.; Goll, A.; Hollermann, B.; Diekkruger, B. Future of water supply and demand in the middle Draa Valley, Morocco, under climate and land use change. Water 2016, 8, 313. [Google Scholar] [CrossRef]
- Goraniwar, S.D.; Smout, I.K. Multilevel approach for optimizing land and water resources and irrigation deliveries for tertiary units in large irrigation schemes. II: Application. J. Irrig. Drain. Eng. 2005, 131, 264–272. [Google Scholar] [CrossRef]
- Yoshinaga, I.; Miura, A.; Hitomi, T.; Hamada, K.; Shiratani, E. Runoff nitrogen from a large sized paddy field during a crop period. Agric. Water Manag. 2007, 87, 217–222. [Google Scholar] [CrossRef]
- Georgiou, P.E.; Papamichail, D.M. Optimization model of an irrigation reservoir for water allocation and crop planning under various weather conditions. Irrig. Sci. 2008, 26, 487–504. [Google Scholar] [CrossRef]
- Montoro, A.; Lopez-Fuster, P.; Fereres, E. Improving on-farm water management through an irrigation scheduling service. Irrig. Sci. 2011, 29, 311–319. [Google Scholar] [CrossRef]
- Kaur, S.; Srivastava, D.K.; Arya, D.S. Improved planning model for canal scheduling of rotational irrigation. J. Irrig. Drain. Eng. 2013, 139, 560–570. [Google Scholar] [CrossRef]
- Ji, Y.; Lei, X.; Cai, S.; Wang, X. Hedging rules for water supply reservoir based on the model of simulation and optimization. Water 2016, 8, 249. [Google Scholar] [CrossRef]
- Maidment, D.R.; Hutchinson, P.D. Modeling water demands of irrigation projects. J. Irrig. Drain. Eng. 1983, 109, 405–418. [Google Scholar] [CrossRef]
- Reddy, M.J.; Kumar, D.N. Evolving strategies for crop planning and operation of irrigation reservoir system using multi-objective differential evolution. Irrig. Sci. 2008, 26, 177–190. [Google Scholar] [CrossRef]
- Wu, Y.; Chen, J. Estimating irrigation water demand using an improved method and optimizing reservoir operation for water supply and hydropower generation: A case study of the Xinfengjiang reservoir in southern China. Agric. Water Manag. 2013, 116, 110–121. [Google Scholar] [CrossRef]
- Xu, B.; Zhong, P.A.; Huang, Q.; Wang, J.; Yu, Z.; Zhang, J. Optimal hedging rules for water supply reservoir operations under forecast uncertainty and conditional value-at-risk criterion. Water 2017, 9, 568. [Google Scholar] [CrossRef]
- Panigrahi, B.; Panda, S.N.; Mull, R. Simulation of water harvesting potential in rainfed ricelands using water balance model. Agric. Syst. 2001, 69, 165–182. [Google Scholar] [CrossRef]
- Goraniwar, S.D.; Smout, I.K. Allocation of scarce water resources using deficit irrigation in rotational systems. J. Irrig. Drain. Eng. 2003, 129, 155–163. [Google Scholar] [CrossRef]
- Khan, N.M.; Tingsanchali, T. Optimization and simulation of reservoir operation with sediment evacuation: A case study of the Tarbela Dam, Pakistan. Hydrol. Process. 2009, 23, 730–747. [Google Scholar] [CrossRef]
- Moradi-Jalal, M.; Haddad, O.B.; Karney, B.W.; Marino, M.A. Reservoir operation in assigning optimal multi-crop irrigation areas. Agric. Water Manag. 2007, 90, 149–159. [Google Scholar] [CrossRef]
- Zhang, Q.; Maeda, S.; Kawachi, T. Stochastic multiobjective optimization model for allocating irrigation water to paddy fields. Paddy Water Environ. 2007, 5, 93–99. [Google Scholar] [CrossRef]
- De Nys, E.; Le Gal, P.Y.; Raes, D.; Ana, E. WaDI (Water Delivery for Irrigation): A simulation tool to address strategic interaction of water demand and supply in irrigation schemes. Agric. Water Manag. 2008, 95, 224–232. [Google Scholar] [CrossRef]
- Lowe, L.D.; Webb, J.A.; Nathan, R.J.; Etchells, T.; Malano, H.M. Evaporation from water supply reservoirs: An assessment of uncertainty. J. Hydrol. 2009, 376, 261–274. [Google Scholar] [CrossRef]
- Meza, F.J.; Wilks, D.S.; Gurovich, L.; Bambach, N. Impacts of climate change on irrigated agriculture in the Maipo basin, Chile: Reliability of water rights and changes in the demand for irrigation. J. Water Resour. Plan. Manag. 2012, 138, 421–430. [Google Scholar] [CrossRef]
- Ghahraman, B.; Sepaskhah, A.R. Optimal allocation of water from a single purpose reservoir to an irrigation project with pre-determined multiple cropping patterns. Irrig. Sci. 2002, 21, 127–137. [Google Scholar] [CrossRef]
- Mehta, V.K.; Haden, V.R.; Joyce, B.A.; Purkey, D.R.; Jackson, L.E. Irrigation demand and supply, given projections of climate and land-use change, in Yolo County, California. Agric. Water Manag. 2013, 117, 70–82. [Google Scholar] [CrossRef]
- Goharian, E.; Burian, S.J.; Bardsley, T.; Strong, C. Incorporating potential severity into vulnerability assessment of water supply systems under climate change conditions. J. Water Resour. Plan. Manag. 2016, 142, 04015051. [Google Scholar] [CrossRef]
- Nam, W.H.; Hong, E.M.; Choi, J.Y. Has climate change already affected the spatial distribution and temporal trends of reference evapotranspiration in South Korea? Agric. Water Manag. 2015, 150, 129–138. [Google Scholar] [CrossRef]
- Nam, W.H.; Choi, J.Y. Development of an irrigation vulnerability assessment model in agricultural reservoirs utilizing probability theory and reliability analysis. Agric. Water Manag. 2014, 142, 115–126. [Google Scholar] [CrossRef]
- Hong, E.M.; Choi, J.Y.; Nam, W.H.; Kim, J.T. Decision support system for the real-time operation and management of an agricultural water supply. Irrig. Drain. 2016, 65, 197–209. [Google Scholar] [CrossRef]
- Borgia, C.; Garcia-Bolanos, M.; Mateos, L. Patterns of variability in large-scale irrigation schemes in Mauritania. Agric. Water Manag. 2012, 112, 1–12. [Google Scholar] [CrossRef]
- Su, M.D.; Lin, M.C.; Lin, C.H.; Wang, S.F.; Wen, T.H.; Hsieh, H.I. A spatial aggregation index for effective fallow decision in paddy irrigation demand planning. Paddy Water Environ. 2012, 10, 31–39. [Google Scholar] [CrossRef]
- Hong, E.M.; Nam, W.H.; Choi, J.Y.; Pachepsky, Y.A. Projected irrigation requirements for upland crops using soil moisture model under climate change in South Korea. Agric. Water Manag. 2016, 165, 163–180. [Google Scholar] [CrossRef]
- Nguyen, T.T.; Hoang, V.N.; Seo, B. Cost and environmental efficiency of rice farms in South Korea. Agric. Econ. 2012, 43, 367–376. [Google Scholar]
- Lee, T.; Jeong, C. Nonparametric statistical temporal downscaling of daily precipitation to hourly precipitation and implications for climate change scenarios. J. Hydrol. 2014, 510, 182–196. [Google Scholar] [CrossRef]
- Daly, C.; Halbleib, M.; Smith, J.I.; Gibson, W.P.; Doggett, M.K.; Taylor, G.H.; Curtis, J.; Pasteris, P.P. Physiographically sensitive mapping of climatological temperature and precipitation across the conterminous United States. Int. J. Climatol. 2008, 28, 2031–2064. [Google Scholar] [CrossRef]
- Seo, Y.A.; Lee, Y.; Park, J.S.; Kim, M.K.; Cho, C.H.; Baek, H.J. Assessing changes in observed and future projected precipitation extremes in South Korea. Int. J. Climatol. 2015, 35, 1069–1078. [Google Scholar] [CrossRef]
- Ahn, J.B.; Jo, S.; Suh, M.S.; Cha, D.H.; Lee, D.K.; Hong, S.Y.; Min, S.K.; Park, S.C.; Kang, H.S.; Shim, K.M. Changes of precipitation extremes over South Korea projected by the 5 RCMs under RCP scenarios. Asia-Pac. J. Atmos. Sci. 2016, 52, 223–236. [Google Scholar] [CrossRef]
- Kite, G. Use of time series analysis to detect climatic change. J. Hydrol. 1989, 111, 259–279. [Google Scholar] [CrossRef]
- Mudelsee, M. Climate time series analysis. In Classical Statistical and Bootstrap Methods; Springer: Dordrecht, The Netherlands, 2010. [Google Scholar]
- De Hamer, W.; Love, D.; Owen, R.; Booij, M.J.; Hoekstra, A.Y. Potential water supply of a small reservoir and alluvial aquifer system in southern Zimbabwe. Phys. Chem. Earth 2008, 33, 633–639. [Google Scholar] [CrossRef]
- Chukalla, A.D.; Haile, A.M.; Schultz, B. Optimum irrigation and pond operation to move away from exclusively rainfed agriculture: The Boru Dodota Spate Irrigation Scheme, Ethiopia. Irrig. Sci. 2013, 31, 1091–1102. [Google Scholar] [CrossRef]
- Nam, W.H. Sustainability and Operations Evaluation of Agricultural Reservoirs Based on Probability Theory. Ph.D. Thesis, Seoul National University, Korea, 2013. (In Korean). [Google Scholar]
- Ashofteh, P.S.; Haddad, O.B.; Marino, M.A. Climate change impact on reservoir performance indexes in agricultural water supply. J. Irrig. Drain. Eng. 2013, 139, 85–97. [Google Scholar] [CrossRef]
- Baek, C.W.; Coles, N.A. An artificial catchment rainfall-runoff collecting system: Design efficiency and reliability potential considering climate change in Western Australia. Agric. Water Manag. 2013, 121, 124–134. [Google Scholar] [CrossRef]
- Sugawara, M. Automatic calibration of the tank model. Hydrol. Sci. Bull. 1979, 24, 375–388. [Google Scholar] [CrossRef]
- Lee, Y.H.; Singh, V.P. Tank model using kalman filter. J. Hydrol. Eng. 1999, 4, 344–349. [Google Scholar] [CrossRef]
- Song, J.H.; Kang, M.S.; Song, I.; Jun, S.M. Water balance in irrigation reservoirs considering flood control and irrigation efficiency variation. J. Irrig. Drain Eng. 2016, 142, 04016003. [Google Scholar] [CrossRef]
- Ministry of Agriculture and Forestry (MAF). Design Standard of Agricultural Improvement Project: Irrigation; Ministry of Agriculture and Forestry: Seoul, Korea, 1998. (In Korean)
- Veihmeyer, F.J. Evapotranspiration. In Handbook of Applied Hydrology; Chow, V.T., Ed.; McGraw-Hill: New York, NY, USA, 1964. [Google Scholar]
- Dick, R.M. Timeliness of irrigation. Irrig. Drain. Syst. 1995, 9, 371–387. [Google Scholar] [CrossRef]
- Oad, R.; Sampath, R.K. Performance measure for improving irrigation management. Irrig. Drain. Syst. 1995, 9, 357–370. [Google Scholar] [CrossRef]
- Smout, I.K.; Goraniwar, S.D. Multilevel approach for optimizing land and water resources and irrigation deliveries for tertiary units in large irrigation schemes. I: Method. J. Irrig. Drain. Eng. 2005, 131, 254–263. [Google Scholar] [CrossRef]
- Boldt, A.L.; Eisenhauer, D.E.; Martin, D.L.; Wilmes, G.J. Water conservation practices for a river valley irrigated with groundwater. Agric. Water Manag. 1999, 38, 235–256. [Google Scholar] [CrossRef]
- De Silva, C.S.; Weatherhead, E.K.; Knox, J.W.; Rodriguez-Diaz, J.A. Predicting the impacts of climate change—A case study of paddy irrigation water requirements in Sri Lanka. Agric. Water Manag. 2007, 93, 19–29. [Google Scholar] [CrossRef]
- Doorenbos, J.; Pruitt, W.O. Guidelines for Predicting Crop Water Requirements; FAO Irrigation and Drainage, Paper No. 24; Food and Agriculture Organization of the United Nations, Water Resources and Development Service: Rome, Italy, 1977. [Google Scholar]
- Jensen, M.E.; Burman, R.D.; Allen, R.G. Evapotranspiration and irrigation water requirement. In ASCE Manual No. 70; ASCE: New York, NY, USA, 1990. [Google Scholar]
- Doorenbos, J.; Kassam, A.H. Yield Response to Water; FAO Irrigation and Drainage, Paper No. 33; Food and Agriculture Organization of the United Nations, Water Resources and Development Service: Rome, Italy, 1986. [Google Scholar]
- Maruyama, T.; Tanji, K.K. Soil physical properties in relationship to drainage. In Physical and Chemical Processes of Soil Related to Paddy Drainage; Maruyama, T., Tanji, K.K., Eds.; Shinzansha Sci. & Tech.: Tokyo, Japan, 1997. [Google Scholar]
- Kim, S.J.; Park, G.A.; Kwon, H.J. Evaluation of paddy water storage dynamics during flood period in South Korea. KSCE J. Civil Eng. 2007, 11, 269–276. [Google Scholar] [CrossRef]
- Allen, R.G.; Pereira, L.S.; Raes, D.; Smith, M. Crop Evapotranspiration: Guidelines for Computing Crop Requirements—FAO Irrigation and Drainage, Paper No. 56; Food and Agriculture Organization of the United Nations, Water Resources and Development Service: Rome, Italy, 1998. [Google Scholar]
- Korea Water Resources Cooperation. Dam Design Manual; Korea Water Recourses Cooperation: Taejeon, Korea, 2004. (In Korean) [Google Scholar]
- Jang, M.W.; Choi, J.Y.; Lee, J.J. A spatial reasoning approach to estimating paddy rice water demand in Hwanghaenam-do, North Korea. Agric. Water Manag. 2007, 89, 185–198. [Google Scholar] [CrossRef]
- Nam, W.H.; Choi, J.Y.; Yoo, S.H.; Engel, B.A. A real-time online drought broadcast system for monitoring soil moisture index. KSCE J. Civ. Eng. 2012, 16, 357–365. [Google Scholar] [CrossRef]
- Nam, W.H.; Hayes, M.J.; Svoboda, M.D.; Tadesse, T.; Wilhite, D.A. Drought hazard assessment in the context of climate change for South Korea. Agric. Water Manag. 2015, 160, 106–117. [Google Scholar] [CrossRef]
Figure 1.
Locations of the meteorological stations and agricultural reservoirs used in this study.

Figure 2.
Schematic diagram of the assessment for vulnerable seasons of paddy irrigation.

Figure 3.
Elements of the water resources balance model for agricultural reservoirs [48].
Figure 3.
Elements of the water resources balance model for agricultural reservoirs [48].

Figure 4.
Definition of the potential water supply capacity and irrigation water requirement.

Figure 5.
Definition of the irrigation vulnerable seasons using the distribution of the potential water supply capacity and irrigation water requirement.
Figure 5.
Definition of the irrigation vulnerable seasons using the distribution of the potential water supply capacity and irrigation water requirement.
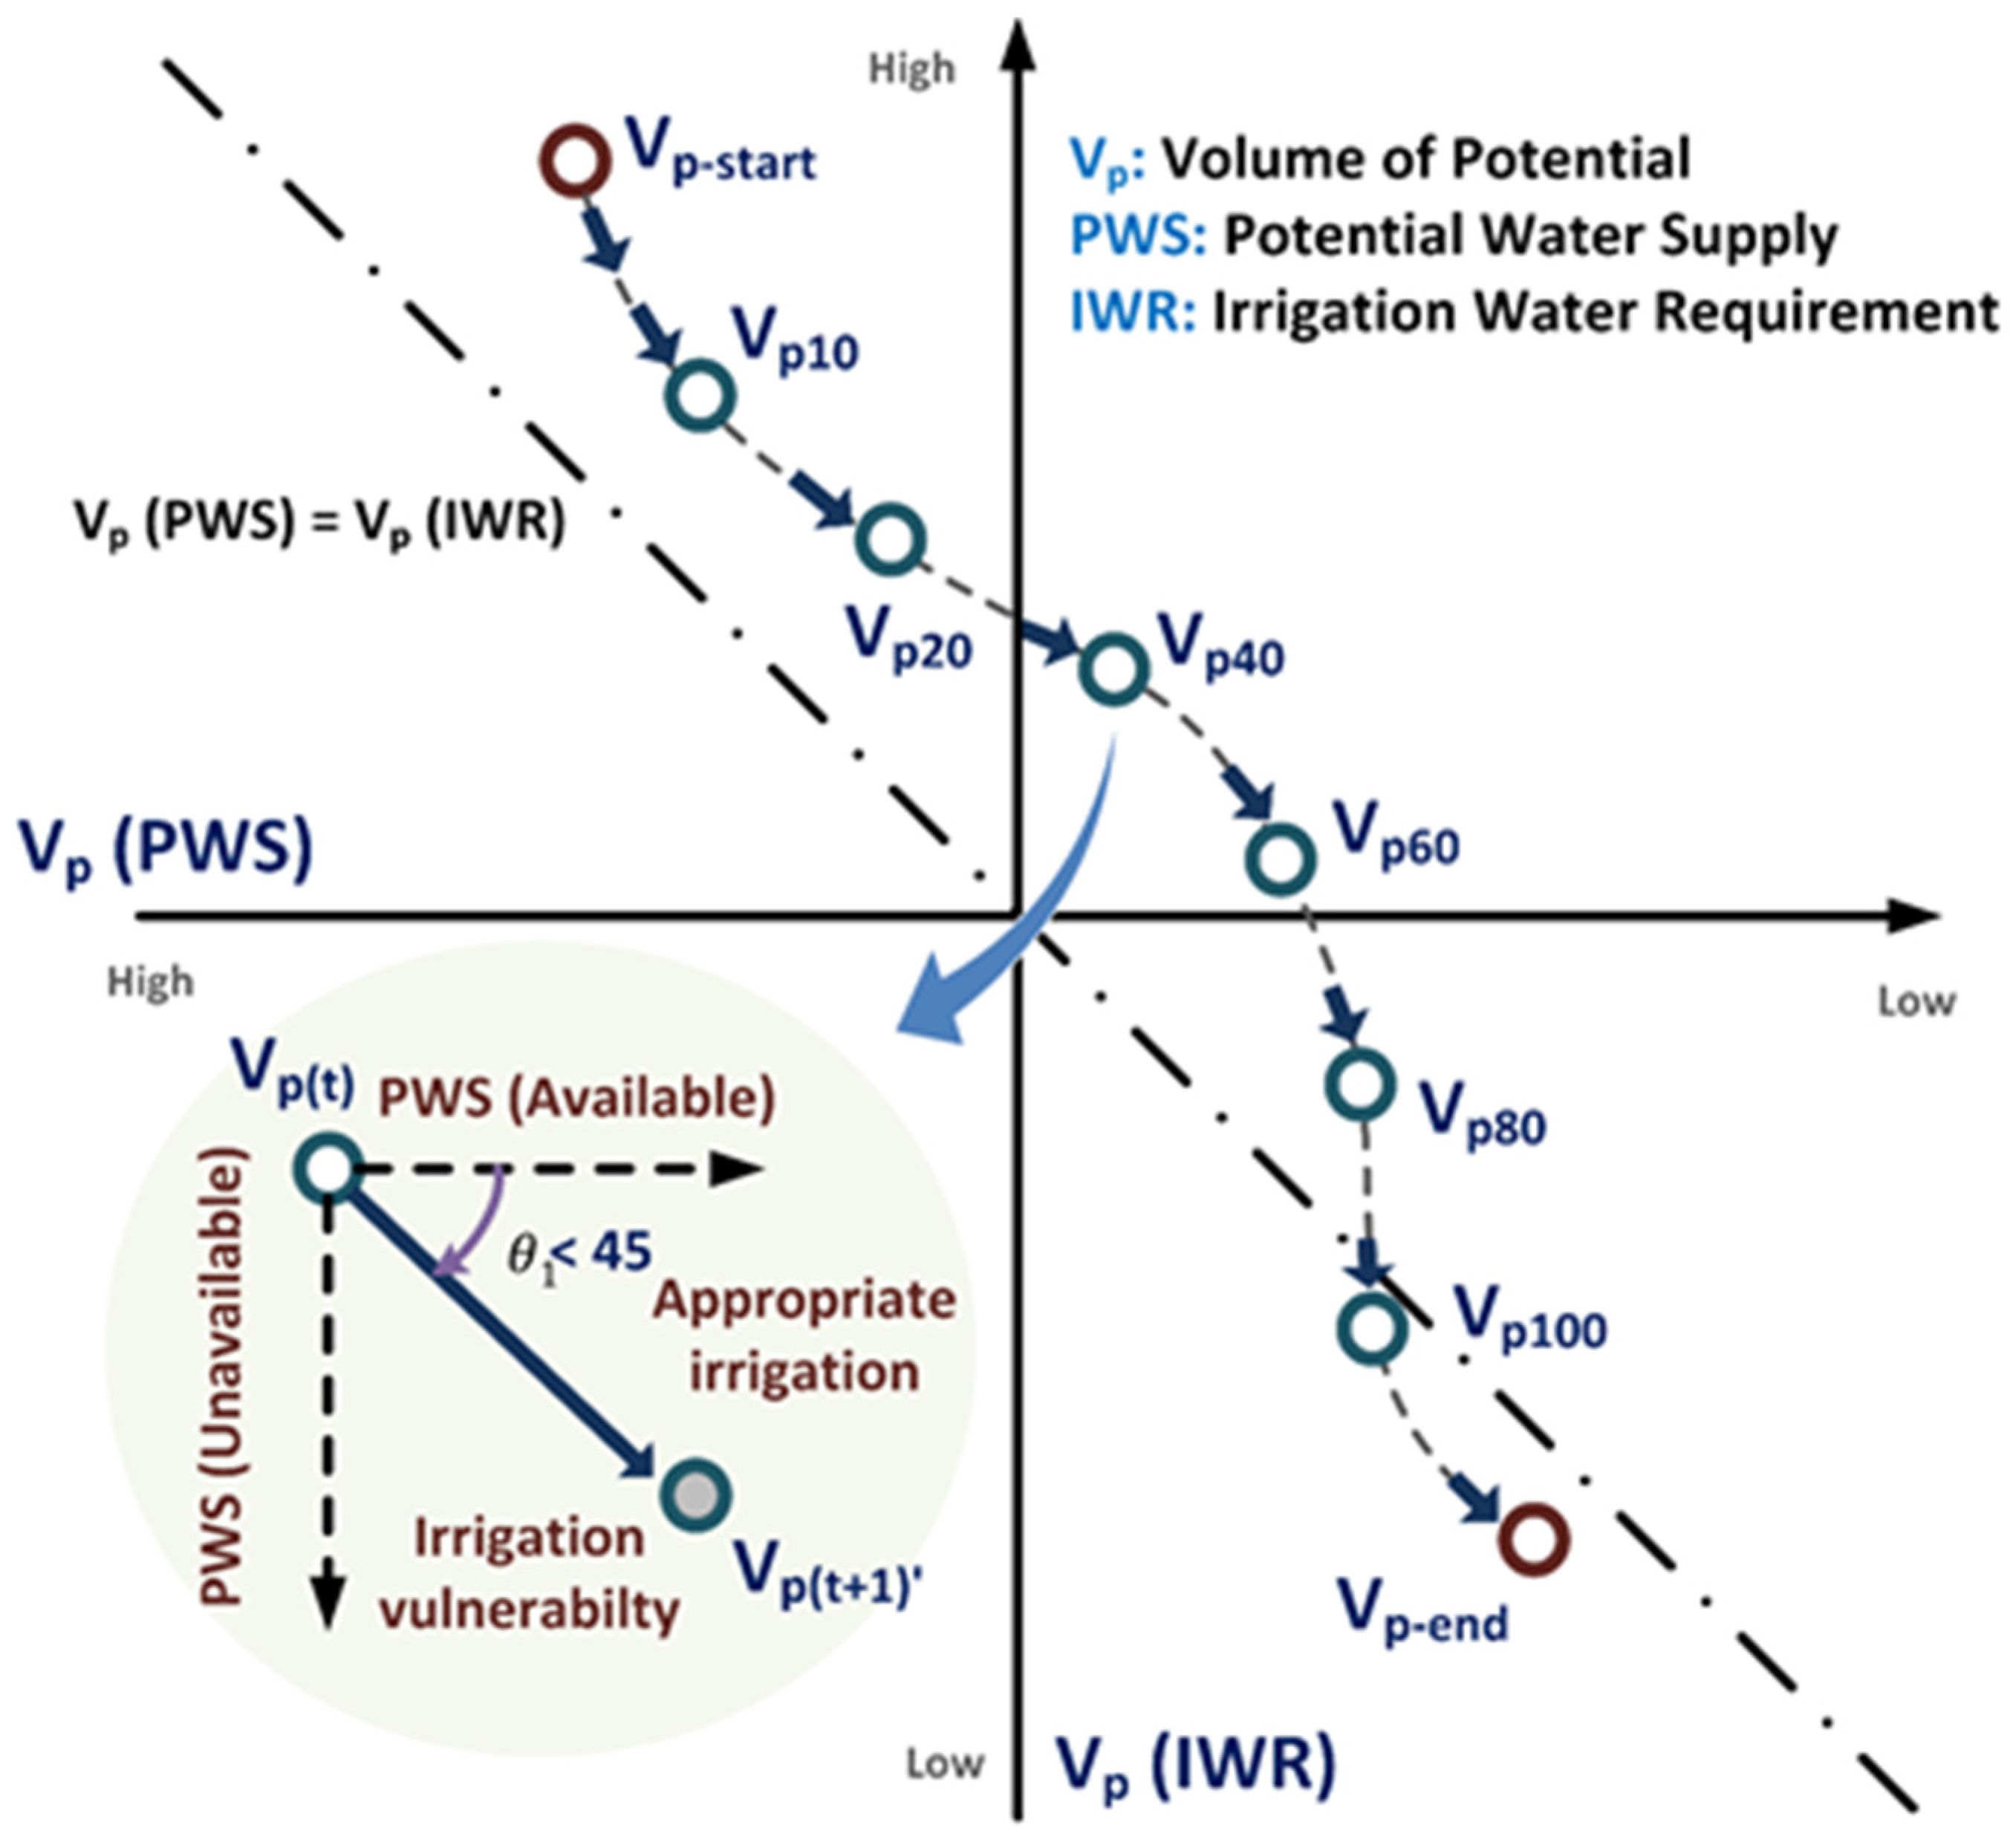
Figure 6.
Distribution changes in the irrigation water requirement and the potential water supply capacity as determined by the drought year during the historical period in the agricultural reservoirs of the central region: Res. A.
Figure 6.
Distribution changes in the irrigation water requirement and the potential water supply capacity as determined by the drought year during the historical period in the agricultural reservoirs of the central region: Res. A.
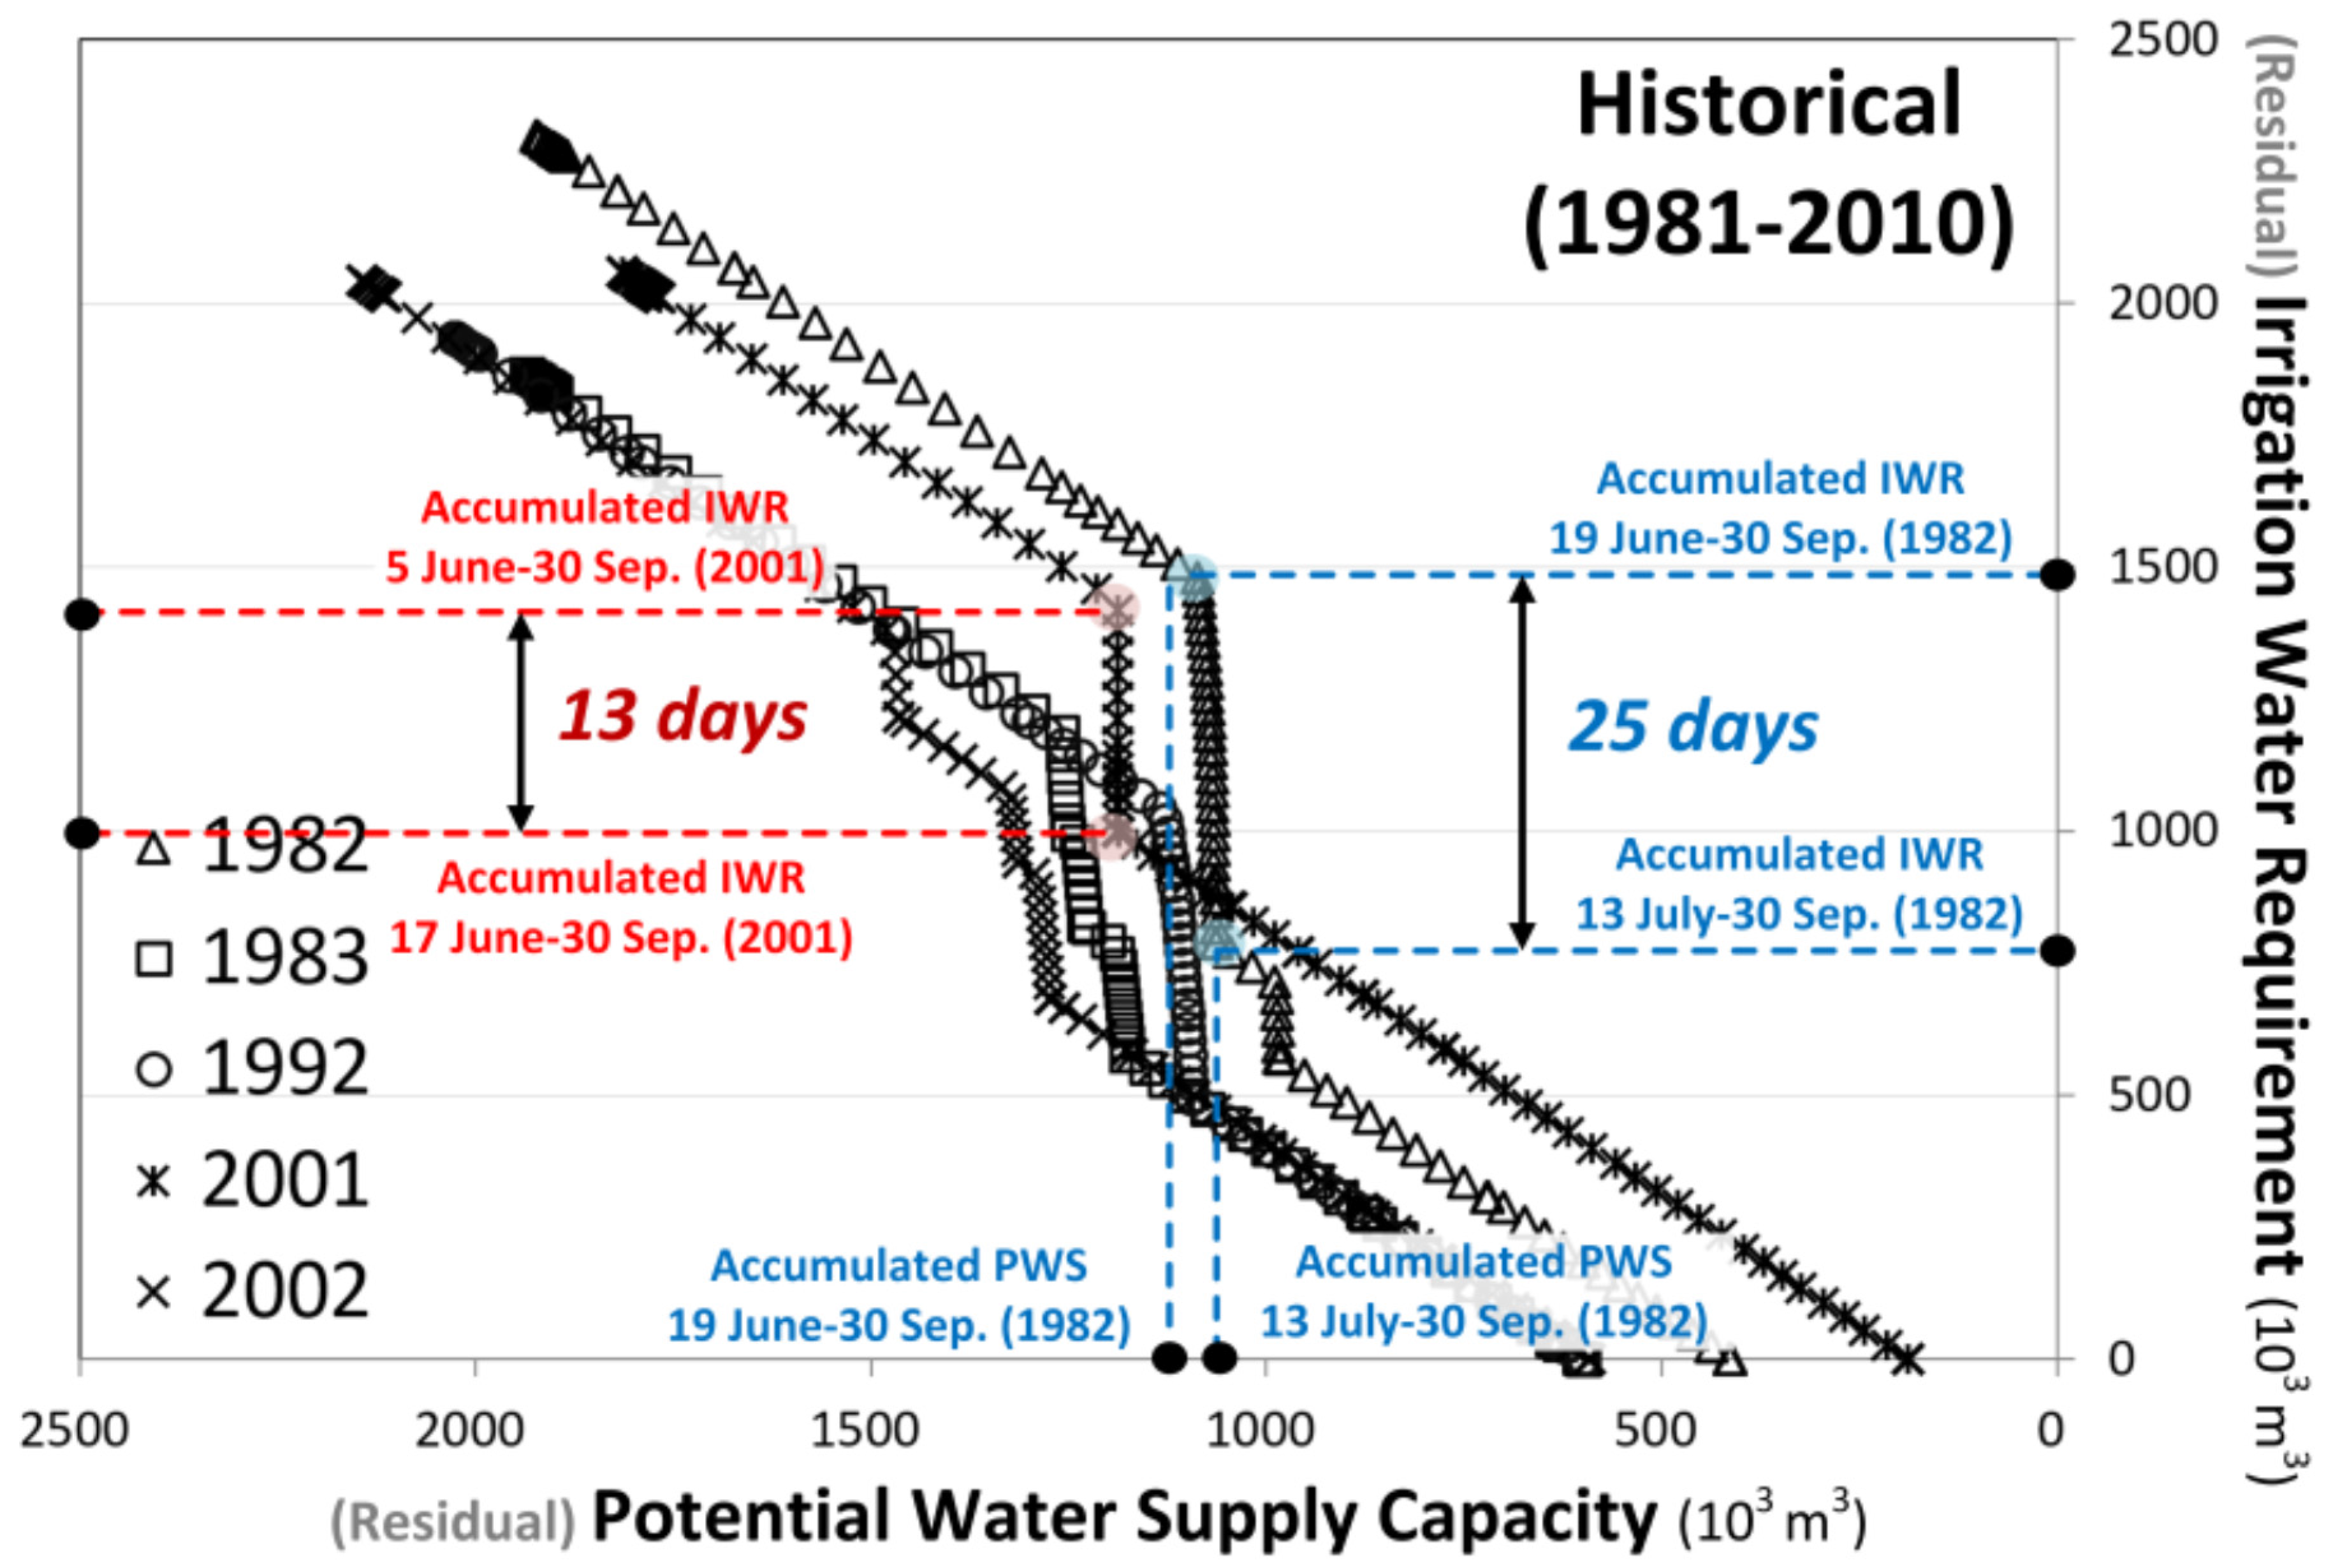
Figure 7.
Temporal patterns in the irrigation water requirement and the reservoir volume during the irrigation period in 1982 as determined by the drought year: Res. A.
Figure 7.
Temporal patterns in the irrigation water requirement and the reservoir volume during the irrigation period in 1982 as determined by the drought year: Res. A.

Figure 8.
Distribution changes in the irrigation water requirement and the potential water supply capacity as determined by the drought year during the future period in the agricultural reservoirs of the central region: Res. A.
Figure 8.
Distribution changes in the irrigation water requirement and the potential water supply capacity as determined by the drought year during the future period in the agricultural reservoirs of the central region: Res. A.
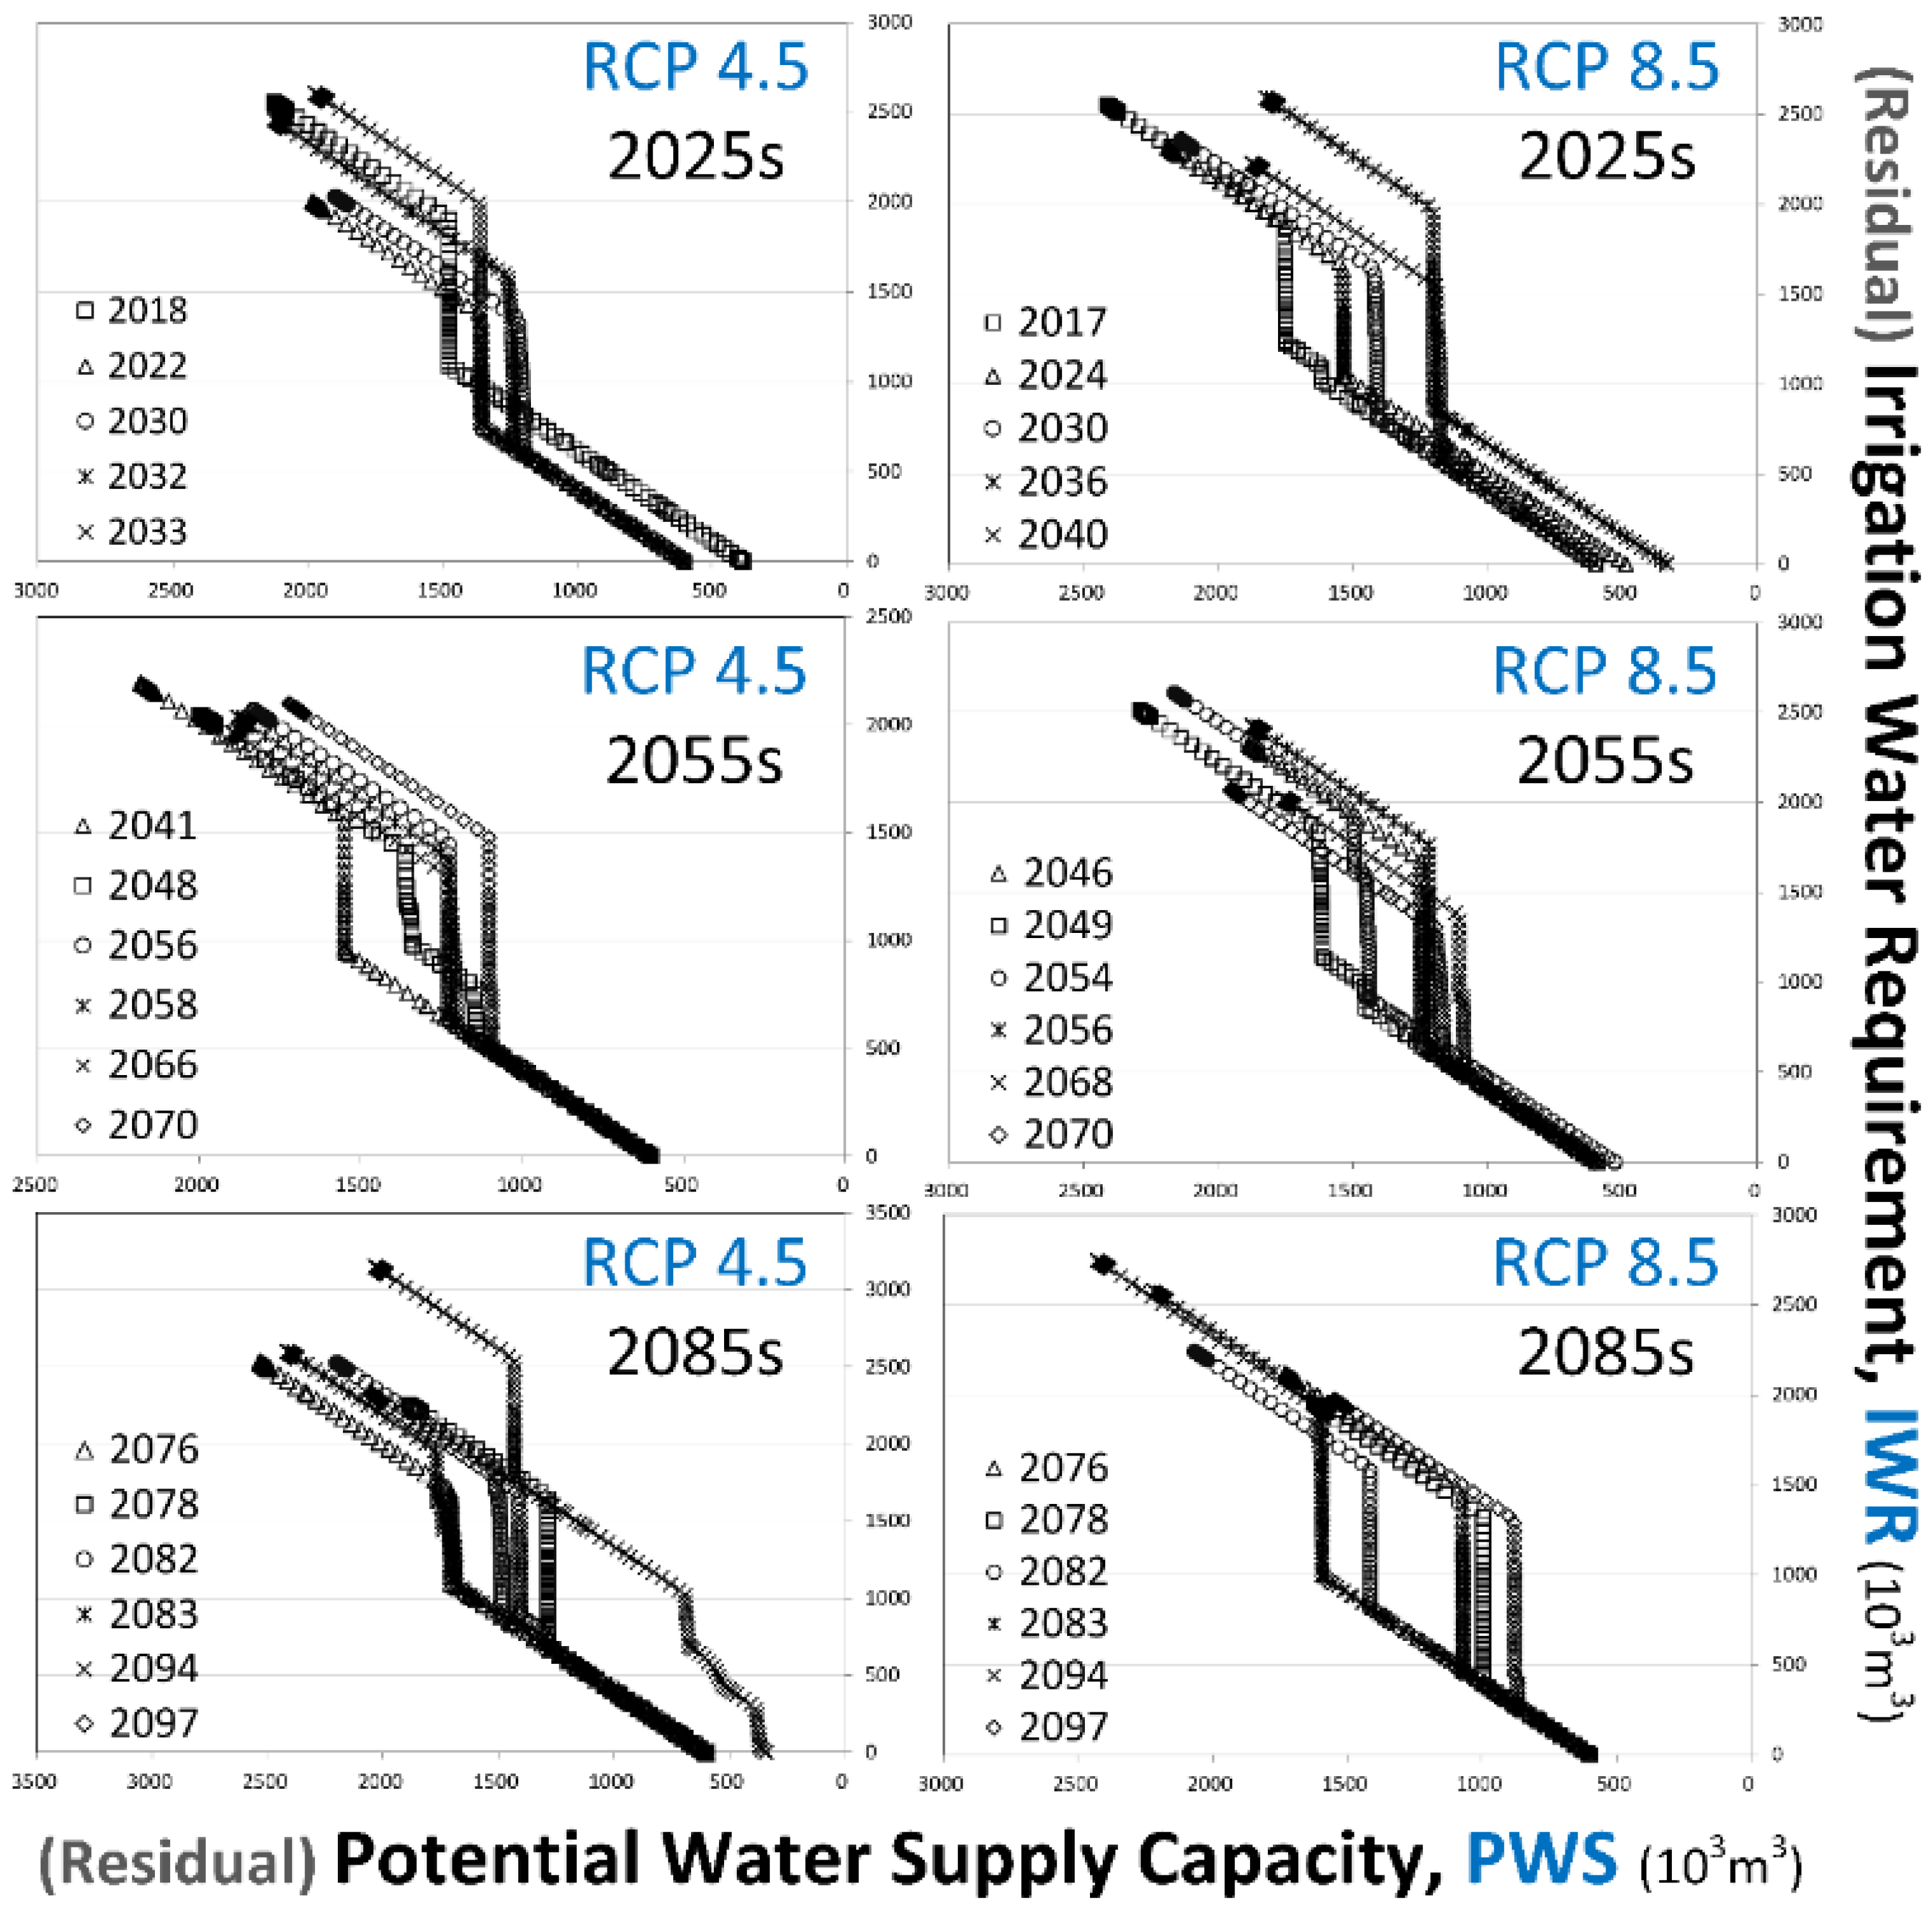
Figure 9.
Distribution changes in the irrigation water requirement and the potential water supply capacity as determined by the drought year between the historical period and future period in the agricultural reservoirs of the southern region: Res. D.
Figure 9.
Distribution changes in the irrigation water requirement and the potential water supply capacity as determined by the drought year between the historical period and future period in the agricultural reservoirs of the southern region: Res. D.

Figure 10.
Temporal shifts in irrigation vulnerable seasons between the historical period and future period in the agricultural reservoirs: (a) Res. A, (b) Res. B, (c) Res. C, (d) Res. D.
Figure 10.
Temporal shifts in irrigation vulnerable seasons between the historical period and future period in the agricultural reservoirs: (a) Res. A, (b) Res. B, (c) Res. C, (d) Res. D.


Table 1.
Characteristics of agricultural reservoirs in the study area.
| Region | Meteorological Station | Reservoir Name | Symbol | Effective Storage Capacity (103 m3) | Watershed Area (ha) | Irrigated Area (ha) | Design Frequency of Drought (Year) | Construction Year (Year) |
|---|---|---|---|---|---|---|---|---|
| Central region | Suwon | Myeoku | Res. A | 600 | 830 | 246 | 5 | 1945 |
| Seosan | Songak | Res. B | 463 | 254 | 161 | 3 | 1958 | |
| Southern region | Haenam | Baekho | Res. C | 826 | 570 | 370 | 3 | 1958 |
| Gumi | Duman | Res. D | 369 | 470 | 149 | 3 | 1972 |
Table 2.
Classification of climate change data from Representative Concentration Pathways (RCPs) scenarios.
Table 2.
Classification of climate change data from Representative Concentration Pathways (RCPs) scenarios.
| Classification | Period | Source | Climate Model | Climate Data Items |
|---|---|---|---|---|
| Historical | 1981–2010 | KMA (Korea Meteorological Administration) | Observed data | Daily maximum/minimum temperature, precipitation, solar radiation, relative humidity and sunshine duration |
| RCP 2025s | 2011–2040 | RCP scenarios (RCP 4.5 and 8.5, source of KMA) | HadGEM3-RA | |
| RCP 2055s | 2041–2070 | |||
| RCP 2085s | 2071–2100 |
| Date | 30 May | 1 June–20 June | 21 June–31 July | 1 August–10 August | 11 August–10 September | |
|---|---|---|---|---|---|---|
| Growth stages | Transplanting | Effective Tillering | Non-effective Tillering (Forced Drainage) | Head development | Heading | Grain filling and ripening |
| Ponding water depth (mm) | 30 | 30 | 0 | 40 | 60 | 30 |
Table 4.
Classification of irrigation vulnerable seasons.
| Slope of Potential Volume | Comparison of Elements | Irrigation State |
|---|---|---|
| Less than 45 degrees | PWS 1 > IWR 2 | Excessive irrigation |
| 45 degrees | PWS = IWR | Appropriate irrigation water supply |
| More than 45 degrees | PWS < IWR | Shortage of irrigation water supply or water-saving irrigation |
1 PWS: potential water supply capacity, 2 IWR: irrigation water requirement.
Table 5.
Comparisons of meteorological factors between the historical period and climate change period.
Table 5.
Comparisons of meteorological factors between the historical period and climate change period.
| Region | Meteorological Station | Factors | Historical (1981–2010) | RCP 4.5 Scenario | RCP 8.5 Scenario | ||||
|---|---|---|---|---|---|---|---|---|---|
| 2025s | 2055s | 2085s | 2025s | 2055s | 2085s | ||||
| Central region | Suwon | PREC 1 | 1312 | 1576 | 1673 | 1849 | 1604 | 1806 | 1823 |
| TEMP 2 | 12.1 | 13.2 | 14.1 | 14.7 | 13.4 | 15.2 | 17.3 | ||
| Seosan | PREC | 1286 | 1516 | 1642 | 1734 | 1539 | 1652 | 1775 | |
| TEMP | 11.9 | 12.7 | 13.7 | 14.3 | 12.9 | 14.7 | 16.9 | ||
| Southern region | Haenam | PREC | 1325 | 1678 | 1774 | 1917 | 1619 | 1778 | 1942 |
| TEMP | 13.5 | 14.3 | 15.3 | 15.9 | 14.5 | 16.3 | 18.3 | ||
| Gumi | PREC | 1073 | 1394 | 1414 | 1486 | 1318 | 1478 | 1484 | |
| TEMP | 12.6 | 13.6 | 14.5 | 15.1 | 13.9 | 15.6 | 17.7 | ||
1 PREC: annual precipitation (mm), 2 TEMP: average temperature (degree Celsius).
Table 6.
Comparisons of RI, RF, ETc and ER between the historical period and climate change period.
| Region | Reservoir Symbol | Factors | Historical (1981–2010) | RCP 4.5 Scenario | RCP 8.5 Scenario | ||||
|---|---|---|---|---|---|---|---|---|---|
| 2025s | 2055s | 2085s | 2025s | 2055s | 2085s | ||||
| Central region | Res. A (Myeoku) | RI 1 | 6627 (1535) | 5107 (1626) | 7145 (1911) | 6176 (2112) | 5908 (1742) | 6317 (1645) | 6910 (1831) |
| RF 2 | 5084 (1649) | 3505 (1766) | 5718 (2027) | 4593 (2252) | 4431 (1838) | 4794 (1770) | 5348 (2046) | ||
| ETc 3 | 1469 (60) | 1579 (121) | 1531 (87) | 1606 (140) | 1539 (84) | 1643 (94) | 1709 (138) | ||
| ER 4 | 1559 (258) | 1331 (342) | 1570 (298) | 1429 (334) | 1361 (262) | 1368 (267) | 1427 (270) | ||
| Res. B (Songak) | RI | 1896 (574) | 1534 (463) | 2070 (546) | 1843 (701) | 1729 (494) | 1801 (463) | 1942 (489) | |
| RF | 900 (592) | 535 (473) | 1115 (572) | 868 (755) | 753 (469) | 822 (456) | 949 (545) | ||
| ETc | 942 (41) | 1004 (73) | 982 (62) | 1032 (87) | 974 (63) | 1039 (67) | 1087 (91) | ||
| ER | 971 (217) | 918 (214) | 1071 (197) | 993 (214) | 915 (180) | 922 (173) | 962 (164) | ||
| Southern region | Res. C (Baekho) | RI | 4497 (1368) | 4672 (1218) | 5333 (1147) | 5227 (1608) | 5075 (1138) | 4951 (1356) | 5890 (1361) |
| RF | 2348 (1263) | 2585 (1372) | 3323 (1372) | 3207 (1766) | 3092 (1322) | 2846 (1481) | 3959 (1635) | ||
| ETc | 3347 (174) | 3382 (241) | 3433 (212) | 3477 (223) | 3345 (163) | 3647 (227) | 3754 (221) | ||
| ER | 3593 (773) | 4103 (679) | 4357 (722) | 4365 (703) | 4099 (556) | 4184 (757) | 4557 (639) | ||
| Res. D (Gumi) | RI | 2868 (939) | 2984 (686) | 3366 (630) | 3270 (990) | 3254 (876) | 3227 (634) | 3594 (919) | |
| RF | 1856 (996) | 1954 (795) | 2392 (699) | 2252 (1014) | 2312 (939) | 2235 (686) | 2657 (1072) | ||
| ETc | 961 (48) | 900 (50) | 904 (45) | 1020 (76) | 981 (48) | 1043 (54) | 1095 (68) | ||
| ER | 862 (207) | 1199 (277) | 1392 (283) | 923 (189) | 940 (176) | 951 (160) | 1023 (178) | ||
1 RI: reservoir inflow based on the tank model (rainfall–runoff model), 2 RF: reservoir overflow through the sluice gates (reservoir operation model), 3 ETc: reference evapotranspiration in paddy fields using the Penman–Monteith model (irrigation water requirement model), 4 ER: effective rainfall in paddy fields. Units: average (103 m3), standard deviation in parentheses.
Table 7.
Comparisons of PWS and IWR between the historical period and climate change period.
| Region | Reservoir Symbol | Factors | Historical (1981–2010) | RCP 4.5 Scenario | RCP 8.5 Scenario | ||||
|---|---|---|---|---|---|---|---|---|---|
| 2025s | 2055s | 2085s | 2025s | 2055s | 2085s | ||||
| Central region | Res. A (Myeoku) | PWS 1 | 2135 (224) | 2222 (297) | 2095 (261) | 2234 (240) | 2101 (234) | 2164 (252) | 2218 (368) |
| IWR 2 | 1822 (274) | 2068 (400) | 1812 (284) | 2011 (443) | 2045 (289) | 2115 (317) | 2100 (331) | ||
| Res. B (Songak) | PWS | 1356 (170) | 1343 (149) | 1405 (122) | 1402 (133) | 1343 (118) | 1369 (110) | 1404 (159) | |
| IWR | 1234 (238) | 1318 (241) | 1151 (197) | 1262 (273) | 1293 (207) | 1350 (214) | 1336 (212) | ||
| Southern region | Res. C (Baekho) | PWS | 2627 (392) | 2737 (241) | 2739 (343) | 2774 (290) | 2709 (268) | 2808 (266) | 2699 (332) |
| IWR | 2310 (561) | 2376 (529) | 2265 (511) | 2295 (456) | 2330 (436) | 2472 (488) | 2246 (519) | ||
| Res. D (Gumi) | PWS | 1327 (139) | 1405 (150) | 1351 (123) | 1394 (113) | 1319 (133) | 1364 (176) | 1314 (208) | |
| IWR | 1243 (221) | 1214 (214) | 1153 (151) | 1247 (214) | 1181 (214) | 1228 (199) | 1186 (246) | ||
1 PWS: potential water supply capacity, 2 IWR: irrigation water requirement. Units: average (103 m3), standard deviation in parentheses.
Table 8.
Comparisons of irrigation vulnerable seasons between the historical period and climate change period.
Table 8.
Comparisons of irrigation vulnerable seasons between the historical period and climate change period.
| Region | Reservoir Symbol | Historical (1981–2010) | RCP 4.5 Scenario | RCP 8.5 Scenario | ||||
|---|---|---|---|---|---|---|---|---|
| 2025s | 2055s | 2085s | 2025s | 2055s | 2085s | |||
| Central region | Res. A (Myeoku) | 22 (6.0) | 26 (4.9) | 26 (5.3) | 32 (5.9) | 31 (6.4) | 37 (7.1) | 31 (2.3) |
| Res. B (Songak) | 24 (8.5) | 25 (5.1) | 27 (6.7) | 34 (11.7) | 26 (8.3) | 31 (6.0) | 37 (9.4) | |
| Southern region | Res. C (Baekho) | 21 (5.9) | 14 (4.4) | 15 (3.5) | 18 (2.9) | 18 (2.5) | 20 (5.6) | 25 (5.0) |
| Res. D (Gumi) | 25 (3.5) | 19 (4.9) | 20 (4.1) | 27 (4.5) | 19 (5.7) | 28 (3.0) | 26 (3.0) | |
Units: average (days), standard deviation in parentheses.
© 2017 by the authors. Licensee MDPI, Basel, Switzerland. This article is an open access article distributed under the terms and conditions of the Creative Commons Attribution (CC BY) license (http://creativecommons.org/licenses/by/4.0/).
Share and Cite
MDPI and ACS Style
Nam, W.-H.; Kim, T.; Hong, E.-M.; Choi, J.-Y. Regional Climate Change Impacts on Irrigation Vulnerable Season Shifts in Agricultural Water Availability for South Korea. Water 2017, 9, 735. https://doi.org/10.3390/w9100735
AMA Style
Nam W-H, Kim T, Hong E-M, Choi J-Y. Regional Climate Change Impacts on Irrigation Vulnerable Season Shifts in Agricultural Water Availability for South Korea. Water. 2017; 9(10):735. https://doi.org/10.3390/w9100735
Chicago/Turabian StyleNam, Won-Ho, Taegon Kim, Eun-Mi Hong, and Jin-Yong Choi. 2017. "Regional Climate Change Impacts on Irrigation Vulnerable Season Shifts in Agricultural Water Availability for South Korea" Water 9, no. 10: 735. https://doi.org/10.3390/w9100735
Note that from the first issue of 2016, this journal uses article numbers instead of page numbers. See further details here.