Variation of Aridity Index and the Role of Climate Variables in the Southwest China

1
College of Hydrometeorology, Nanjing University of Information Science and Technology, Nanjing 210044, China
2
National Climate Center, China Meteorological Administration, Beijing 100081, China
3
Institute of Geographic Sciences and Natural Resources Research, Chinese Academy of Sciences, Beijing 100101, China
4
Yellow River Institute of Hydraulic Research, Yellow River Conservancy Commission, Zhengzhou 450003, China
*
Author to whom correspondence should be addressed.
Water 2017, 9(10), 743; https://doi.org/10.3390/w9100743
Submission received: 30 August 2017
/
Revised: 24 September 2017
/
Accepted: 26 September 2017
/
Published: 28 September 2017
Abstract
:Aridity index (AI), defined as the ratio of annual potential evapotranspiration to annual precipitation, has been widely applied in dividing climate regimes and monitoring drought events. Investigating variation of AI and the role of climate variables are thus of great significant for managing agricultural water resource and maintaining regional ecosystem stability. In this study, with the well-corrected precipitation records and the optimized parameters in estimating solar radiation, we investigated the variation of AI and its climatic attribution in the Southwest China using the observed climate records from 135 meteorological stations during the period of 1993–2015. The results showed that the AI increased significantly (0.0053 year−1, p < 0.05) from 1993 to 2015 and abruptly increasing occurred around 2002. Approximately 85% of stations showed an increasing trend, while 24% of stations reached up to a significant increasing level, which demonstrated that the Southwest China was getting drier for the recent 20 years. Overall, the AI was most sensitive to maximum air temperature and precipitation with values of 1.11 and −1.00, respectively. The following factors are vapor pressure, solar radiation, minimum temperature, and wind speed. The declining precipitation and ascending maximum air temperature were the key variables in dominating the increase in aridity index during the period of 1993–2015, which contribute 38.98% and 36.26% of AI variation, respectively. Our results highlighted the influence of climate variability on aridity in the Southwest China.
1. Introduction
Associated with the exacerbation of climate change [1], extreme climate events such as drought [2], extreme precipitation [3], and flooding [4] are increasing at different levels at both global and regional scales [5,6]. Drought, considered as one of the damaging extreme climate events, happened frequently and intensively in recent years [7], which brought more economic and population losses than other climatic disasters [8,9]. In China, high-frequency severe drought of is one of the most devastating natural disasters due to the combined effects of monsoon climates and complicated geographic landscape. The socioeconomic losses caused by severe drought increased significantly during the past 50 years in China [10]. In each year, approximately 250 million people were affected by drought, and 2.5–3.3 billion dollars were lost accordingly. For example, severe droughts in Southwest China since the beginning of the 21st century [10,11] impacted more than 60 million people and over one million hectare of crop lands [12].
The aridity index (AI), which is defined as the ratio of annual potential evapotranspiration (ET0) to annual precipitation (Pre) [13,14], is a key parameter in drought characterization. It has also been widely used for evaluating the trends of aridity or humidity [12,15,16]. If AI becomes larger than normal in a region, the climate tends to suffer from drought and water resource shortages. The ET0 indicates the maximum quantity of water capable of being evaporated from the soil and transpired from the vegetation of a specific surface, which is a function of wind speed, solar radiation, vapor pressure, and temperature [17,18]. Many studies documented that the AI has changed. For example, in the continental Mediterranean region of Turkey, the AI values showed a tendency from humid to sub-humid conditions [19]. In southern Europe, drier conditions will be established in most regions at the end of the 21st century due to the change in AI [20], while in the western Asia, the increase in AI is more remarkable in semi-arid regions than that in humid regions [21]. In addition, the AI deceased significantly (p < 0.05) in northwest China during the period of 1960–2010 with the rise in precipitation [16,22]. The AI exhibited spatiotemporal difference in the Pearl River basin (especially in the west part) of China during the period of 1960–2005, with significant dry tendency in the rainy season [23]. Although the trends in AI have been investigated, what is the dominant factor driving the change in AI? How do the climate variables (such as precipitation, wind speed, solar radiation, and vapor pressure) contribute to the change in AI? Those questions are essential for further understanding the effect of climate change on hydrological process, for water resource management, and for the prediction the variation in drought.
As a crucial component in AI calculation, the atmospheric evaporative demand, always depicted by ET0, is also important in evaluations of drought [6,24]. The variation of ET0 and possible contribution of meteorological factors were reported in many regions in the context of climate change [25,26,27,28,29]. For example, Sun, Chen, Ju, Wang, Sun, Huang, Ma, Gao, Hua, and Yan [6] found that the change in ET0 played a predominant role in determining region drought in the Southwest China during 1990s, rather than precipitation. Li, Liang, Bai, Feng, Liu, and Dong [29] investigated the variation of ET0 in the Loess Plateau, in which the ET0 was found increased significantly from 1990 to 2013 due to ascending air temperature. Liu and Zhang [28] found that ET0 decreased by −2.34 mm year−2 from 1960 to 1993 and was dominated by wind speed, while it increased since 1994 by 4.80 mm year−2 associated with the increase of air temperature. Meanwhile, Liu, Luo, Zhang, Zhang, and Liu [25] investigated the pan evaporation (ETpan, linearly related to ET0) at the national and regional scale. They found that the ETpan gradually decreased over China before 1992 and then increased overall. Although change in ET0 and its possible contribution of climate variables were analyzed in many regions, the effect of climate changes on ET0 and its contributions to AI are still unclear in Southwest China, which are essential in this drought-prone region [30] for further understanding the effect of climate change on hydrological processes and water resource management during frequent drought conditions.
This paper focused on the variation of AI and the role of climate variables in the Southwest China. The main objectives are (1) to investigate the variation of AI in the Southwest China during the period of 1993–2015, (2) to analyze the sensitivity of AI variation to climate variables, and (3) to quantify the contributions of climate variables to the change in AI. This study is structured as follows: In Section 2 and Section 3, the study area, datasets, and methodology used in this study are described. In Section 4, the variation of AI and its sensitivity to climate variables are quantified. In Section 5, the uncertainties in this study and the potential implications of AI variation on water resource and drought are discussed. Conclusions are presented in Section 6.
2. Study Area and Data
2.1. Study Area
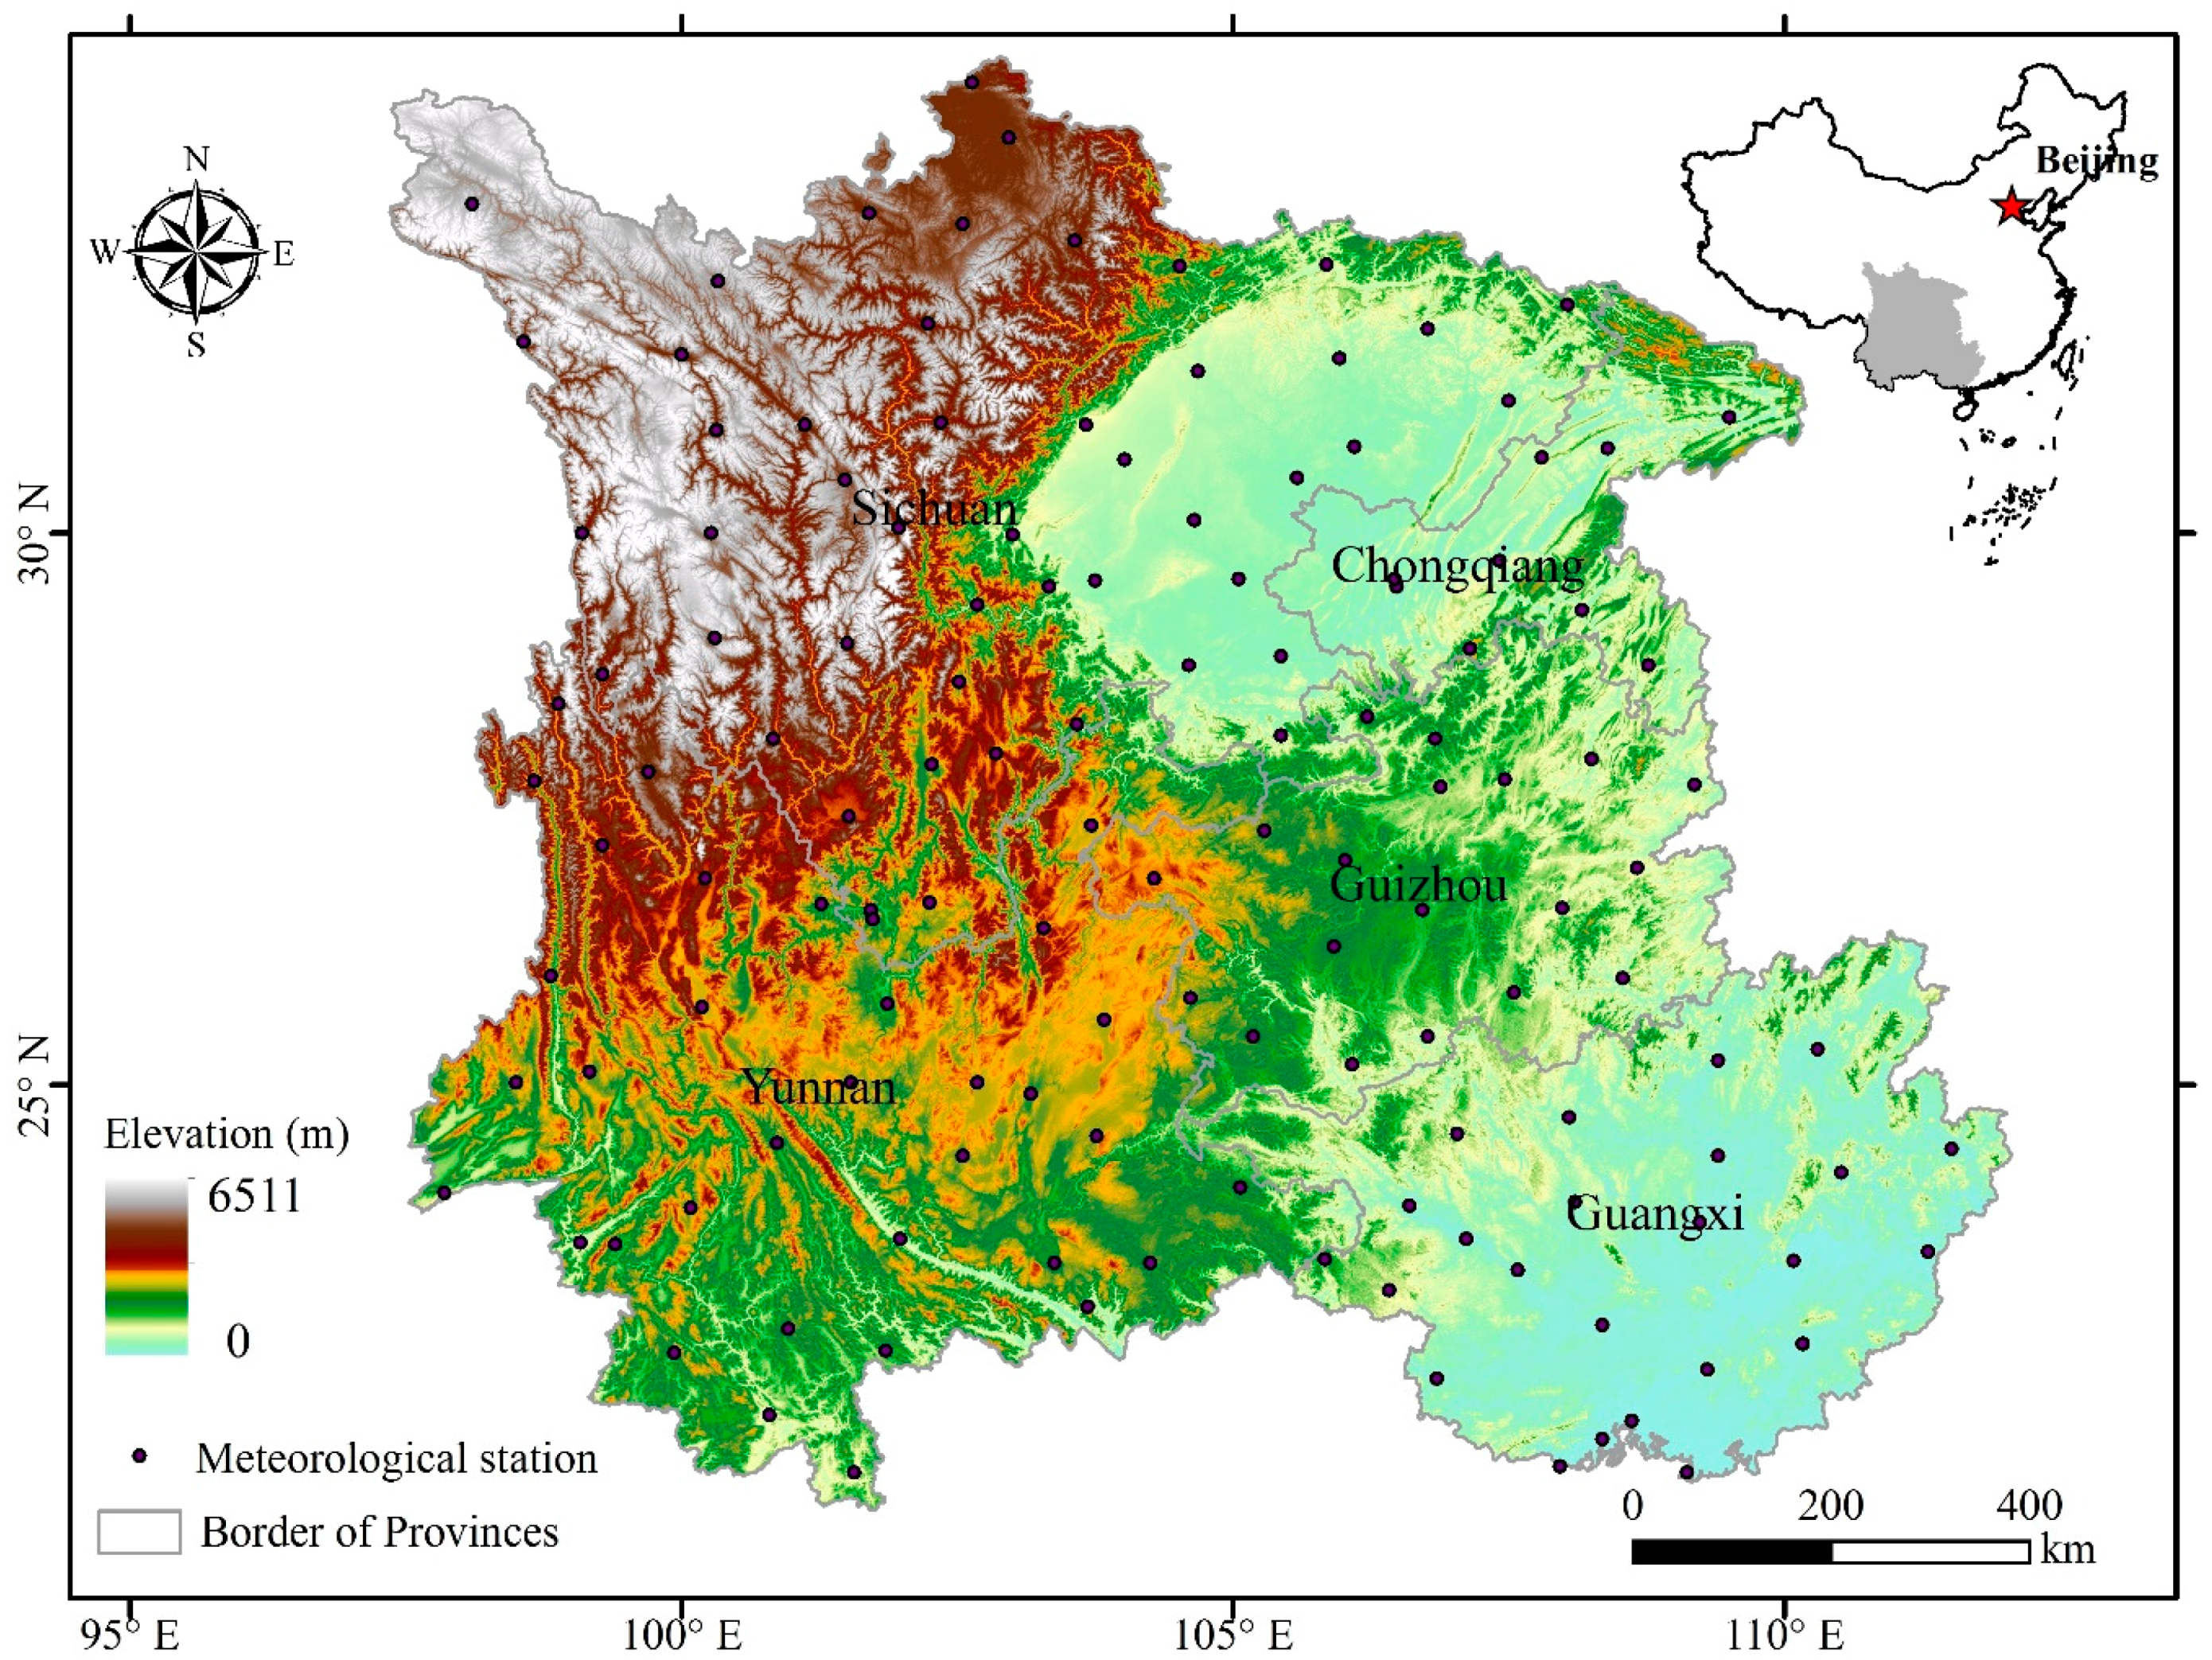
The study area (97.36° E–112.06° E, 21.14° N–34.32° N) is located in the southwest of China, including Sichuang, Chongqing, Guizhou, Yunnan, and Guangxi provinces (Figure 1). It covers a total area of 1.37 × 10⁶ km2 and accounts for 14.3% of the total land area of China. The elevation shows a large variation from southern Guangxi to northwestern Sichuan with an elevation of 6511 m. As one of the most densely populated area, it has about 1/6 of the total population of China. Most of Southwest China experiences humid climates with annual mean precipitation of 1261 mm and potential evapotranspiration of 913 mm. The seasonal distribution of precipitation is uneven, with about 76% of precipitation occuring in the period of May to September. The major crops are maize and rice, and the cropping patterns are double-cropping systems drawing irrigation water from higher locations [31].
2.2. Data
Daily climate data (including daily maximum, minimum and mean, air temperature (Tmax, Tmin, Ta) at 2 m height, wind speed measured at 10 m height, vapor pressure at 2 m height, and sunshine duration [18,32]) from 135 national meteorological stations (shown in Figure 1) during the period 1993–2015 were obtained from the National Climate Center of China Meteorological Administration. The wind speed was adjusted to 2 m height (U2) using the wind profile relationship [18]. The precipitation is considered as the key variable in calculating aridity index. Precipitation biases caused by wetting loss and wind-induced undercatch [33,34,35] could bring great uncertainties in evaluating the availability of water resource [36]. The wetting loss resulted from precipitation being retained or stuck on the sides of the gauge, which cannot be poured out and measured in the precipitation observation. The wind-induced undercatch of precipitation is caused by the deformation of wind field above the gauge orifice [37]. It is therefore necessary to correct the bias of gauge-measured precipitation first before conducting any climate change and hydrological studies. The following formula was adopted to correct the bias [35]:
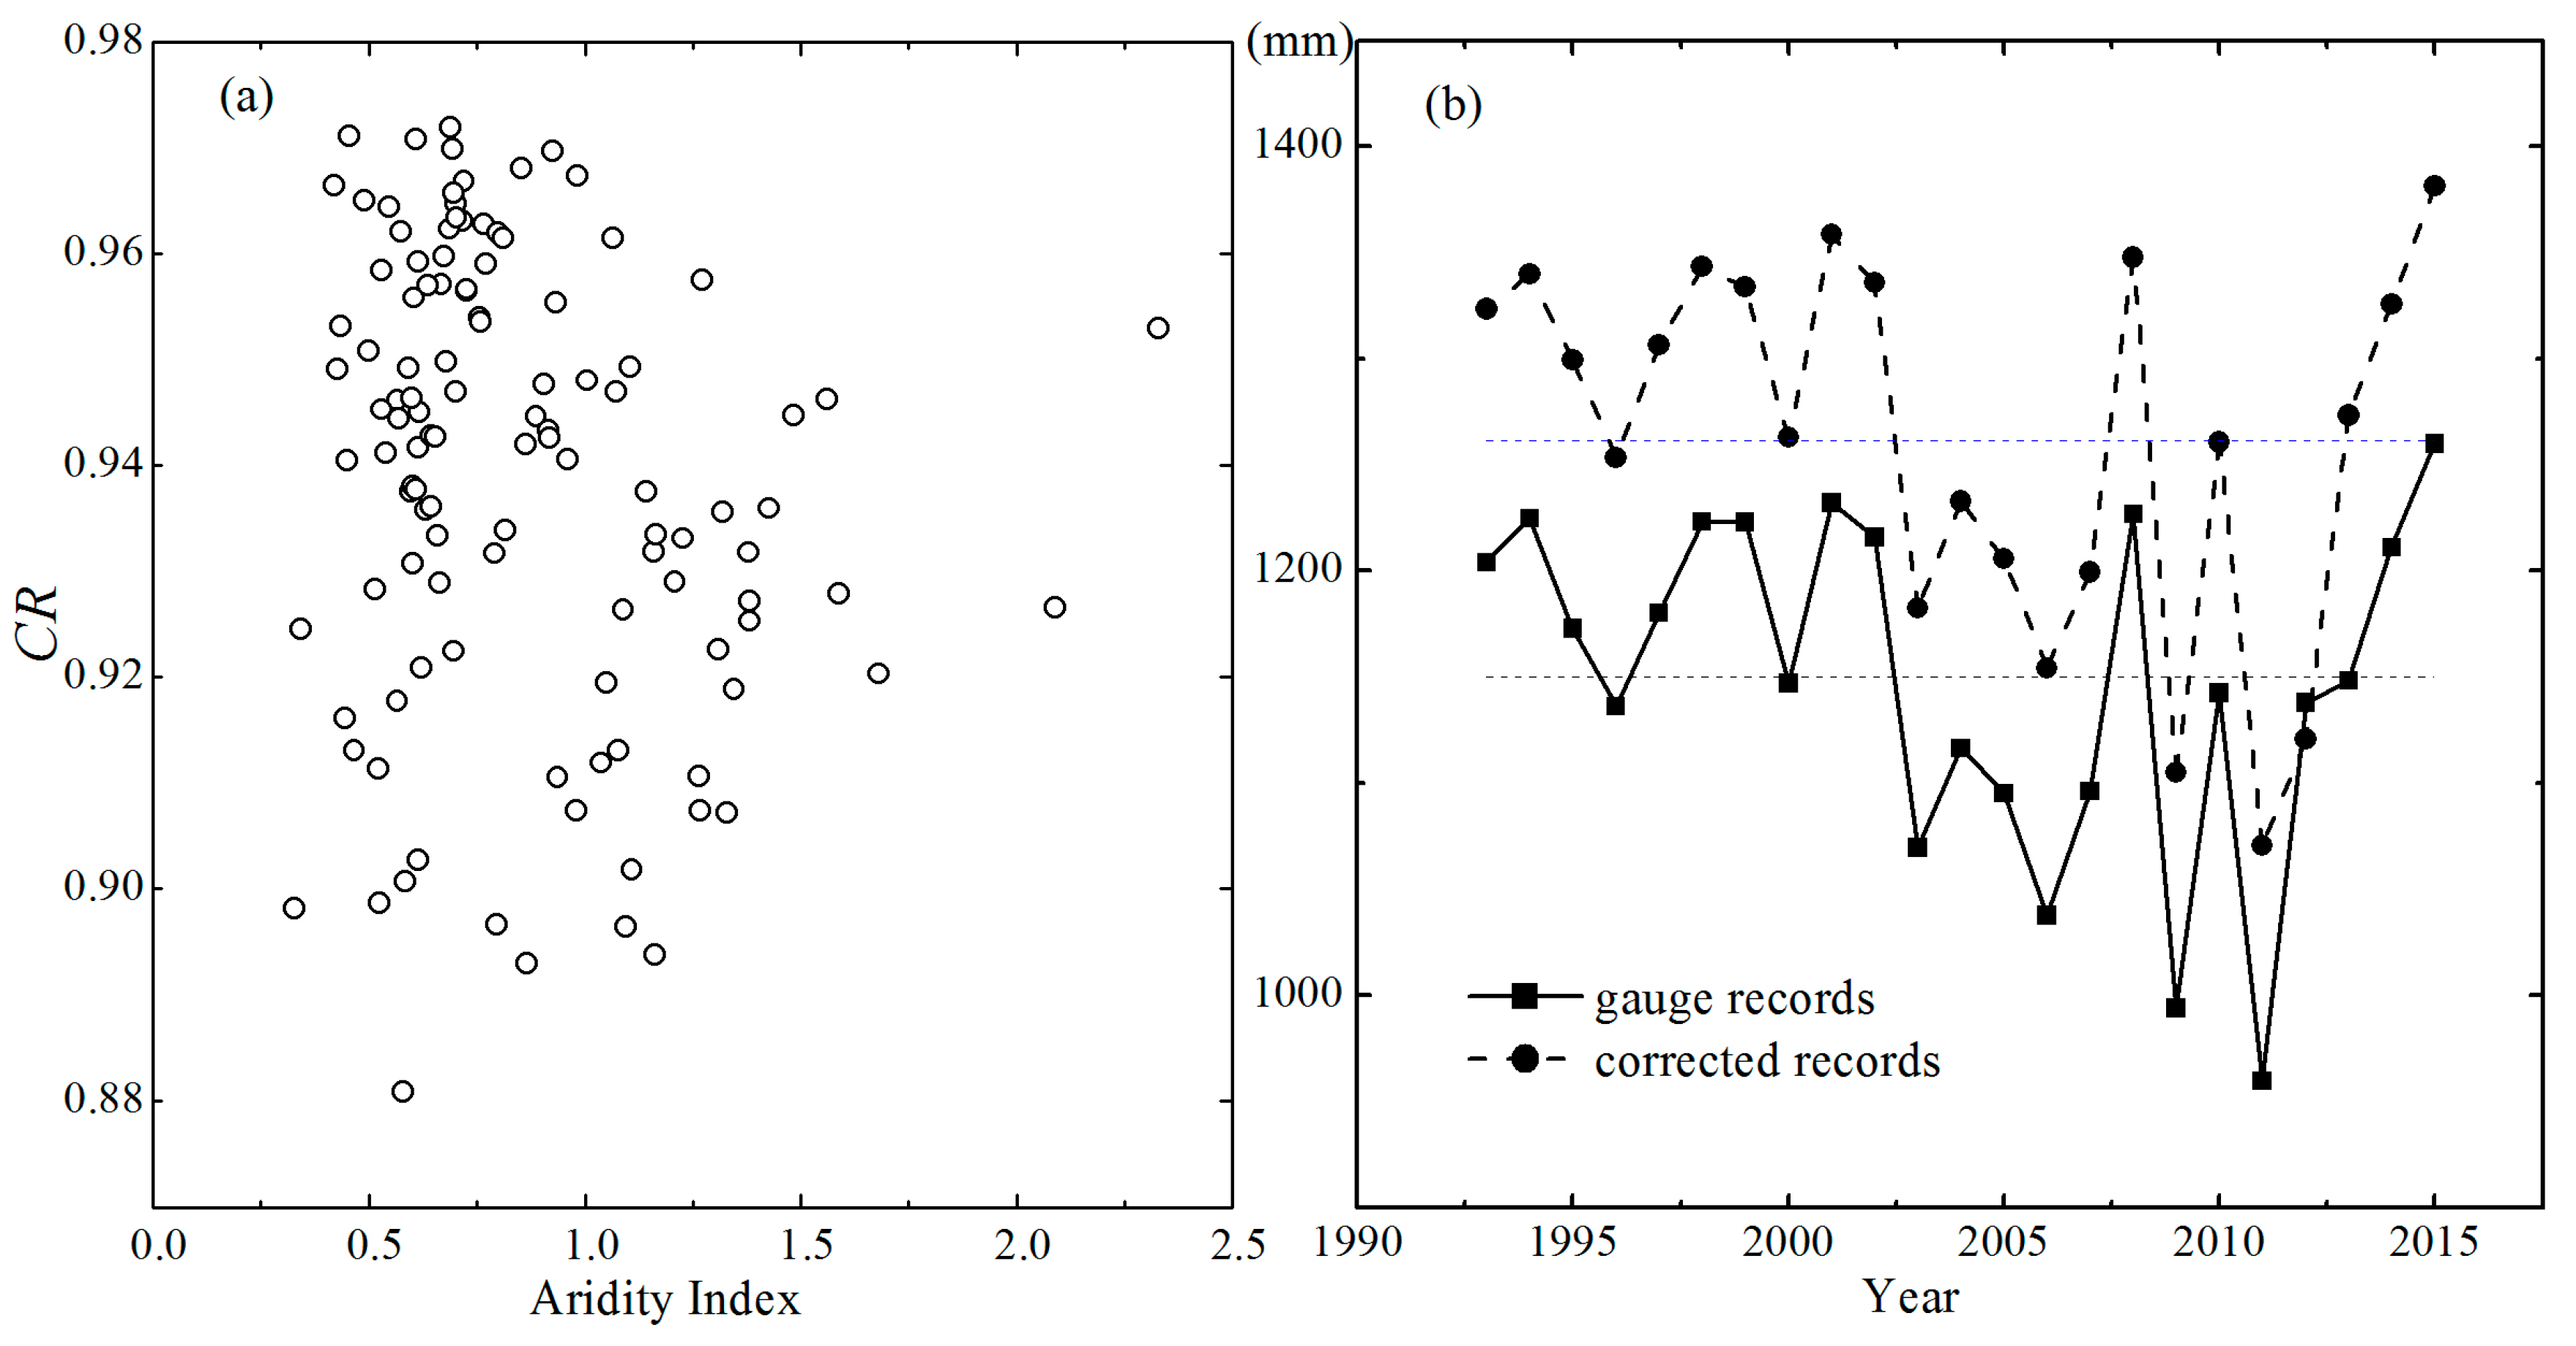
where Pc is the corrected precipitation according to different precipitation types (snow, rain, and mixed precipitation), Pg is the daily precipitation measured from the gauge records, ΔPw is the wetting loss, and CR is the catch ratio that defined as the ratio of gauge measured precipitation to the true precipitation. The closer the value of CR to unity means the more true precipitation caught by the gauge instruments. Figure 2a shows the annual catch ratio values for the 135 meteorological stations, ranging from 0.88 to 0.97, with the average of 0.94. It indicates that the gauge records undercaught precipitation by 3% to 12% for the 135 stations. The difference between annual variation of precipitation for gauge and corrected records (Figure 2b) demonstrated that it is of great necessity to correct the precipitation record obtained from meteorological stations before calculating aridity index.
3. Methods
3.1. Calculation of Aridity Index
The aridity index is defined as the ratio of potential evapotranspiration to precipitation as follows:
where ET0 is the annual potential evapotranspiration (mm) and Pre is the annual precipitation (mm). The ET0 can be estimated by Penman-Monteith method [18] as follows:
where Rn is the net radiation at the canopy surface (MJ m−2 d−1), G is the soil heat flux density (MJ m−2 d−1) calculated by the difference of the mean daily air temperature between two continuous days, Ta is the mean daily air temperature at 2 m height (°C), U2 is the wind speed at 2 m height (ms−1), and es and ea are the saturation and actual vapor pressure (kPa), respectively. ∆ is the slope of saturated vapor pressure in relation to air temperature (kPa·°C−1), and γ is the psychrometric constant (kPa·°C−1). Rn can be estimated by the difference between the net shortwave radiation (Rns) and the net long-wave radiation (Rnl).
where α is the albedo of reference grassland (α = 0.23), Rs is the incoming solar radiation (MJ m−2 d−1), n is the actual duration of sunshine (hours), and N is the maximum possible duration of sunshine or daylight hours (h) (n/N is the relative sunshine duration). The coefficients of as and bs, recommended by FAO (as = 0.25, bs = 0.50), are not used in our study. Instead, the two parameters were estimated by an optimized method using the data from solar radiation stations [27,38]. As shown in Figure 3, the as and bs have significant differences in terms of their spatial distribution. For example, the as varies from 0.13 to 0.21, gradually increasing from the eastern to the western part. The bs has a range of 0.53 to 0.69, the higher value found in the northern region and the smaller in the southern region of Southwest China, which indicates that it is necessary to use the optimized values instead of fixed values. The precision of ET0 estimation can thus be greatly improved by the optimized global radiation model.
3.2. Attribution Analysis
The sensitivity coefficient, defined as the ratio of the change rate of dependent variable to the change rate of some independent variables, was used in this study [39]. The sensitivity of AI to climate variables can be calculated by the following formula:
where x is certain climate variable and S(x) is the sensitivity coefficient of AI to x variable. If S(x) is positive, it indicates that the AI will increase with the ascending x. Similarly, if S(x) is negative, AI will decrease according with increasing x.
The change in AI can be approximately attributed to several climatic variables as follows:
or simplified as:
where L_AI is the linear trend in aridity index. Cr(Pre), Cr(Tmax), Cr(Tmin), Cr(Rs), Cr(U2), and Cr(ea) are the contributions to the trend of AI result from the change in Pre, Tmax, Tmin, Rs, U2, and ea, respectively. The total contribution of six variables is simplified as C_AI. ε is the error between C_AI and L_AI. The differential items for each variable are listed in Table 1.
The relative contribution of each climate variable (Cr(xi)) to the trend in AI (RC(xi)) can be calculated by:
where RC(xi) is the relative contribution of climate variable xi to the trend of AI. Additionally, the total contribution of Tmax, Tmin, Rs, ea, and U2 to AI trend can be considered as the corresponding contribution of ET0.
3.3. Statistical Analysis
The Mann-Kendall statistical test is a commonly used approach in detecting the trend in hydro-meteorological variables due to its robustness for non-normally distributed data [25,27,29,40,41,42,43]. It presumes a steady time series (x1, x2…xn), and the rank statistic (dk) can be calculated as the summation of mi, which is the count of later terms (xi+1, xi+1…xn) in the series whose values exceed xi [28]. A positive Mann-Kendal statistic Z larger than 1.96 indicates a significant increasing trend, while a negative Z lower than −1.96 indicates a significant decreasing trend. Critical Z values of ±1.64 and ±2.58 are used for the probabilities of p = 0.1 and 0.01, respectively [43,44]. The trend of AI and climate variables from 1993 to 2015 is determined by linear regression, while the Mann-Kendall test is used to test whether the trend of the regression line is significant. Spatial interpolation with the Kriging method and zonal statistical method in the ArcGIS 10.2 spatial analysis toolbox was used to obtain the spatial distribution of parameters (as, bs) and significance level of AI.
4. Results
4.1. Variation of AI
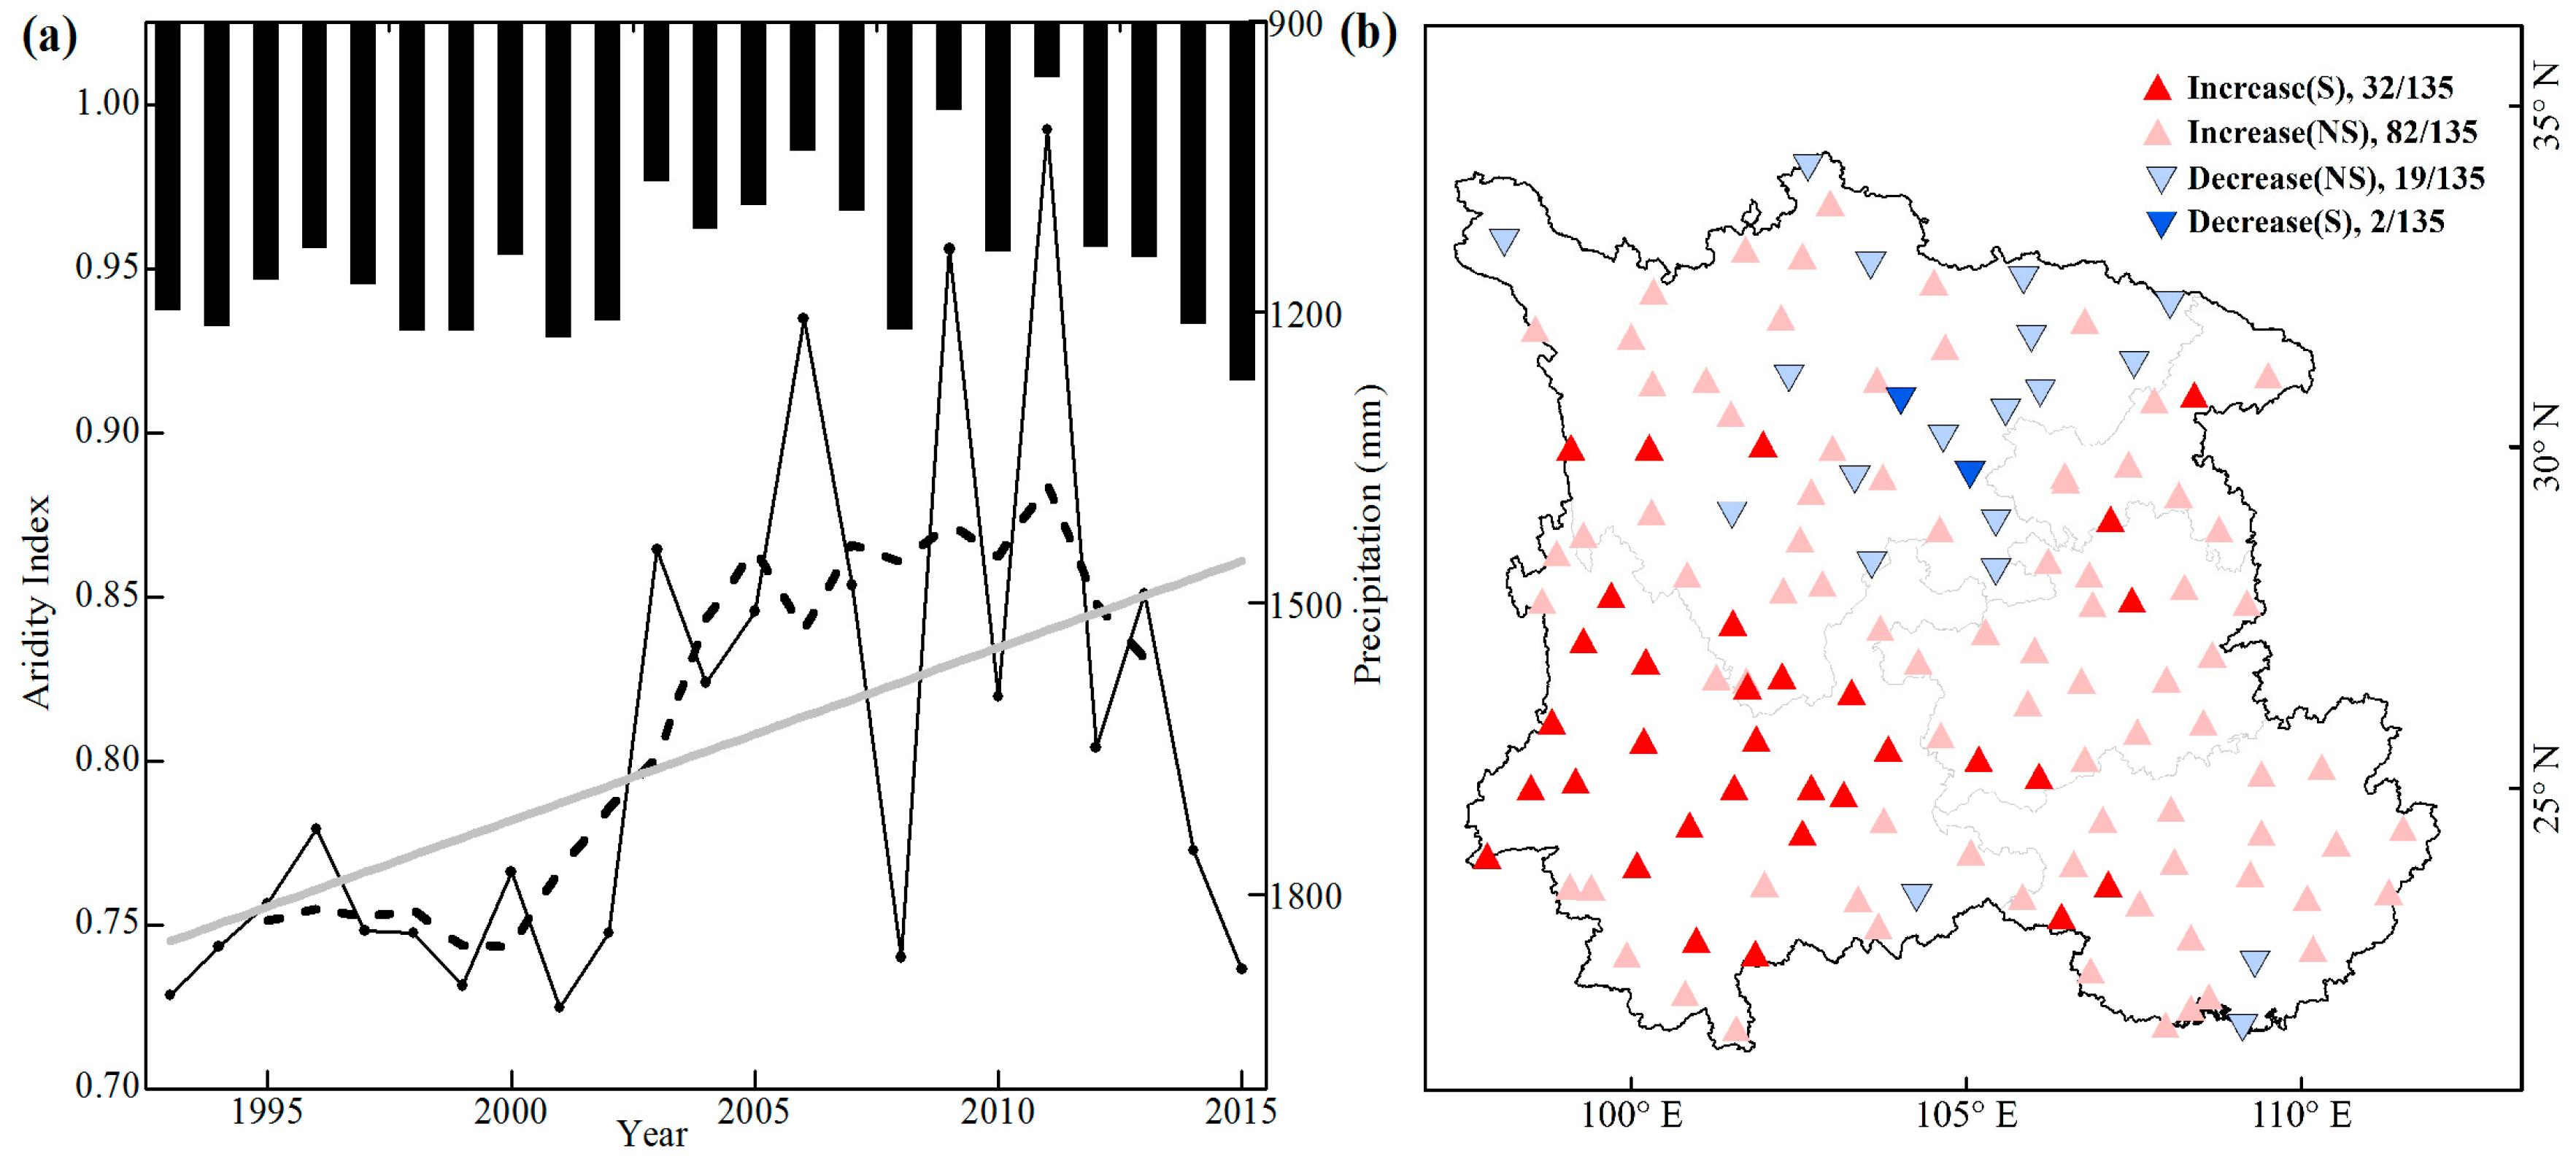
Figure 4a shows the variation of annual AI averaged by 135 meteorological stations in the Southwest China during the period of 1993–2015. Overall, the annual index value varied from about 0.72 to 0.99 across the whole regions. It is relatively lower before 2000 with a mean value of 0.75, and then increase rapidly from 2001 to 2003. A larger aridity index with a mean value of 0.86 is observed from 2003 to 2013, and the driest year occurs in 2011, with an annual aridity index of 0.99. For the whole period, the aridity index increases significantly (p < 0.05) at a rate of 0.0053 year−1 (Table 2), which indicates that the climate in Southwest China tends to be drier in recent years. However, with the increase of precipitation from 2014 to 2015, the drought has, to some extent, been mitigated. Figure 4b shows the spatial distribution of aridity index trend for 135 stations derived from the 23-year mean values. Generally, the aridity index trend displays a gradient increase from northeast to southwest with greater spatial differences, especially significant in Yunnan Province (Figure 1 and Figure 4b). There are 21 stations that show a decreasing trend (only two stations are significant), only accounting for 15.5% of the total stations. 114 stations of the 135 meteorological stations, accounting for 84.4%, show an increasing trend, while 32 stations show a significant increasing trend (p < 0.05), accounting for 23.7% with maximum value of 0.042 year−1.
4.2. Sensitivity of AI to Climate Variables
The differential equation (Equation (7) and Table 1) is employed to calculate the partial derivative and the sensitivity coefficient of AI to climate variables in Southwest China. The annual mean partial derivatives of AI to Pre, Tmax, Tmin, ea, U2, and Rs are −0.0007, 0.0416, 0.0129, −0.2769, 0.0656, and 0.0211, respectively (Table 2). The negative values of , and positive values of , , , indicate that AI could decrease with the increase of Pre and ea, but increase with the increase of Tmax, Tmin, U2, and Rs. The mean annual sensitivity coefficients of AI to Pre, Tmax, Tmin, ea, U2, and Rs are −1.00, 1.11, 0.19, −0.56, 0.10, and 0.33, respectively. It is indicated that a 10% increase in Tmax, Tmin, U2, and Rs could lead to a 11.1%, 1.9%, 1.0%, and 3.3% increase in AI, while a 10% increase in Pre and ea could decrease AI by 10% and 5.6%. For recent 20+ years, the AI in Southwest China is most sensitive to change in Tmax, followed by Pre, ea, Rs, Tmin, and U2.
4.3. Attribution of the Variation in Aridity Index
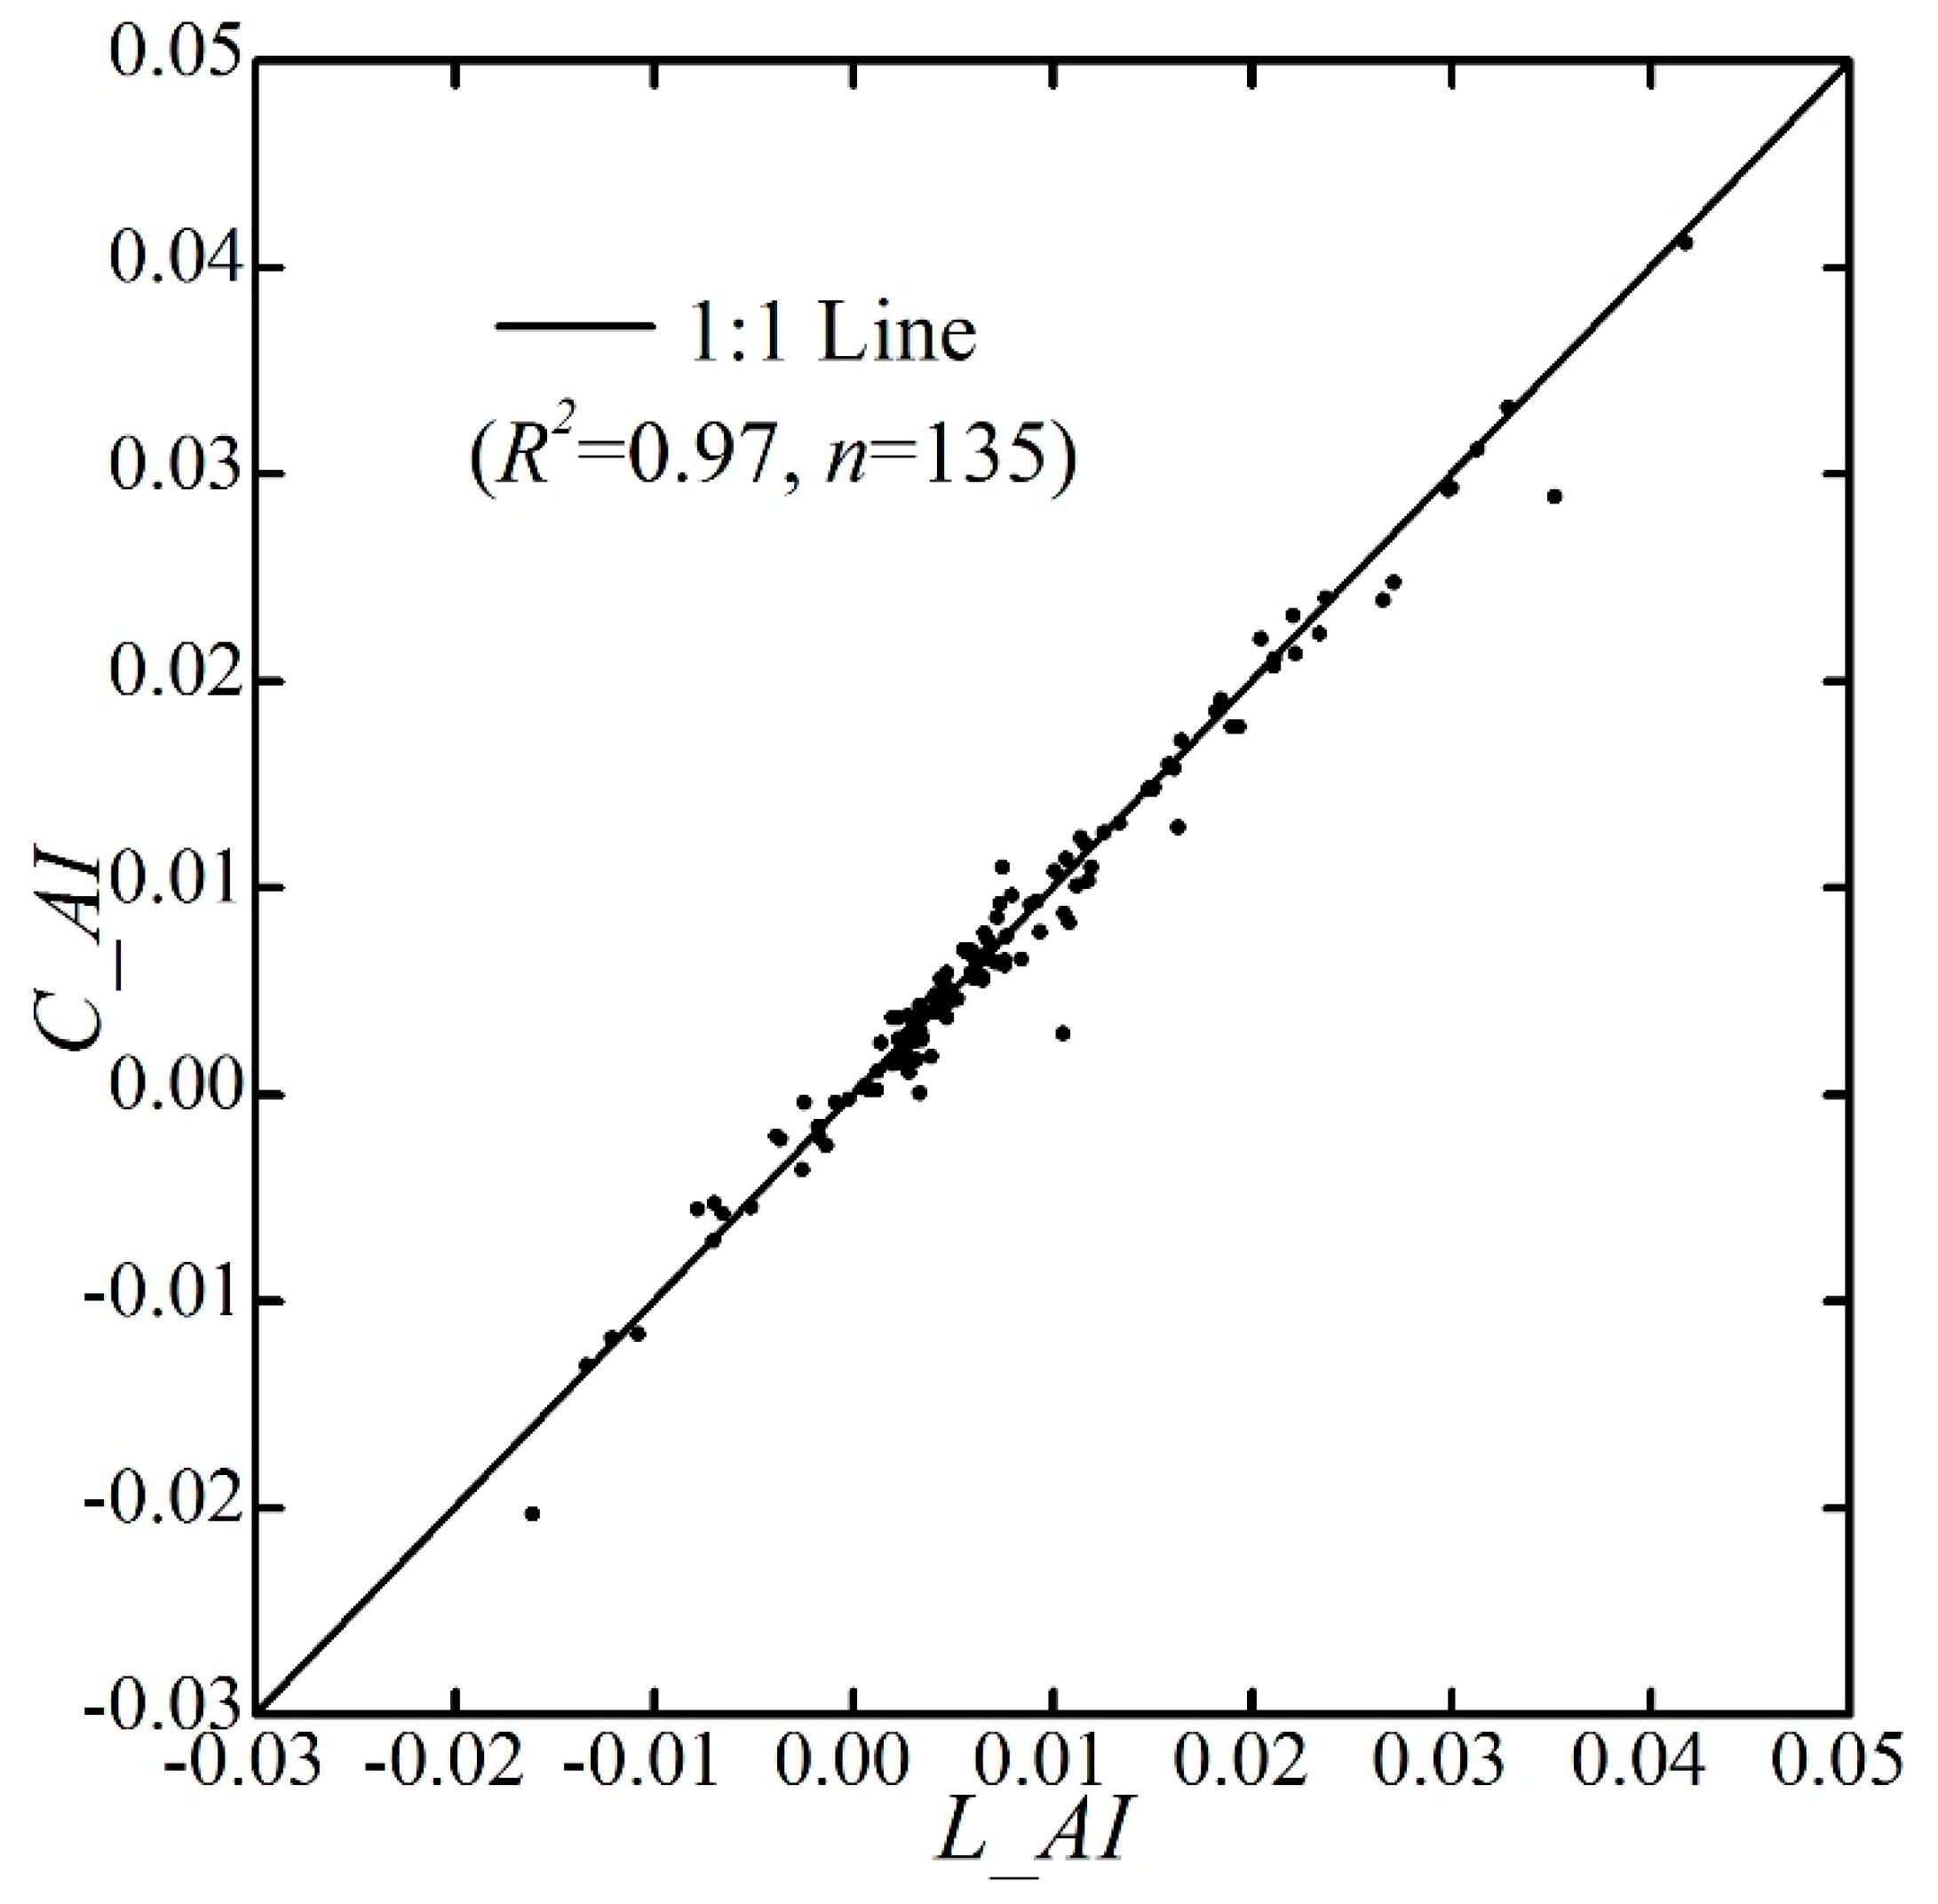
The contributions of climate variables to the change in AI are estimated based on Equations (7) and (8). The calculated annual AI trend (C_AI) overall fitted well (R2 = 0.97) with that detected by linear regression (L_AI) for the 135 stations during 1993–2015 (Figure 5). For the whole region, the error between C_AI and L_AI is 0.0002 with a relative error of −6.12%, which confirms that the method proposed in this study is effective within the acceptable systemic error in the differential process.
The change in Tmax, Tmin, ea, U2, and Rs lead to the changes in AI by 0.0019, 0.0004, 0.0001, 0.0003, and 0.0003 year−1, respectively. The combined effect of the five climate variables results in an increase in AI by 0.0030 year−1, which could be considered as the similar effect of ET0 change to AI, with a consideration relative error of 3.4%. The contribution of Pre to AI trend is 0.0021 year−1, and the six factors combined contribution on AI trend is 0.0051 year−1. The relative contribution of Pre, Tmax, Tmin, ea, U2, and Rs to the trend in AI are 38.98%, 36.26%, 8.49%, 2.27%, 4.83%, and 5.10%, respectively. The decrease in Pre dominates the increase in AI, followed by Tmax. However, if combined the Tmax and Tmin as annual average temperature (Ta), it would have larger contribution than Pre.
Generally, the climate condition for a special region is dominated by both energy balance and water balance [45,46,47]. In the humid regions, the climate is controlled by energy, namely energy limitation, and can be reflected by ET0 [48], while it is controlled by water limitation in the arid regions. In Southwest China, the annual precipitation is larger than ET0, with annual AI smaller than unity (Figure 4a), which indicates that it belonged to energy limitation. Therefore, it is reasonable that the contribution of ET0 to the change in AI is larger than that of Pre (Table 2). A similar conclusion is found in the arid region of the Northwest China: the increasing Pre contributed 91.7% of the decrease in the AI [22]. The increased air temperature and decreased precipitation are the key factors that dominated the variation of AI in this region. The trend of AI in 85 out of 135 stations (63%) is dominated by Pre while that in 50 out of 135 stations is dominated by Tmax.
5. Discussion
5.1. Uncertainties
Although the quality controls, including correction to the precipitation and optimized parameters for evaluating ET0, were carried out, uncertainties existed in this paper. First, when calculating the contribution of each climate variable to the change in AI, this analysis was based on the assumption that the six climate variables were independent in partial differential Equations (6) and (7). However, they actually interacted with each other. For example, the increase in precipitation would increase the vapor pressure and decrease temperature, and the change in solar radiation can alter energy input of land surface and further impact the temperature. The other uncertainties came from the difference of aridity and drought. The increase in AI can lead to aridification for a long time, but it cannot certainly increase drought. If the precipitation persistently decreases and increases in temperature, it would enhance the actual evapotranspiration (ETa) [44,49] and reduce the availability of water resource and might finally increase the probability of drought.
5.2. Impacts of Change in Aridity Index on Drought
The two key components of AI, precipitation and ET0, varied over recent years. Many studies reported that the precipitation showed a decreasing trend over Southwest China [6,50]. In this study, the precipitation was found decreased during the period of 1993–2015 (Table 2), particularly during 2000–2013 (−6.4 mm year−1, p < 0.05). The abrupt decrease in precipitation favored the intensification, such as severity, duration and extent, of the severe drought event for this area. Fortunately, the precipitation was larger for 2014 and 2015 (Figure 4a), which could mitigate the drought severity of 2009–2011 [12,51,52,53].
Moreover, the ET0 showed an increasing trend at the rate of 3.31 mm year−1 from 1993 to 2015, which indicated that the atmosphere needed more water to meet its evaporative demand [49]. If the precipitation continues to decrease in Southwest China, the climate will be more vulnerable to severe drought. The contribution of ET0 to the change in AI was greater than that of precipitation (Table 2), which indicated the ET0 will exert more effect on aridity trend, especially associating with the increase of ET0 and temperature in future [42,54,55,56]. Therefore, quantifying the contribution of ET0 to the change in AI would be benefit for understanding drought change.
5.3. Impact of Change in Aridity Index on Water Resource
The Pre and ET0, reflecting the availability water and energy, were also crucial variables in hydrological cycles [43,57]. According to the water balance, the multi-year streamflow R, without considering the water storage change [58,59], can be simply estimated by Equation (10):
while the ETa can be calculated by Equation (11) based on the Budyko framework [45,47,60].
In our study, the decreasing Pre and increasing ET0 lead to a significant increase in AI during 1993–2015 (Table 2). The increasing AI could further bring much more water evaporated into the atmosphere, and would finally reduce the streamflow in the river and impact the water availability of livelihood and crops. Investigation to the change in AI and the roles of climate variables could thus improve the capability of long-term streamflow forecasting, increase management efficiency of water resource and further guide to drought resistance and disaster reduction. Based on this initial work, ongoing research will expand our work to national scale. Investigating the AI variation in different climate regions (humid, arid, and transition regions) and quantifying the contribution of AI to streamflow will improve the prediction and management to water resource [59].
6. Conclusions
In this paper, the variation of the aridity index and the role of climate variables were investigated in Southwest China using the observed climate data from 135 national meteorological stations from 1993 to 2015. The annual AI increased significantly (p < 0.05) at the rate of 0.0053 year−1, and remarkable changed occurred around 2002. Particularly, about 84% of the 135 meteorological stations showed an increasing trend, and 24% were significant. The obvious increase in the aridity index indicated that Southwest China became drier over the last 20 years, which could impact regional water resources. The partial differential method was used to quantify the contribution of climate variables to the change in aridity index. The mean annual sensitivity coefficients of AI to Pre, Tmax, Tmin, ea, U2, and Rs were −1.00, 1.11, 0.19, −0.56, 0.10, and 0.33, respectively, which indicated that the aridity index was most sensitivity to Tmax, followed by Pre, ea, Rs, Tmin, and U2. The contribution of Pre, Tmax, Tmin, ea, U2, and Rs to the change in AI were 0.0021, 0.0019, 0.0004, 0.0001, 0.0003, and 0.0003, respectively. The combined contribution of six climate variables to AI is 0.0051. The increase in air temperature, which contributed to about 45% of the increase in the aridity index, was the dominant variable determining AI trends in Southwest China from 1993 to 2015. Relative to precipitation, the ET0 (57% contribution) played a more important role than precipitation (39% contribution) in dominating the trend in AI, which could potentially amplify drought duration and intensity.
Acknowledgments
This study was financially supported by the National Natural Science Foundation of China (No. 41701019, 51779099) and the Startup Foundation for Introducing Talent of NUIST. We greatly thank Xiaomang Liu for giving constructive suggestions towards the manuscript.
Author Contributions
Yanzhong Li performed the data processing and wrote the manuscript. Aiqing Feng provided the ideas and the data used in the manuscript. Wenbin Liu helped process the potential evapotranspiration and correct the precipitation. Xieyao Ma and Guotao Dong revised the language and provided financial support.
Conflicts of Interest
The authors declare no conflict of interest.
Notations
| AI | aridity index. |
| ET0 | potential evapotranspiration(mm). |
| Pre | precipitation (mm). |
| ETpan | pan evaporation (mm). |
| Tmax, Tmin, Ta | daily maximum, minimum and air temperature (°C). |
| Tmax,k, Tmin,k | daily maximum, minimum in kelvin temperature (°C). |
| es, ea | saturation and actual vapor pressure (kPa). |
| U2 | wind speed at 2 m (m s−1). |
| Pc | corrected precipitation. |
| Pg | precipitation measured from the gauge station. |
| ΔPw | wetting loss. |
| CR | ratio of gauge measured precipitation to the true precipitation. |
| G | soil heat flux density (MJ m−2 d−1). |
| Rs | incoming solar radiation (MJ m−2 d−1). |
| Rn | net radiation (MJ m−2 d−1). |
| Rns | net shortwave radiation (MJ m−2day−1). |
| Rnl | net long-wave radiation (MJ m−2day−1). |
| ∆ | slope of saturated vapor pressure (kPa °C−1). |
| γ | psychrometric constant (kPa °C−1). |
| α | albedo (α = 0.23). |
| n | actual duration of sunshine. |
| N | maximum possible duration of sunshine. |
| as, bs | parameters in calculating Rs (as = 0.25, bs = 0.50). |
| S(x) | sensitivity coefficient of AI to x variable. |
| L_AI | detected aridity index trend by linear regression. |
| C_AI | total contribution of variables. |
| ε | error between C_AI and L_AI. |
| RC(xi) | relative contribution of each climate variable. |
| Cr(xi) | contribution of each climate variable. |
| ETa | actual evapotranspiration. |
| R | streamflow. |
References
- Intergovernmental Panel on Climate Change (IPCC). Summary for Policymakes: The Physical Science Basis, Contribution of Working Group I to the IPCC Fifth Assessment Report Climate Change; IPCC: Geneva, Switzerland, 2013. [Google Scholar]
- Taufik, M.; Torfs, P.J.J.; Uijlenhoet, R.; Jones, P.D.; Murdiyarso, D.; van Lanen, H.A.J. Amplification of wildfire area burnt by hydrological drought in the humid tropics. Nat. Clim. Chang. 2017, 7, 428–431. [Google Scholar] [CrossRef]
- Donat, M.G.; Lowry, A.L.; Alexander, L.V.; O’Gorman, P.A.; Maher, N. More extreme precipitation in the world’s dry and wet regions. Nat. Clim. Chang. 2017, 7, 154–158. [Google Scholar] [CrossRef]
- Blöschl, G.; Hall, J.; Parajka, J.; Perdigão, R.A.P.; Merz, B.; Arheimer, B.; Aronica, G.T.; Bilibashi, A.; Bonacci, O.; Borga, M.; et al. Changing climate shifts timing of European floods. Science 2017, 357, 588–590. [Google Scholar] [CrossRef] [PubMed]
- Schwalm, C.R.; Anderegg, W.R.L.; Michalak, A.M.; Fisher, J.B.; Biondi, F.; Koch, G.; Litvak, M.; Ogle, K.; Shaw, J.D.; Wolf, A.; et al. Global patterns of drought recovery. Nature 2017, 548, 202–205. [Google Scholar] [CrossRef] [PubMed]
- Sun, S.; Chen, H.; Ju, W.; Wang, G.; Sun, G.; Huang, J.; Ma, H.; Gao, C.; Hua, W.; Yan, G. On the coupling between precipitation and potential evapotranspiration: Contributions to decadal drought anomalies in the Southwest China. Clim. Dyn. 2016, 11–12, 1–19. [Google Scholar] [CrossRef]
- Cook, B.I.; Ault, T.R.; Smerdon, J.E. Unprecedented 21st century drought risk in the American Southwest and Central Plains. Sci. Adv. 2015, 1, e1400082. [Google Scholar] [CrossRef] [PubMed]
- Li, B.; Su, H.; Chen, F.; Wu, J.; Qi, J. The changing characteristics of drought in China from 1982 to 2005. Nat. Hazards 2013, 68, 723–743. [Google Scholar] [CrossRef]
- Liu, X.; Luo, Y.; Yang, T.; Liang, K.; Zhang, M.; Liu, C. Investigation of the probability of concurrent drought events between the water source and destination regions of China’s water diversion project. Geophys. Res. Lett. 2015, 42, 8424–8431. [Google Scholar] [CrossRef]
- Xu, K.; Yang, D.; Yang, H.; Li, Z.; Qin, Y.; Shen, Y. Spatio-temporal variation of drought in China during 1961–2012: A climatic perspective. J. Hydrol. 2015, 526, 253–264. [Google Scholar] [CrossRef]
- Long, D.; Shen, Y.; Sun, A.; Hong, Y.; Longuevergne, L.; Yang, Y.; Li, B.; Chen, L. Drought and flood monitoring for a large karst plateau in Southwest China using extended GRACE data. Remote Sens. Environ. 2014, 155, 145–160. [Google Scholar] [CrossRef]
- Zhang, W.; Jin, F.-F.; Zhao, J.-X.; Qi, L.; Ren, H.-L. The Possible Influence of a Nonconventional El Niño on the Severe Autumn Drought of 2009 in Southwest China. J. Clim. 2013, 26, 8392–8405. [Google Scholar] [CrossRef]
- United Nations Educational, Scientific and Cultural Organization (UNESCO). Map of the World Distribution of Arid Regions: Explanatory Note; MAB Technical Notes; UNESCO: Paris, France, 1979. [Google Scholar]
- Food and Agriculture Organization (FAO). Arid Zone Forestry: A Guide for Field Technicians; FAO: Rome, Italy, 1989. [Google Scholar]
- Maliva, R.; Missimer, T. Arid Lands Water Evaluation and Management; Springer Science & Business Media: Berlin/Heidelberg, Germany, 2012. [Google Scholar]
- Huo, Z.; Dai, X.; Feng, S.; Kang, S.; Huang, G. Effect of climate change on reference evapotranspiration and aridity index in arid region of China. J. Hydrol. 2013, 492, 24–34. [Google Scholar] [CrossRef]
- Zhang, Y.; Liu, C.; Tang, Y.; Yang, Y. Trends in pan evaporation and reference and actual evapotranspiration across the Tibetan Plateau. J. Geophys. Res. Atmos. 2007, 112, 113–120. [Google Scholar] [CrossRef]
- Allen, R.G.; Pereira, L.S.; Raes, D.; Smith, M. Crop Evapotranspiration—Guidelines for Computing Crop Water Requirements; FAO Irrigation and Drainage Paper 56; FAO: Rome, Italy, 1998. [Google Scholar]
- Türkeş, M. Spatial and temporal variations in precipitation and aridity index series of Turkey. In Mediterranean Climate; Springer: Berlin/Heidelberg, Germany, 2003; pp. 181–213. [Google Scholar]
- Nastos, P.T.; Politi, N.; Kapsomenakis, J. Spatial and temporal variability of the Aridity Index in Greece. Atmos. Res. 2013, 119, 140–152. [Google Scholar] [CrossRef]
- Tabari, H.; Aghajanloo, M.-B. Temporal pattern of aridity index in Iran with considering precipitation and evapotranspiration trends. Int. J. Climatol. 2013, 33, 396–409. [Google Scholar] [CrossRef]
- Liu, X.; Zhang, D.; Luo, Y.; Liu, C. Spatial and temporal changes in aridity index in northwest China: 1960 to 2010. Theor. Appl. Climatol. 2013, 112, 307–316. [Google Scholar] [CrossRef]
- Zhang, Q.; Xu, C.-Y.; Zhang, Z. Observed changes of drought/wetness episodes in the Pearl River basin, China, using the standardized precipitation index and aridity index. Theor. Appl. Climatol. 2009, 98, 89–99. [Google Scholar] [CrossRef]
- Vicente-Serrano, S.M.; van der Schrier, G.; Beguería, S.; Azorin-Molina, C.; Lopez-Moreno, J.-I. Contribution of precipitation and reference evapotranspiration to drought indices under different climates. J. Hydrol. 2015, 526, 42–54. [Google Scholar] [CrossRef]
- Liu, X.; Luo, Y.; Zhang, D.; Zhang, M.; Liu, C. Recent changes in pan-evaporation dynamics in China. Geophys. Res. Lett. 2011, 38, 142–154. [Google Scholar] [CrossRef]
- McVicar, T.R.; Roderick, M.L.; Donohue, R.J.; Li, L.T.; van Niel, T.G.; Thomas, A.; Grieser, J.; Jhajharia, D.; Himri, Y.; Mahowald, N.M. Global review and synthesis of trends in observed terrestrial near-surface wind speeds: Implications for evaporation. J. Hydrol. 2012, 416, 182–205. [Google Scholar] [CrossRef]
- Liu, C.; Zhang, D.; Liu, X.; Zhao, C. Spatial and temporal change in the potential evapotranspiration sensitivity to meteorological factors in China (1960–2007). J. Geogr. Sci. 2012, 22, 3–14. [Google Scholar] [CrossRef]
- Liu, X.; Zhang, D. Trend analysis of reference evapotranspiration in Northwest China: The roles of changing wind speed and surface air temperature. Hydrol. Process. 2013, 27, 3941–3948. [Google Scholar] [CrossRef]
- Li, Y.; Liang, K.; Bai, P.; Feng, A.; Liu, L.; Dong, G. The spatiotemporal variation of reference evapotranspiration and the contribution of its climatic factors in the Loess Plateau, China. Environ. Earth Sci. 2016, 75, 1–14. [Google Scholar] [CrossRef]
- Yu, M.; Li, Q.; Hayes, M.J.; Svoboda, M.D.; Heim, R.R. Are droughts becoming more frequent or severe in China based on the Standardized Precipitation Evapotranspiration Index: 1951–2010? Int. J. Climatol. 2014, 34, 545–558. [Google Scholar] [CrossRef]
- Yao, F.; Xu, Y.; Lin, E.; Yokozawa, M.; Zhang, J. Assessing the impacts of climate change on rice yields in the main rice areas of China. Clim. Chang. 2007, 80, 395–409. [Google Scholar] [CrossRef]
- World Meteorological Organization (WMO). Guide to Meteorological Instruments and Methods of Observation, 6th ed.; World Meteorological Organization: Geneva, Switzerland, 1996. [Google Scholar]
- Liu, X.; Liu, C.; Brutsaert, W. Regional evaporation estimates in the eastern monsoon region of China: Assessment of a nonlinear formulation of the complementary principle. Water Resour. Res. 2016, 52. [Google Scholar] [CrossRef]
- Goodison, B.; Sevruk, B.; Klemm, S. WMO solid precipitation measurement intercomparison: Objectives, methodology, analysis. Atmos. Depos. 1989, 179, 57–64. [Google Scholar]
- Yang, D.; Goodison, B.E.; Metcalfe, J.R.; Louie, P.; Leavesley, G.; Emerson, D.; Hanson, C.L.; Golubev, V.S.; Elomaa, E.; Gunther, T.; et al. Quantification of precipitation measurement discontinuity induced by wind shields on national gauges. Water Resour. Res. 1999, 35, 491–508. [Google Scholar] [CrossRef]
- Liu, X.; Yang, T.; Hsu, K.; Liu, C.; Sorooshian, S. Evaluating the streamflow simulation capability of PERSIANN-CDR daily rainfall products in two river basins on the Tibetan Plateau. Hydrol. Earth Syst. Sci. 2017, 21, 169–181. [Google Scholar] [CrossRef]
- Sevruk, B.; Hamon, W. International Comparison of National Precipitation Gauges with a Reference Pit Gauge; Instruments and Observing Methods Report; Secretariat of the World Meteorological Organization: Geneva, Switzerland, 1984. [Google Scholar]
- Wang, T.; Zhang, J.; Sun, F.; Liu, W. Pan evaporation paradox and evaporative demand from the past to the future over China: A review. Wiley Interdiscip. Rev. Water 2017, 4, e1207. [Google Scholar] [CrossRef]
- McCuen, R.H. A Sensitivity and Error Analysis Cf Procedures Used For Estimating Evaporation1. JAWRA J. Am. Water Resour. Assoc. 1974, 10, 486–497. [Google Scholar] [CrossRef]
- Kendall, M.G. Rank Correlation Methods; Charles Griffin: London, UK, 1948. [Google Scholar]
- Zheng, H.; Liu, X.; Liu, C.; Dai, X.; Zhu, R. Assessing contributions to panevaporation trends in Haihe River Basin, China. J. Geophys. Res. Atmos. 2009, 114, D24105. [Google Scholar] [CrossRef]
- Zhang, D.; Liu, X.; Hong, H. Assessing the effect of climate change on reference evapotranspiration in China. Stoch. Environ. Res. Risk Assess. 2013, 27, 1871–1881. [Google Scholar] [CrossRef]
- Li, Y.; Liu, C.; Zhang, D.; Liang, K.; Li, X.; Dong, G. Reduced Runoff Due to Anthropogenic Intervention in the Loess Plateau, China. Water 2016, 8, 458. [Google Scholar] [CrossRef]
- Li, Y.; Liang, K.; Liu, C.; Liu, W.; Bai, P. Evaluation of different evapotranspiration products in the middle Yellow River Basin, China. Hydrol. Res. 2016, 47. [Google Scholar] [CrossRef]
- Budyko, M.I. Evaporation under Natural Conditions; Gidrometeoizdat: Leningrad, Russia, 1963. [Google Scholar]
- Huang, S.; Huang, Q.; Leng, G.; Zhao, M.; Meng, E. Variations in annual water-energy balance and their correlations with vegetation and soil moisture dynamics: A case study in the Wei River Basin, China. J. Hydrol. 2017, 546, 515–525. [Google Scholar] [CrossRef]
- Baw-Puh, F. On the calculation of the evaporation from land surface. Chin. J. Atmos. Sci. 1981, 5, 23–31. [Google Scholar]
- Zhang, Y.; Chiew, F.H.S.; Peña-Arancibia, J.; Sun, F.; Li, H.; Leuning, R. Global variation of transpiration and soil evaporation and the role of their major climate drivers. J. Geophys. Res. Atmos. 2017, 122, 6868–6881. [Google Scholar] [CrossRef]
- Brutsaert, W. Evaporation into the Atmosphere: Theory, History and Applications; Springer Science & Business Media: Berlin/Heidelberg, Germany, 1982; Volume 1. [Google Scholar]
- Tan, L.; Cai, Y.; An, Z.; Cheng, H.; Shen, C.; Gao, Y.; Edwards, R.L. Decreasing monsoon precipitation in southwest China during the last 240 years associated with the warming of tropical ocean. Clim. Dyn. 2017, 48, 1769–1778. [Google Scholar] [CrossRef]
- Qiu, J. China Drought Highlights Future Climate Threats; Nature Publishing Group: London, UK, 2010. [Google Scholar]
- Zhang, L.; Xiao, J.; Li, J.; Wang, K.; Lei, L.; Guo, H. The 2010 spring drought reduced primary productivity in southwestern China. Environ. Res. Lett. 2012, 7, 045706. [Google Scholar] [CrossRef]
- Hou, W.; Gao, J.; Wu, S.; Dai, E. Interannual Variations in Growing-Season NDVI and Its Correlation with Climate Variables in the Southwestern Karst Region of China. Remote Sens. 2015, 7, 11105–11124. [Google Scholar] [CrossRef]
- Henley, B.J.; King, A.D. Trajectories toward the 1.5 °C Paris target: Modulation by the Interdecadal Pacific Oscillation. Geophys. Res. Lett. 2017, 44, 4256–4262. [Google Scholar] [CrossRef]
- King, A.D.; Karoly, D.J.; Henley, B.J. Australian climate extremes at 1.5[thinsp][deg]C and 2[thinsp][deg]C of global warming. Nat. Clim. Chang. 2017, 7, 412–416. [Google Scholar] [CrossRef]
- Mitchell, D.; James, R.; Forster, P.M.; Betts, R.A.; Shiogama, H.; Allen, M. Realizing the impacts of a 1.5 [deg]C warmer world. Nat. Clim. Chang. 2016, 6, 735–737. [Google Scholar] [CrossRef]
- Roderick, M.L.; Farquhar, G.D. A simple framework for relating variations in runoff to variations in climatic conditions and catchment properties. Water Resour. Res. 2011, 47. [Google Scholar] [CrossRef]
- Hobbins, M.T.; Ramírez, J.A.; Brown, T.C. The complementary relationship in estimation of regional evapotranspiration: An enhanced advection-aridity model. Water Resour. Res. 2001, 37, 1389–1403. [Google Scholar] [CrossRef]
- Liu, X.; Liu, W.; Xia, J. Comparison of the streamflow sensitivity to aridity index between the Danjiangkou Reservoir basin and Miyun Reservoir basin, China. Theor. Appl. Climatol. 2013, 111, 683–691. [Google Scholar] [CrossRef]
- Choudhury, B. Evaluation of an empirical equation for annual evaporation using field observations and results from a biophysical model. J. Hydrol. 1999, 216, 99–110. [Google Scholar] [CrossRef]
Figure 1.
Location of the Southwest China.

Figure 2.
(a) Mean values of catch ratio (CR) of the gauge measured precipitation to the corrected precipitation in Southwest China and (b) the difference of gauge records with corrected records from 1993 to 2015.
Figure 2.
(a) Mean values of catch ratio (CR) of the gauge measured precipitation to the corrected precipitation in Southwest China and (b) the difference of gauge records with corrected records from 1993 to 2015.

Figure 3.
Spatial pattern of optimized annual average as and bs for calculating solar radiation in Southwest China from 1993 to 2015. (a) The distribution of parameter of optimized as and (b) bs.
Figure 3.
Spatial pattern of optimized annual average as and bs for calculating solar radiation in Southwest China from 1993 to 2015. (a) The distribution of parameter of optimized as and (b) bs.
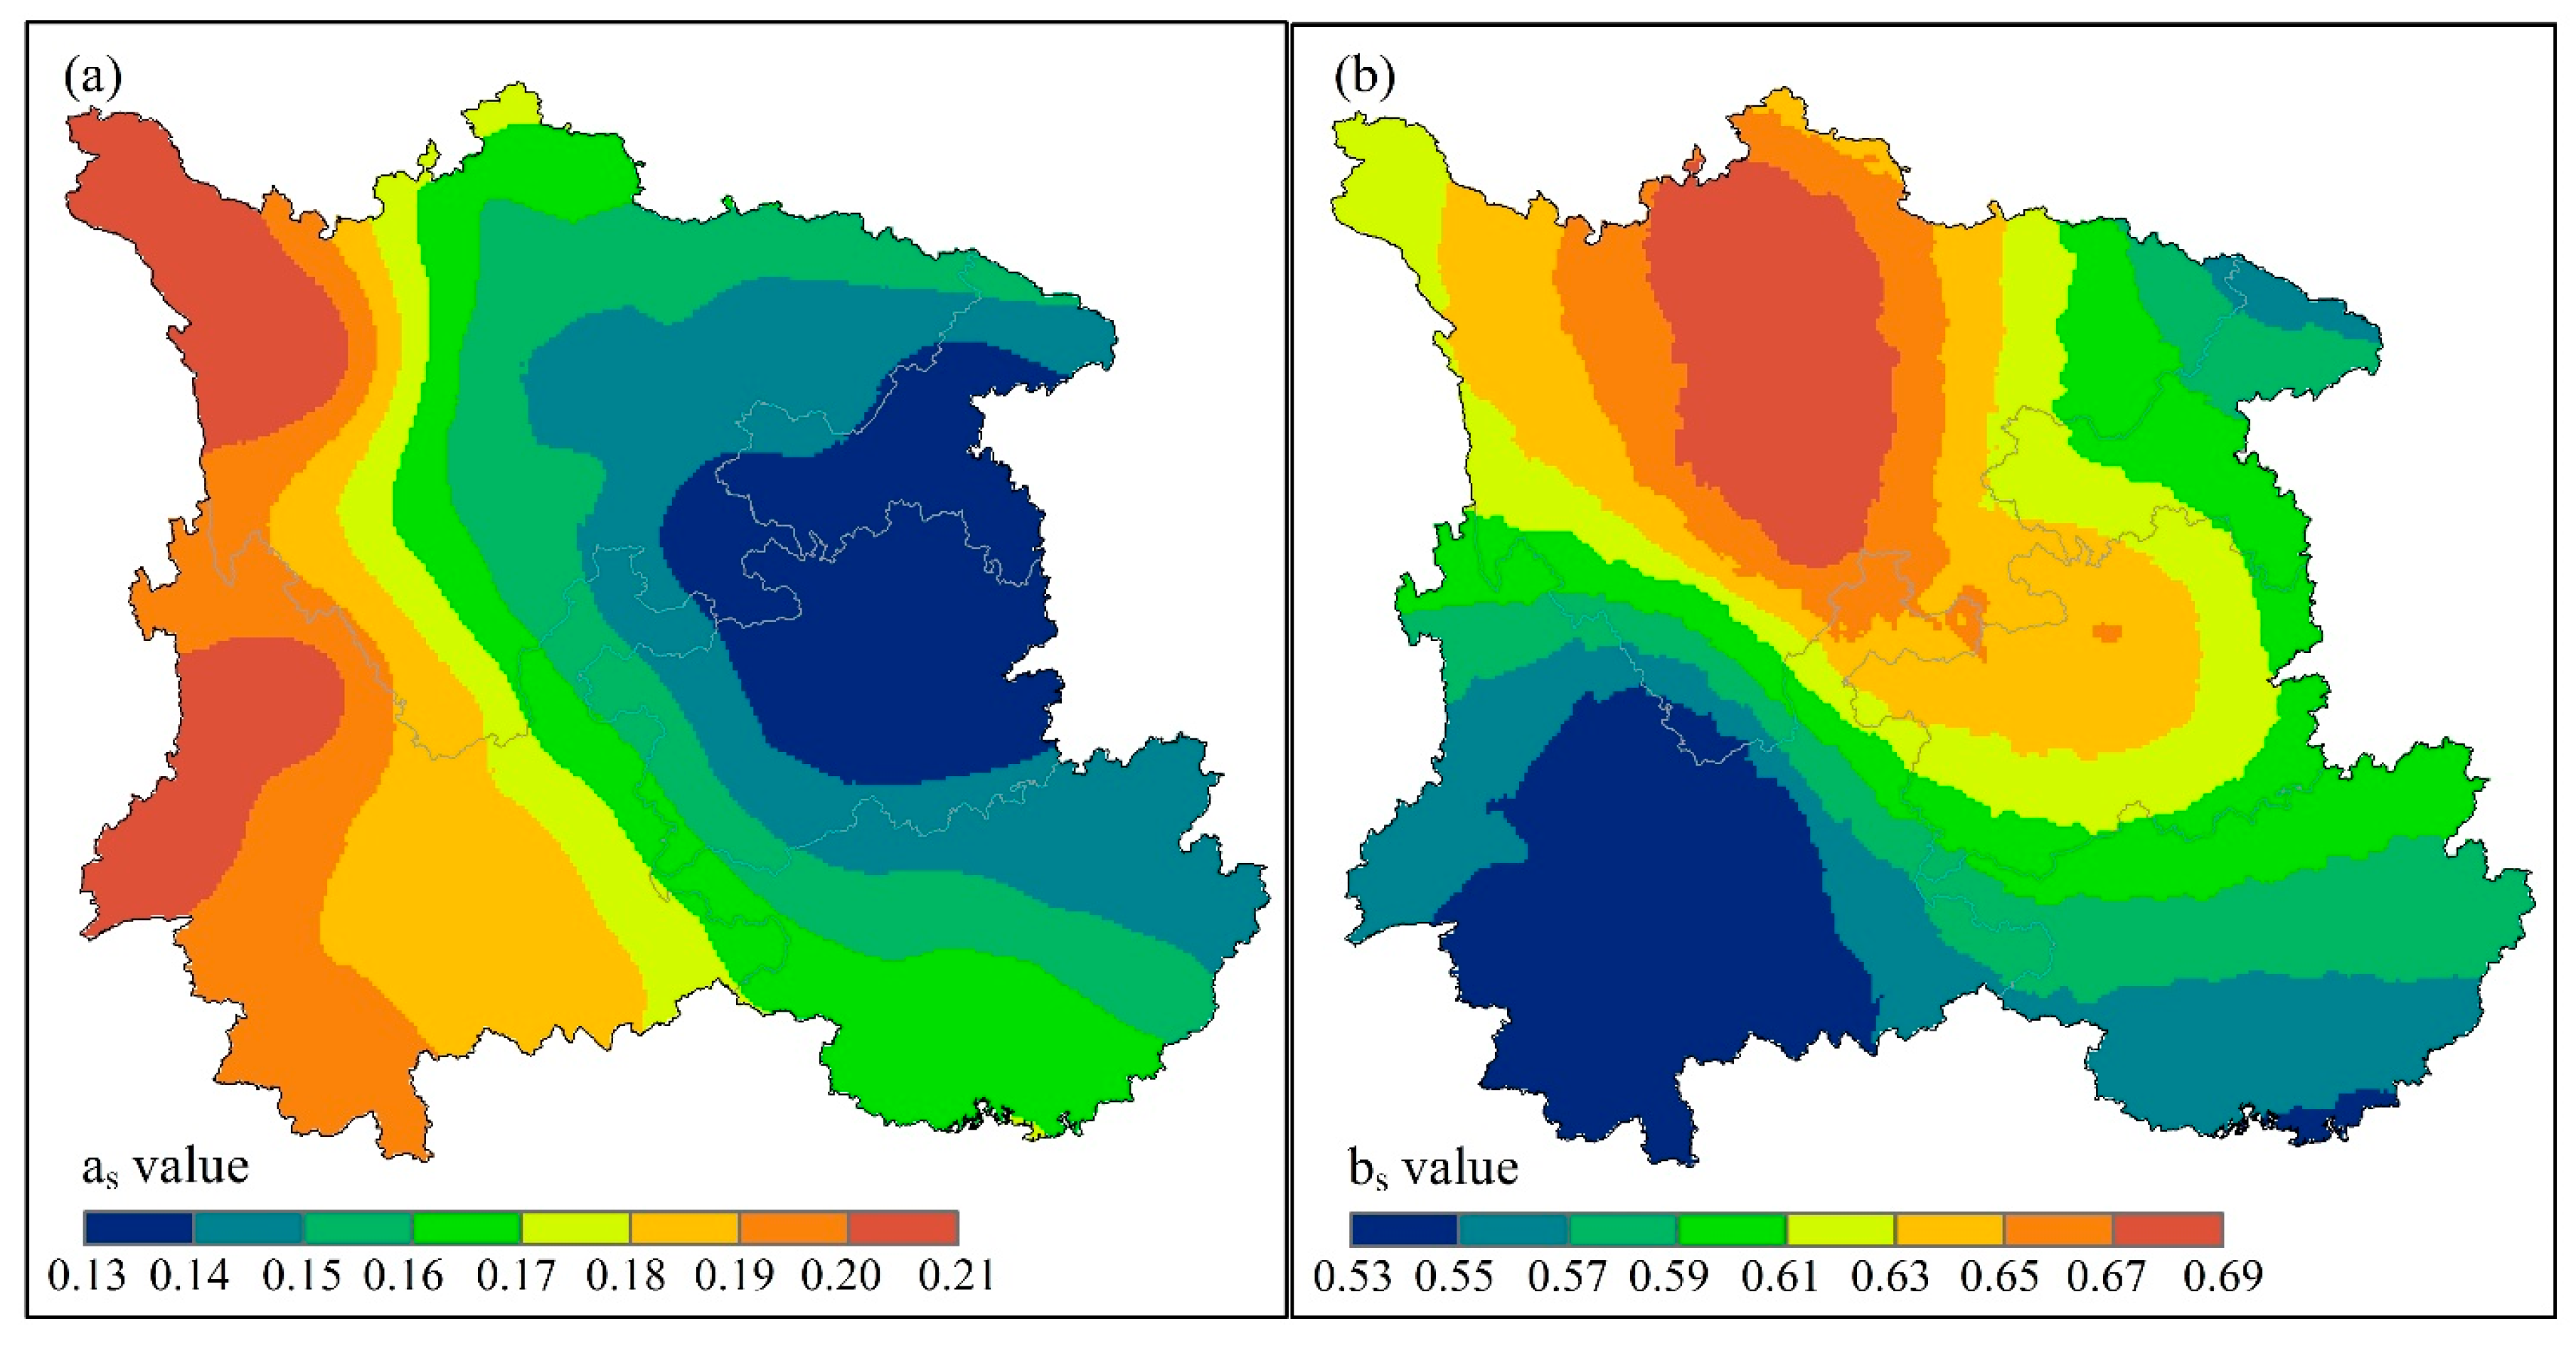
Figure 4.
(a) Variation of aridity index in Southwest China from 1993 to 2015. The black dot line is the five-year moving average, the gray line is the linear trend fitted, and the bars are annual precipitation. (b) Spatial distribution of significance level in aridity index for the 135 meteorological stations. Red triangles indicates an increasing trend, while blue inverted triangles indicates decrease trend; S and NS in the legend indicate significant and insignificant at p = 0.05, respectively. The number after S or NS means the count of stations out of 135 stations in each category.

Figure 5.
Comparison between the calculated annual aridity index trend (C_AI) and the detected aridity index trend by linear regression (L_AI) for the 135 meteorological stations in Southwest China from 1993 to 2015.
Figure 5.
Comparison between the calculated annual aridity index trend (C_AI) and the detected aridity index trend by linear regression (L_AI) for the 135 meteorological stations in Southwest China from 1993 to 2015.


Table 1.
Partial derivative formulas of aridity index to the climate variables.
| Differential Items | Formula |
|---|---|
Table 2.
Contribution of climate variables to the trends in annual aridity in Southwest China from 1993 to 2015.
Table 2.
Contribution of climate variables to the trends in annual aridity in Southwest China from 1993 to 2015.
| Pre | Tmax | Tmin | ea | U2 | Rs | ET0 | AI | ρ(ε)% | |
|---|---|---|---|---|---|---|---|---|---|
| Trend | −2.9474 | 0.0460 ** | 0.0346 ** | −0.0004 | 0.0039 | 0.0127 | 3.3135 | 0.0053 * | - |
| −0.0007 | 0.0416 | 0.0129 | −0.2769 | 0.0656 | 0.0211 | 0.0009 | - | - | |
| S(xi) | −1.00 | 1.11 | 0.19 | −0.56 | 0.10 | 0.33 | 1.00 | ||
| Cr(xi) | 0.0021 | 0.0019 | 0.0004 | 0.0001 | 0.0003 | 0.0003 | 0.0029 | - | −6.12 |
| RC(xi) | 38.98 | 36.26 | 8.49 | 2.27 | 4.83 | 5.10 | 56.95 | 95.93 | - |
Note: * significant at the 0.1 level, ** significant at the 0.01 level.
© 2017 by the authors. Licensee MDPI, Basel, Switzerland. This article is an open access article distributed under the terms and conditions of the Creative Commons Attribution (CC BY) license (http://creativecommons.org/licenses/by/4.0/).
Share and Cite
MDPI and ACS Style
Li, Y.; Feng, A.; Liu, W.; Ma, X.; Dong, G. Variation of Aridity Index and the Role of Climate Variables in the Southwest China. Water 2017, 9, 743. https://doi.org/10.3390/w9100743
AMA Style
Li Y, Feng A, Liu W, Ma X, Dong G. Variation of Aridity Index and the Role of Climate Variables in the Southwest China. Water. 2017; 9(10):743. https://doi.org/10.3390/w9100743
Chicago/Turabian StyleLi, Yanzhong, Aiqing Feng, Wenbin Liu, Xieyao Ma, and Guotao Dong. 2017. "Variation of Aridity Index and the Role of Climate Variables in the Southwest China" Water 9, no. 10: 743. https://doi.org/10.3390/w9100743
Note that from the first issue of 2016, this journal uses article numbers instead of page numbers. See further details here.