Article

Uncertainty of the Soil–Water Characteristic Curve and Its Effects on Slope Seepage and Stability Analysis under Conditions of Rainfall Using the Markov Chain Monte Carlo Method

1
School of Civil Engineering and Architecture, Nanchang University, Nanchang 330031, China
2
School of Civil Engineering and Architecture, Jiangxi Science and Technology Normal University, Nanchang 330013, China
3
School of Civil Engineering and Architecture, Nanchang Institute of Technology, Nanchang 330099, China
*
Author to whom correspondence should be addressed.
Water 2017, 9(10), 758; https://doi.org/10.3390/w9100758
Submission received: 25 August 2017 / Revised: 20 September 2017 / Accepted: 29 September 2017 / Published: 9 October 2017

Abstract

:
It is important to determine the soil–water characteristic curve (SWCC) for analyzing slope seepage and stability under the conditions of rainfall. However, SWCCs exhibit high uncertainty because of complex influencing factors, which has not been previously considered in slope seepage and stability analysis under conditions of rainfall. This study aimed to evaluate the uncertainty of the SWCC and its effects on the seepage and stability analysis of an unsaturated soil slope under conditions of rainfall. The SWCC model parameters were treated as random variables. An uncertainty evaluation of the parameters was conducted based on the Bayesian approach and the Markov chain Monte Carlo (MCMC) method. Observed data from granite residual soil were used to test the uncertainty of the SWCC. Then, different confidence intervals for the model parameters of the SWCC were constructed. The slope seepage and stability analysis under conditions of rainfall with the SWCC of different confidence intervals was investigated using finite element software (SEEP/W and SLOPE/W). The results demonstrated that SWCC uncertainty had significant effects on slope seepage and stability. In general, the larger the percentile value, the greater the reduction of negative pore-water pressure in the soil layer and the lower the safety factor of the slope. Uncertainties in the model parameters of the SWCC can lead to obvious errors in predicted pore-water pressure profiles and the estimated safety factor of the slope under conditions of rainfall.

1. Introduction

The soil–water characteristic curve (SWCC) is one of the fundamental elements used to describe unsaturated soil. It plays an important role in reflecting the hydraulic and mechanical characteristics of unsaturated soil, such as its water storage capacity, permeability coefficient, and strength characteristics [1,2,3]. The SWCC describes a relationship between water content or degree of saturation and suction in the soil. It is influenced by many complex factors such as initial water content [4,5], particle size distribution [6,7], stress state [8], and temperature [9]. The initial water content and grain-size distribution will influence the initial portion and slope, respectively. The net vertical stress and temperature will influence the air-entry value of the SWCC. The SWCC is also affected by the number of samples, the predicting model and the model parameters estimation method [10,11], and hence the SWCC model parameters are subject to high uncertainty [12,13]. A better estimation of SWCC is expected for a given soil class through statistical analysis of SWCC distribution, where the model parameters can be regarded as random variables [14,15]. Mishra et al. [16] evaluated the uncertainty in SWCC model parameters using the first-order error analysis method. Phoon et al. [17] used the four-term Hermite expansions to carry out an uncertainty analysis of the SWCC. Zhai and Rahardjo [18] developed equations for the confidence limits of the best-fitted SWCC to quantify the uncertainties. Uncertainty of the model parameters of the SWCC is usually represented by probability distributions reflecting the objective uncertainty of the parameters. However, the confidence interval of the SWCC has not been considered in traditional uncertainty analysis. In turn, the confidence interval of the SWCC has received little attention in engineering applications, especially in the seepage and stability analysis of unsaturated soil slopes under the conditions of rainfall.
The uncertainty of model parameters plays a leading role in uncertainty analysis when the structure of the SWCC can reasonably reflect the characteristics of soil water and the accuracy of the measured data is high. A lot of attention has been focused on this kind of uncertainty analysis [19,20]. Furthermore, it can be performed using a Bayesian approach in which uncertain parameters are described by a known probability distribution. The Markov chain Monte Carlo (MCMC) method [21] can effectively solve the posterior distribution, and it has greatly promoted the application of the Bayesian approach. At present, the MCMC method has been applied to analyzing the uncertainties in different research fields, such as flood frequency analysis [22], the ultimate capacity of piles [23], shear strength [24], and the consolidation coefficient [25]. Estimation of the parameters (including SWCC model parameters) under certain confidence levels can also be carried out by the MCMC method.
The SWCC is a crucial input for modeling geotechnical engineering. The success of numerical simulations for the seepage and stability of an unsaturated soil slope under rainfall greatly depends on the reliability of the SWCC [26]. Zhang et al. [27] discussed the influence of the shape of the SWCC on pore-water pressure distribution in a slope by varying the model parameters of the SWCC. Rahimi et al. [26] and Dong et al. [28] investigated the effects of soil hydraulic properties on rainfall-induced slope failure by considering one model parameter of the SWCC, while other model parameters were kept constant. Previous studies on model parameters of the SWCC can be considered as sensitivity analysis. Until now, the effects of model parameters of the SWCC have been investigated separately, even though rainfall is recognized as the main triggering factor for slope failure [29,30,31,32]. Therefore, there is a lack of knowledge on the effect of SWCC uncertainty on slope seepage and stability analysis.
This paper focuses on the uncertainty of the SWCC and its effects on the seepage and the stability of a soil slope subjected to rainfall. First, Bayesian analysis was applied to derive the probability density function of the model parameters of the SWCC using the test data of the granite residual soil. Second, the uncertain estimation of model parameters of the SWCC was performed using the MCMC method. Finally, the SWCC with different confidence intervals obtained by uncertain estimation was used as input data for slope seepage and stability analysis in the SEEP/W and SLOPE/W software.

2. Materials

2.1.Test Data of the Soil–Water Characteristic Curve

In this paper, the uncertainty analysis was conducted on data of granite residual soil collected from Yudu in Jiangxi Province, China. Yudu is hilly and has undergone serious collapsing erosion. Granite residual soil is distributed widely. Samples of the granite residual soil were taken from open pits excavated to a depth of 0.5 m below ground surface. Dry-sieving analysis was performed, and the grain-size distribution is shown in Figure 1. The soil had a liquid limit of 40%, a plastic limit of 27.5%, a plasticity index of 12.5, a specific gravity of 2.73, and a maximum dry density of 1.76 g/cm3. These soil properties were measured for the granite residual soil using standard soil test methods (State Standard of the People’s Republic of China).
The soil particles were first sieved with a sieve of 2-mm aperture size, and particles with a dimension larger than 2 mm were discarded. The experimental specimens were prepared for dry densities of 1.45 g/cm3, 1.50 g/cm3, 1.55 g/cm3, 1.60 g/cm3, 1.65 g/cm3. The particles (which were also sieved with sieves of 0.5 mm and 1 mm aperture size, respectively) were made into soil specimens with a dry density of 1.60 g/cm3. The SWCCs were measured by means of a pressure plate extractor (GEO-Experts) that realized the soil specimen drying or wetting process by increasing or decreasing the matrix suction, which was based on the axis translation technique. Soil specimens were prepared using a cutting ring of 70 mm in diameter and 19 mm in height. The soil specimens were remolded. The SWCCs were measured following the drying path in the suction range of 0–400 kPa. Seven soil samples in total were used in the study. Among them, 49 suction-degree of saturation pairs were obtained, and are plotted in Figure 2. The details of fitting SWCC using optimal model parameters in Figure 2 are presented in Section 4.1.

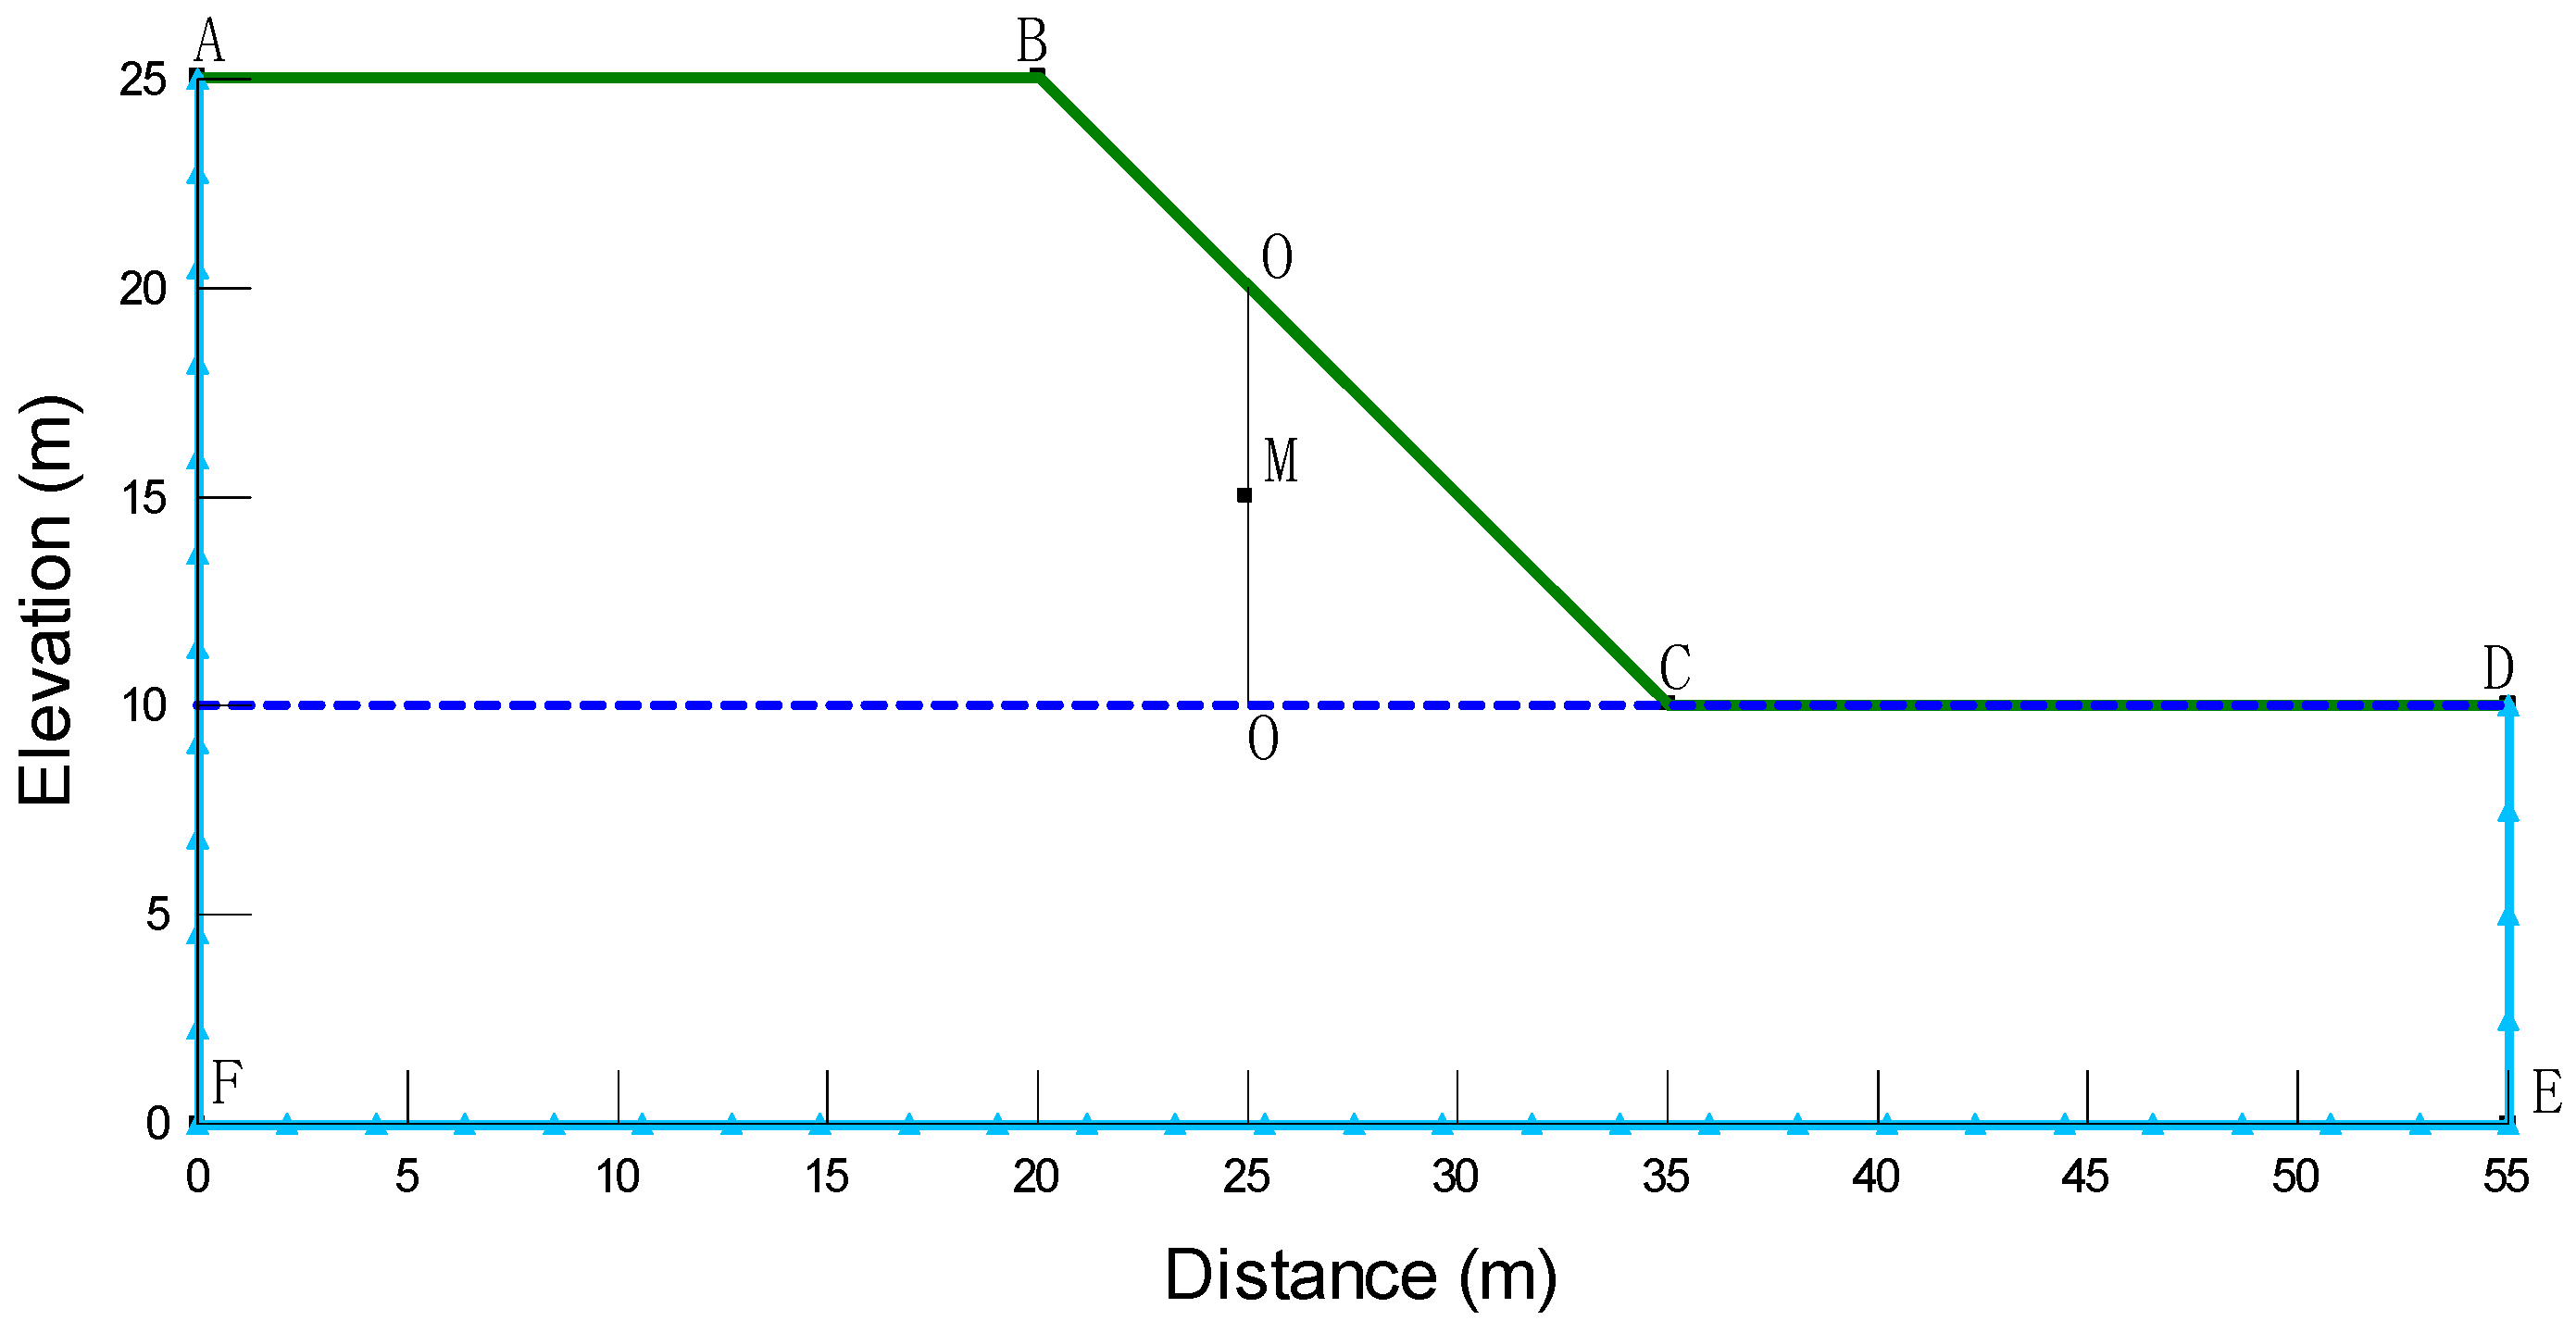
2.2. Slope Properties

The slope shown in Figure 3 was used in this study. The slope material was characterized by the granite residual soil, and the geometry and boundary conditions of the homogeneous slope are also presented in Figure 3. The slope had a height of 15 m and a slope angle of 45°. The boundary flux (equal to rainfall intensity) was applied to the slope surface. It was assumed that rainfall intensity was less than the saturated permeability coefficient. As rainfall is completely infiltrated into the soil, the flow boundary condition was adopted for the infiltration boundary of the slope surface and was assumed to be equal to rainfall intensity. A zero-flux boundary was applied along the sides of the slope above the groundwater table and along the bottom of the slope to simulate the on-flow zone. Constant head was applied along the left and right sides of the slope below the groundwater table. The groundwater table was at the foot of the slope. The base of the slope was assumed to be impermeable. Section O–O was at the height of 10 m of the slope. The point M at the selected section O–O was at a height of 3 m of the slope. The pore-water pressure profiles at section O–O are presented to illustrate the conditions under which suction was maintained. The values of the following parameters were adopted: the dry density of soil at 1.60 g/cm3, the unit weight at 18.5 KN/m3, the saturated permeability coefficient at 2.5 × 10⁻⁶ m/s, the saturated volumetric water content at 0.488, the effective cohesion at 18 kPa, and the angle of shearing resistance at 30°.

3.Methods

The model parameters of the SWCC were regarded as random variables. The uncertainty analysis of the SWCC was performed for the granite residual soil using the Bayesian approach. The posterior distributions of model parameters were sampled by the MCMC method, with delayed rejection adaptive metropolis (DRAM). Then, the different confidence intervals of the SWCC and the corresponding model parameters were obtained. Finally, the homogeneous soil slope (shown in Figure 3) was taken as an example, and the influence of the uncertainty of the SWCC on the seepage and stability analysis of the unsaturated soil slope under rainfall was analyzed.

3.1. SWCC Model

Many mathematical models have been proposed to fit the SWCC [33,34,35,36,37]. In this paper, the Van Genuchten model [34] was used to describe the relationship between saturation or water content and suction. It is one of the most commonly used SWCC models and is in good agreement with the experimental results [17]. According to the Van Genuchten model, the SWCC can be expressed as:
S = 1 ( 1 + ( a ψ ) n ) 1 n 1
where S is the effective degree of saturation bounded by 0 and 1; S = θ w / θ s , θ w is volumetric water content; θ s is saturated volumetric water content; ψ is the suction; and a and n are the model parameters. The a is directly related to the air-entry value of the soil. The n is related to the shape of the SWCC. The Van Genuchten model has been used in many geotechnical software applications, such as SEEP/W [31], Hydrus [38].

3.2. Bayesian Approach

The Bayesian approach is effective for the estimation of model parameters, and can reflect their uncertainty. This approach is well suited for the analysis of geotechnical engineering, especially when limited data are available [39]. Any unknown parameter can be regarded as a random variable, and can be described by a probability distribution. The Bayesian formula can be expressed as
p ( ζ | D ) = p ( D | ζ ) p ( ζ ) p ( D )
where p ( ζ ) is the prior probability distribution of the parameters; p ( D | ζ ) is the likelihood probability distribution that reflects the likelihood between the model output and observed data; P ( ζ | D ) is the posterior distribution of the parameters; P ( D ) is the normalized constant of probability density function; and ζ is the uncertain input parameter variables.
According to the SWCC expressed in Equation (1), the uncertainty of the model parameters can be estimated by the Bayesian approach. The model parameters in the SWCC model were considered as random variables ζ = [ a , n ] . There were differences between the actual response and predicted response due to the model error and measurement noise. The model error and measurement noise can be defined as the model output error ε .
S m = S ( ζ ) + ε
where S m is the measured degree of saturation, and S ( ζ ) is the model output degree of saturation corresponding to the parameter variable ζ = [ a , n ] using the Van Genuchten model. If the error ε is assumed to follow the normal distribution, the probability density function for ε can be written as
h ( ε ) = 1 2 π σ ε exp ( ( ε μ ε ) 2 2 σ ε 2 )
where μ ε and σ ε are the mean value and the standard deviation of error ε . In this paper, μ ε = 0 , σ ε = 0.02 .
By assuming that the errors in different records are statistically independent, the likelihood function is given by
p ( D | ζ ) = ( 2 π ) N / 2 σ ε N exp [ N 2 σ ε 2 J g ( ζ | D ) ]
where N is the number of measurement records; and J g ( ζ | D ) is the goodness of fitting function.
It was assumed that the model parameters ζ = [ a , n ] in the Van Genuchten model satisfied the prior distribution p ( ζ ) . According to the Bayesian approach, the posterior probability density function (PDF) [40,41,42] of the model parameters ζ = [ a , n ] , given the database D , can be expressed as
p ( ζ | D ) = c 0 p ( ζ ) ( 2 π ) N / 2 σ ε N exp [ N 2 σ ε 2 J g ( ζ | D ) ]
where c 0 is the normalizing constant to make the probability density function valid; p ( ζ ) is the prior PDF of model parameters representing the user's judgment; and J g ( ζ | D ) indicates the level of data fitting.
J g ( ζ | D ) = 1 N n = 1 N [ S m ( i ) S ( ψ ; ζ ) ] 2
where S m ( i ) is the measured degree of saturation of the i-th record; and S ( ψ ; ζ ) is the corresponding i-th model output using the Van Genuchten model. The optimal values ζ ^ of the model parameters of SWCC can be obtained by minimizing the goodness of fitting function with respect to the model parameter space ζ .
J ( ζ | D ) ζ = 0
σ ^ ε 2 = min J g ( ζ | D ) = J g ( ζ ^ | D )
Geotechnical parameters are often assumed to follow a lognormal distribution as they cannot have negative values [43]. Assuming no correlations between the parameters in prior distribution, the prior distribution is expressed as
p ( ζ ) = i = 1 m 1 2 π ζ i σ ln ζ i exp [ 1 2 ( ln ( ζ i ) μ ln ζ i σ ln ζ i ) 2 ]
where m is the number of random variables; and μ ln ζ i and σ ln ζ i are logarithmic mean and standard deviation, respectively, calculated by
σ ln ζ i = ln [ 1 + ( σ ζ i μ ζ i ) 2 ]
μ ln ζ i = ln μ ζ i 1 2 σ ln ζ i 2

3.3. Uncertainty Estimation

Bayesian analysis was carried out based on the SWCC proposed by Van Genuchten, and the MCMC method was used to sample the posterior PDF of the SWCC model parameters, as MCMC is very flexible given that any type of prior distribution can be used and it is efficient for highly non-linear problems [44]. The advantages of using the MCMC method is that the normalization factor may be avoided, which is generally difficult for multiple dimensional problems [19,45]. A possible limitation of MCMC is that it requires iterative evaluation of the model. There are many types of MCMC method. The DRAM algorithm proposed by Haario et al. [21] was adopted in this study due to its high effectiveness. The relevant details of DRAM can be found in Haario et al. [21]. The uncertainty of the SWCC model parameters can be evaluated and different confidence intervals of the SWCC obtained using the Bayesian approach and the MCMC method. The SWCC associated with various confidence intervals can be evaluated by the Bayesian approach as follows:
(1)
In this study, the prior distributions p ( ζ ) of the model parameters ζ [ α , n ] were assumed to be lognormal distributions;
(2)
The likelihood function p ( D | ζ ) was determined by measured data of the SWCC;
(3)
The posterior PDF was used as the target distribution function, and the samples were generated from posterior PDF using DRAM;
(4)
The samples at the beginning stage were discarded, and the remaining samples used to represent the posterior distribution;
(5)
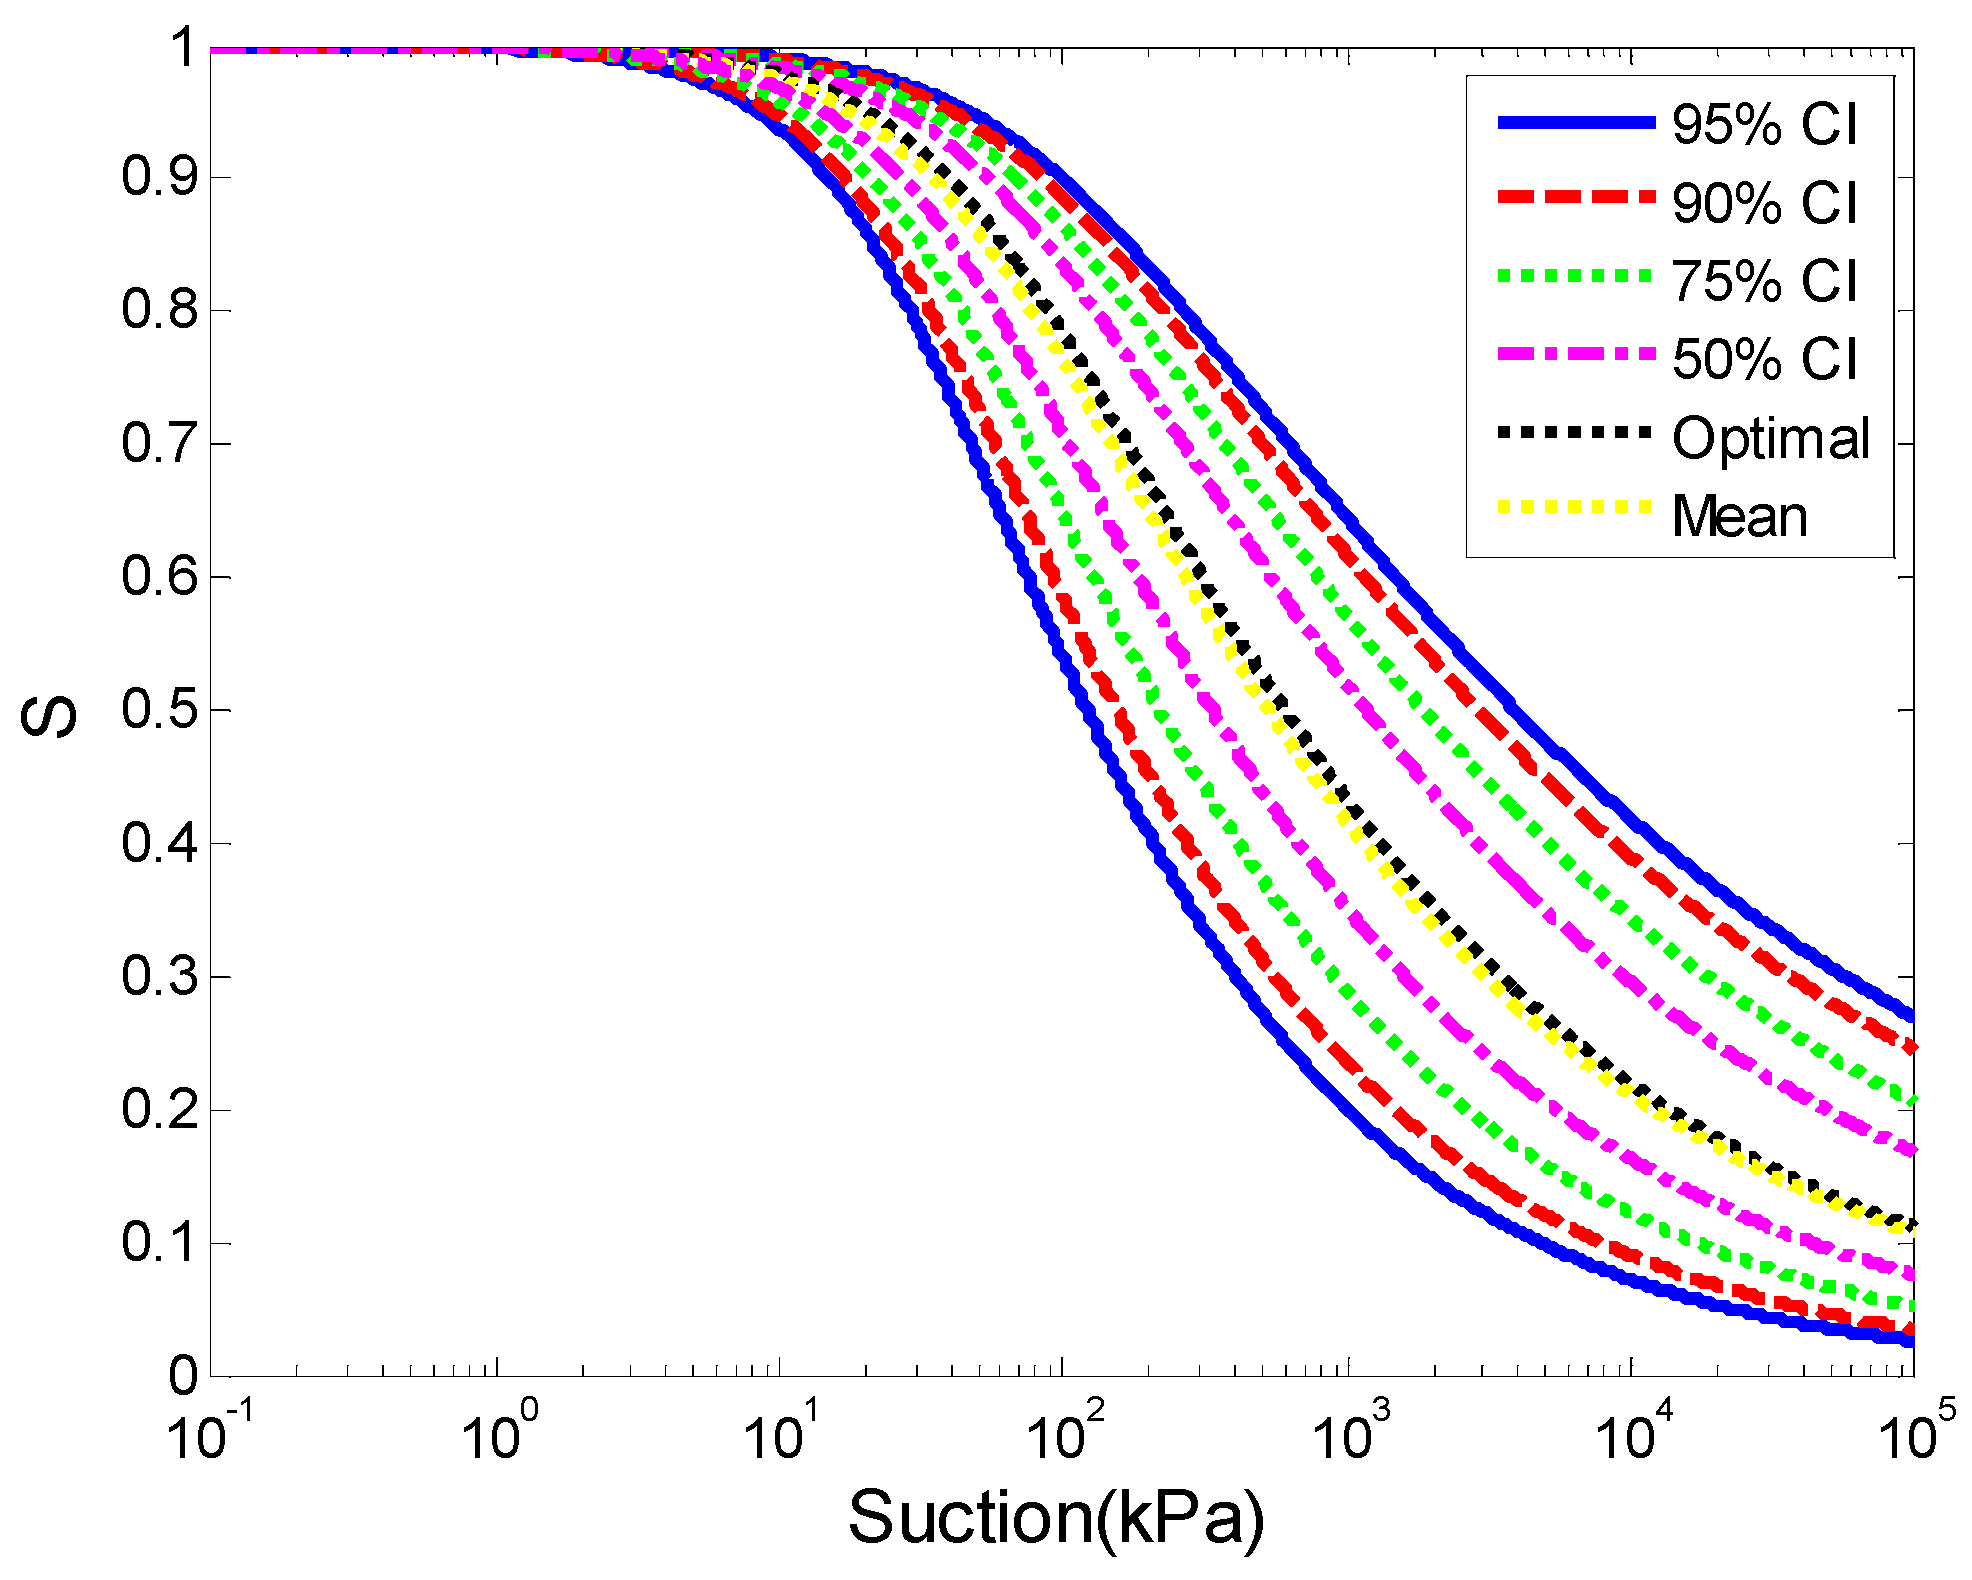
The confidence intervals of the SWCC and its model parameters corresponding to different percentiles (PCT) were obtained.

3.4. Water Flow through Unsaturated Soil

Seepage analysis in an unsaturated soil can be readily performed through the use of available finite element seepage software to compute the pore-water pressure. In this paper, the slope seepage calculation was carried out using the SEEP/W software, which has been widely used for seepage analyses in unsaturated soils [27,46]. The governing equation for solving a transient and two-dimensional seepage analysis in unsaturated soils is given as
x ( k x H x ) + y ( k y H y ) + Q = m 2 w γ w H t
where H is the hydraulic head; k x and k y are the permeability coefficient in the x and y directions, respectively; Q is the applied flux at the boundary; t is time; m 2 w is the water storage coefficient; and γ w is the unit weight of water.
An unsaturated soil may have a permeability coefficient that is greatly reduced from that of a saturated soil. The permeability coefficient of unsaturated soil is characterized by the saturated permeability coefficient and SWCC. Van Genuchten [34] proposed a closed-form equation to estimate the permeability coefficient that may be used for the flow-modeling of saturated-unsaturated soil.
k w = k s S 1 / 2 [ 1 ( 1 S 1 / m ) m ] 2
where S = 1 [ 1 + ( a ψ ) n ] [ 1 n 1 ] , m = 1 n 1 , k w is the permeability coefficient; and k s is saturated permeability coefficient, which can usually be assumed as a constant value.
The storage term in unsaturated flow is dependent on the suction, and can be characterized by the SWCC [47]. Hydraulic properties are influenced by the uncertainty of a and n . This predictive method for unsaturated hydraulic conductivity was used in numerical software such as SEEP/W. This method uses saturated hydraulic conductivity and SWCC in the prediction of the unsaturated hydraulic conductivity function. The infiltration of rainfall in an initially unsaturated soil slope depends on rainfall intensity and duration, groundwater condition, the saturated permeability coefficient, the permeability function, SWCC, and so on [48,49,50,51]. This paper mainly focused on the effect of uncertainty of the SWCC on the seepage and stability analysis under rainfall. Based on the slope properties in Section 2.2, seepage analysis was carried out using the model parameters with different percentiles by the software SEEP/W. According to the Hydrological Bureau of Jiangxi Province, a rainfall intensity of 8.6mm/h (which is the maximum daily rainfall intensity in the collapsing zone, Yudu) was applied on the slope for a duration of 96 h.

3.5. Calculation Theory of the Safety Factor

The shear strength theory of unsaturated soil in the slope stability analysis considering a negative pore water pressure was used to calculate the safety factor. It was an expanded model of the Mohr–Coulomb model.
τ = c + ( σ u ) tan φ + ( u u w ) tan φ b
where c and φ are the effective cohesion and the angle of shearing resistance, respectively; σ is the total normal stress; u is the pore air pressure; u w is the void water pressure; ( u u w ) is the suction; and φ b is the increased angle of the strength curve induced by the increase in suction (set as a constant in this study).
The current methods used to calculate the safety factor generally include strength reduction methods and limit equilibrium methods [52]. In this paper, the limit equilibrium analysis was carried out with the widely used Morgenstern–Price method [53]. Calculating the safety factor using this method requires less computational effort and time. The commercially available software, SLOPE/W, was used to calculate the safety factor of the slope under rainfall [54]. Soil mechanical properties were taken from Section 2.2.

4. Results and Discussion

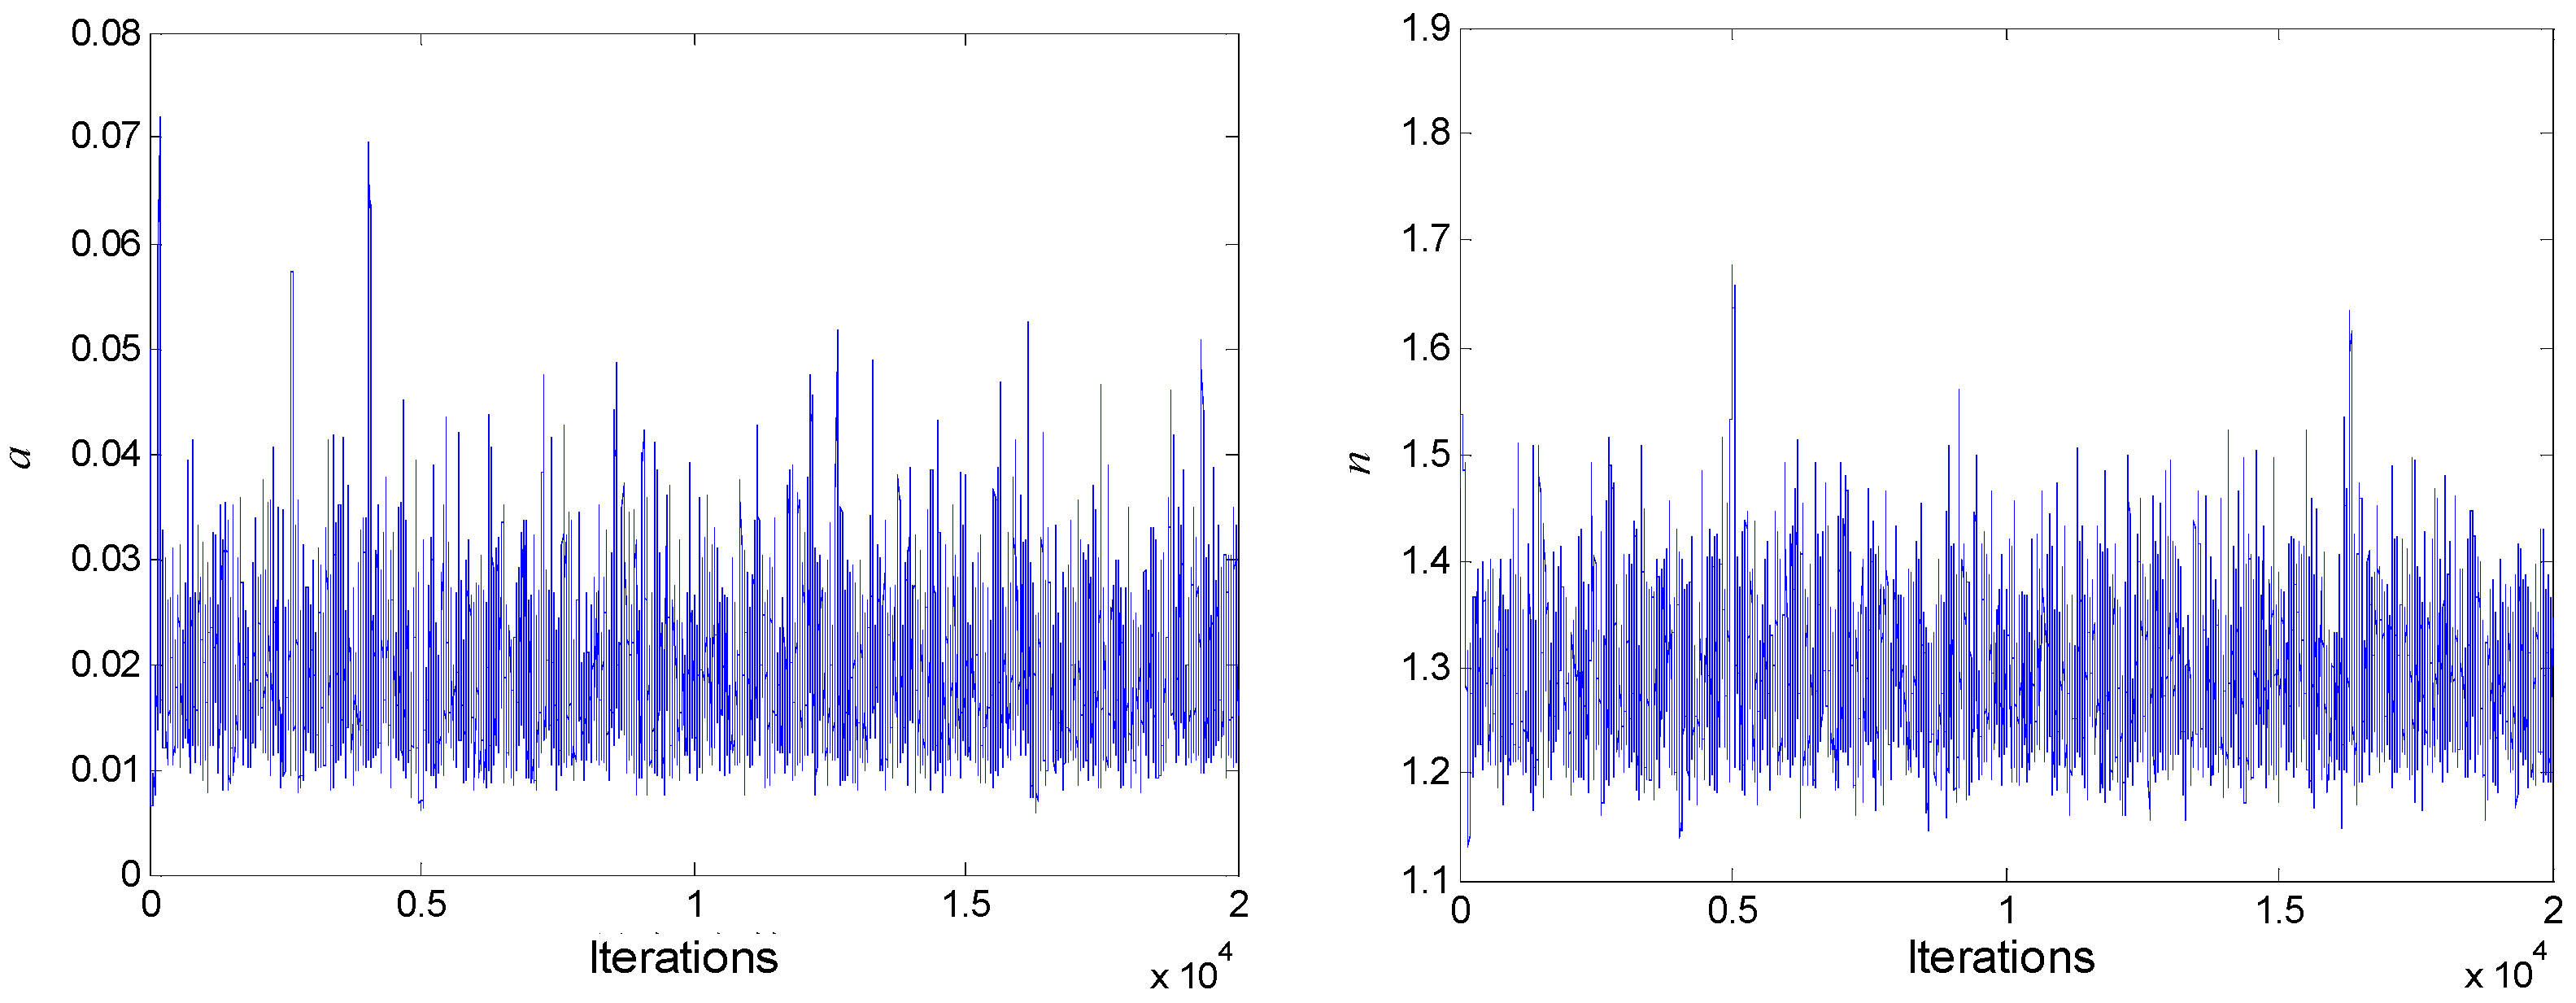
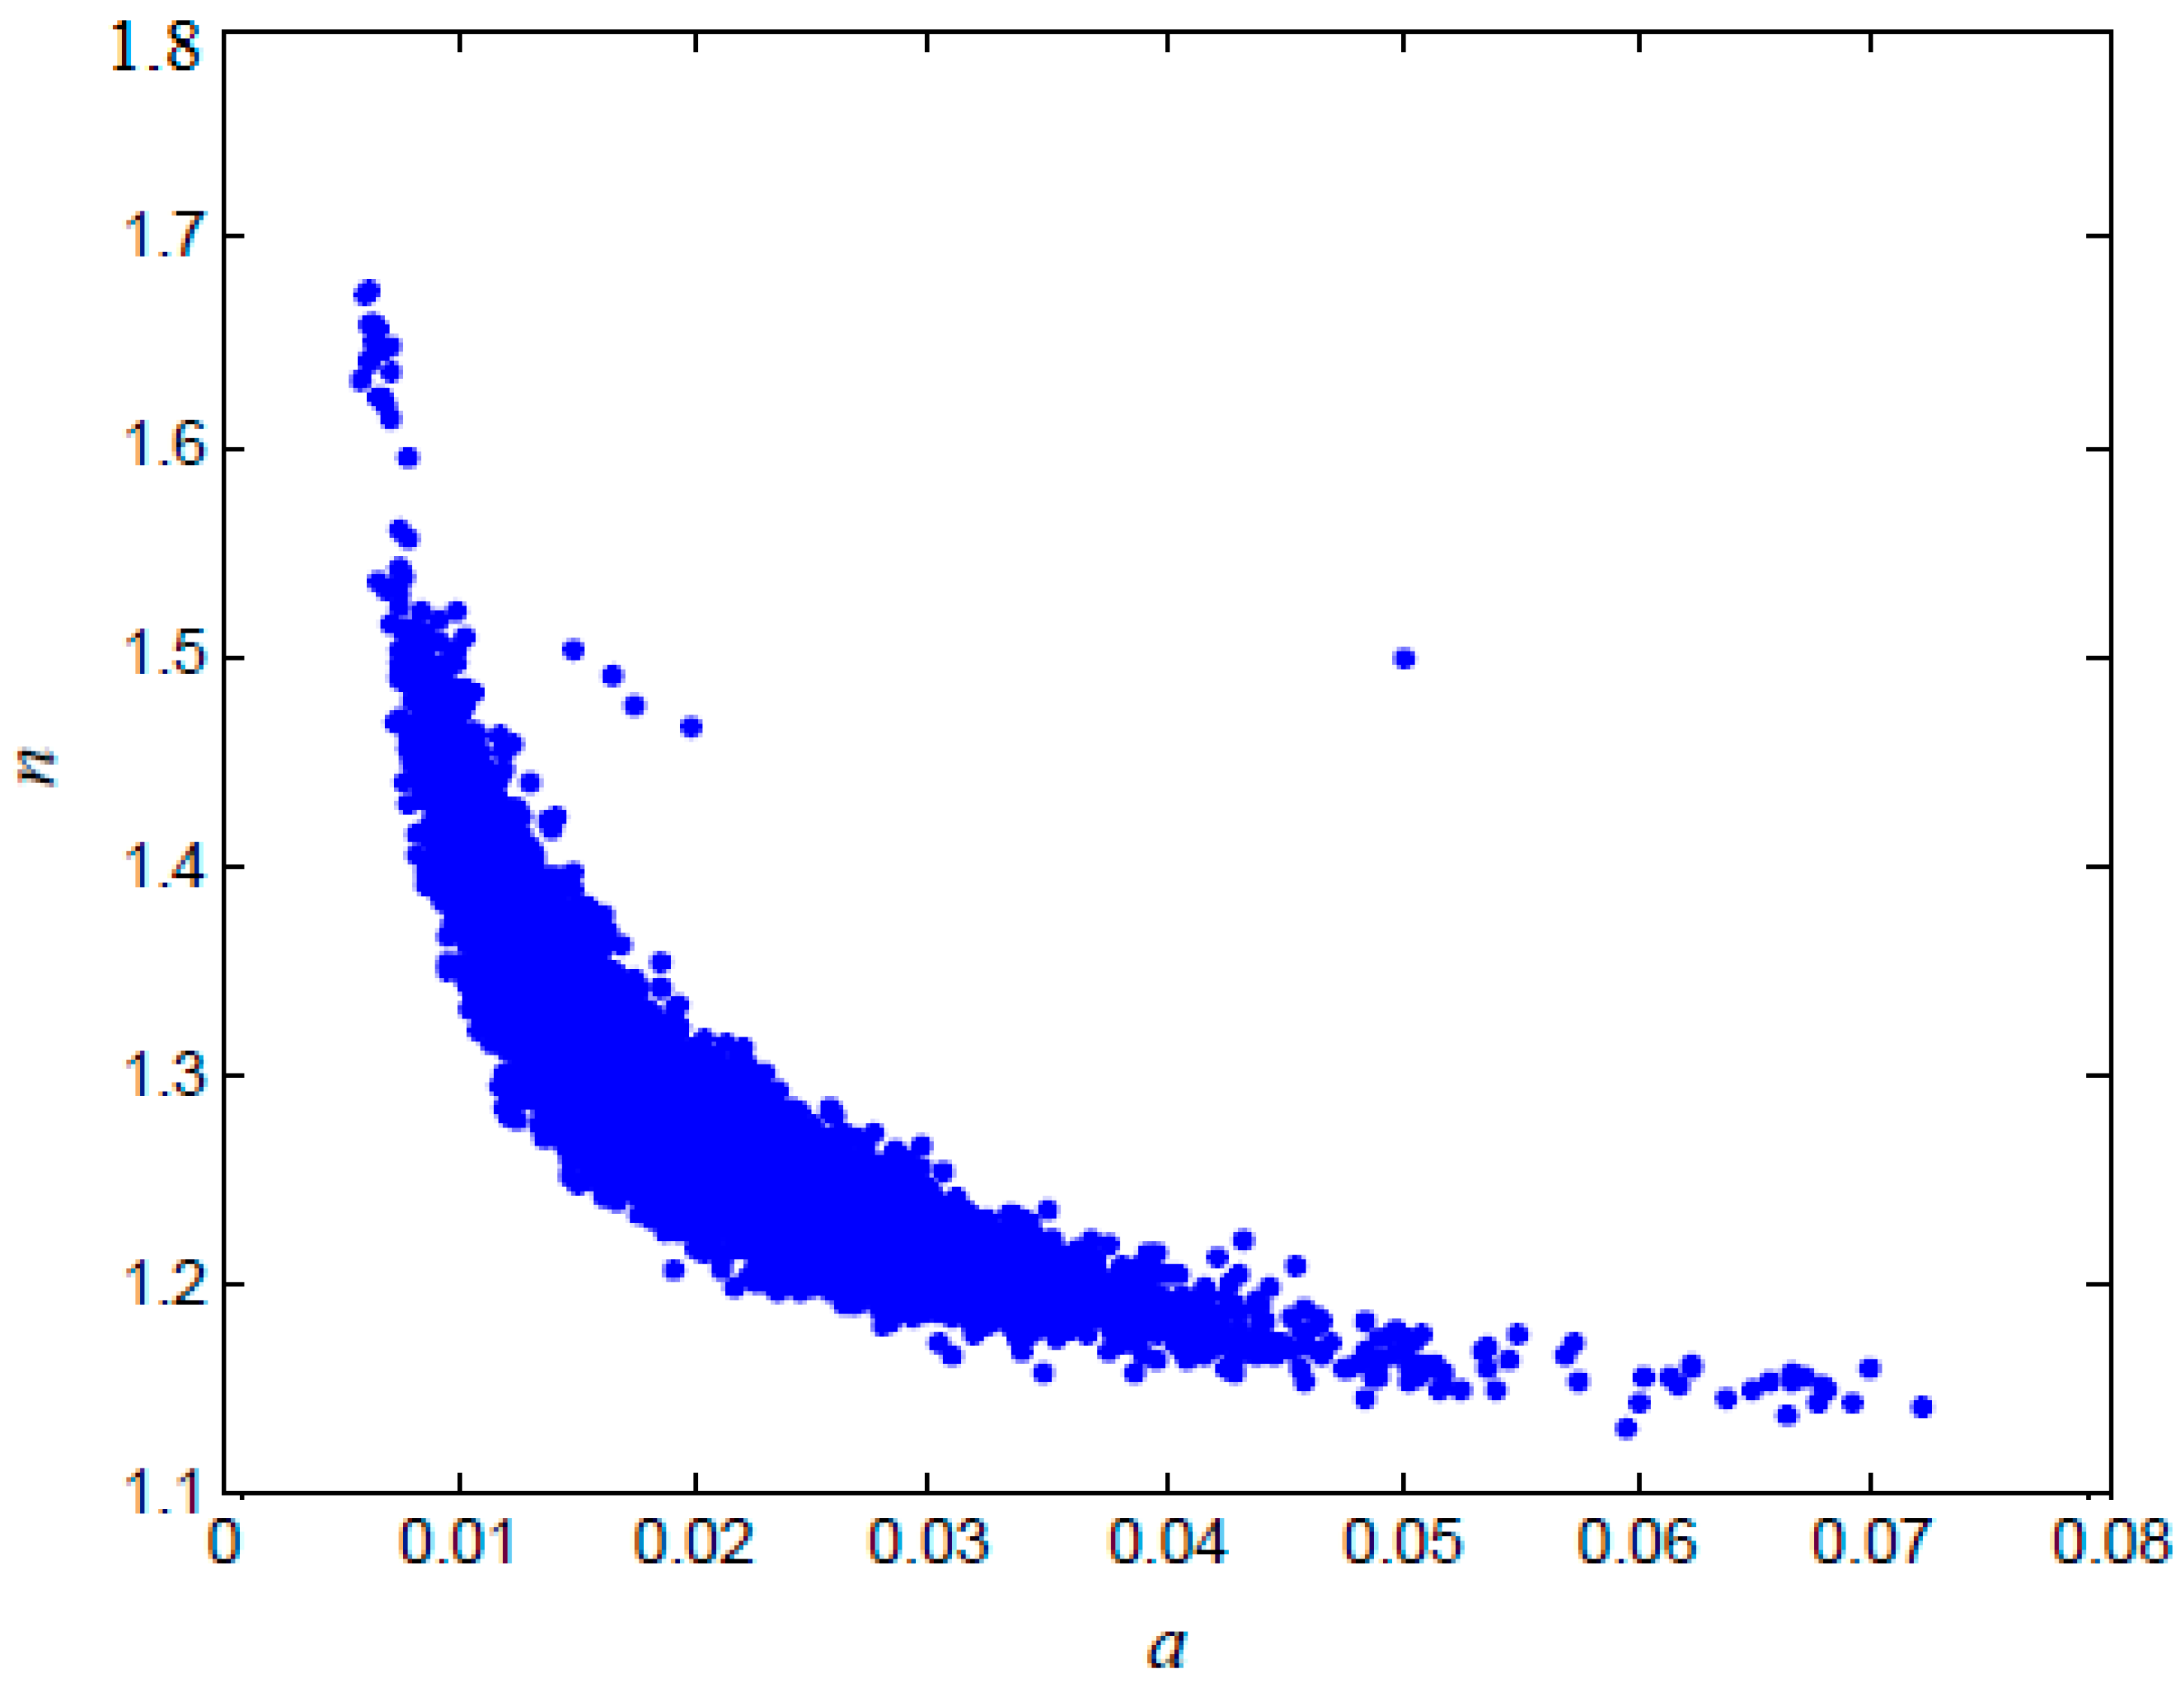
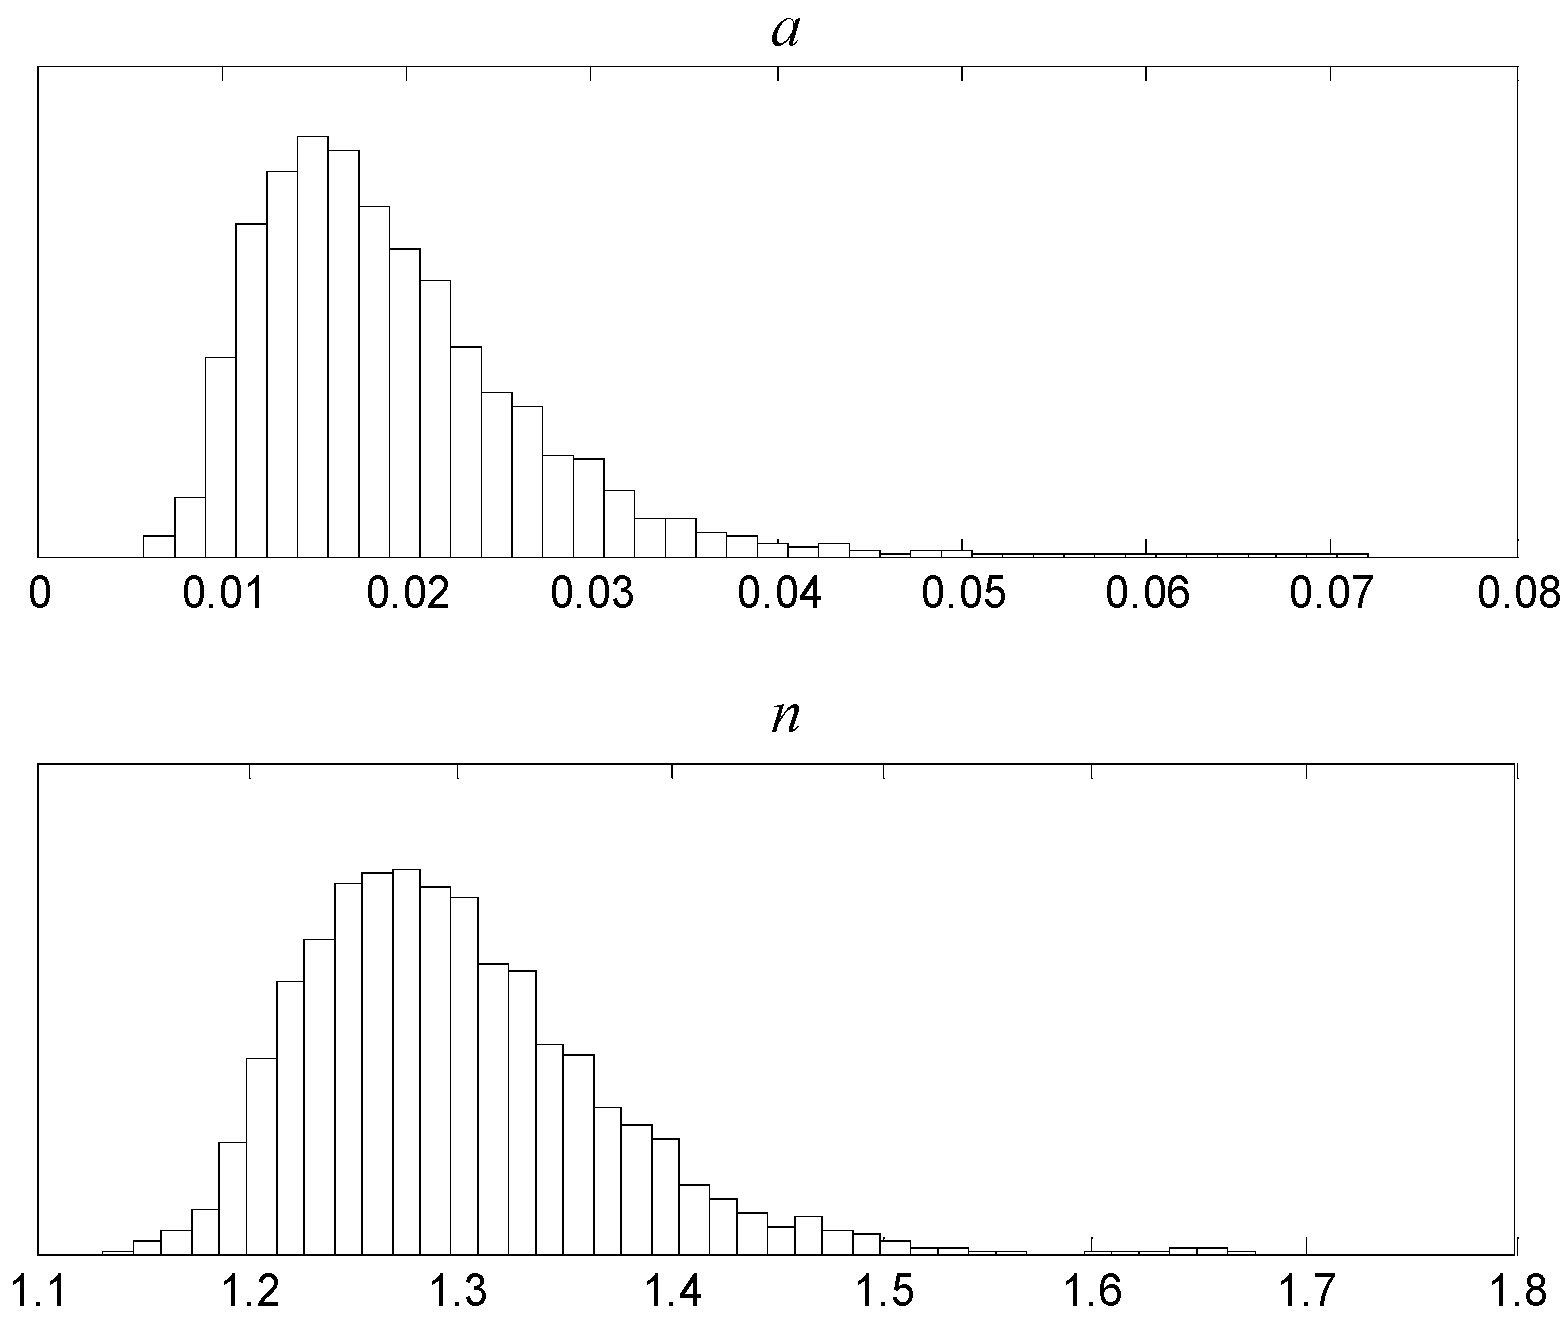
4.1. The Results of Uncertainty Estimation

Using the aforementioned SWCC data records of the granite residual soil, the uncertain model parameters of SWCC were obtained by a complete probability distribution. Using the MCMC method, the iterative conditions were established for a sample in the distribution space. Samples that converged to the posterior distribution function were extracted and analyzed statistically. It was assumed that the prior distribution of random variables was an independent logarithmic distribution. The prior mean and standard deviation of a were 0.02 and 0.04, respectively. The prior mean and standard deviation of n were 0.8 and 1.6, respectively. The MCMC and the PDF of the parameters generated 20,000 samples of model parameters in the SWCC. Figure 4 shows the evolution processes of the random samples.
The 3000 samples before convergence were discarded and not used for posterior statistical inference. The remaining 17,000 samples were used as the posterior distribution samples. The relationship between the random variables and the associated histograms for random variables are presented in Figure 5 and Figure 6, respectively. The statistics of the posterior distributions can be summarized as follows: the posterior mean and standard deviations of a were 0.0190 and 0.0071, respectively; and the posterior mean and standard deviations of n were 1.2962 and 0.0686, respectively.
The optimal values and the corresponding uncertainty of parameters were obtained and were summarized in Table 1, including the optimal value ( a ^ , n ^ ), standard deviation ( σ a , σ n ), and output error variance σ ^ ε 2 . The σ ^ ε 2 controls the magnitude of the fitting error. The optimal or most probable model parameters corresponded to the maximum values of the posterior PDF. The SWCC of the optimal parameters and laboratory data for granite residual soil were plotted in Figure 2 through fitting the Van Genuchten model with the optimal parameters deduced from the Bayesian analysis.
From the previous samples, 17,000 pairs of model parameters a and n were generated. For a given suction value, 17,000 values of degrees of saturation were, therefore, generated. By sorting the 17,000 degrees of saturation, the SWCC with different confidence intervals and its PCT among the entire database was obtained. Next, the corresponding model parameters were obtained. The upper and lower bounds of the SWCC associated with various confidence intervals (50%, 75%, 90%, and 95%) and the mean curve were evaluated (as shown in Figure 7). Confidence levels of 50%, 75%, 90%, and 95% were built by calculating the 25% (lower bound) and 75% (upper bound), the 12.5% and 87.5%, the 5% and 95%, the 2.5% and 97.5%, respectively. As shown in Figure 7, at the optimal, the SWCC was very close to the mean curve. The SWCC associated with different percentiles was also obtained. Note that the substantial variation in SWCC relationships for given percentiles was to be expected where the higher the percentile, the greater the water-retention ability at a given suction, and the more gradual the slope of the curve. Table 2 summarizes the model parameters a and n for different percentiles that represent the lower bound (LB) and upper bound (UB) of different confidence intervals (CI) of the SWCC. The ranges of the model parameters a and n in Van Genuchten for the confidence interval 95% were (0.0361, 0.0093) and (1.4472, 1.1919), respectively. These obtained model parameters were then used to analyze the slope transient seepage and stability analysis in the next section. Therefore, the proposed method could effectively obtain the confidence interval of the SWCC and estimate model parameters, and the uncertainty of the SWCC can be assessed quantitatively. This estimation of uncertainty and accuracy of the SWCC can be improved through field monitoring data of the SWCC [55].

4.2. Influence of the SWCC with Different Confidence on Seepage Analysis

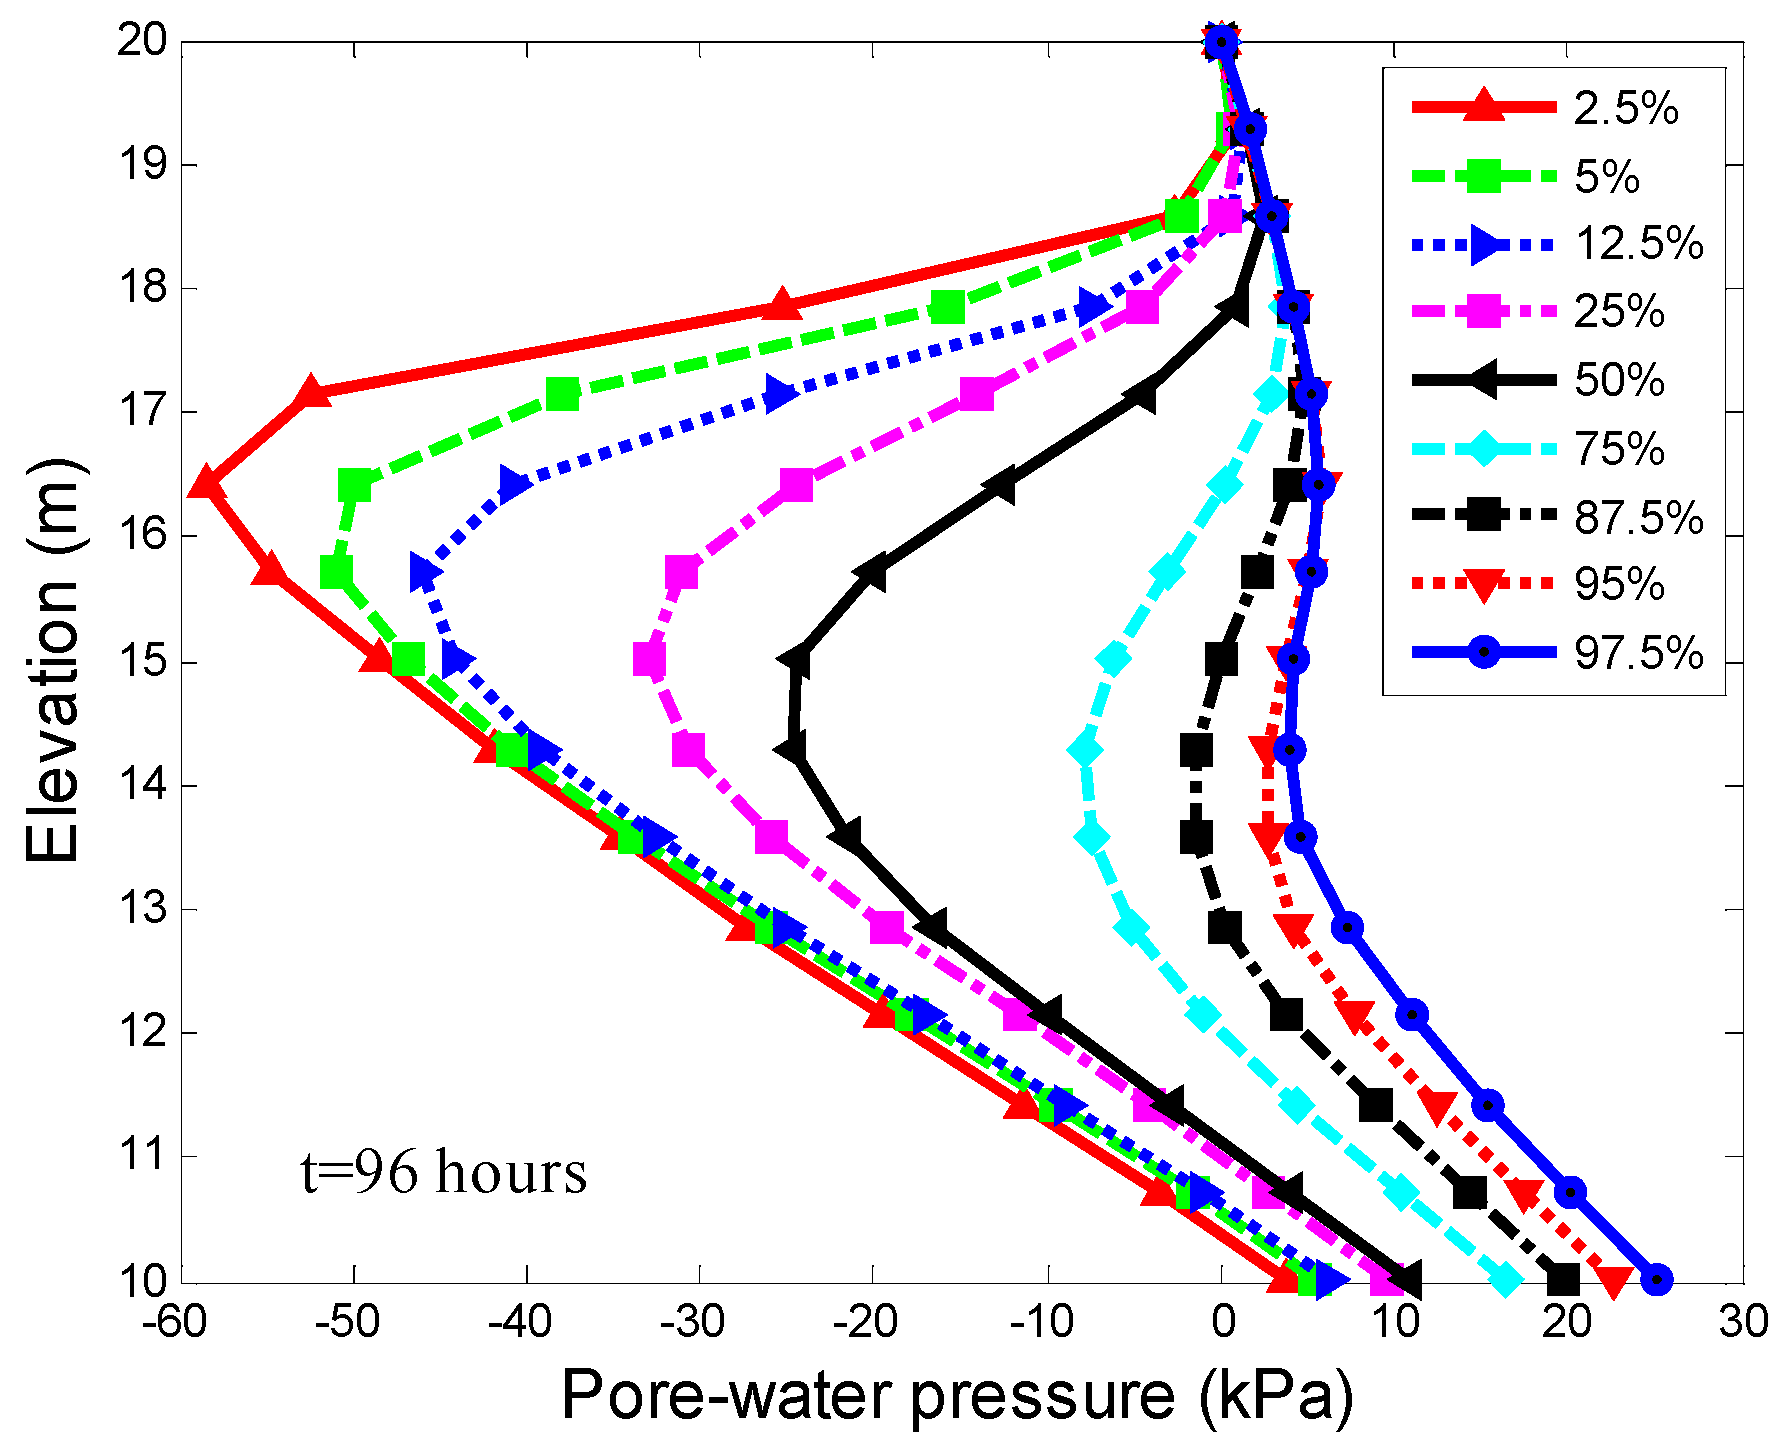
4.2.1. Pore-Water Pressure Profiles with Different Percentiles

The effects of the uncertainty of the SWCC on pore-water pressure in an unsaturated soil slope were obtained, and are presented in this section. The SWCC with a given percentile was used in the transient seepage analysis to establish the pore-water pressure profile in the slope. The initial pore-water pressure (t = 0 h) was linearly distributed with slope height. The pore-water pressure profiles at section O–O for the SWCC of different confidence intervals with a given rainfall condition are shown in Figure 8. The results in Figure 8 are obtained applying a rainfall intensity of 8.6 mm/h. The pore-water pressure profiles shown in Figure 8a–f corresponded to the SWCC with PCT equal to 2.5%, 5%, 12.5%, 25%, 50%, 72.5%, 87.5%, 95%, and 97.5% (the model parameters a and n are shown in Table 2), respectively. The SWCC and the corresponding parameters for different PCT are shown in Figure 3 and Table 1, respectively. Different rainfall duration (i.e., 0 h, 24 h, 48 h, 72 h, and 96 h) were applied to the surface of the slope in the numerical analysis. The infiltration of rainfall will produce a wetting front that gradually advances downwards and consequently causes a reduction in suction profile.
The pore-water pressure profiles were influenced by the different set of parameters obtained through the statistical analysis for different PCT. For soil with PCT = 2.5%, the wetting front was sharp and distinct, as shown in Figure 8a. Water continued to flow downward through the soil, and the negative pore-water pressure decreased at shallow depths in the slope. The downward movement of the wetting front in the soil was slow. After 96 h of rainfall, the depth of the wetting front was only about 4 m below the ground surface. The reduction of negative pore-water pressure mainly occurred in the shallow zone, as the permeability of the soil was relatively poor. However, the pore-water pressure of the deep zone was not affected. The influence of rainfall duration on the wetting front position was neglected, and the wetting front advanced downward at a small rate. For a soil with PCT = 5.0% and PCT = 12.5% (as shown in Figure 8b, c), the pore-water pressure profiles were similar to PCT = 2.5%. The negative pore-water pressure near the ground surface decreased with time, but the rate of downward movement became fast. Essentially, the negative pore-water pressure remained constant for the deep zone. The transition zone between the infiltration zone and the unaffected zone was still quite sharp and distinct. When PCT = 25%, infiltration depth increased, and negative pore-water pressure in the deep zone became affected (as shown in Figure 8d).
For PCT greater than 50%, the remaining negative pore-water pressure in the soil decreased more rapidly (as shown in Figure 8e–i). The transition between the infiltration zone and the unaffected zone became less distinct. The downward velocity of the wetting front increased, and the groundwater table rose. For PCT = 75% (as shown in Figure 8f), the negative pore-water pressure dropped greatly, and almost disappeared after 96 h of rainfall. Given the same initial suction, the influence depth of rainfall on the slope increased gradually with the increase of PCT. A comparison of the profiles of the pore-water pressure showed that, under the same initial pore-water pressure, the wetting fronts had less depth for cases with low PCT than those with high PCT. The shapes of the profiles were similar, but the rates of downward movement of the wetting fronts were distinct, which indicated that the behavior of rainfall should be related to the SWCC. Decreasing the PCT, the shape of pore-water pressure profiles changed little. It was noted that the most striking difference between different PCT was in the shallow zone. For soils with the same saturated permeability coefficient that were subjected to the same rainfall intensity and duration, the soil with a higher PCT had a greater water storage capacity. Thus, the movement of wetting fronts was much faster in soil with higher PCT. The higher the PCT, the faster the disappearance of the negative pore-water pressure in the soil. In general, the uncertainty of the SWCC can lead to significant errors in predicted pore-water pressure profiles.

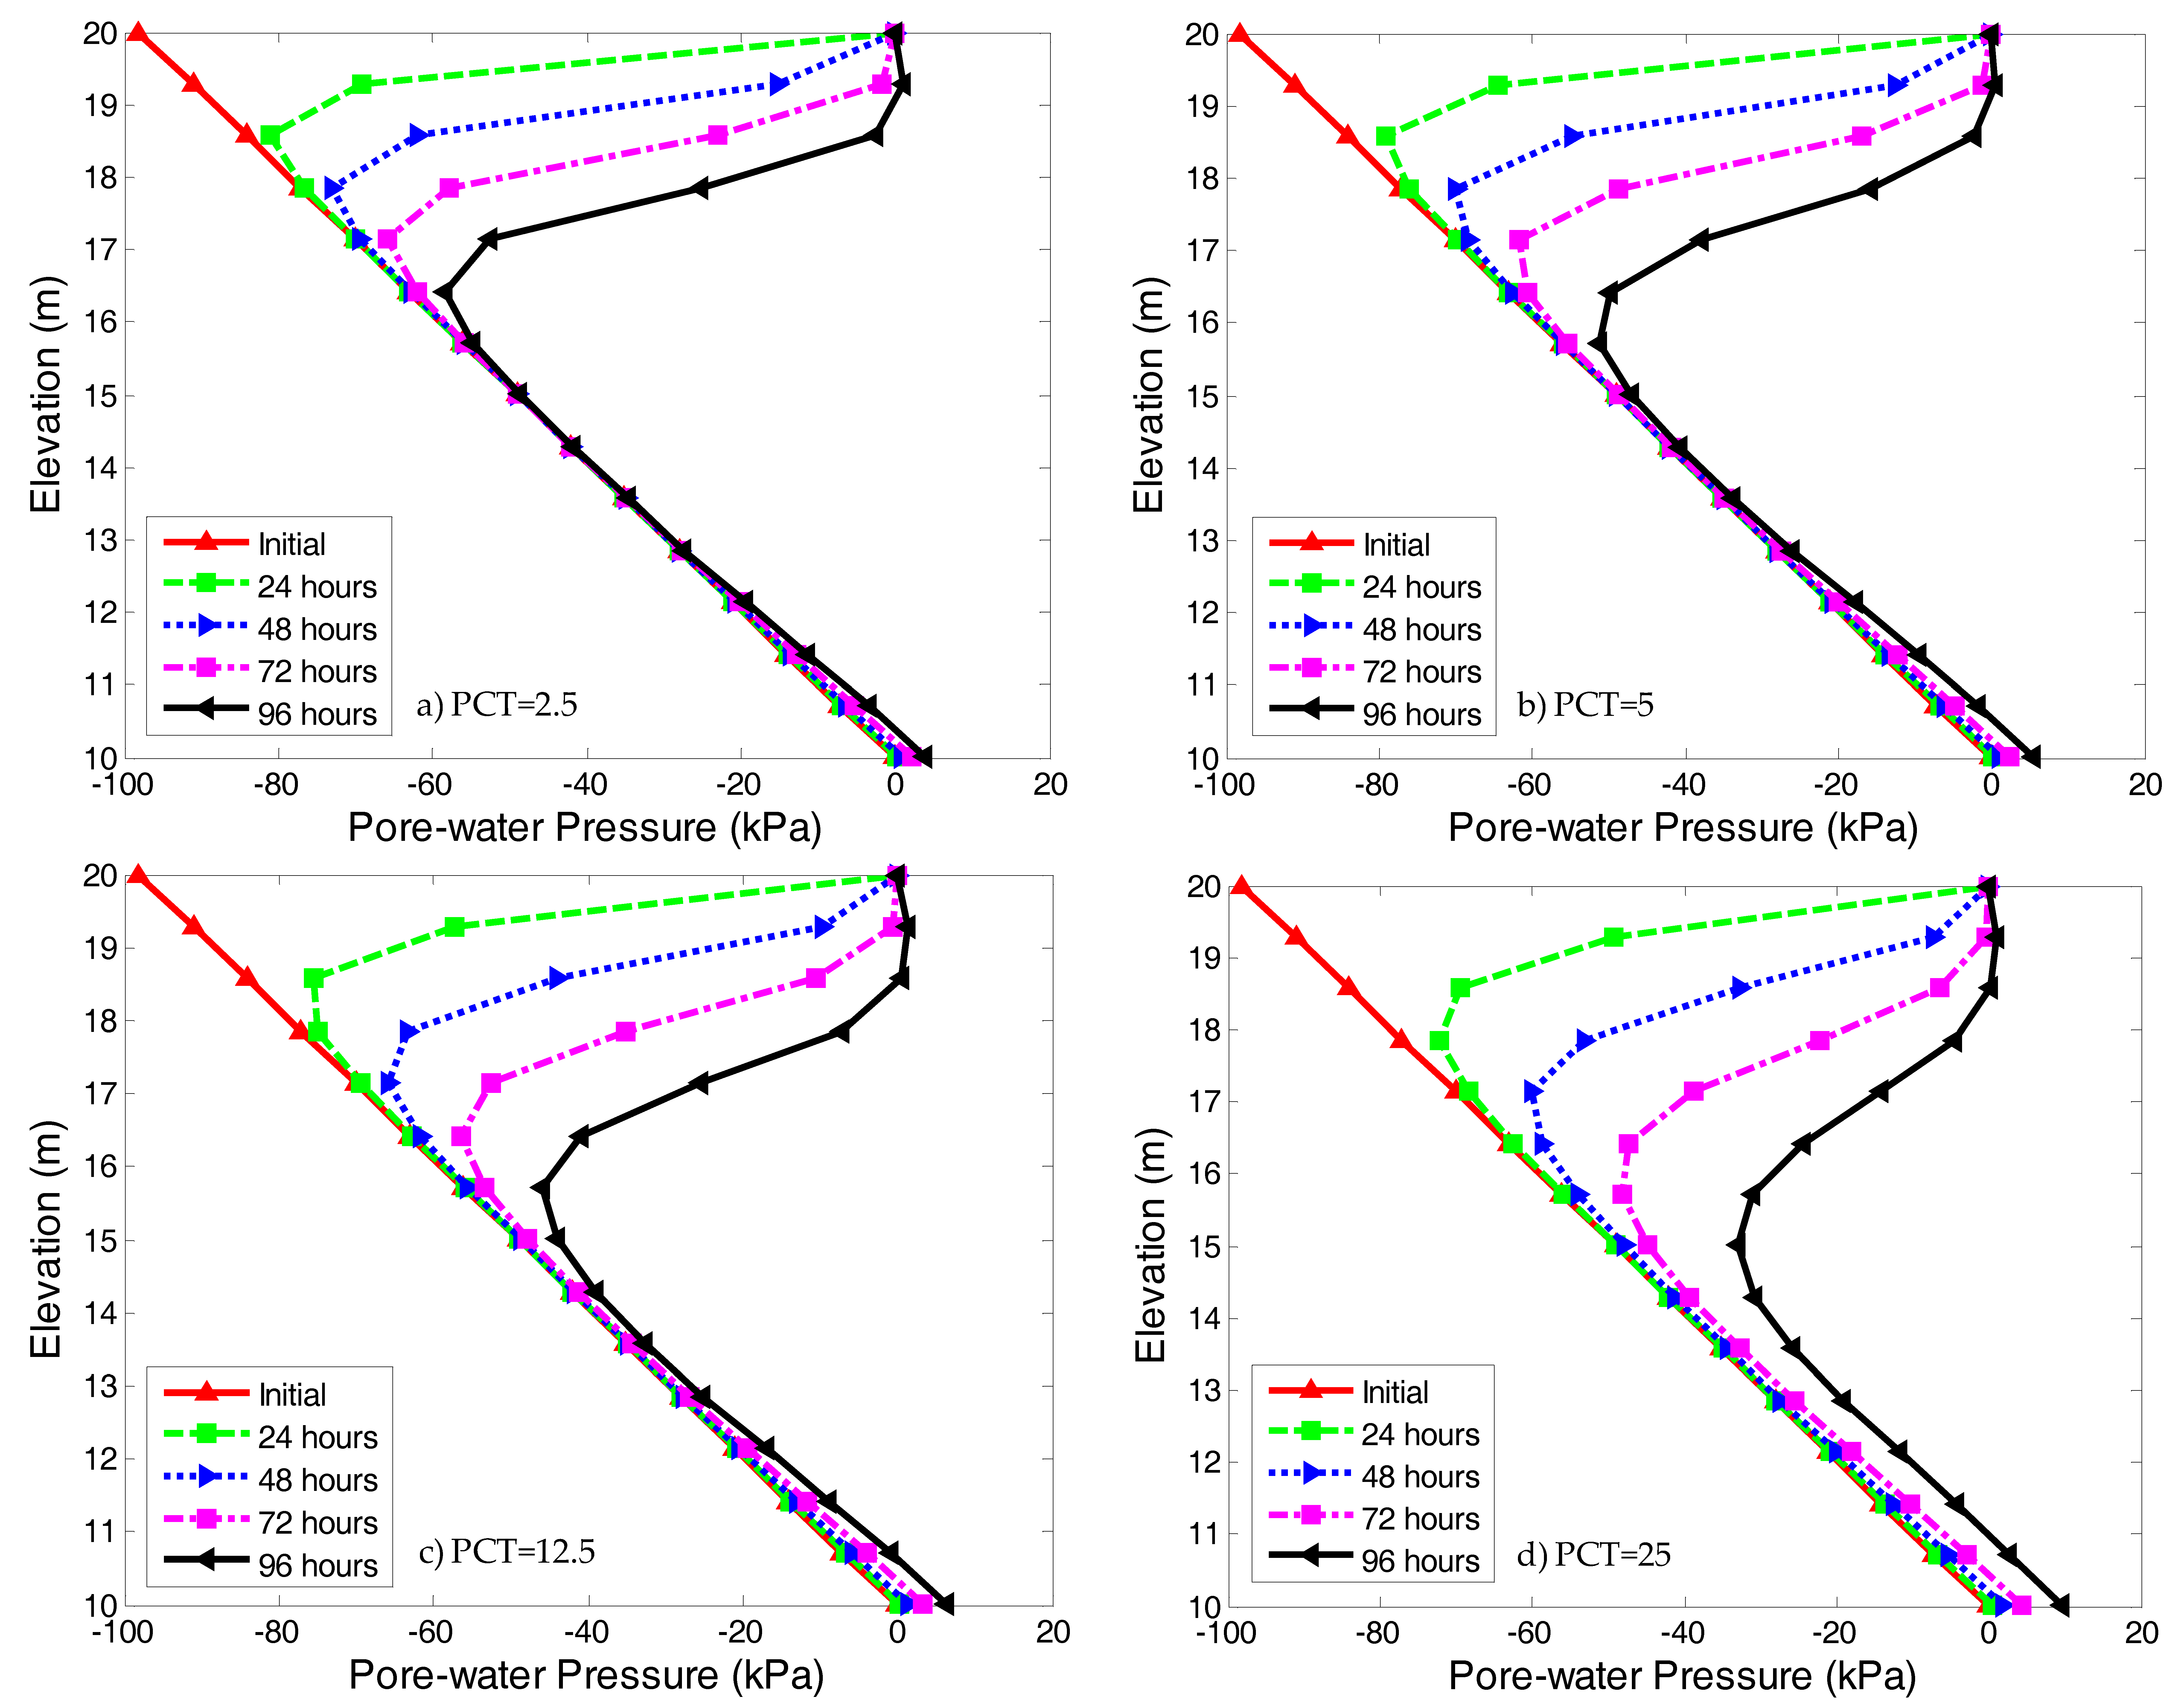
4.2.2. Pore-Water Pressure Profiles after Same Rainfall Duration

Figure 9 shows the pore-water pressure profiles at section O–O for soil with the same rainfall duration of 96 h, but with different PCT of the SWCC. The results showed the effects of PCT on pore-water pressure response were significant. Moreover, for the SWCC with higher PCT, the wetting-front zone became smaller. The influence range of rainfall gradually transferred from the shallow zone to the deep zone with increasing PCT. When the PCT was greater, the wetting front advanced deeper, due to the greater water storage capacity of the soil, and the negative pore-water pressure disappeared more easily; while the negative pore-water pressure for a small PCT value was larger. It should be pointed out that the infiltration behavior of the entire slope controls the stability of the slope.

4.2.3. Gradient of the Pore-Water Pressure

Figure 10 depicts the pore-water pressure at point M (25, 15) in the slope as shown in Figure 3 versus the rainfall duration time for the different PCT of the SWCC. The suction showed a gradual reduction during rainfall and indicated that the negative pore-water pressure at point M with the same rainfall duration decreased with an increase in the PCT value. The change of suction was much smaller when PCT equaled 2.5%, than when PCT equaled 97.5%. A significant change in the pore-water pressure gradient can be clearly seen in Figure 10. The gradient of the pore-water pressure was dependent on the PCT of the SWCC, and increased with increasing PCT. With respect to the SWCC, a higher value of PCT meant a higher degree of saturation or volumetric water content (as shown in Figure 7). In soil with a higher volumetric water content, the movement of water was faster [56], and the negative pore-water pressure decreased more. An increase in infiltration rate inside a soil with increasing PCT could explain this trend. Therefore, the confidence interval of the SWCC had a great influence on the seepage analysis of the slope under rainfall.

4.3. Influence of the SWCC with Different Confidence on Stability Analysis

The computed pore-water pressure distributions through SEEP/W were used as input data for slope stability analysis. The safety factor of the slope was calculated for a rainfall duration of 96 h. Under the same rainfall intensity and duration, the safety factors of an unsaturated slope for different PCT of the SWCC were evaluated. The calculated safety factors for different PCT are summarized in Table 3.
It was clear that the safety factors for different PCT differ greatly, and decrease with increasing PCT. For a soil with the SWCC of low PCT, the reduction of negative pore-water pressure in the slope was relatively small as a result of rainfall. The negative pore-water pressure on the slope surface was mainly affected, and the safety factor was relatively high. When the SWCC with high PCT was considered, the range and depth of the slope affected by rainfall became wider and deeper due to its stronger water storage capacity. Therefore, the safety factor of a slope under rainfall was relatively lower. The maximum safety factor for the slope with PCT equal to 2.5% was 1.790, whereas that for soil with PCT equal to 97.5% was only 1.162. There were great differences between the safety factors when the PCT were 2.5% and 97.5%. The safety factor dropped by 0.628 when the PCT rose from 2.5% to 97.5%. It was seen that the uncertainty in the SWCC had a significant effect on the stability of the unsaturated soil slope. These values were reasonable as the results of stability were related to pore-water pressure distribution in the slope.
As shown in Figure 8, rainfall only affected the pore-water pressure in the shallow zone of the slope for PCT = 2.5%, while the effects in the deep zone can be neglected. Therefore, the safety factor of the slope was relatively high. When PCT increased from 2.5% to 25%, the safety factor decreased from 1.790 to 1.679. The safety factor decreased by 0.111, which changed little with percentile of the SWCC. When PCT was smaller than 25%, the influence of rainfall on the pore-water pressure was not significant, and the reduction of the safety factor was not obvious with the increase of PCT. However, when PCT was larger than 50%, the negative pore-water pressure decreased greatly, the wetting front was relatively deep after a duration of 96 h, and the groundwater table rose, resulting in a greatly decreased safety factor. As expected, the soil with SWCC for PCT = 97.5% had the lowest safety factor, given that it had the highest infiltration rate of rainwater into soil. A higher PCT meant a higher volumetric water content, which caused water to move faster in the slope. Thus, rainfall resulted in a greater reduction in the negative pore-water pressure. As a result, the reduction in the safety factor due to rainfall was faster for a soil with higher PCT.
The confidence intervals for the safety factor were constructed by stability analysis. When the slope was subjected to rainfall for 96 h, the corresponding safety factor was 1.562 for PCT = 50% (mean value). The ranges in safety factors between the PCT = 25% (lower bound) and the PCT = 75% (upper bound) of the 50% confidence interval were from 1.679 to 1.329. For the 75% confidence interval (PCT = 12.5%, PCT = 87.5%), the 90% confidence interval (PCT = 5%, PCT = 95%), and the 95% confidence interval (PCT = 2.5%, PCT = 97.5%), the corresponding ranges in safety factors were from 1.744 to 1.239, from 1.782 to 1.187, and from 1.790 to 1.162, respectively. As expected, the range increased with increasing confidence interval, so the uncertainty of the SWCC had a significant effect on the reliability of the safety factor.

5. Conclusions

This paper presented use of the Bayesian approach and MCMC method to evaluate the uncertainty of the SWCC. The effects of the SWCC on the seepage and stability of an unsaturated soil slope under conditions of rainfall were also analyzed. The conclusions of this paper can be summarized as follows:
(1)
Assuming the Van Genuchten model as a fitting model of the SWCC, and taking the model parameters of Van Genuchten as random variables, the posterior distribution of the model parameters of Van Genuchten could be effectively sampled by the DRAM algorithm. The proposed Bayesian approach could be effectively applied to estimate a SWCC with a given level of confidence for the specific soil.
(2)
Based on the confidence interval of the SWCC, a new approach for evaluating the effect of uncertainty of the SWCC on seepage and stability analysis of an unsaturated soil slope under rainfall was proposed. It was found that, under the same conditions of saturated permeability coefficient and rainfall, the pore-water pressure profile was dependent on the confidence interval and was significantly influenced by the change of PCT. For the same conditions of rainfall, the higher the PCT value, the greater the reduction of negative pore-water pressures from the initial condition; and the deeper and faster the wetting front will advance due to the greater water storage capacity of the soil. Hence, a SWCC with a higher PCT leads to a lower safety factor for the slope.
(3)
The uncertainty of the SWCC was important for stability analysis under rainfall. We want to study the reliability analysis for the slope using the Bayesian approach and MCMC method in future research.

Acknowledgments

This research is funded by the Natural Science Foundation of China (No. 51468041), the PhD. Programs Foundation of the Ministry of Education of China (No. 20123601110001), and the Foundation of Jiangxi Science (No. 20161BAB203078).

Author Contributions

Weiping Liu analyzed the results and wrote the paper; Xiaoyan Luo contributed reagents/materials/analysis tools; Faming Huang analyzed the data; Mingfu Fu conceived and designed the experiments.

Conflicts of Interest

The authors declare no conflict of interest.

References

  1. Han, Z.; Vanapalli, S.K. Stiffness and shear strength of unsaturated soils in relation to soil-water characteristic curve. Géotechnique 2016. [Google Scholar] [CrossRef]
  2. Zhou, A.N.; Sheng, D.; Carter, J.P. Modelling the effect of initial density on soil-water characteristic curves. Géotechnique 2015, 62, 669–680. [Google Scholar] [CrossRef]
  3. Fredlund, D.G.; Xing, A.; Huang, S. Predicting the permeability function for unsaturated soils using the soil-water characteristic curve. Can. Geotech. J. 1994, 31, 533–546. [Google Scholar] [CrossRef]
  4. Iyer, K.; Jayanth, S.; Gurnani, S.; Singh, D.N. Influence of initial water content and specimen thickness on the swcc of fine-grained soils. Int. J. Geomech. 2013, 13, 894–899. [Google Scholar] [CrossRef]
  5. Jiang, Y.; Chen, W.; Wang, G.; Sun, G.; Zhang, F. Influence of initial dry density and water content on the soil–water characteristic curve and suction stress of a reconstituted loess soil. Bull. Eng. Geol. Environ. 2017, 76, 1085–1095. [Google Scholar] [CrossRef]
  6. Gallage, C.P.K.; Uchimura, T. Effects of dry density and grain size distribution on soil-water characteristic curves of sandy soils. Soils Found. 2010, 50, 161–172. [Google Scholar] [CrossRef]
  7. Hong, W.T.; Jung, Y.S.; Kang, S.; Lee, J.S. Estimation of soil-water characteristic curves in multiple-cycles using membrane and TDR system. Materials 2016, 9, 1019. [Google Scholar] [CrossRef] [PubMed]
  8. Elkady, T.Y.; Al-Mahbashi, A.M.; Al-Refeai, T.O. Stress-dependent soil-water characteristic curves of lime-treated expansive clay. J. Mater. Civ. Eng. 2013, 27, 04014127. [Google Scholar] [CrossRef]
  9. Gao, H.; Shao, M. Effects of temperature changes on soil hydraulic properties. Soil Tillage Res. 2015, 153, 145–154. [Google Scholar] [CrossRef]
  10. Li, X.; Li, J.H.; Zhang, L.M. Predicting bimodal soil–water characteristic curves and permeability functions using physically based parameters. Comput. Geotech. 2014, 57, 85–96. [Google Scholar] [CrossRef]
  11. Wijaya, M.; Leong, E.C. Equation for unimodal and bimodal soil–water characteristic curves. Soils Found. 2016, 56, 291–300. [Google Scholar] [CrossRef]
  12. Zhou, W.H.; Yuen, K.V.; Tan, F. Estimation of soil–water characteristic curve and relative permeability for granular soils with different initial dry densities. Eng. Geol. 2014, 179, 1–9. [Google Scholar] [CrossRef]
  13. Calamak, M.; Yanmaz, A.M.; Kentel, E. Probabilistic evaluation of the effects of uncertainty in transient seepage parameters. J. Geotech. Geoenviron. Eng. 2017, 143. [Google Scholar] [CrossRef]
  14. Kokkwang, P.; Santoso, A.; Sertong, Q. Probabilistic analysis of soil-water characteristic curves. J. Geotech. Geoenviron. Eng. 2010, 136, 445–455. [Google Scholar]
  15. Chiu, C.F.; Yan, W.M.; Yuen, K.V. Reliability analysis of soil–water characteristics curve and its application to slope stability analysis. Eng. Geol. 2012, 135–136, 83–91. [Google Scholar] [CrossRef]
  16. Mishra, S.; Parker, J.C.; Singhal, N. Estimation of soil hydraulic properties and their uncertainty from particle size distribution data. J. Hydrol. 1989, 108, 1–18. [Google Scholar] [CrossRef]
  17. Phoon, K.K.; Santoso, A.; Cheng, Y. Probabilistic Analysis of Soil Water Characteristic Curves from Sandy Clay Loam. In The Challenge of Sustainability in the Geoenvironment, Geotechnical Special Publication, Proceedings of GeoCongress: New Orleans, LA, USA, 9‒12 March 2008; ASCE: Reston, VA, USA, 2008; pp. 917–925. [Google Scholar]
  18. Zhai, Q.; Rahardjo, H. Quantification of uncertainties in soil–water characteristic curve associated with fitting parameters. Eng. Geol. 2013, 163, 144–152. [Google Scholar] [CrossRef]
  19. Zhang, L.L.; Zhang, J.; Zhang, L.M.; Tang, W.H. Back analysis of slope failure with markov chain monte carlo simulation. Comput. Geotech. 2010, 37, 905–912. [Google Scholar] [CrossRef]
  20. Medard, B.; Gumiere, S.J. Bayesian uncertainty analysis of the distributed hydrological model hydrotel. J. Hydrol. Eng. 2012, 17, 1021–1032. [Google Scholar]
  21. Haario, H.; Laine, M.; Mira, A.; Saksman, E. Dram: Efficient adaptive mcmc. Stat. Comput. 2006, 16, 339–354. [Google Scholar] [CrossRef]
  22. Gaume, E.; Gaál, L.; Viglione, A.; Szolgay, J.; Kohnová, S.; Blöschl, G. Bayesian mcmc approach to regional flood frequency analyses involving extraordinary flood events at ungauged sites. J. Hydrol. 2010, 394, 101–117. [Google Scholar] [CrossRef]
  23. Huang, J.; Kelly, R.; Li, D.; Zhou, C.; Sloan, S. Updating reliability of single piles and pile groups by load tests. Comput. Geotech. 2016, 73, 221–230. [Google Scholar] [CrossRef]
  24. Wang, Y.; Au, S.K.; Cao, Z. Bayesian approach for probabilistic characterization of sand friction angles. Eng. Geol. 2010, 114, 354–363. [Google Scholar] [CrossRef]
  25. Kelly, R.; Huang, J. Bayesian updating for one-dimensional consolidation measurements. Can. Geotech. J. 2016, 52, 1318–1330. [Google Scholar] [CrossRef]
  26. Rahimi, A.; Rahardjo, H.; Leong, E.C. Effect of hydraulic properties of soil on rainfall-induced slope failure. Eng. Geol. 2010, 114, 135–143. [Google Scholar] [CrossRef]
  27. Zhang, L.L.; Fredlund, D.G.; Zhang, L.M.; Tang, W.H. Numerical study of soil conditions under which matric suction can be maintained. Can. Geotech. J. 2004, 41, 569–582. [Google Scholar] [CrossRef]
  28. Dong, T.; Xiaohui, Q.; Shuihua, J.; Dianqing, L. Influence of different antecedent rainfall and soil water characteristic curve on slope stability. Chin. J. Geotech. Eng. 2015, 37, 148–155. [Google Scholar]
  29. Cao, C.; Wang, Q.; Chen, J.; Ruan, Y.; Zheng, L.; Song, S.; Niu, C. Landslide susceptibility mapping in vertical distribution law of precipitation area: Case of the Xulong hydropower station reservoir, southwestern china. Water 2016, 8, 270. [Google Scholar] [CrossRef]
  30. Chien, L.K.; Hsu, C.F.; Yin, L.C. Warning model for shallow landslides induced by extreme rainfall. Water 2015, 7, 4362–4384. [Google Scholar] [CrossRef]
  31. Huang, F.; Luo, X.; Liu, W. Stability analysis of hydrodynamic pressure landslides with different permeability coefficients affected by reservoir water level fluctuations and rainstorms. Water 2017, 9, 450. [Google Scholar] [CrossRef]
  32. Bordoni, M.; Meisina, C.; Valentino, R.; Lu, N.; Bittelli, M.; Chersich, S. Hydrological factors affecting rainfall-induced shallow landslides: From the field monitoring to a simplified slope stability analysis. Eng. Geol. 2015, 193, 19–37. [Google Scholar] [CrossRef]
  33. Gardner, W.R. Some steady-state solutions of the unsaturated moisture flow equation with application to evaporation from a water table. Soil Sci. 1958, 85, 228–232. [Google Scholar] [CrossRef]
  34. Genuchten, M.T.V. A closed-form equation for predicting the hydraulic conductivity of unsaturated soils. Soil Sci. Soc. Am. J. 1980, 44, 892–898. [Google Scholar] [CrossRef]
  35. Milly, P.C.D. Estimation of brooks-corey parameters from water retention data. Water Resour. Res. 1987, 23, 1085–1089. [Google Scholar] [CrossRef]
  36. Fredlund, D.G.; Xing, A. Equations for the soil-water characteristic curve. Can. Geotech. J. 1994, 31, 521–532. [Google Scholar] [CrossRef]
  37. Krishnapillai, S.H.; Ravichandran, N. New soil-water characteristic curve and its performance in the finite-element simulation of unsaturated soils. Int. J. Geomech. 2012, 12, 209–219. [Google Scholar] [CrossRef]
  38. Tran, A.P.; Vanclooster, M.; Zupanski, M.; Lambot, S. Joint estimation of soil moisture profile and hydraulic parameters by ground-penetrating radar data assimilation with maximum likelihood ensemble filter. Water Resour. Res. 2014, 50, 3131–3146. [Google Scholar] [CrossRef]
  39. Baecher, G.B.; Christian, J.T. Reliability and Statistics in Geotechnical Engineering; Wiley: Hoboken, NJ, USA, 2003. [Google Scholar]
  40. Yan, W.M.; Kaveng, Y.; Gillim, Y. Bayesian probabilistic approach for the correlations of compression index for marine clays. J. Geotech. Geoenviron. Eng. 2009, 136, 1932–1940. [Google Scholar] [CrossRef]
  41. Yuen, K.V. Recent developments of bayesian model class selection and applications in civil engineering. Struct. Saf. 2010, 32, 338–346. [Google Scholar] [CrossRef]
  42. Zhou, W.H.; Yuen, K.V.; Tan, F. Estimation of maximum pullout shear stress of grouted soil nails using bayesian probabilistic approach. Int. J. Geomech. 2013, 13, 659–664. [Google Scholar] [CrossRef]
  43. Huang, J. System reliability of slopes by rfem. Soils Found. Tokyo 2010, 50, 343–353. [Google Scholar] [CrossRef]
  44. Zhang, L.L.; Zuo, Z.B.; Ye, G.L.; Jeng, D.S.; Wang, J.H. Probabilistic parameter estimation and predictive uncertainty based on field measurements for unsaturated soil slope. Comput. Geotech. 2013, 48, 72–81. [Google Scholar] [CrossRef]
  45. Juang, C.H.; Luo, Z.; Atamturktur, S.; Huang, H. Bayesian updating of soil parameters for braced excavations using field observations. J. Geotech. Geoenviron. Eng. 2012, 139, 395–406. [Google Scholar] [CrossRef]
  46. Cuomo, S.; Sala, M.D. Rainfall-induced infiltration, runoff and failure in steep unsaturated shallow soil deposits. Eng. Geol. 2013, 162, 118–127. [Google Scholar] [CrossRef]
  47. Zhan, T.L.T.; Ng, C.W.W. Analytical analysis of rainfall infiltration mechanism in unsaturated soils. Int. J. Geomech. 2004, 4, 273–284. [Google Scholar] [CrossRef]
  48. Fredlund, D.G.; Xing, A.; Fredlund, M.D.; Barbour, S.L. The relationship of the unsaturated soil shear to the soil-water chara. Can. Geotech. J. 1996, 33, 440–448. [Google Scholar] [CrossRef]
  49. Zhang, L.L.; Zheng, Y.F.; Zhang, L.M.; Li, X.; Wang, J.H. Probabilistic model calibration for soil slope under rainfall: Effects of measurement duration and frequency in field monitoring. Géotechnique 2014, 64, 365–378. [Google Scholar] [CrossRef]
  50. Conte, E.; Troncone, A. A method for the analysis of soil slips triggered by rainfall. Géotechnique 2012, 62, 187–192. [Google Scholar] [CrossRef]
  51. Conte, E.; Donato, A.; Troncone, A. A simplified method for predicting rainfall-induced mobility of active landslides. Landslides 2017, 14, 35–45. [Google Scholar] [CrossRef]
  52. Kalenchuk, K.S.; Hutchinson, D.J.; Diederichs, M.S. Downie slide: Numerical simulation of groundwater fluctuations influencing the behaviour of a massive landslide. Bull. Eng. Geol. Environ. 2013, 72, 397–412. [Google Scholar] [CrossRef]
  53. Fredlund, D.G.; Krahn, J. Comparison of slope stability methods of analysis. Can. Geotech. J. 1977, 14, 429–439. [Google Scholar] [CrossRef]
  54. Oh, S.; Lu, N. Slope stability analysis under unsaturated conditions: Case studies of rainfall-induced failure of cut slopes. Eng. Geol. 2015, 184, 96–103. [Google Scholar] [CrossRef]
  55. Bordoni, M.; Bittelli, M.; Valentino, R.; Chersich, S.; Meisina, C. Improving the estimation of complete field soil water characteristic curves through field monitoring data. J. Hydrol. 2017, 552, 283–305. [Google Scholar] [CrossRef]
  56. Fredlund, D.G.; Rahardjo, H. Soil Mechanics for Unsaturated Soils; Wiley: Hoboken, NJ, USA, 1993; pp. 286–321. [Google Scholar]
Figure 1. Grain-size distribution of test materials.
Water 09 00758 g001
Figure 2. Fitted soil–water characteristic curve (SWCC) using optimal model parameters and laboratory data.
Water 09 00758 g002
Figure 3. Calculation model.
Water 09 00758 g003
Figure 4. Evolution processes of the random samples.
Water 09 00758 g004
Figure 5. Relationships between random variables after updating.
Water 09 00758 g005
Figure 6. Histograms for random variable distribution after updating.
Water 09 00758 g006
Figure 7. Confidence intervals of the SWCC.
Water 09 00758 g007
Figure 8. Pore-water pressure profiles at section O–O in slopes with different percentiles of SWCC. (a) PCT = 2.5; (b) PCT = 5; (c) PCT = 12.5; (d) PCT = 25; (e) PCT = 50; (f) PCT = 75; (g) PCT = 87.5; (h) PCT = 95; (i) PCT = 97.5.
Water 09 00758 g008aWater 09 00758 g008b
Figure 9. Pore-water pressure profiles in slopes with different percentiles of SWCC (t = 96 h).
Water 09 00758 g009
Figure 10. Pore-water pressure profiles at point M (25,15).
Water 09 00758 g010
Table 1. Summary of statistics of posterior distributions.
a ^ σ a n ^ σ n σ ^ ε 2
0.0166 (kPa−1)8 × 10−71.29641.0 × 10−40.0026
Table 2. Model parameters of the SWCC for different percentiles.
Percentiles (PCT)2.5512.52550/Mean7587.59597.5
a (kPa−1)0.03610.03210.02710.02260.01900.01380.01170.01030.0093
n1.44721.41671.37591.33471.29621.24711.22351.20301.1919
RemarkLB of 95%CILB of 90%CILB of 75%CILB of 50%CIMean curveUB of 50%CIUB of 75%CIUB of 90%CIUB of 95%CI
Table 3. Safety factors for different percentiles of the SWCC.
Percentiles (PCT)2.5512.525507587.59597.5
Safety factor1.7901.7821.7441.6791.5621.3291.2391.1871.162

