Integrated Application of Remote Sensing, GIS and Hydrological Modeling to Estimate the Potential Impact Area of Earthquake-Induced Dammed Lakes


Changjiang River Scientific Research Institute, Wuhan 430010, China
*
Author to whom correspondence should be addressed.
Water 2017, 9(10), 777; https://doi.org/10.3390/w9100777
Submission received: 7 September 2017
/
Revised: 30 September 2017
/
Accepted: 9 October 2017
/
Published: 12 October 2017
Abstract
:Dammed lakes are an important secondary hazard caused by earthquakes. They can induce further damage to nearby humans. Current hydrology calculation research on dammed lakes usually lacks spatial expressive ability and cannot accurately conduct impact assessment without the support of remote sensing, which obtains important characteristic information of dammed lakes. The current study aims to address the issues of the potential impact area estimate of earthquake-induced dammed lakes by combining remote sensing (RS), a geographic information system (GIS), and hydrological modeling. The Tangjiashan dammed lake induced by the Wenchuan earthquake was selected as the case for study. The elevation-versus-reservoir capacity curve was first calculated using the seed-growing algorithm based on digital elevation model (DEM) data. The simulated annealing algorithm was applied to train the hydrological modeling parameters according to the historical hydrologic data. Then, the downstream water elevation variational process under different collapse capacity conditions was performed based on the obtained parameters. Finally, the downstream potential impact area was estimated by the highest water elevation values at different hydrologic sections. Results show that a flood with a collapse elevation of at least 680 m will impact the entire downstream region of Beichuan town. We conclude that spatial information technology combined with hydrological modeling can accurately predict and demonstrate the potential impact area with limited data resources. This paper provides a better guide for future immediate responses to dammed lake hazard mitigation.
1. Introduction
Dammed lakes formed by earthquake landslides are an important secondary hazard induced by earthquakes. Damming objects, sliding from mountain slopes, comprise rocks and weathered soil, which have strong penetrability, low stickiness, and high instability. Damming objects easily collapse and threaten human beings who live downstream [1,2]. Rainfall usually occurs after an earthquake. Given that a high amount of rainfall falls upstream, the damming objects block the runoff and destroy the river function, thereby increasing the water level and the risk of the dam collapsing. A flood that develops under these extreme conditions after a dam collapses is more dangerous than the usual mountain torrent disasters. Such floods will generate a second calamity to the people who have just suffered from an earthquake.
Remote sensing techniques are widely applied for extracting water bodies and monitoring floods [3,4,5,6,7,8,9,10,11]. Using remote sensing images, digital elevation model (DEM), and geographic information system (GIS) can also generate flood mapping [12,13,14,15]. The earthquake-induced dammed lake is formed suddenly with the occurrence of earthquakes. It is not long-standing. Therefore, there is no long-term historical data on the lake that can provide a reference for the study. In recent years, remote sensing of dammed lakes has been researched increasingly due to the frequent occurrence of serious earthquake disasters. People have paid more attention to dangerous lakes that continually threatening the earthquake disaster victims. For example, after an earthquake measuring 8.0 on the Richter scale struck Wenchuan of the Sichuan province of China on 12 May 2008, and the Ya’an earthquake happened on 20 April 2013, many studies have focused on the interpretation of dammed lake properties by using remote sensing images such as DEM and digital orthophoto map (DOM). Many related studies have dynamically monitored dammed lakes forming in the earthquake and have acquired relative lake property information, such as the area, the backwater length, and the water volume, based on multi-platform remote sensing [16,17,18,19,20,21,22]. Very high-resolution (VHR) satellite imagery and the high-resolution synthetic aperture radar (SAR) imagery were also used to assess the effect of the Wenchuan earthquake as a complementary data source to aerial photography [23]. Remote sensing techniques are increasingly important in acquiring firsthand information on emergent dammed lake events.
Remote sensing (RS) was also used to survey the hydrological variations caused by earthquakes. Hsu et al. [24] studied an earthquake of 7.3 on the Richter scale whose epicenter occurred at Jiji, in the central of Taiwan. The effect of earthquake-induced dammed lakes on channel evolution and hydrological analysis of mobile beds was studied based on remote sensing surveys. The RS technique can provide the necessary parameters of the hydrological model. A hydrological model of the dammed lake in Santa Maria Basin, Argentina was established to estimate hydrological variations caused by the newly forming lake [25]. Carmelo et al. [26] combined hydraulic geometry, GIS, and RS into rainfall-runoff models to estimate the flood magnitude in ephemeral fluvial systems.
Meanwhile, several studies on dam-break have been promoted recently. They combined a hydraulic empirical model and a physical model to improve the forecasting accuracy of dam-break floods [27]. Methods on risk assessment related to dam-break floods have obtained increasing attention due to the increase in earthquake-induced dammed lake events [28,29,30,31]. Related emergency strategies and methods based on risk assessment were also promoted [32].
Summarizing the above studies, we conclude that many studies on dammed lakes only use the RS technology that focuses on the current situation, such as the location of the damming object and the current inundated area; these methods have failed to consider future trends. Several GIS studies about dammed lakes have an excellent spatial expressive ability to obtain the reservoir storage, the submerging depth, and the submerging area. However, most of them simply deal with water elevation problems wherein the water surface is assumed to be flat. The hypothesis is approximately appropriate to the upstream of the dammed lake, whereas the hypothesis is not obviously reasonable for area downstream. Hydraulic calculations can exactly forecast the future flood routing, but they are usually not combined with RS and GIS and lack a spatial expressive ability. Moreover, hydraulic calculation is time-consuming and requires massive boundary conditions, whereas the dammed lake formed by a sudden landslide usually lacks complete data to support the complex hydraulic calculations. Dammed lake disasters must take full advantage of limited data resources to conduct emergency response in a short time. The response must effectively and rapidly estimate the corresponding potential impact area based on different given dam-break conditions. Therefore, this study combines RS, GIS technologies, and hydrologic data to establish an effective method to estimate the impact risk of dammed lakes in the corresponding downstream regions under different water elevation conditions. The study in this paper can be widely applied to different earthquake-induced dammed lake cases because it only requires DEM, historical hydrological data, and current RS images that are easy to obtain.
2. Study Area and Dataset
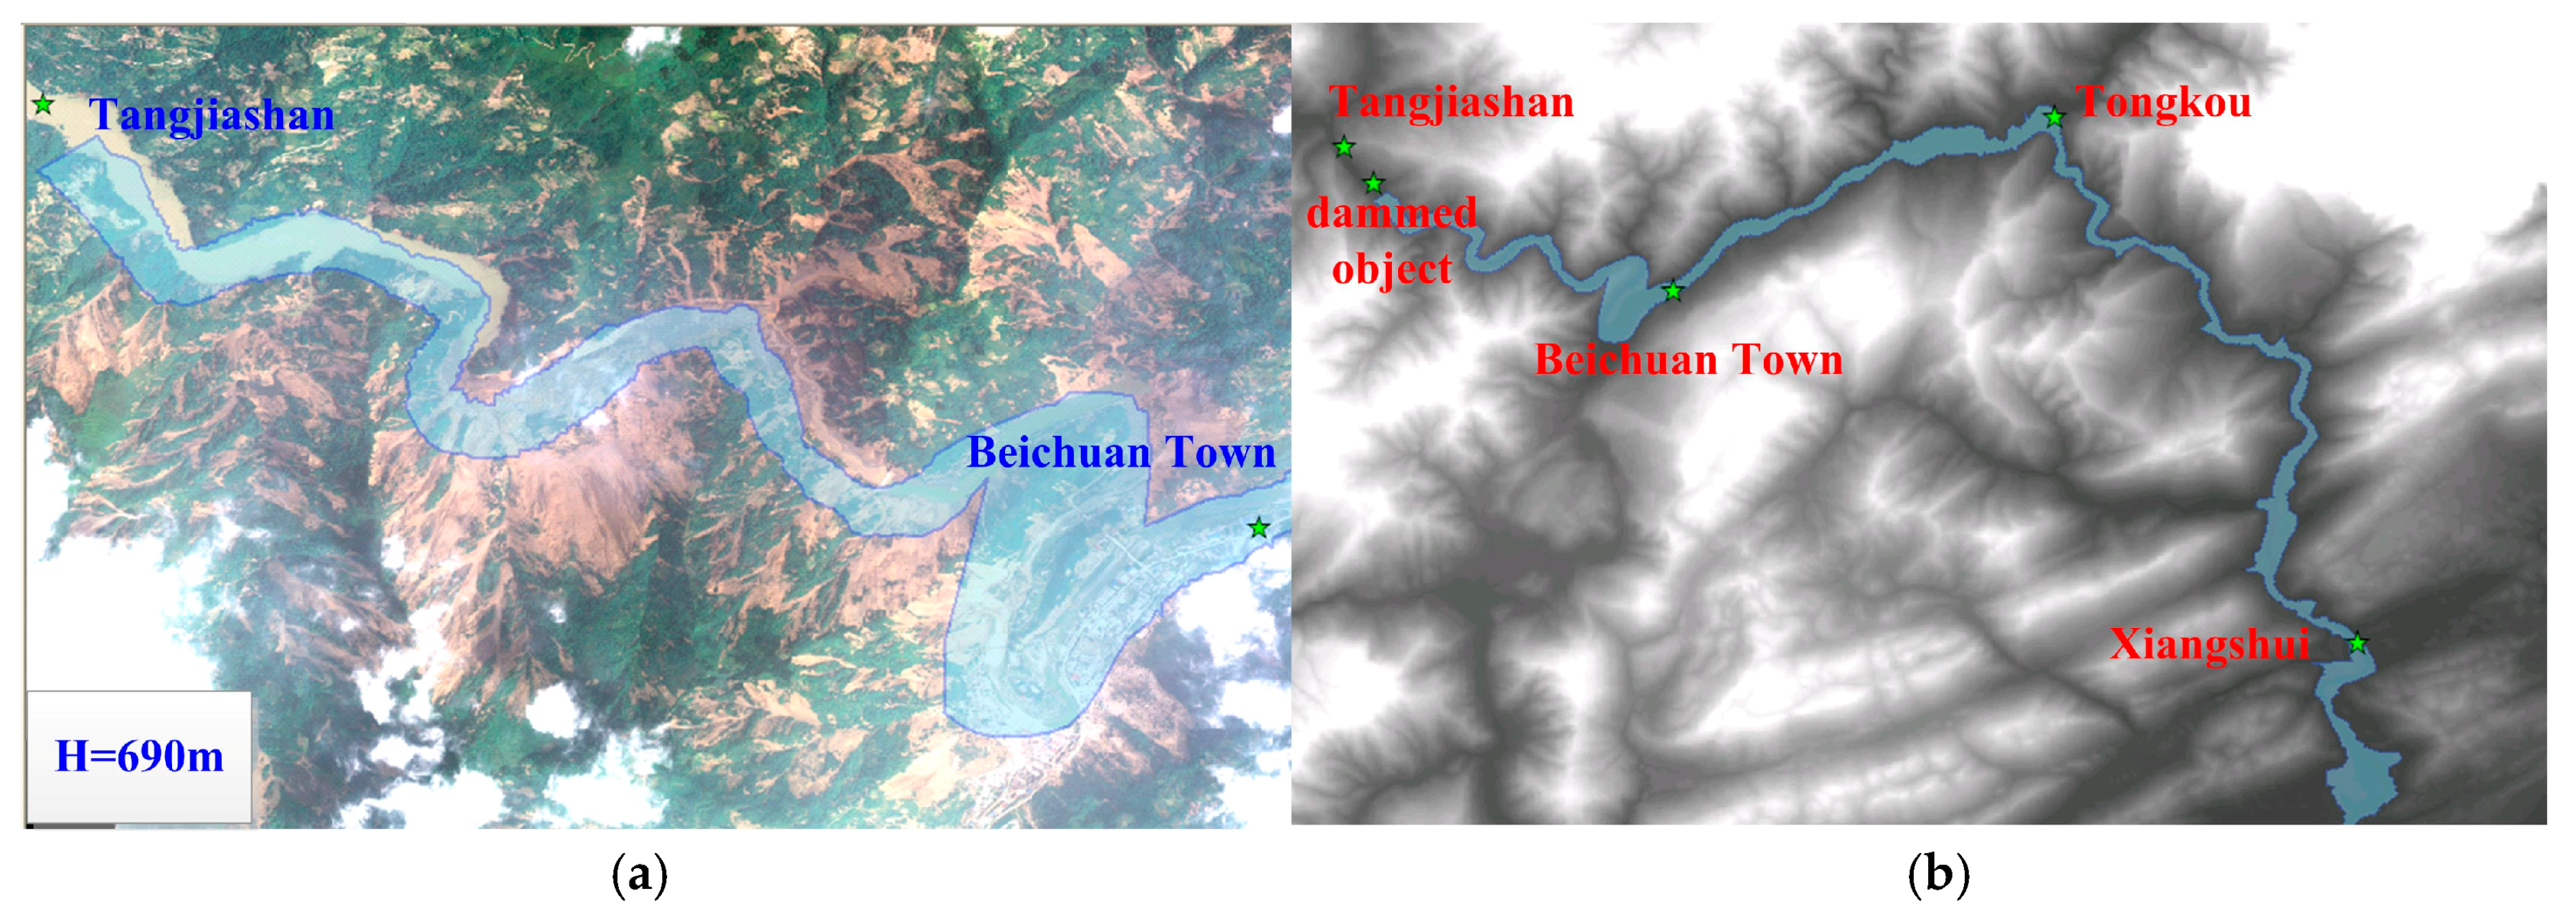
On 12 May 2008, a magnitude 8.0 earthquake occurred in Wenchuan country, Sichuan province, China. The earthquake induced a massive mountain landslide that destroyed the natural river discharge function and formed 33 large dammed lakes. The largest dammed lake, Tanjiashan dammed lake, was selected as the study area. Tanjiashan is located at the upstream of the Xun River and is only six kilometers from Beichuan town, which is the largest town downstream from the dammed lake and was also severely afflicted by the Wenchuan earthquake disaster. Thus, Tanjiashan dammed lake has the highest risk level among all of the dammed lakes.
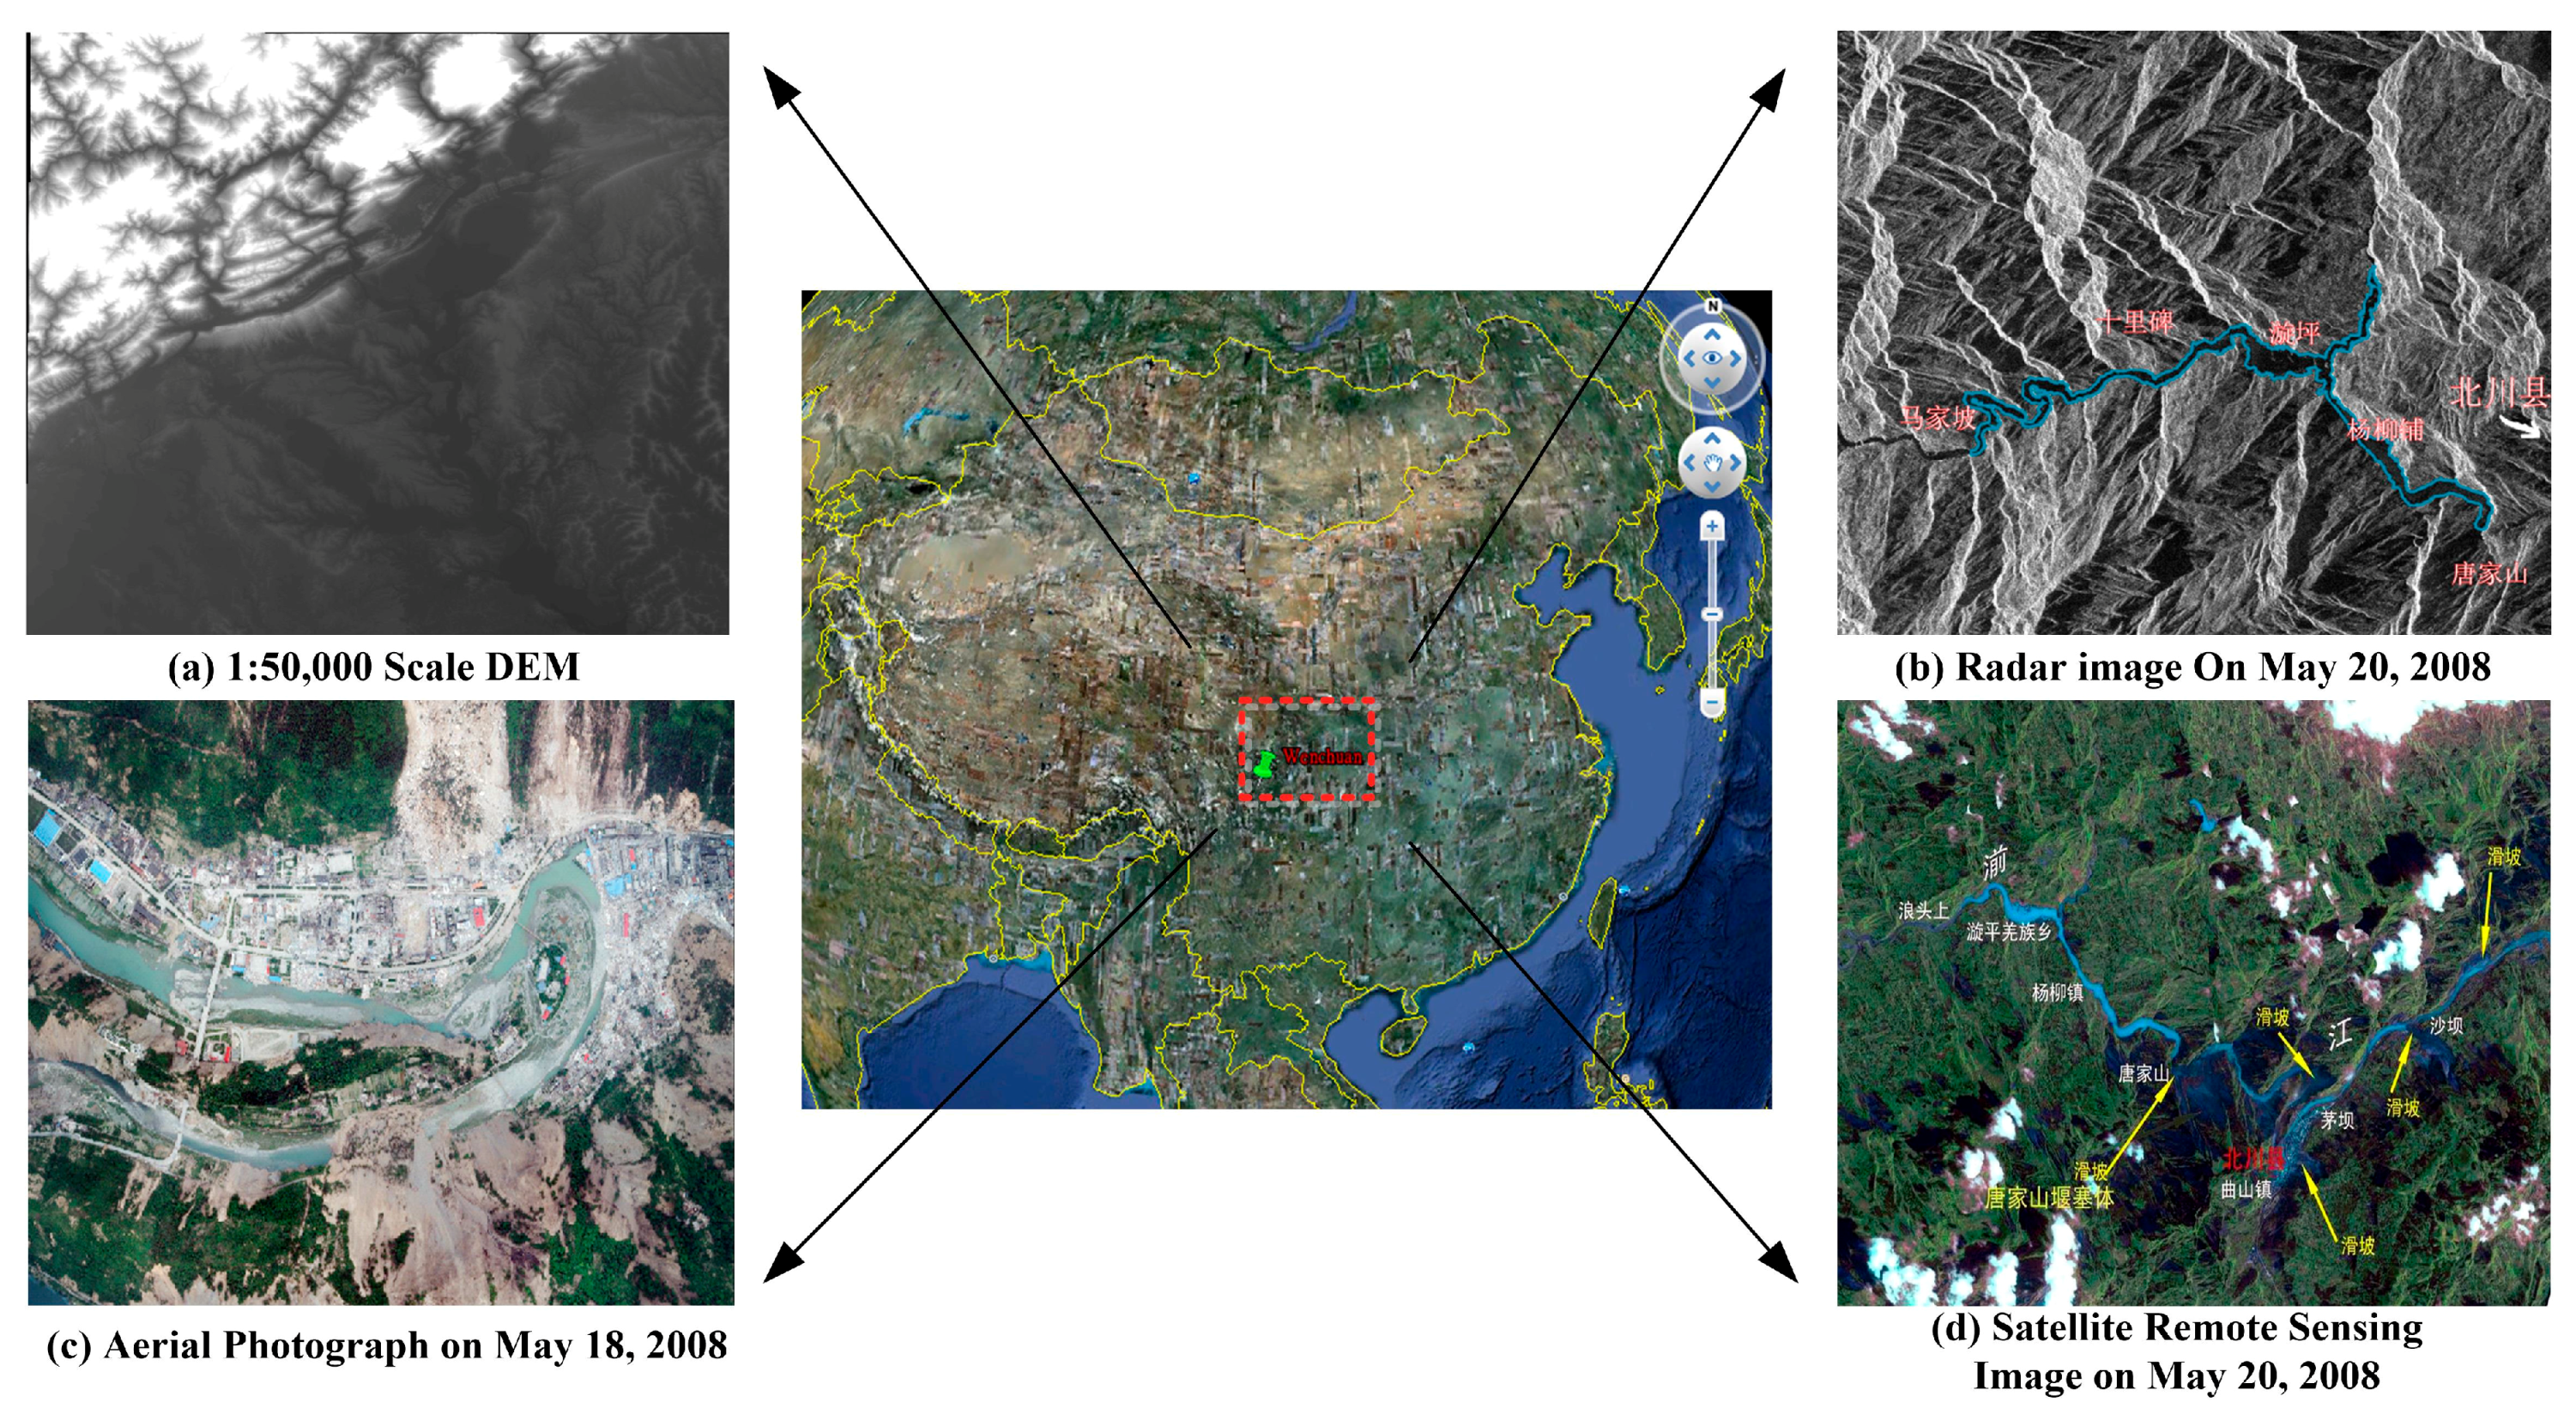
The experimental data mainly include DEM, various satellite RS images, aerial photographs, and historical hydrologic data (observed at Tongkou and Xiangshui hydrologic stations) (Figure 1). All of the images employed in the study are referenced in the World Geodetic System (WGS84) datum, and are projected to the Universal Transverse Mercator system. Further information about the specifications of the data used in this study is provided in Table 1.
3. Methodology
The research process is demonstrated in Figure 2.
3.1. Extraction and Calculation of Dammed Lake Parameters
The dammed lake’s characteristic parameters, including its location, current submerged area, storage volume, and other geometric characteristics, can be extracted based on the DEM data obtained before the earthquake and the RS images acquired after the earthquake. The dammed lake’s geometric parameters, including the location, size, and area of the damming object, were acquired by visual interpretation from Formosat-2 images. The reservoir storage capacity curve was calculated based on the DEM when the location of the dammed lake was known. The elevation versus reservoir capacity curve is essential in forecasting the tendency of the downstream potential submerged area that affects the estimation of the submerging loss and risk avoidance decision. We applied the eight neighborhoods seed-growing algorithm [33] to calculate the reservoir storage capacity curve based on the DEM data.
The principle of the algorithm is to locate damming objects from RS images acquired after the earthquake, where a line segment across the river channel is set as a pretend dam body. A seed origin at the center of the upper dammed lake is selected to spread on the DEM below a given elevation. In designing the algorithm, the elevation value of the line segment across the river channel can be first set to an invalid value (Null) or a maximum (such as elevation = 99,999). When a seed grows nearby the dam site, it cannot cross the dam and proceed downstream because of the existence of the invalid values. This method is similar to the clustering method in the image process. It is an iterative or recursive judgment process for computer programming. It repeatedly judges whether the given elevation H0 is higher than seed’s eight neighborhoods. If the elevation of any neighborhood is lower than H0, then the neighborhood (pixel) would be viewed as a submerged grid and pushed to the top of the stack. Then, the pixel on the top of stack will be selected as the current seed. If no neighborhood satisfies the condition (lower than ), then the current seed will be ejected from the top of the stack. The push and pop-up circle will repeat until all the seeds in stack are ejected. When finding a satisfied grid, the accumulated volume is added to the current volume, which can be expressed with the following equation:
Finally, the number of grids, once pushed into the stack, represents the submerged area. The accumulated volume is the reservoir capacity corresponding with the condition.
After a group of given water level values were assumed to calculate the corresponding water surface area and reservoir capacity with DEM data, the elevation versus area and reservoir capacity curve was established by the above calculation results.
3.2. Dam-Break Flow Calculation
The weir flow empirical formula (Equation (2)) was adopted to calculate dam-break flow:
where is outflow, is the free fall acceleration, is the overflow surface width, is the flow coefficient, is the side contraction coefficient, and is potential head, including the elevation heads and velocity heads. Upon initiating the dam-break mode, the break shape and time step are given, and the outflow process can be calculated. The break shapes can be divided into several typical styles, such as a triangle or trapezoid. The dam-break modes can also be an entire break, a half break, and a 1/3 break. In fact, the real time of dam-break is unknown. People usually assume several typical time schemes of dam-break, such as 1 h entire break, 2 h entire break, and 6 h entire break. The continuity Equation (3) is expressed as follows:
where is the time step; is the reservoir capacity variation; and are the inflow and outflow of reservoir, respectively; and, n is the length of the time series. The water elevation determines and . All of the parameters in Equation (3) are known except . According to the Equations (2) and (3), storage capacity versus elevation curve and the break shape, represented by the dynamic coefficient , can be solved. The dam-break flow is the initial condition for the downstream flood routing. The potential impact area is formed by the largest flood; thus, we select the most dangerous combination, in which entire break mode consumes 1 h.
3.3. Flood Routing with an Improved Muskingum Method
The Muskingum flood routing method was adopted in this paper to calculate the potential impact area downstream because of its accuracy and simplification.
3.3.1. Muskingum Method
The principle of the Muskingum method can be described by the difference form of continuous equation and the channel storage equation [34]. The equations are expressed as follows:
Through simultaneous of Equations (4) and (5), the Muskingum flood routing equation is defined as follows:
where,
where (input) and (output), respectively, represent the inflow rate and outflow rate to the reach, is the water storage between the upper river section and the lower section, and and are equation parameters. Equation (6) is the basic equation. If the parameters, namely, , , and are known, then the outflow sequences can be calculated according to Equation (6) when the inflow sequences and initial outflow are given.
3.3.2. Parameter Optimization with Simulated Annealing
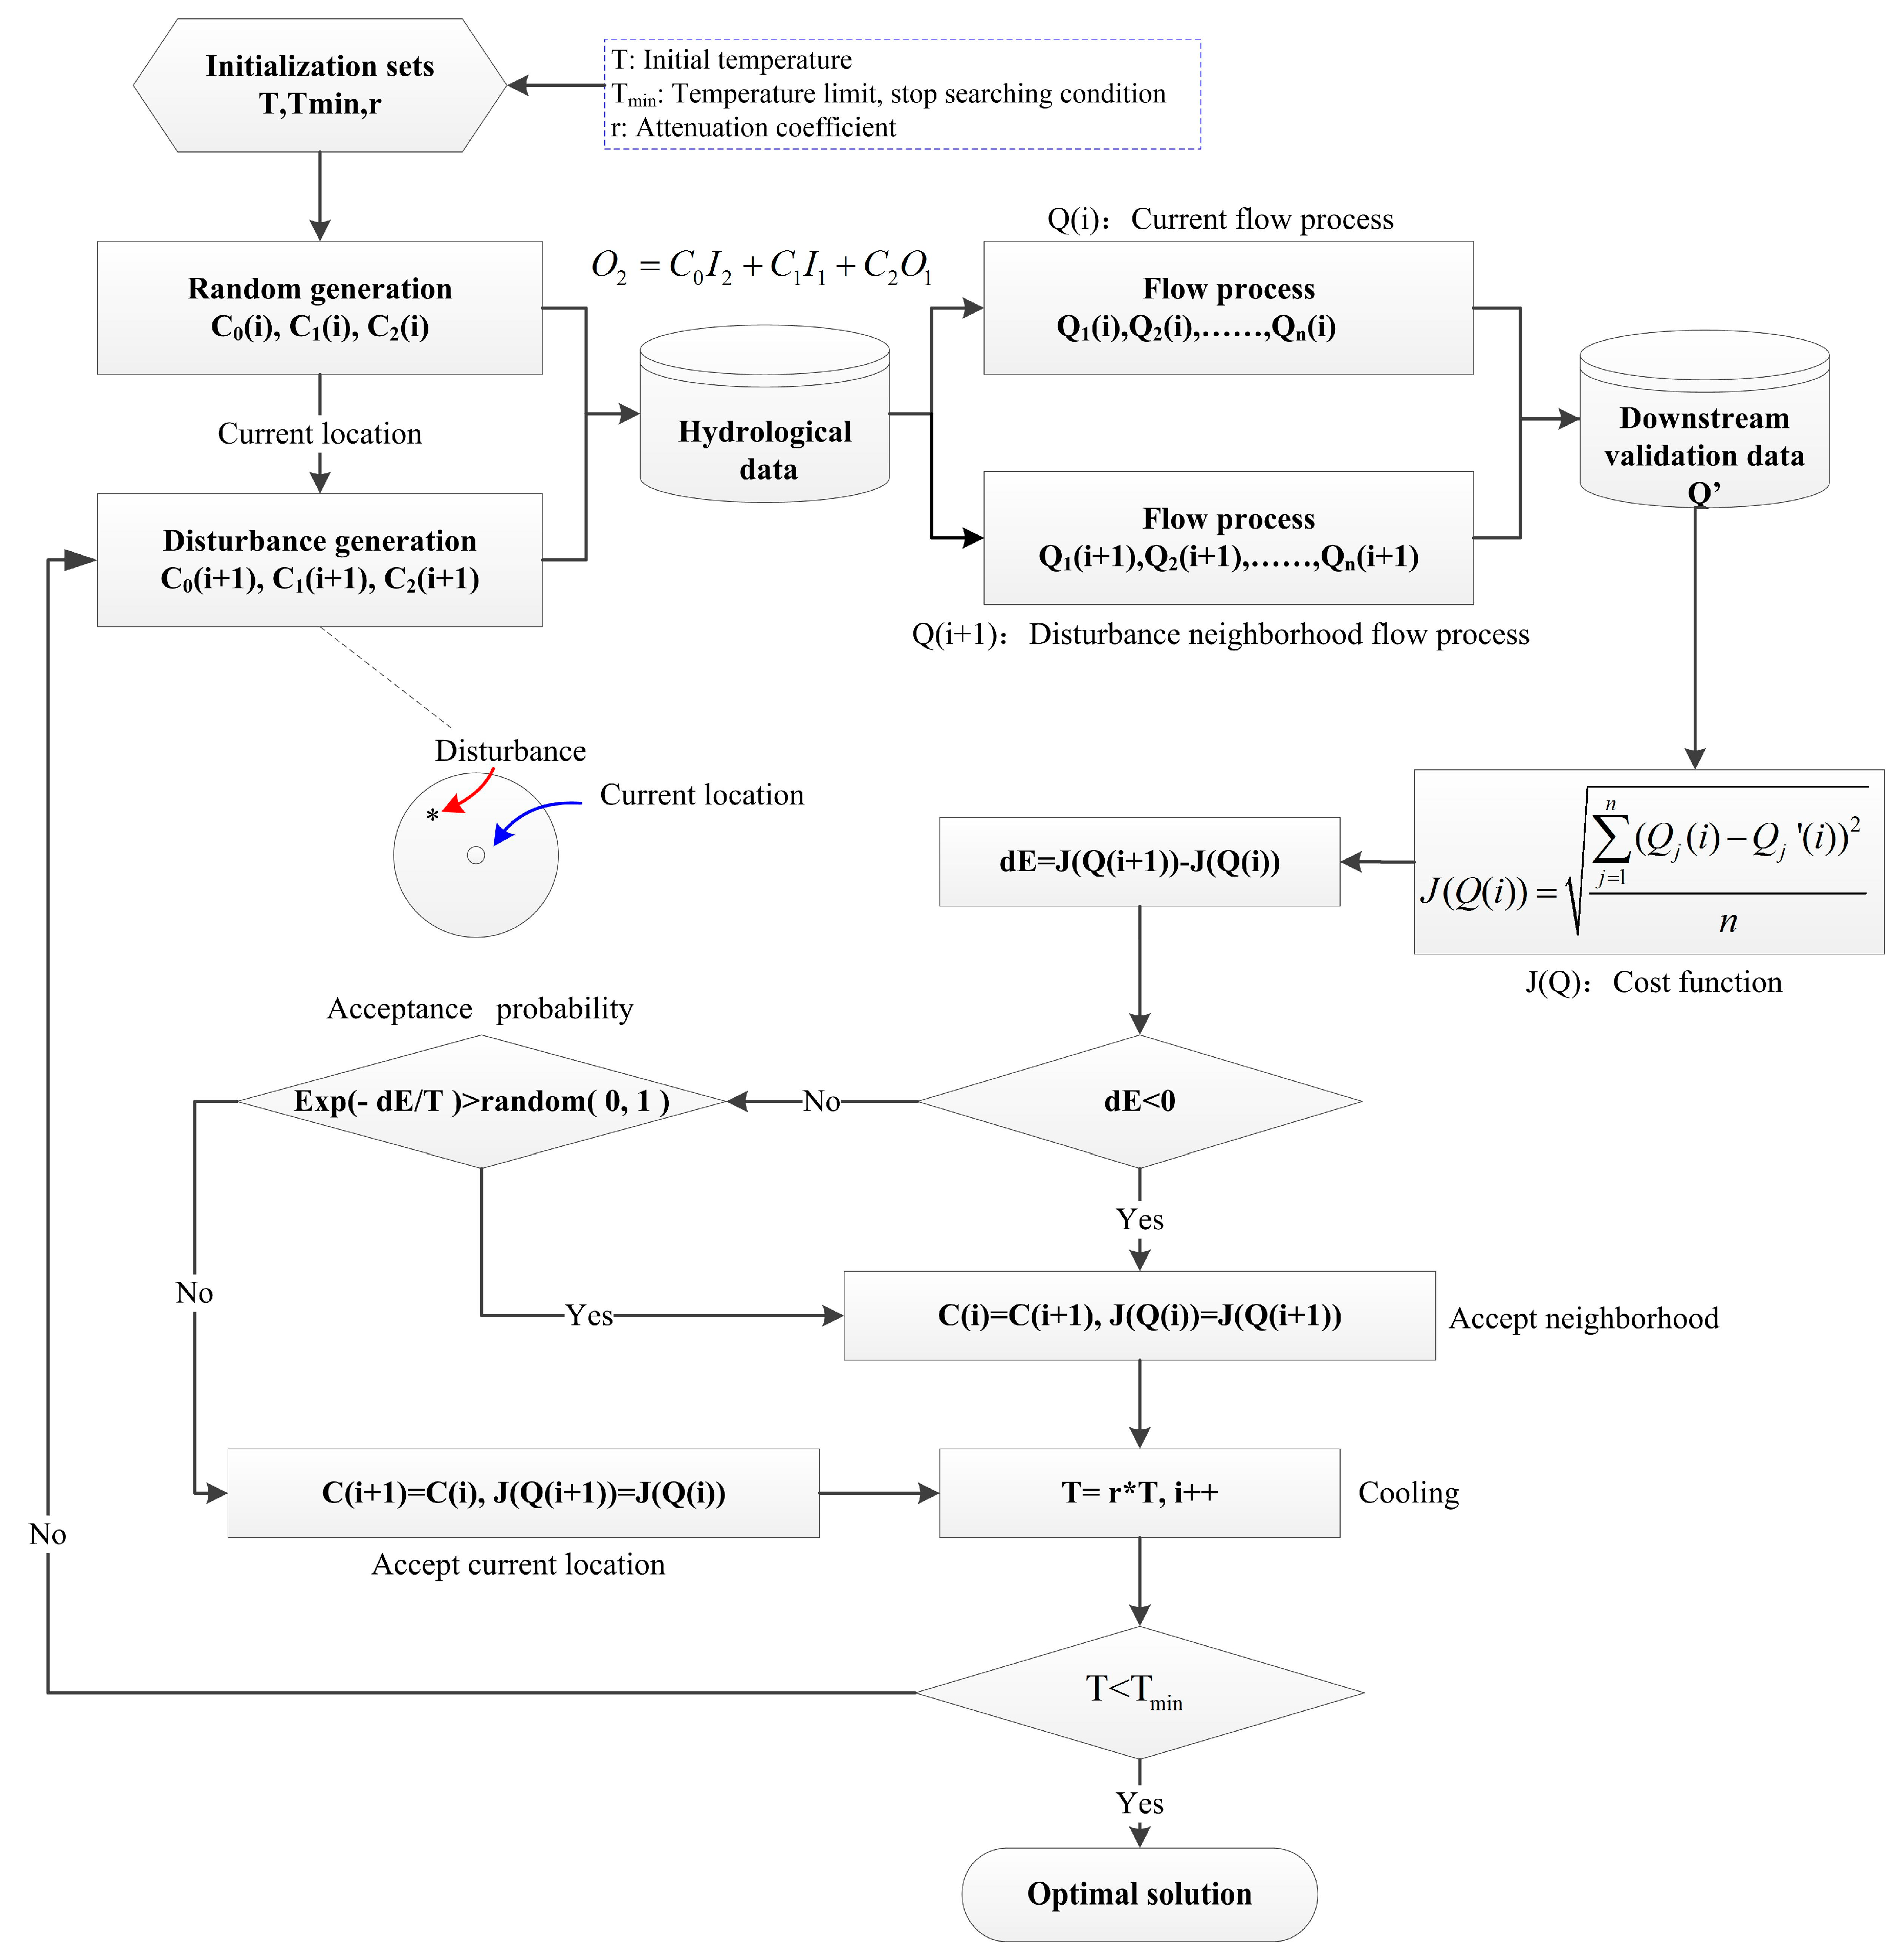
The key of the Muskingum flood routing method is determining the equation parameters. The traditional method of solving equation parameters is a tentative calculation algorithm with low efficiency and low precision. Simulated annealing (SA) [35], one of the intelligent algorithms, is used to solve the Muskingum parameters in this paper. SA, which is derived from thermodynamics theory to simulate the annealing process, is a universal probability algorithm. The algorithm simulates the slow temperature descent based on the initial given temperature parameter and searches the optimal solution of a subject in the entire solution space.
The algorithm structure is shown in Figure 3. After the initialization setting step, the SA procedure generates random equation parameters, , as the current location. The last parameter, , can be used instead of . Then, the other group of C parameters is generated and considered as a disturbance neighborhood near the current location. The program uses the Muskingum flood routing equation (Equation (6)) to calculate both outflows according to the mass hydrological historical data. The program also applies a cost function (Figure 3) to check which group of parameters is better. The cost function comprises a mean square deviation formula that judges the difference between calculated outflow and practical outflow acquired from hydrological observation stations. If (Figure 3), signifying that is better than , then the neighborhood will be accepted to be current solution. Otherwise, some acceptance probability is used to accept the worse neighborhood. The purpose of acceptance probability is to avoid falling into a local minimum instead of global optimization at the beginning of calculation. According to the instance, a higher T indicates that searching time is not yet long and is likely to decrease. Thus, the probability deciding to jump the circle of local optimization is greater than that during the late cooling stage. Likewise, a smaller illustrates that the difference between the current location and the neighborhood is little and the program can accept a worse neighborhood in a certain probability to extend the beneficial searching scope.
The SA method is independent of an initial value and asymptotic convergence. It improves on the traditional Muskingum tentative calculation and avoids solving middle parameters , and judging the curve regardless of whether a line is approached or not (ending condition). Its advantage is its direct adjustment of equation parameters .
3.4. Estimation for Potential Impact Area
3.4.1. The Runoff vs. Elevation Curve
When the runoff peak spreads through downstream hydrologic stations, the submerged area achieves a maximum (potential impact area). The Muskingum flood routing result is the indirect runoff information, not the elevation information itself. Thus, the flow must be translated into a corresponding elevation by the runoff versus elevation curve acquired from survey data polynomial fitting. The polynomial fitting on every hydrologic station section represents the relationship between the runoff with the water level based on long-term observation data. The quadratic or cubic equations usually fit the runoff versus elevation curve very well for mountainous rivers, most of them having simple regular fluctuations.
3.4.2. Estimation for Dam-Break Damage based on Remote Sensing Image and DEM
Through the Muskingum flood routing method and the runoff versus elevation curve, we obtained all of the maximum water levels at every hydrologic station section. However, the hydrologic stations were limited, and the downstream water elevation was descending along the river channel. Therefore, this study adopted the distance interpolation method to deal with the maximum water level of the control sections (including dam, hydrologic stations) and generated a series of dense elevations in all of the segments along the river. The river channel was divided into many segments. All of the segments were manually divided by approximately equal distances and were vertical to the river channel. The maximum water level at each section was interpolated by distance and the known water level.
The potential impact area at every segment was generated by the dense elevation values and the DEM data. We used the seed growing algorithm identical to the one used when calculating the elevation versus reservoir capacity curve. The calculation formed a series of segment documents. The entire impact area downstream was generated by overlaying all of the segment documents. The submerged elevation at every segment was viewed as flat. Thus, the junction about the adjacent segments was not smooth. Sometimes we could use enveloping line or smooth algorithm to obtain the smooth submerging boundary. Once the impact area was known, we could generally analyze the submerging depth and area and evaluate the disaster population, economy loss, and other essential damage information by overlaying the impact area, DEM, and RS image.
4. Calculation Example and Analysis
4.1. Dammed Lake Parameters based on DEM and Remote Sensing Images
According to the results interpreted by the multisource remote sensing images (Formosat-2, Aerial photograph.), the location of Tangjiashan dammed lake is approximately 104°24′27″ E and 31°51′30″ N. The shape of dammed objects is rectangular. The length along the river is approximately 803 m, and the width is 611 m. Combining RS images with the DEM shows that the top of the damming objects is 775.0 m on the right bank of the river and 793.9 m on the left.
When basic spatial information about Tangjiashan dammed lake is known, we assume a group of characteristic water level values and apply the eight neighborhoods seed growing algorithm to calculate the reservoir storage capacity curve based on the DEM data. The elevation-area-reservoir capacity curve and submerged range are shown in Table 2 and Figure 4.
4.2. Dam-Break Flow Calculation Result (H = 700 m)
The weir flow empirical formula (Equation (2)) and continuity equation (Equation (3)) were adopted to calculate dam-break flow. In this calculation example, the water elevation was 700 m, and the weir bottom elevation was 600 m. We adopted an entire break mode and selected a trapezoidal break shape. The hydraulic calculation result corresponding with the above conditions is shown in Table 3.
The result demonstrates that the entire flood process finished in a short time (approximately 60 min), and that the flow suddenly decreased to the upstream natural inflow whose value adopted the observation average (76 m3/s). The dam-break period (approximately 17 min) can be neglected when compared with the time when the flood spreads in the channel. Meanwhile, the potential impact area concerns the flood peak; thus, we can select the dam-break flow maximum (Q0 = 83,620 m3/s) as the initial inflow.
4.3. Flood Routing Result (H = 700 m) with an Improved Muskingum Method
4.3.1. Muskingum Parameters Calculation with the Simulated Annealing Method
The Muskingum Parameters were trained by abundant historical data acquired from hydrological observation stations (Tongkou and Xiangshui stations). When the cost function convergence error in the SA method was stable, the Muskingum parameters in Tongkou and Xiangshui achieved optimization solutions (Table 4).
4.3.2. Validation of the Muskingum Parameters
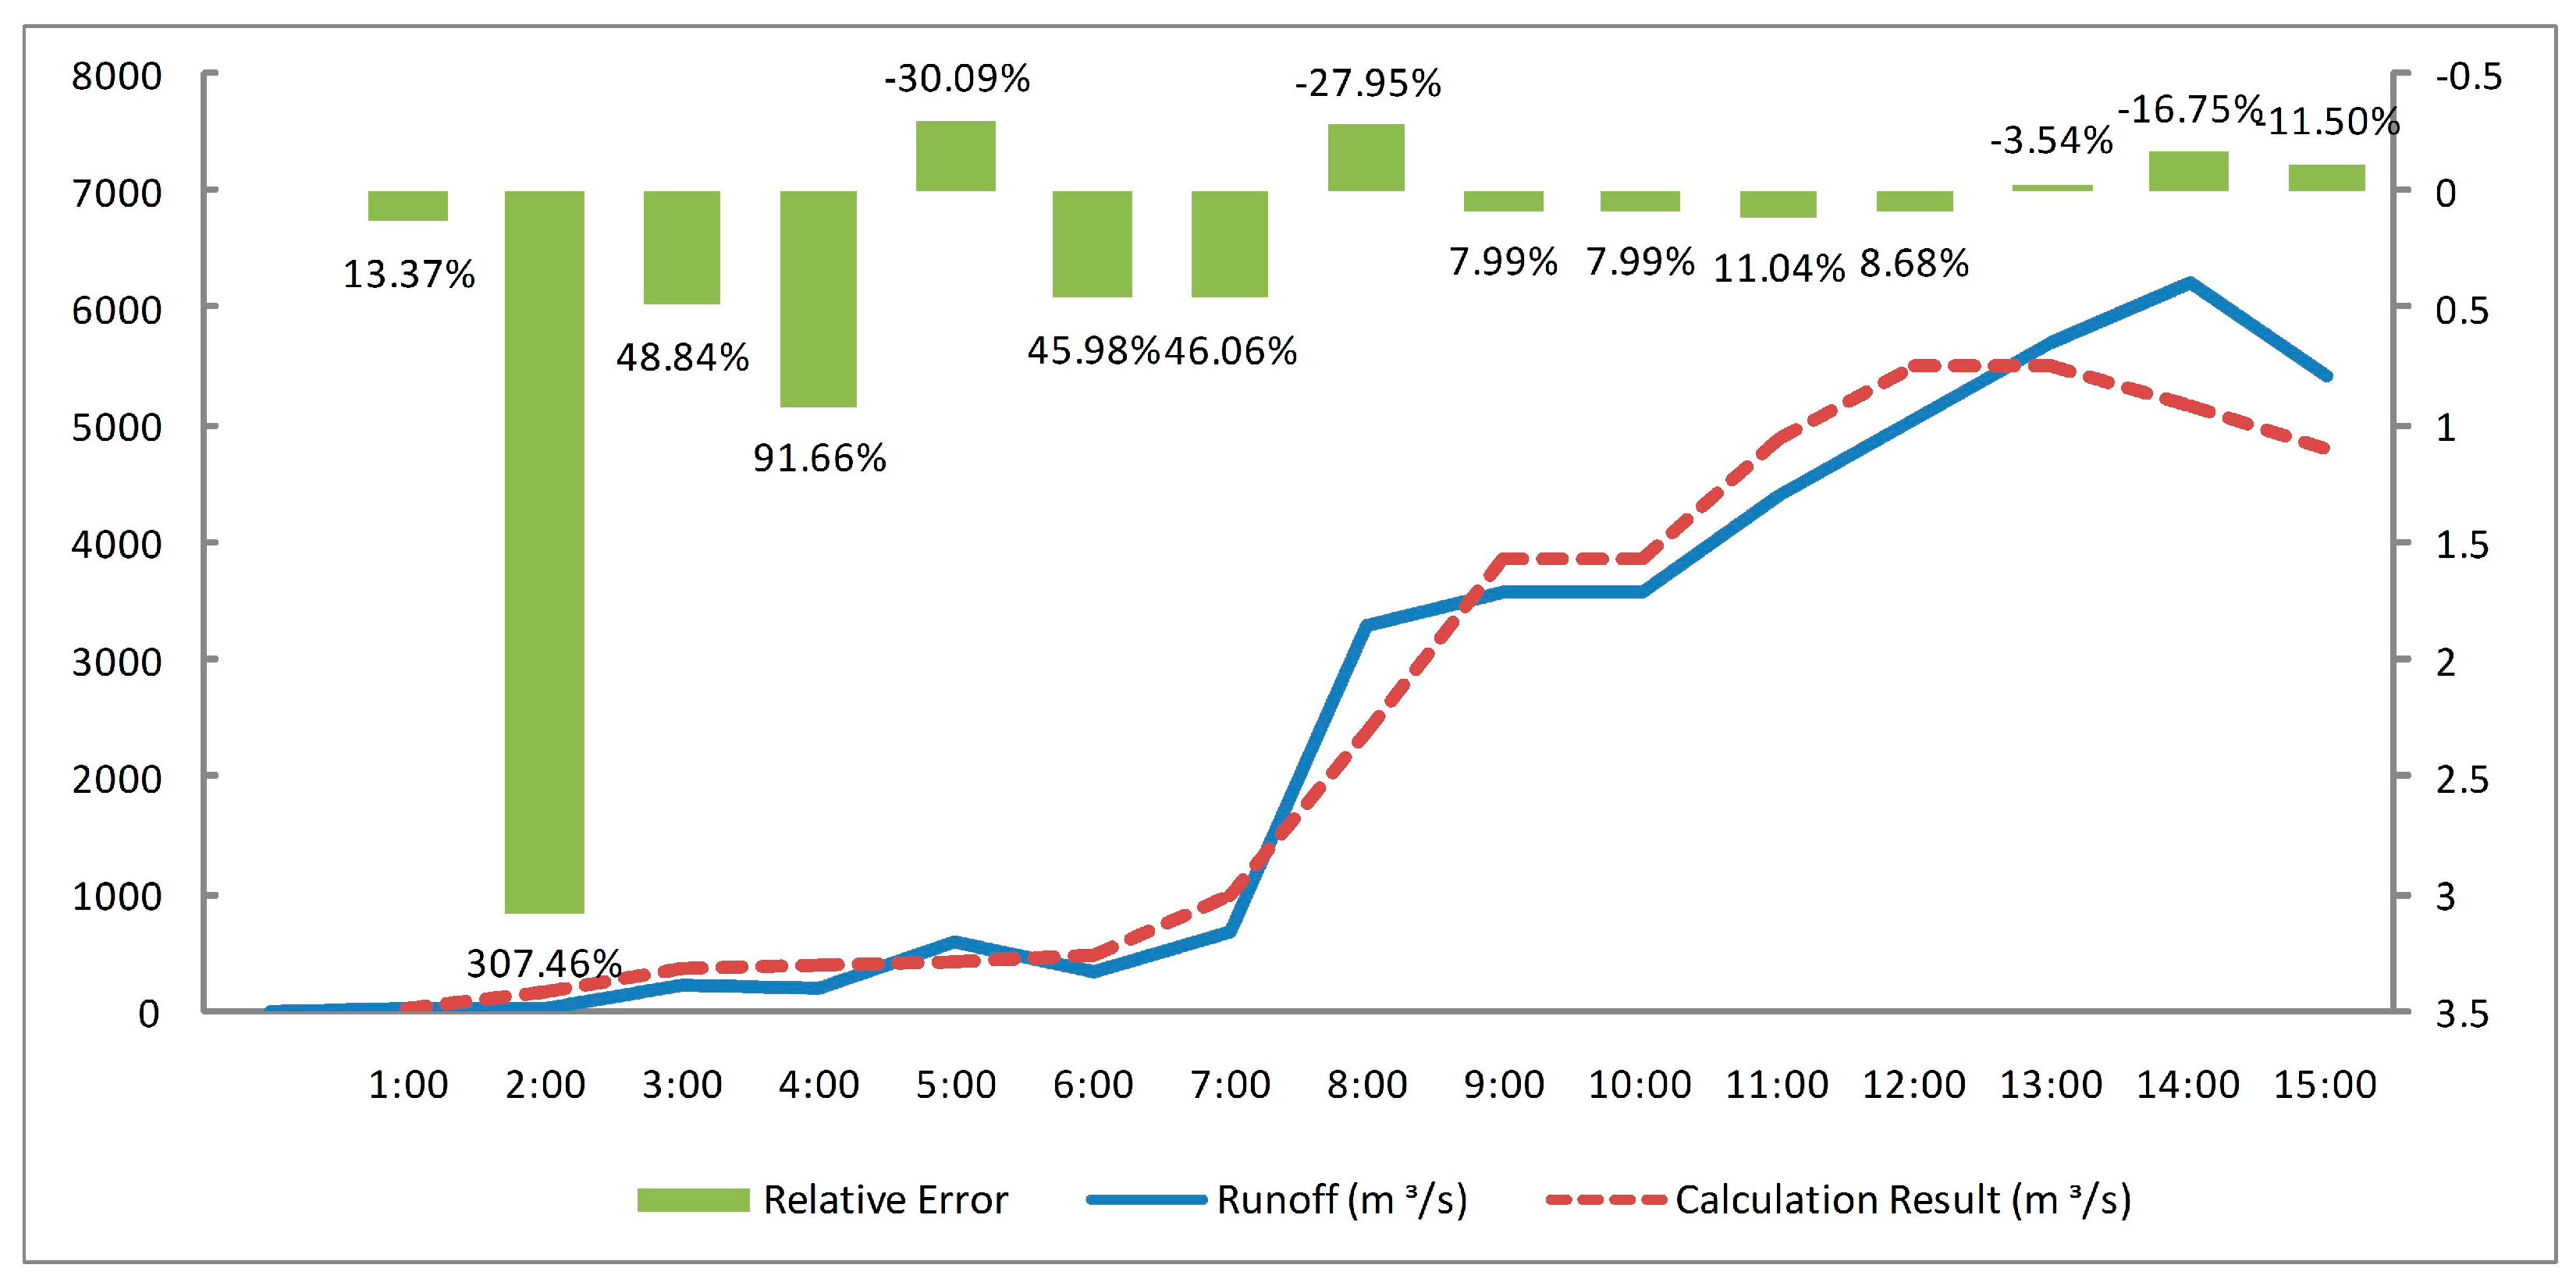
The measuring runoff data after the earthquake was selected to validate the Muskingum parameters. The flood that occurred on 10 June 2008 was used as a test sample to check the accuracy of the Muskingum parameters. The Muskingum flood routing equation (Tangjiashan to Tongkou) is expressed as follows:
The field survey data Q measuring at Tangjiashan station was considered as known inflow condition (I2, I1). The 23 m3/s value is viewed as the initial outflow condition (O1) at Tongkou station. The outflow sequences could be calculated according to the Equation (8). Comparing outflow sequences with field survey data Q′ measuring at Tongkou station, the coefficient test result is shown as below (Table 5 and Figure 5).
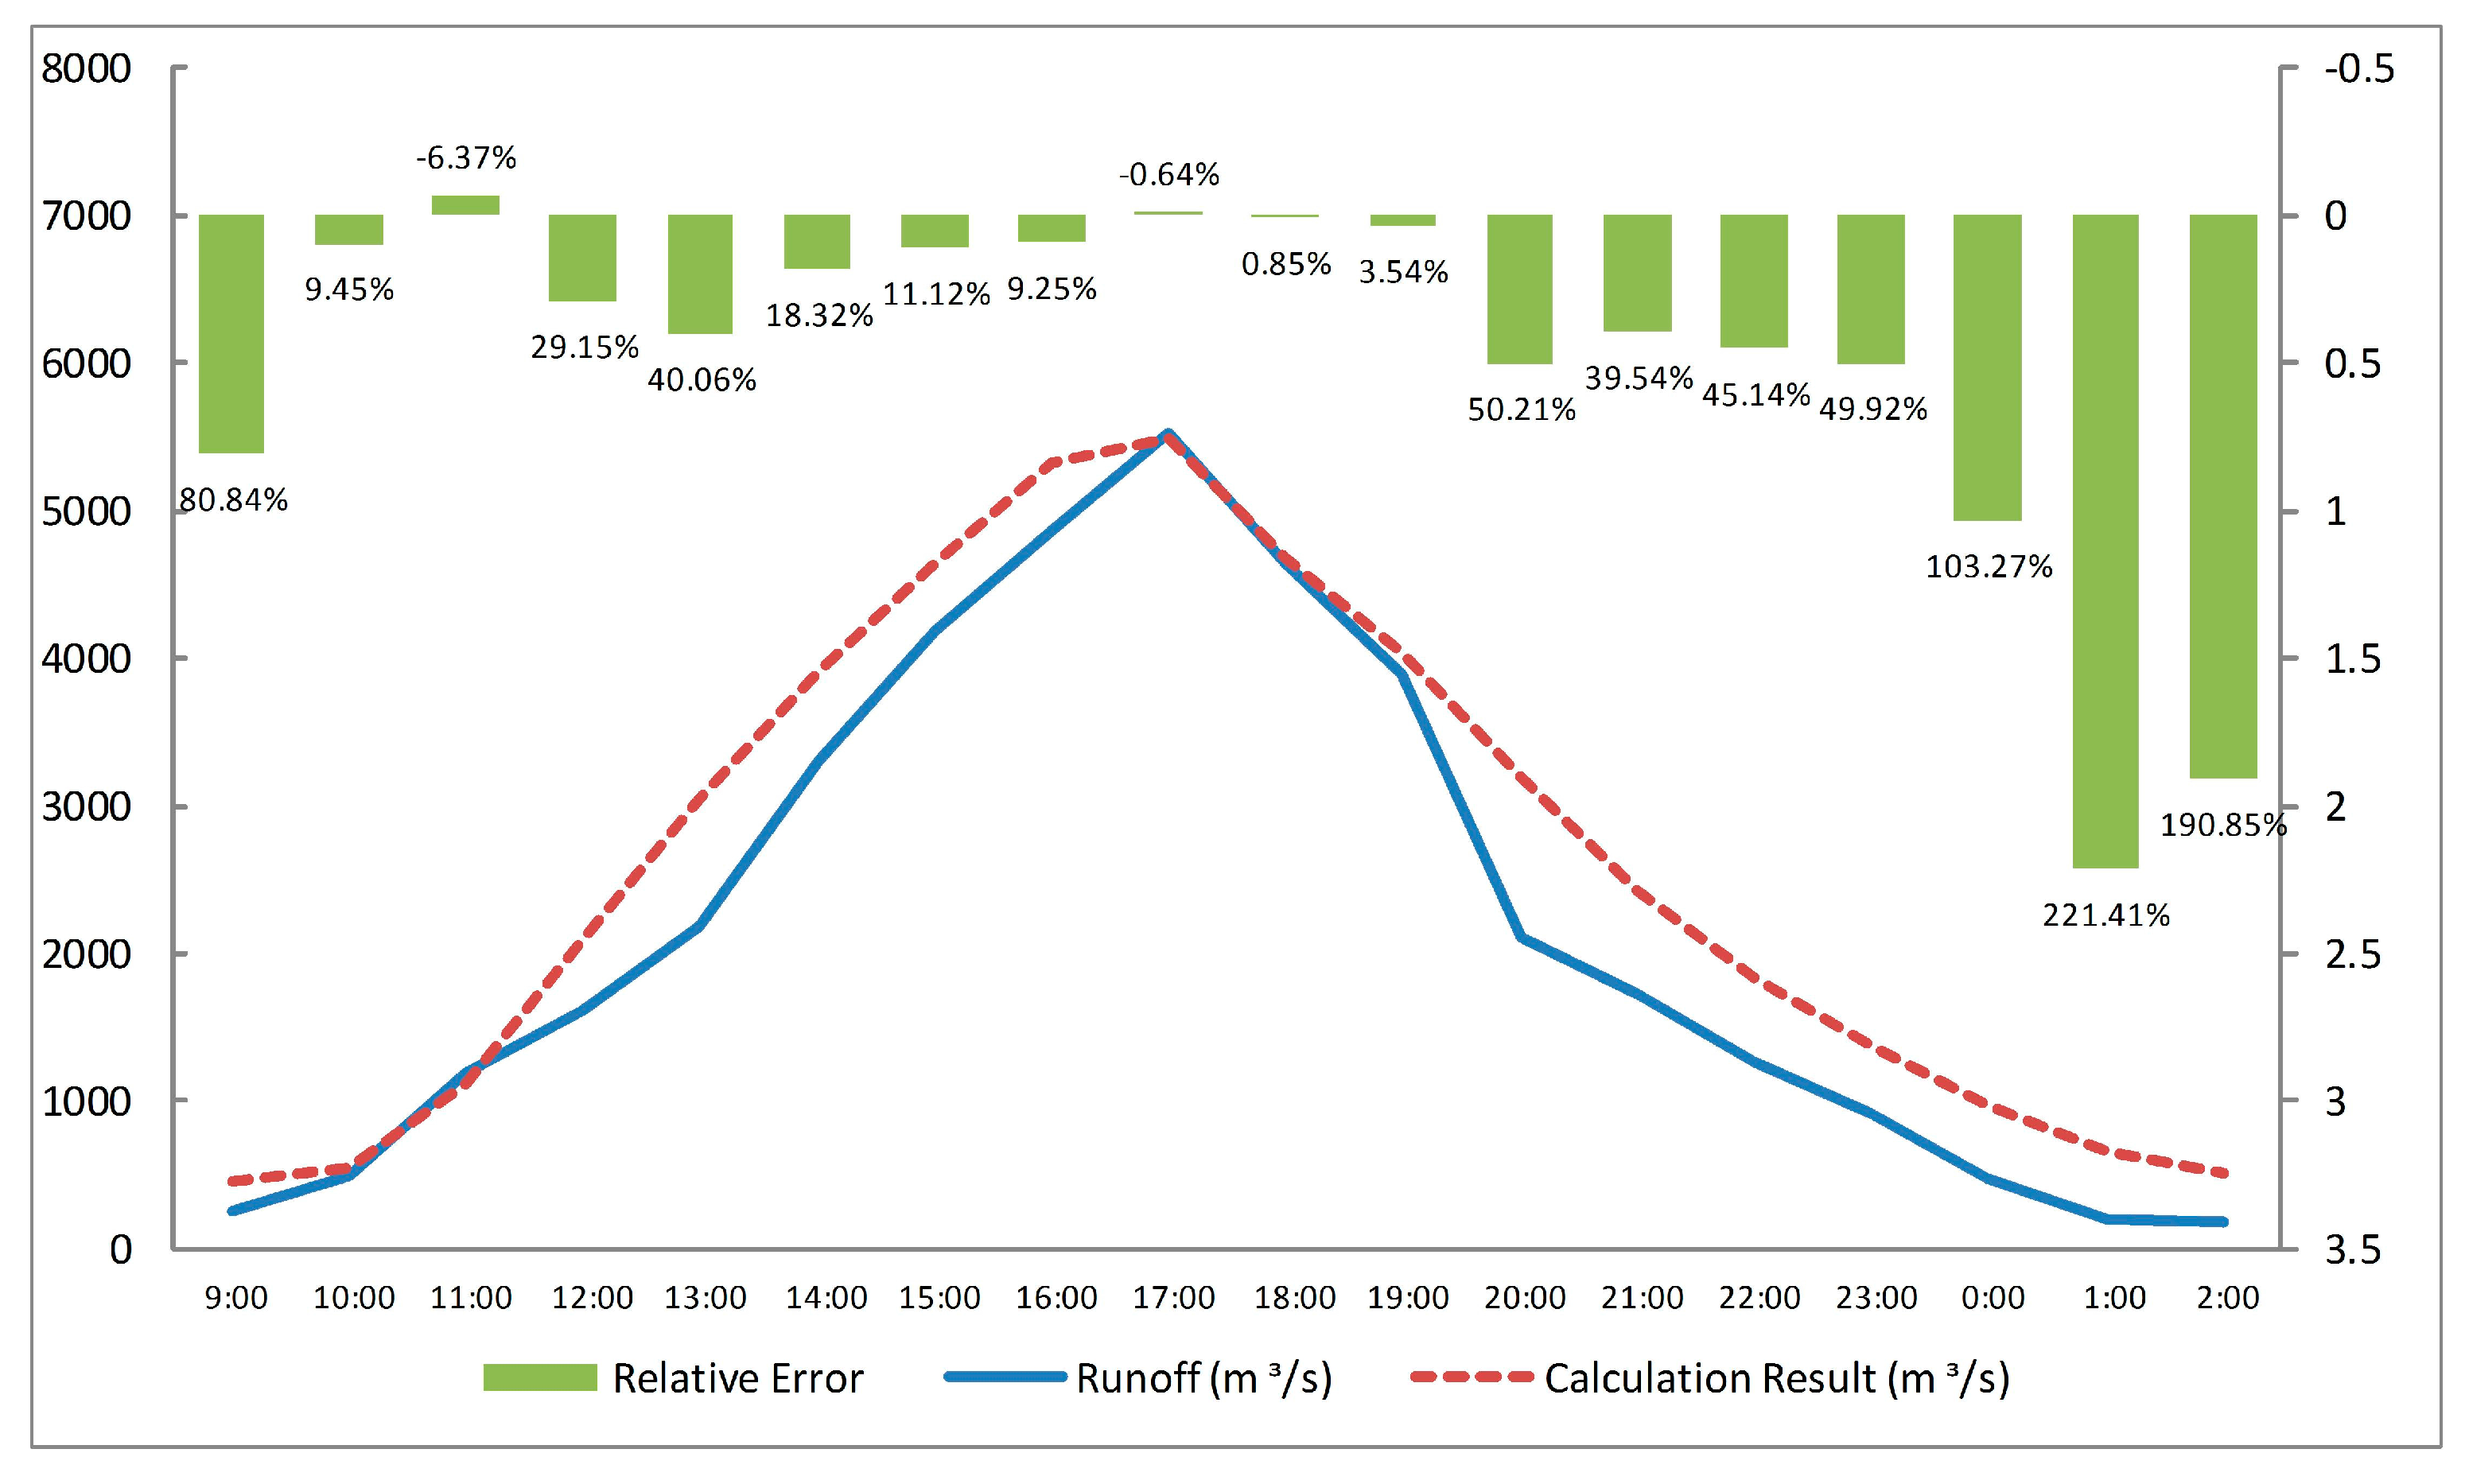
Similarly, the flood that occurred on 12 June 2008 was used to check the Muskingum parameters of Xiangshui section. The Muskingum flood routing equation (Tongkou to Xiangshui) is expressed as follows:
The process of calculation is the same as the above. The data table is abbreviated because of the length of paper. The coefficient test result at Xiangshui station is shown in Figure 6.
Table 5 and Figure 5 and Figure 6 show that the training parameters can ensure that total forecasting error is least when the cost function comprises a mean square deviation formula. The strategy of error control determines that a larger flow correlates with a higher weight impacting on the cost function. Thus, the peak flood flow is forecasted more exactly than the bottom of the flow. For example, the relative error of the peak flood flow is −0.64%, and is obviously more exact than the small flow in Figure 6. In this paper, our goal is to analyze the widest submerging area that corresponds with the peak flood flow. The outflow simulation is therefore appropriate for this study.
4.3.3. Flood Routing Result (H = 700 m)
Once a dammed lake is generated, it blocks the surface runoff, thus leaving only a small base flow in the river. The base flow primarily generated by groundwater is a small, stable value. It can be acquired by observation after the formation of a dammed lake (dammed lake 3.2 m3/s, Tongkou 4 m3/s, and Xiangshui 2 m3/s). They are the initial inflow and outflow in Muskingum flood routing. The flood routing result (H = 700 m) is given in Table 6 and Table 7 below.
4.4. Estimation for Potential Impact Area (H = 700 m)
The runoff is plotted in Figure 7a according to the Muskingum flood routing results. When the runoff peak spreads through the Tongkou and Xiangshui stations, the submerged area achieves the maximum. The flow can be converted to a corresponding elevation by the runoff-versus-elevation curve (Table 8) acquired from survey data polynomial fitting. The conversion result shows that the highest impact elevation is 565.89 m in Tongkou and 537.47 m in Xiangshui.
Finally, the study adopted the distance interpolation method to deal with 700 m in dammed lake, 565.89 m in Tongkou, and 537.47 m in Xiangshui and to generate a series of dense elevations in all the segments along the river (Figure 7). All of the sections are manually divided by approximately equal distances and are vertical to the river channel. The potential impact area at every segment was generated by interpolating elevation values using the seed growing algorithm. The entire impact area was obtained by overlaying those segment results. To obtain a smooth junction, we used a smooth algorithm to deal with the entire impact area.
When the water elevation H was 700 m and the weir bottom elevation was 600 m, Figure 8 shows the potential impact area (smooth result) when adopting an entire break mode and selecting a trapezoidal break shape.
From the submerging result combining the DEM and RS images, we find that a given dam-break flood forming after an earthquake can destroy the entire Beichuan Town, which was already severely afflicted by the Wenchuan earthquake disaster. Based on downstream impact research, quickly estimating the loss of dam-break flood disasters is possible by using a GIS overlay analysis function that can generally analyze the population, economy, submerging depth, and other essential information.
5. Discussion
Usually, flood routing using hydraulics methods requires complicated grid calculation and various boundary conditions. Consequently, the hydraulics methods are time consuming and cannot provide a series of submerged areas corresponding to different water levels in a short time. The study in this paper obtained potential impact areas with scarce data resources (DEM, historical hydrological data, and current RS images). Furthermore, the improved Muskingum method could simplify the calculation process and significantly improve efficiency. It could rapidly forecast the downstream submerged area corresponding with different dam-break elevations.
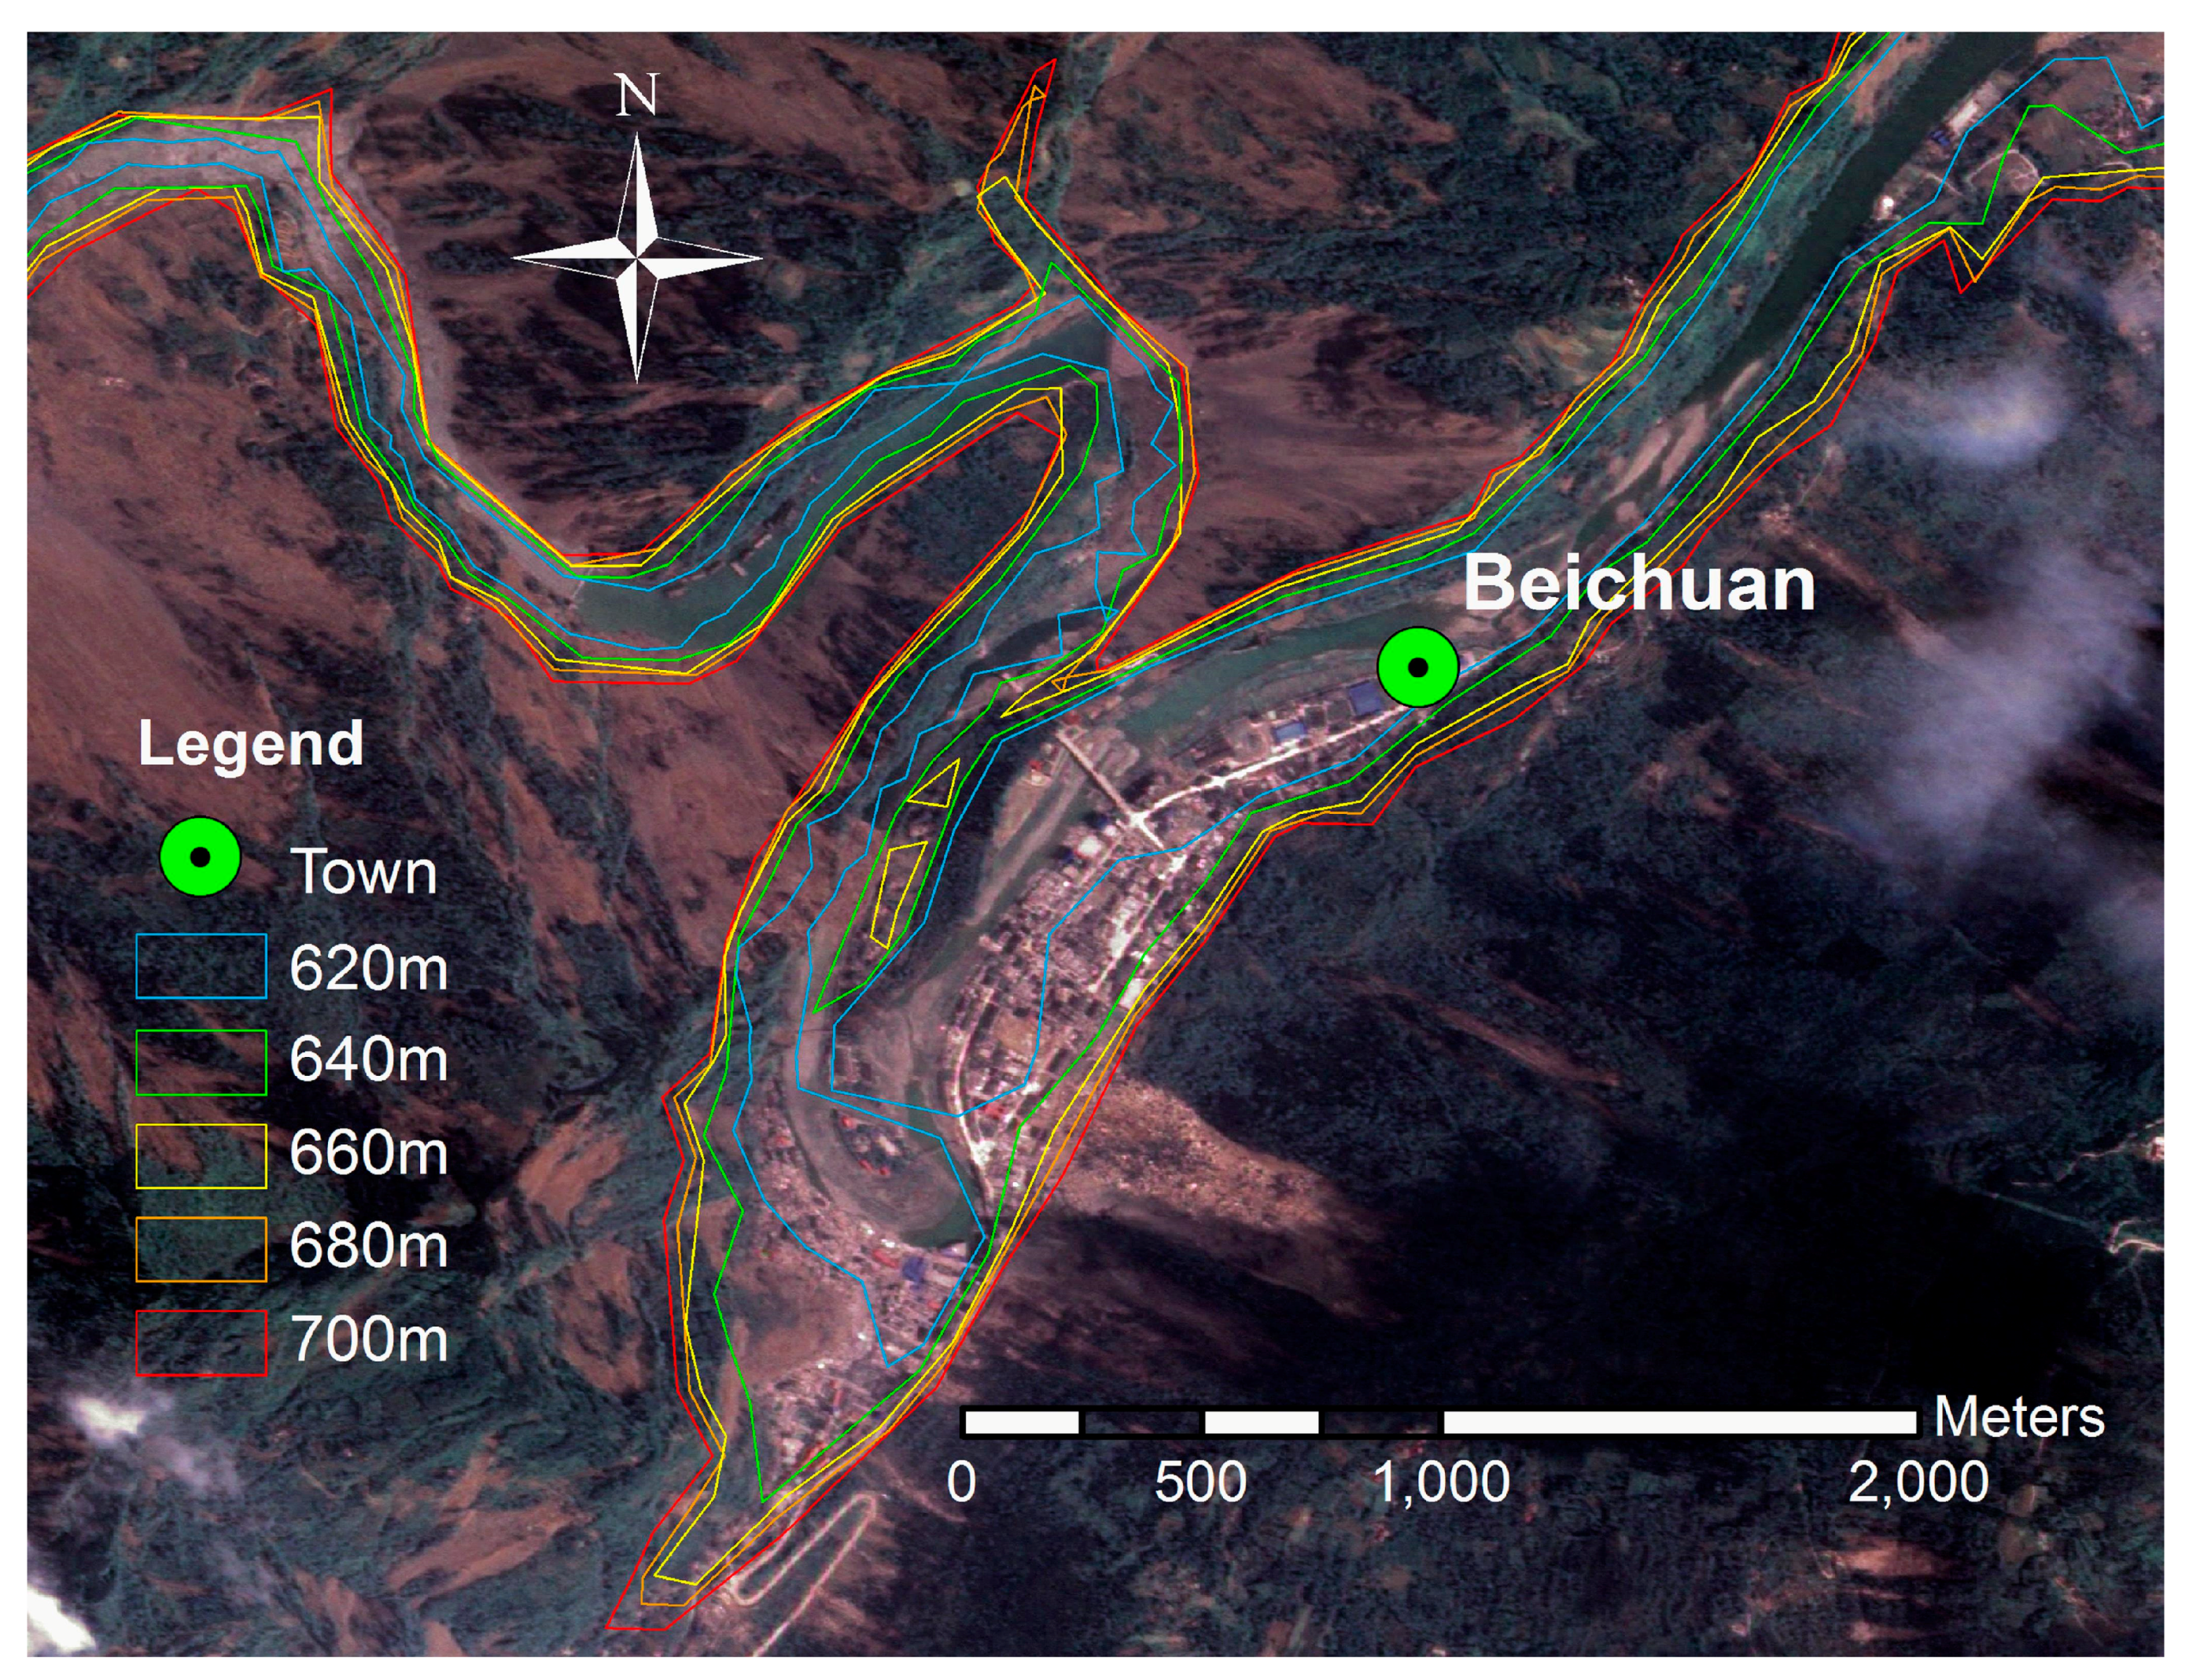
According to the similar dam-break mode and calculation method, we assumed a group of dam-break elevations (H = 700, 680, 660, 640, and 620 m) in calculating the corresponding submerged area. The group of calculation results is shown in Figure 9. The result shows that the flood with the 680 m collapse elevation will impact the entire downstream region of Beichuan town. Several islands remained for the transfer route when the 660 m flood occurred.
6. Conclusions
After an earthquake, the communication and transportation in a disaster region is cut off. Traditional land measurement cannot immediately provide first-hand estimation under such conditions. Accompanying the development of spatial techniques, rapidly estimating the impact of dammed lakes, one of the secondary disasters induced by earthquake, is possible. This paper proposed a method to respond immediately to dammed lakes and obtain their corresponding potential impact area by using a DEM, historical hydrological data, and current RS images. The proposed method can be used to survey the location, quantity, and scale of dammed lakes, and to estimate the potential submerging loss. The proposed method can forecast the upstream potential impact area according to different water levels and downstream potential impact areas according to different dam-break styles without requiring a field survey. Its time-efficiency is important in selecting transfer routes and generally assessing disaster loss. It is also helpful in providing rapid decision support to choose reasonable schemes and to effectively decrease the harm of dammed lakes. Research on rapid estimation for potential impact areas of earthquake-induced dammed lakes can satisfy the requirements of dammed lake management.
Acknowledgments
This paper is financially supported by the National Natural Science Foundation of China (Nos. 51409021, 51509007 and 51379023), and Basic Scientific Research Operating Expenses of Central-Level Public Academies and Institutes (CKSF2016033/GC). The authors also greatly appreciate the anonymous reviewers and academic editor for their careful comments and valuable suggestions to improve the manuscript.
Author Contributions
Shengmei Yang and Bo Cao conceived the study; Bo Cao performed the experiments; Bo Cao, Shengmei Yang, Song Ye wrote the paper.
Conflicts of Interest
The authors declare no conflict of interest.
References
- Mckillop, R.J.; Clague, J.J. Statistical, remote sensing-based approach for estimating the probability of catastrophic drainage from moraine-dammed lakes in southwestern British Columbia. Glob. Planet. Chang. 2007, 56, 153–171. [Google Scholar] [CrossRef]
- Zhou, J.W.; Cui, P.; Fang, H. Dynamic process analysis for the formation of Yangjiagou landslide-dammed lake triggered by the Wenchuan earthquake, China. Landslides 2013, 10, 331–342. [Google Scholar] [CrossRef]
- Feyisa, G.L.; Meilby, H.; Fensholt, R.; Proud, S.R. Automated Water Extraction Index: A new technique for surface water mapping using Landsat imagery. Remote Sens. Environ. 2014, 140, 23–35. [Google Scholar] [CrossRef]
- Schumann, J.P.; Neal, J.C.; Mason, D.C.; Bates, P.D. The accuracy of sequential aerial photography and SAR data for observing urban flood dynamics, a case study of the UK summer 2007 floods. Remote Sens. Environ. 2011, 115, 2536–2546. [Google Scholar] [CrossRef]
- Sheng, Y.; Gong, P.; Xiao, Q. Quantitative dynamic flood monitoring with NOAA AVHRR. Int. J. Remote Sens. 2001, 22, 1709–1724. [Google Scholar] [CrossRef]
- Ling, F.; Du, Y. Monitoring river discharge with remotely sensed imagery using river island area as an indicator. J. Appl. Remote Sens. 2012, 6, 063564. [Google Scholar] [CrossRef]
- Van Dijk, A.; Renzullo, L.J. Water resource monitoring systems and the role of satellite observations. HESS 2010, 7, 2360–2364. [Google Scholar] [CrossRef]
- Jain, S.K.; Saraf, A.K.; Goswami, A.; Ahmad, T. Flood inundation mapping using NOAA AVHRR data. Water Resour. Manag. 2006, 20, 949–959. [Google Scholar] [CrossRef]
- Lu, S.; Wu, B.; Yan, N.; Wang, H. Water body mapping method with HJ-1A/B satellite imagery. Int. J. Appl. Earth Obs. 2011, 13, 428–434. [Google Scholar] [CrossRef]
- Ouma, Y.O.; Tateishi, R. A water index for rapid mapping of shoreline changes of five East African Rift Valley lakes: An empirical analysis using Landsat TM and ETM+ data. Int. J. Remote Sens. 2006, 27, 3153–3181. [Google Scholar] [CrossRef]
- Sun, F.; Sun, W.; Chen, J.; Gong, P. Comparison and improvement of methods for identifying waterbodies in remotely sensed imagery. Int. J. Remote Sens. 2012, 33, 6854–6875. [Google Scholar] [CrossRef]
- Zhang, J.; Zhou, C.; Xu, K.; Watanabea, M. Flood disaster monitoring and evaluation in China. Environ. Hazard. 2002, 4, 33–43. [Google Scholar]
- Stephens, E.M.; Batesa, P.D.; Freera, J.E.; Masonb, D.C. The impact of uncertainty in satellite data on the assessment of flood inundation models. J. Hydrol. 2012, 414, 162–173. [Google Scholar] [CrossRef]
- Kuenzer, C.; Guo, H.; Huth, J.; Leinenkugel, P.; Li, X.; Dech, S. Flood Mapping and Flood Dynamics of the Mekong Delta: ENVISAT-ASAR-WSM Based Time Series Analyses. Remote Sens. 2013, 5, 687–715. [Google Scholar] [CrossRef] [Green Version]
- Amini, J. A method for generating floodplain maps using IKONOS images and DEMs. Int. J. Remote Sens. 2010, 31, 2441–2456. [Google Scholar] [CrossRef]
- Zheng, D.; Bastiaanssen, W.G.M. Estimating water volume variations in lakes and reservoirs from four operational satellite altimetry databases and satellite imagery data. Remote Sens. Environ. 2013, 134, 403–416. [Google Scholar]
- Othman, A.A.; Gloaguen, R. River Courses Affected by Landslides and Implications for Hazard Assessment: A High Resolution Remote Sensing Case Study in NE Iraq–W Iran. Remote Sens. 2013, 5, 1024–1044. [Google Scholar] [CrossRef]
- Van Genderen, J.L. Atlas of remote sensing of the Wenchuan earthquake. Int. J. Digit. Earth 2009, 4, 91–92. [Google Scholar] [CrossRef]
- Furuya, M.; Wahr, J.M. Water level changes at an ice-dammed lake in west Greenland inferred from InSAR data. Geophys. Res. Lett. 2005, 32, 301–320. [Google Scholar] [CrossRef]
- Pan, S.; Li, X.; Song, X. Using Remote Sensing Data to Monitor Landslide-dammed Lakes Caused by Wenchuan Earthquake. J. Geo-Inf. Sci. 2009, 11, 299–304. (In Chinese) [Google Scholar] [CrossRef]
- Fan, J.; Tian, B.; Cheng, G.; Tao, H.; Zhang, J.; Yan, D.; Su, F.; Liu, B. Investigation on Damming Object Induced by the Earthquake of Wenchuan on May 12 Based on Multi-platform Remote Sensing. J. Mt. Sci-Engl. 2008, 26, 257–262. (In Chinese) [Google Scholar]
- Gorum, T.; Fan, X.; Westen, C.J.V.; Huang, R.Q. Distribution pattern of earthquake-induced landslides triggered by the 12 May 2008 Wenchuan earthquake. Geomorphology 2011, 133, 152–167. [Google Scholar] [CrossRef]
- Ehrlich, D.; Guo, H.D.; Molch, K.; Ma, J.W.; Pesaresi, M. Identifying damage caused by the 2008 Wenchuan earthquake from VHR remote sensing data. Int. J. Digit. Earth 2009, 2, 309–326. [Google Scholar] [CrossRef]
- Yinsung, H.; Yuhsiung, H. Impact of earthquake-induced dammed lakes on channel evolution and bed mobility: Case study of the Tsaoling landslide dammed lake. J. Hydrol. 2009, 374, 43–55. [Google Scholar]
- Bookhagen, B.; Haselton, K.; Trauth, M.H. Hydrological modelling of a Pleistocene landslide-dammed lake in the Santa Maria Basin, NW Argentina. Palaeogeogr. Palaeoclimatol. 2001, 169, 113–127. [Google Scholar] [CrossRef]
- Conesa-Garcia, C.; Caselles-Miralles, V.; Sanchez Tomas, J.M.; Garcia-Lorenzo, R. Hydraulic Geometry, GIS and Remote Sensing, Techniques against Rainfall-Runoff Models for Estimating Flood Magnitude in Ephemeral Fluvial Systems. Remote Sens. 2010, 2, 2607–2628. [Google Scholar] [CrossRef]
- Xue, Y.; Xu, W.; Luo, S.; Chen, H.; Li, N.; Xu, L. Experimental study of dam-break flow in cascade reservoirs with steep bottom slope. J. Hydrodyn. 2011, 23, 491–497. [Google Scholar] [CrossRef]
- Cui, P.; Dang, C.; Zhuang, J.Q.; You, Y.; Chen, X.Q. Landslide-dammed lake at Tangjiashan, Sichuan province, China (triggered by the Wenchuan Earthquake, May 12, 2008): Risk assessment, mitigation strategy, and lessons learned. Environ. Earth Sci. 2012, 65, 1055–1065. [Google Scholar] [CrossRef]
- Peng, C.; Zhu, Y.Y.; Han, Y.S.; Chen, X.Q.; Zhuang, J.Q. The 12 May Wenchuan earthquake-induced landslide lakes: Distribution and preliminary risk evaluation. Landslides 2009, 6, 209–223. [Google Scholar]
- Peng, M.; Zhang, L.M. Analysis of human risks due to dam break floods—Part 2: Application to Tangjiashan landslide dam failure. Nat. Hazards 2012, 64, 1899–1923. [Google Scholar] [CrossRef]
- Yang, S.H.; Pan, Y.W.; Dong, J.J.; Yeh, K.C.; Liao, J.J. A systematic approach for the assessment of flooding hazard and risk associated with a landslide dam. Nat. Hazards 2013, 65, 41–62. [Google Scholar] [CrossRef]
- Chen, X.Q.; Cui, P.; Li, Y.; Zhao, W.Y. Emergency response to the Tangjiashan landslide-dammed lake resulting from the 2008 Wenchuan Earthquake, China. Landslides 2011, 8, 91–98. [Google Scholar] [CrossRef]
- Liu, J.; Ma, C.; Liu, C.; Qin, D.; Gu, X. An extended maxima transform-based region growing algorithm for convective cell detection on satellite images. Remote Sens. Lett. 2014, 5, 971–980. [Google Scholar] [CrossRef]
- Zhan, D.J.; Ye, S.Z. Engineering Hydrology, 17th ed.; China Water & Power Press: Beijing, China, 2000; pp. 122–125. [Google Scholar]
- Bahrami, S.; Ardejani, F.D.; Baafi, E. Application of artificial neural network coupled with genetic algorithm and simulated annealing to solve groundwater inflow problem to an advancing open pit mine. J. Hydrol. 2016, 536, 471–484. [Google Scholar] [CrossRef]
Figure 1.
Study area and data.

Figure 2.
Research flow chart.
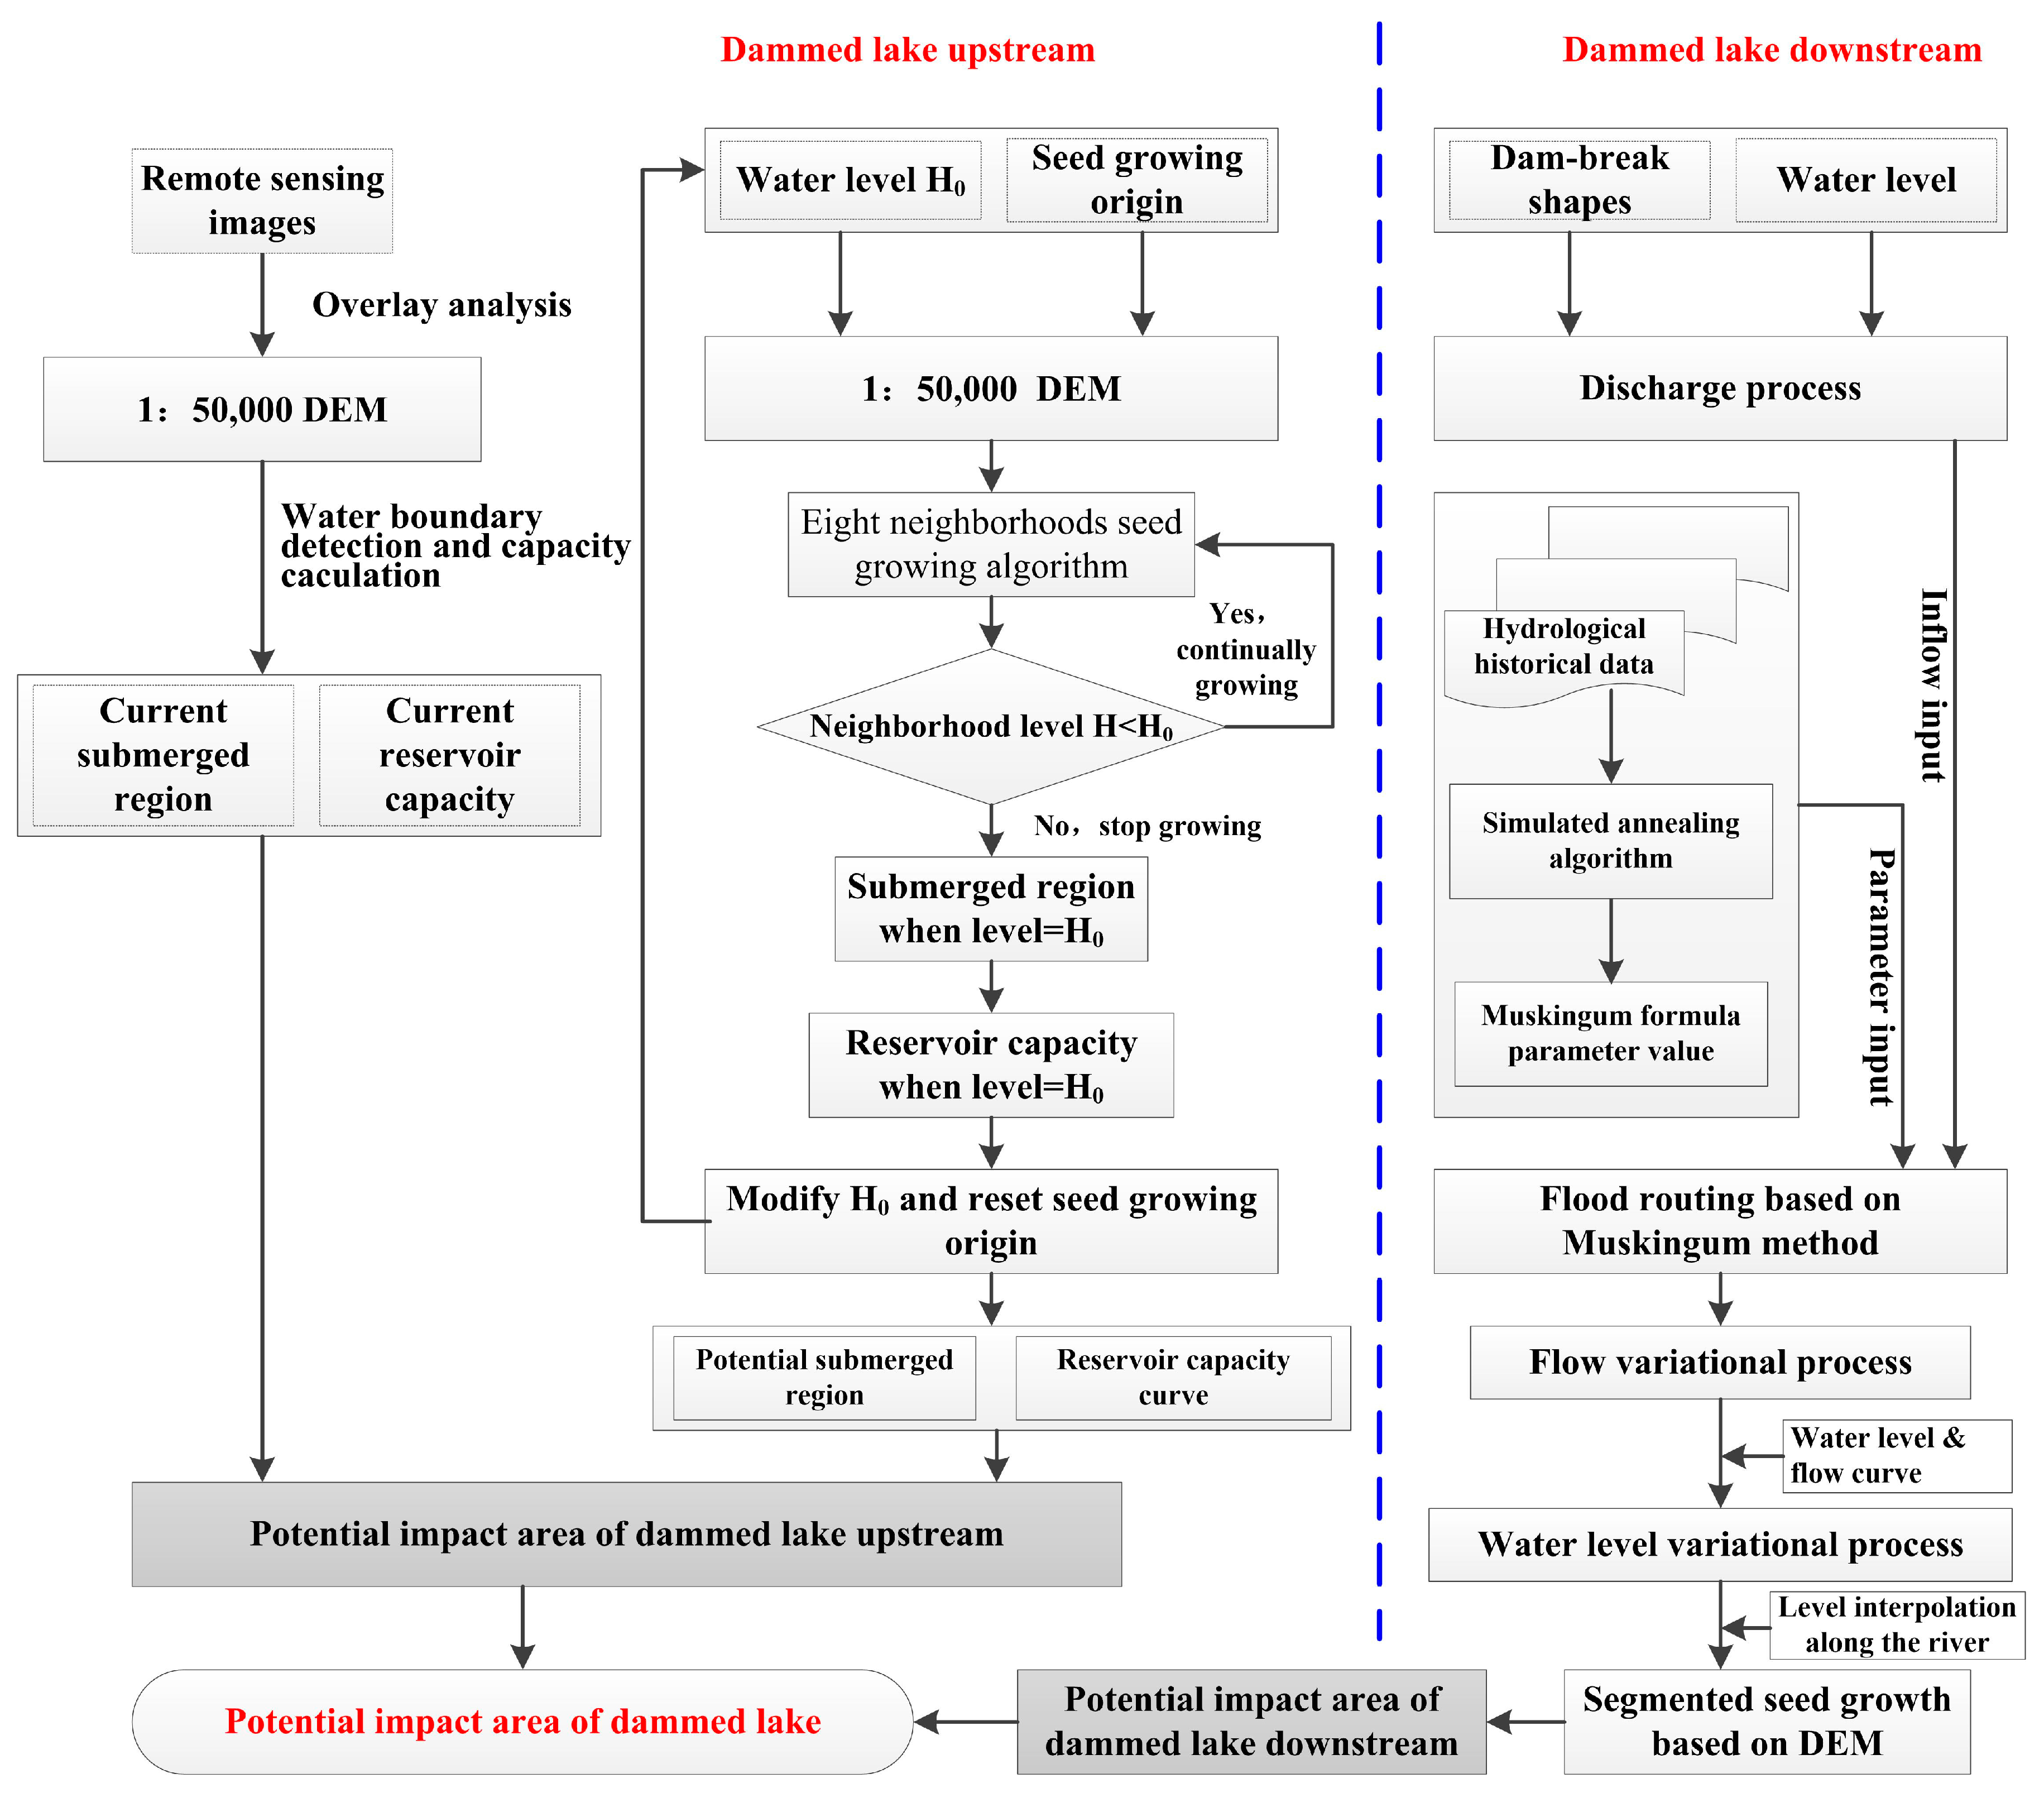
Figure 3.
Simulated annealing algorithm flow chart.

Figure 4.
Dammed lake area in different water level.
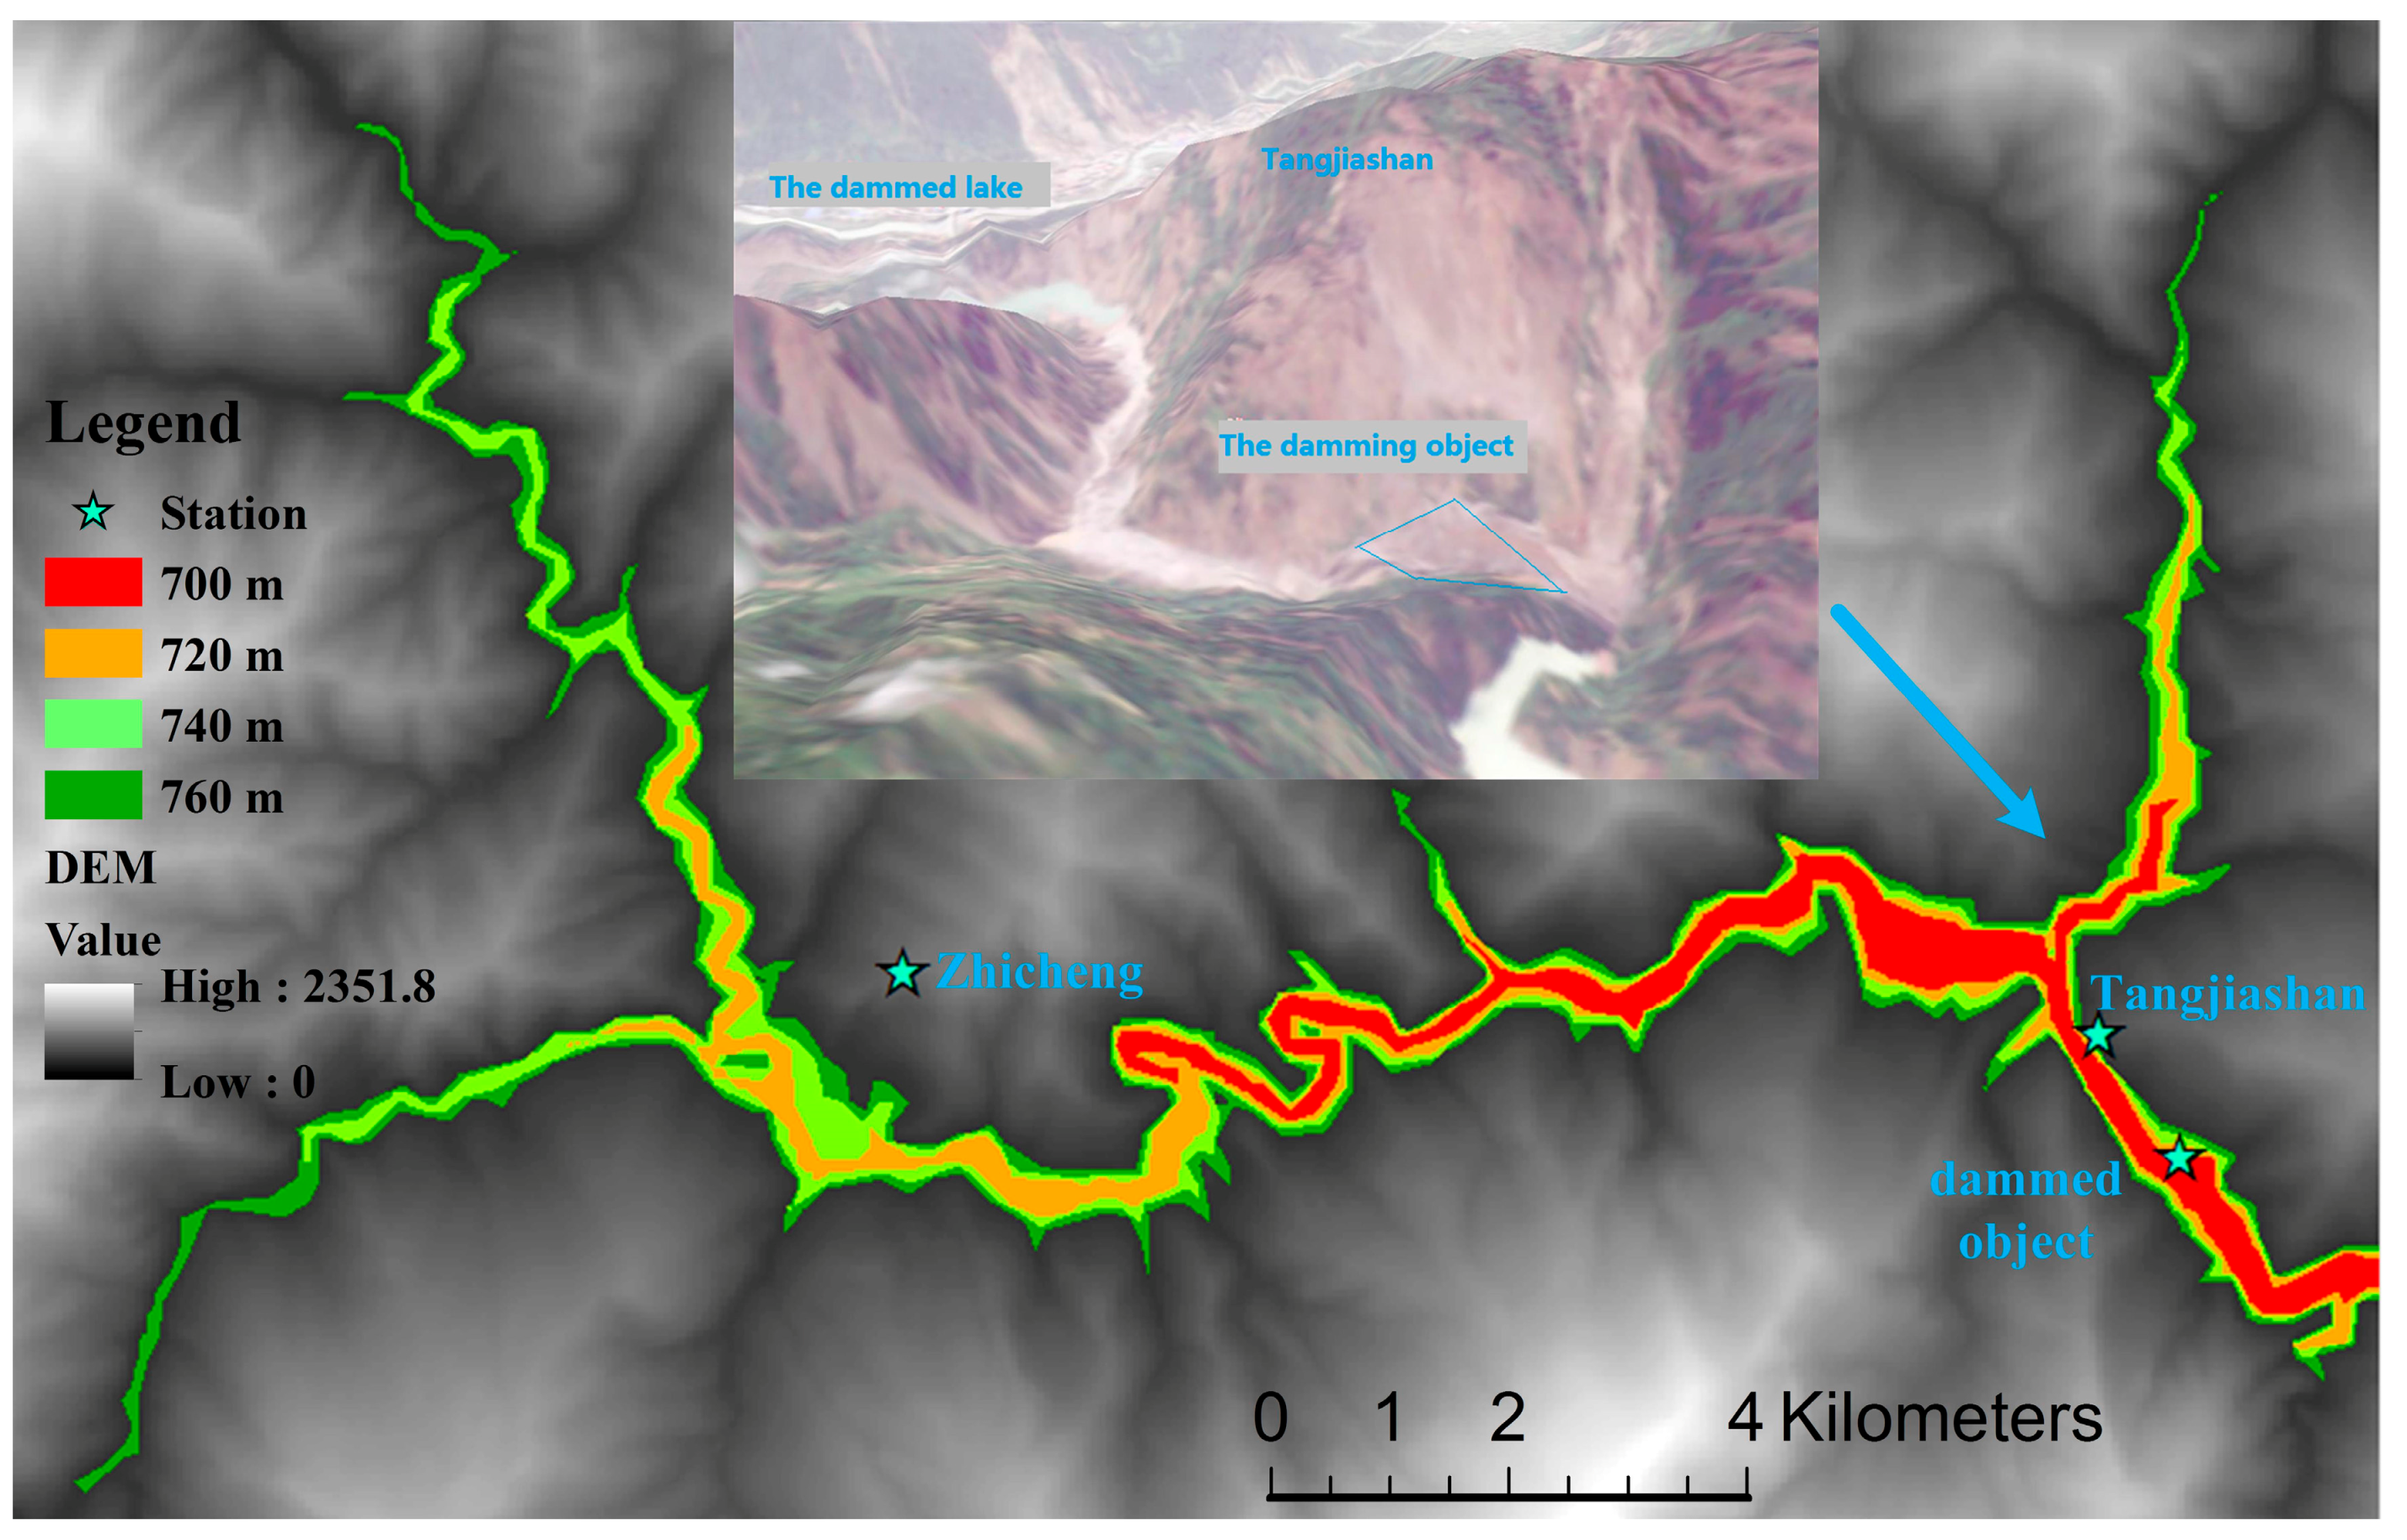
Figure 5.
Tongkou station coefficient test result.

Figure 6.
Xiangshui station coefficient test result.

Figure 7.
Muskingum flood routing results and elevation interpolation method. (a) Flood routing results based on Muskingum method and segments division; (b) The elevation interpolation along the river.
Figure 7.
Muskingum flood routing results and elevation interpolation method. (a) Flood routing results based on Muskingum method and segments division; (b) The elevation interpolation along the river.
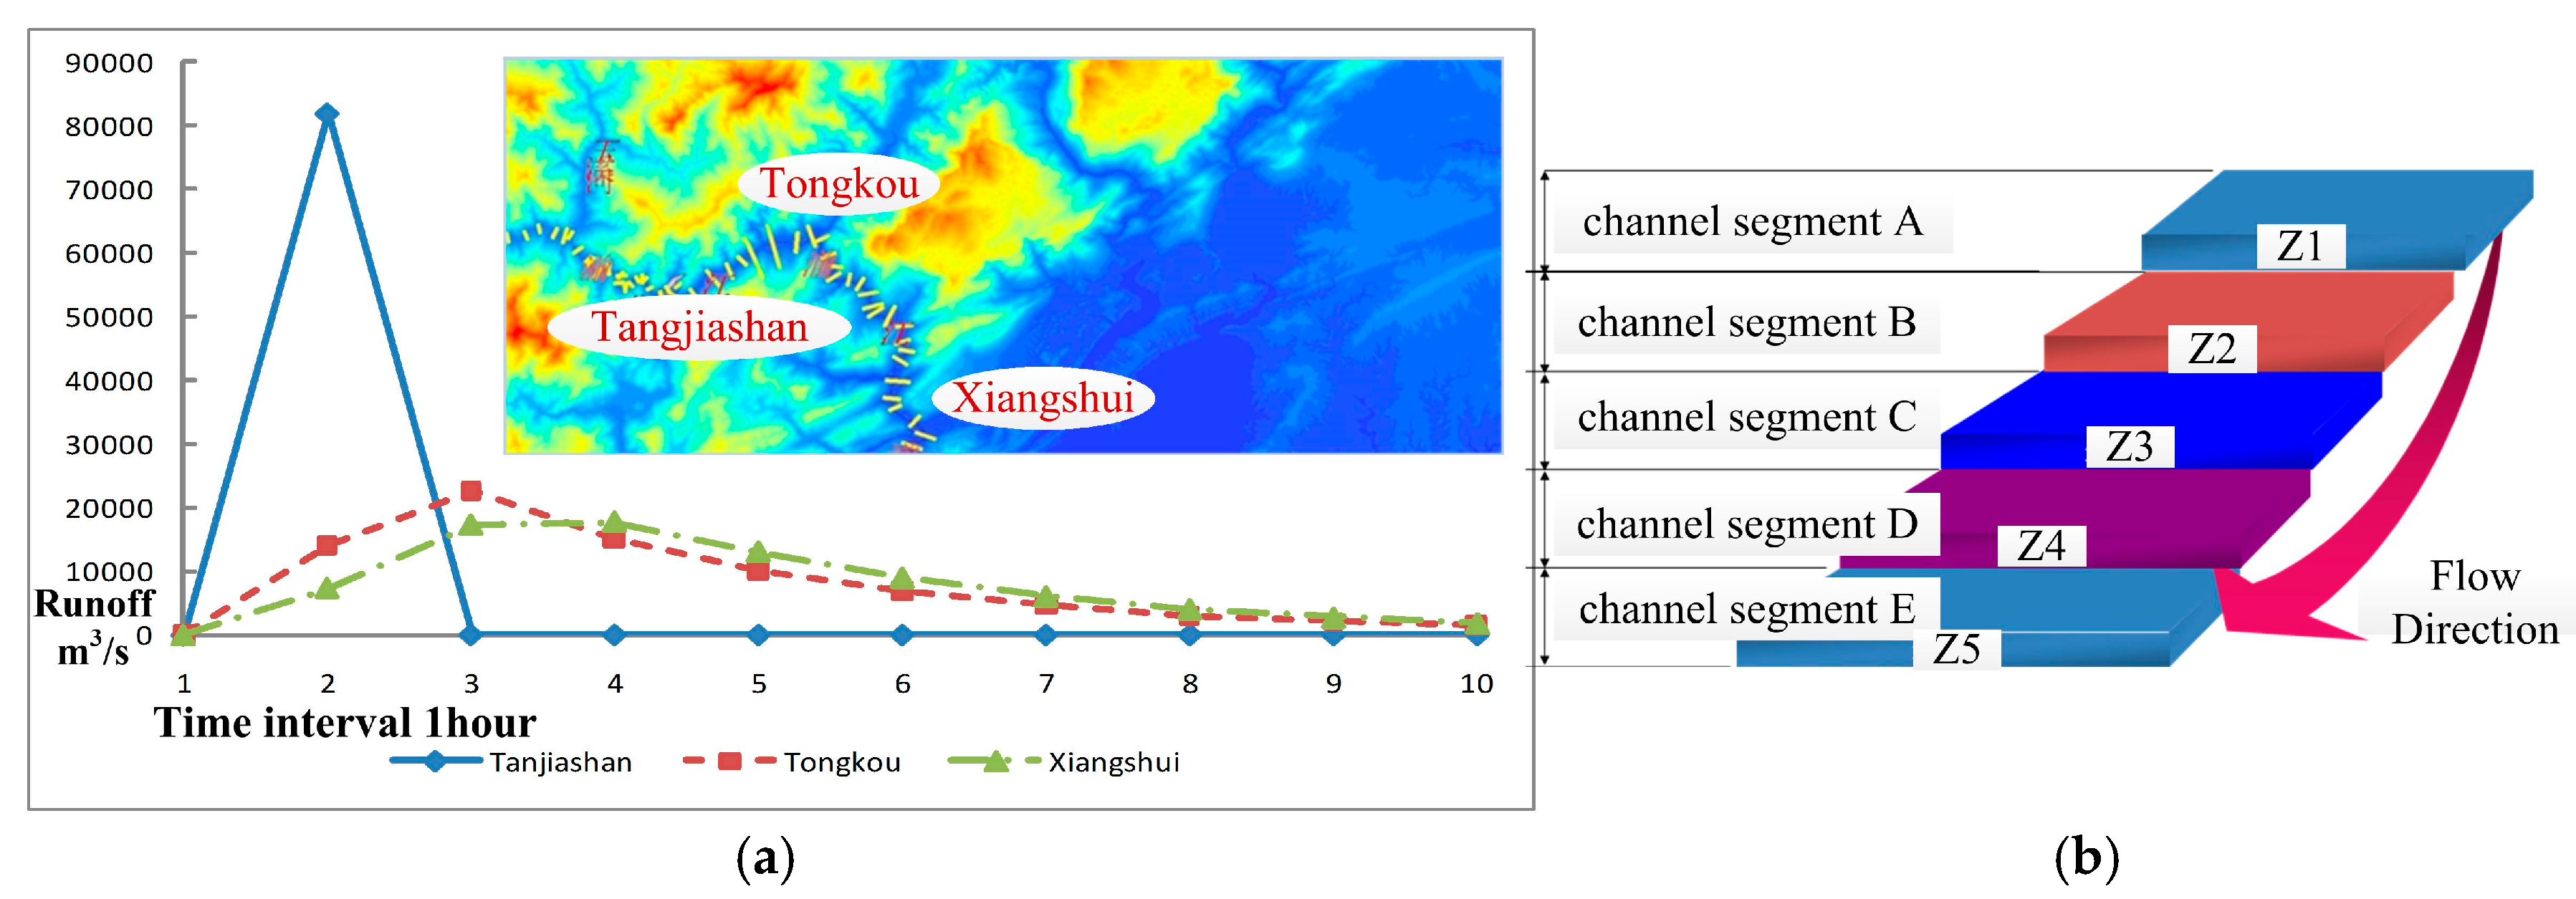
Figure 8.
Potential impact area of the dammed lake downstream (H = 700 m). (a) Partial view of the submerged area; (b) Global view of the submerged area.
Figure 8.
Potential impact area of the dammed lake downstream (H = 700 m). (a) Partial view of the submerged area; (b) Global view of the submerged area.

Figure 9.
Potential impact area of dammed lake downstream (H = 700, 680, 660, 640, 620 m).


Table 1.
Specifications of the satellite remote sensing image, aerial photograph, and satellite radar data used in this study.
Table 1.
Specifications of the satellite remote sensing image, aerial photograph, and satellite radar data used in this study.
| Data | Acquisition Date | Resolution | Format | Region |
|---|---|---|---|---|
| Formosat-2 | 20 May 2008 | 2 m | TIFF | Tanjiashan Dammed Lake |
| Aerial photograph | 18 May 2008 | 0.15 m | TIFF | Beichuan Town |
| Envisat | 20 May 2008 | 30 m | TIFF | Tanjiashan Dammed Lake |
| DEM | 2003 | 1:50,000 | TIFF | Xun River Basin |
Table 2.
Elevation-area-reservoir capacity curve.
| Water Level (m) | Reservoir Capacity (108 m3) | Area (km2) |
|---|---|---|
| 690 | 0.248 | 1.591 |
| 695 | 0.338 | 1.958 |
| 700 | 0.445 | 2.430 |
| 705 | 0.572 | 2.680 |
| 710 | 0.714 | 2.975 |
| 715 | 0.872 | 3.380 |
| 720 | 1.076 | 4.538 |
| 725 | 1.318 | 5.077 |
| 730 | 1.587 | 5.671 |
| 735 | 1.888 | 6.276 |
| 740 | 2.229 | 7.223 |
| 745 | 2.607 | 7.883 |
| 750 | 3.018 | 8.564 |
Table 3.
Dam-break flow calculation result (H = 700 m).
| Dam-Break Time | Flood Peak | Peak Appearance Time | Ending Flow |
|---|---|---|---|
| 1 h | 83,620 m3/s | 17 min | 76 ms3/s |
Table 4.
Muskingum parameters.
| Reach | C0 | C1 | C2 |
|---|---|---|---|
| Tangjiashan to Tongkou | 0.1722 | 0.1615 | 0.6663 |
| Tongkou to Xiangshui | 0.5197 | 0.2819 | 0.1984 |
Table 5.
Coefficient test result between Tangjiashan and Tongkou section.
| Time (h) Tangjiashan | Water Level (m) | Runoff Q (m3/s) | Time (h) Tongkou | Water Level (m) | Runoff Q′ (m3/s) | Flood Routing Result | Relative Error % |
|---|---|---|---|---|---|---|---|
| 0:00 | 620.90 | 33.1 | 0:00 | 535.31 | 23 | ||
| 1:00 | 621.05 | 64.3 | 1:00 | 535.36 | 28 | 31.743 | +13.37% |
| 2:00 | 622.75 | 858 | 2:00 | 535.52 | 44 | 179.282 | +307.46% |
| 3:00 | 622.25 | 576 | 3:00 | 537.19 | 240 | 357.210 | +48.84% |
| 4:00 | 621.93 | 415 | 4:00 | 537.1 | 210 * | 402.496 | +91.66% |
| 5:00 | 622.03 | 465 | 5:00 | 538.27 | 594 | 415.279 | −30.09% |
| 6:00 | 622.62 | 780 | 6:00 | 537.33 | 333 | 486.114 | +45.98% |
| 7:00 | 625.90 | 3240 | 7:00 | 538.57 | 690 | 1007.800 | +46.06% |
| 8:00 | 629.54 | 6870 | 8:00 | 545.05 | 3300 | 2377.770 | −27.95% |
| 9:00 | 629.54 | 6870 | 9:00 | 545.65 | 3590 | 3876.827 | +7.99% |
| 10:00 | 629.54 | 6870 | 10:00 | 545.65 | 3590 | 3876.827 | +7.99% |
| 11:00 | 629.59 | 6930 | 11:00 | 547.16 | 4400 | 4885.981 | +11.04% |
| 12:00 | 629.23 | 6530 | 12:00 | 548.25 | 5060 | 5499.190 | +8.68% |
| 13:00 | 627.34 | 4640 | 13:00 | 549.20 | 5720 | 5517.713 | −3.54% |
| 14:00 | 626.94 | 4320 | 14:00 | 549.73 | 6210 | 5169.716 | −16.75% |
| 15:00 | 626.47 | 3800 | 15:00 | 548.80 | 5420 | 4796.622 | −11.5% |
Note: * Interpolation.
Table 6.
Muskingum flood routing between Tangjiashan and Tongkou.
| Reach Parameters | I2 (m3/s) | I1 (m3/s) | O1 (m3/s) | O2 (m3/s) |
|---|---|---|---|---|
| Tangjiashan to Tongkou | 83,620 | 3.2 | 4 | 14,402.6 |
| C0 = 0.1722 | 76 | 83,620 | 14,402.6 | 23,114.1 |
| C1 = 0.1615 | 76 | 76 | 23,114.1 | 15,426.3 |
| C2 = 0.6663 | 76 | 76 | 15,426.3 | 10,303.9 |
| 76 | 76 | 10,303.9 | 6890.9 | |
| 76 | 76 | 6890.9 | 4616.7 | |
| 76 | 76 | 4616.7 | 3101.5 | |
| 76 | 76 | 3101.5 | 2091.9 | |
| 76 | 76 | 2091.9 | 1419.2 |
Table 7.
Muskingum flood routing between Tongkou and Xiangshui.
| Reach Parameters | I2 (m3/s) | I1 (m3/s) | O1 (m3/s) | O2 (m3/s) |
|---|---|---|---|---|
| Tongkou to Xiangshui | 14,402.6 | 4 | 2 | 7486.6 |
| C0 = 0.5197 | 23,114.1 | 14,402.6 | 7486.6 | 17,557.8 |
| C1 = 0.2819 | 15,426.3 | 23,114.1 | 17,557.8 | 18,016.4 |
| C2 = 0.1984 | 10,303.9 | 15,426.3 | 18,016.4 | 13,278.1 |
| 6890.9 | 10,303.9 | 13,278.1 | 9120.2 | |
| 4616.7 | 6890.9 | 9120.2 | 6151.3 | |
| 3101.5 | 4616.7 | 6151.3 | 4133.7 | |
| 2091.9 | 3101.5 | 4133.7 | 2781.6 | |
| 1419.2 | 2091.9 | 2781.6 | 1879.1 |
Table 8.
Runoff versus elevation curve in Tongkou and Xiangshui.
| Hydrologic Stations | The Runoff (y) vs. Elevation (x) Curve | Flood Peak | Elevation Maximum |
|---|---|---|---|
| Tongkou | y = 20.9186473861676x2 − 22,283.2134587244x + 5,934,150.94321418 | 23,114.1 m3/s | 565.89 m |
| R2 = 0.986247730187266 | |||
| Xiangshui | y = 7.26568228353629x3 − 11,429.4504515713x2 + 5,993,229.82457408x − 1,047,570,044.59771 | 18,016.4 m3/s | 537.47 m |
| R2 = 0.997800010971559 |
© 2017 by the authors. Licensee MDPI, Basel, Switzerland. This article is an open access article distributed under the terms and conditions of the Creative Commons Attribution (CC BY) license (http://creativecommons.org/licenses/by/4.0/).
Share and Cite
MDPI and ACS Style
Cao, B.; Yang, S.; Ye, S. Integrated Application of Remote Sensing, GIS and Hydrological Modeling to Estimate the Potential Impact Area of Earthquake-Induced Dammed Lakes. Water 2017, 9, 777. https://doi.org/10.3390/w9100777
AMA Style
Cao B, Yang S, Ye S. Integrated Application of Remote Sensing, GIS and Hydrological Modeling to Estimate the Potential Impact Area of Earthquake-Induced Dammed Lakes. Water. 2017; 9(10):777. https://doi.org/10.3390/w9100777
Chicago/Turabian StyleCao, Bo, Shengmei Yang, and Song Ye. 2017. "Integrated Application of Remote Sensing, GIS and Hydrological Modeling to Estimate the Potential Impact Area of Earthquake-Induced Dammed Lakes" Water 9, no. 10: 777. https://doi.org/10.3390/w9100777
Note that from the first issue of 2016, this journal uses article numbers instead of page numbers. See further details here.