Optimization of Multiple Seepage Piping Parameters to Maximize the Critical Hydraulic Gradient in Bimsoils

1
Beijing Key Laboratory of Urban Underground Space Engineering, Department of Civil Engineering, School of Civil & Resource Engineering, University of Science & Technology Beijing, Beijing 100083, China
2
Key Laboratory of the Ministry of Education of China for High-Efficient Mining and Safety of Metal Mines, University of Science & Technology Beijing, Beijing 100083, China
3
Key Laboratory of Shale Gas and Geoengineering, Institute of Geology and Geophysics, Chinese Academy of Sciences, Beijing 100029, China
*
Author to whom correspondence should be addressed.
Water 2017, 9(10), 787; https://doi.org/10.3390/w9100787
Submission received: 2 August 2017
/
Revised: 30 September 2017
/
Accepted: 3 October 2017
/
Published: 15 October 2017
(This article belongs to the Special Issue Soil Water Conservation: Dynamics and Impact)
Abstract
:Seepage failure in the form of piping can strongly influence the stability of block-in-matrix-soils (bimsoils), as well as weaken and affect the performance of bimsoil structures. The multiple-factor evaluation and optimization play a crucial role in controlling the seepage failure in bimsoil. The aim of this study is to improve the ability to control the piping seepage failure in bimsoil. In this work, the response surface method (RSM) was employed to evaluate and optimize the multiple piping parameters to maximize the critical hydraulic gradient (CHG), in combination with experimental modeling based on a self-developed servo-controlled flow-erosion-stress coupled testing system. All of the studied specimens with rock block percentage (RBP) of 30%, 50%, and 70% were produced as a cylindrical shape (50 mm diameter and 100 mm height) by compaction tests. Four uncertain parameters, such as RBP, soil matrix density, confining pressure, and block morphology were used to fit an optimal response of the CHG. The sensitivity analysis reveals the influential order of the studied factors to CHG. It is found that RBP is the most sensitive factor, the CHG decreases with the increase of RBP, and CHG increases with the increase of confining pressure, soil matrix density, and block angularity.
1. Introduction
Bimsoils (block-in-matrix-soils), as a kind of special geomaterial, which are characterized by the extreme nonhomogeneity, environmental sensitivity, and looseness [1,2,3,4,5,6,7,8,9,10,11]. Many engineering geological disasters have direct relations to the bimsoils [3,4,5,6,7,8]. As is known, piping is a very common and severe kind of seepage failure, it has been pointed out that piping is considered as the main mechanism leading to the failure of hydraulic structures in bimsoils [12,13,14]. It is also the primary reason resulting in the instability of landslides, dam foundation, and dyke building, which are generaaly composed of bimsoils. From the statistical data worldwide, for the wreckage earth-rockfill dams, about 40.5% of them are caused by seepage failure (e.g., Malpasset Arch Dam in France 1959, Balder Yamauchi dam in 1964, Tetonin USA 1976, Gouhou Reservoir Dam in China 1993, etc.). In addition, landslides composed of bimsoil material caulsed by seepage failure are common all over the world. Piping often occurs in loose and unstable structure of bimsoils, especially with high RBP, part of the soil and rock units is not coupled tightly, even some soil particles are in the state of free suspension; under seepage flow, the high seepage gradient acts on soil-rock interfaces, seepage channel is easily formed in the soil-rock interfaces under the action of seepage force. Once the seepage channels are formed, these channels propagate into soil matrix under continuous water flow, small soil particles move in those channels, and seepage failure occurs accordingly.
Currently, the studies of flow characteristics of bimsoil are mainly focused on the permeable regime [10,15] and flow-stress coupling properties [16]. In addition, seepage piping erosion is almost focused on soil material (e.g., clay, silty, sand, etc.) by laboratory tests [16,17] or numerical simulation [18,19,20]. Up to now, from literature review, studies about the multi-parameter evolution and optimization for piping seepage failure in bimsoils are rarely reported. Under flow condition, different hydraulic properties of those components in bimsoil sresults in various non-linear responses [15]. The rock blocks with various size random distributes in bimsoil, change the seepage path of fluid as compared to the homogenous soil and rock material. Large seepage drop occurs at soil-rock interfaces, and contact erosion at the random interfaces is severe and at dominance. The piping characteristics of bimsoilare distinctly influenced by its complicated internal structure. Although the piping phenomenon of bimsoil has been studied through laboratory experiments [21,22,23], the study of the effect of multiple factors on piping evolution is rarely published. In this work, attempts are made to provide deep insights into the effective evaluation, prevention, and control of piping in bimsoils. A self-developed servo controlled flow erosion stress coupled system was used to obtain the critical hydraulic gradient. In addition, response surface methodology algorithm is used to evaluate the influential order of the studied factors, such as rock block percentage, soil matrix density, confining pressure, and block morphology. The aim of this paper is to improve the ability to control piping erosion failure, by adjusting the sensitive factors in geotechnical engineering construction composed of bimsoil.
2. Experimental Methods
2.1. Material and Sample Preparation
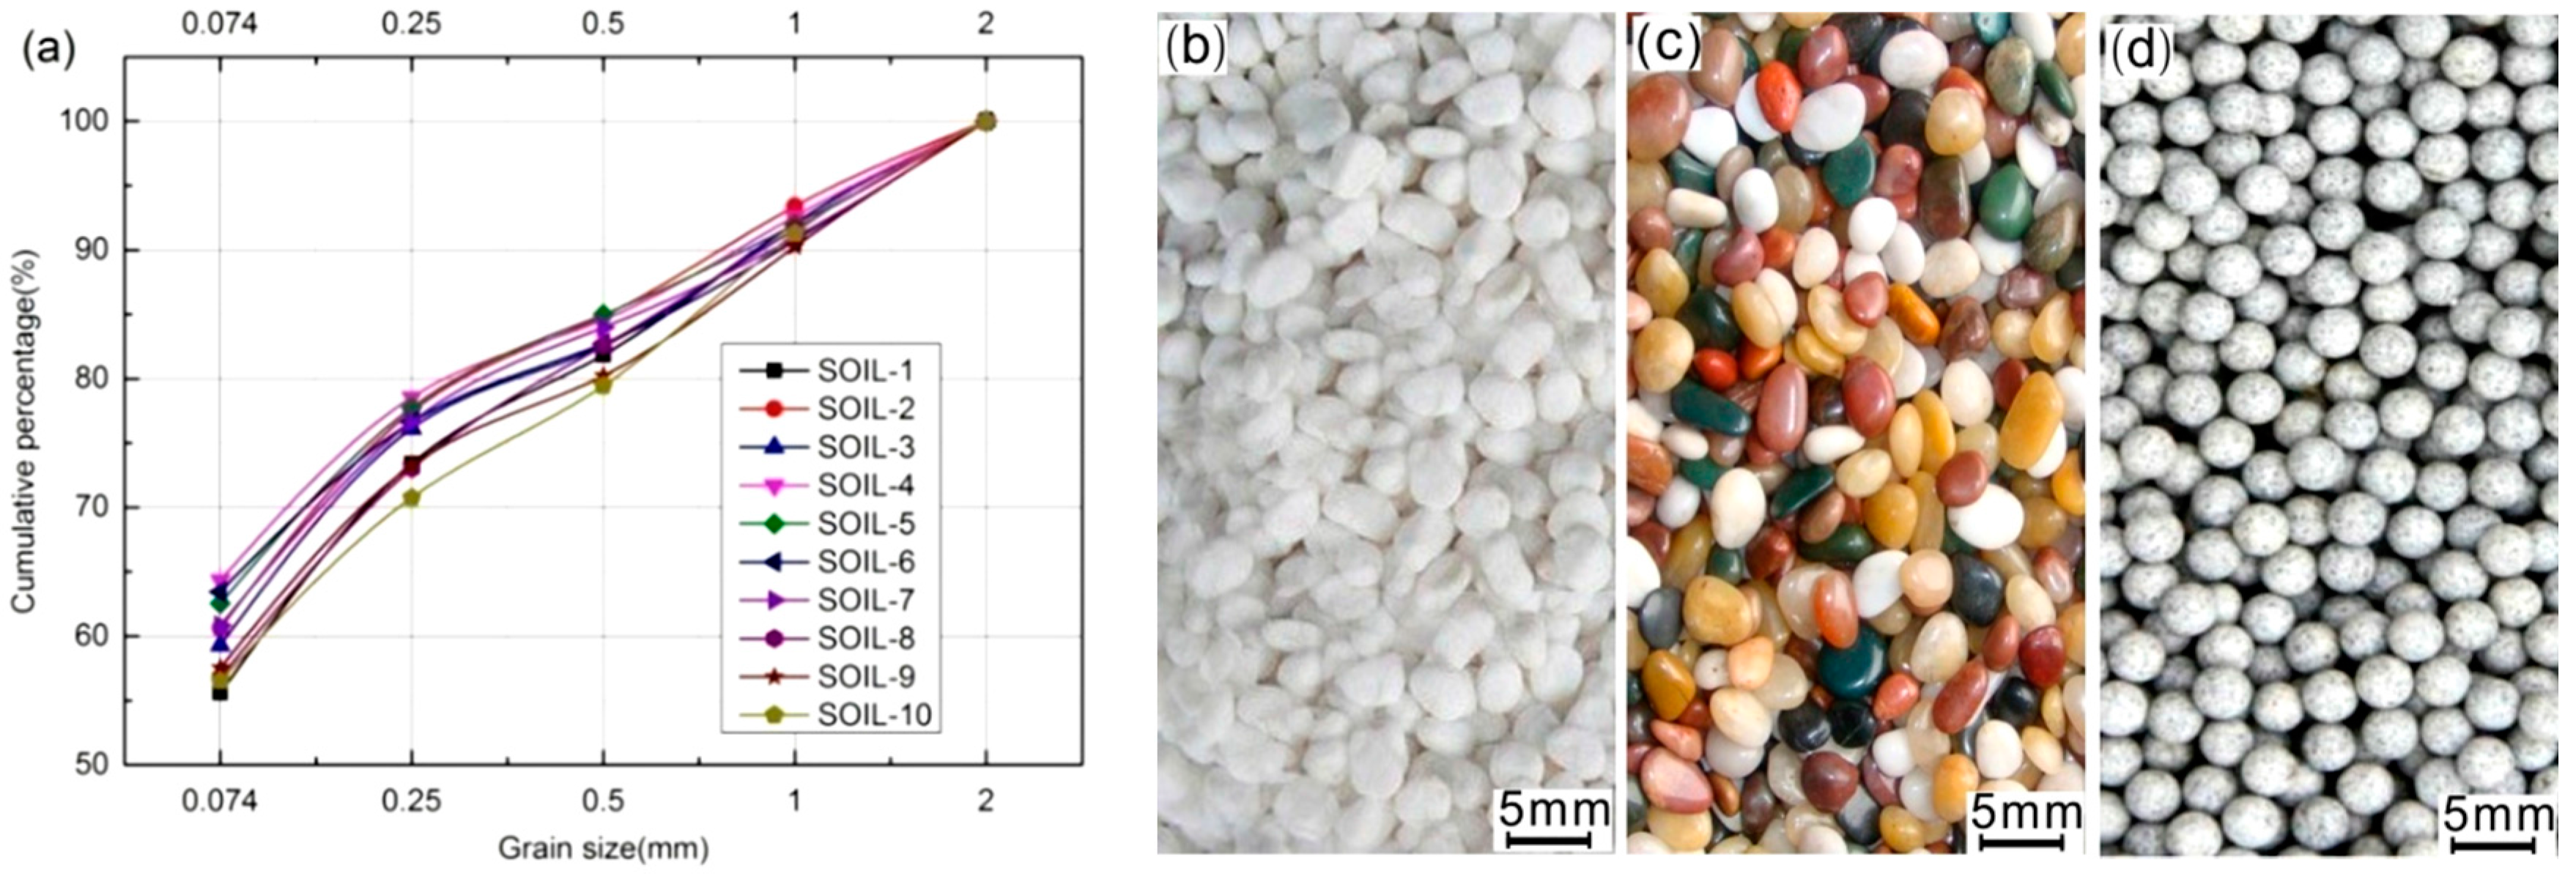
The sample studied here is a mixture of soil matrix and rock blocks. The soil matrix belongs to a kind of clay soil. The gradation curve of this soil is shown in Figure 1a. The clay soil contained lots of clay minerals with strong hydrophilic property. The liquid limit of the hard clay can reach 64%, while the plastic limit can reach 36%; the plasticity index was about 28 and the liquidity index was about 0.05–0.127. These indices indicated that this kind of soil belonged to a typical high plastic and high plastic clay. The saturation is about 18.5% from the lab measurement. To identify the mineral composition and mineral content, both Scanning Electron Microscope (SEM) and X-ray diffraction (XRD) tests were conducted on the clay soil. According to the results of the SEM tests, rodlike, and irregular quartz grains with a grain size of about 0.01~0.03 mm can be clearly seen that are probably surrounded by clay minerals. The XRD tests reveal that the clay soil has a higher percentage of clay minerals, such as kaolinite (26.73%), montmorillonite (61.52%), and illite (6.25%). The physical and mechanical properties of the soil matrix is listed in Table 1.
Lithology of the crushed rock blocks used in the experiment was marble, the size of rock blocks range between 2 and 5 mm (Figure 1b). According to the geotechnical test standards [24,25] and the prepared bimsoil specimen standard, the threshold value for soil particle and rock block is determined as 2 mm. Density of rock block is 2.53 g/cm3, the wet and dry uniaxial compressive strengthare 43.21 and 80.75, respectively. Generally, the morphological characteristics of the rock blocks have a great effect on the geomechanical properties of bimsoils. Some quantitative morphological feature of the rock blocks with weighted average indices are obtained by digital image process [8], as listed in Table 2.
In this work, dynamic compaction was used for the preparation of the bimsoils pecimens [10,11,12,26,27]. The appropriate optimal hammer count was determined according to the relationship between the hammer count and the soil matrix density Compaction was done in a split mould by applying a dynamic pressure, using a compaction test apparatus. Owing to the high difference of elastic modulus between soil matrix and rock block, compactness of bimsoil is actual the compactness of soil matrix. Soil density is a very important factor affecting the permeability of bimsoil [28]. As a result, how to control the hammer count is crucial to the sensitive analysis of piping erosion. In this work, determination of hammer count producing specimens with different soil density is from the relationship between the soil density and the optimal hammer count, as shown in Figure 2a. The soil matrix density for bimsoil with RBP of 30%, 50%, and 70% increased with the increase of hammer count. To change the soil density, three dot dash lines were drawn to intersect with the curves in Figure 2a, the corresponding of abscissa values are determined as the optimal hammer count. Figure 2b plots the relationship between different soil densities and hammer counts. When the RBP is 70%, the soil matrix in the specimens is difficult to compacted, considering that the rock blocks in bimsoil specimens with RBP of 70% would be crushed with too much hammer counts, therefore, 12 times was determined as the optimal hammer count. All of the specimens were compacted layer by layer with three layers, as shown in Figure 3a. The length and diameter of the prepared samples were 100 and 50 mm. The prepared cylinder-shaped specimens with RBP of 30%, 50%, and 70% were shown in Figure 3b.All of the tested specimens were sealed with plastic wrap to prevent water evaporation and kept the water content constant.
2.2. Experimental Setup
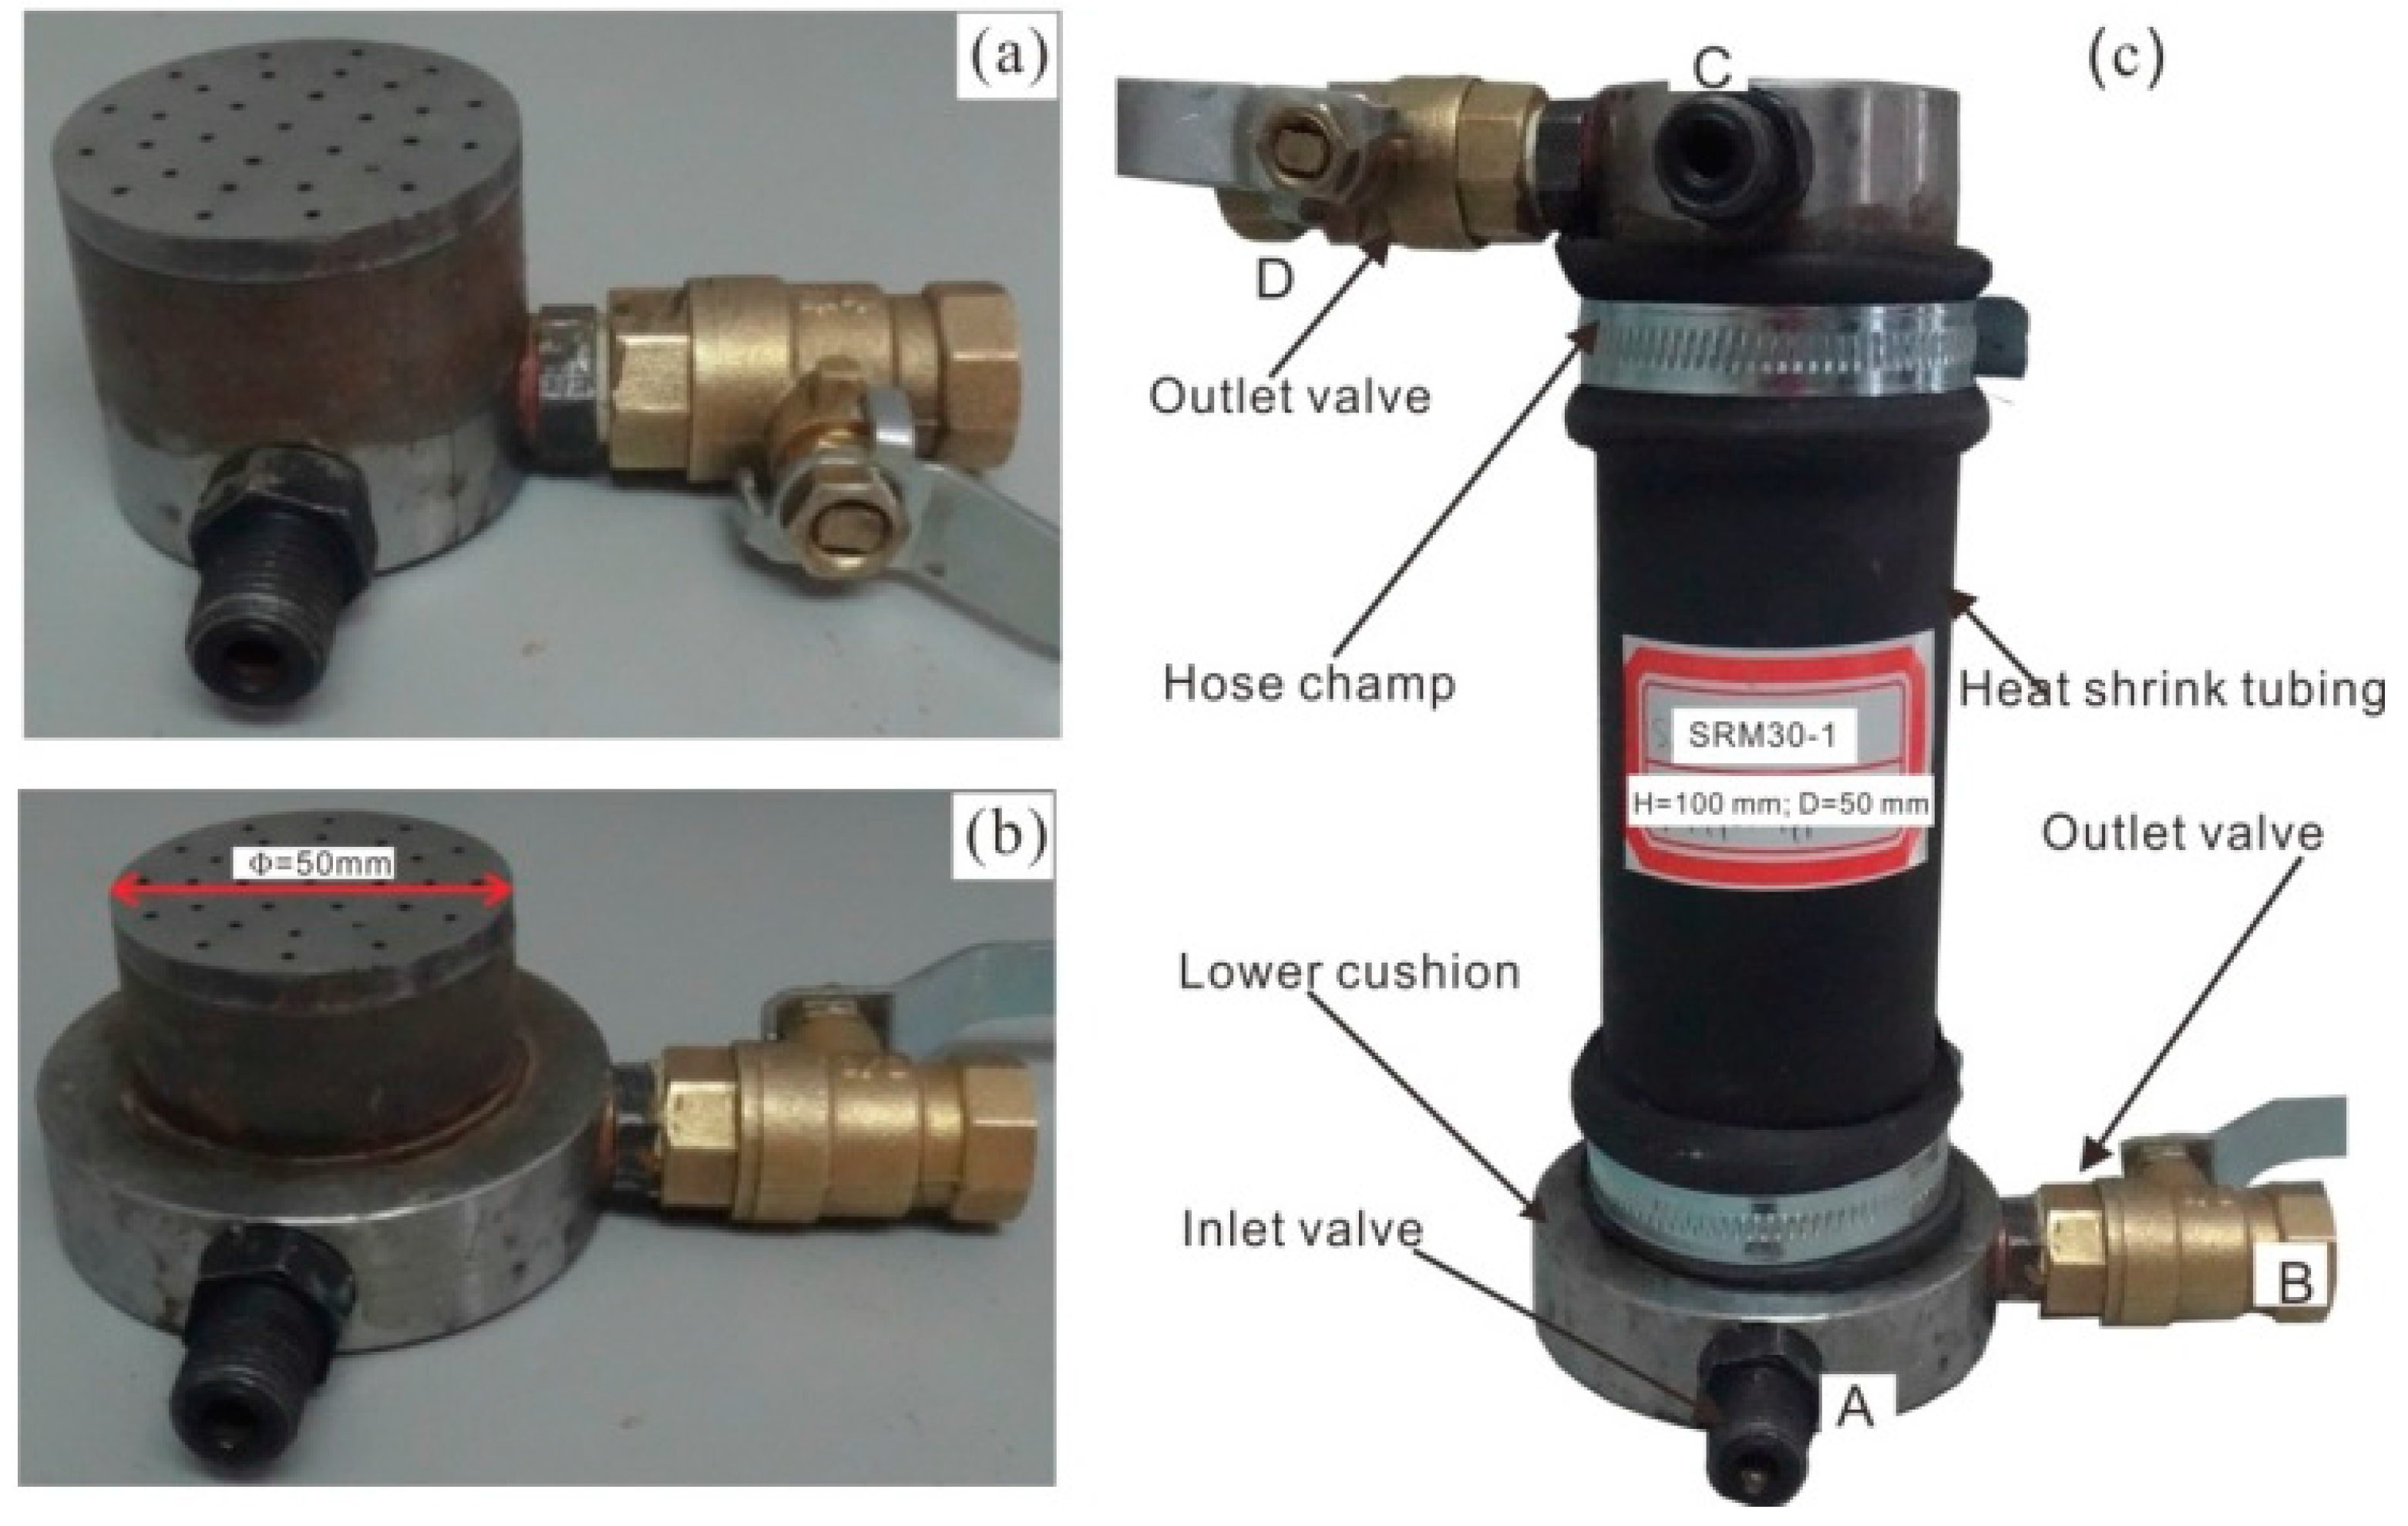
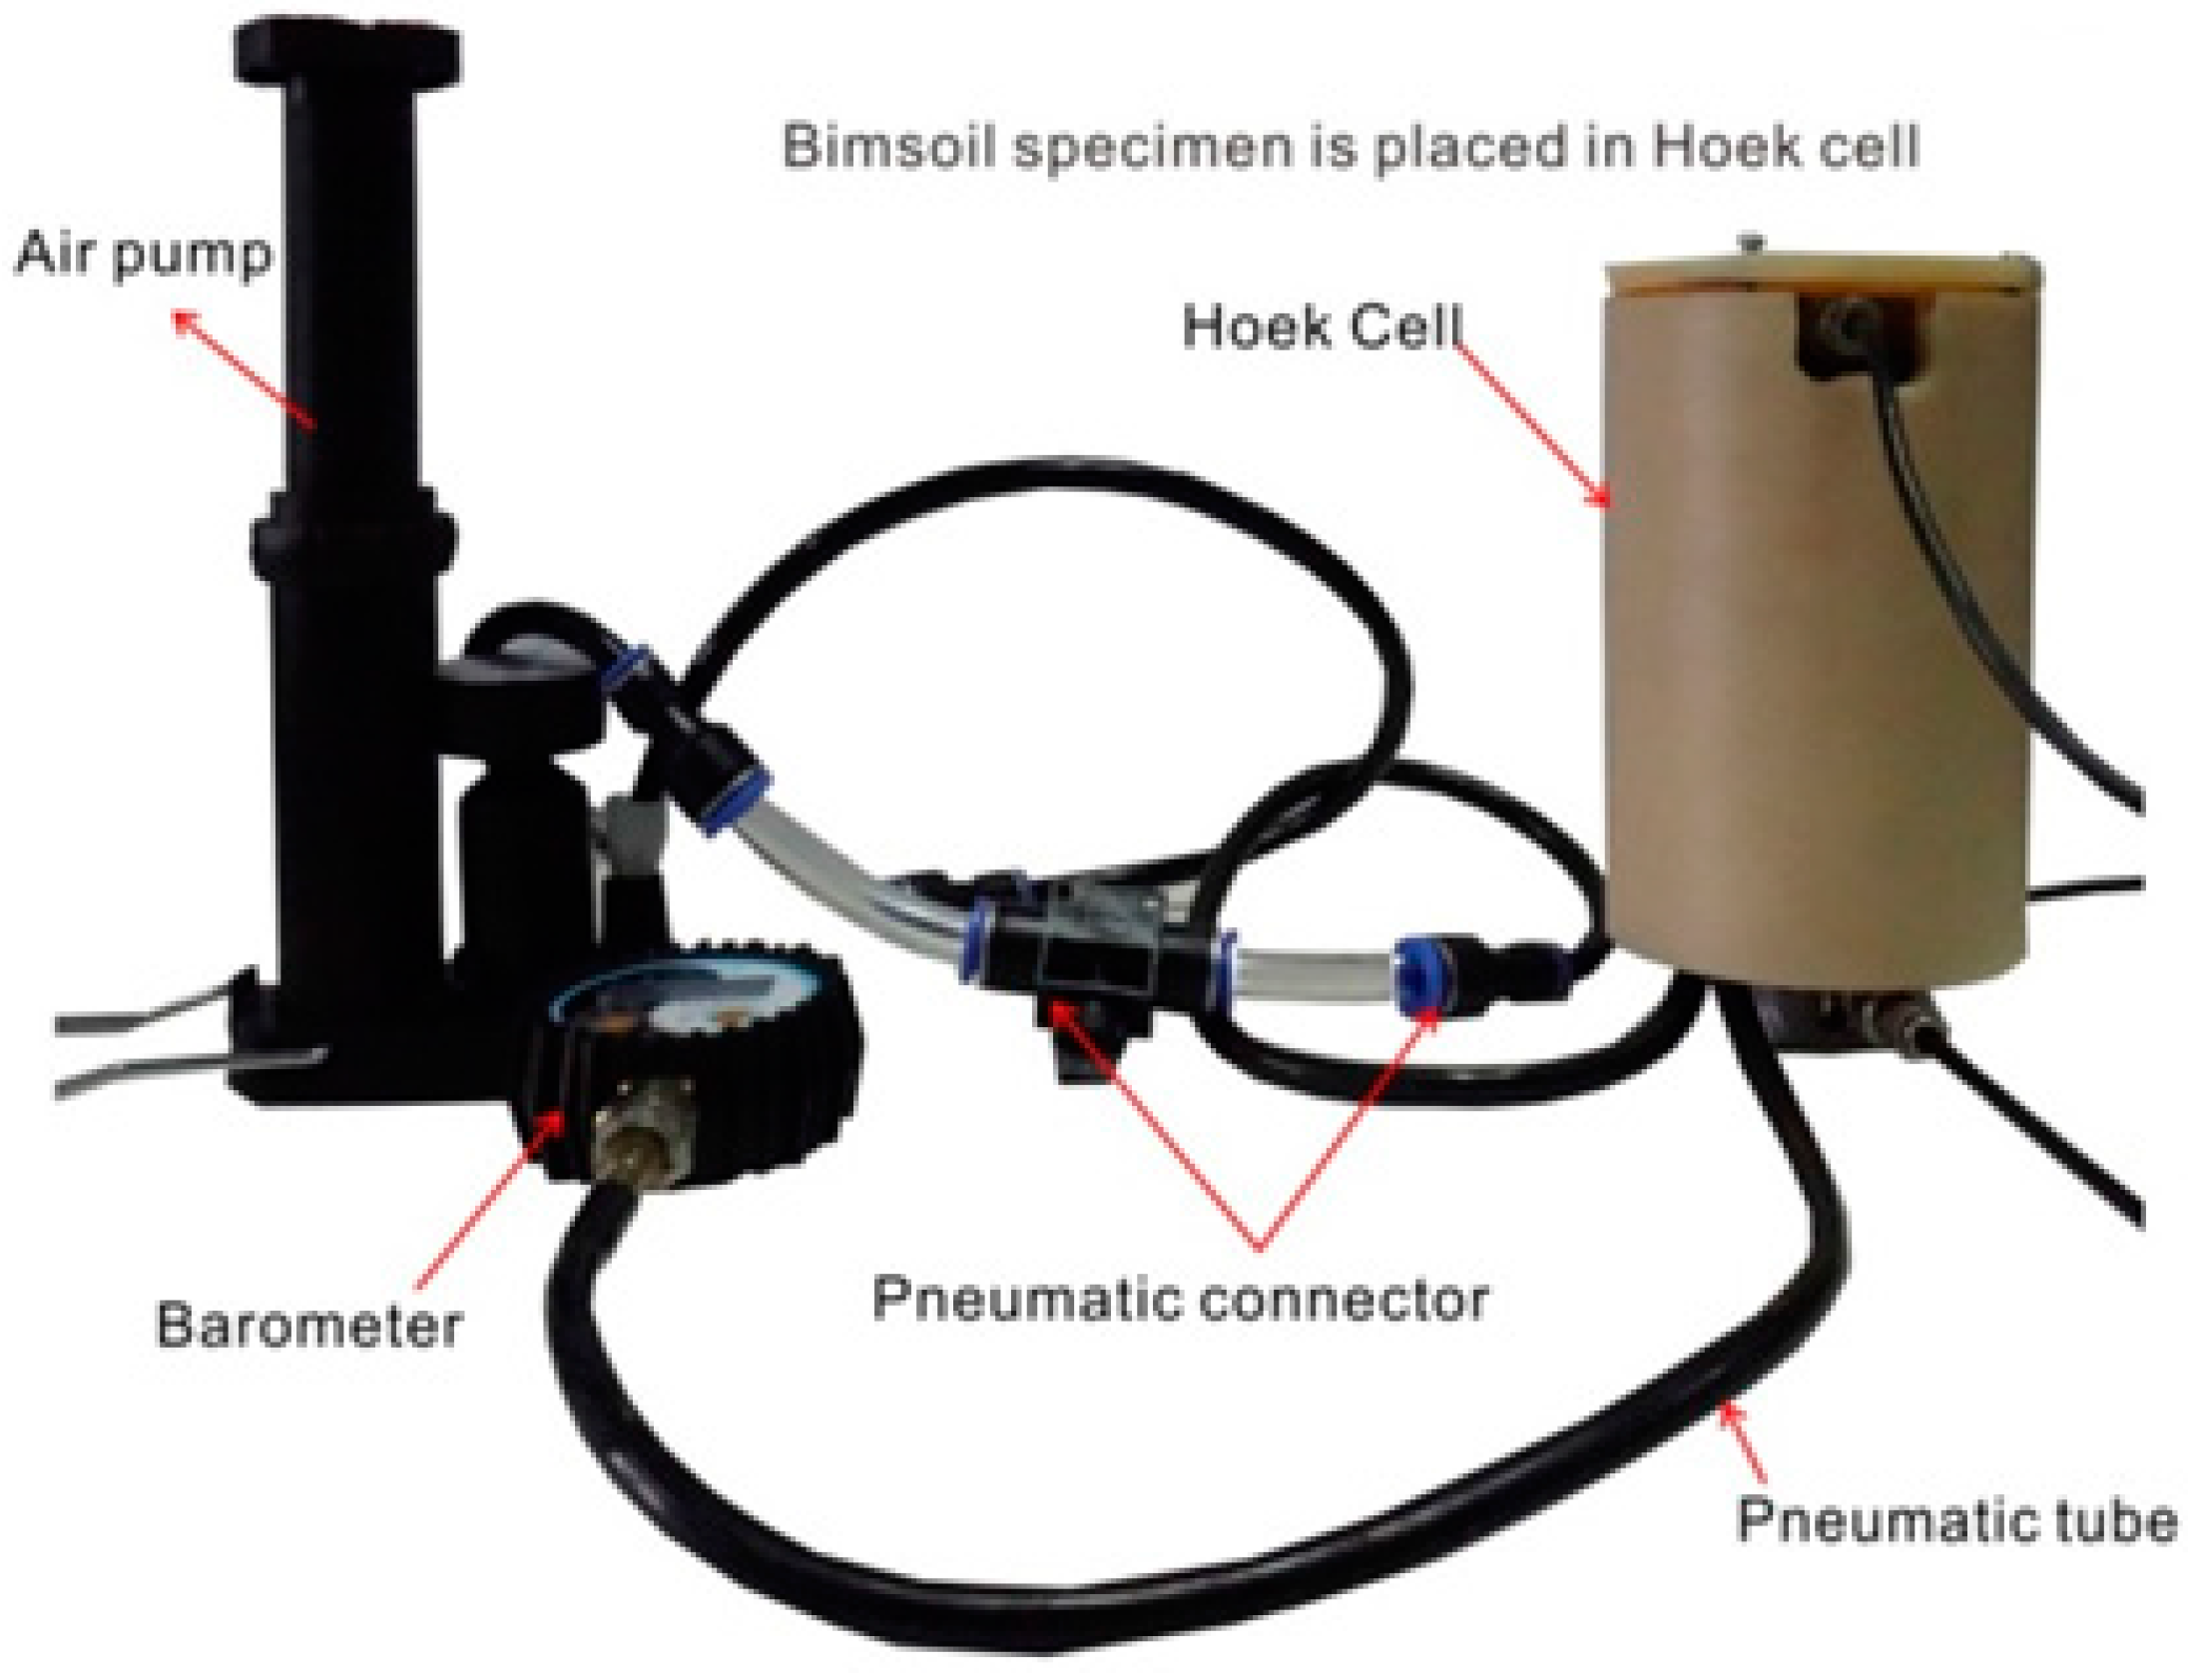
This experimental setup was previously detailed described by Wang et al. [12]. Figure 4 shows the layout of the piping test system includes the rigid specimen holder, the servo pressurized water-supply system, and the specimen chamber system. The rigid specimen holder is composed of the beams, rigid column, rigid platform, guide bar, etc. The purpose of the specimen holder is to keep the specimen chamber system steady on the platform during the whole piping test. The servo pressurized water-supply system includes the main parts of the speed feedback component, servo and drive motor, full digital servo controller, and the computer. The sample chamber system is composed of two metal seepage plates, two metal caps (upper one and lower ones), two hose clamps, and a length of heat shrink tubing accommodating the bimsoil specimen. The metal permeability caps are specially designed for the piping test; they contain the inlet valves, outlet valves, and some grooves. The diameter of the inlet and outlet valveis 3 mm. The heat shrinks the tube and the metal cap is connected with the self-adhesive type and hose clamps. The purpose of the self-adhesive type is to prevent leakage, and its sealing hydraulic pressure can reach 1 MPa. The detailed dimensions and structure of the mental cap, and locations of the inlet and outlet valve are shown in Figure 5. The confining pressure system (Figure 6) is composed of the Hoek cell, air pump, barometer, pneumatic connector, and pneumatic pipe [12].
2.3. Piping Test Procedure
To study the flow-erosion-stress coupled evolution process of bimsoil specimens with different RBPs, and obtain some important results from the piping test, the detailed technical flowchart is shown in Figure 7. The main procedures are as follows: (1) Specimen preparation and saturation. The bimsoil specimen is produced according to the method above. Saturation was performed with vacuum treatment, and then installed by the lower cap, upper cap, hose heating clamps, plastic self-adhesive tape, and shrink tube. The specimen is installed to be kept in the vertical state in order to avoid eccentric compaction. Water is injected at a low constant flow rate to saturate the specimen; (2) Formation of steady seepage field. During flow conditions, the specimen chamber system is placed on the rigid specimen holder. During the water-injection process, water is supplied by a constant pressure increment or a constant flow velocity. It is until the curve of the hydraulic pressure against time gradually became level, and the slope of the water flow curve against time is a constant value, that the steady seepage has formed in the specimen. The detail saturation process has been described by Wang et al. [12]; (3) Isotropic consolidation. The axial stress and confining pressure are exerted simultaneously, making the specimen in the state of equivalent stress; and, (4) Applying seepage pressure step by step. When water flow reaches steady state, we record the water-outflow volume, hydraulic pressure and flow time at each injection steps, and calculate the hydraulic gradient. The permeability coefficient basedon the Darcy law is obtained as below:
where Q is the total amount of flow water; A is the specimen cross-section area; t is the flow time; L is flow distance (i.e., length of specimen); P1 and, P2 is the hydraulic pressure of the inlet valve and outlet valve, respectively; and are the coefficient of water kinematic viscosity at T °C (the experimental temperature) and 20 °C, respectively.
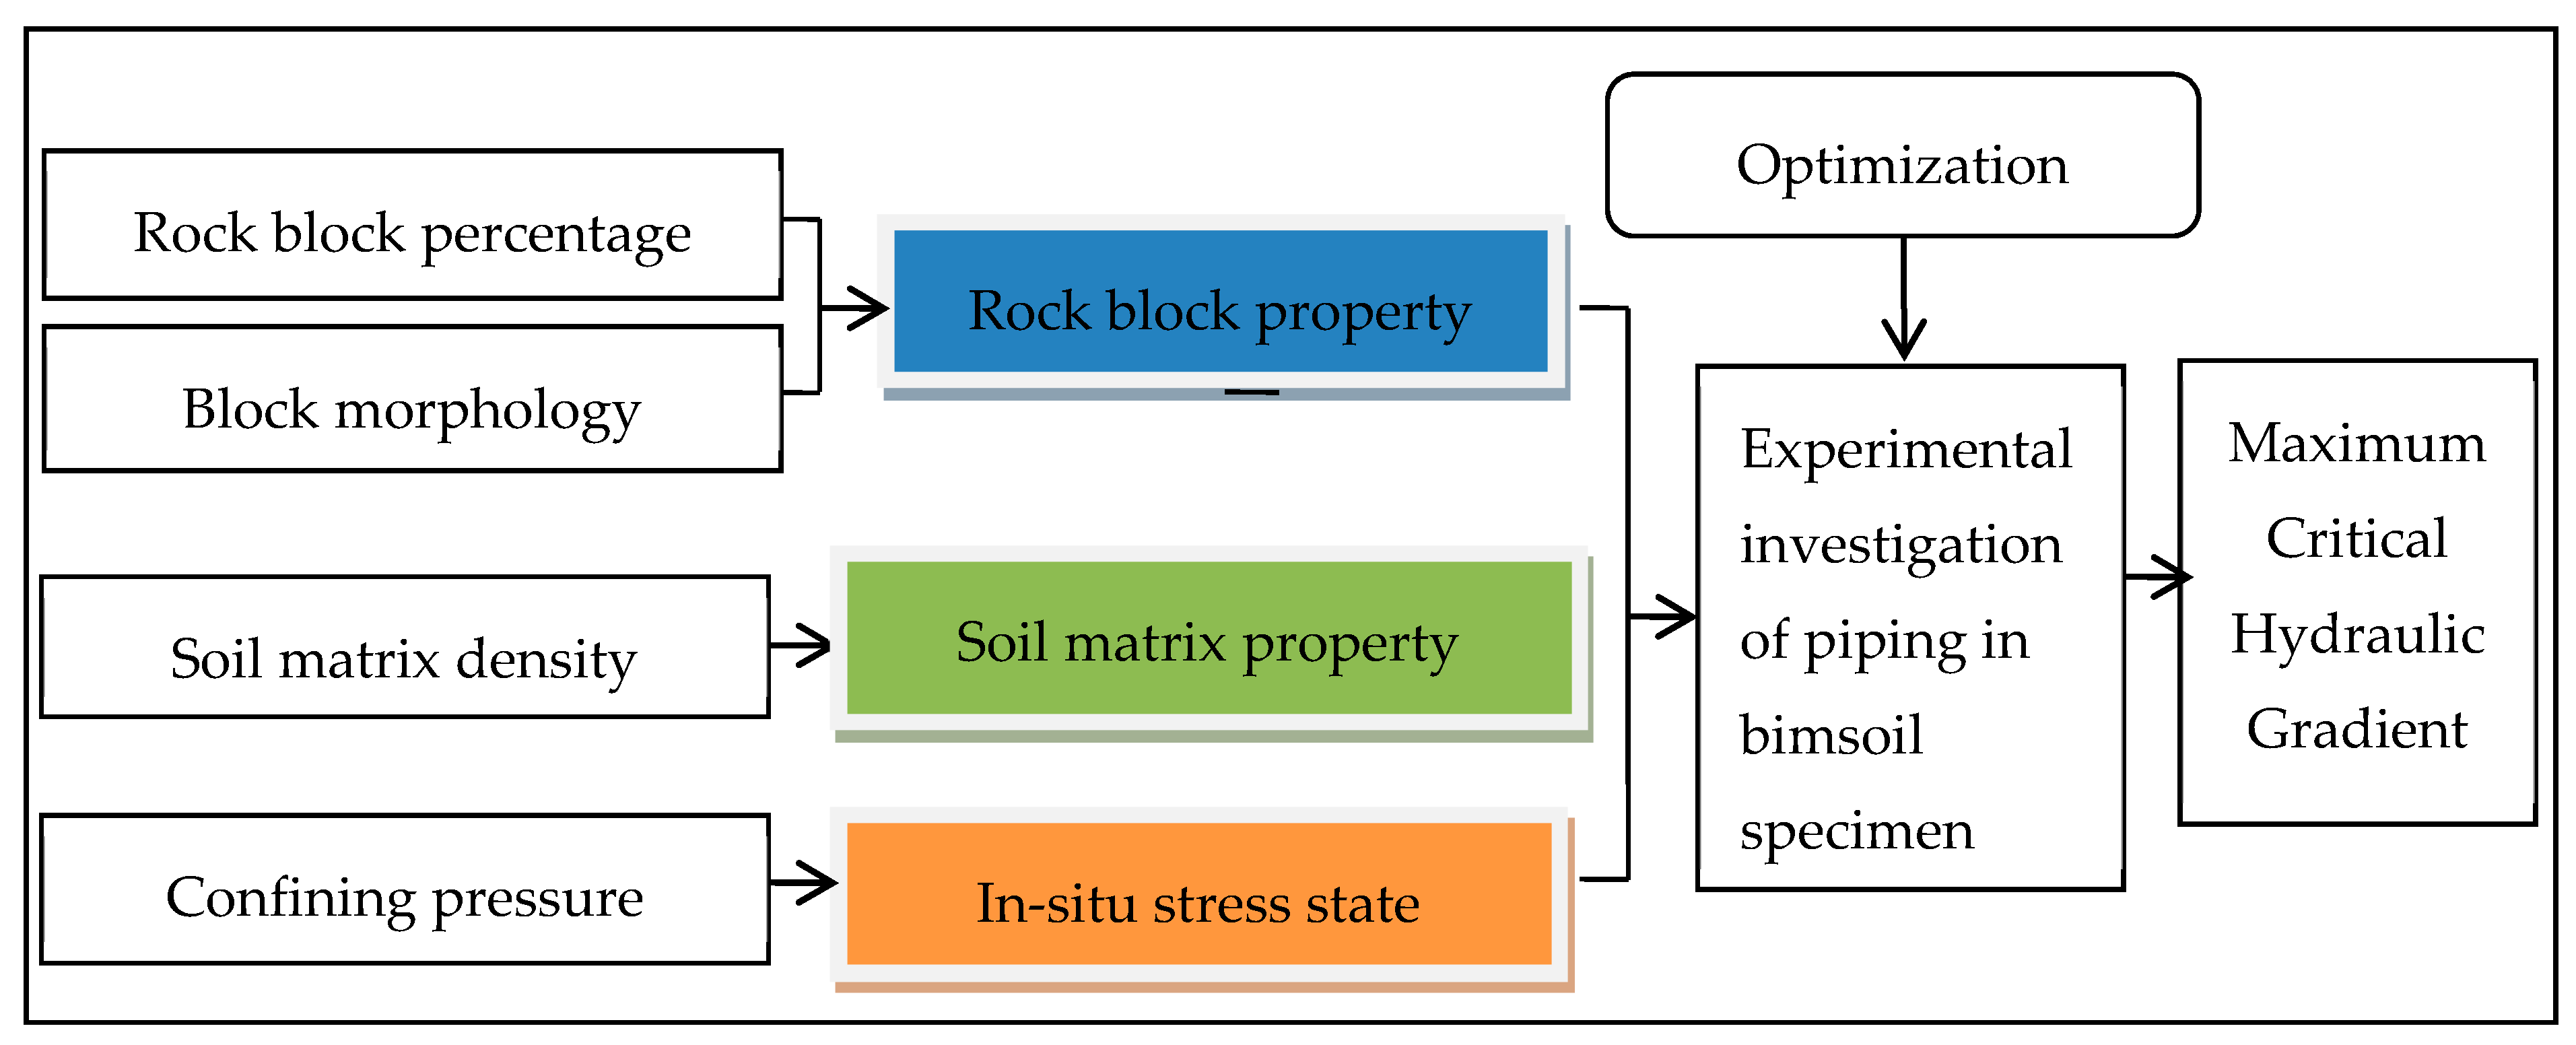
Figure 7 shows the flow chart for the multiple parameters evaluation during piping test the in bimsoils. Four factors were considered in this work. Rock block percentage is an accepted factor that influences the mechanical and hydraulic properties of bimsoil, whether by numerical test or laboratory experiments, this factor is always considered [2,3,4,5,6]. The density of soil matrix influences the flow capacity of bimsoil. Zhou et al. [28] have conducted orthogonal test to study the effect of various factors on bimsoil permeability, and showed that soil matrix density was the first influenced factor on the bimsoil permeability coefficient; in addition, the block morphology has effect on its permability. The stress state of the bimsoil also has an obvious effect on the evolution of piping [29,30,31,32]. Studies have shown that for an undisturbed sample, the critical hydraulic gradient is smaller than undisturbed specimen [10,11,15]; therefore, the piping test should consider the factor of stress state. Figure 8 shows the research idea of the multiparameters evaluation and optimization for piping evolution.
3. Multiparameter Evaluation and Analysis
3.1. Box-Behnken Design
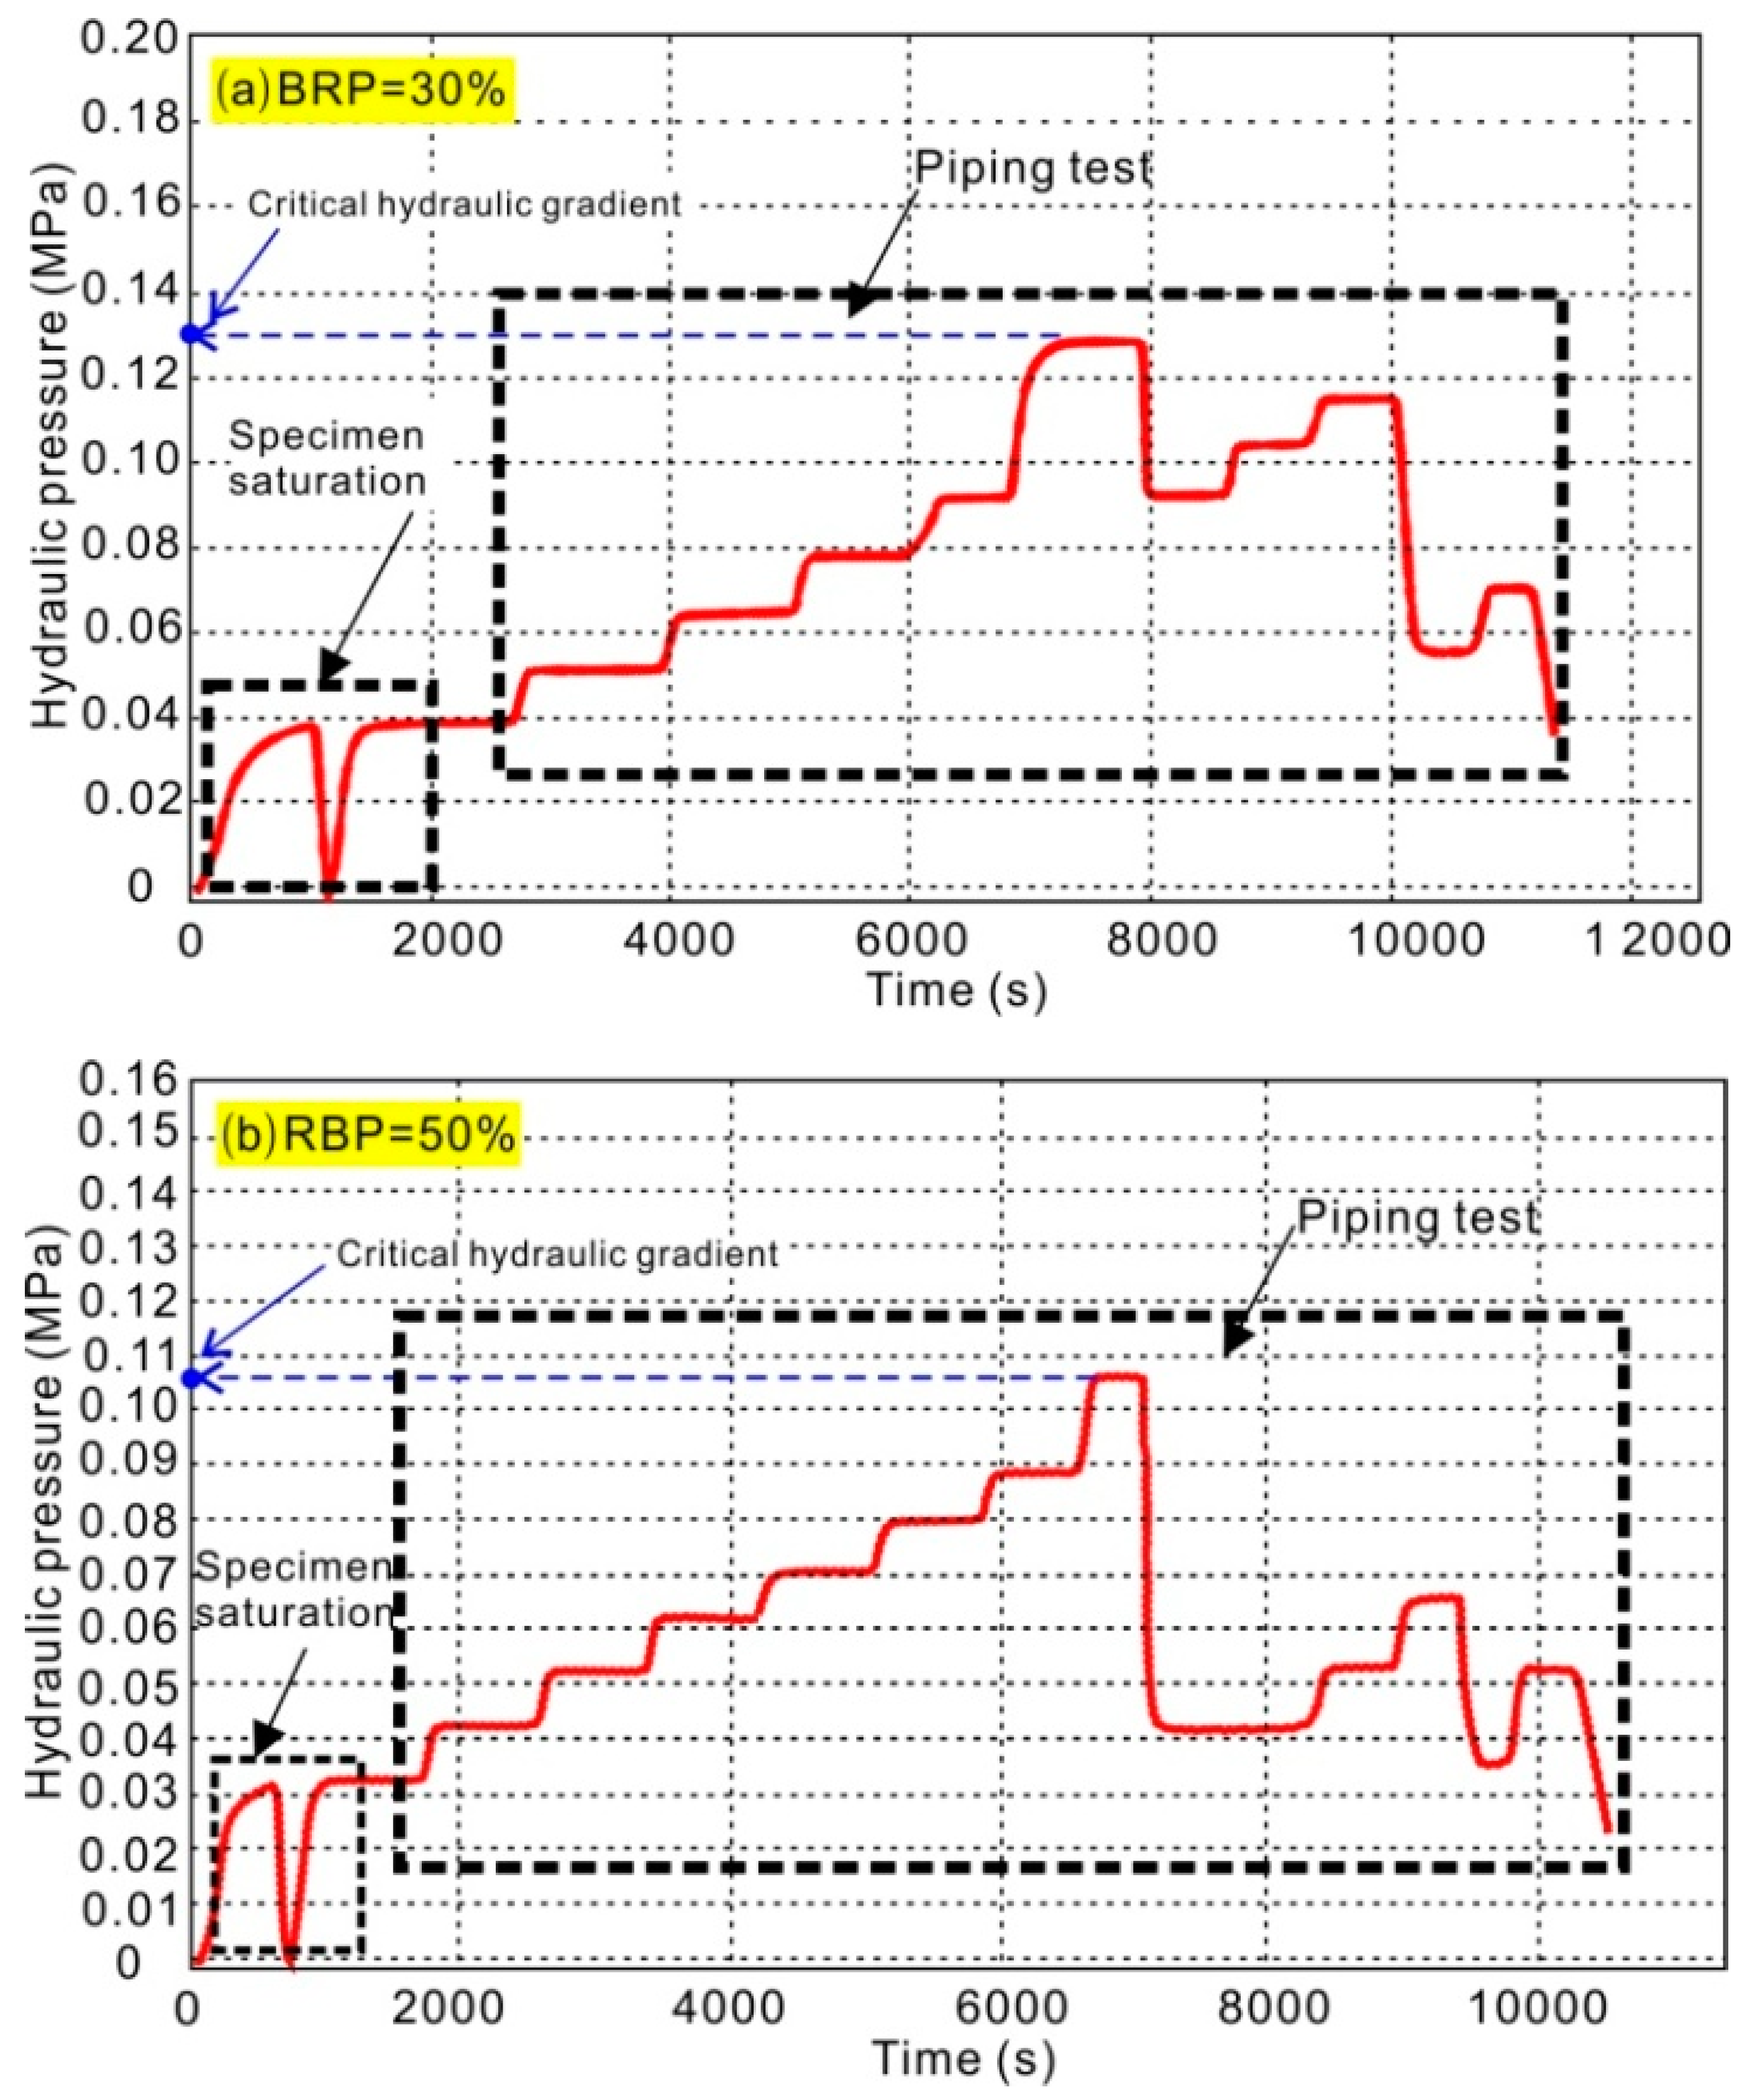
In this work, the response surface methodology (RSM) approach is applied to the evaluation and optimization of the piping stability in the bimsoils. In this work, the RSM approach is applied to evaluatean index of critical hydraulic gradient (which is defined as the value of piping initiation) for bimsoil during piping. Based on the least squares criterion, RSM is utilized to approximate a response over a range of variability of input factors, in terms of the maximum critical hydraulic gradient. The RSM model can offer a cost-effective and efficient way to deal with the uncertain factors for piping seepage, the form of it can be linear or fully quadratic. More detailed statistical and mathematical theories of RSM can refer to studies of Myers and Montgomery [33]. Four uncertain parameters, such as rock block percentage (RBP), soil matrix density (SMD), confining pressure (CP), and block morphology (BM)are given a reasonable range with the actual minimum and maximum values or coded symbol of “−1” and “+1”, respectively, as listed in Table 3. According the principle of the RSM method, for the four variables, a total of 27 cases were required based on the approach of Box-Behnken Design, which originated from the optimal design theory [34,35,36]. Table 4 lists the 27 combinations of these uncertain parameters generated by the Box-Behnken Design. After the piping experiment of each case, the results of critical hydraulic gradient are listed in column 8 in Table 4, as the response value. The critical hydraulic gradient is determined from the curves of hydraulic gradient against time. Taking the specimen with RBP of 30% and 50% for example (Figure 9), hydraulic gradient increases with the increase of flow time. When it reaches a critical value, the curve suddenly drops and fluctuates with time. The inflection point is determined as the critical hydraulic gradient. Some significant results can be drawn from Figure 9, as below:
- (1)
- The curves presents fluctuation trend after the critical hydraulic pressure, however, the value cannot exceed the critical peak value. This result implies that irreversible damage occurs in bimsoil during piping. During process of piping, the erosion, and movement of soil particles result in the change of permeability. When the fine soil particles during movement are clogged in the pores, leading to the increment of hydraulic gradient, seepage velocity, and the associated permeability coefficient; and when the clogged pores are break through again, these values suddenly decrease. This non-linear multiple fluctuation always existsin the piping process.
- (2)
- From the curves of flow water, it can also be seen that the slope of the curve in not constant, but variational during the whole test. The non-linear fluctuation behavior of the curves shows that the evolution of piping includes a series of complex movement behaviors, such as the erosion, migration of fine soil particles; contact erosion of rock-soil interface; forming of pore channel; blocking of flow channel by fine soil particles; breakdown of the blocked flow channel; and, re-block of the flow channel, etc. The characteristics of piping in bimsoilare progressive and repeated. The blocked flow channel can be attributed to two factors, one is the fine soil particles; the other is the movement of rock blocks, as the structure of bimsoil sample changes, the blocks would sink along the direction of water flow.
3.2. RSM Model Analysis
From Figure 8, the onset of the steep drop in the hydraulic pressure-flow time curves was assumed to estimate the critical hydraulic gradient. Beyond this point, the seepage velocity, hydraulic gradient, and permeability fluctuate repeatedly. This method to determine the critical hydraulic gradient has also been used by other researchers, such as Das et al. [37] and Das and Viswanadham [38] during piping tests. When the critical hydraulic gradient was obtained, the RSM method is used to analyze the relationship between the response value and the four uncertain factors. In order to select the appropriate RSM model, a linear model, two factor model interaction model (2FI), quadratic model, and cubic model are selected to judge, which polynomial fits the equation based on the statistical approach, as shown in Table 5. Table 5 lists the response surface model for the critical hydraulic gradient. If the model has the highest polynomial, and the other additional terms are significant, and the model is not aliased [12,39], we choose it as the appropriate model. We would not select the cubic model, if it is aliased. Aliasing phenomenon decreases the number of experimental runs. When this appears, several groups of effects are combined into one group and the most significant effect in the group is used to represent the effect of the group. Essentially, it is important to note that the selected model should not be aliased. In addition, the model has the maximum “Predicted R-Squared” and “Adjusted R-Squared” is also important criteria to be considered [39]. From the results of Table 5, the fully quadratic model is finally selected to build the critical hydraulic gradient (CHG) response surface in the subsequent optimization process.
The anova for the response surface quadratic model of CHG is shown in Table 6. From the result, the model F-value of 24.01 implies the model is very significant, the change is less than 0.1% that a “Model F-Value” this large could occur due to noise. Values of “Prob > F” less than 0.05 indicates that the model variations are significant. In this case, the model p-value prob of the studied factors is <0.0001, 0.0020, 0.013, and 0.0325; this result indicates that the factors of A, B, C, and D are all significant model terms. The smaller the p-value pro, the more sensitive of the factor is to the response surface. The influential order of these four factors is: A-rock block percentage > C-confining pressure > B-soil matrix density > D-block morphology. The equations fitted to the critical hydraulic gradient response surface in terms of actual factors are:
where A is the rock block percentage; B is the soil matrix density; C is the confining pressure; and, D is the block morphology.
CHG = +119.11 − 1.73A + 50.31B + 0.12C − 12.60D − 1.77AB + 0.11A × D − 0.07B × C − 0.46B × D − 0.013C × D + 0.03A2 + 26.19B2 + 1.63D2
Figure 10 shows the normal plots of residuals, which can reflect the distribution of the residuals for the response value of the critical hydraulic gradient. All of the test points in the “Normal Plot of Residuals” fall on the straight line, implying that the residuals are normally distributed, and the model is significant. Figure 11 shows the “Predicted versus Actual” for critical hydraulic gradient, illustrating whether the generated equation of gradient response surface accurately predicts the actual values. It can be seen that generated hydraulic gradient response surface models provide such reliable predicted values for hydraulic gradient, as compared to the actual values of the hydraulic gradient.
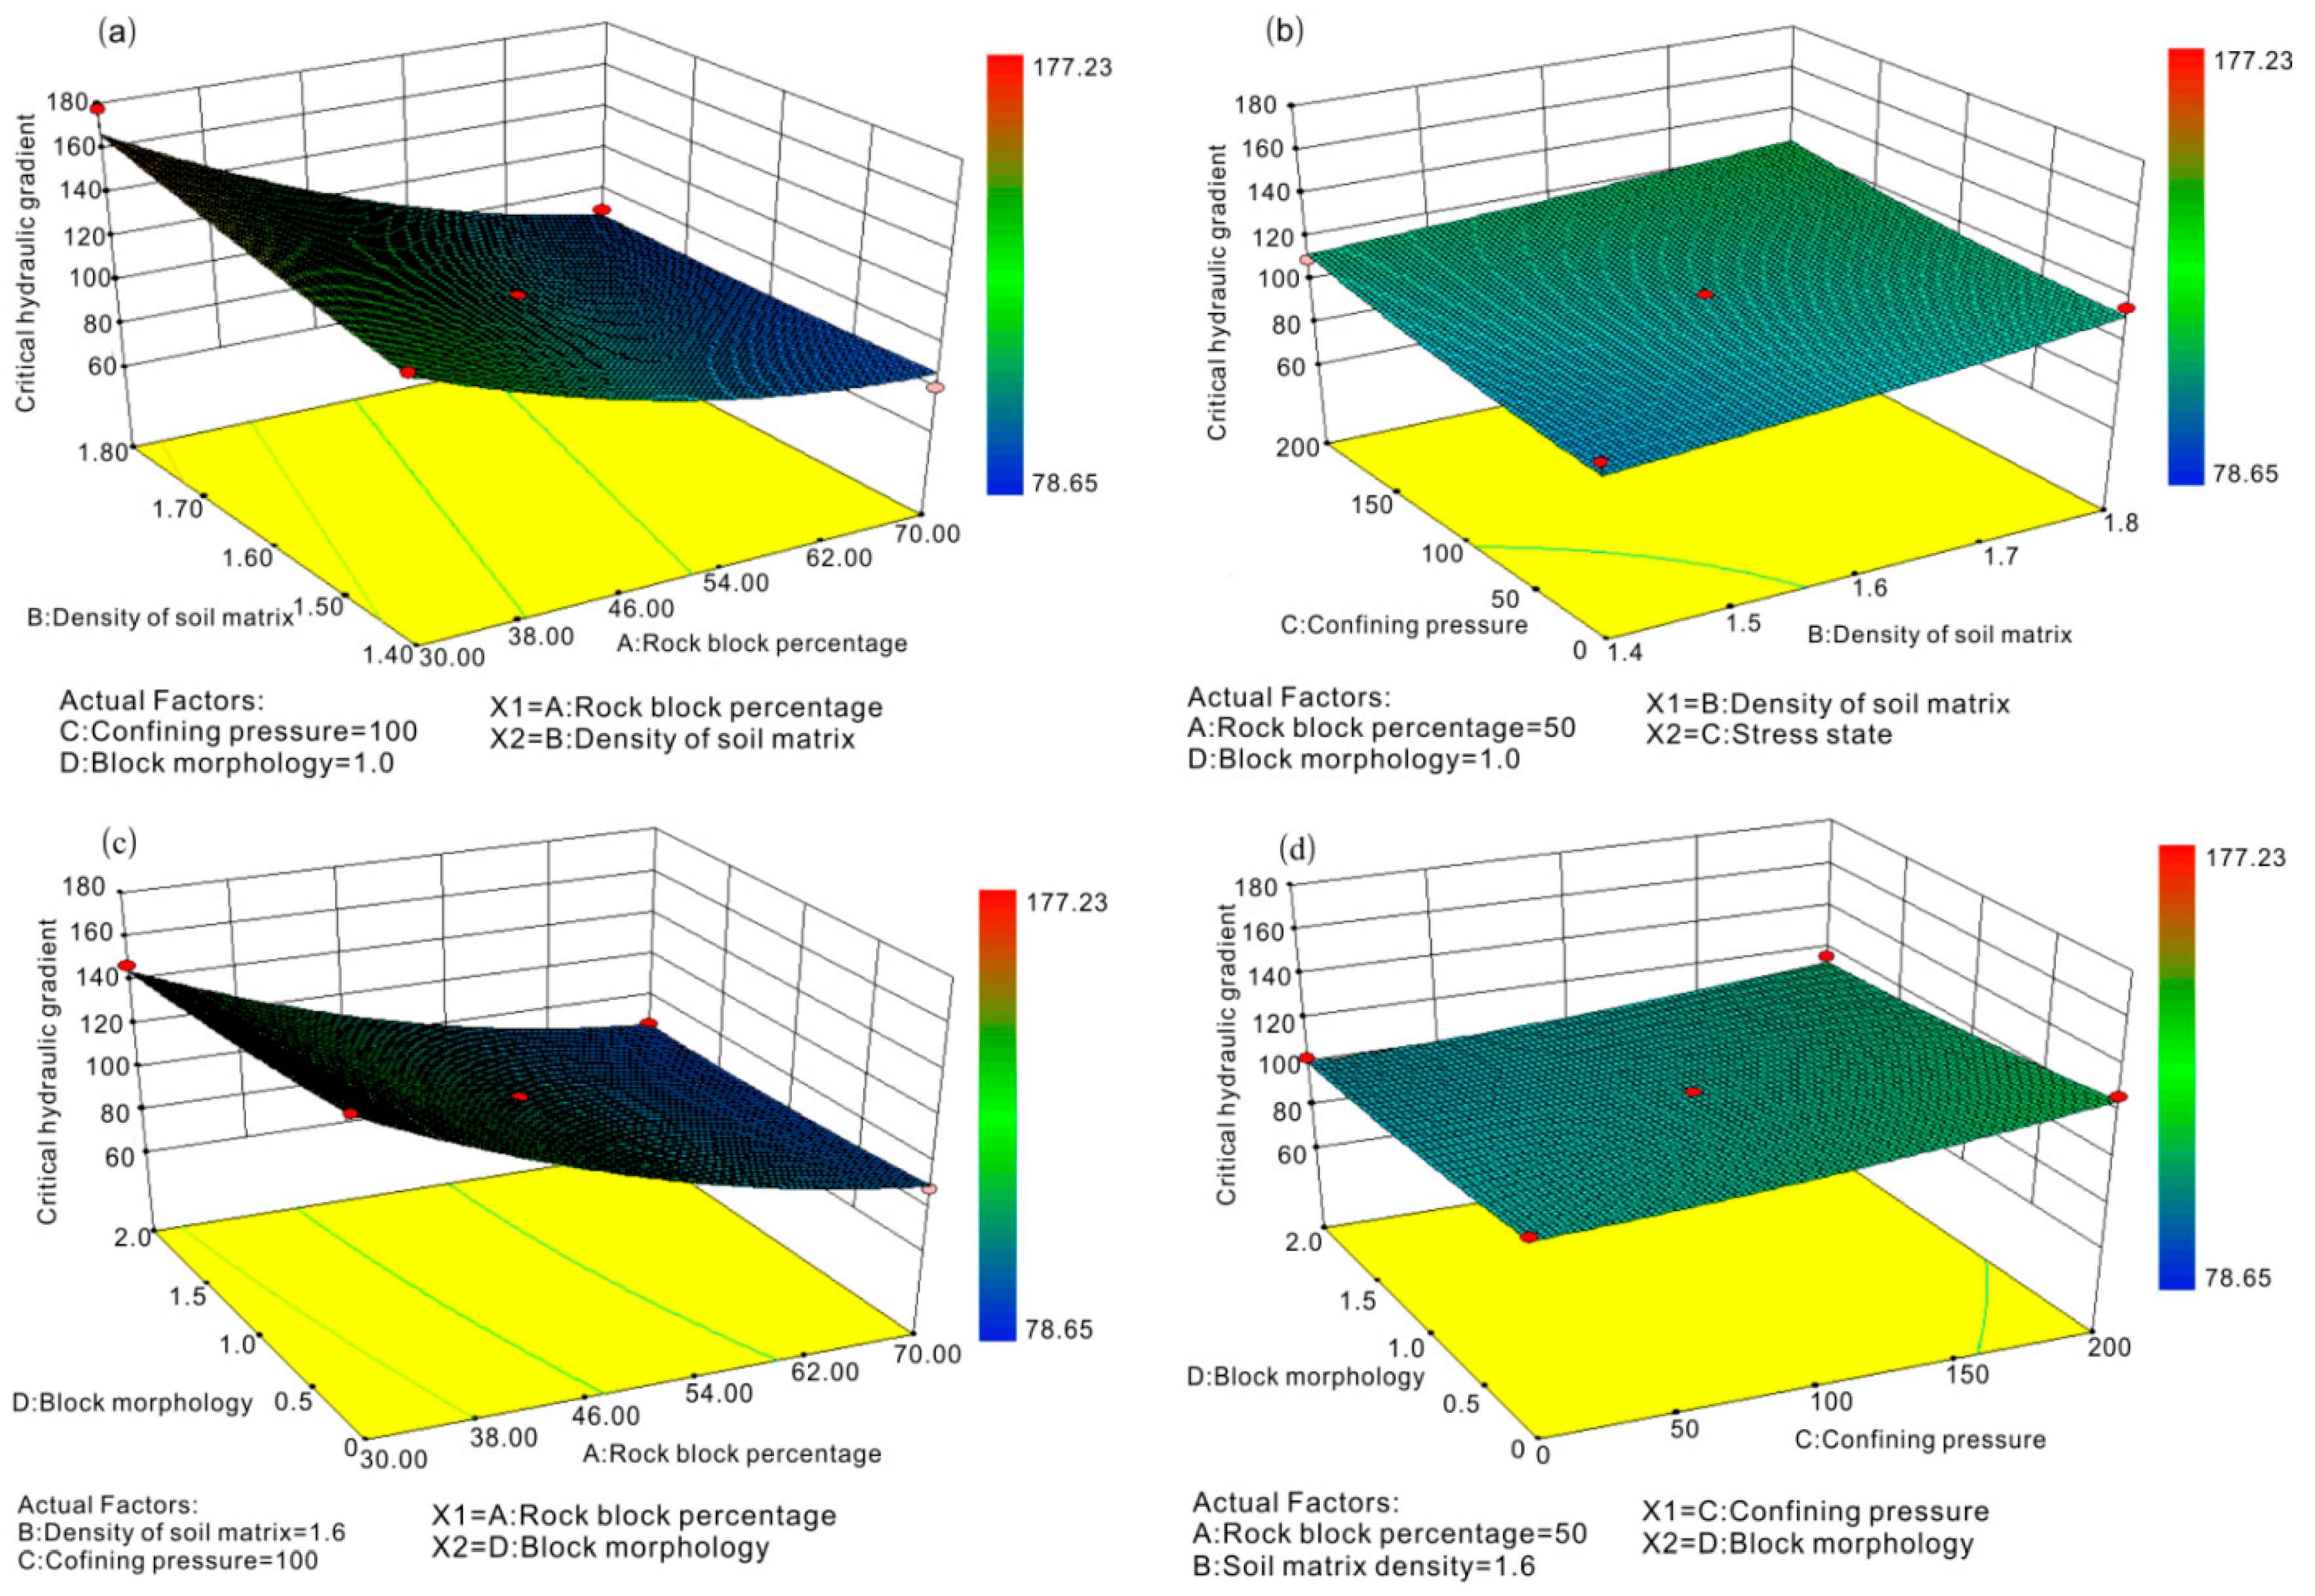
Figure 12 plots the three-dimensional (3D) response surface of the four studied factors, the response surface represents all the 27 run case. It shows the influential tread of the four factors to CHG. Figure 12a plots the influence of factor rock block percentage and soil matrix density on the CHG response. It can be clearly seen that CHG decreases with the increasing rock block percentage; Figure 12b plots the influence of soil matrix density and confining pressure on CHG response, the CHG increases with the increase of confining pressure and soil matrix density; Figure 12c plots the influence of rock block percentage and block morphology on the CHG response, the CHG increases with the increase of block angularity, this result implies the incremental compactness of soil particles and contact between soil matrix and rock blocks. The coupling degree of rock block and soil matrix improves as the confining pressure and soil density increase. Content of rock blocks increases the number of rock-soil interface, the sudden drop of seepage force at these interfaces causes the occurrence of contact erosion, and the associated seepage failure, which leads to the decrement of flow stability of bimsoil specimen.
3.3. Critical Hydraulic Gradient Optimization
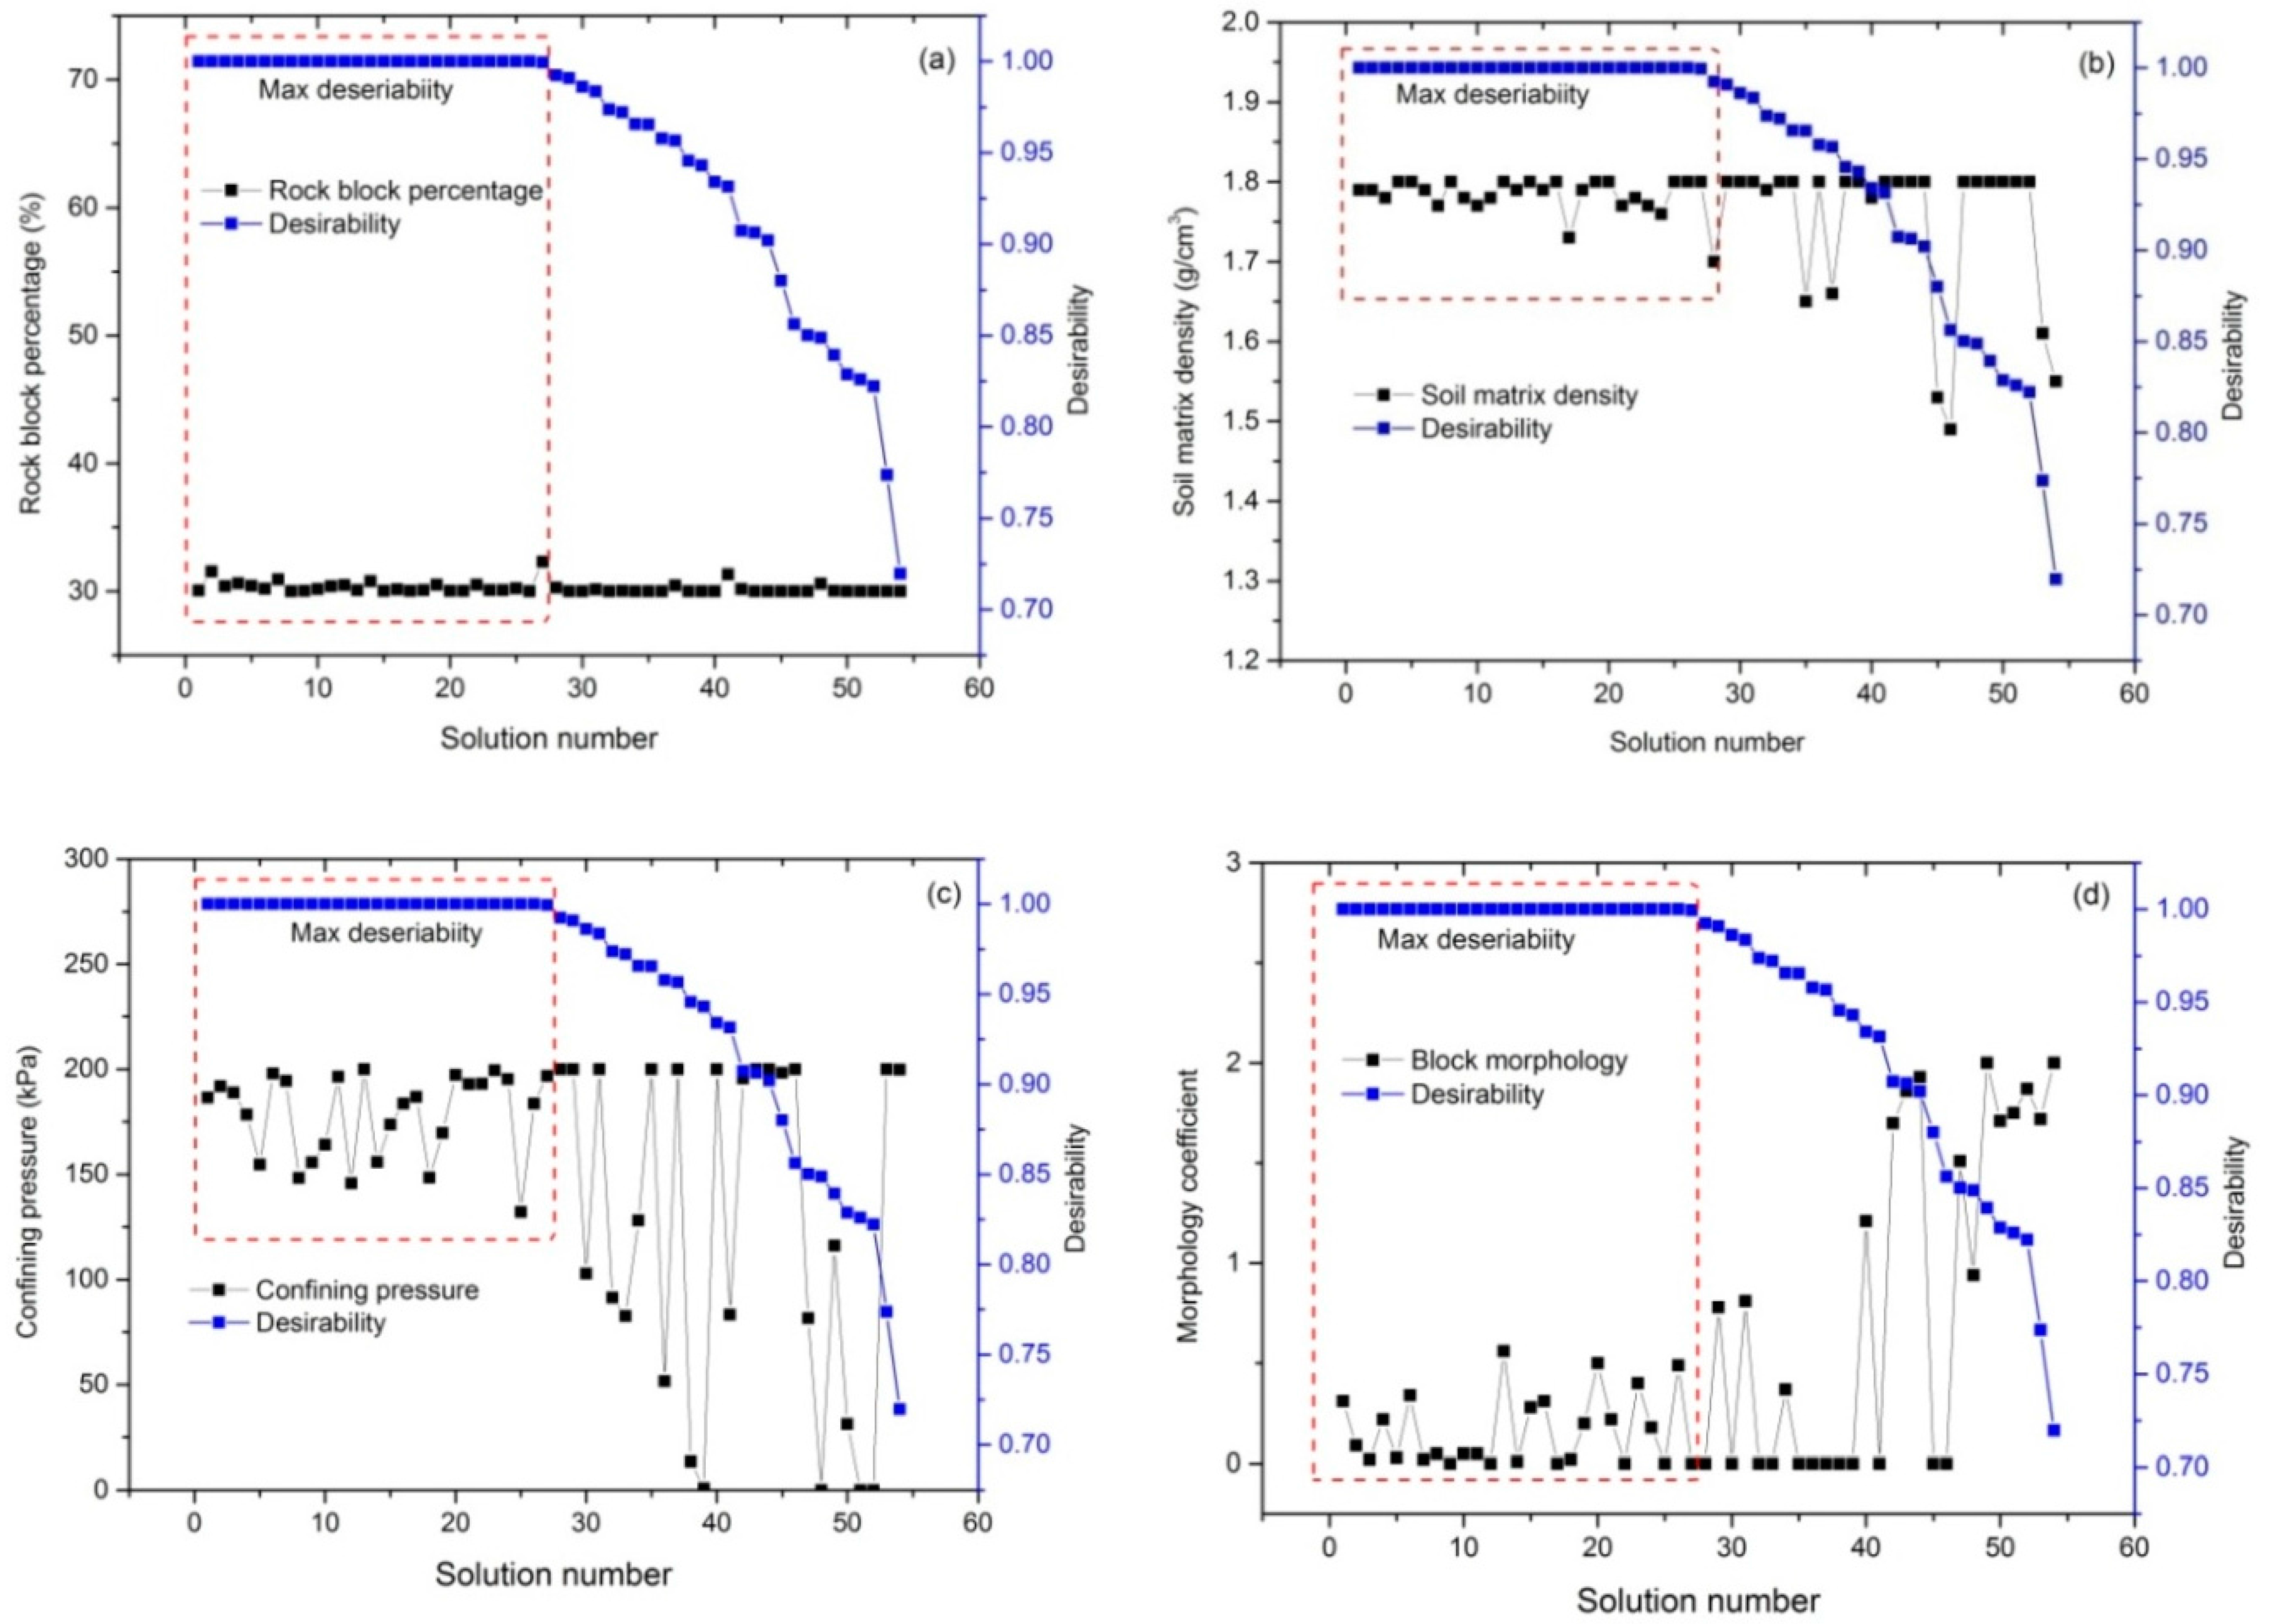
The index of CHG indicates the resistance capacity of bimsoil to seepage force, the larger the CHG value, the better capacity of bimsoil is. In this section, the RSM numerical optimization algorithm is employed to select the set of variables that leads to the maximum CHG value. A total of 54 optimal solutions are generated after the RSM numerically optimization. The desirability value ranges from 0.376 to 1.0. We select the solutions with the maximum desirability value to analyze. Figure 13 shows the relationship between the studied factors and the desirability value. The red box indicates the desirability value equal to 1.0, which are the optimist solutions. From the optimization results, the rock block percentage is about 30% if we want to obtain the maximum CHG, it corresponds to the smallest the block content. Higher soil matrix density is desirable to improve the CHG. When to get a high CHG, confining pressure ranges from 160 to 180 kPa, in-situ stress state has an important influence on the CHG. The factor of block morphology is not so sensitive to CHG, and angular rock block tends to improve CHG as compared to round block. Among the 54 solutions, we select the 20 cases when the desirability is 1, as listed in Table 7.
3.4. Discussions
Based on the experimental data of the piping test, we used the response surface method to conduct the sensitive analysis. The rock block percentage is the most sensitive factor influenced the seepage erosion failure. The role of rock blocks in bimsoil is always considered to be the important factor influencing the mechanical and physical properties. Xu et al. [40], Liao [41], Dan et al. [15], and Wang et al. [10] have conducted a series of permeable test forbimsoil, they found that rock blocks in bimsoil have obvious effect on permeability coefficient. In our study, it was also found that rock blocks have an obvious influence on the critical hydraulic gradient. Although the rock blocks play a role of an impervious effect, this effect may improve the permeability in some ways, however, the contact erosion at rock-soil interface is always the decisive factor controlling the seepage failure of bimsoil. Along the seepage direction, the hydraulic pressure drops sharply at rock-soil interfaces, resulting in the formation of a great seepage force at the interfaces, flow channel of erosion first forms at these parts. Therefore, the characteristics of rock blocks (e.g., size, shape, distribution, content, etc.) control the flow life of specimens, and the critical hydraulic gradient decreases with an increasing rock block content. The factor of confining pressure reflects the in-situ stress state of bimsoil, some scholars clearly point out that when studying the permeable characteristics of bimsoil, confining pressure should not be ignored [29,42]; otherwise, most of the testsdo not consider the actual stress state. Soil matrix density is also a crucial factor to the permeable characteristics of bimsoil, Zhou et al. [28] conducted orthogonal tests on the permeability of bimsoil. They found that soil density is more sensitive to other factors. Tickell and Hiatt [43] discussed the influence of granular angularity and roundness on the permeability coefficient, found that with the increasing of angularity, the permeability coefficient increases. The result implies that angularity has different degree of resistance on water flow. Our test results further prove this phenomenon and reveal some new insights on the seepage failure of bimsoils.
4. Conclusions
In this work, a self-developed servo-controlled flow-erosion-stress system was used to conduct the piping experiments. By using the response surface methodology, four uncertain parameters (i.e., rock block percentage, soil matrix density, confining pressure, and block morphology) were used to evaluate and obtain the optimal solutions for the critical hydraulic gradient. The following conclusions can be drawn from this study:
- (1)
- By the RSM evaluation, the influential order of the studied factors to piping seepage failure is firstly obtained, rock block percentage is the most sensitive factor to the critical hydraulic gradient. The influentical order is rock block percentage > confining pressure > soil matrix density > block morphology.
- (2)
- Confining pressure has obvious effect on the critical hydraulic gradient of bimsoil. The sensitivity of this factor is second to the rock block percentage, it is a non-negligible factor when investigating the piping erosion mechanism of bimsoil. In-situ stress state not only influences the seepage field, but also affects the degree of contact erosion among rock-soil interfaces.
- (3)
- Increasing soil density, confining pressure, and block angularity can improve the ability to resist piping seepage failure. In bimsoil construction, we can adjust the rock block content, compaction degree, and block morphology to improve the ability of anti-seepage erosion.
Acknowledgments
The authors would like to thank the editors and the anonymous reviewers for their helpful and constructive comments. This work was supported by the Beijing Natural Science Foundation of China (Grants No. 8164070), National Natural Science Foundation of China (41502294), Fundamental Research Funds for the Central Universities (2302017FRF-TP-17-027A1), and the National key technologies Research & Development program (2017YFC0804609).
Author Contributions
Yu Wang and Changhong Li designed the theoretical framework; Yu Wang conducted the experiment, analyzed the experimental date and wrote the manuscript; Yanzhi Hu and Yonggang Xiao corrected the figures.
Conflicts of Interest
The authors declare no conflict of interest.
References
- Lindquist, E.S. The Strength and Deformation Properties of Melange. Ph.D. Thesis, University of California, Berkeley, Berkeley, CA, USA, March 1994. [Google Scholar]
- Medley, E.W. Observations on tortuous failure surfaces in Bimrocks. Felsbau Rock Soil Eng. 2004, 5, 35–43. [Google Scholar]
- Medley, E.W. Systematic characterization of mélange bimrocks and other chaotic soil/rockmixtures. Felsbau-Rock Soil Eng. 1999, 17, 152–162. [Google Scholar]
- Goodman, R.E.; Ahlgren, C.S. Evaluating safety of concrete gravity dam on weak rock. J. Geotech. Geoenviron. Eng. 2000, 126, 429–442. [Google Scholar] [CrossRef]
- Coli, N.; Boldin, I.D.; Bandini, A.; Lopes, D.S. Modeling of complex geological rock mixtures under triaxial testing conditions. In Proceedings of the International Symposium on Rock Engineering & Technology for Sustainable Underground Construction (Eurock), Stockholm, Sweden, 28–30 May 2012. [Google Scholar]
- Coli, N.; Berry, P.; Boldini, D. In situ non-conventional shear tests for the mechanical characterisation of a bimrock. Int. J. Rock Mech. Min. Sci. 2011, 48, 95–102. [Google Scholar] [CrossRef]
- Afifipour, M.; Moarefvand, P. Failure patterns of geomaterials with block-in-matrix texture: Experimental and numerical evaluation. Arab. J. Geosci. 2014, 7, 2781–2792. [Google Scholar] [CrossRef]
- Wang, Y.; Li, X.; Zhang, B. Meso-damage cracking characteristics analysis for rock and soil aggregate with CT test. Sci. China Technol. Sci. 2014, 57, 1361–1371. [Google Scholar] [CrossRef]
- Wang, Y.; Li, X.; Wu, Y.F.; Lin, C.; Zhang, B. Experimental study on meso-damage cracking characteristics of RSA by CT test. Environ. Earth Sci. 2015, 73, 5545–5558. [Google Scholar] [CrossRef]
- Wang, Y.; Li, X.; Zheng, B.; Li, S.D.; Duan, Y.T. A laboratory study of the effect of confining pressure on permeable property in soil-rock mixture. Environ. Earth Sci. 2016, 75, 1–16. [Google Scholar] [CrossRef]
- Wang, Y.; Li, X.; Zheng, B.; Ma, C.F. An Experimental Investigation of the Flow-Stress Coupling Characteristics of Soil-Rock Mixture under Compression. Transp. Porous Media 2016. [Google Scholar] [CrossRef]
- Wang, Y.; Li, C.; Zhou, X.; Wei, X. Seepage Piping Evolution Characteristics in Bimsoils—An Experimental Study. Water 2017, 9, 458. [Google Scholar] [CrossRef]
- Estabragh, A.R.; Soltannajad, K.; Javadi, A.A. Improving piping resistance using randomly distributed fibers. Geotext. Geomembr. 2014, 42, 15–24. [Google Scholar] [CrossRef]
- Sibille, L.; Lominé, F.; Poullain, P. Internal erosion in granular media: Direct numerical simulations and energy interpretation. Hydrol. Process. 2015, 29, 2149–2163. [Google Scholar] [CrossRef] [Green Version]
- Dan, H.C.; He, L.H.; Xu, B. Experimental Investigation on Non-Darcian Flow in Unbound Graded Aggregate Material of Highway Pavement. Transp. Porous Media 2016, 112, 189–206. [Google Scholar] [CrossRef]
- Cyril, G.; Yves-Henri, F.; Rémi, B. Contact erosion at the interface between granular coarse soil and various base soils under tangential flow condition. J. Geotech. Geoenviron. Eng. 2009, 136, 741–750. [Google Scholar] [CrossRef]
- Richards, K.S.; Reddy, K.R. Experimental investigation of initiation of backward erosion piping in soils. Géotechnique 2012, 62, 933–942. [Google Scholar] [CrossRef]
- Ni, X.; Wang, Y.; Dallo, Y.A.H. Discussion of Analysis of the internal stability of granular soils using different methods. Can. Geotech. J. 2015, 52, 382–384. [Google Scholar] [CrossRef]
- Liang, Y.; Yeh, T.C.J.; Wang, J.; Liu, M.; Zha, Y.; Hao, Y. An auto-adaptive moving mesh method for the numerical simulation of piping erosion. Comput. Geotech. 2017, 82, 237–248. [Google Scholar] [CrossRef]
- Marwan, A.; Zhou, M.M.; Abdelrehim, M.Z. Optimization of artificial ground freezing in tunneling in the presence of seepage flow. Comput. Geotech. 2016, 75, 112–125. [Google Scholar] [CrossRef]
- Guo, Q.G. The Engineering Properties and Application of Coarse Grained Soil; The Yellow River Water Conservancy Press: Zhengzhou, China, 1998; pp. 286–313. (In Chinese) [Google Scholar]
- Ge, C.; Zhang, R.T. Benxi steel NaFen dam dam foundation seepage deformation survey—On gravel seepage deformation of soil. Oil-Gasfield Surf. Eng. 2003, 22, 37–38. (In Chinese) [Google Scholar]
- Feng, S.R.; Zhao, H.B.; Jiang, Z.M.; Zeng, X.X. Experimental study on seepage failure characteristics of broken rock mass in dam foundation at left bank of Xiangjiaba Hydropower Project. Chin. J. Geotech. Eng. 2012, 34, 600–605. (In Chinese) [Google Scholar]
- British Standards Institution. Methods of Test for Soils for Civil Engineering Purposes—Part 1: General Requirements and Sample Preparation; BS1377-1 (1990) British Standard; British Standards Institution: London, UK, 1990. [Google Scholar]
- The Ministry of Water Resources of China. Standard for Soil Test Method; GB/T 50123-1999 (1999); China Planning Press: Beijing, China, 1999. (In Chinese) [Google Scholar]
- Donaghe, R.T.; Torrey, V.H. Proposed New Standard Test Method For Laboratory Compaction Testing of Soil-Rock Mixtures Using Standard Effort. Geotech. Test. J. 1994, 17, 387–392. [Google Scholar]
- Rücknagel, J.; Götze, P.; Hofmann, B.; Christen, O.; Marschall, K. The influence of soil gravel content on compaction behavior and pre-compression stress. Geoderma 2013, 209–210, 226–232. [Google Scholar] [CrossRef]
- Zhou, Z.; Fu, H.L.; Liu, B.C. Orthogonal tests on permeability of soil-rock mixture. Chin. J. Rock Mech. Eng. 2006, 28, 1132–1138. [Google Scholar]
- Mao, C.X. Discussion of Seepage control of earth dam on the sand-gravel foundation. J. Hydraul. Eng. 1963, 4, 66–69. (In Chinese) [Google Scholar]
- Cao, D.L. Cofferdam seepage control of Gezhouba Project. J. Hydraul. Eng. 1988, 19, 49–55. (In Chinese) [Google Scholar]
- Luo, Y.L.; Wu, Q.; Zhan, M.L.; Sheng, G.C. Development of Seepage-Erosion-Stress Coupling Piping Test Apparatus and Its Primary Application. Chin. J. Rock Mech. Eng. 2013, 32, 2108–2114. (In Chinese) [Google Scholar]
- Kenney, T.C.; Lau, D. Internal stability of granular filters. Can. Geotech. J. 1985, 22, 215–225. [Google Scholar] [CrossRef]
- Myers, R.H.; Montgomery, D.C. Response Surface Methodology: Process and Product Optimization Using Designed Experiments; John Wiley and Sons: Hoboken, NJ, USA, 2002. [Google Scholar]
- Box, G.E.P.; Wilson, K.B. On the Experimental Attainment of optimum Conditions. In Breakthroughs in Statistics; Springer: New York, NY, USA, 1992; pp. 270–310. [Google Scholar]
- KieferJ, W.J. Optimum designs in regression problems. Ann. Math. Stat. 1999, 30, 271–294. [Google Scholar] [CrossRef]
- Yu, W.; Varavei, A.; Sepehrnoori, K. Optimization of Shale Gas Production Using Design of Experiment and Response Surface Methodology. Eng. Sour. Part A Recovery Util. Environ. Eff. 2015, 37, 906–918. [Google Scholar] [CrossRef]
- Das, A.; Jayashree, C.; Viswanadham, B.V.S. Effect of randomly distributed geofibers on the piping behaviour of embankments constructed with fly ash as a fill material. Geotext. Geomembr. 2009, 27, 341–349. [Google Scholar] [CrossRef]
- Das, A.; Viswanadham, B.V.S. Experiments on the piping behaviour of geofiber-reinforced soil. Geosynth. Int. 2010, 17, 171–182. [Google Scholar] [CrossRef]
- Wang, Y.; Li, X.; Hu, R.; Ma, C.F.; Zhao, Z.Z.; Zhang, B. Numerical Evaluation and Optimization of Multiple Hydraulically Fractured Parameters Using a Flow-Stress-Damage Coupled Approach. Energies 2016, 9, 325. [Google Scholar] [CrossRef]
- Xu, W.J.; Wang, Y.G. Meso-structural permeability of S-RM based on numerical tests. China J. Rock Mech. Eng. 2010, 32, 543–550. [Google Scholar]
- Liao, Q.L. Geological Origin and Structure model of Rock and Soil Aggregate and Study on Its Mechanical and MH Coupled Properties. Ph.D. Thesis, Institute of Geology and Geophysics, Chinese Academy of Science, Beijing, China, 2004. (In Chinese). [Google Scholar]
- Midgley, T.L.; Fox, G.A.; Wilson, G.V.; Felice, R.M.; Heeren, D.M. In situ soil pipeflow experiments on contrasting streambank soils. Trans. ASABE 2013, 56, 479–488. [Google Scholar] [CrossRef]
- Tickell, F.G.; Hiatt, W.N. Effect of angularity of grains on porosity and permeability of unconsolidated sands. AAPG Bull. 1938, 22, 1272–1274. [Google Scholar]
Figure 1.
The characteristics of soil mtrix and rock blocks used for bimsoils in this study. (a) Grain size distribution using sieving method for the used soil matrix; (b–d) Gravel, pebble and round rock blocks used in bimsoil specimen preparation, size range from 2 to 5 mm according to BS1377-1 (1990).

Figure 2.
The relationships between the hammer count and soil density and the rock block percentage (a. Plot of the soil matrix density against hammer count for specimens with RBP of 30%, 50%, and 70%, respectively; b. Determination of the optimal hammer count for bimsoil specimens with different soil matrix density).
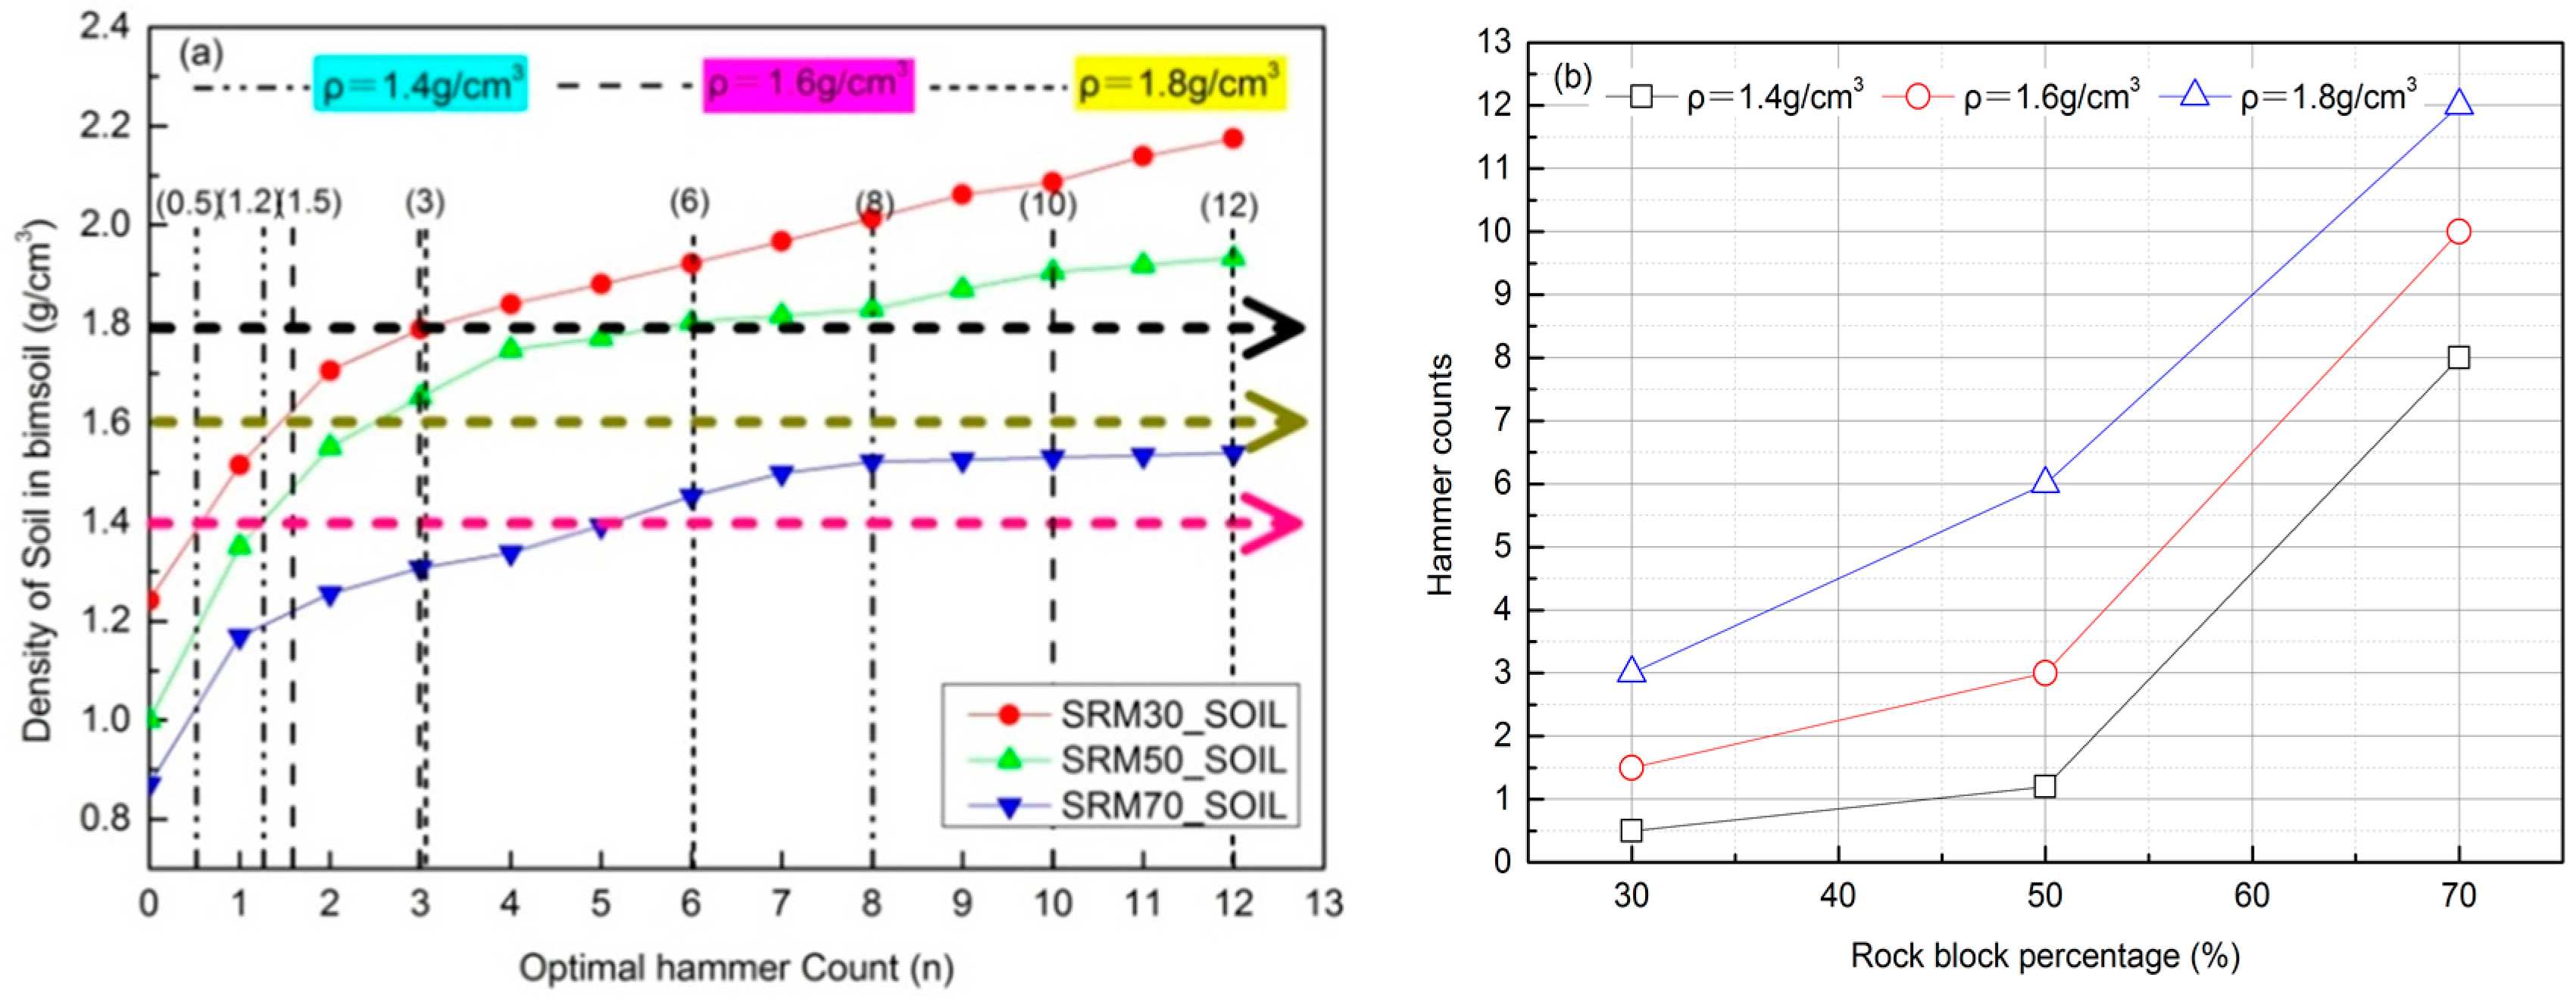
Figure 3.
Bimsoil specimens used in the piping erosion test. (a. Compact test is used to prepare the bimsoil specimens, and the specimen was compacted with three layers; b. Partial remolded bimsoil specimens for the piping erosion test).
Figure 3.
Bimsoil specimens used in the piping erosion test. (a. Compact test is used to prepare the bimsoil specimens, and the specimen was compacted with three layers; b. Partial remolded bimsoil specimens for the piping erosion test).
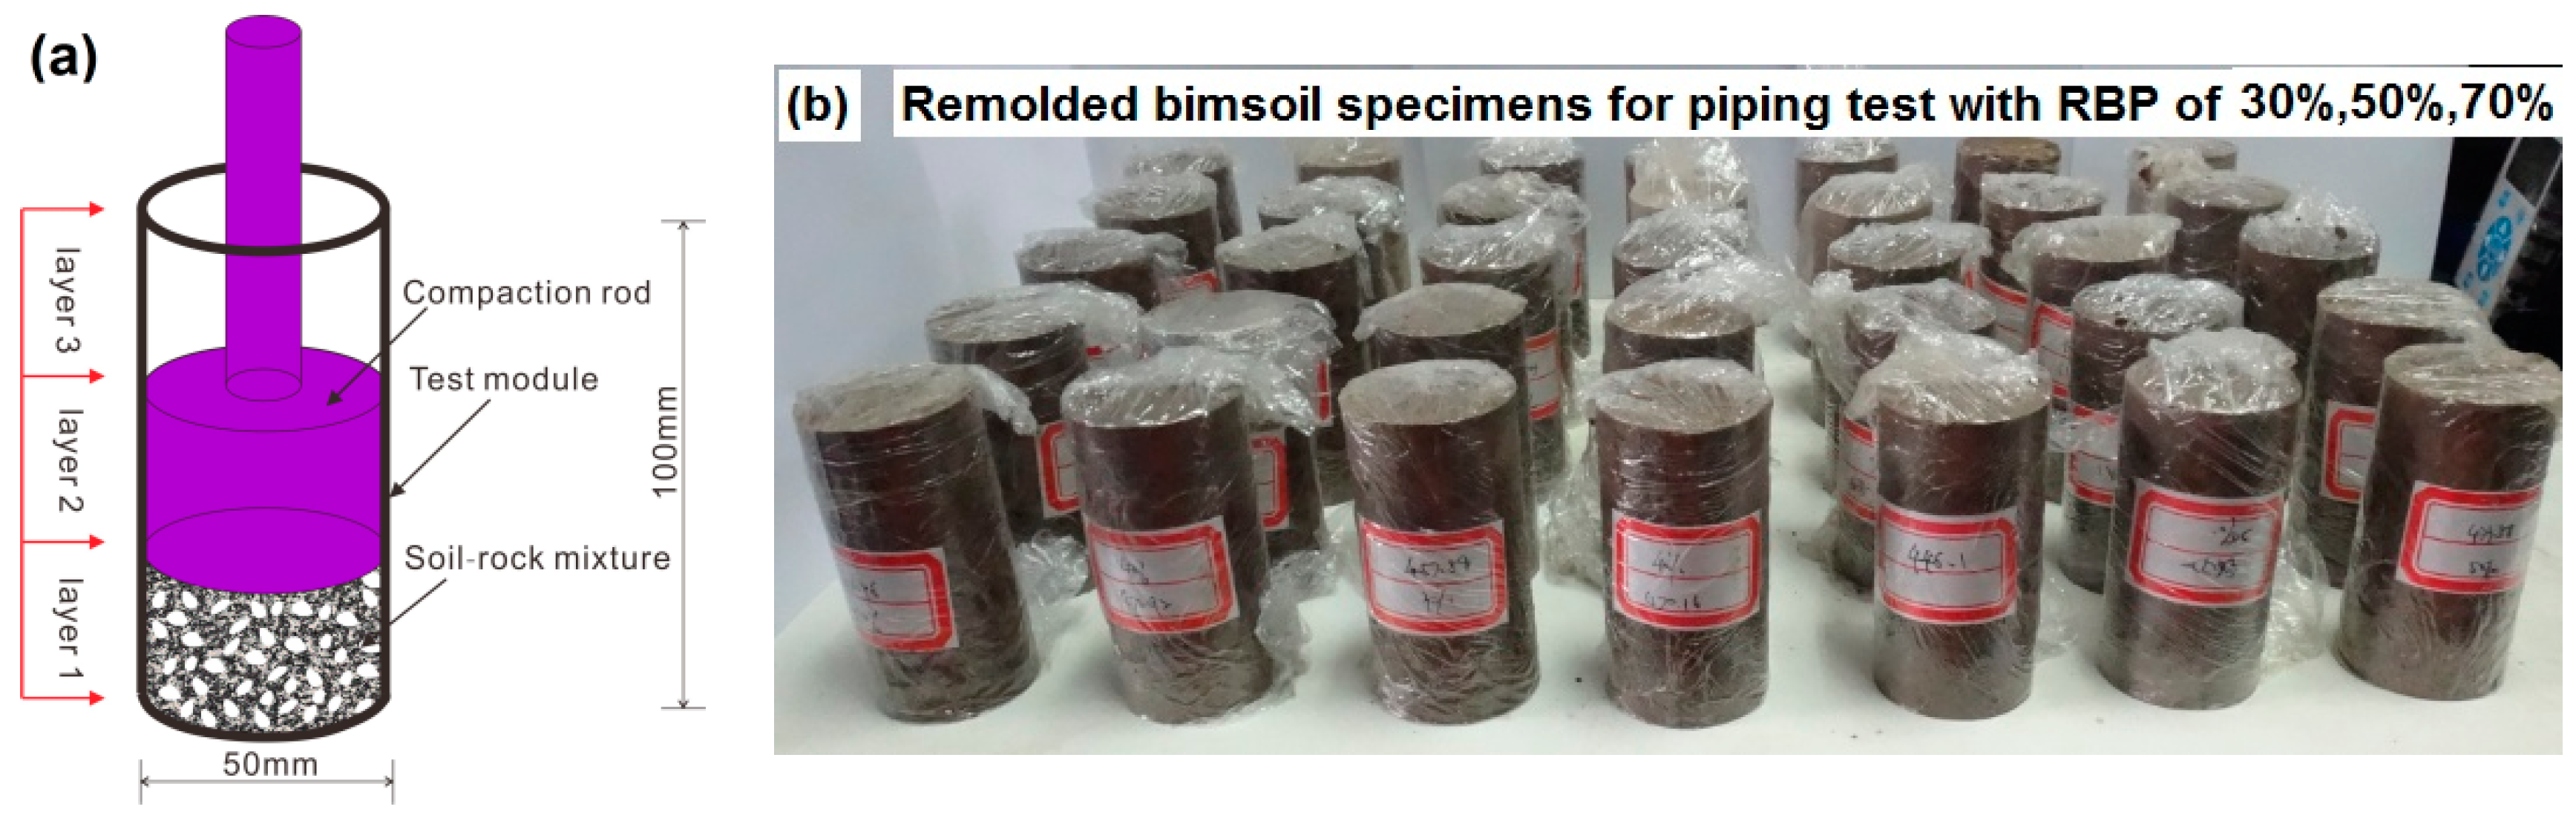
Figure 4.
Schematic diagram of the piping testing system, which is composed of the rigid specimen holder, the servo pressurized water-supply system, and the specimen chamber system [12]. (1. Upper cross beam; 2. Rigid column; 3. Platform; 4. Guide bar; 5. Lower cross beam; 6. Bimsoil specimen; 7. Self-adhesive tape; 8. Permeable cap; 9. Hose champ; 10. Filter paper; 11. Heat shrink tubing; 12. Seconds counter; 13. Water valve; 14. Force sensor; 15. Hydraulic jack; 16. Three-way valve; 17. Water tube; 18. Servo-injection water system; 19. Force sensorand; 20. Measuring cup).
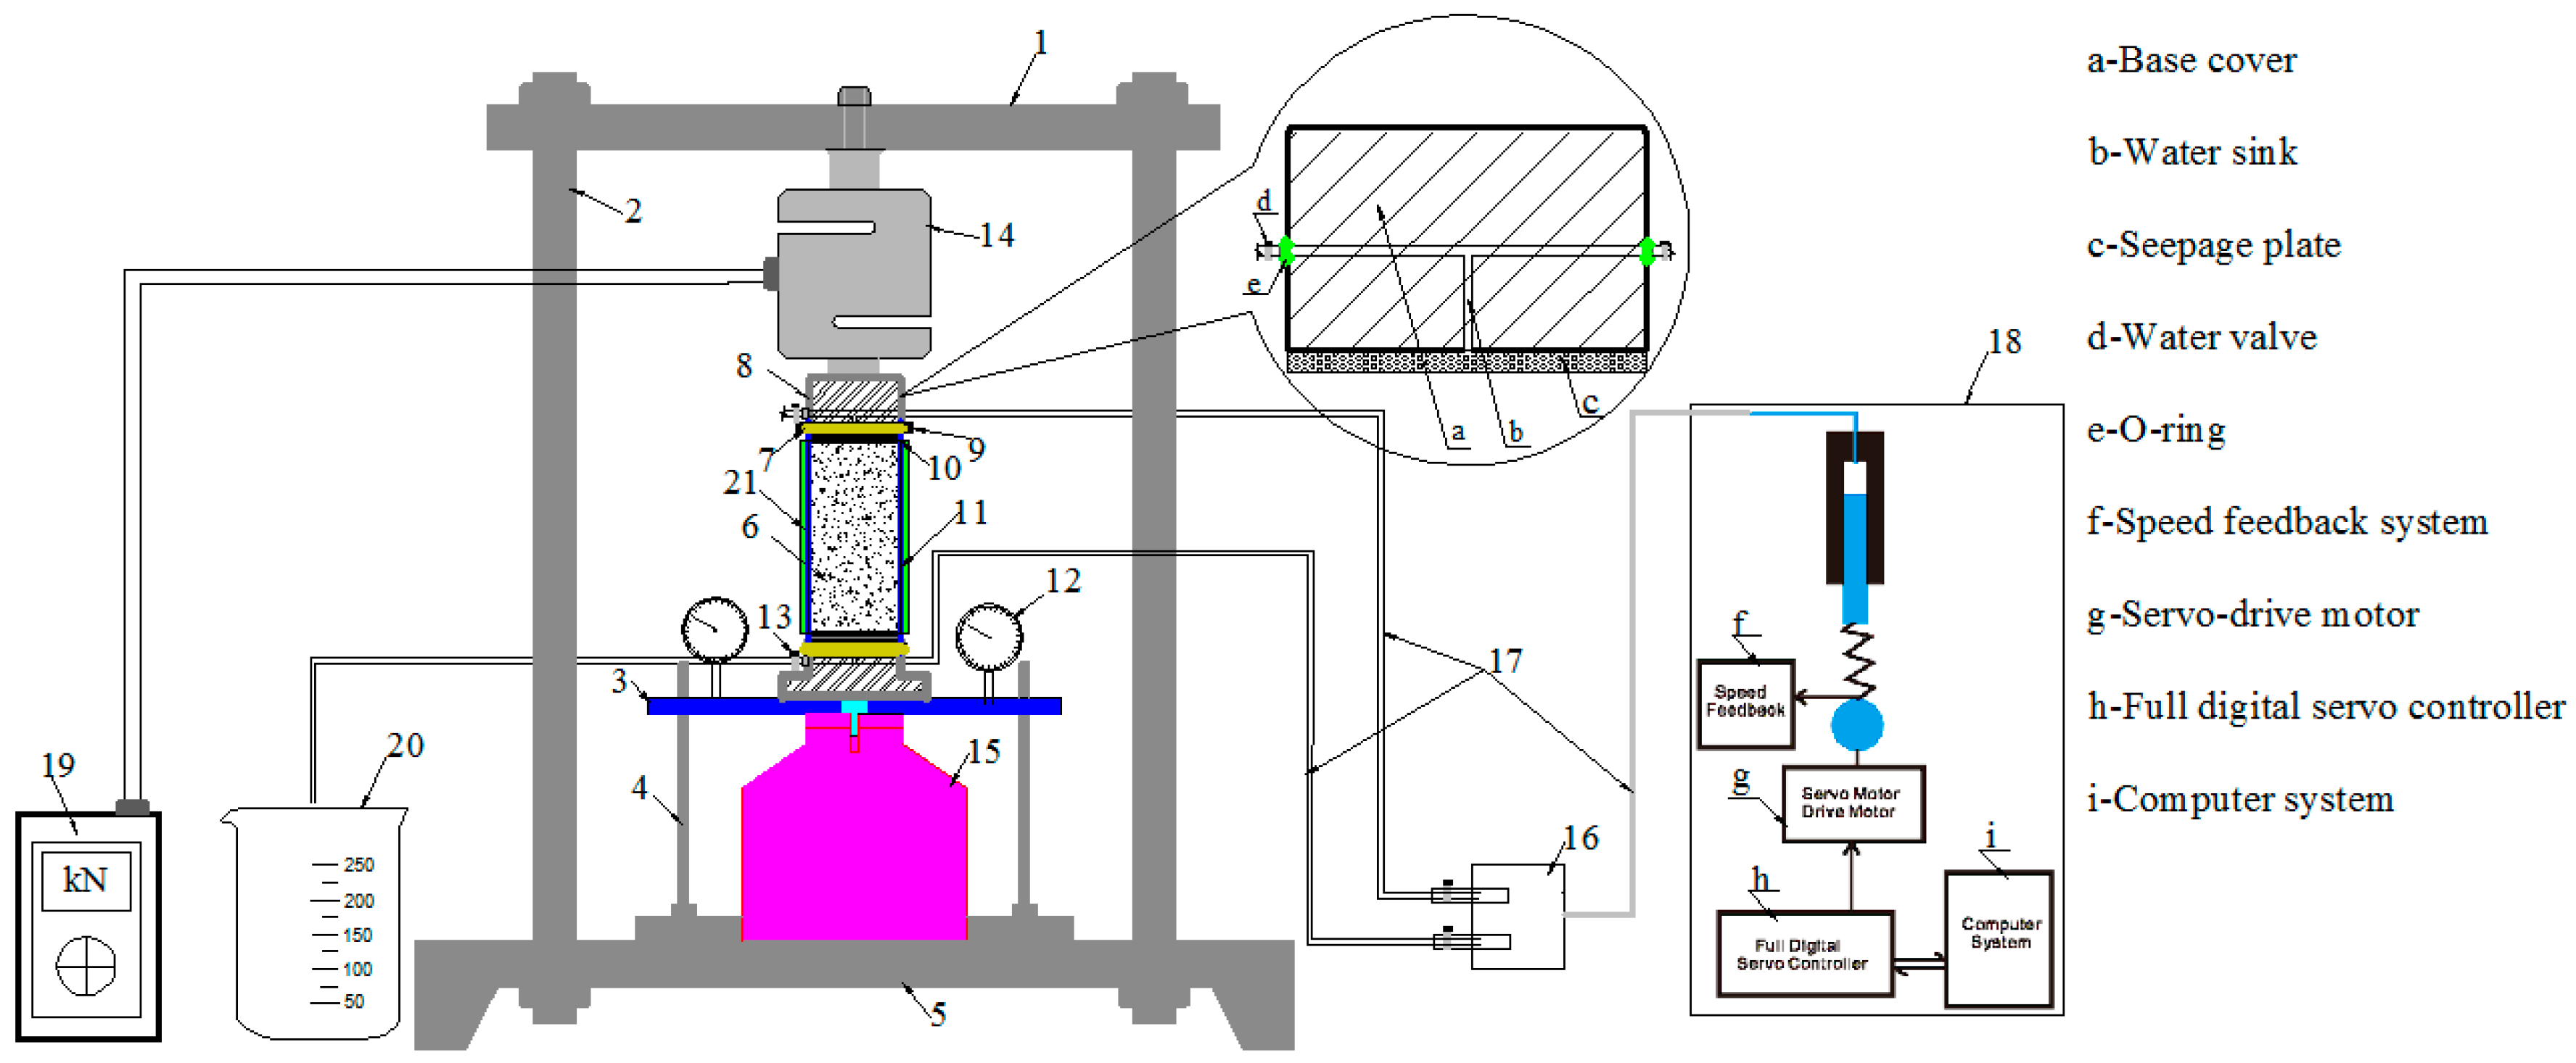
Figure 5.
Picture of the structure of seepage cap and specimen chamber (a. the lower cap; b. the upper cap; c. specimen chamber for bimsoil specimen, taking rock block percentage (RBP) of 30% for example).
Figure 5.
Picture of the structure of seepage cap and specimen chamber (a. the lower cap; b. the upper cap; c. specimen chamber for bimsoil specimen, taking rock block percentage (RBP) of 30% for example).

Figure 6.
Photograph of the confining pressure system, the main components includes: air pump, hoek cell, barometer, pneumatic connector, and pneumatic tube.
Figure 6.
Photograph of the confining pressure system, the main components includes: air pump, hoek cell, barometer, pneumatic connector, and pneumatic tube.

Figure 7.
The flow chart of the piping test for bimsoil specimens.
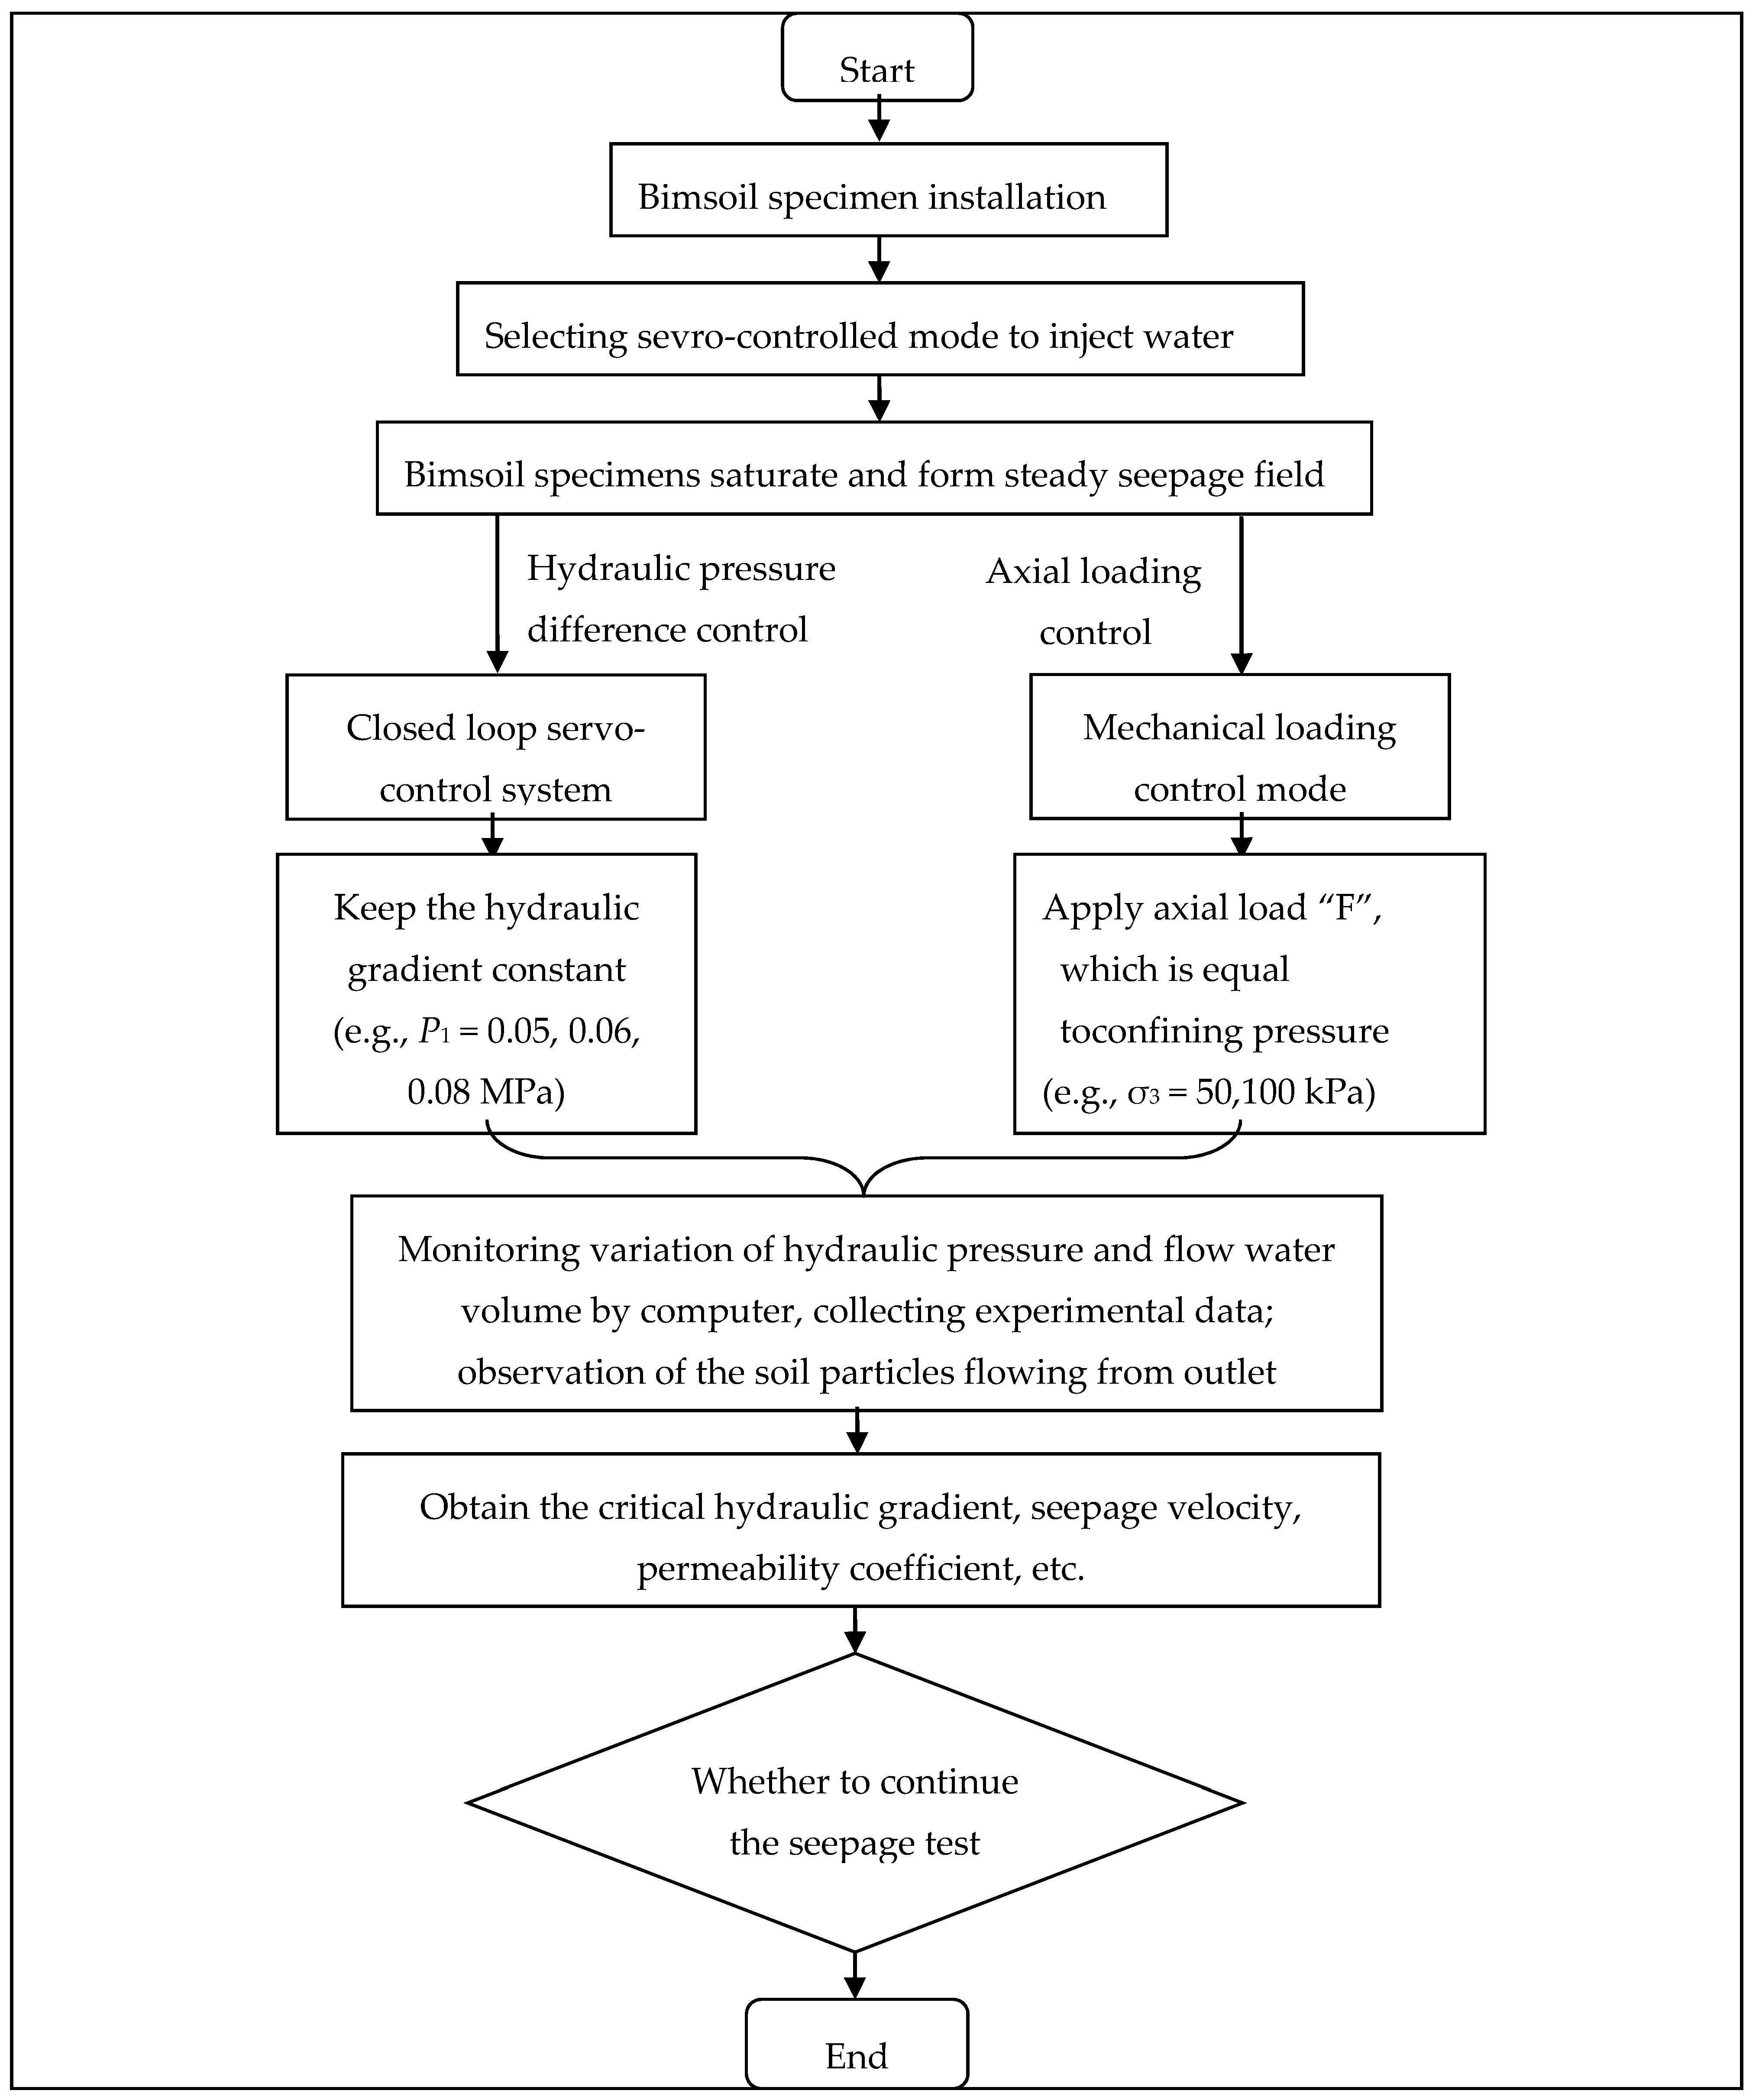
Figure 8.
The flow chart for the multiple parameters evaluation and optimization for piping in bimsoils.
Figure 8.
The flow chart for the multiple parameters evaluation and optimization for piping in bimsoils.

Figure 9.
Determination of critical hydraulic gradient for bimsoil specimen with RBP of 30% and 50% (a. specimen with rock block percentage (RBP) of 30%, corresponds to the case 10 in Table 4; b. specimen with RBP of 50% corresponds to the case 16 in Table 4.

Figure 10.
Normal plot of residuals for critical hydraulic gradient.
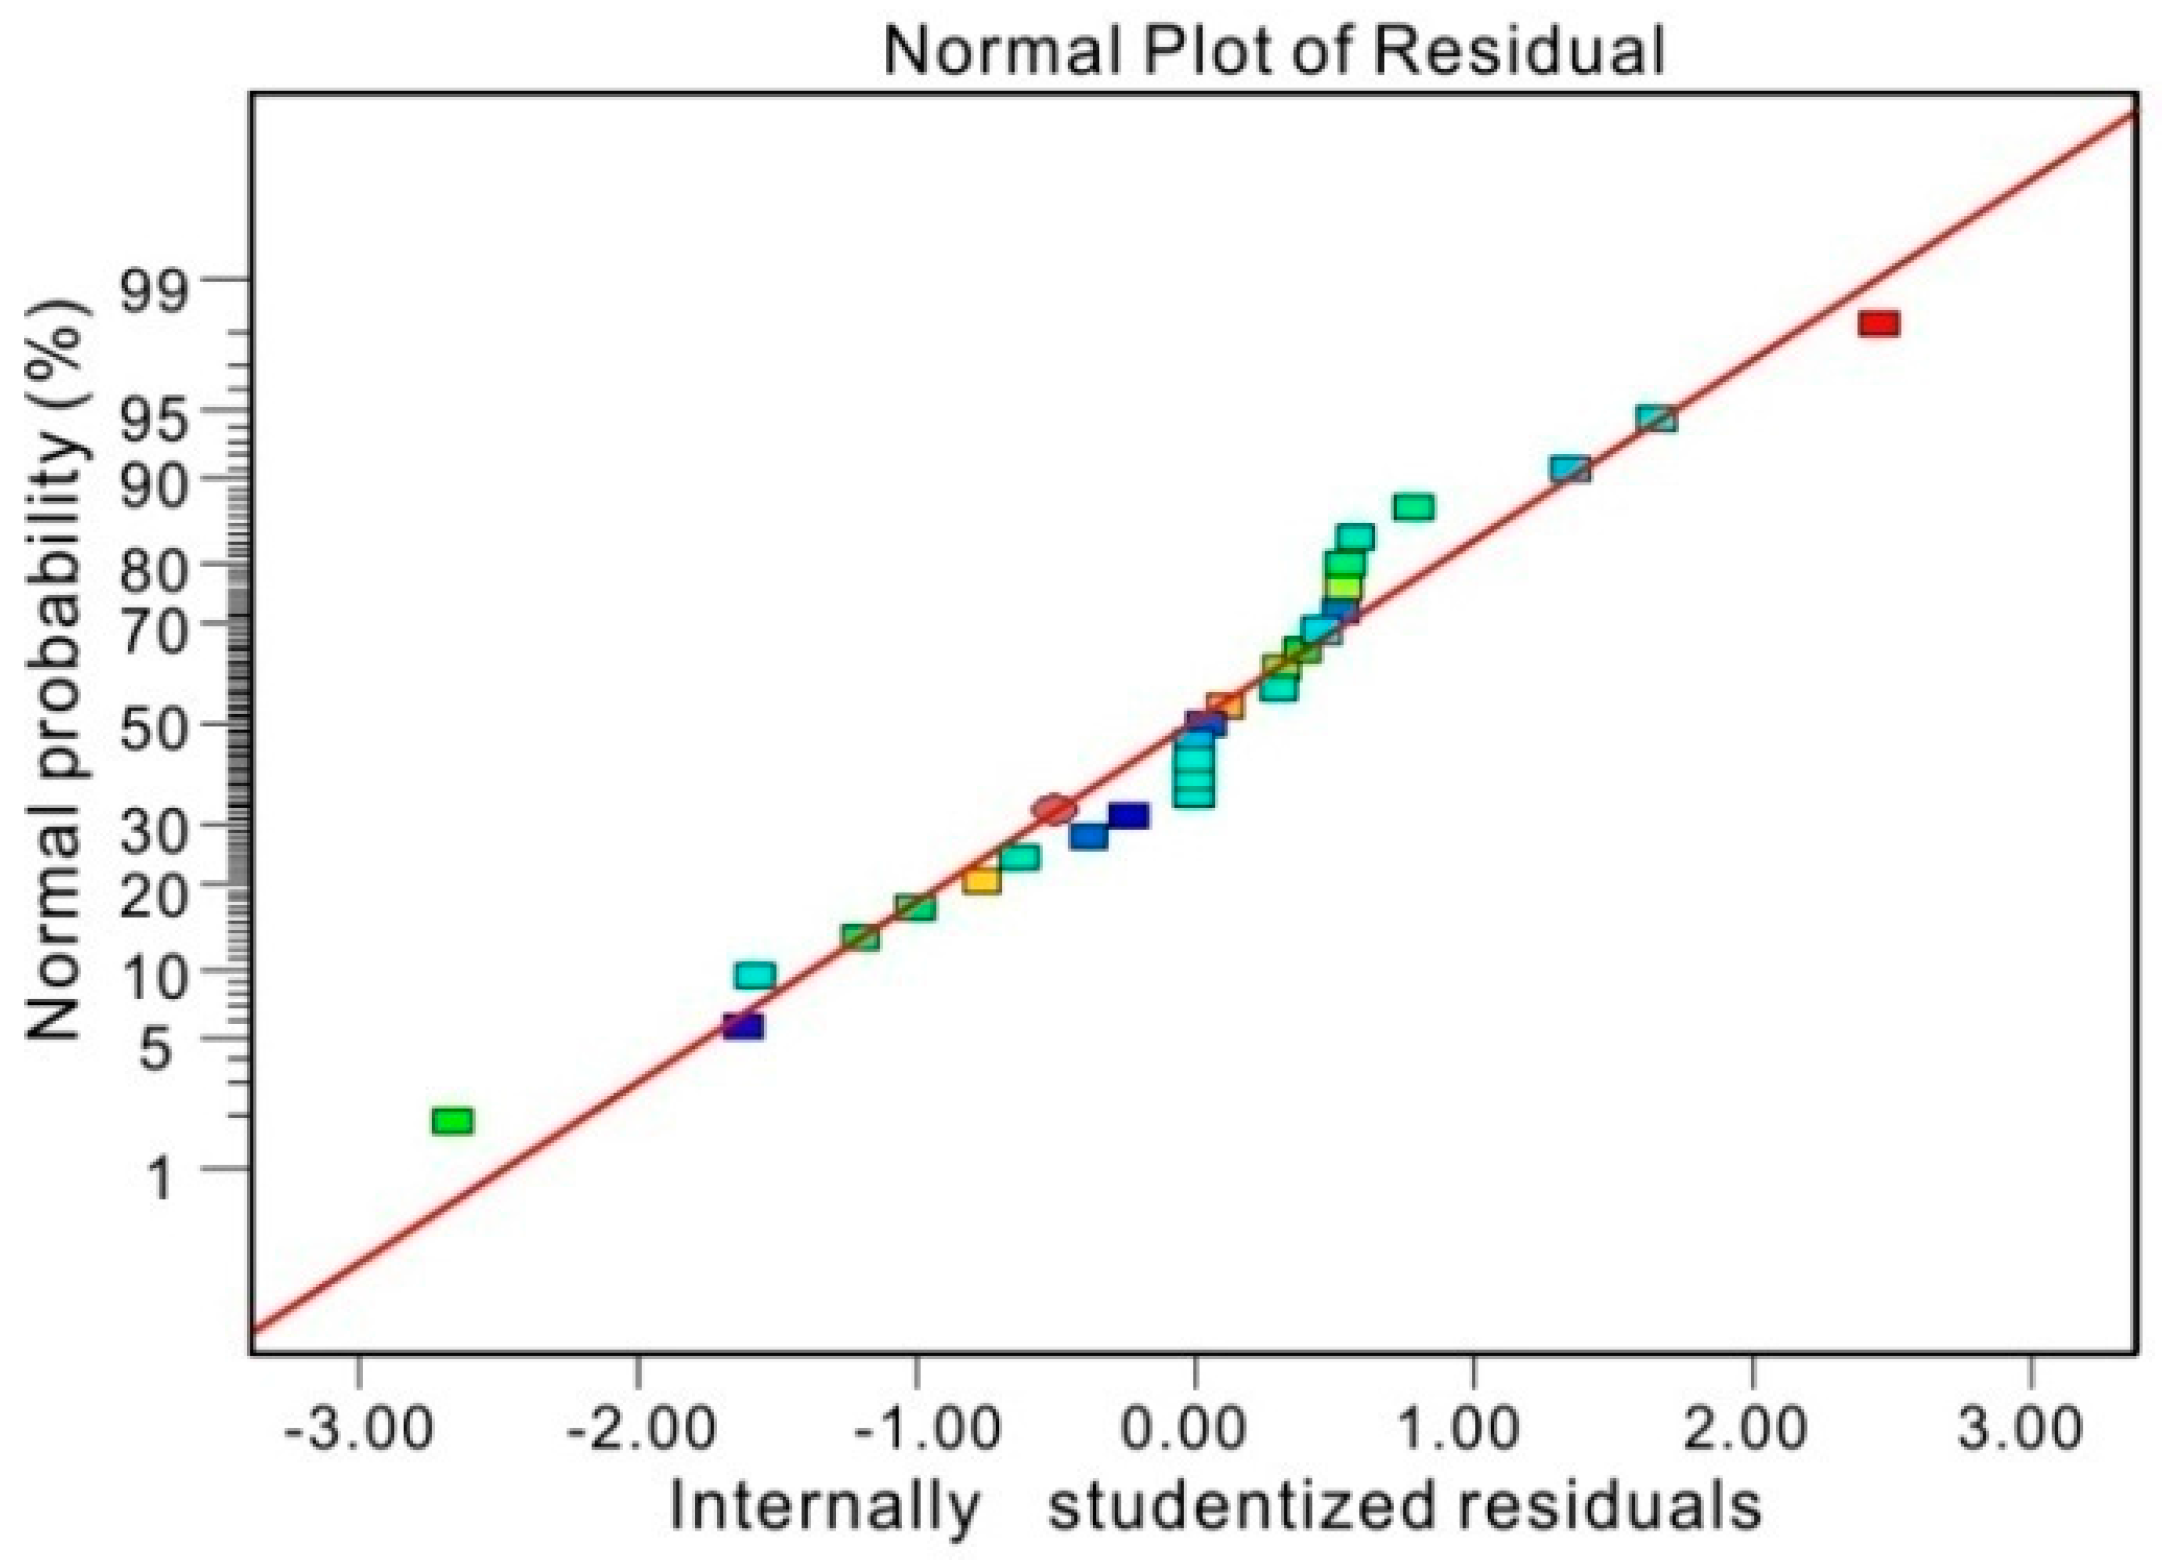
Figure 11.
Predicted value versus the actual values for response surface value.
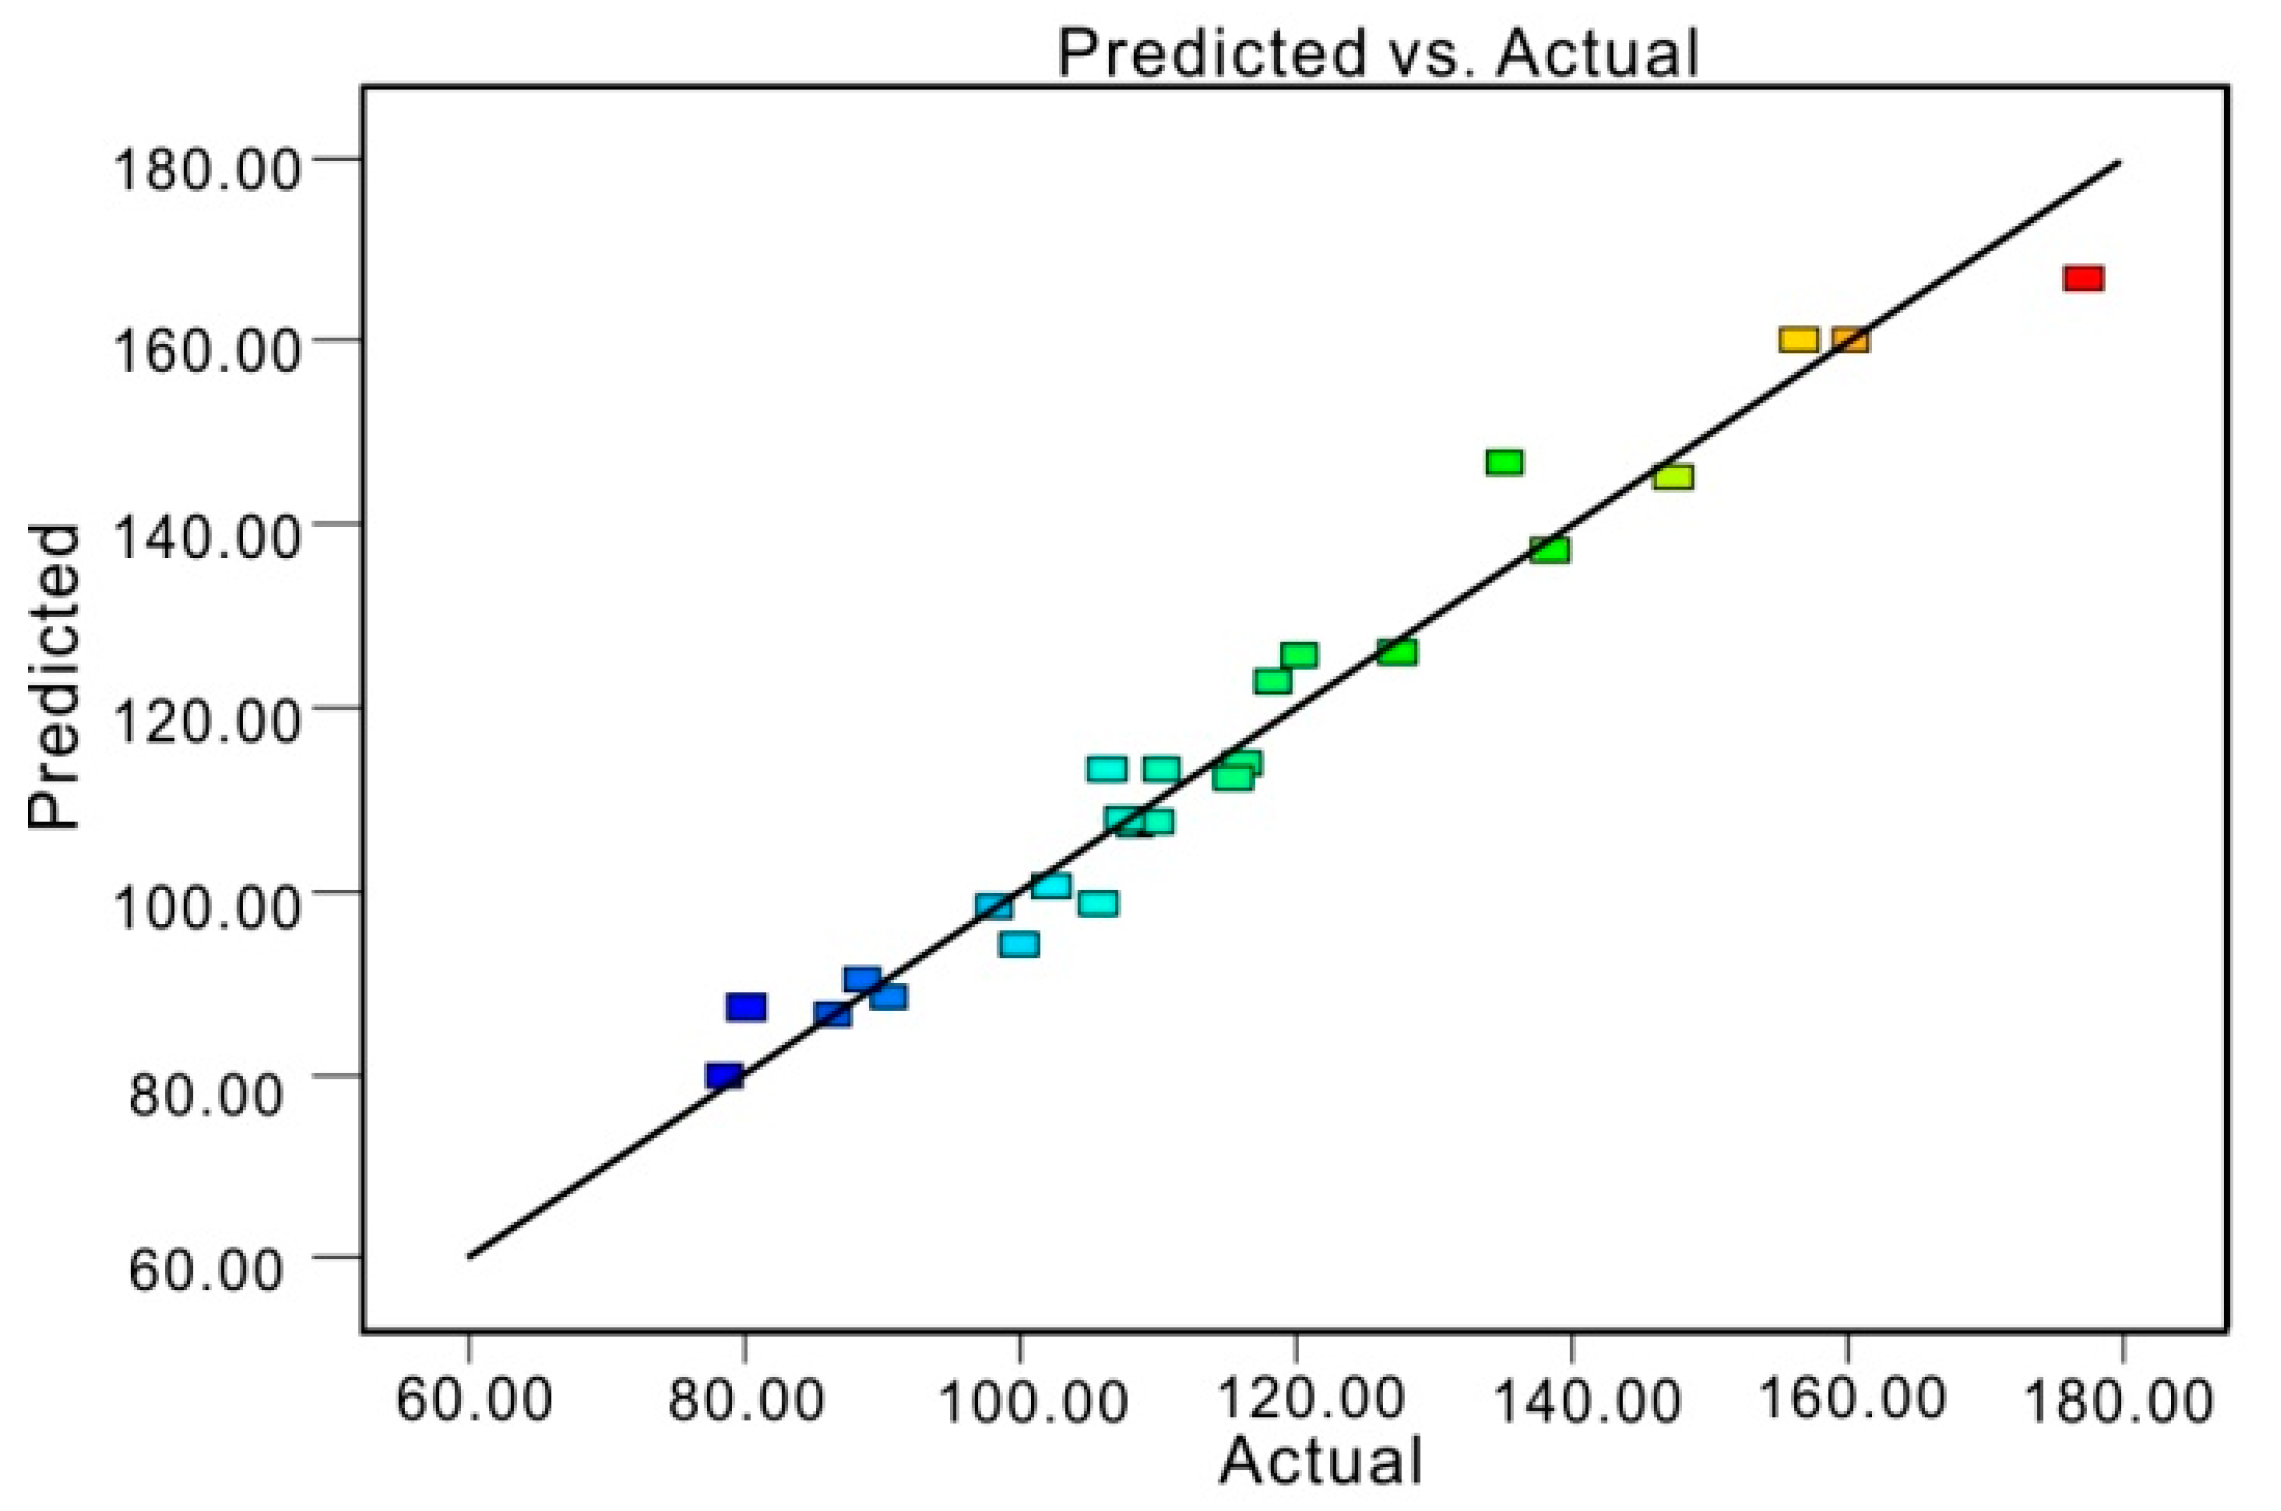
Figure 12.
The influential of four studied factors on critical hydraulic gradient response surface (a. influence of factor A and B on variation of the response surface; b. influence of factor B and C on variation of the response surface; c. influence of factor A and D on variation of the response surface; and, d. influence of factor C and D on variation of the response surface).

Figure 13.
Influences of the studied factors on the optimist solutons (a–d plots the effect of rock block percentage, soil density, confiniing pressure, and block morphology, respectively).
Figure 13.
Influences of the studied factors on the optimist solutons (a–d plots the effect of rock block percentage, soil density, confiniing pressure, and block morphology, respectively).

Table 1.
Basic physical and mechanical properties of the used soil matrix and rock blocks for bimsoil samples.
Table 1.
Basic physical and mechanical properties of the used soil matrix and rock blocks for bimsoil samples.
| Index | Soil Matrix | Rock Block |
|---|---|---|
| Bulk density (g/cm3) | 1.64 | 2.53 |
| Dryweight density (g/cm3) | 2.06 | / |
| Optimum water content (%) | 9.5 | / |
| Specific gravity (GS) | 2.73 | / |
| Effective particle size, D10 (mm) | 0.01 | / |
| Coefficient of uniformity, Cu | 4.2 | / |
| Coefficient of curvature, Cc | 1.32 | / |
| Liquid limit (%) | 64 | / |
| plastic limit (%) | 36 | / |
| plasticity index | 28 | / |
| liquidity index | 0.121 | / |
| Wet compressive strength (MPa) | 0.57 | 43.21 |
| Dry compressive strength (MPa) | 2.27 | 80.75 |
Note: for soil matrix, the wet state corresponds to natural state, and for rock block, the wet state corresponds to saturation state.
Table 2.
The morphological feature of three kinds of rock blocks.
| Rock Block | Outline Indices | Angularity Indices (Gradient Method) | ||||
|---|---|---|---|---|---|---|
| Flakiness | Elongation | Sphericity | Shape Factor | Angularity | Convexity Ratio | |
| Gravel | 0.934 | 1.353 | 0.834 | 0.933 | 0.925 | 0.895 |
| Pebble | 0.745 | 1.418 | 0.923 | 0.823 | 0.977 | 0.934 |
| Round ball | 1.0 | 1.0 | 1.0 | 1.0 | 1.0 | 1.0 |
Table 3.
The considered factors and levels for the response surface method (RSM) model.
| Influential Factors | Coded Symbol | Levels | ||
|---|---|---|---|---|
| (−1) | (0) | (+1) | ||
| Rock block percentage (%) | A | 30 | 50 | 70 |
| Soil matrix density (g/cm3) | B | 1.4 | 1.6 | 1.8 |
| Confining pressure (kPa) | C | 0 | 100 | 200 |
| Block morphology (/) | D | 0 | 1 | 2 |
Note: For factor of block morphology, level “0” refers to round ball; level “1” refers to pebble; level 2 refers to “gavel”.
Table 4.
Box-Behnken design table for piping erosion test.
| Run | A-RBP (%) | B-SMD (g/cm3) | C-CP (kPa) | D-BM (/) | R2 |
|---|---|---|---|---|---|
| 1 | 70 | 1.6 | 100 | 0 | 88.67 |
| 2 | 50 | 1.8 | 200 | 1 | 120.32 |
| 3 | 50 | 1.6 | 200 | 0 | 127.45 |
| 4 | 70 | 1.4 | 100 | 1 | 80.24 |
| 5 | 30 | 1.6 | 0 | 1 | 135.2 |
| 6 | 50 | 1.4 | 100 | 0 | 109.87 |
| 7 | 30 | 1.4 | 100 | 1 | 138.56 |
| 8 | 30 | 1.8 | 100 | 1 | 177.23 |
| 9 | 50 | 1.4 | 100 | 2 | 98.23 |
| 10 | 50 | 1.6 | 100 | 1 | 107.73 |
| 11 | 50 | 1.8 | 0 | 1 | 115.57 |
| 12 | 70 | 1.6 | 200 | 1 | 105.78 |
| 13 | 50 | 1.8 | 100 | 2 | 106.44 |
| 14 | 70 | 1.6 | 100 | 2 | 86.51 |
| 15 | 30 | 1.6 | 100 | 0 | 160.32 |
| 16 | 50 | 1.8 | 100 | 0 | 118.45 |
| 17 | 70 | 1.8 | 100 | 1 | 90.53 |
| 18 | 30 | 1.6 | 200 | 1 | 156.64 |
| 19 | 30 | 1.6 | 100 | 2 | 147.45 |
| 20 | 50 | 1.6 | 0 | 0 | 108.45 |
| 21 | 50 | 1.6 | 100 | 1 | 107.73 |
| 22 | 50 | 1.4 | 0 | 1 | 100.03 |
| 23 | 50 | 1.6 | 0 | 2 | 102.33 |
| 24 | 50 | 1.4 | 200 | 1 | 110.32 |
| 25 | 70 | 1.6 | 0 | 1 | 78.65 |
| 26 | 50 | 1.6 | 100 | 1 | 107.73 |
| 27 | 50 | 1.6 | 200 | 2 | 116.23 |
Table 5.
Statistical approach to select the RSM model for critical hydraulic gradient.
| Source | Std.Dev. | R-Squared | AdjustedR-Squared | PredictedR-Squared | Press | Suggestion |
|---|---|---|---|---|---|---|
| Linear | 8.24 | 0.90 | 0.89 | 0.80 | 2280.37 | - |
| 2FI | 8.81 | 0.92 | 0.87 | 0.75 | 3811.78 | - |
| Quadratic | 6.69 | 0.97 | 0.93 | 0.85 | 3093.21 | Suggested |
| Cubic | 4.02 | 0.99 | 0.97 | 0.40 | 9275.11 | Aliased |
Table 6.
Anova for SRM response surface with quadratic model.
| Source | Sum of Squares | df | Mean Square | F Value | p-Value Prob > F | Significience |
|---|---|---|---|---|---|---|
| Model | 15,043.44 | 14 | 1074.53 | 24.01 | <0.0001 | significant |
| A-rock block percentage | 12,353.37 | 1 | 12,353.37 | 276.04 | <0.0001 | - |
| B-soil matrix density | 694.48 | 1 | 694.48 | 15.52 | 0.0020 | - |
| C-confining pressure | 776.18 | 1 | 776.18 | 17.34 | 0.0013 | - |
| D-block morphology | 261.52 | 1 | 261.52 | 5.84 | 0.033 | - |
| AB | 201.35 | 1 | 201.35 | 4.49 | 0.056 | - |
| AC | 8.09 | 1 | 8.09 | 0.18 | 0.68 | - |
| AD | 28.67 | 1 | 28.67 | 0.64 | 0.44 | - |
| BC | 7.67 | 1 | 7.67 | 0.17 | 0.046 | - |
| BD | 0.03 | 1 | 0.03 | 0.00071 | 0.97 | - |
| CD | 6.50 | 1 | 6.50 | 0.15 | 0.70 | - |
| A^2 | 650.77 | 1 | 650.77 | 14.54 | 0.0025 | - |
| B^2 | 5.85 | 1 | 5.85 | 0.13 | 0.72 | - |
| C^2 | 31.88 | 1 | 31.88 | 0.71 | 0.42 | - |
| D^2 | 14.06 | 1 | 14.06 | 0.31 | 0.59 | - |
| Residual | 537.01 | 12 | 44.75 | - | - | - |
| Lack of Fit | 537.01 | 10 | 53.70 | - | - | - |
| Pure Error | 0 | 2 | 0 | - | - | - |
| Cor Total | 15,580.46 | 26 | - | - | - | - |
Table 7.
The optimal solutions for the maximum of critical hydraulic gradient (CHG).
| Number | RBP (%) | D (g/cm3) | CP (kPa) | M (/) | CHG | Desirability |
|---|---|---|---|---|---|---|
| 1 | 30.07 | 1.79 | 186.47 | 0.31 | 178.452 | 1 |
| 2 | 31.54 | 1.79 | 191.94 | 0.09 | 177.466 | 1 |
| 3 | 30.4 | 1.78 | 188.79 | 0.02 | 180.391 | 1 |
| 4 | 30.62 | 1.8 | 178.46 | 0.22 | 177.775 | 1 |
| 5 | 30.43 | 1.8 | 154.62 | 0.03 | 177.951 | 1 |
| 6 | 30.2 | 1.79 | 197.9 | 0.34 | 178.88 | 1 |
| 7 | 30.94 | 1.77 | 194.37 | 0.02 | 178.524 | 1 |
| 8 | 30.01 | 1.8 | 148.35 | 0.05 | 178.51 | 1 |
| 9 | 30.04 | 1.78 | 155.65 | 0 | 178.294 | 1 |
| 10 | 30.17 | 1.77 | 164.14 | 0.05 | 177.474 | 1 |
| 11 | 30.4 | 1.78 | 196.52 | 0.05 | 180.62 | 1 |
| 12 | 30.49 | 1.8 | 145.79 | 0 | 177.525 | 1 |
| 13 | 30.09 | 1.79 | 199.95 | 0.56 | 177.354 | 1 |
| 14 | 30.8 | 1.8 | 155.8 | 0.01 | 177.384 | 1 |
| 15 | 30.03 | 1.79 | 173.65 | 0.28 | 177.706 | 1 |
| 16 | 30.15 | 1.8 | 183.66 | 0.31 | 178.752 | 1 |
| 17 | 30.04 | 1.73 | 186.88 | 0 | 177.402 | 1 |
| 18 | 30.1 | 1.79 | 148.41 | 0.02 | 177.683 | 1 |
| 19 | 30.52 | 1.8 | 169.68 | 0.2 | 177.46 | 1 |
| 20 | 30.04 | 1.8 | 197.27 | 0.5 | 178.454 | 1 |
© 2017 by the authors. Licensee MDPI, Basel, Switzerland. This article is an open access article distributed under the terms and conditions of the Creative Commons Attribution (CC BY) license (http://creativecommons.org/licenses/by/4.0/).
Share and Cite
MDPI and ACS Style
Wang, Y.; Li, C.; Hu, Y.; Xiao, Y. Optimization of Multiple Seepage Piping Parameters to Maximize the Critical Hydraulic Gradient in Bimsoils. Water 2017, 9, 787. https://doi.org/10.3390/w9100787
AMA Style
Wang Y, Li C, Hu Y, Xiao Y. Optimization of Multiple Seepage Piping Parameters to Maximize the Critical Hydraulic Gradient in Bimsoils. Water. 2017; 9(10):787. https://doi.org/10.3390/w9100787
Chicago/Turabian StyleWang, Yu, Changhong Li, Yanzhi Hu, and Yonggang Xiao. 2017. "Optimization of Multiple Seepage Piping Parameters to Maximize the Critical Hydraulic Gradient in Bimsoils" Water 9, no. 10: 787. https://doi.org/10.3390/w9100787
Note that from the first issue of 2016, this journal uses article numbers instead of page numbers. See further details here.