Water and Land Footprints and Economic Productivity as Factors in Local Crop Choice: The Case of Silk in Malawi


1
Twente Water Centre, University of Twente, P.O. Box 217, 7500 AE Enschede, The Netherlands
2
Institute of Water Policy, Lee Kuan Yew School of Public Policy, National University of Singapore, Singapore 259770, Singapore
*
Author to whom correspondence should be addressed.
Water 2017, 9(10), 802; https://doi.org/10.3390/w9100802
Submission received: 31 August 2017
/
Revised: 28 September 2017
/
Accepted: 10 October 2017
/
Published: 18 October 2017
(This article belongs to the Special Issue Progress in Water Footprint Assessment)
Abstract
:In deciding what crops to grow, farmers will look at, among other things, the economically most productive use of the water and land resources that they have access to. However, optimizing water and land use at the farm level may result in total water and land footprints at the catchment level that are in conflict with sustainable resource use. This study explores how data on water and land footprints, and on economic water and land productivity can inform micro-level decision making of crop choice, in the macro-level context of sustainable resource use. For a proposed sericulture project in Malawi, we calculated water and land footprints of silk along its production chain, and economic water and land productivities. We compared these to current cropping practices, and addressed the implications of water consumption at the catchment scale. We found that farmers may prefer irrigated silk production over currently grown rain-fed staple crops, because its economic water and land productivity is higher than that for currently grown crops. However, because the water footprint of irrigated silk is higher, sericulture will increase the pressure on local water resources. Since water consumption in the catchment generally does not exceed the maximum sustainable footprint, sericulture is a viable alternative crop for farmers in the case study area, as long as silk production remains small-scale (~3% of the area at most) and does not depress local food markets.
1. Introduction
Suppose you are a farmer in Malawi. What crops would you grow, and on what factors would you base that decision? You would probably consider the availability, quality and cost of seeds, labour, land, water, fertilizers and technology, the access to markets, available capital to invest, insurance, and what alternative options you have to feed your family if crops fail. Now, you are aware that pressures on water and land resources are increasing—due to climate change, growing populations and more demanding lifestyles—and you want to find out how your operations affect overall questions of sustainability, efficient resource use, and equity. How can you make sure you maximize your farming operations’ profitability, while at the same time minimizing harmful impacts on both others in your area and on the next generation? After all, they will also need the natural resources to support their livelihoods.
This stream-of-thought sketches the tension between micro-level decision making in agriculture and its macro-level effects. Much research has been done to identify factors that influence local crop choice [1,2,3,4,5,6,7]. In the current study, we focus on water and land availability and consider indicators such as water and land footprints and economic water and land productivity [8,9,10,11]. Water footprints (WF) and land footprints (LF) of crop production represent the volume of water (m3) and area of land (m2) that are appropriated to produce a crop (kg) [12]. Footprints inform the farmer how much water and land the intended crop requires in absolute terms, or, if compared to a benchmark footprint for that crop, in relative terms [13,14]. Economic water productivity (EWP, in € m−3) and economic land productivity (ELP, in € m−2) address economic considerations, by showing how much money each cubic meter of water or square meter of land generates.
Whereas micro-level questions focus on efficiency and productivity, macro-level questions are concerned with the sustainability and equity of resource use at the higher system level, such as the catchment, biome or even global level [15]. Total footprints at the system level result from the pressures placed on the system by all individual water and land using activities combined. Studies concerned with macro-level questions typically try to quantify total pressure limits of the system, also termed assimilation capacity, operation space or boundaries [15,16,17]. Exceeding these lead to undesirable consequences. Defining maximum sustainable footprints is one way to quantify such macro-level limits to resource use [13,18]. If farmers are only guided by micro-level factors—such as local water and land footprints, or economic and land productivities of their intended crops—then maximum sustainable system footprints may eventually be violated at the macro-level. On the other hand, total footprint limits at the system level only become practical if they can be translated to implications at the local level.
The aim of this study is therefore to explore how data on water and land footprints and economic water and land productivity can inform micro-level decision making on crop choice, in the context of macro-level sustainability of resource use, for a case study of proposed silk production in Mzimba District in Malawi. Malawi is economically poor, but relatively rich in arable land and water resources. It has a large untapped potential for irrigation expansion [19]. Nevertheless, agricultural output is low and about a quarter of the population is unable to secure its minimum daily recommended food intake, despite enough food being produced at the national level [20]. The Malawian government therefore wants to diversify the current low-value, staple-crop-only agricultural portfolio, in order to boost overall productivity and possibly increase exports. Introducing sericulture can help achieve the desired diversification, while holding the promise of providing better livelihoods to rural families. Cultivating silk is labour intensive, requires low skill levels, and silk has had and is expected to have a steady global market for years to come [21]. However, sericulture has implications for land and water resource use, both locally for the farmers’ operations and for the wider catchment. In this study, we explore the local implications of silk production based on water and land productivity, and we place water footprints in the context of catchment-level water availability. We conclude with a discussion of whether farmers should appropriate local water and land resources to sericulture based on these factors.
2. Method and Data
2.1. The Production Chain of Raw Silk
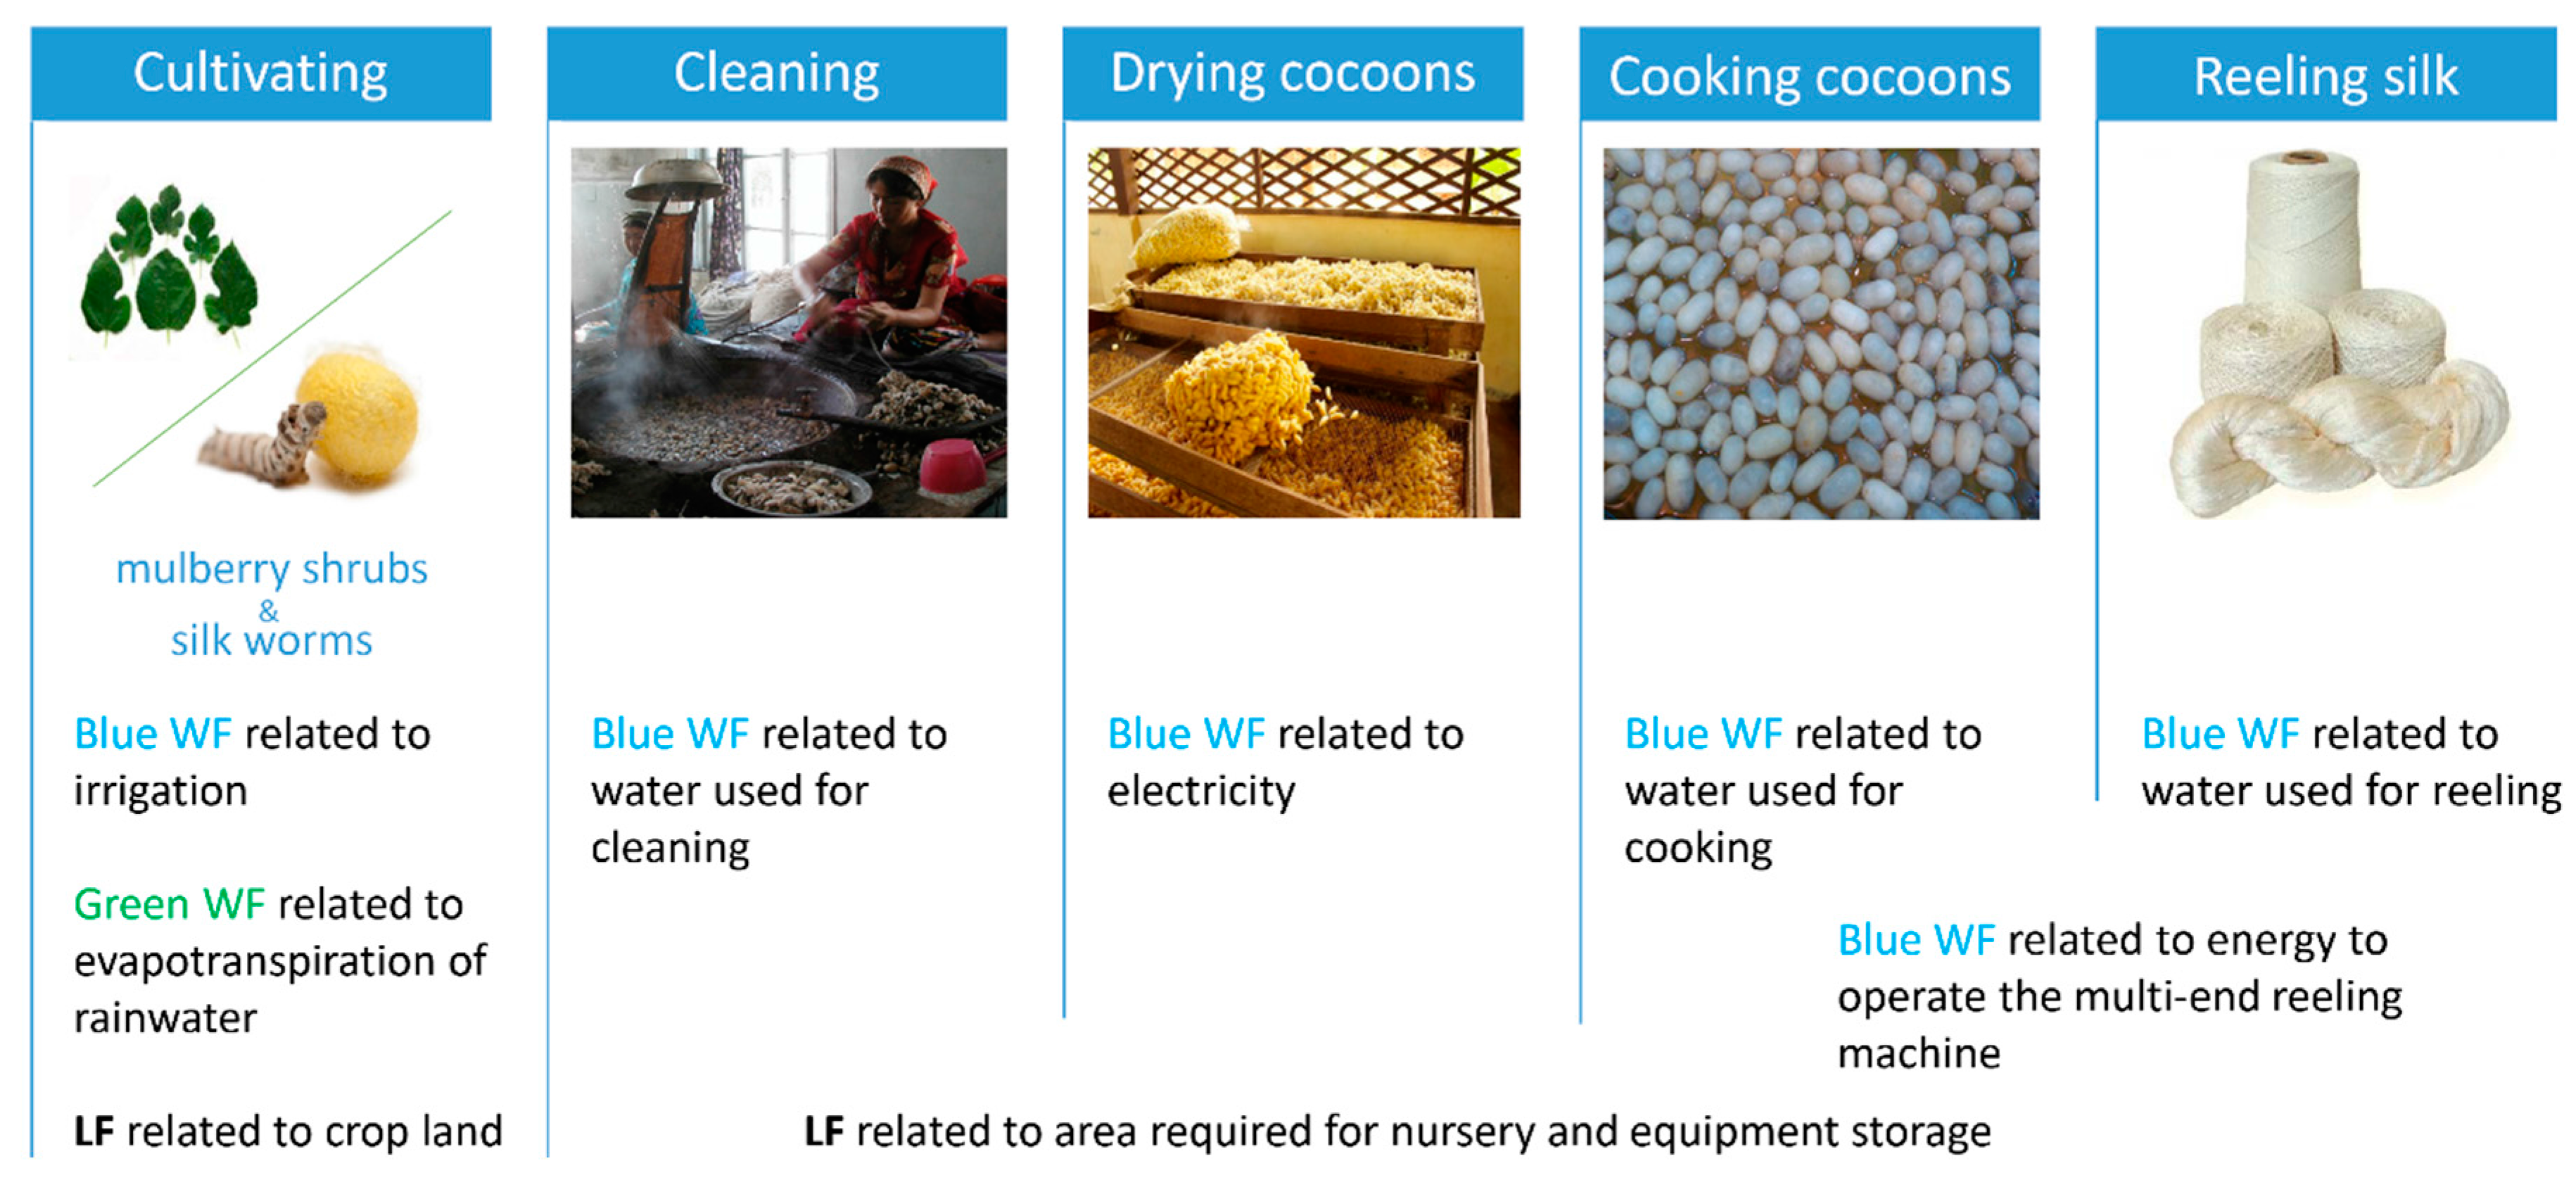
The production chain of raw silk has several steps, each of which may have a water or land footprint associated with it. The total water or land footprint of raw silk is the sum of the respective footprints in each step [12]. The first step of silk production is the cultivation of mulberry shrubs for their leaves and the rearing of silkworms (Bombyx mori). The leaves serve as feed for the silkworms, which are raised on rearing beds in special nurseries. When the worms reach maturity, they form cocoons, which, once pupation is about to complete, are harvested. After each harvest (4–7 per year), the nurseries have to be thoroughly cleaned to prevent the spread of diseases and promote general hygiene before a new batch of worms is reared [2]. The harvested cocoons are stifled to kill the pupae inside without disturbing the structure of the silk shell. This is usually done by means of hot air-conditioning, which is why the process is referred to as drying. After drying, the cocoons are heated in boiling water in order to soften the gummy protein sericin to a point where unravelling of the silk filament is possible. The dry raw silk is then reeled onto bobbins and is ready for further processing, dyeing or direct sale. The processes that require water and land are shown in Figure 1. In the case of water use, we distinguish between the green WF, representing the consumptive use of rainwater, and the blue WF, referring to the consumptive use of surface or groundwater [12].
2.2. Study Area
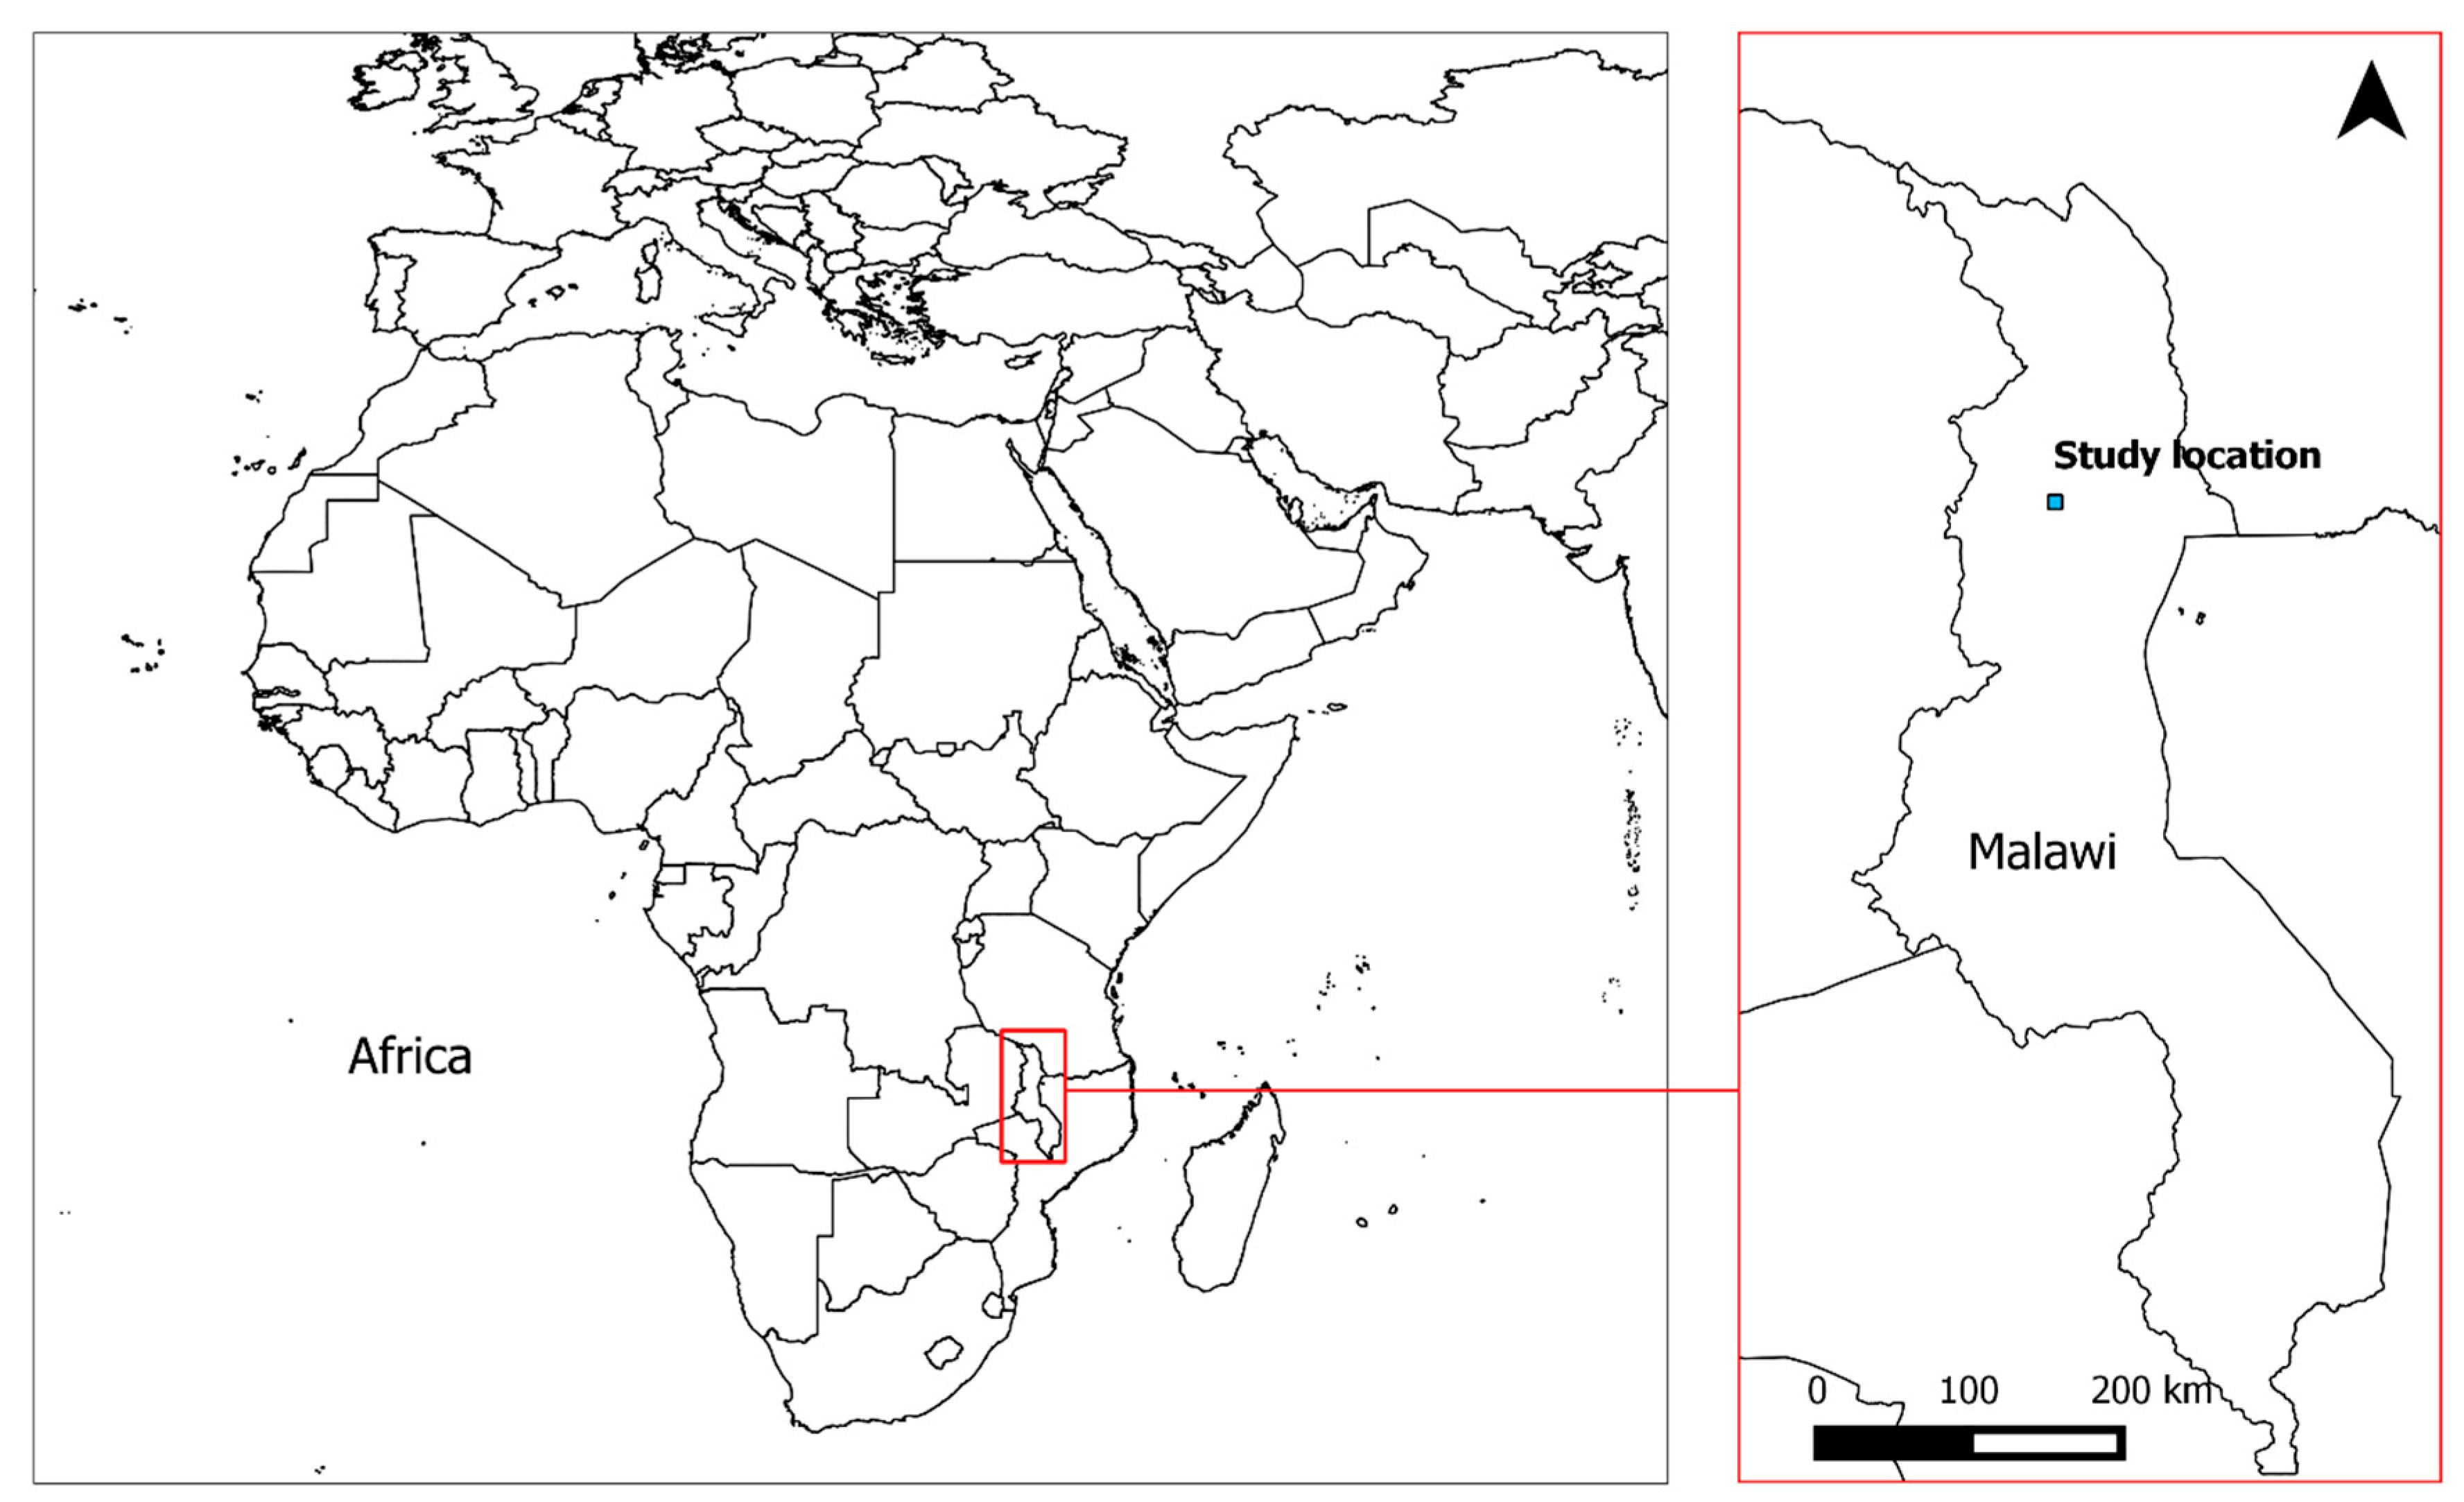
The choice for the case study in Malawi is borne out of an intended sericulture project by a non-governmental organisation (NGO) based in The Netherlands. This project is to be implemented around three estates and roughly 200 surrounding smallholder farms in the Mzimba District in the Northern Region of Malawi (Figure 2). The study area is within the Nyika Plateau catchment, with an elevation of about 1200 m above mean sea level and temperatures ranging between 9 °C and 30 °C. With an average annual precipitation of 644 mm and an average annual potential evapotranspiration of 1350 mm, the climate can be classified as subtropical highland variety [22]. The wet season starts in November and ends in April, and the dry season is from May to October. The main soil types are sandy loam and silty clay loam. These climate and soil conditions are favourable for mulberry cultivation [23]. The perennial Runyina River close to the study location is the preferred source of irrigation water.
Smallholder farmers currently grow crops such as tobacco, groundnuts and maize, while the estates mainly grow chillies and paprika. The project intends to replace currently grown crops with mulberry shrubs for silk production on about 20 hectares of the estates, and on half a hectare of each of the smallholder farms.
2.3. Calculation of Water and Land Footprints and Economic Productivities
Water and land footprints were assessed along each step of the production chain of raw silk (Figure 1), following the global water footprint standard [12]. To estimate the WF of mulberry cultivation and the currently grown crops (maize, chillies, paprika, groundnut and tobacco), we used the method as in Mekonnen and Hoekstra [24], but replaced the CropWat model with the more advanced AquaCrop model developed by the Food and Agriculture Organisation of the United Nations (FAO) [25]. AquaCrop simulates the daily soil water balance and biomass growth, in order to estimate crop water use and yield. Because mulberry is a perennial crop—and AquaCrop is developed for annuals—we set crop parameters such that AquaCrop mainly simulates canopy development and reflects local (projected) cropping practice. For mulberry shrubs, yield refers to the tonnes of leaves that can be harvested per year per hectare (note: not to the yield in terms of mulberries). For currently grown crops, simulated yields are scaled based on average local yields in the study area (Figure 2). We calculated land footprints (m2 kg−1) by taking the inverse of the yield, and we distinguished between green and blue WF based on the method described in Chukalla et al. [26]. To account for inter-annual variation in WFs, we simulate crop production for each year in the period 1986–2016. We ignored the blue WF related to energy for pumping water to the fields in case mulberry shrubs are irrigated, because the exact location, setting and types of pumps are not yet decided. We also ignored the grey WF, because of a lack of sensible data and its high dependency on local, actual practices.
We assumed that the leaves represent the full value gained from the mulberry plantation, so no value or WF is attributed to by-products such as berries. Based on estimates from the International Centre of Insect Physiology and Ecology (ICIPE, pers. comm. via email), we assumed that 187.5 kg of fresh mulberry leaves are needed to harvest 9.1 kg of dry cocoons, which after processing yield 1 kg of dry raw silk.
Data on soil properties are taken from De Lannoy et al. [27] and local data. We assumed that soil fertility is good and does not hamper crop production. Crop calendars were taken from Chapagain and Hoekstra [28] and Portmann et al. [29]. Climate data have been taken from global high-resolution datasets by Harris et al. [30] and Dee et al. [31]. These daily fields—evaluated at the location of the estates—have been scaled such that the monthly averages match monthly fields that were observed locally, at the nearby Bolero climate station.
We evaluated five mulberry cultivation scenarios, in which we compare various irrigation strategies and techniques for growing mulberry shrubs (Table 1), to assess the effect of farming practice on WFs and LFs.
The blue WF associated with cleaning, drying, cooking and reeling is highly dependent on local factors and practices. Due to the lack of a credible source, we assumed a water footprint of 100 L per harvest for cleaning the premises and five harvests per year, based on a one-hectare operation and a consumptive fraction of 10%. Generating electricity requires water, which needs to be accounted for [12]. Singh [32] estimates that electricity consumption of cocoon drying is 1.0 kWh per kg cocoons. We assumed a conservative blue WF of the energy mix for Malawi at 400 m3 TJ−1 (or 0.00144 m3 kWh−1) based on a study by Mekonnen et al. [33]. Kathari et al. [34] report that—using a multi-end reeling machine—cocoon cooking consumes 57 L of water per kg of raw silk and reeling 100 L per kg of raw silk. We adopted these estimates here as well, since a similar centrally operated multi-end reeling machine is anticipated to be used in the Malawi project. This machine—if wood-powered—requires 2.6 kg of wood per kg of cocoon for the cooking and reeling processes [35]. We calculated the WF related to wood using the average (green) WF of wood in Malawi of 74 m3 per m3 of wet round-wood (or 137 L kg−1 dry firewood) as determined by Schyns et al. [36]. However, solar power is the project’s preferred source of energy to power the machine. We therefore estimated the blue WF of cooking with solar energy as well, by converting the caloric value of wood into an equivalent amount of solar energy, and multiplying solar energy demand with the blue WF of solar energy of 150 m3 TJ−1 as estimated by Mekonnen et al. [33]. For the lack of a better estimate, the LF of silk processing (for the rearing facilities and equipment storage) is assumed at 100 m2 per hectare of mulberry shrubs.
We calculated the economic water productivity (EWP, in € m−3) and economic land productivity (ELP, in € m−2) of silk and of the currently grown crops, by dividing the local market price (€ kg−1) by the WF (m3 kg−1) or LF (m2 kg−1), respectively.
Finally, we placed the WF in the context of water availability at the catchment level. Due to the lack of local hydrological assessments for the Nyika Plateau catchment, we took data on local water scarcity levels from the high-resolution global study by Mekonnen and Hoekstra [37] to see if sustainability levels are currently being exceeded. In addition, we drew up a hypothetical case based on local precipitation figures to obtain a rough estimate of water availability levels in the catchment.
3. Results
3.1. The Water and Land Footprint of Silk Production
The total WF and LF of silk production is a summation of all WFs and LFs along the production chain of silk, as shown in Figure 1. We summarized all steps into two major components: (1) the WF and LF of silk related to cultivation of mulberry leaves; and (2) the WF and LF of silk related to the silk processing steps of cleaning, drying, cooking and reeling.
3.1.1. The Water and Land Footprint of Mulberry Cultivation
The WF of rain-fed mulberry leaves is 423 m3 t−1 and the LF 820 m2 t−1—on average over the period 1986–2016 (Table 2). The WF is 100% green, because only rainwater stored in the soil is consumed. Since there is no irrigation in this scenario to keep plants from suffering water stress, footprints strongly depend on the prevailing weather conditions in a given year. Temporal variability of both water and land footprints is high, as shown by their respective standard deviations of 169 m3 t−1 and 537 m2 t−1.
If the mulberry fields are irrigated, the LF of leaf production goes down considerably, to 236 m2 t−1 on average, and the total WF shrinks by at least 25%. The WF associated with full irrigation using the furrow technique is 314 m3 t−1, and becomes smaller with each improvement in irrigation practice. In the best-practice scenario in terms of water consumption per metric ton of leaves—i.e., deficit irrigation using drip systems while applying a layer of organic mulching—the WF is 254 m3 t−1. Temporal variability of footprints is much lower than under rain-fed conditions, because the shrubs do not suffer water stress as they do under rain-fed conditions. For example, under full drip irrigation, standard deviations are 19 m3 t−1 and 10 m2 t−1 for WF and LF, respectively. However, the WF does have a blue component in these scenarios.
Footprints expressed per tonne of mulberry leaves are converted to footprints per kg of raw silk based on the assumed feed requirement of 187.5 kg of mulberry leaves per kg of final raw silk. Water and land footprints of silk related to mulberry leaf production are listed in Table 3. It shows that rain-fed silk has a green water consumption of 79,300 L kg−1 and irrigated silk has a total water consumption between 47,500 and 58,900 L kg−1. Land footprints range from 154 m2 kg−1 under rain-fed condition to 44 or 45 m2 kg−1 under irrigation scenarios.
3.1.2. The Water and Land Footprint of Cleaning, Drying, Cooking and Reeling
Table 4 shows the WF of cleaning, drying, cooking and reeling, which in each process step is fully blue. The reeling process is the major water consuming step, but this is only so if we assume that the multi-end machine runs on solar power. Alternatively, the reeling machines may run on firewood, or small-scale sericulture farmers—who cannot afford a multi-end reeling machine at all—may simply heat water in pots on firewood stoves. The use of firewood profoundly alters the water footprint. While a solar-energy powered silk processing has a total blue WF of 180 L kg−1, using firewood results in a much larger green WF of firewood of over 3200 L kg−1. The choice of energy source to heat water for cooking therefore has a substantial influence on the total WF of the processing of silk.
The land footprint of the rearing facilities and equipment storage was estimated at 100 m2 per hectare of mulberry plantation.
3.1.3. The Total Water and Land Footprint of Silk Production
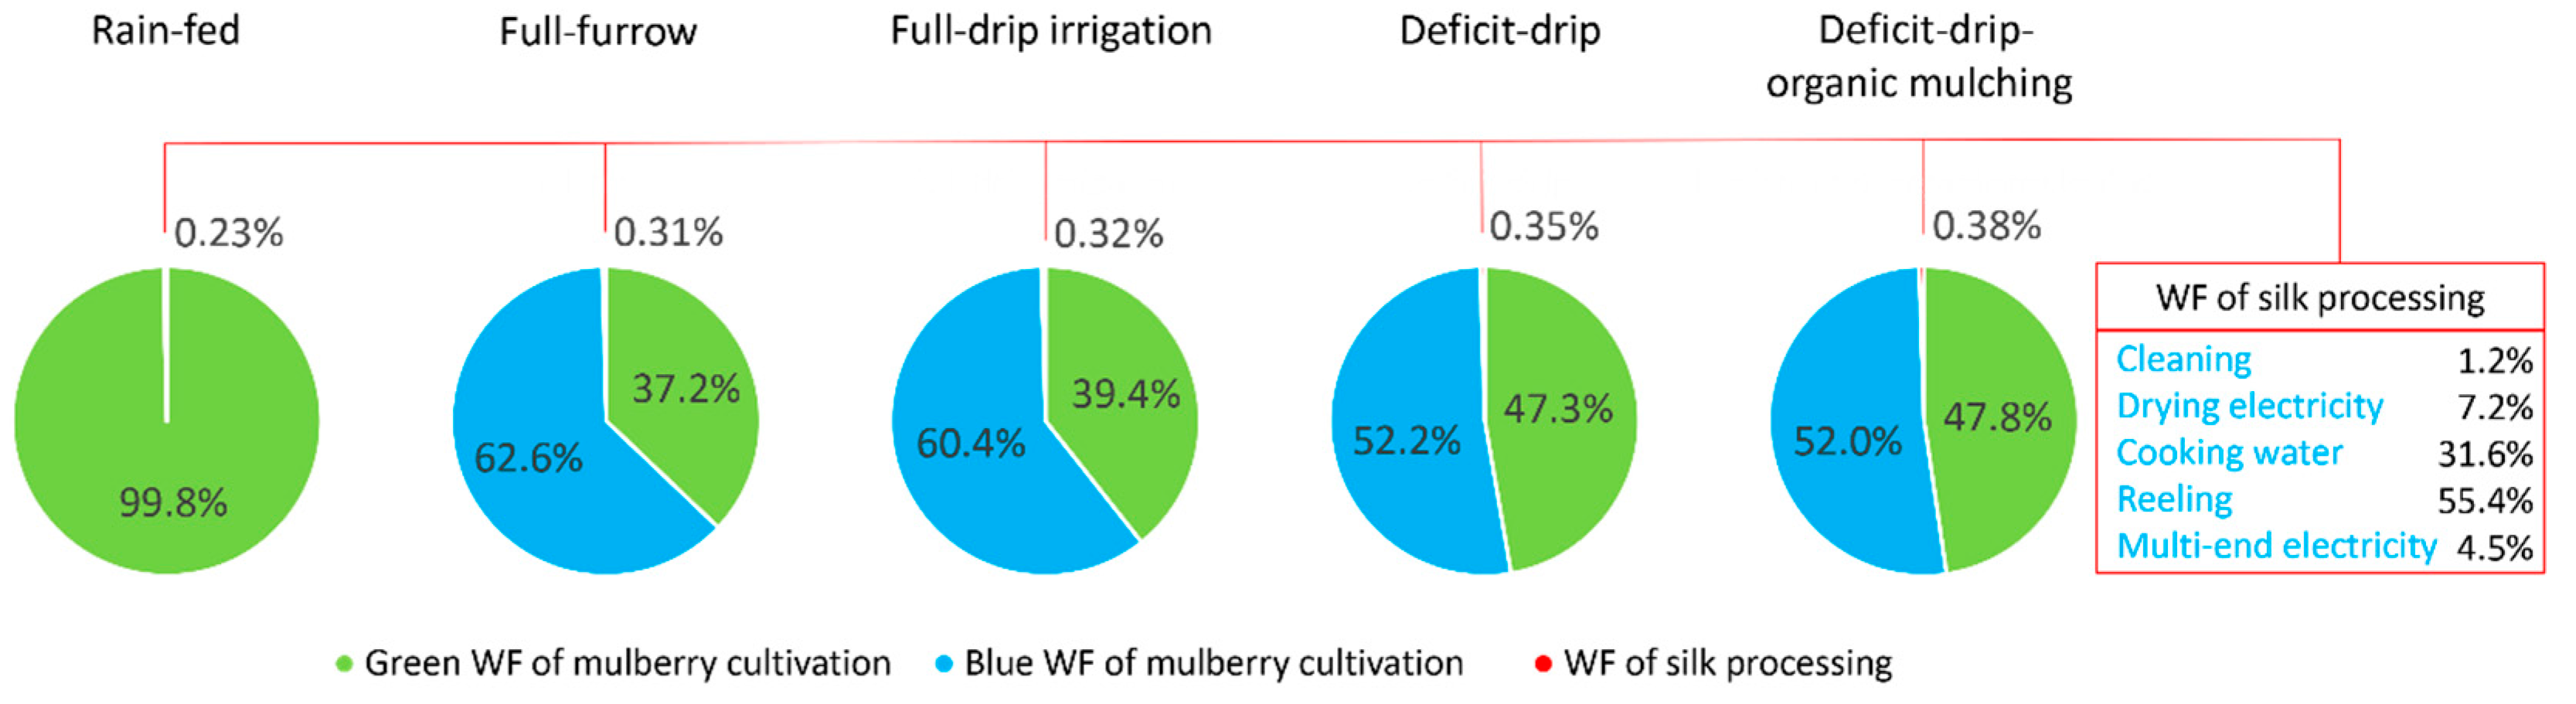
The total footprint of raw silk is the sum of the footprint of mulberry leaf production and the footprint of silk processing (Table 5). The total WF of silk decreases with each mulberry cultivation scenario, while the blue portion of 62.8% in the full-furrow irrigation scenario decreases to 52.3% in the best-practice scenario of deficit drip irrigation with organic mulching. For each scenario, a full WF split per colour and stage of the production chain is shown in Figure 3. We find that the largest parts of both the total LF and WF are the result of the mulberry cultivation component. The LF related to processing is around 1% of the total, while the WF related to processing is 0.2–0.4% of the total.
3.2. Economic Water and Land Productivity
Producing one kg of silk requires far more water and land than to produce one kg of the crops currently grown by farmers (Table 6). The market price of silk, on the other hand, is much higher than for the other crops. Comparing economic water and land productivities of silk with those of currently grown crops confirms that silk generates more economic value per unit of natural resource used. The average ELP of silk—0.37 € m−2 for the rain-fed scenario and 1.24–1.28 € m−2 for the drip irrigation scenarios—is considerably higher than the ELP of currently grown crops, which ranges from 0.04 € m−2 for maize to 0.19 € m−2 for chillies. The average EWP of silk for the rain-fed scenario, 0.72 € m−3, is much larger than the EWP of maize, groundnuts and tobacco, slightly larger than the EWP of paprika and similar as the EWP of chillies. Under drip irrigation, the EWP of silk is estimated at 1.02 to 1.20 € m3, which is much higher than for all currently grown rain-fed crops. The large range for the EWP of rain-fed silk (0.23–0.89 € m−3) compared with, for example, silk production under full drip irrigation (0.90–1.15 € m−3), demonstrates the higher variability of rain-fed versus irrigated production.
EWP and ELP vary with WF and LF, respectively, as well as with changing market prices. With a local estimate of a bottom market price for raw silk of 54 € kg−1, average EWP and ELP of rain-fed silk (the least productive form of silk production) reduce to 0.68 € m−3 and 0.35 € m−2, respectively. When we assume a low market price of raw silk of 42 € kg−1, as has been reported in India [38], EWP and ELP of rain-fed silk would be 0.53 € m−3 and 0.27 € m−2, respectively. Under such low silk prices, average water productivities of chillies and paprika—if unchanged themselves—become higher than for rain-fed silk; land productivity of silk remains higher than for currently grown crops regardless such low silk prices. Both average EWP and average ELP of irrigated silk remain higher than those for currently grown crops even under low silk price estimates.
3.3. Macro-Level Sustainability
Current consumption of blue water resources for agricultural and domestic purposes in the Nyika Plateau watershed is low and remains within sustainable limits for most of the year according to Mekonnen and Hoekstra [37]. Only toward the end of the dry season, in October and November, total blue WFs in the watershed are slightly higher than the volume of water that is sustainably available, potentially causing moderate water scarcity in that part of the year. This estimate is based on the assumption that 80% of runoff is to be reserved to maintain environmental flows. Due to the lack of a reliable catchment-level assessment, no exact sustainability limit could be given. However, small-scale mulberry cultivation in the order of magnitude proposed in the project is not expected to cause water scarcity in the catchment.
To sketch out what would happen if silk production in the area takes off on a larger scale, we considered the following hypothetical case. Based on local data, average rainfall over the period 1986–2016 is 644 mm per year. The Malawi Government estimates the local runoff coefficient at 20% [39]; Ghosh and Desai report a runoff coefficient of 25% for the nearby Rukuru River and 34% for the also nearby Luweya River [40]. We conservatively assume here that 20% of annual precipitation around the study location becomes runoff, and thus becomes a blue water resource. In addition, from a precautionary principle, we assume that 80% of this runoff is to remain in rivers and streams to protect riparian ecosystems [41]. Given these assumptions, local total blue WFs are sustainable as long as they do not exceed about 25 mm per year on average (the macro-level sustainability limit). The blue WF of mulberry shrubs under full drip irrigation is about 750 mm per year. This implies that up to 3.3% of the local watershed area could be used for irrigated mulberry cultivation, before water consumption exceeds 20% of annual runoff potentially and environmental flow requirements are violated. Coverage of the area with irrigated mulberry shrubs beyond this share could lead to moderate water scarcity. In this scenario, we did not consider the blue WF of other activities, such as the presence of other irrigated agriculture. However, we know that the agricultural area equipped for irrigation (in the whole of Malawi) is low, at only 2.3% of the total [19]. Unfortunately, we could not evaluate locally what flow is sustainably available throughout the year in the Runyina River.
4. Discussion
We calculated WFs and LFs of silk and currently grown crops using FAO’s AquaCrop model, which yielded several uncertainties. Firstly, AquaCrop is not calibrated for mulberry shrubs or for local Malawian circumstances. Secondly, although we accounted for variations in time by performing multi-year analyses, the sensitivities of yield and biomass build-up to specific weather conditions in a given year may not be fully captured by the model. Leaf yield will also depend on crop genetic make-up, since different mulberry varieties respond differently to different conditions. Nonetheless, simulated yields were about the same as anticipated yields of mulberry shrubs (International Centre of Insect Physiology and Ecology, ICIPE, pers. comm.).
Another source of uncertainty is the conversion factor of mulberry leaves to raw silk. The estimate of 187.5 kg of leaves to produce 9.1 kg of cocoons and 1 kg of raw silk (as expressed by ICIPE, pers. comm.) is slightly lower than the estimate by Astudillo et al. [35] of 238 kg leaves per kg raw silk and slightly higher than the 8.6 kg of cocoons per kg of silk by Patil et al. [42]. Any changes in this conversion factor directly translate into changes in the footprints of silk. Literature estimates of water consumption in silk processing also show a spread. For example Kathari et al. [34] estimate that 100 L of water is needed per kg of raw silk in the reeling process versus 1000 L by FAO [43] for the same process. However, since processing hardly contributes to overall footprints, the associated uncertainty is negligible.
There are no other studies to our knowledge quantify the total WF of silk. Astudillo et al. [35] estimated the blue WF component of silk in an Indian setting at 54.0 m3 kg−1 and 26.7 m3 kg−1, for conditions following recommended guidelines and under actual farm practices, respectively. These numbers match our estimates (25.0–37.2 m3 kg−1 for irrigation scenarios), but it has to be noted that climatic conditions are not necessarily comparable among the studies. Karthik and Rathinamoorthy [44] and Central Silk Board [38] estimate the LF of silk at 256 m2 kg−1 and 103 m2 kg−1, respectively. Especially for irrigated scenarios, our estimate is significantly lower (around 45 m2 kg−1), which can probably be explained by the previously mentioned leaves-to-cocoons-to-silk conversion factors. This provides one more argument to assess thoroughly these conversion factors before embarking on sericulture.
We only considered the green and blue WF of silk production, and not the grey WF related to pollution. Sericulture has more than once been associated with pollution [2,43]. Depending on farming practices, such as fertilizer and pesticides application, this component may therefore add to the total WF. In addition, chemicals and disinfectants used in the silk processing stages may increase the WF if wastewater is not treated properly before disposal.
Like cotton, silk is a fibre harnessed by the apparel sector, so we thought it relevant to compare the water and land implications of silk versus cotton fibre. The global average WF of cotton of 9100 L kg−1 and LF of 4.2 m2 kg−1 [45] are much lower than those for silk. Silk therefore is not the preferred source of fibre to replace cotton on a large scale. The cotton market price in Malawi estimated by Bisani [46] is 0.46 € kg−1. Therefore, the economic value of cotton is much lower than that of silk. EWP and ELP of cotton (0.05 € m−3 and 0.11 € m−2, respectively) are lower still than their silk equivalents (see Table 6). Considering only water and land, this implies that farmers would prefer sericulture to cotton production if they act as rational economic agents.
The same argument goes for the currently grown crops. Land and water requirements of silk—which is a luxury item—are higher than for low-value staple food crops, but the monetary added value per unit of resource is higher still for sericulture. Silk’s advantages hold as long as: (1) market prices for silk remain high; (2) sericulture does not depress local food markets; and (3) total (blue) water consumption does not exceed sustainability limits at the catchment level. The implication is that silk has to remain a marginally produced product, in the case of our study area at no more than 3% of available land in the catchment area.
Clearly, water and land are not the sole factors a farmer considers in choosing what crop to grow [8,18]. However, footprints and economic productivities—calculated at the local level and placed in the wider environmental context of catchment-level sustainability—proved useful factors in our Malawi case study. It helps farmers to link implications of their crop choice to natural resources use and catchment-level sustainability limits [47]. Especially the estate owners could thereby—however partially and by no means exhaustively—give substance to their Corporate Social Responsibility (CSR) programs.
5. Conclusions
This study set out to explore how data on water and land footprints and economic productivity can inform micro-level decision making on crop choice—in the context of macro-level sustainability of resource use—with a study of proposed silk production in Malawi.
The total WF and LF of silk depend on the farming practices under which mulberry shrubs are cultivated. We found the total WF and LF of silk at the study location ranges from 79,500 L kg−1 and 155 m2 kg−1, respectively, under rain-fed conditions, to 47,800 L kg−1 and 45 m2 kg−1 under the best farming practices. Here, best practice entails the use of deficit drip irrigation with organic mulch application. Over 99% of both the WF and LF relates to mulberry leaf production. The rest relates to silk processing, that is cleaning the nurseries, drying and cooking of the cocoons and reeling the silk. The WF of mulberry cultivation is all green in rain-fed agriculture and a mix of green and blue under irrigated conditions. The blue WF makes up 52 to 63% of the total WF, depending on the irrigation strategy and technique. Variability in time is considerably lower in irrigated than in rain-fed agriculture. A more constant silk production is therefore expected under irrigated farming conditions.
The WF and LF of silk are higher than those of currently grown rain-fed crops (maize, groundnuts, chilly, paprika and tobacco) and cotton, but the economic water and land productivities are also higher. Average EWP of silk ranges from 0.72 € m−3 (rain-fed conditions) to 1.20 € m−3 (deficit drip irrigation with mulching). EWP of cotton is much lower at 0.05 € m−3, and EWPs of currently grown crops range from 0.10 € m−3 (maize) to 0.74 € m−3 (chilly). Average ELP of silk ranges from 0.37 € m−2 (rain-fed conditions) to 1.24 € m−2 (deficit drip irrigation with mulching) and is considerably higher than ELP of the currently grown crops (0.04–0.19 € m−2).
The blue WF resulting from the introduction of irrigated mulberry plantations will increase the pressure on blue water resources compared with current rain-fed cropping practices. Current total water footprints in the Nyika Plateau catchment remain below the maximum sustainable footprint during most months of the year; only toward the end of the dry period is a moderate scarcity reported. Therefore, as long as irrigated mulberry cultivation takes place on a relatively small scale—not exceeding ~3% of the catchment area—no harmful environmental effects are expected.
Sericulture holds the promise of creating agricultural diversity, income and employment for the rural Malawian setting of our study case. Based on our assessment of water and land productivity, we conclude that sericulture is a viable alternative for farmers to currently grown crops—especially if they can irrigate their fields. This conclusion holds as long as prices of silk stay high, production remains marginal, and local food markets are not repressed. We recommend, however, to more closely evaluate both catchment hydrology and mulberry leaves-to-cocoons-to-raw silk conversion factors before a decision to grow silk is made.
With the case study of proposed silk production in Malawi, we have shown how water and land footprints and economic productivity data can be useful to farmers in choosing their crops. Moreover, these indicators provide a means for the farmers to give substance to their Corporate Social Responsibility (CSR) programs. However, final decision making should include considerations of other relevant factors (about seeds, labour, technology, access to markets, capital and so on) for a fully comprehensive assessment.
Acknowledgments
We would like to thank Marianne Löwik from The Netherlands-based NGO Sympany, Duncan McDavid from the estates at the study location, and Bonaface Ngoka and Everlyn Nguku from ICIPE for their valuable insights into sericulture and the provision of local data. This study greatly benefited from their contributions. The research was funded by Sympany; the writing of the article was funded by NWO Earth and Life Sciences (ALW), project 869.15.007. The work was partially developed within the framework of the Panta Rhei Research Initiative of the International Association of Hydrological Sciences (IAHS).
Author Contributions
Rick J. Hogeboom and Arjen Y. Hoekstra conceived and designed the study; Rick J. Hogeboom performed the modelling and analysed the data; and Rick J. Hogeboom and Arjen Y. Hoekstra wrote the paper.
Conflicts of Interest
The authors declare no conflict of interest and the founding sponsors had no role in the design of the study; in the collection, analyses, or interpretation of data; in the writing of the manuscript, and in the decision to publish the results.
References
- Dercon, S. Risk, crop choice, and savings: Evidence from Tanzania. Econ. Dev. Cult. Chang. 1996, 44, 485–513. [Google Scholar] [CrossRef]
- Raina, S.K. The Economics of Apiculture and Sericulture Modules for Income Generation; International Centre of Insect Physiology and Ecology: Nairobi, Kenya, 2000. [Google Scholar]
- Qiu, H.G.; Wang, X.B.; Zhang, C.P.; Xu, Z.G. Farmers’ seed choice behaviors under asymmetrical information: Evidence from maize farming in China. J. Integr. Agric. 2016, 15, 1915–1923. [Google Scholar] [CrossRef]
- Sherrick, B.J.; Barry, P.J.; Ellinger, P.N.; Schnitkey, G.D. Factors influencing farmers’ crop insurance decisions. Am. J. Agric. Econ. 2004, 86, 103–114. [Google Scholar] [CrossRef]
- Wineman, A.; Crawford, E.W. Climate change and crop choice in Zambia: A mathematical programming approach. NJAS Wagening. J. Life Sci. 2017, 81, 19–31. [Google Scholar] [CrossRef]
- Schmautz, Z.; Loeu, F.; Liebisch, F.; Graber, A.; Mathis, A.; Bulc, T.G.; Junge, R. Tomato productivity and quality in aquaponics: Comparison of three hydroponic methods. Water 2016, 8, 533. [Google Scholar] [CrossRef]
- Tan, Q.; Zhang, S.; Li, R. Optimal use of agricultural water and land resources through reconfiguring crop planting structure under socioeconomic and ecological objectives. Water 2017, 9, 488. [Google Scholar] [CrossRef]
- Hoekstra, A.Y. Water footprint assessment (WFA): Evolvement of a new research field. Water Resour. Manag. 2017, 31, 3061–3081. [Google Scholar] [CrossRef]
- Bruckner, M.; Fischer, G.; Tramberend, S.; Giljum, S. Measuring telecouplings in the global land system: A review and comparative evaluation of land footprint accounting methods. Ecol. Econ. 2015, 114, 11–21. [Google Scholar] [CrossRef]
- Aldaya, M.M.; Garrido, A.; Llamas, M.R.; Varela-Ortega, C.; Novo, P.; Casado, R.R. Water footprint and virtual water trade in Spain. In Water Policy in Spain; Garrido, A., Llamas, R., Eds.; CRC Press: Leiden, The Netherlands, 2010; pp. 49–59. [Google Scholar]
- Gutierrez-Martin, C.; Borrego-Marin, M.M.; Berbel, J. The economic analysis of water use in the water framework directive based on the system of environmental-economic accounting for water: A case study of the Guadalquivir river basin. Water 2017, 9, 180. [Google Scholar] [CrossRef]
- Hoekstra, A.Y.; Chapagain, A.K.; Aldaya, M.M.; Mekonnen, M.M. The Water Footprint Assessment Manual: Setting the Global Standard; Earthscan: London, UK, 2011. [Google Scholar]
- Hoekstra, A.Y. The sustainability of a single activity, production process or product. Ecol. Indic. 2015, 57, 82–84. [Google Scholar] [CrossRef]
- Chukalla, A.D.; Krol, M.S.; Hoekstra, A.Y. Marginal cost curves for water footprint reduction in irrigated agriculture: Guiding a cost-effective reduction of crop water consumption to a permit or benchmark level. Hydrol. Earth Syst. Sci. 2017, 21, 3507–3524. [Google Scholar] [CrossRef]
- Hoekstra, A.Y.; Wiedmann, T.O. Humanity’s unsustainable environmental footprint. Science 2014, 344, 1114–1117. [Google Scholar] [CrossRef] [PubMed]
- Steffen, W.; Richardson, K.; Rockstrom, J.; Cornell, S.E.; Fetzer, I.; Bennett, E.M.; Biggs, R.; Carpenter, S.R.; de Vries, W.; de Wit, C.A.; et al. Sustainability. Planetary boundaries: Guiding human development on a changing planet. Science 2015, 347, 1259855. [Google Scholar] [CrossRef] [PubMed]
- Vörösmarty, C.J.; McIntyre, P.B.; Gessner, M.O.; Dudgeon, D.; Prusevich, A.; Green, P.; Glidden, S.; Bunn, S.E.; Sullivan, C.A.; Liermann, C.R.; et al. Global threats to human water security and river biodiversity. Nature 2010, 467, 555–561. [Google Scholar] [CrossRef] [PubMed]
- Chenoweth, J.; Hadjikakou, M.; Zoumides, C. Quantifying the human impact on water resources: A critical review of the water footprint concept. Hydrol. Earth Syst. Sci. 2014, 18, 2325–2342. [Google Scholar] [CrossRef] [Green Version]
- International Water Management Institue (IWMI). Trends and Outlook—Agricultural Water Management in Southern Africa—Country Report of Malawi; International Water Management Institue: Colombo, Sri Lanka, 2010. [Google Scholar]
- Food and Agricultural Organization (FAO). Review of Food and Agricultural Policies in Malawi; Food and Agricultural Organization: Rome, Italy, 2015. [Google Scholar]
- International Trade Centre (ITC). Trade Map for Product: 5002 Raw Silk. Trade Statistics for International Business Development; International Trade Centre: Geneva, Switzerland, 2017. [Google Scholar]
- Kottek, M.; Grieser, J.; Beck, C.; Rudolf, B.; Rubel, F. World map of the Köppen-Geiger climate classification updated. Meteorol. Z. 2006, 15, 259–263. [Google Scholar] [CrossRef]
- Jian, Q.; Ningjia, H.; Yong, W.; Zhonghuai, X. Ecological issues of mulberry and sustainable development. J. Resour. Ecol. 2012, 3, 330–339. [Google Scholar] [CrossRef]
- Mekonnen, M.M.; Hoekstra, A.Y. The green, blue and grey water footprint of crops and derived crop products. Hydrol. Earth Syst. Sci. 2011, 15, 1577–1600. [Google Scholar] [CrossRef] [Green Version]
- Steduto, P.; Hsiao, T.C.; Raes, D.; Fereres, E. Aquacrop-the fao crop model to simulate yield response to water: I. Concepts and underlying principles. Agron. J. 2009, 101, 426–437. [Google Scholar] [CrossRef]
- Chukalla, A.D.; Krol, M.S.; Hoekstra, A.Y. Green and blue water footprint reduction in irrigated agriculture: Effect of irrigation techniques, irrigation strategies and mulching. Hydrol. Earth Syst. Sci. 2015, 19, 4877–4891. [Google Scholar] [CrossRef]
- De Lannoy, G.J.M.; Koster, R.D.; Reichle, R.H.; Mahanama, S.P.P.; Liu, Q. An updated treatment of soil texture and associated hydraulic properties in a global land modeling system. J. Adv. Model. Earth Syst. 2014, 6, 957–979. [Google Scholar] [CrossRef] [Green Version]
- Chapagain, A.K.; Hoekstra, A.Y. Virtual Water Flows between Nations in Relation to Trade in Livestock and Livestock Products; UNESCO-IHE: Delft, The Netherlands, 2003. [Google Scholar]
- Portmann, F.T.; Siebert, S.; Bauer, C.; Döll, P. Global Dataset of Monthly Growing Areas of 26 Irrigated Crops: Version 1.0.; University Institute of Physical Geography: Frankfurt, Germany, 2008. [Google Scholar]
- Harris, I.; Jones, P.D.; Osborn, T.J.; Lister, D.H. Updated high-resolution grids of monthly climatic observations—The cru ts3.10 dataset. Int. J. Climatol. 2014, 34, 623–642. [Google Scholar] [CrossRef] [Green Version]
- Dee, D.P.; Uppala, S.M.; Simmons, A.J.; Berrisford, P.; Poli, P.; Kobayashi, S.; Andrae, U.; Balmaseda, M.A.; Balsamo, G.; Bauer, P.; et al. The ERA-Interim reanalysis: Configuration and performance of the data assimilation system. Q. J. R. Meteorol. Soc. 2011, 137, 553–597. [Google Scholar] [CrossRef]
- Singh, P.L. Silk cocoon drying in forced convection type solar dryer. Appl. Energy 2011, 88, 1720–1726. [Google Scholar] [CrossRef]
- Mekonnen, M.M.; Gerbens-Leenes, P.W.; Hoekstra, A.Y. The consumptive water footprint of electricity and heat: A global assessment. Environ. Sci. Water Res. 2015, 1, 285–297. [Google Scholar] [CrossRef]
- Kathari, V.P.; Mahesh, K.N.; Basu, A. Energy efficient silk reeling process using solar water heating system and ushma shoshak unit in multiend silk reeling unit. Sericologia 2013, 53, 219–224. [Google Scholar]
- Astudillo, M.F.; Thalwitz, G.; Vollrath, F. Life cycle assessment of indian silk. J. Clean. Prod. 2014, 81, 158–167. [Google Scholar] [CrossRef]
- Schyns, J.F.; Booij, M.J.; Hoekstra, A.Y. The water footprint of wood for lumber, pulp, paper, fuel and firewood. Adv. Water Resour. 2017, 107, 490–501. [Google Scholar] [CrossRef]
- Mekonnen, M.M.; Hoekstra, A.Y. Four billion people facing severe water scarcity. Sci. Adv. 2016, 2, e1500323. [Google Scholar] [CrossRef] [PubMed]
- Central Silk Board. Indian Silk April–June 2015: Impressive Achievements. Available online: http://www.csb.gov.in/publications/indian-silk/contents/current-issue-editorial/ (accessed on 13 October 2017).
- Malawi Government. Malawi State of Environment and Outlook Report: Environment for Sustainable Economic Growth; Ministry of Natural Resources, Energy and Environment, Malawi Government: Lilongwe, Malawi, 2010.
- Ghosh, S.N.; Desai, V.R. Environmental Hydrology and Hydraulics—Eco-Technological Practices for Sustainably Development; Taylor and Francis: Boca Raton, FL, USA, 2006. [Google Scholar]
- Richter, B.D.; Davis, M.M.; Apse, C.; Konrad, C. A presumptive standard for environmental flow protection. River Res. Appl. 2012, 28, 1312–1321. [Google Scholar] [CrossRef]
- Patil, B.R.; Singh, K.K.; Pawar, S.E.; Maarse, L.; Otte, J. Sericulture—An Alternative Source of Income to Enhance the Livelihoods of Small-Scale Farmers and Tribal Communities; Food and Agriculture Organization: Rome, Italy, 2009. [Google Scholar]
- Food and Agriculture Organization (FAO). Conservation Status of Sericulture Germplasm Resources in the World—II. Conservation Status of Silkworm (Bombyx mori) Genetic Resources in the World; Food and Agriculture Organization: Rome, Italy, 2003. [Google Scholar]
- Karthik, T.; Rathinamoorthy, R. 6-Sustainable silk production a2-Muthu, Subramanian Senthilkannan. In Sustainable Fibres and Textiles; Woodhead Publishing: Cambridge, UK, 2017; pp. 135–170. [Google Scholar]
- Hoekstra, A.Y. The Water Footprint of Modern Consumer Society; Routledge: Abingdon, UK, 2013. [Google Scholar]
- Bisani, L. Malawi Cotton Farmers Bemoan Poor Prices. Available online: https://malawi24.com/2016/06/06/malawi-cotton-farmers-bemoan-poor-prices/ (accessed on 13 October 2017).
- Herva, M.; Franco, A.; Carrasco, E.F.; Roca, E. Review of corporate environmental indicators. J. Clean. Prod. 2011, 19, 1687–1699. [Google Scholar] [CrossRef] [Green Version]
Figure 1.
Water and land footprints along the production chain of raw silk.

Figure 2.
Location of the study area where switching from currently grown crops (maize, chillies, paprika, groundnuts, and tobacco) to sericulture is being considered.
Figure 2.
Location of the study area where switching from currently grown crops (maize, chillies, paprika, groundnuts, and tobacco) to sericulture is being considered.

Figure 3.
The composition of the water footprint (WF) of raw silk, by colour and by production stage, for five mulberry cultivation scenarios.
Figure 3.
The composition of the water footprint (WF) of raw silk, by colour and by production stage, for five mulberry cultivation scenarios.


Table 1.
Different scenarios of cultivating mulberry shrubs evaluated in this study.
| Scenario | Irrigation Strategy | Irrigation Technique | Expected Effect |
|---|---|---|---|
| Rain-fed | No irrigation | None | Sensitive to climate variability; a dry year leads to lower leaf yields. |
| Full-furrow | Full irrigation | Furrow | No water stress; optimum yields. High evaporation because large part of soil is wetted. |
| Full-drip | Full irrigation | Drip | No water stress; optimum yields. Lower evaporation because small part of soil is wetted. |
| Deficit-drip | Deficit irrigation | Drip | Some water stress, leading to lower yields. Lower evaporation because small part of soil is wetted. Smaller water footprint per tonne of leaves. |
| Deficit-drip-organic mulching | Deficit irrigation | Drip | Some water stress, leading to lower yields. Very low evaporation because of protective organic mulching layer covering the soil. Minimum water footprint per tonne of leaves. |
Table 2.
Green and blue water footprint (WF) and average, minimum and maximum total WF and land footprint (LF) of mulberry leaf production per metric ton of leaf for five different scenarios. Average WF and LF are production weighted over the period 1986–2016.
Table 2.
Green and blue water footprint (WF) and average, minimum and maximum total WF and land footprint (LF) of mulberry leaf production per metric ton of leaf for five different scenarios. Average WF and LF are production weighted over the period 1986–2016.
| Scenario | WFavg;green (m3 t−1) | WFavg;blue (m3 t−1) | WFavg;total (m3 t−1) | WFmin (m3 t−1) | WFmax (m3 t−1) | LFavg (m2 t−1) | LFmin (m2 t−1) | LFmax (m2 t−1) |
|---|---|---|---|---|---|---|---|---|
| Rain-fed | 423 | 0 | 423 | 340 | 1336 | 820 | 532 | 3704 |
| Full-furrow | 117 | 197 | 314 | 278 | 356 | 236 | 217 | 254 |
| Full-drip | 117 | 180 | 297 | 265 | 339 | 236 | 217 | 254 |
| Deficit-drip | 129 | 142 | 271 | 239 | 308 | 243 | 216 | 278 |
| Deficit-drip-organic mulching | 122 | 132 | 254 | 223 | 288 | 242 | 212 | 279 |
Table 3.
Green and blue WF and average, minimum and maximum total WF and LF of raw silk related to mulberry leaf production per kg of raw silk for five different scenarios. Average WF and LF are production weighted over the period 1986–2016.
Table 3.
Green and blue WF and average, minimum and maximum total WF and LF of raw silk related to mulberry leaf production per kg of raw silk for five different scenarios. Average WF and LF are production weighted over the period 1986–2016.
| Scenario | WFavg;green (L kg−1) | WFavg;blue (L kg−1) | WFavg;total (L kg−1) | WFmin (L kg−1) | WFmax (L kg−1) | LFavg (m2 kg−1) | LFmin (m2 kg−1) | LFmax (m2 kg−1) |
|---|---|---|---|---|---|---|---|---|
| Rain-fed | 79,300 | 0 | 79,300 | 63,800 | 250,500 | 154 | 100 | 694 |
| Full-furrow | 22,000 | 37,000 | 58,900 | 52,100 | 66,800 | 44.2 | 40.7 | 47.7 |
| Full-drip | 22,000 | 33,700 | 55,700 | 49,600 | 63,500 | 44.2 | 40.7 | 47.7 |
| Deficit-drip | 24,100 | 26,600 | 50,800 | 44,800 | 57,800 | 45.6 | 40.5 | 52.1 |
| Deficit-drip-organic mulching | 22,800 | 24,800 | 47,500 | 41,900 | 54,000 | 45.4 | 39.8 | 52.2 |
Table 4.
Green, blue and total water footprint (WF) related to cleaning, drying, cooking and reeling per kg of raw silk, assuming water for cooking is heated using solar energy.
Table 4.
Green, blue and total water footprint (WF) related to cleaning, drying, cooking and reeling per kg of raw silk, assuming water for cooking is heated using solar energy.
| Process Step | WFgreen (L kg−1) | WFblue (L kg−1) | WFtotal (L kg−1) |
|---|---|---|---|
| Cleaning | 0 | 2 | 2 |
| Drying electricity | 0 | 13 | 13 |
| Cooking cocoons | 0 | 57 | 57 |
| Reeling silk | 0 | 100 | 100 |
| Multi-end machine energy when solar powered | 0 | 8 | 8 |
| Alternative: multi-end machine energy when wood powered | 3200 | 0 | 3200 |
| Total | 0 | 180 | 180 |
Table 5.
Green, blue and total water footprint (WF) and land footprint (LF) of silk under five mulberry cultivation scenarios per kg of raw silk.
Table 5.
Green, blue and total water footprint (WF) and land footprint (LF) of silk under five mulberry cultivation scenarios per kg of raw silk.
| Scenario | WFgreen (L kg−1) | WFgreen (%) | WFblue (L kg−1) | WFblue (%) | WFtotal (L kg−1) | LFtotal (m2 kg−1) |
|---|---|---|---|---|---|---|
| Rain-fed | 79,300 | 99.7 | 180 | 0.3 | 79,500 | 155 |
| Full-furrow | 22,000 | 37.2 | 37,200 | 62.8 | 59,200 | 44.7 |
| Full-drip | 22,000 | 39.4 | 33,900 | 60.6 | 55,900 | 44.7 |
| Deficit-drip | 24,100 | 47.3 | 26,800 | 52.7 | 50,900 | 46.1 |
| Deficit-drip-organic mulching | 22,800 | 47.7 | 25,000 | 52.3 | 47,800 | 45.9 |
Table 6.
Economic water productivity (EWP) and land productivity (ELP) for silk under three scenarios, and for five currently grown crops. Minimum and maximum EWP are based on highest and lowest WF over the period 1986–2016, respectively. Silk yields are simulated; yields of current crops and market prices are based on local data.
| Crop | WFtotal (L kg−1) | Yieldavg (kg ha−1) | Market Price (€ kg−1) | EWPmin (€ m−3) | EWPavg (€ m−3) | EWPmax (€ m−3) | ELPavg (€ m−2) |
|---|---|---|---|---|---|---|---|
| Silk, rain-fed | 79,500 | 65 | 57.00 | 0.23 | 0.72 | 0.89 | 0.37 |
| Silk, full drip irrigation | 55,900 | 226 | 57.00 | 0.90 | 1.02 | 1.15 | 1.28 |
| Silk, def. drip irr., organic mulch | 47,800 | 220 | 57.00 | 1.05 | 1.20 | 1.35 | 1.24 |
| Maize | 2500 | 1500 | 0.26 | 0.01 | 0.10 | 0.16 | 0.04 |
| Chilly | 3400 | 750 | 2.50 | 0.42 | 0.74 | 0.84 | 0.19 |
| Paprika | 1900 | 1350 | 1.20 | 0.36 | 0.64 | 0.73 | 0.16 |
| Groundnuts | 3300 | 1250 | 0.48 | 0.03 | 0.15 | 0.23 | 0.06 |
| Tobacco | 3300 | 1250 | 1.05 | 0.00 | 0.32 | 0.40 | 0.13 |
© 2017 by the authors. Licensee MDPI, Basel, Switzerland. This article is an open access article distributed under the terms and conditions of the Creative Commons Attribution (CC BY) license (http://creativecommons.org/licenses/by/4.0/).
Share and Cite
MDPI and ACS Style
Hogeboom, R.J.; Hoekstra, A.Y. Water and Land Footprints and Economic Productivity as Factors in Local Crop Choice: The Case of Silk in Malawi. Water 2017, 9, 802. https://doi.org/10.3390/w9100802
AMA Style
Hogeboom RJ, Hoekstra AY. Water and Land Footprints and Economic Productivity as Factors in Local Crop Choice: The Case of Silk in Malawi. Water. 2017; 9(10):802. https://doi.org/10.3390/w9100802
Chicago/Turabian StyleHogeboom, Rick J., and Arjen Y. Hoekstra. 2017. "Water and Land Footprints and Economic Productivity as Factors in Local Crop Choice: The Case of Silk in Malawi" Water 9, no. 10: 802. https://doi.org/10.3390/w9100802
Note that from the first issue of 2016, this journal uses article numbers instead of page numbers. See further details here.