Thermal Study on Extensive Green Roof Integrated Irrigation in Northwestern Arid Regions of China

Department of Municipal Engineering, School of Civil Engineering, Southeast University, Nanjing 210096, China
*
Authors to whom correspondence should be addressed.
Water 2017, 9(11), 810; https://doi.org/10.3390/w9110810
Submission received: 24 August 2017
/
Revised: 17 October 2017
/
Accepted: 19 October 2017
/
Published: 9 November 2017
(This article belongs to the Special Issue Sponge Cities: Emerging Approaches, Challenges and Opportunities)
Abstract
:Selection of xerophils and drought tolerant plants is highly crucial in green roof techniques in the drought prone regions of Northwest China. In this study, the thermal performance under the natural conventional climate in summer was analyzed using a self-made simulation experimental platform through comparison of the internal surface temperature with and without green roofs. The distribution frequency of internal surface temperature was investigated by dividing internal surface temperature into several ranges. Statistical analysis showed that the frequency of internal surface temperature lower than 33 °C for green roofs was 91.8%, about 1.09 times higher than that for non-green roofs, and that the sum of internal surface temperature exceeding 35 °C was about one third of that for non-green roofs. The results proved that green roofs have a significant insulation effect. Moreover, the thermal insulation property of green roofs had a strong positive relation with outside temperature. The thermal insulation characteristic was improved as the outdoor temperature increased, additionally, it had a better insulation effect within two hours after irrigation.
1. Introduction
Commonly existing urban infrastructure, such as buildings, roads and parking lots, forms a growing area of impervious surfaces across cities globally. Impervious surfaces have considerable influence on stormwater quantity and quality. The runoff coefficient on impervious surfaces is generally 0.9, translating to 90% of rain falling on an impervious surface leaving as surface runoff rather than infiltrating [1]. Surface runoff leaves a site as discharge to existing drainage infrastructure or receiving water bodies; it represents a missed opportunity for storage and reuse. This missed opportunity is especially impactful in the northwestern arid areas of the Loess Plateau in China where rainwater has become the second most important water source [2,3,4] due to the lack of available surface water resources in the region.
If collected and treated reliably, captured stormwater has the potential to become an important additional source of freshwater. This can be achieved by employing stormwater management practices which aim to intercept, attenuate, and retain stormwater flows to improve water quality and restore flow regimes to pre-development levels. Such techniques are often referred to as low impact development (LID) systems in the USA, water sensitive urban design (WSUD) in Australia, sustainable urban drainage systems (SUDS) in the UK and sponge city construction in China.
Green roofs are a popular stormwater management practice in urban areas as they fit within the existing developed footprint without the additional space requirements of other practices. Green roof technology is also a popular stormwater management practice in sponge city construction. Green roofs are effective in improving the city environment [5] and absorbing radiation heat. Associated thermal insulation characteristics can reduce the burden on building air conditioning equipment [6] and significantly reduce the temperature of the roof [7].
Installing green roofs is now widely considered as an effective strategy to reduce the thermal load of the building’s shell. Several studies have been carried out to evaluate the thermal insulation of vegetation for green roofs by using experimental and infrared techniques. Niachou et al. [8] demonstrated that solar radiation and external temperature are reduced by the vegetative cover of planted green roofs, which agrees with previous research [9]. A recent study by Costanzo et al. [10] found that the green leaf area index has the largest impact on thermal performance. Moreover, Sailor [11] studied the energy balance of green roofs and concluded that the dominant way for green roofs to dissipate absorbed heat was through evapotranspiration.
A recent study by Pianella et al., showed that green roof irrigation would be necessary to maintain plant health and reduce substrate temperature and heat flux [12]; however, costs associated with irrigating green roofs in arid climates can nullify savings in energy demand for air-conditioning [13]. Consequently, rainwater collection and automatic irrigation subsystem research is significantly needed in follow-up studies.
The surface temperature of vegetation is nonhomogeneous due to the complex geometry of plant surfaces. It is also difficult to measure surface temperatures using traditional thermocouple probes as there is considerable error [14]. However, results measured using infrared thermography are visual and accurate [15,16].
Research on green roofs constructed on new buildings has made considerable headway [17], while the amount of research involving existing green roofs has not. Moreover, the majority of published research literature contains little related information on the performance of green roofs in arid regions.
The study aims to investigate extensive multi-species vegetated green roofs in order to answer the following questions:
- What is the best model to simulate green roofs in arid climates?
- What plant species have the greatest impact on the temperature inside the buildings during long-term drought?
- How can integrated irrigation systems be designed for drought resistance?
- How can the thermal characteristics of green roofs be assessed under drought and strong light area conditions?
- How can thermal changes be assessed after irrigation?
2. Methods
Reduced-scale models of buildings equipped with vegetated green roofs were constructed for this study. Post-construction, plants were allowed to establish before treatments and monitoring began. Greens roofs were monitored for temperature and plant water requirements. Monitoring of the models began on 1 July 2014, and continued, with some interruptions and changes to the experimental design, until 31 July 2014.
2.1. Study Site
The experiment was conducted at Lanzhou University of Technology. Located at the geometric center of China (36°3′27.10″ N, 103°43′43.75″ E), Lanzhou has an arid to semi-arid climate with hot summers. Temperatures range from −11 to 1 °C in January and 16 to 28 °C in August and average annual precipitation is 322.10 mm, with rainfall occurring entirely between June and August (Figure 1).
2.2. Selection of Plant Species
Three types of plants with different appearances and adaptation strategies were selected [18,19,20]. There were six replicates for each plant species. Plants were propagated in greenhouse conditions from seed when possible and from cuttings if seeds were unavailable. Plants were allowed to root and grow for at least four weeks before the experiment began. Mature cuttings propagated from plants were chosen as parent materials. To ensure the same initial condition for all cuttings, the tested cuttings were snipped off at 4 cm from the top of shoot, and the leaves on the two bottom nodes were stripped. The following selected plants represent different classes of potential green roof solutions that would maximize benefit in terms of thermal protection and minimize cost in terms of irrigation:
- a
- Sedum lineare has a dense root system and is a rapidly growing species. It propagates easily and is drought-tolerant. Previous research has shown Sedum spp. reliability and dependability to be of crucial importance in green roof implementation [18].
- b
- Aptenia cordifolia is a succulent with bright green leaves and red flowers. It is very efficient in heavy metal uptake for sewage sludge compost recuperation. Earlier studies reveal that it is capable of surviving drought conditions [19].
- c
- Tifdwarf bermuda grass has been one of the most popular choices for putting greens for over 40 years [20].
2.3. Construction of Reduced-Scale Building Models
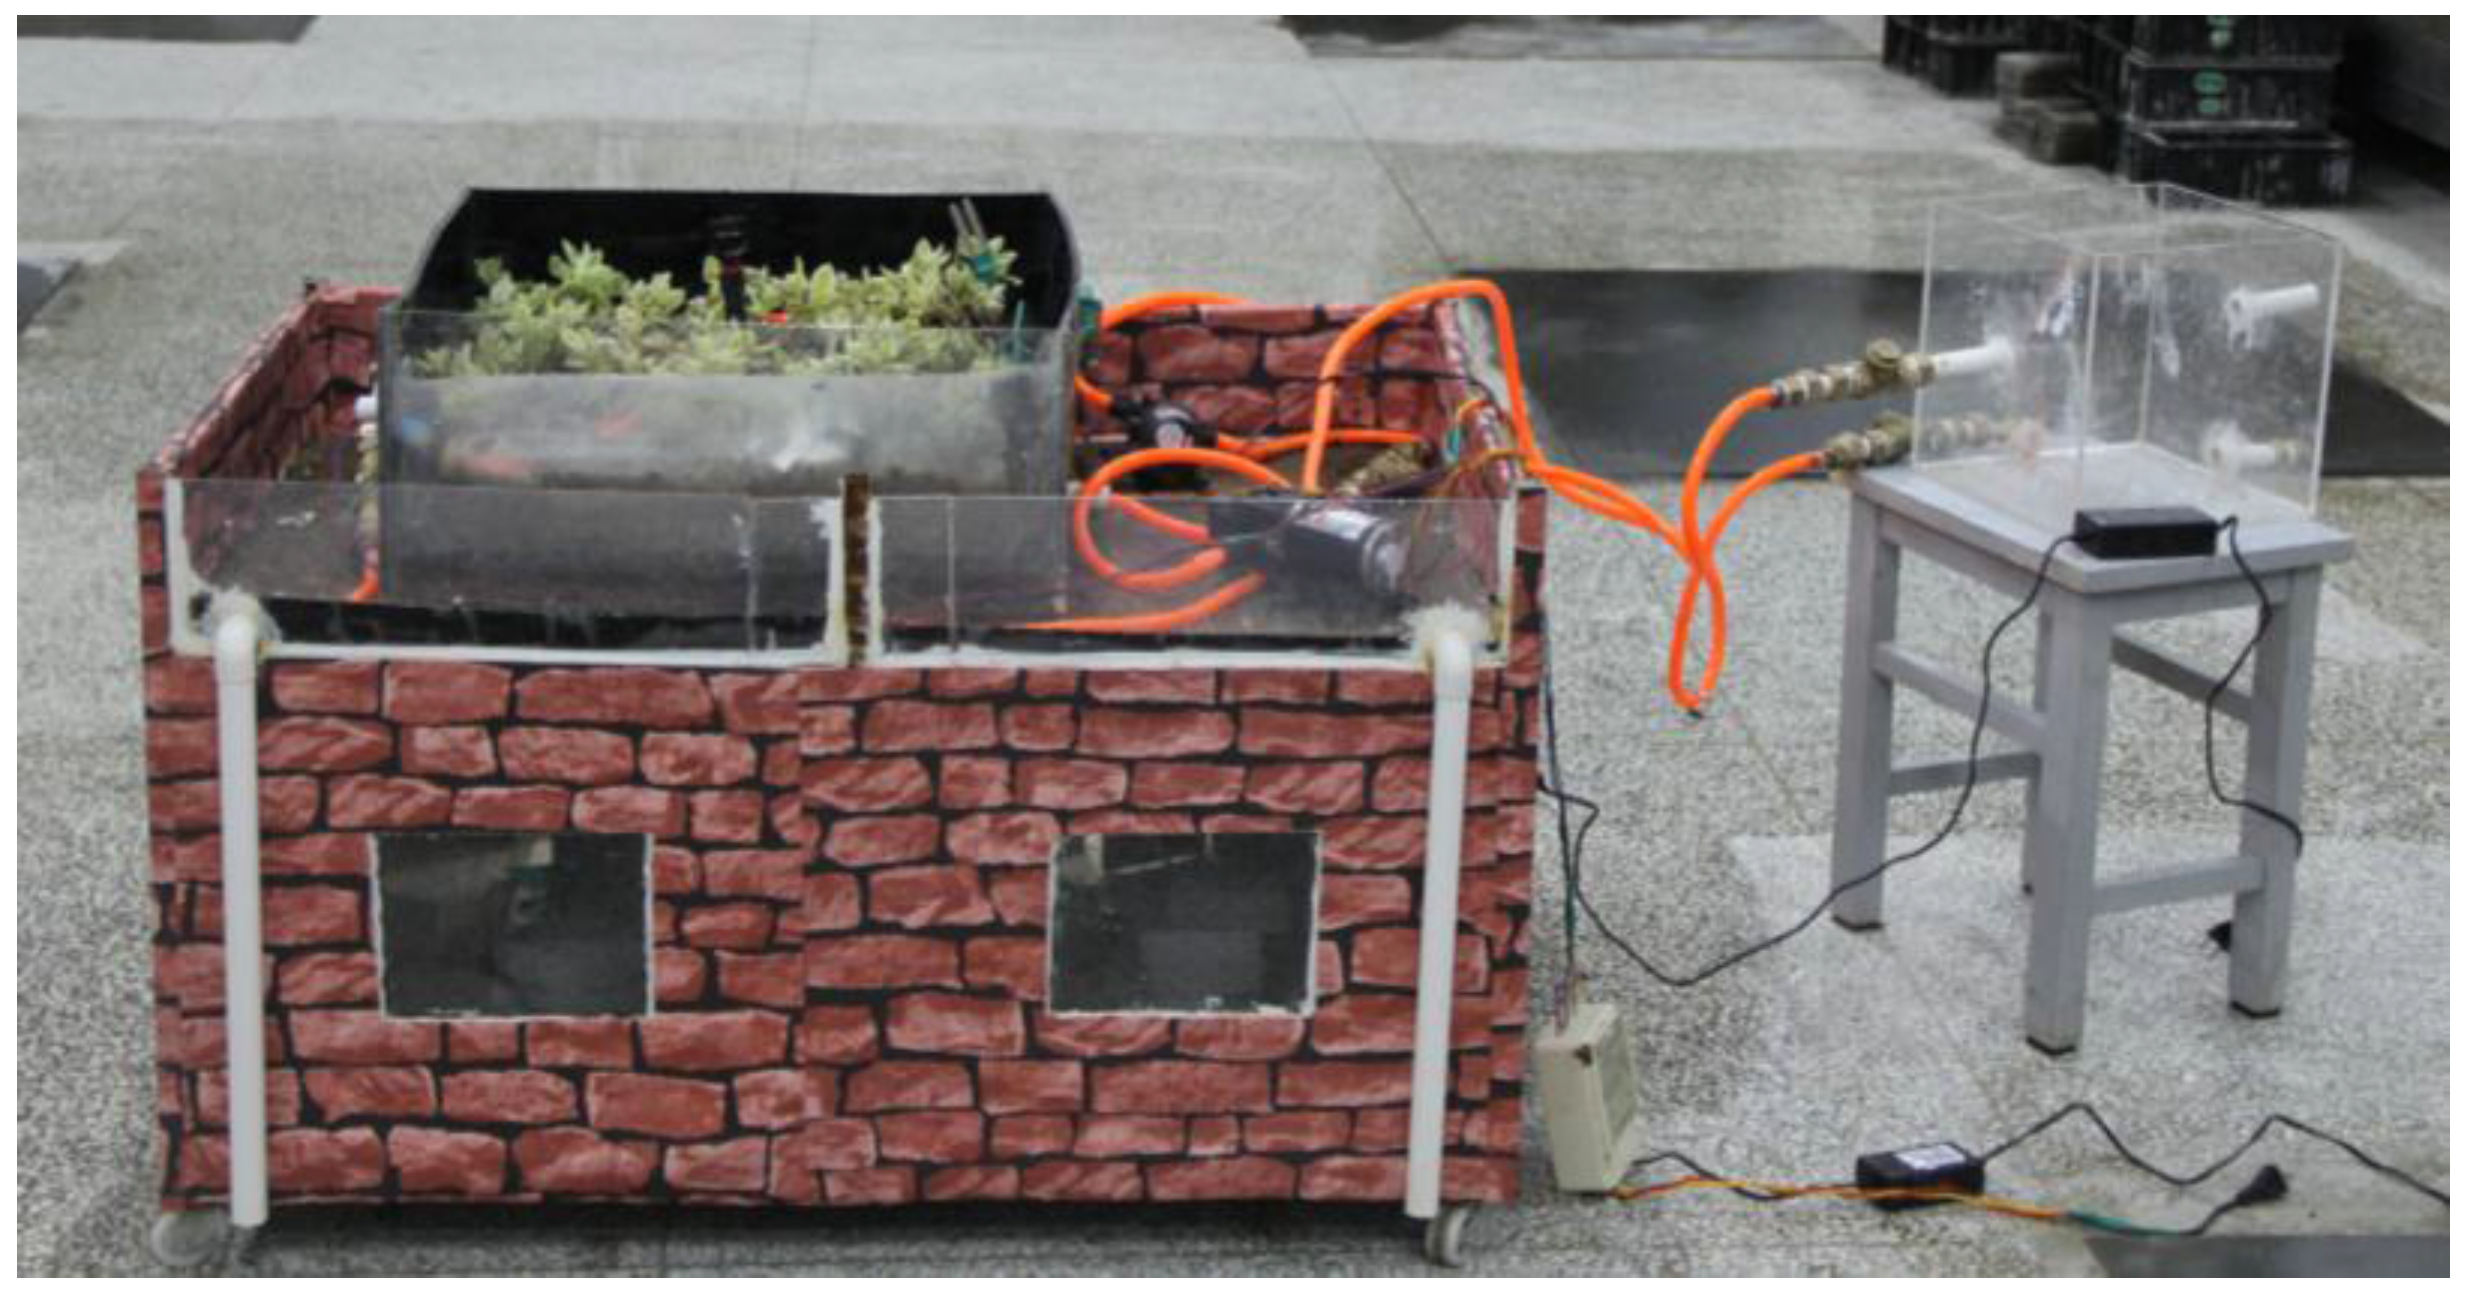
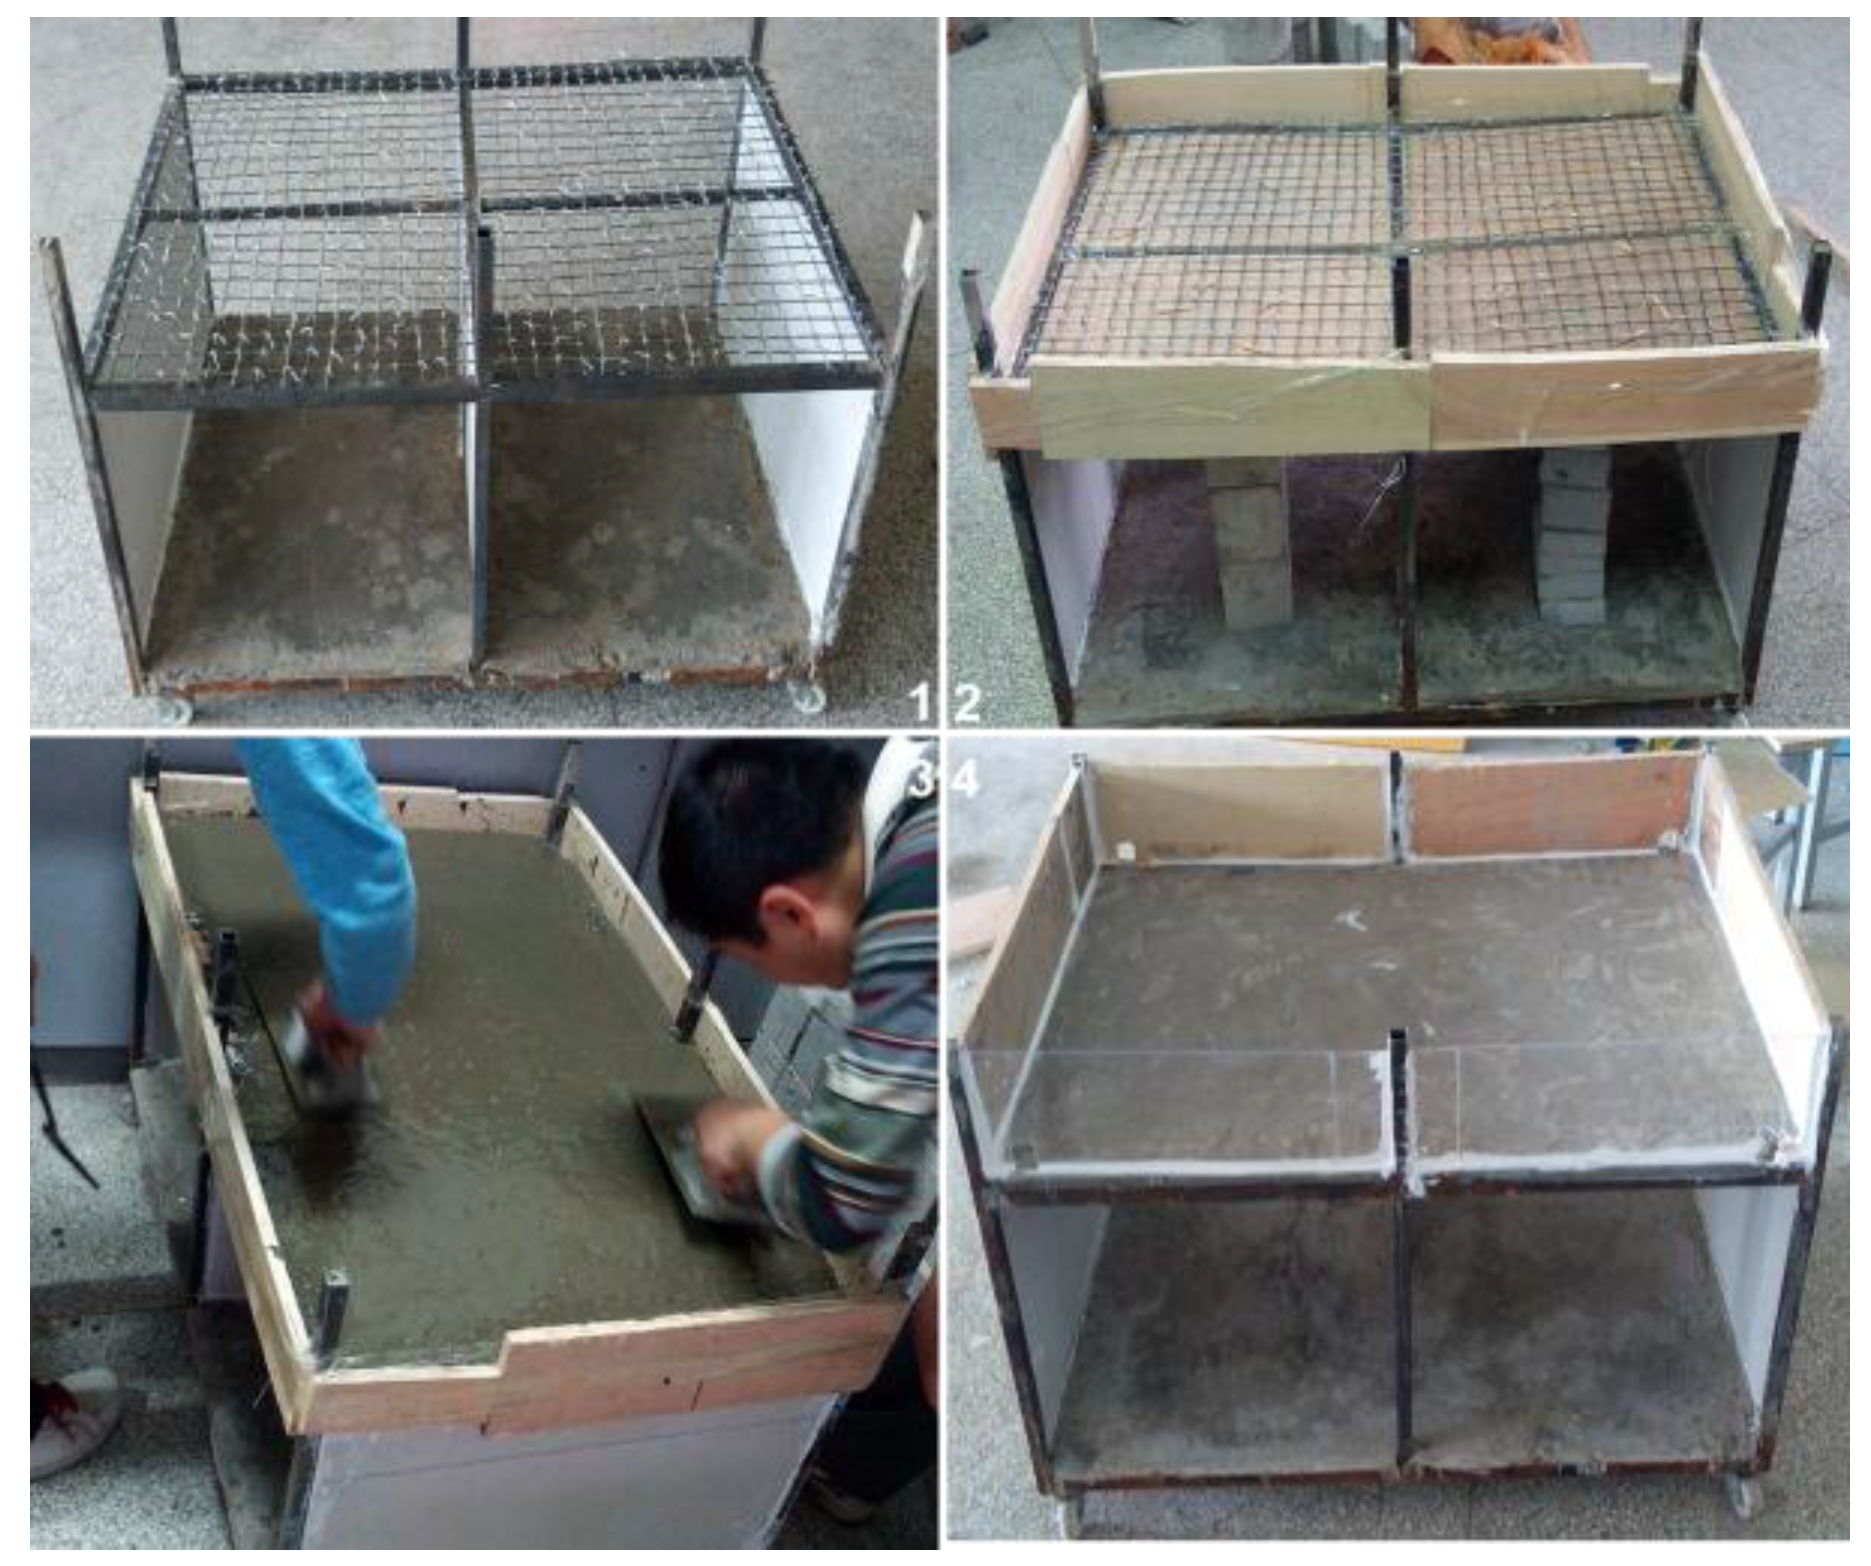
A simulation experiment platform representing northwest parapet flat-roofed houses was used for the test model. The model was scaled by 1:8 and had similar materials, mechanics, geometry, and had the following dimensions: 1000 mm length, 650 mm width, and 400 mm height (Figure 2). The test model contained two adjacent contrast test rooms each with an area of 0.325 m2. The steel structural framework consisted of constructional columns and ring beams using #20 square concrete-filled steel tubes. The roof and floor were made of cast-in-place reinforced concrete slab with a thickness of 12.50 mm. Its assembly is shown in Figure 3. Walls were made of fiber concrete slab with an exterior wall thickness of 38 mm and interior wall thickness of 25 mm. The underside of the upper roof space had natural ventilation so that its surface temperature directly reflected the effects of roof insulation. It should be emphasized that an attempt was made to ensure the differential thermal behavior between the test model rooms with and without greening.
2.4. Establishment of Irrigation System
The extensive green roof system with light, insulation, and greening layer structure consisted of a rainwater collection subsystem and automatic irrigation subsystem and could implement rainwater collection, storage and irrigation during the dry seasons found in Lanzhou [21] (Figure 4).
The green roof container assembly consisted of a polypropylene frame (220 mm deep) with a 6 mm watertight high impact polypropylene (HIPP) sheet serving as the tray (Figure 4). Based on technical specifications for green roofs [22], the lightweight media was a mixture of rural soil (30%, sawdust (40%), and fine sand (30%). Additional media characteristics were as follows: 950 kg/m3 saturated water density, 25% organic content, 65% total porosity, 30% effective moisture, 60 mm/h drainage rate, 60 mm soil layer depth [22]. Both the storage layer and the drainage layer were settled at the bottom of the green roof container. The storage layer can be used to conserve water for vegetation. Simulated rain water was not stored until internal water levels fell to contact the control probe, and was not recharged until soil moisture fell below 20% (m3 water/m3 soil).
2.5. Set-up of Monitoring Instrument
Monitoring was conducted during July 2014. Thermodetectors were installed in the internal surface for set-ups with and without the green roof (Figure 4). Data were collected using Elitech Elitech RC-4 temperature data loggers with a multifunction liquid crystal display alarm indicator (Elitech Corp., Milpitas, California, CA, USA) with an internal probe (Elitech Corp., Milpitas, California, CA, USA) temperature range of −30 to 60 °C, external probe (Elitech Corp., Milpitas, California, CA, USA) temperature range of −49 to 85 °C, accuracy of ±1 °C, and resolution of 0.10 °C. Data were recorded at 15 minute intervals and retrieved for processing in Excel spreadsheets. Other climate parameters including humidity, wind speed, and rainfall, were gathered using a WE800 mini-meteorological station (Global Water Corp., College Station, TX, USA). Infrared thermography of sprinkler irrigation and non-sprinkler irrigation areas were measured with a YRH600 infrared thermal imager (Fengte Corp., Guangzhou, China), and were analyzed using SatIrReport software (Fengte Corp., Guangzhou, China).
2.6. Statistical Analysis
All data were analyzed using an ANOVA model by SPSS 13.0 (IBM, Corp., Armonk, NY, USA). Data were checked to ensure ANOVA assumptions were not violated and were transformed appropriately when needed prior to analysis. Figures were drawn using Origin 9.0 (OriginLab Corp., Northampton, MA, USA).
3. Results and Discussion
3.1. Drought Tolerance
The three plant species installed in the water-scarce region may be exposed to stress as a result of prolonged periods without precipitation. To look into the plants’ performance under such conditions, limits on irrigation and restrictions on the use of potable water were investigated. Figure 5 shows the effects of the withdrawal of irrigation from previously healthy plants for a period of 40 days. A tray with Aptenia cordifolia (Figure 5) survived this extended drought in fairly good health. It is estimated that this plant could have survived for several more weeks. All other tested plant species, including Sedum lineare, did not survive the 40-day drought period.
3.2. Comparison of the Effect of Green Roofs on Temperature
Figure 6 shows the changes of the internal temperatures of models with and without a green roof, as influenced by the outside climate. The moisture state of the soil and the plants, which directly affects the heat transfer to the roof, were affected by the change in climate-related parameters, resulting in variable temperature recordings.
The internal temperature of the building, a comprehensive natural indoor temperature, is formed from heat transformation at each part of the building envelope. It can be seen that the internal temperatures with green roofs were lower than without green roofs, and had much smaller temperature variations daily. This means that the green roof set-up fully showed the cooling effect on indoor thermal environments. On the contrary, internal temperature on the non-green roof set-up had larger temperature variations. The temperature variations can be directly related to the weather (i.e. the variations on a sunny day will be bigger). The indoor temperature in a non-green roof set-up was higher than that in a green roof set-up on a hot sunny day where the highest temperature can reach up to 57.7 °C, higher than that in the green roof set-up under the same conditions. However, there was no evident difference in internal temperature between non-green roof and green roof set-ups during rainy days.
Therefore, the research’s emphasis was to investigate the roof insulation’s ability under high temperature conditions. During the experiment, the point data was 1000 times. Using 2 °C as step length, it was divided into 13 time intervals from 33 to 59 °C.
The distribution frequency of each interval is as follows:
where i = 33, 35, 37, 39, 41, 43, 45, 47, 49, 51, 53, 55, 57, 59 (°C); P is the distribution frequency within (i,i + 1.9) temperature interval (%); N is the test number (1000); and n is the occurrence number in (i,i + 1.9) interval.
The distribution number and frequency of each test point using Equation (1) is shown in Table 1. Table 1 shows that 34 °C of the highest outside temperature distributed in one temperature interval; 37.5 °C of the highest internal temperature with green roof distributed in five temperature intervals; 57.7 °C of the highest internal temperature without green roof distributed in 13 temperature intervals. All results of the exceeding 28 °C temperature frequency show that the outside temperature frequency was 44.10%, the internal temperature frequency with green roof was 60.00%, and the internal temperature frequency without green roof was 69.10%.
Table 1 shows that the highest distribution frequencies were recorded at the following temperature intervals: 33–34.9 °C interval for outside temperature; 35–36.9 °C interval for the internal temperature with the green roof; and 51–52.9 °C interval for the internal temperature without the green roof. It is worth noting that the frequencies were distributed at each temperature interval for the internal temperature without the green roof.
People feel more comfortable when the surface temperature is less than 33 °C [23]. Table 1 shows that the highest occurrence frequency for temperature recordings less than 33 °C occurred on the recording for internal surface temperature with green roofs at 91.8%, while the occurrence frequency without green roofs was only 84.20%. Obviously, the distribution frequency with green roofs is 0.8 times than that of non-green roofs. However, the distribution frequency of uncomfortably high temperature (i.e., exceeding 35 °C) mainly appeared on the recordings for internal surfaces without green roofs, where the high temperature can reach up to 57.7 °C.
39 °C is a turning point. When the temperature is less than 39 °C, the temperature distribution frequency for both green and non-green roof set-ups were almost higher than the outside temperature. This suggests that the two set-ups have a certain ability to insulate heat. On the other hand, the two set-ups have different tendencies when the temperature is higher than 39 °C. The frequency for the green roof fell sharply and stopped at the 41–42.9 °C temperature range (only 0.1% of the total number), and was lower than the frequency for the outside air temperature. This shows that the green roof set-up had better thermal insulation. However, the frequency without green roofs decreased much more slowly, its frequency was much higher than the outside temperature and green roofs, especially under the extreme high temperature range (i.e., exceeding 40 °C), where the frequency without green roof emerged 120 times (12% of the total number).
The total frequency at the 15–59 °C temperature range was set to 100%. From this, 91.8% of internal surface temperature with green roofs fell into the low temperature area (i.e., less than 33 °C) while the internal surface temperature with green roofs appeared only 53 times in the high temperature area (i.e., exceeding 35 °C). On the other hand, the internal surface temperature without green roofs appeared 135 times in the high temperature area.
The obtained results confirm that the thermal insulation of green roofs was very effective, which coincides with a series of the previous experimental results, showing that green roofs can reduce the heating loads of residential buildings. For example, Getter et al. [24] quantified that the monthly average values over the course of the year were consistently higher for a gravel-ballasted roof than a green roof, with values up to 20 °C warmer during summer. Qin et al. [25] showed that a green roof test-bed can reduce the internal air temperature by an average value of 0.5 °C if compared with a bare roof.
3.3. Statistical Test and Variance Analysis
Through statistical analysis of the raw data from Table 1, the statistical description of each group (A for outside temperature, B for internal temperature frequency with green roof, C for internal temperature frequency without green roof), statistical tests (Table 2) and variance analysis (Table 3) are given below.
Table 2 shows that there is a significant difference between group B and group C (0.026228 < 0.05). It also shows that there is a significant difference between group B and group A—between greening facilities and outside temperature (0.036636 < 0.05). The results are consistent with the results in Table 1.
3.4. Infrared Thermal Imaging of Plants and Analysis
To study the transpiration process of green plants and the optimum conditions of heat insulation in summer under sprinkler irrigation, infrared thermography was performed once every half an hour for two hours.
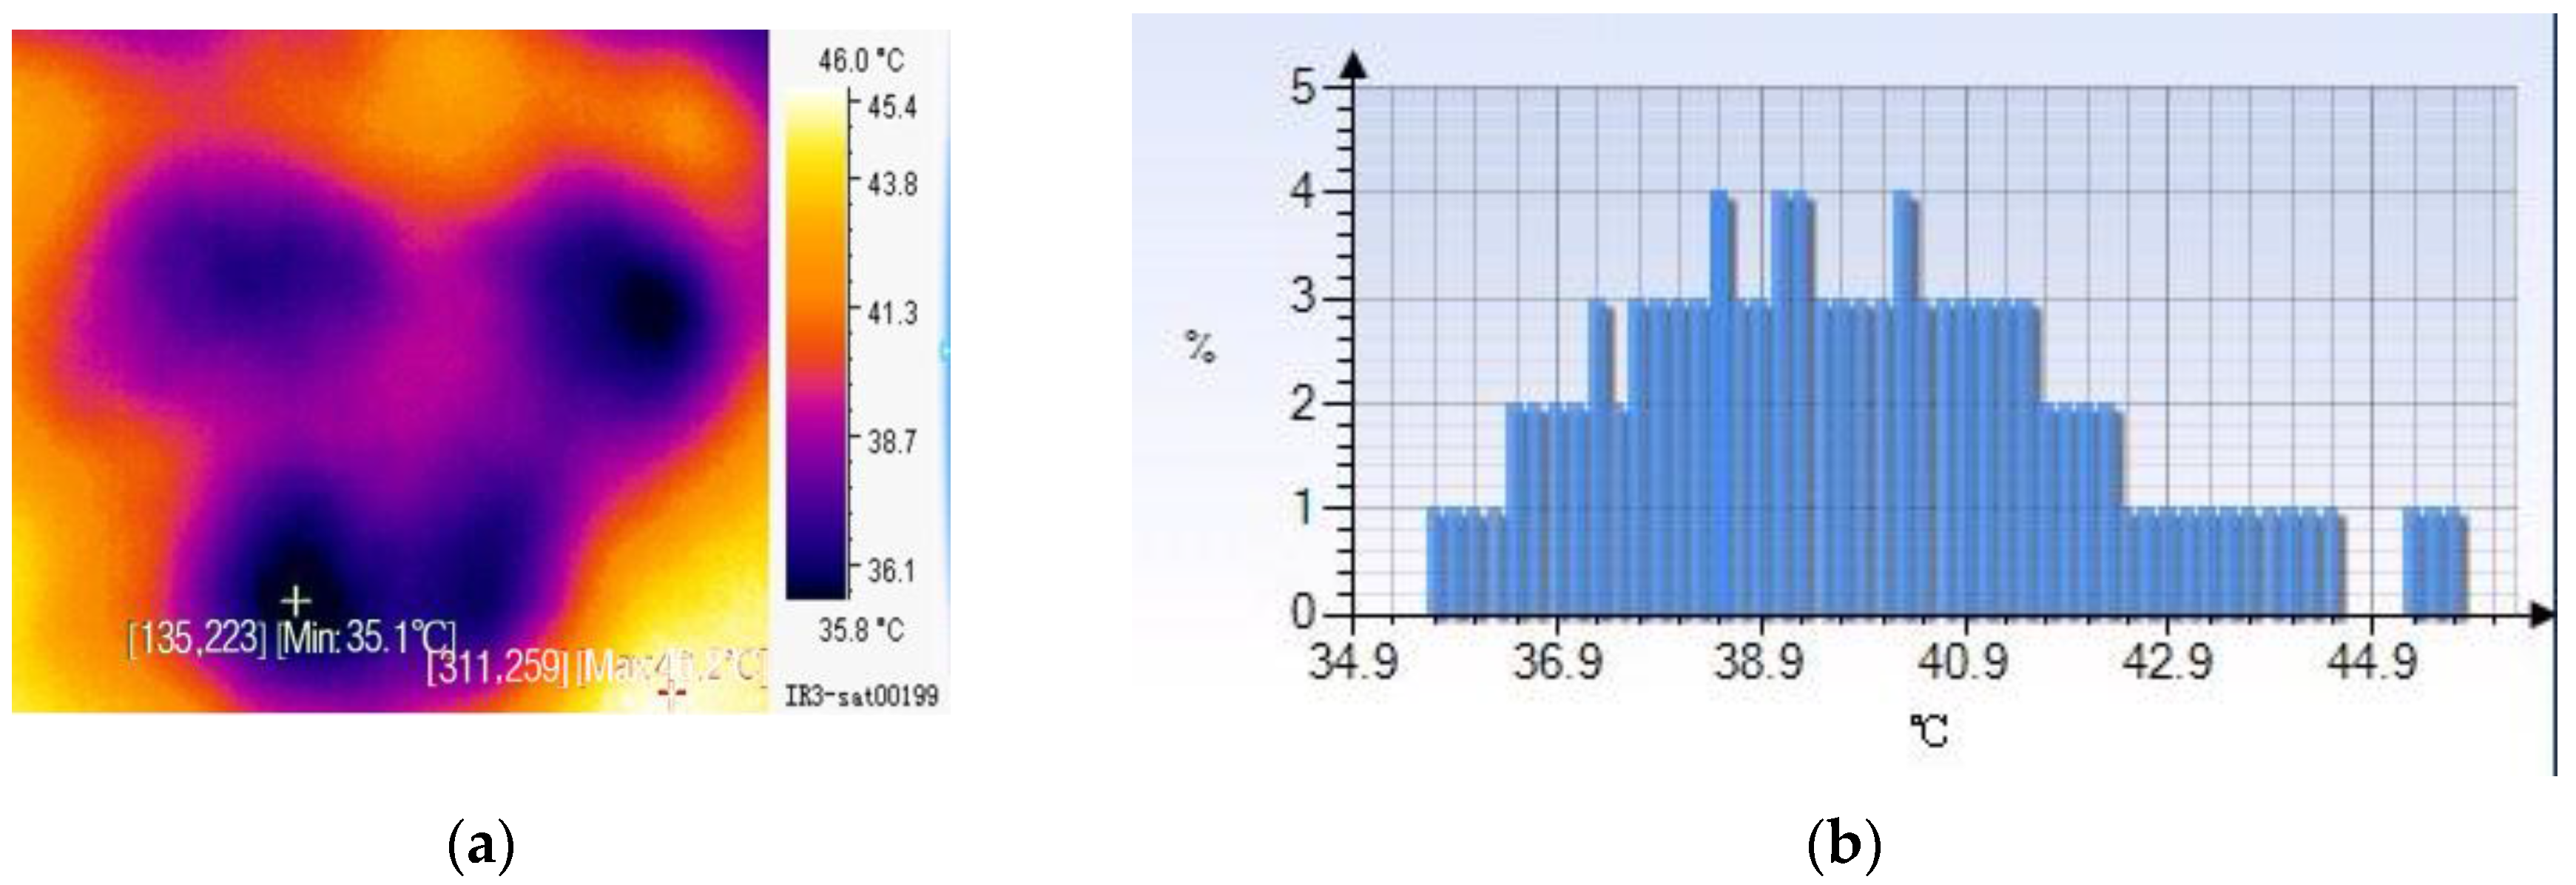
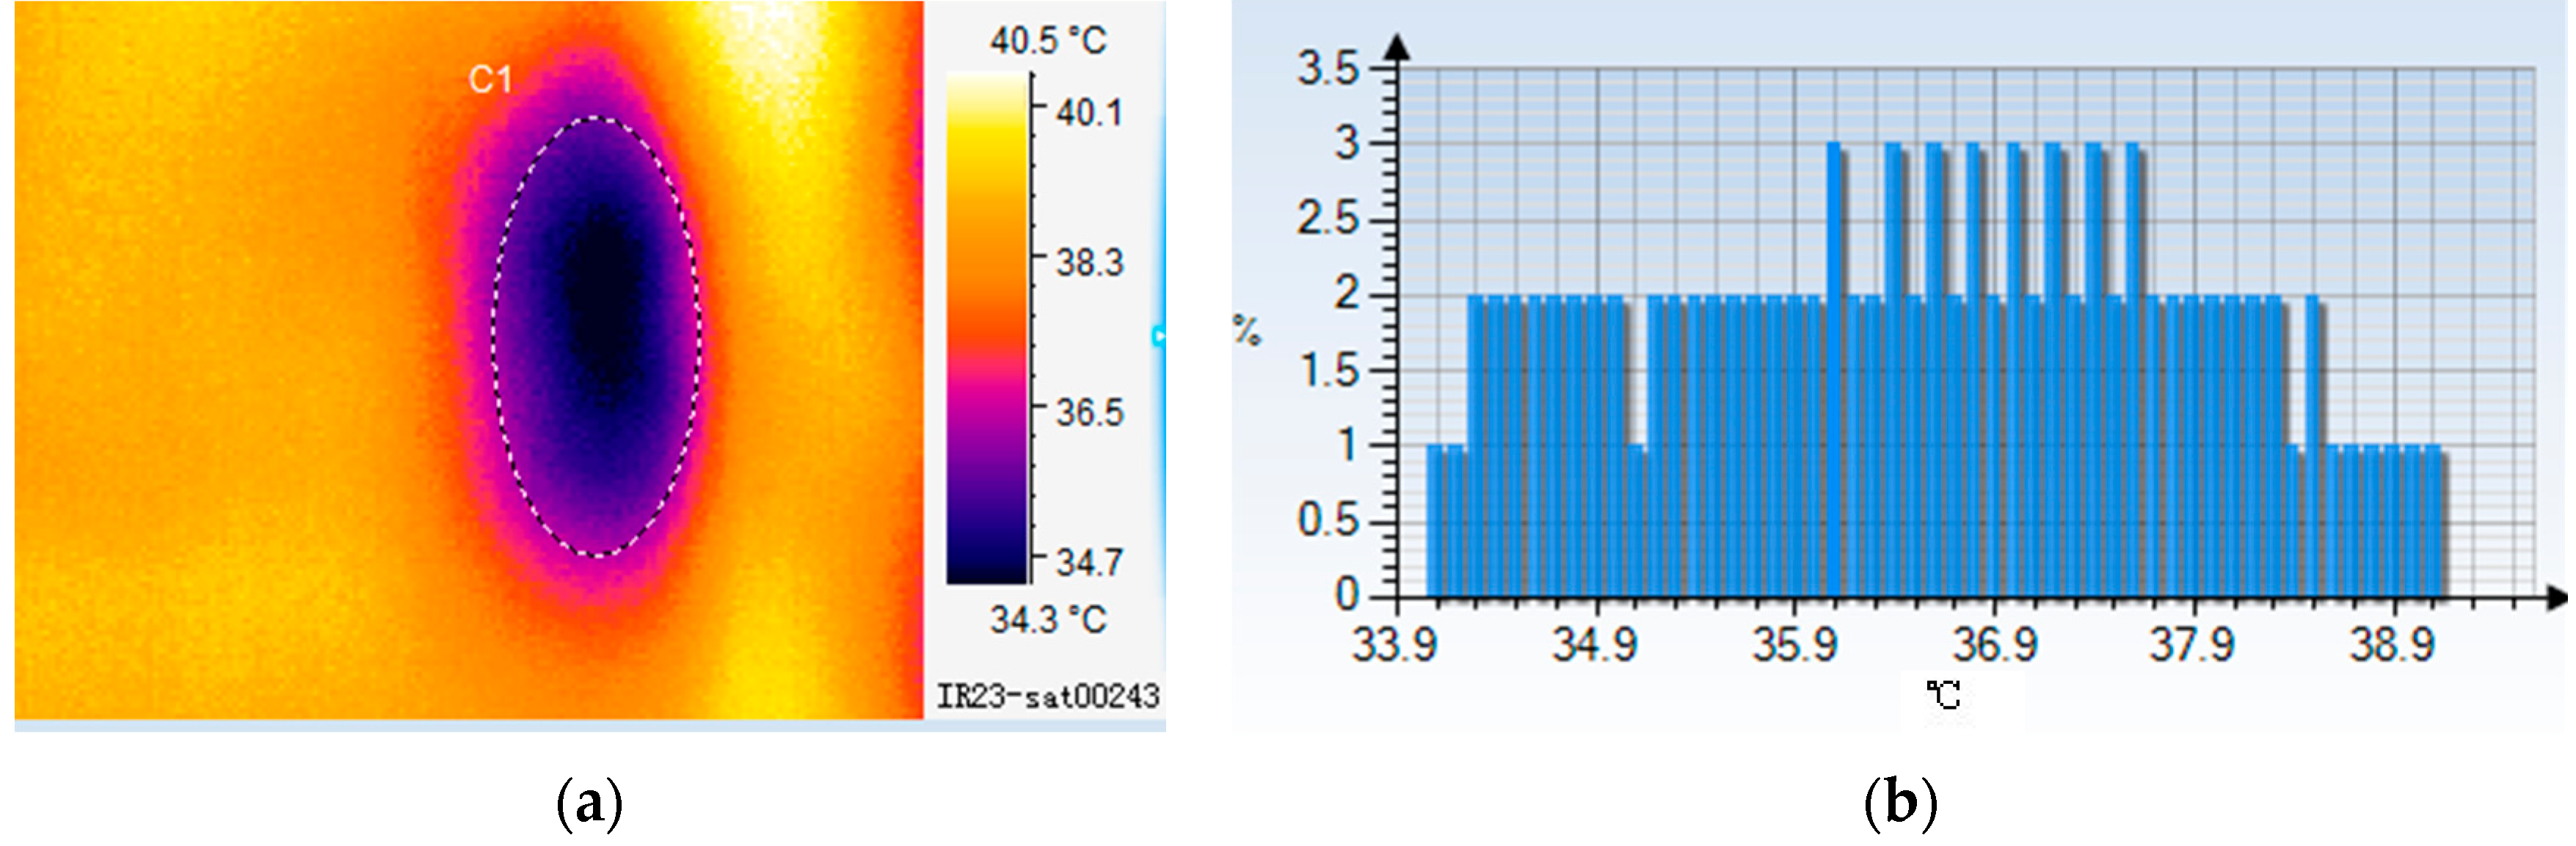
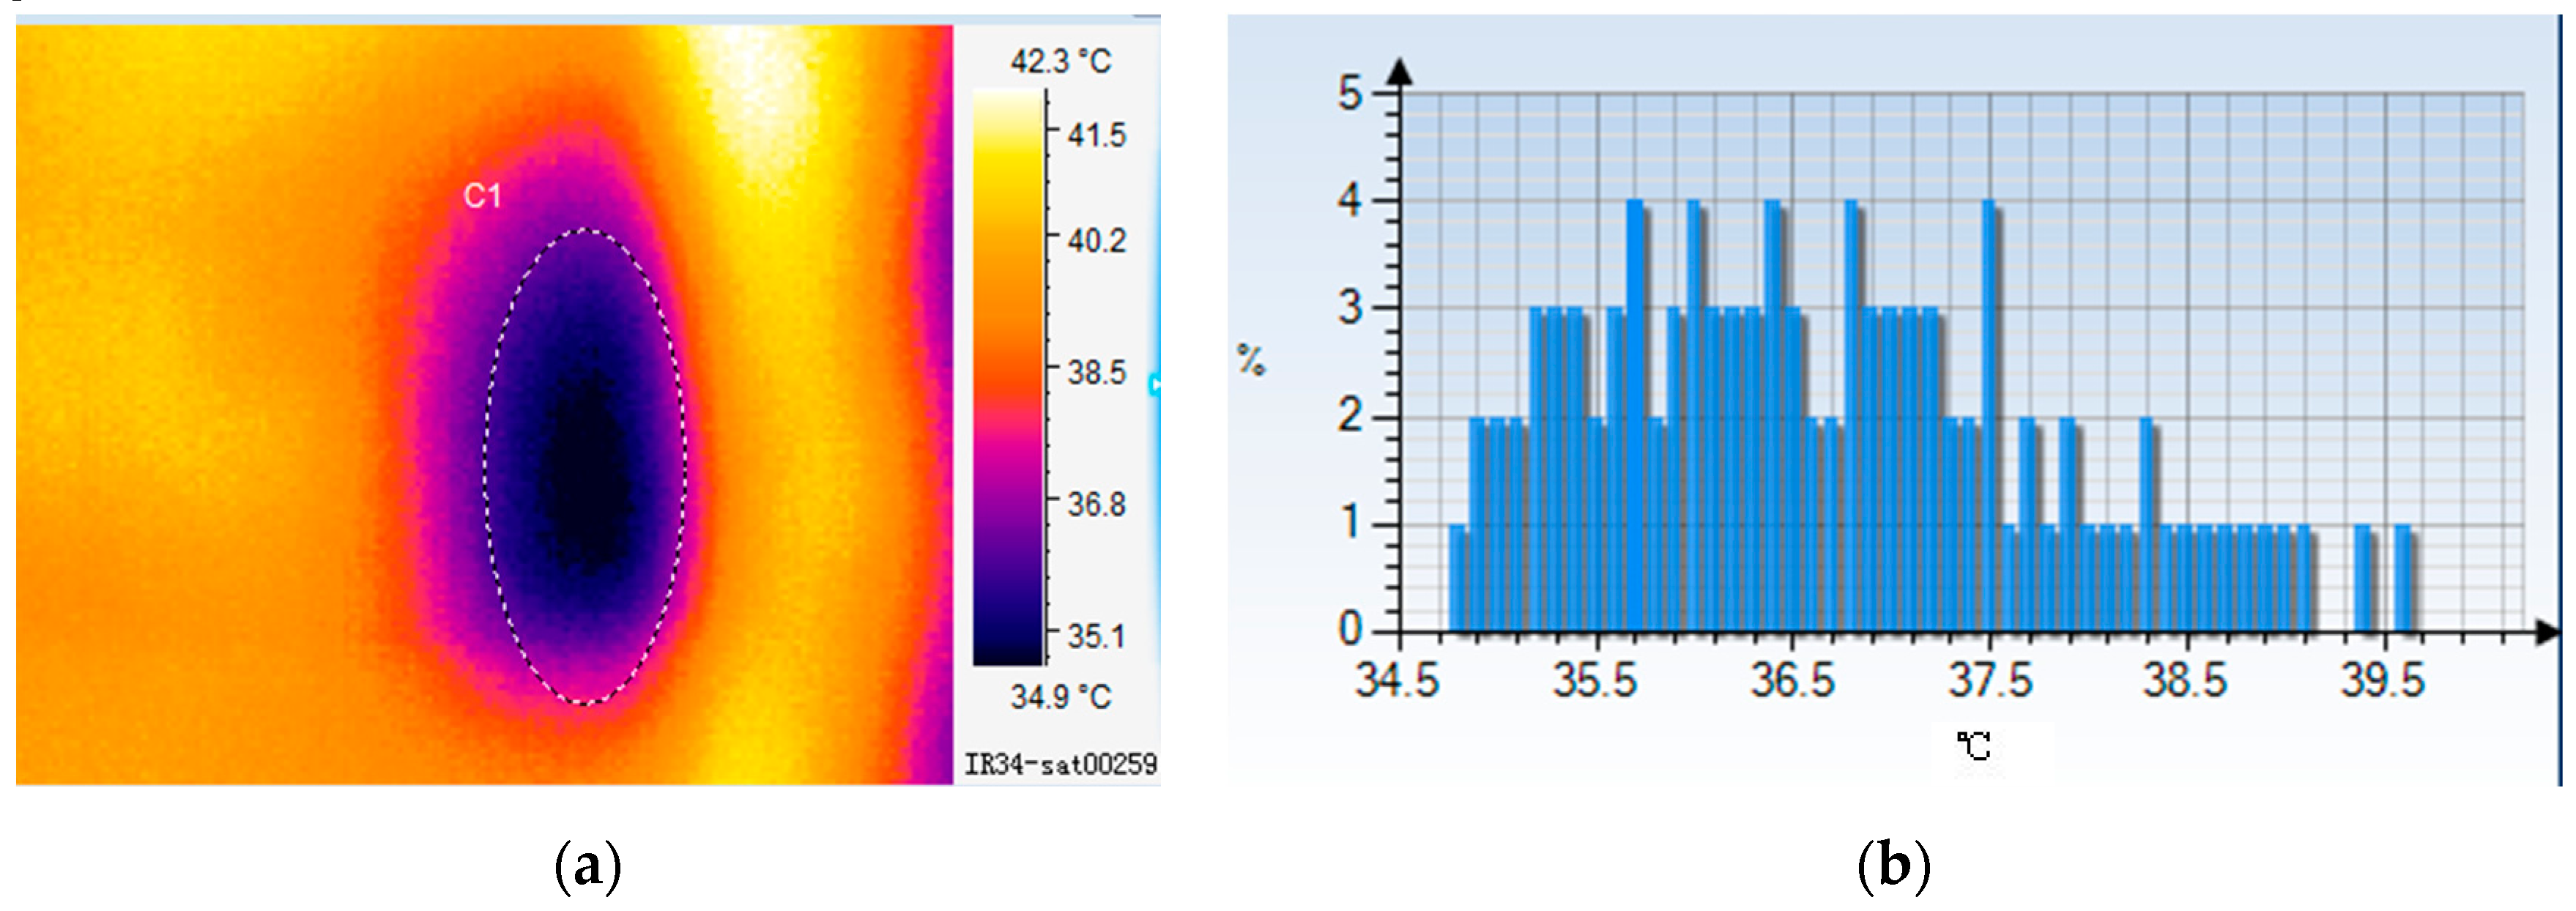
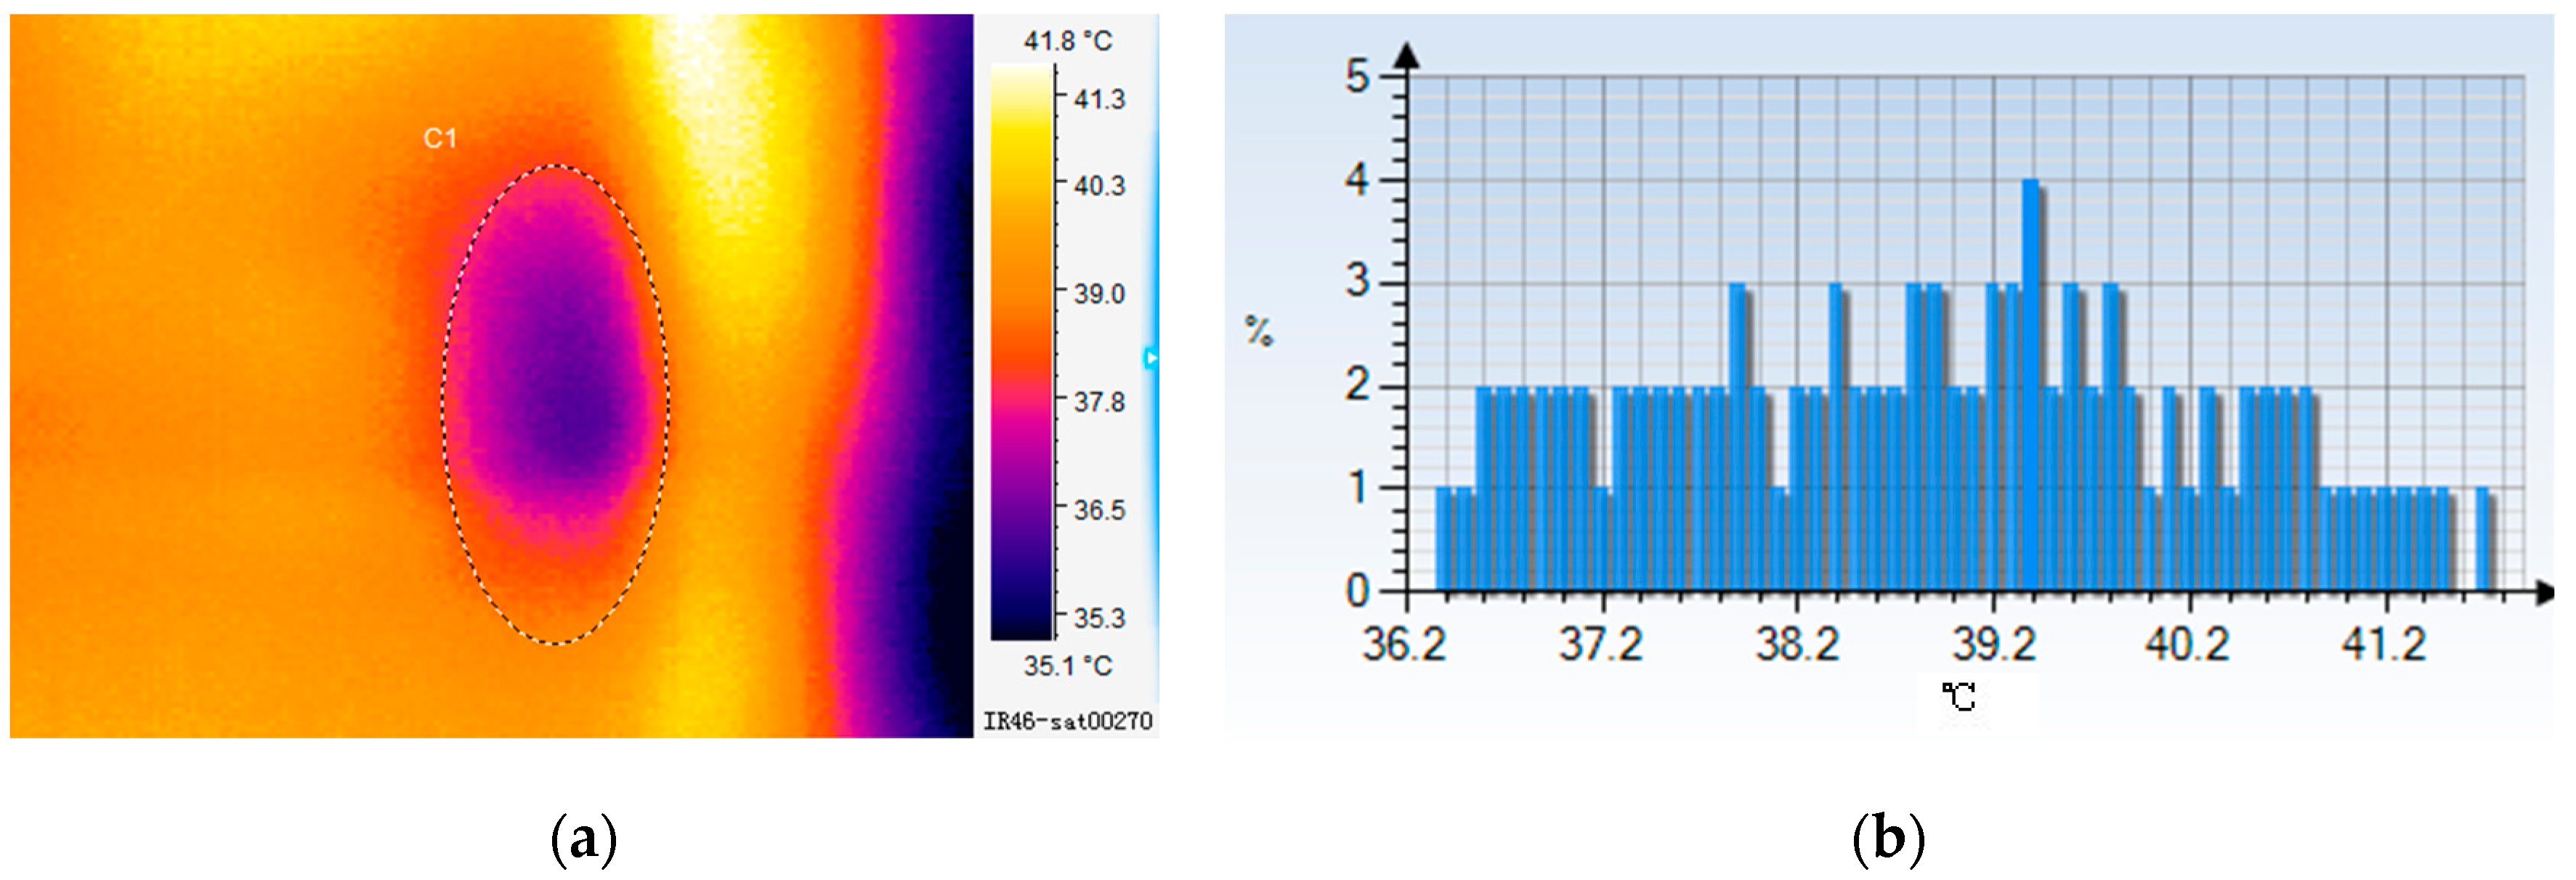
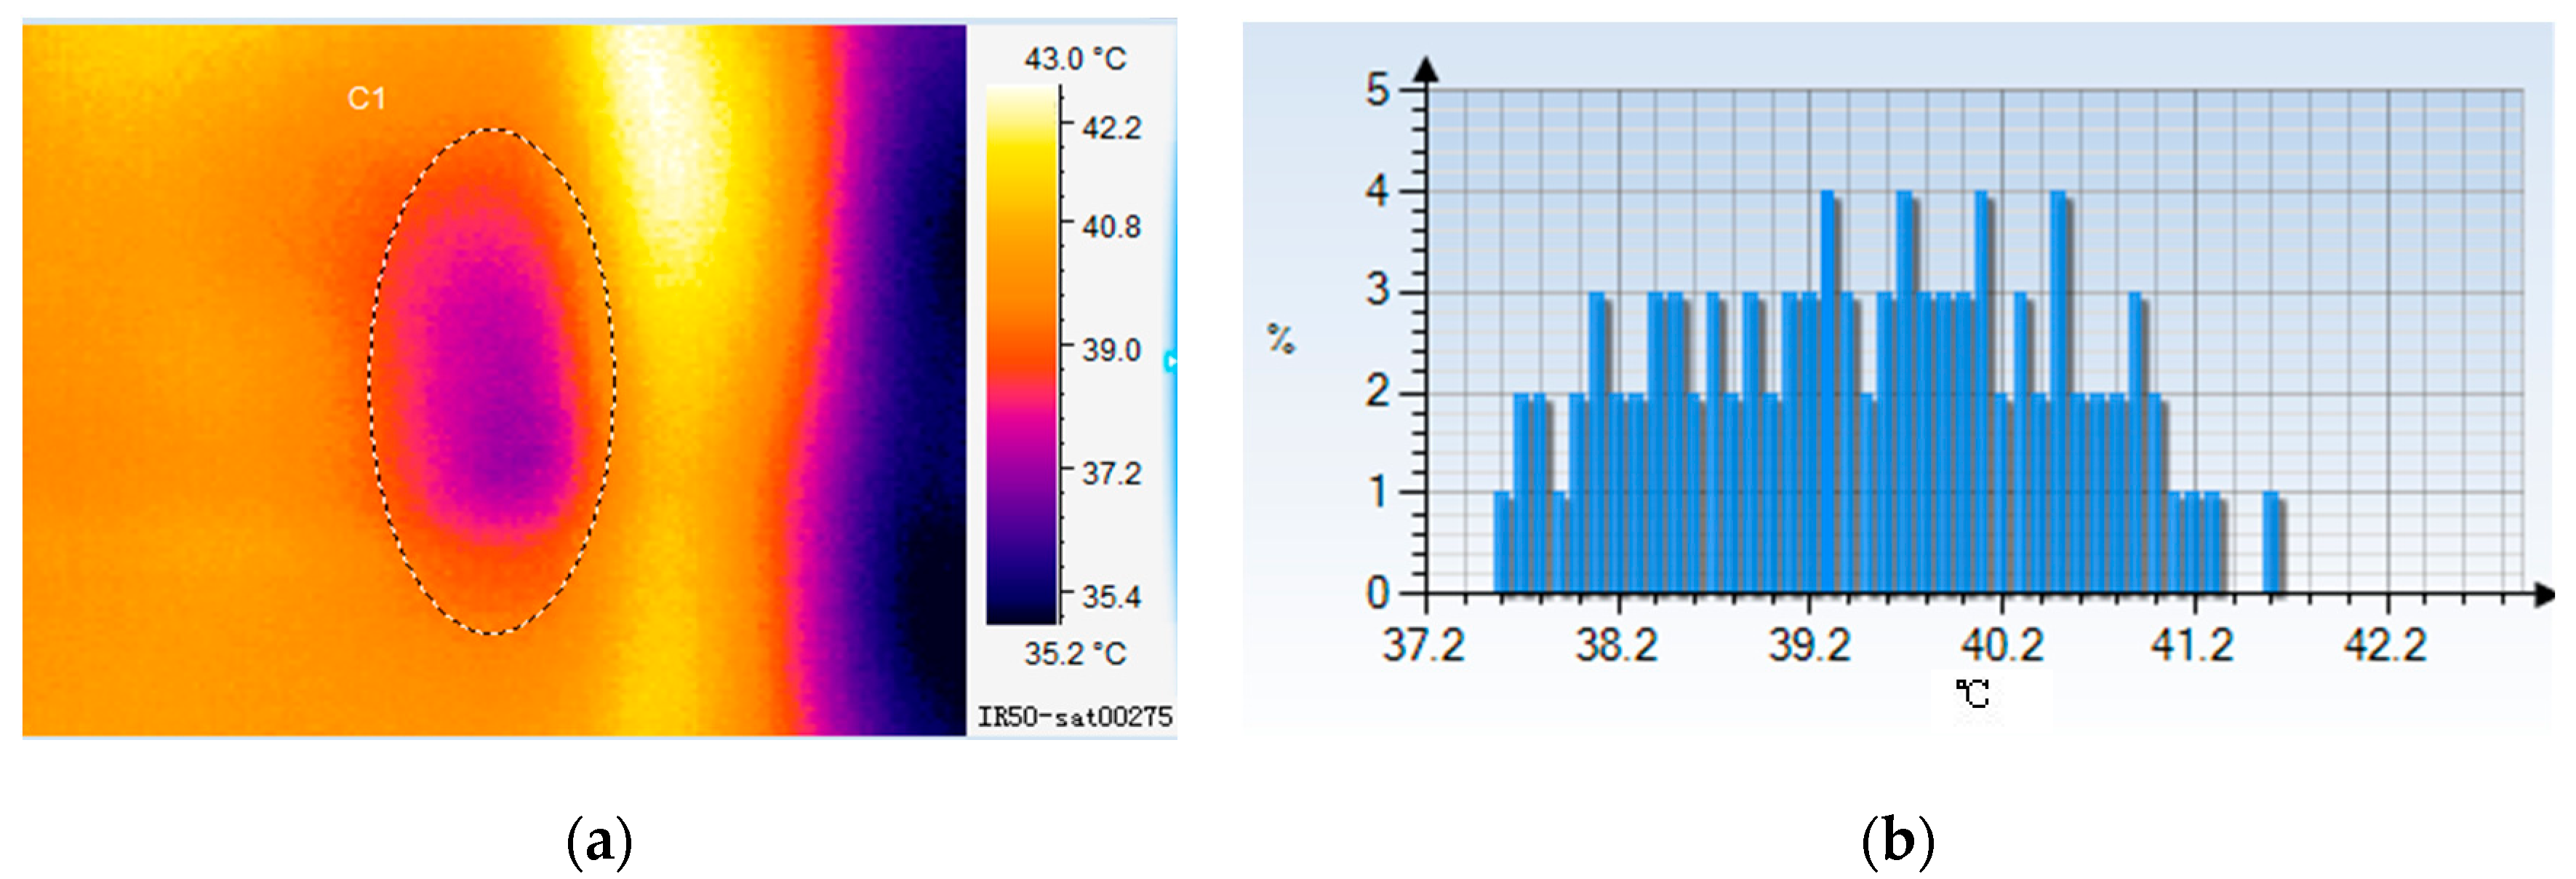
During the long-term high temperature before irrigation, the temperatures of the plant surface began to rise rapidly, and the temperature field was between 42.5 and 48.5 °C (Figure 7). The main reason for the temperature rise is that the water content on the plant surface evaporated completely, as well as plant transpiration decreasing rapidly, and the leaf entered the dormant state again after it reached the critical state. After further irrigation, the temperature of the leaves decreased obviously, and the temperature field was between 36.9 and 40.9 °C (Figure 8). The leaves received moisture, meanwhile, the surface transpiration took away a lot of heat when the stomata of the leaves were opened, so that the surface temperature dropped again. Then, after half an hour of irrigation, the temperature field was between 34.9 and 37.9 °C (Figure 9), with leaf transpiration occurring continually. After that, after half an hour of irrigation, the temperature field was between 36.2 and 40.2 °C (Figure 10). At this time, the transpiration of leaves entered the most intense period, the average temperature of the leaf surface only increased by 1 °C when the environmental temperature rose by 1.7 °C. Later, after 1.5 h of irrigation, the temperature field was between 37.2 and 41.2 °C (Figure 11). At this time, due to insufficient water supply, the leaf surface temperature increased rapidly with the reduction of leaf transpiration. In the end, after two hours of irrigation, the temperature field was between 38.2 and 41.2 °C (Figure 12). At this time, the leaves of the plant basically entered dormancy, and the leaf surface temperature was close to the environmental temperature.
Under the high temperatures in summer, the leaves of the plant enter the dormancy state. When the leaf surface is sprayed with water, the temperature of the leaves drops and then the surface stomata opens, and the transpiration stage begins [26,27]. The leaves enter the dormancy state again, as well as water on the leaf surface evaporating [28]. After irrigation, the transpiration began to weaken with the increase of temperature, and then the leaves became dormant and transpiration disappeared when the temperature reached 40 °C; this entire process took about 1.5 h, thus the greening plants have better insulation within 1.5 h, though the insulation effect dropped dramatically after more than two hours.
4. Conclusions
In climates with extended hot and dry seasons, such as in the northwest arid areas located in the Loess Plateau in China, the installation of green roofs may prove beneficial only if appropriate plants are selected. The proper selection of plants will allow the green roof to survive extended dry periods through rainwater collection and automatic irrigation. Three local plant species were selected for the drought resistance experiments to choose the suitable local greening plants. The study showed that Aptenia cordifolia was capable of surviving extended dry periods in fairly good health. An automatic irrigation system was designed to sustain the roofs through an extended dry period.
Through the statistical analysis method, the measured data were used in the statistical description and variance analysis. The results showed that (1) the occurrence frequency of the internal surface temperature below 33 °C for green roofs was 91.8%, and it was 1.09 times higher than that of the internal surface temperature without green roofs; (2) the sum of the internal surface temperature exceeding 35 °C was about one third of that for roofs without greening plants and showed that the green roof showed obvious insulation performance, which became more significant as temperatures rose; (3) the non-green roof set-up had a more sensitive response to outside temperature changes, as exemplified by the rapid increase in the internal surface temperature with the increase of outside temperature. Frequencies were also recorded for each temperature range where the highest temperature could reach up to 57.7 °C; where people could feel uncomfortable in a room without a green roof, which is bound to increase the energy consumption. Also, green roofs have a strong temperature control function as exemplified by the relatively slow internal temperature response. This characteristics also means that the internal surface temperature is relatively stable.
Through monitoring of the plant temperature and heat insulation before and after irrigation, the results showed that timely irrigation can improve insulation performance, which is better within two hours of irrigation.
Although this system might be more sensitive to water scarcity and thermal conduction on reduced-scale models than on full-scale roofs due to spatial heterogeneity effects, it allows us to assess/verify the function of green roofs in dry areas. The automatic irrigation subsystem according to the soil moisture content can make up for the influence of the drought climate on greening plants.
Extensive green roofs are a proven technology in temperate or tropical countries, but there are many barriers to the implementation of such roofs in the arid regions of northwest China with dry climates. Further research is required to solve the vegetation survival in the cold winter, and to quantify the actual benefits, conduction and others. It is clear that green roofs must be designed with great care in accordance with the local climate: they may not, in fact, be an appropriate environmental response in all conditions.
Acknowledgments
This study was co-funded by the National Key Technologies R&D Program (No. 2015BAL02B05); and the Priority Academic Program Development of Jiangsu Higher Education Institutions; the University Scientific Research Project of Gansu Province (2016B-026); the National Natural Science Foundation of China: (No. 51650410657). We thank Jeffrey Johnson (Department of Biological and Agricultural Engineering, North Carolina State University, Raleigh, NC 27695, United States; [email protected]), who carried out the English editing and proofreading.
Author Contributions
Yajun Wang and Dafang Fu conceived and designed the experiments; Fang Zhou performed the experiments; Yajun Wang and Junyu Zhang analyzed the data; Yajun Wang, Dafang Fu and Rajendra Prasad Singh contributed reagents/materials/analysis tools; Yajun Wang and Rajendra Prasad Singh wrote the paper.
Conflicts of Interest
The authors declare no conflict of interest.
References
- Walsh, C.J.; Fletcher, T.D.; Ladson, A.R. Stream restoration in urban catchments through redesigning stormwater systems: looking to the catchment to save the stream. J. N. Am. Benthol. Soc. 2005, 24, 690–705. [Google Scholar] [CrossRef]
- Wang, G.; Cheng, G. The characteristics of water resources and the changes of the hydrological process and environment in the arid zone of northwest China. Environ. Geol. 2000, 39, 783–790. [Google Scholar] [CrossRef]
- Wang, Y.; Chang, Y. Drinking water technology of rural housing rainwater treatment at arid regions of northwest China. Chin. J. Environ. Eng. 2014, 8, 1021–1024. [Google Scholar]
- Xiao, G.; Wang, J. Research on progress of rainwater harvesting agriculture on the Loess Plateau of China. Acta Ecol. Sin. 2003, 23, 1003–1011. [Google Scholar]
- Payne, E.G.I.; Hatt, B.E.; Deletic, A. Adoption Guidelines for Stormwater Biofiltration Systems; Cooperative Research Centre for Water Sensitive Cities: Melbourne, Australia, 2015. [Google Scholar]
- Jim, C.Y. Building thermal-insulation effect on ambient and indoor thermal performance of green roofs. Ecol. Eng. 2014, 69, 265–275. [Google Scholar] [CrossRef]
- Teemusk, A.; Ülo, M. Temperature regime of planted roofs compared with conventional roofing systems. Ecol. Eng. 2010, 36, 91–95. [Google Scholar] [CrossRef]
- Niachou, A.; Papakonstantinou, K.; Santamouris, M.; Tsangrassoulis, A.; Mihalakakou, G. Analysis of the green roof thermal properties and investigation of its energy performance. Energy Build. 2001, 33, 719–729. [Google Scholar] [CrossRef]
- Mellor, R.S.; Salisbury, F.B.; Raschke, K. Leaf temperatures in controlled environment. Planta 1964, 61, 56–72. [Google Scholar] [CrossRef]
- Costanzo, V.; Evola, G.; Marletta, L. Energy savings in buildings or UHI mitigation? Comparison between green roofs and cool roofs. Energy Build. 2016, 114, 247–255. [Google Scholar] [CrossRef]
- Sailor, D.J. A green roof model for building energy simulation programs. Energy Build. 2008, 40, 1466–1478. [Google Scholar] [CrossRef]
- Pianella, A.; Lu, A.; Chen, Z.; Williams, N. Substrate Depth, Vegetation and Irrigation Affect Green Roof Thermal Performance in a Mediterranean Type Climate. Sustainability 2017, 9, 1451–1470. [Google Scholar] [CrossRef]
- Ascione, F.; Bianco, N.; Rossi, F.D.; Turni, G.; Vanoli, G.P. Green roofs in European climates. Are effective solutions for the energy savings in air-conditioning? Appl. Energy 2013, 104, 845–859. [Google Scholar] [CrossRef]
- Attivissimo, F.; Di Nisio, A.; Carducci, C.G.; Spadavecchia, M. Fast Thermal Characterization of Thermoelectric Modules Using Infrared Camera. IEEE Trans. Instrum. Meas. 2017, 66, 305–314. [Google Scholar] [CrossRef]
- Santamouris, M.; Pavlou, C.; Doukas, P.; Mihalakakou, G.; Synnefa, A.; Hatzibiros, A.; Patargias, P. Investigating and analysing the energy and environmental performance of an experimental green roof system installed in a nursery school building in Athens, Greece. Energy 2007, 32, 1781–1788. [Google Scholar] [CrossRef]
- Monteiro, C.M.; Calheiros, C.S.; Martins, J.P.; Costa, F.M.; Palha, P.; De Freitas, S.; Ramos, N.M.; Castro, P.M. Substrate influence on aromatic plant growth in extensive green roofs in a Mediterranean climate. Urban Ecosyst. 2017, 1–11. [Google Scholar] [CrossRef]
- Berardi, U.; Ghaffarianhoseini, A.H.; Ghaffarian Hoseini, A. State-of-the-art analysis of the environmental benefits of green roofs. Appl. Energy 2014, 115, 411–428. [Google Scholar] [CrossRef]
- Lu, J.; Yuan, J.G.; Yang, J.Z.; Chen, A.K.; Yang, Z.Y. Effect of substrate depth on initial growth and drought tolerance of sedum lineare, in extensive green roof system. Ecol. Eng. 2015, 74, 408–414. [Google Scholar] [CrossRef]
- Fleta-Soriano, E.; Pinto-Marijuan, M.; Munne-Bosch, S. Evidence of Drought Stress Memory in the Facultative CAM, Aptenia cordifolia: Possible Role of Phytohormones. PLoS ONE 2015, 10, 1–12. [Google Scholar] [CrossRef] [PubMed]
- Nektarios, P.A.; Ntoulas, N.; Nydrioti, E. Turfgrass use on intensive and extensive green roofs. Acta Hortic. 2012, 938, 121–128. [Google Scholar] [CrossRef]
- Yan, F.X. Analysis and research of utilization status and existing problems of Lanzhou city water resources. Gansu Water Resour. Hydropower Technol. 2012, 48, 11–13. [Google Scholar]
- Ministry of Housing and Urban-Rural Development of the People’s Republic of China. Technical Specification for Green Roof; China Architecture & Building Press: Beijing, China, 2005. (In Chinese)
- Watkins, R.; Palmer, J.; Kolokotroni, M. Increased temperature and intensification of the urban heat island: implications for human comfort and urban design. Built Environ. 2007, 33, 85–96. [Google Scholar] [CrossRef]
- Getter, K.L.; Rowe, D.B.; Andresen, J.A.; Wichman, I.S. Seasonal heat flux properties of an extensive green roof in a Midwestern US climate. Energy Build. 2011, 43, 3548–3557. [Google Scholar] [CrossRef]
- Qin, X.; Wu, X.; Chiew, Y.M.; Li, Y. A green roof test bed for stormwater management and reduction of urban heat island effect in Singapore. Br. J. Environ. Clim. Chang. 2012, 2, 410–420. [Google Scholar] [CrossRef] [PubMed]
- Beerling, D.J.; Chaloner, W.G. The Impact of Atmospheric CO2 and Temperature Changes on Stomatal Density: Observation from Quercus robur Lammas Leaves. Ann. Bot. 1993, 71, 231–235. [Google Scholar] [CrossRef]
- Brewer, C.A.; Smith, W.K. Leaf surface wetness and gas exchange in the pond lily nuphar polysepalum (nymphaeaceae). Am. J. Bot. 1995, 82, 1271–1277. [Google Scholar] [CrossRef]
- Wolf, D.; Lundholm, J. Water uptake in green roof microcosms: effects of plant species and water availability. Ecol. Eng. 2008, 33, 179–186. [Google Scholar] [CrossRef]
Figure 1.
Test value of daily average.
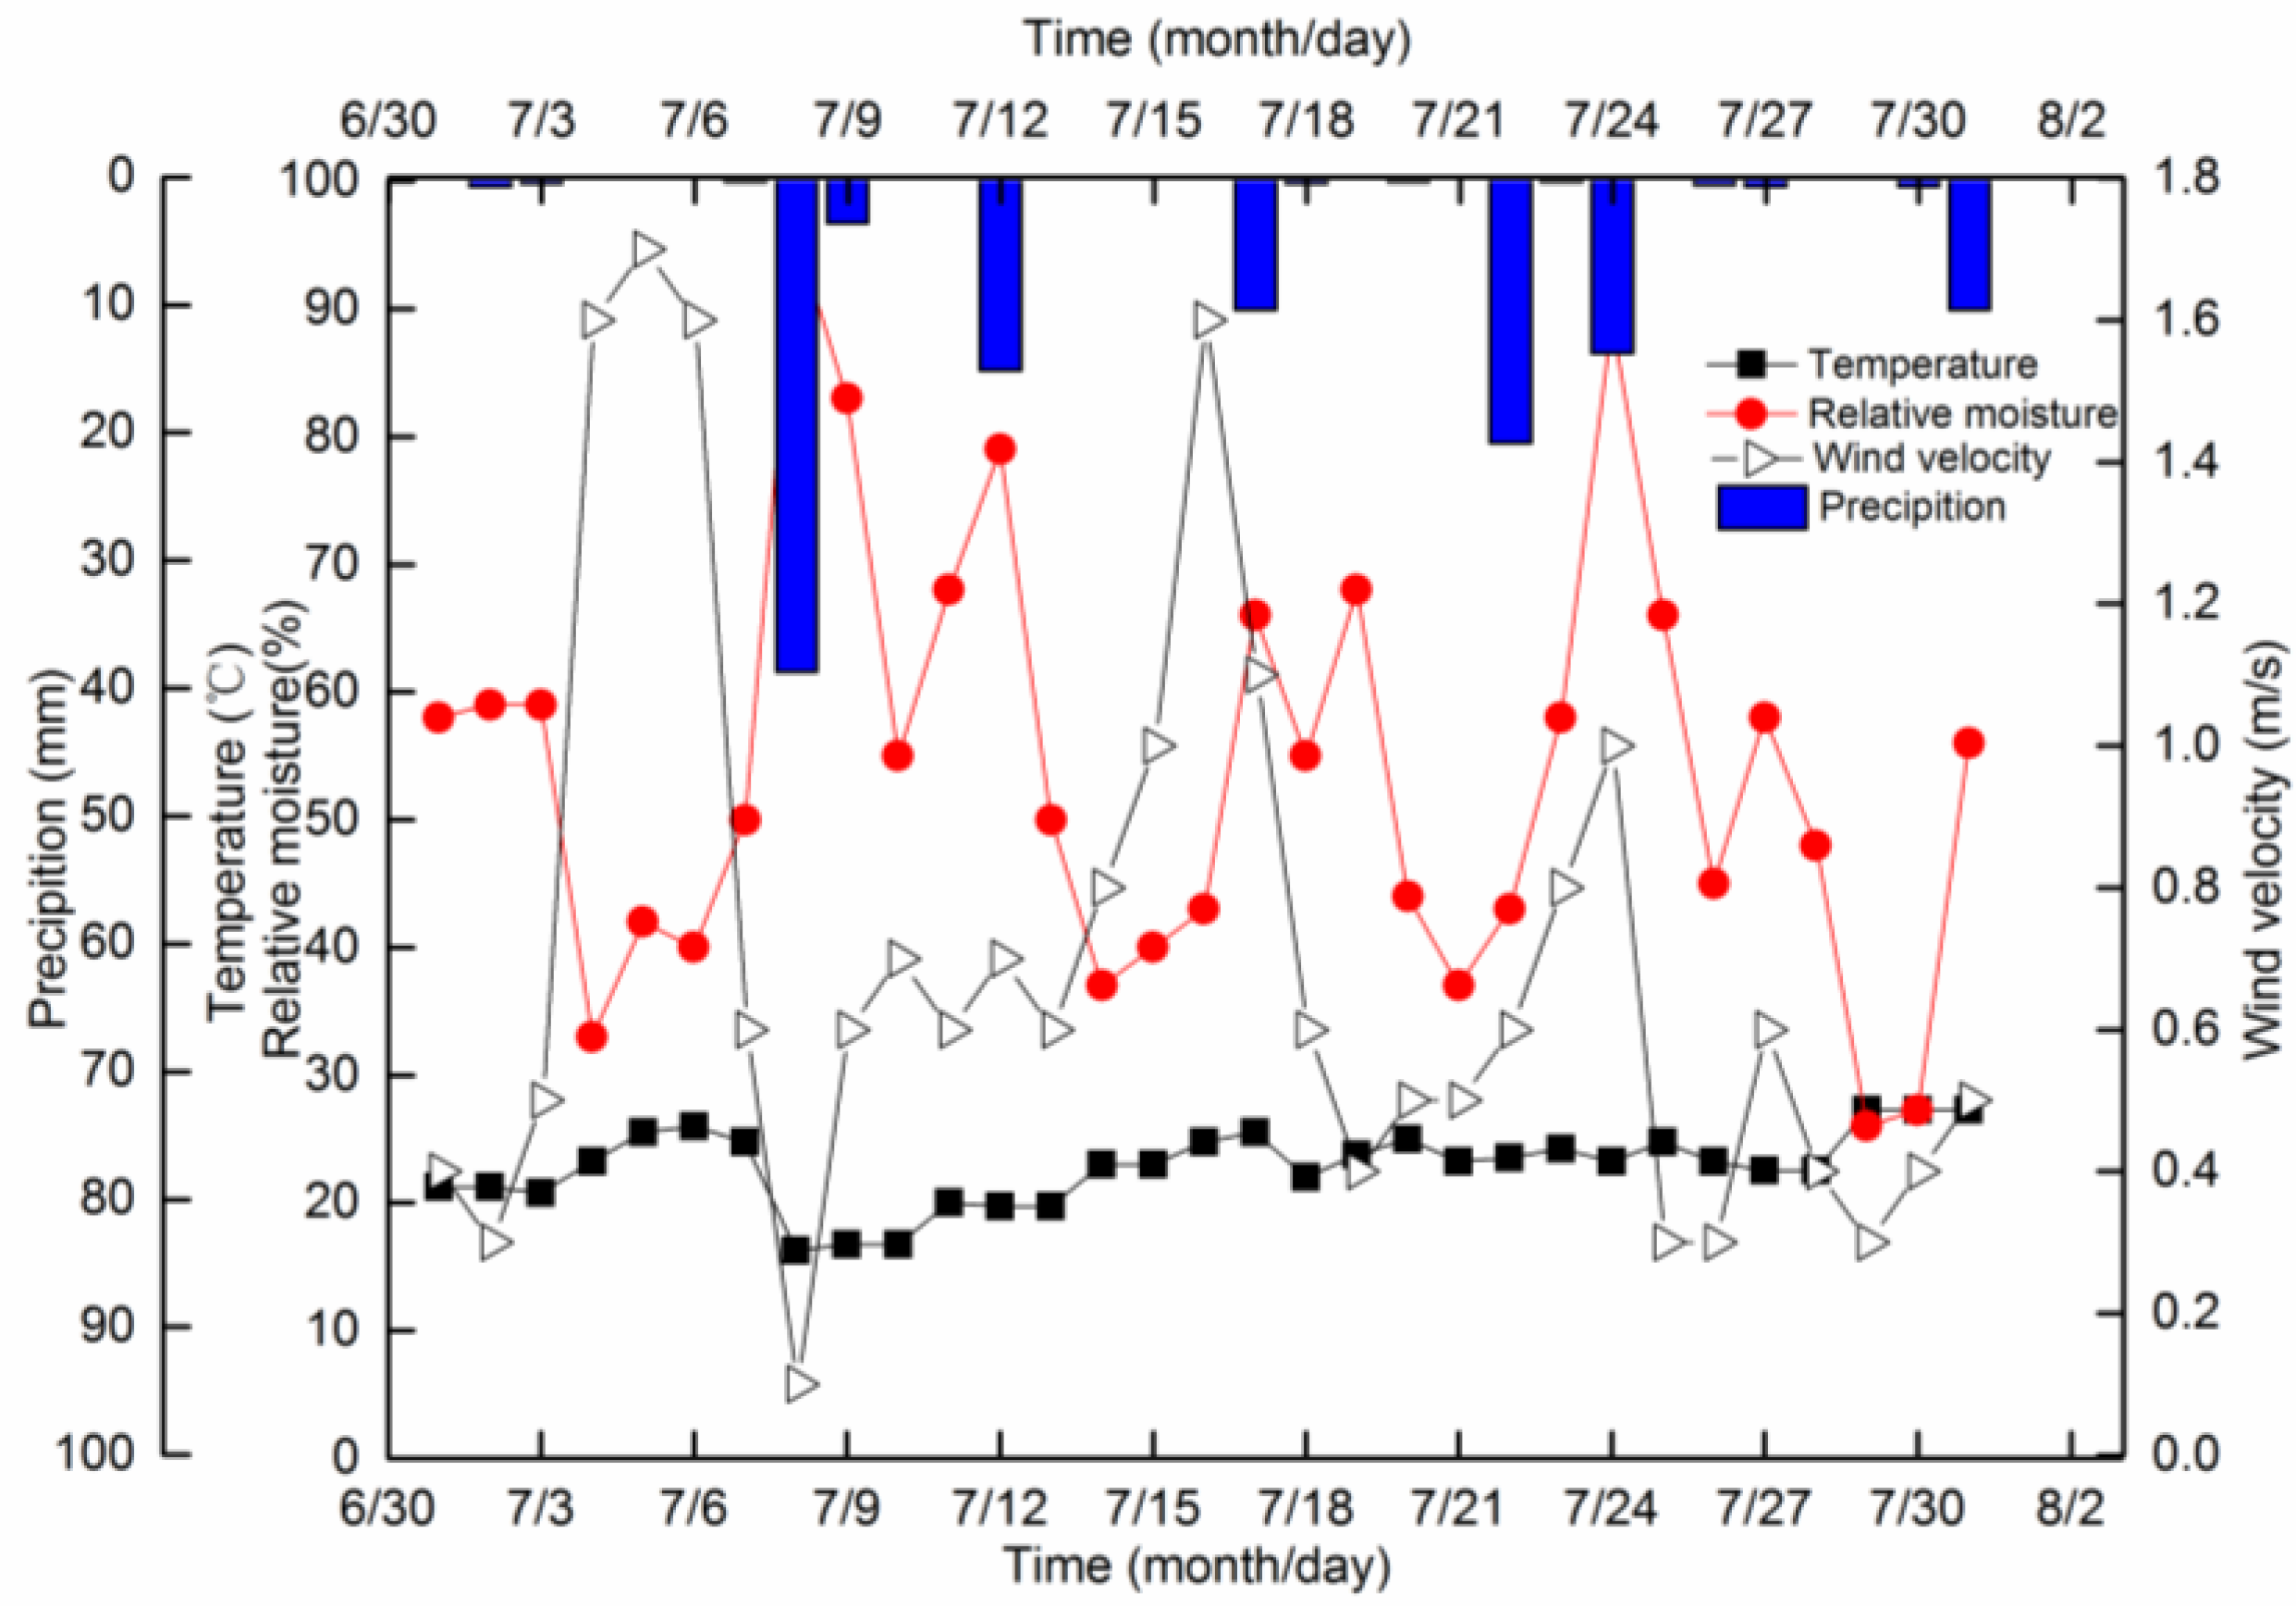
Figure 2.
Model experimental device.

Figure 3.
Assembling process of the experimental device.

Figure 4.
Schematic diagram of the experimental green roof system for integrated rainwater collection and irrigation.
Figure 4.
Schematic diagram of the experimental green roof system for integrated rainwater collection and irrigation.
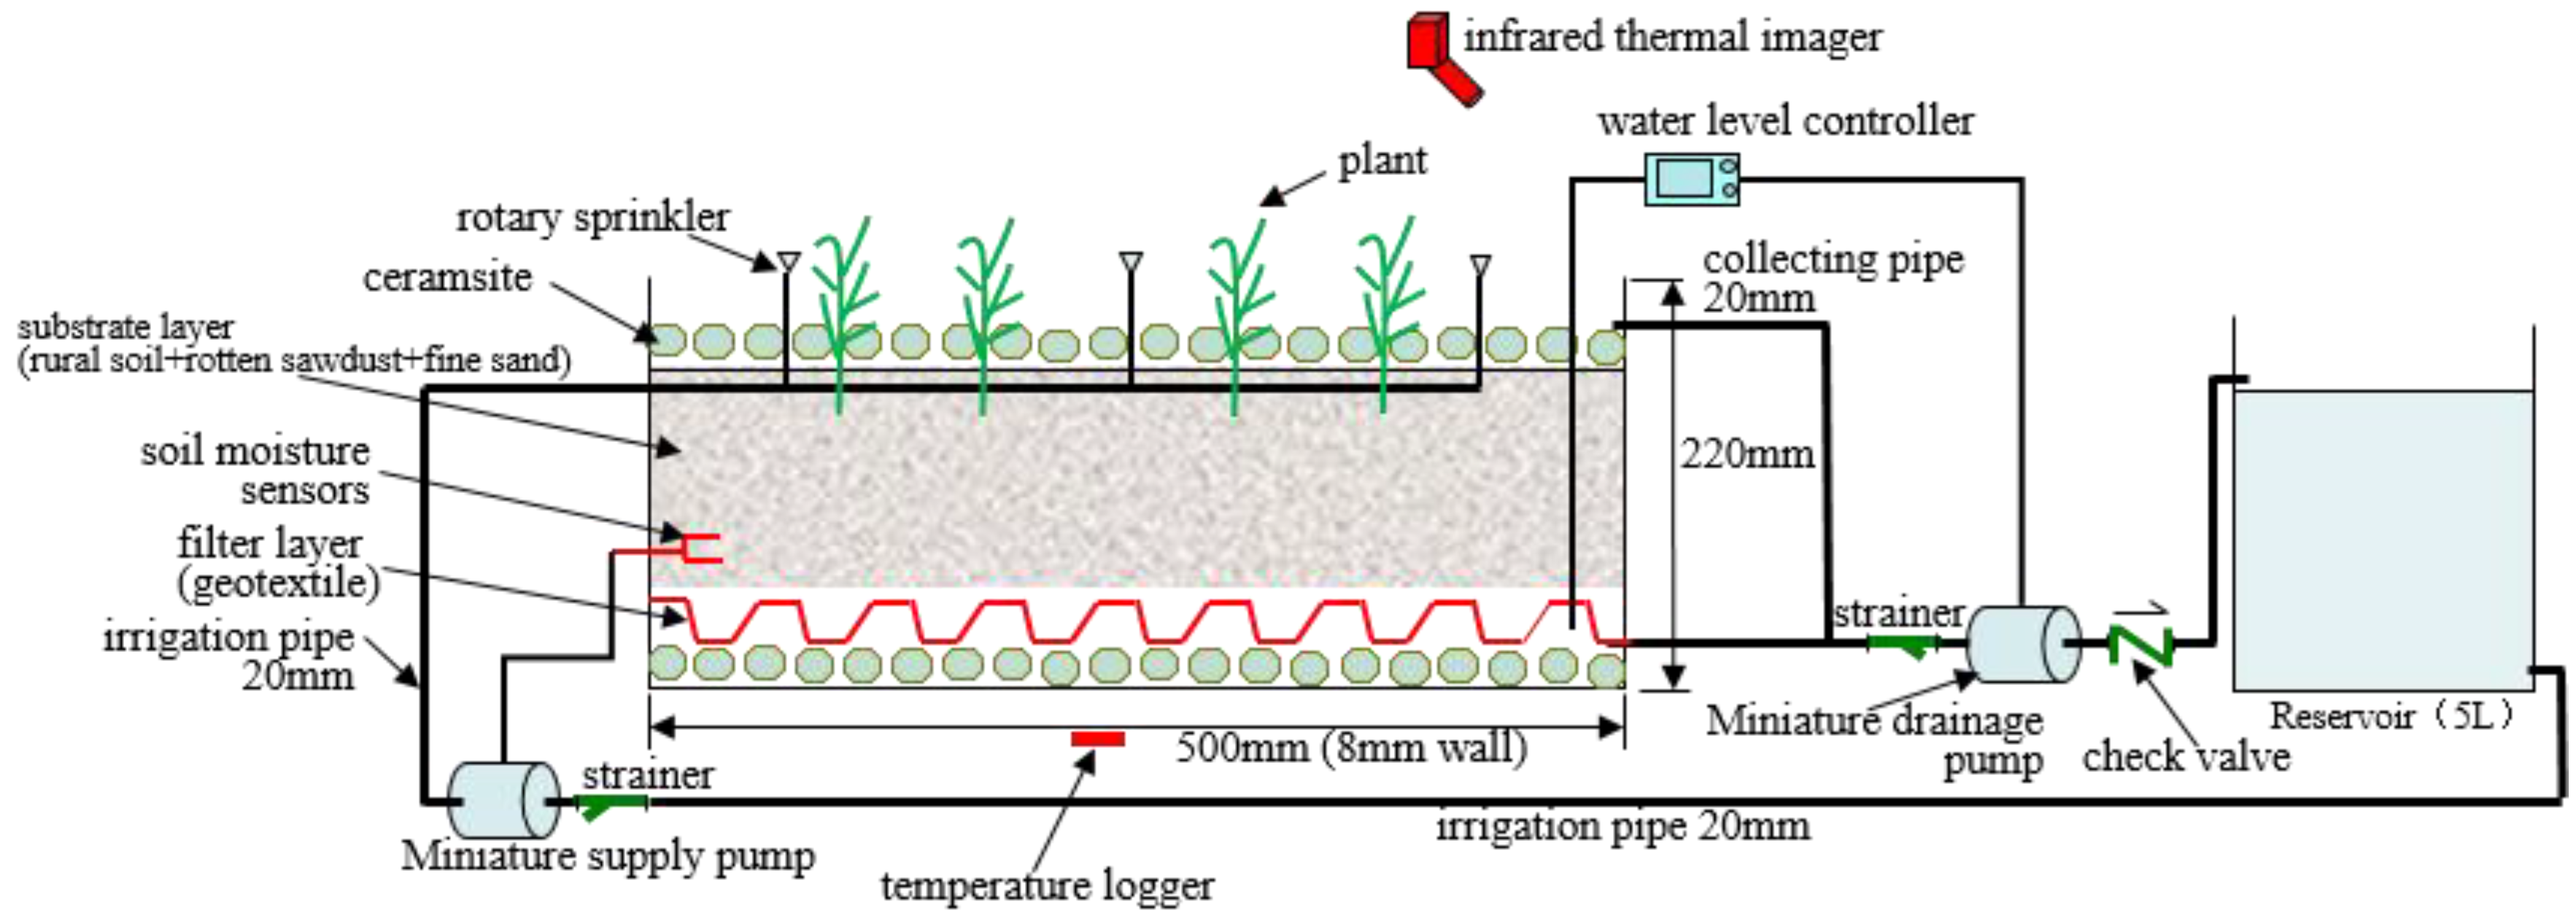
Figure 5.
Trays with (1) Sedum lineare; (2) Aptenia cordifolia and (3) Tifdwarf bermudagrass after 40 days without irrigation.
Figure 5.
Trays with (1) Sedum lineare; (2) Aptenia cordifolia and (3) Tifdwarf bermudagrass after 40 days without irrigation.
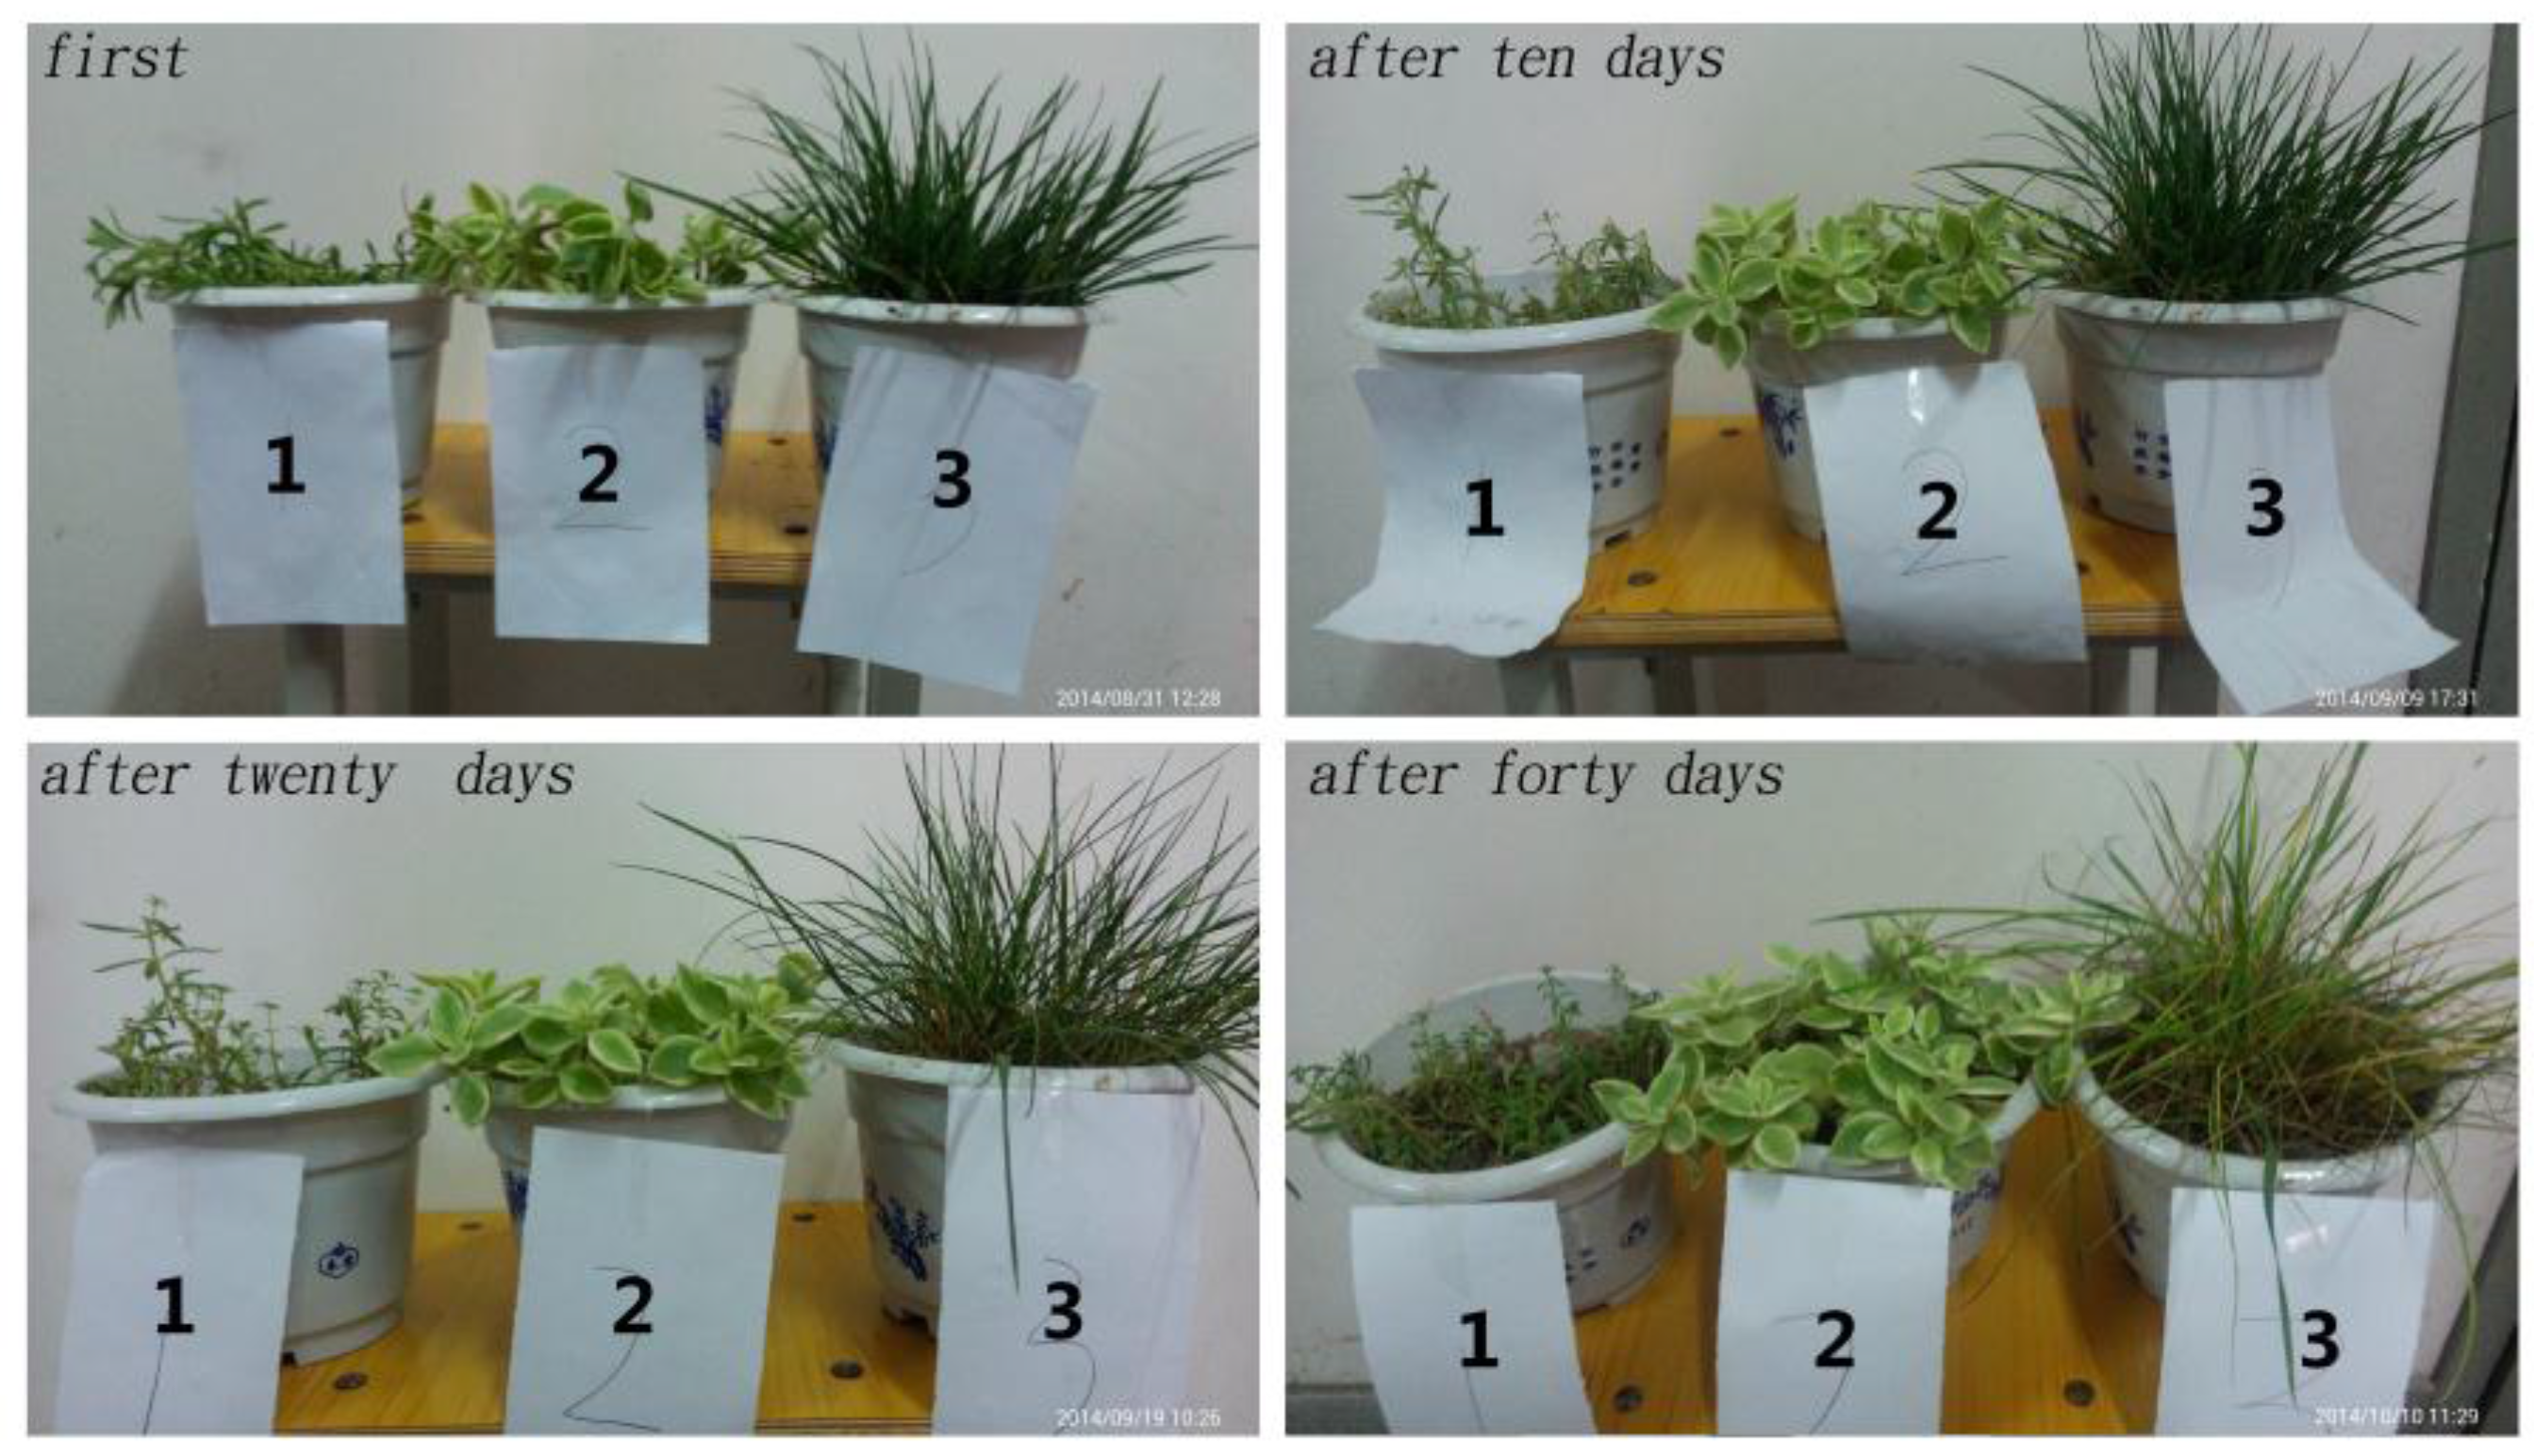
Figure 6.
Temperature comparison with and without roof greening.
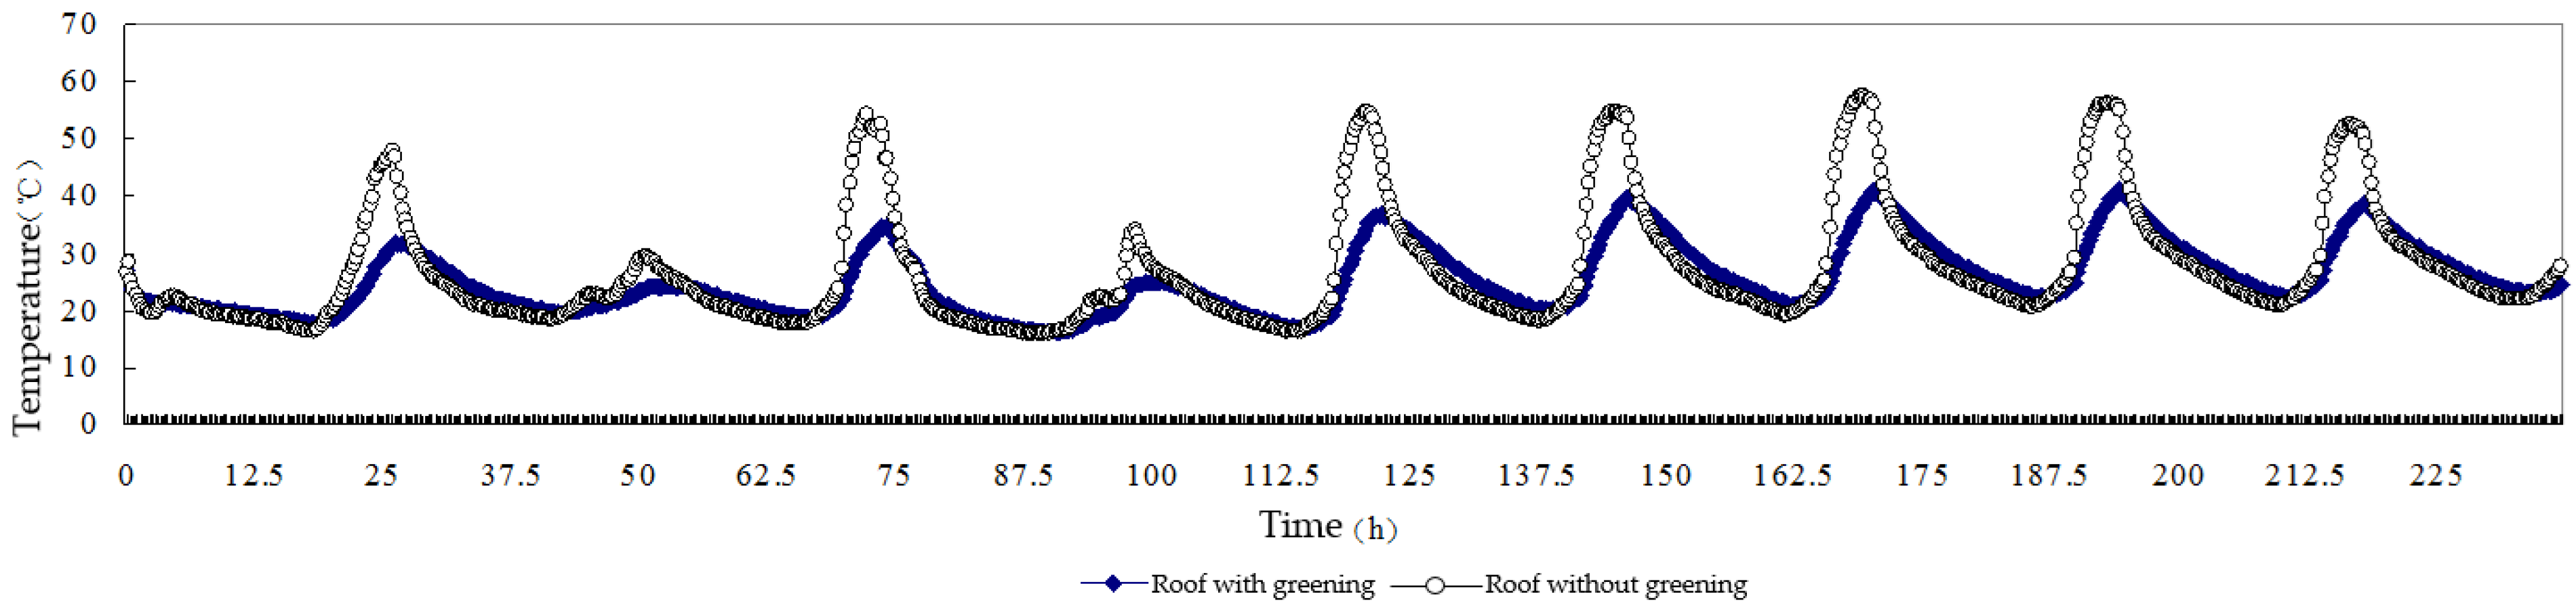
Figure 7.
Infrared imaging and temperature distribution before irrigation at 10:36 a.m., (a) Infrared imaging; (b) Temperature distribution diagram.
Figure 7.
Infrared imaging and temperature distribution before irrigation at 10:36 a.m., (a) Infrared imaging; (b) Temperature distribution diagram.
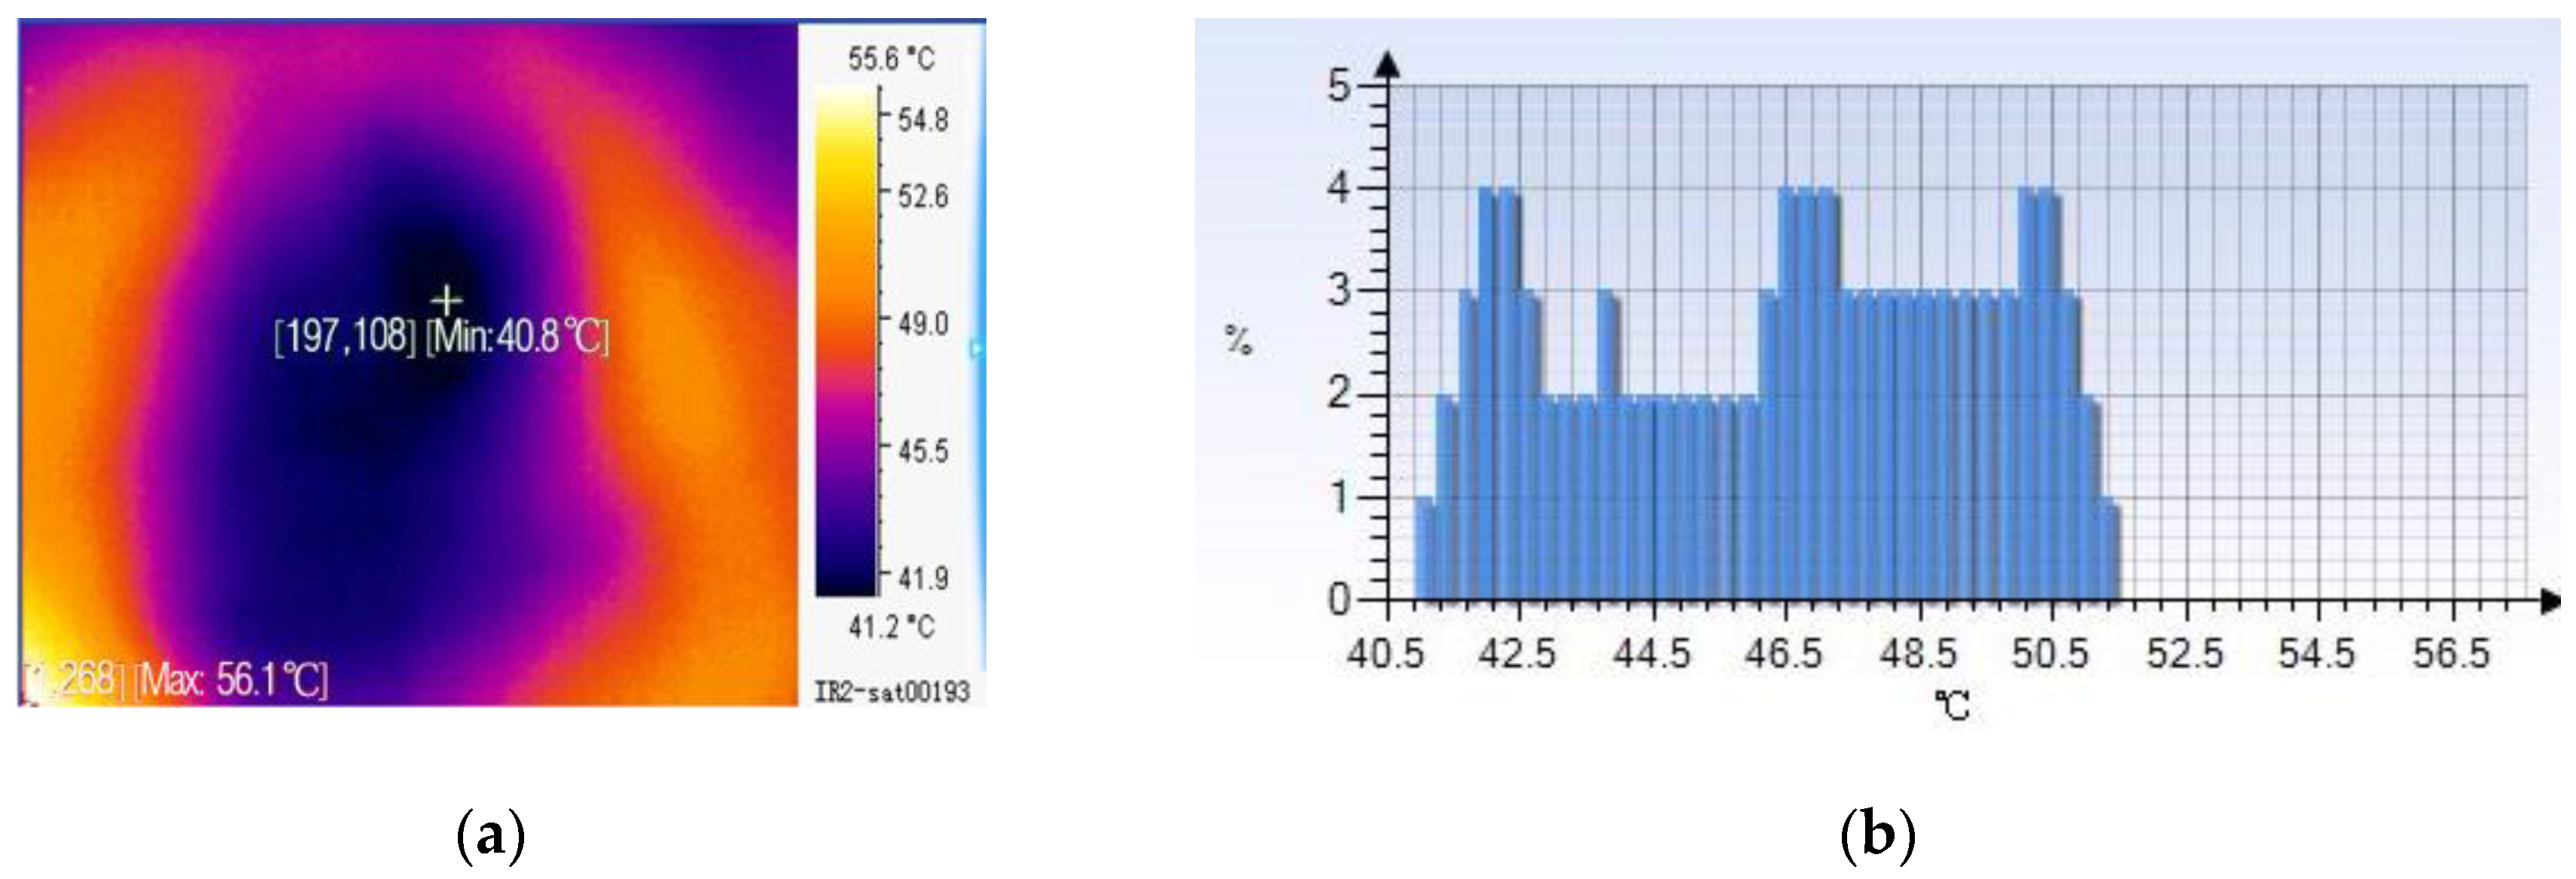
Figure 8.
Infrared imaging and temperature distribution after irrigation at 10:50 a.m., (a) Infrared imaging; (b) Temperature distribution diagram.
Figure 8.
Infrared imaging and temperature distribution after irrigation at 10:50 a.m., (a) Infrared imaging; (b) Temperature distribution diagram.

Figure 9.
Infrared imaging and temperature distribution after irrigation at 11:20 a.m., (a) Infrared imaging; (b) Temperature distribution diagram.
Figure 9.
Infrared imaging and temperature distribution after irrigation at 11:20 a.m., (a) Infrared imaging; (b) Temperature distribution diagram.

Figure 10.
Infrared imaging and temperature distribution after irrigation at 11:50 a.m., (a) Infrared imaging; (b) Temperature distribution diagram.
Figure 10.
Infrared imaging and temperature distribution after irrigation at 11:50 a.m., (a) Infrared imaging; (b) Temperature distribution diagram.

Figure 11.
Infrared imaging and temperature distribution after irrigation at 12:20 p.m., (a) Infrared imaging; (b) Temperature distribution diagram.
Figure 11.
Infrared imaging and temperature distribution after irrigation at 12:20 p.m., (a) Infrared imaging; (b) Temperature distribution diagram.

Figure 12.
Infrared imaging and temperature distribution after irrigation at 12:50 p.m., (a) Infrared imaging (b) Temperature distribution diagram.
Figure 12.
Infrared imaging and temperature distribution after irrigation at 12:50 p.m., (a) Infrared imaging (b) Temperature distribution diagram.


Table 1.
Frequency distribution of outside temperature and internal surface temperature.
| Temperature Interval (°C) | Outside Temperature | Internal Temperature Frequency with Green Roof | Internal Temperature Frequency without Green Roof | |||
|---|---|---|---|---|---|---|
| Number | Frequency (%) | Number | Frequency (%) | Number | Frequency (%) | |
| 33~34.9 | 50 | 5 | 30 | 3 | 23 | 2.3 |
| 35~36.9 | 45 | 4.5 | 34 | 3.4 | 18 | 1.8 |
| 37~38.9 | 23 | 2.3 | 10 | 1.0 | 11 | 1.1 |
| 39~40.9 | 10 | 1 | 7 | 0.7 | 12 | 1.2 |
| 41~42.9 | 1 | 0.1 | 1 | 0.1 | 7 | 0.7 |
| 43~44.9 | 1 | 0.1 | 0 | 0 | 11 | 1.1 |
| 45~46.9 | 0 | 0 | 0 | 0 | 15 | 1.5 |
| 47~48.9 | 0 | 0 | 0 | 0 | 9 | 0.9 |
| 49~50.9 | 0 | 0 | 0 | 0 | 12 | 1.2 |
| 51~52.9 | 0 | 0 | 0 | 0 | 26 | 2.6 |
| 53~54.9 | 0 | 0 | 0 | 0 | 21 | 2.1 |
| 55~56.9 | 0 | 0 | 0 | 0 | 15 | 1.5 |
| 57~58.9 | 0 | 0 | 0 | 0 | 4 | 0.4 |
| ∑ | 130 | 13 | 82 | 8.2 | 158 | 15.8 |
| <33 °C | 870 | 87 | 918 | 91.8 | 842 | 84.2 |
| ≥35 °C | 80 | 8 | 52 | 5.2 | 135 | 13.5 |
Table 2.
Statistical tests of inside surface temperature.
| Name | Outside Temperature (A) | Internal Temperature Frequency with Green Roof (B) | Internal Temperature Frequency without Green Roof (C) |
|---|---|---|---|
| Test Number | Test Number | Test Number | |
| Average value | 10 | 6.307692 | 14.15385 |
| Standard deviation Sx | 17.92577 | 11.863 | 6.401122 |
| Sample number n | 13 | 13 | 13 |
| Minimum value xmin | 0 | 0 | 4 |
| Maximum value xmax | 50 | 34 | 26 |
| Range xmin~xmax | 0~50 | 0~34 | 4~26 |
| Confidence interval half width d | 0.000714 | 0.000714 | 0.000714 |
| Double tail pair comparison t test | 0.386006 (A and C) | 0.036636 (A and B) | 0.026228 (B and C) |
Table 3.
Variance analysis of inside surface temperature.
| Summary | ||||||
| Group | Observation number | Summation | Average | Variance | ||
| A | 13 | 130 | 10 | 321.3333 | ||
| B | 13 | 82 | 6.307692 | 140.7308 | ||
| C | 13 | 184 | 14.15385 | 40.97436 | ||
| Variance Analysis | ||||||
| Source of variance | SS | df | MS | F | P-value | F crit |
| Inter-group | 400.6154 | 2 | 200.3077 | 1.194587 | 0.314548 | 3.259446 |
| Intra-group | 6036.462 | 36 | 167.6795 | |||
| Total | 6437.077 | 38 | ||||
© 2017 by the authors. Licensee MDPI, Basel, Switzerland. This article is an open access article distributed under the terms and conditions of the Creative Commons Attribution (CC BY) license (http://creativecommons.org/licenses/by/4.0/).
Share and Cite
MDPI and ACS Style
Wang, Y.; Singh, R.P.; Fu, D.; Zhang, J.; Zhou, F. Thermal Study on Extensive Green Roof Integrated Irrigation in Northwestern Arid Regions of China. Water 2017, 9, 810. https://doi.org/10.3390/w9110810
AMA Style
Wang Y, Singh RP, Fu D, Zhang J, Zhou F. Thermal Study on Extensive Green Roof Integrated Irrigation in Northwestern Arid Regions of China. Water. 2017; 9(11):810. https://doi.org/10.3390/w9110810
Chicago/Turabian StyleWang, Yajun, Rajendra Prasad Singh, Dafang Fu, Junyu Zhang, and Fang Zhou. 2017. "Thermal Study on Extensive Green Roof Integrated Irrigation in Northwestern Arid Regions of China" Water 9, no. 11: 810. https://doi.org/10.3390/w9110810
Note that from the first issue of 2016, this journal uses article numbers instead of page numbers. See further details here.