Diversity and Distribution of Endemic Stream Insects on a Nationwide Scale, South Korea: Conservation Perspectives


1
Freshwater Biodiversity Research Division, Nakdonggang National Institute of Biological Resources, Sangju-si, Gyeongsangbuk-do 37242, Korea
2
Department of Life and Nanopharmaceutical Sciences, and Department of Biology, Kyung Hee University, Seoul 02447, Korea
*
Author to whom correspondence should be addressed.
Water 2017, 9(11), 833; https://doi.org/10.3390/w9110833
Submission received: 30 September 2017
/
Revised: 21 October 2017
/
Accepted: 24 October 2017
/
Published: 30 October 2017
(This article belongs to the Special Issue Biological Communities Respond to Multiple Human-Induced Aquatic Environment Change)
Abstract
:This study aimed to identify the biogeographical and environmental factors affecting the biodiversity of endemic aquatic species (i.e., Ephemeroptera, Plecoptera and Trichoptera; EPT). We used data collected from 714 sampling sites combined with 39 environmental factors. Ten EPT endemic species were identified. The sampling sites grouped into four clusters based on the similarities of the endemic EPT assemblages using a hierarchical cluster analysis. Non-metric multidimensional scaling (NMS) revealed the differences among the four clusters, with the first three axes being strongly related to annual average, August, and January temperatures, as well as altitude. The random forest model identified geological and meteorological factors as the main factors influencing species distribution, even though the contributions of environmental factors were species-specific. Species with the lower occurrence frequency (i.e., Pteronarcys macra, Kamimuria coreana, and Psilotreta locumtenens) mainly occurred in the least-disturbed habitats. P. macra represents a priority conservation species, because it has a limited distribution range and is highly vulnerable to anthropogenic disturbance. Our results support the need for an environmental management policy to regulate deforestation and conserve biodiversity, including endemic species.
1. Introduction
Endemic species generally inhabit a geologically limited area, and are highly vulnerable to small environmental changes [1]. Therefore, we must strive to conserve and manage such endemic species from loss and extinction. However, knowledge remains limited on the biodiversity of endemic species in freshwater ecosystems, along with the key factors that influence their distribution. Severe pressures from various anthropogenic disturbances are continuously causing changes to original habitats and threatening the continued existence of endemic species [1,2].
Freshwater habitats cover just 0.8% of the Earth’s surface and comprise around 0.01% of the world’s water bodies [3,4]. However, freshwater habitats contain disproportionally high biodiversity of organisms [5]. Freshwater organisms tend to inhabit smaller geographic ranges [6], resulting in high levels of endemism evolving. Severe anthropogenic disturbances have been further shrinking their potential distribution ranges, as well as individual home ranges. Dudgeon et al. [7] listed five major factors that threaten freshwater biodiversity: overexploitation (e.g., [8]); water pollution (e.g., [9]); flow modification (e.g., [10]), and; the destruction and degradation of habitat and invasion of exotic species (e.g., [11]). The impacts of these factors, both separately and in combination, have caused the populations of freshwater organisms to decline, along with their distributions, and the homogenization of freshwater ecosystem worldwide. These factors threaten the survival of endemic species, which are highly adapted to the environmental factors within their specific ranges [12].
Research on the endemism, diversity, distribution, and conservation efforts of endemic species remains limited, especially with respect to endemic macroinvertebrates at nationwide scales. Most literature on endemic species focuses on single species (i.e., Lednia tumana, [13]). Other studies have been conducted within specific areas or under specific environmental conditions, such as with respect to the effects of glacial melting [13], deforestation [14], and the introduction of invasive plants [15].
Among various ecologically similar species, rare species tend to have smaller populations that are more likely to be vulnerable to environmental events, resulting in a greater extinction risk than common species [16]. Therefore, the degree of rarity of endemic species should be the first criterion used to determine conservation priorities and conservation responsibilities [17]. Among aquatic insects, species in Ephemeroptera, Plecoptera, and Trichoptera (EPT) exhibit sensitive responses to physical environmental factors at broad scales, in addition to water quality factors at small scales. The diversity of EPT represents one of the most important biological indices for evaluating the status of freshwater habitats [18]. However, few studies have focused on the rarity and distribution of EPT endemic species [19], despite their high vulnerability to future environmental change [1,20,21,22,23] and their ecological impacts and roles in ecosystem functioning [24]. To our knowledge, even though several studies have investigated the endemism of EPT species, they mainly focus on how climate change or temperature related factors influence the vulnerability of ETP species [13,19].
In this study, we evaluated two hypotheses: first, endemic species diversity becomes higher in the least disturbed areas, and; second, large scale factors, such as meteorological and geological factors (e.g., temperature, latitude, and longitude) are important determinants of the distribution and occurrence of endemic species, even though habitat preference and environmental tolerance differ among endemic species. Our results are expected to provide baseline information on which to build suggestions to advance the conservation efforts of endemic species.
2. Materials and Methods
2.1. Ecological Data
Data on endemic EPT species were obtained from the database of the National Aquatic Ecological Monitoring Program (NAEMAP), supported by the Ministry of Environment and National Institute of Environmental Research, Republic of Korea [25]. From the NAEMAP database, we selected a dataset consisting of samples collected at 717 sampling sites of 371 streams in five major river basins at a national scale in South Korea from 2008 to 2013. South Korea has a temperate climate with an annual mean temperature of 12.8 °C and an annual mean precipitation of 1589 mm/year [26]. The Han River basin (basin area: 41,957 km2) runs through Seoul, the capital of South Korea, and is the largest basin in South Korea (covering approximately one third of the country). The basin is located in the northern part of South Korea, and flows westward into the Yellow Sea. The Nakdong River basin (31,785 km2) is located in the southeastern part of South Korea, and flows into the South Sea. The Guem River basin (17,537 km2) is in the mid-western part of South Korea and the Yeongsan River basin (12,833 km2) is in the southwestern part of the country. Both basins flow into the Yellow Sea. The Seomjin River basin (4914 km2) is located between the Nakdong and Yeongsan river basins, and flows into the South Sea. The Yeongsan and Seomjin rivers were treated as one river system (hereafter, the Yeongseom River) for management purposes, because their catchments are in quite close proximity and share similar geographical conditions [23].
At each sampling site, three replicate sampling surveys were conducted in riffle zones within a 200 m reach of the river using a Surber net (30 × 30 cm2, 1 mm mesh size), based on the guidelines of the National Survey for Stream Ecosystem Health in South Korea [27]. All specimens collected during sampling were sorted and identified to the lowest level (mostly species level) under the microscope based on the published literature [28,29,30,31,32]. We used 39 environmental factors from seven different categories (including meteorology, geography, land use, hydrology, flow type, substrate, and physicochemical water quality) to evaluate how these factors affect EPT endemic species. The factors of hydrology, flow type, substrate, and physicochemical water quality were obtained from the NAEMAP database [33]. Meteorological factors were obtained from the Korea Meteorological Administration. Geographical and land use factors were extracted from digital maps in ArcGIS (Ver. 10.1) [34] based on the coordinate information of each sampling site [25].
2.2. Data Analysis
We conducted data analyses in four steps to characterize the rarity, abundance, and distribution of endemic EPT species. First, we evaluated the rarity of endemic EPT species by considering the number of sampling sites where endemic EPT species were found and the number of endemic EPT species recorded at each individual sampling site at nationwide and basin scales. Second, a hierarchical cluster analysis (CA) based on the endemic EPT assemblage was conducted to define the pattern of similarity of the endemic EPT assemblage structure. CA was calculated based on the Ward's linkage method [35] with the Bray-Curtis distance measure. Then, a Kruskal Wallis test (KW) was conducted to compare the differences of endemic EPT assemblage structure among the clusters defined in the CA. When there were significant differences in KW (p < 0.05), multiple comparison tests were performed to compare the differences between clusters. Multi-response permutation procedures (MRPP) were conducted to check for significant differences among the clusters. CA and MRPP were conducted with a function hclust and mrpp, respectively, in the package vegan [36] in R [37]. KW and multiple comparison tests were carried out with the function kruskal in the package agricolae [38] in R [37].
Third, non-metric multidimensional scaling (NMS) was conducted using the Bray-Curtis distance as the dissimilarity measure for the endemic EPT assemblage to determine the distribution pattern of endemic EPT species. NMS is a non-linear method that is suitable for zero-inflated ecological data sets with unknown data distribution [39]. We used a metaMDS function to determine the best solution (i.e., the lowest stress value) in the package vegan [36] in R. The relationship between endemic EPT species and environmental factors was determined using a function envfit in the package vegan [39,40].
Finally, the occurrence probability of endemic species was predicted using a random forest (RF) model, using the 39 environmental factors as independent variables [41]. RF is an ensemble machine learning technique that is based on a combination of a large set in decision tree. Each tree is trained to select a random sample (i.e., the calibration data set) from a random set and the training dataset of variables [42]. After building the RF model, the relative importance of environmental factors influencing the occurrence of endemic species was calculated from a mean decrease in accuracy, and was then rescaled from 0 to 100. In this study, RF was computed using the package random Forest [43] in R with three training parameters (such as mtree, mtry, and node size) at the default setting. The abundance of each species and some of the environmental factors with high variation (i.e., distance from source, water width, average depth, and average velocity) were log transformed before the data analysis.
3. Results
3.1. Characteristics of Endemic EPT Species
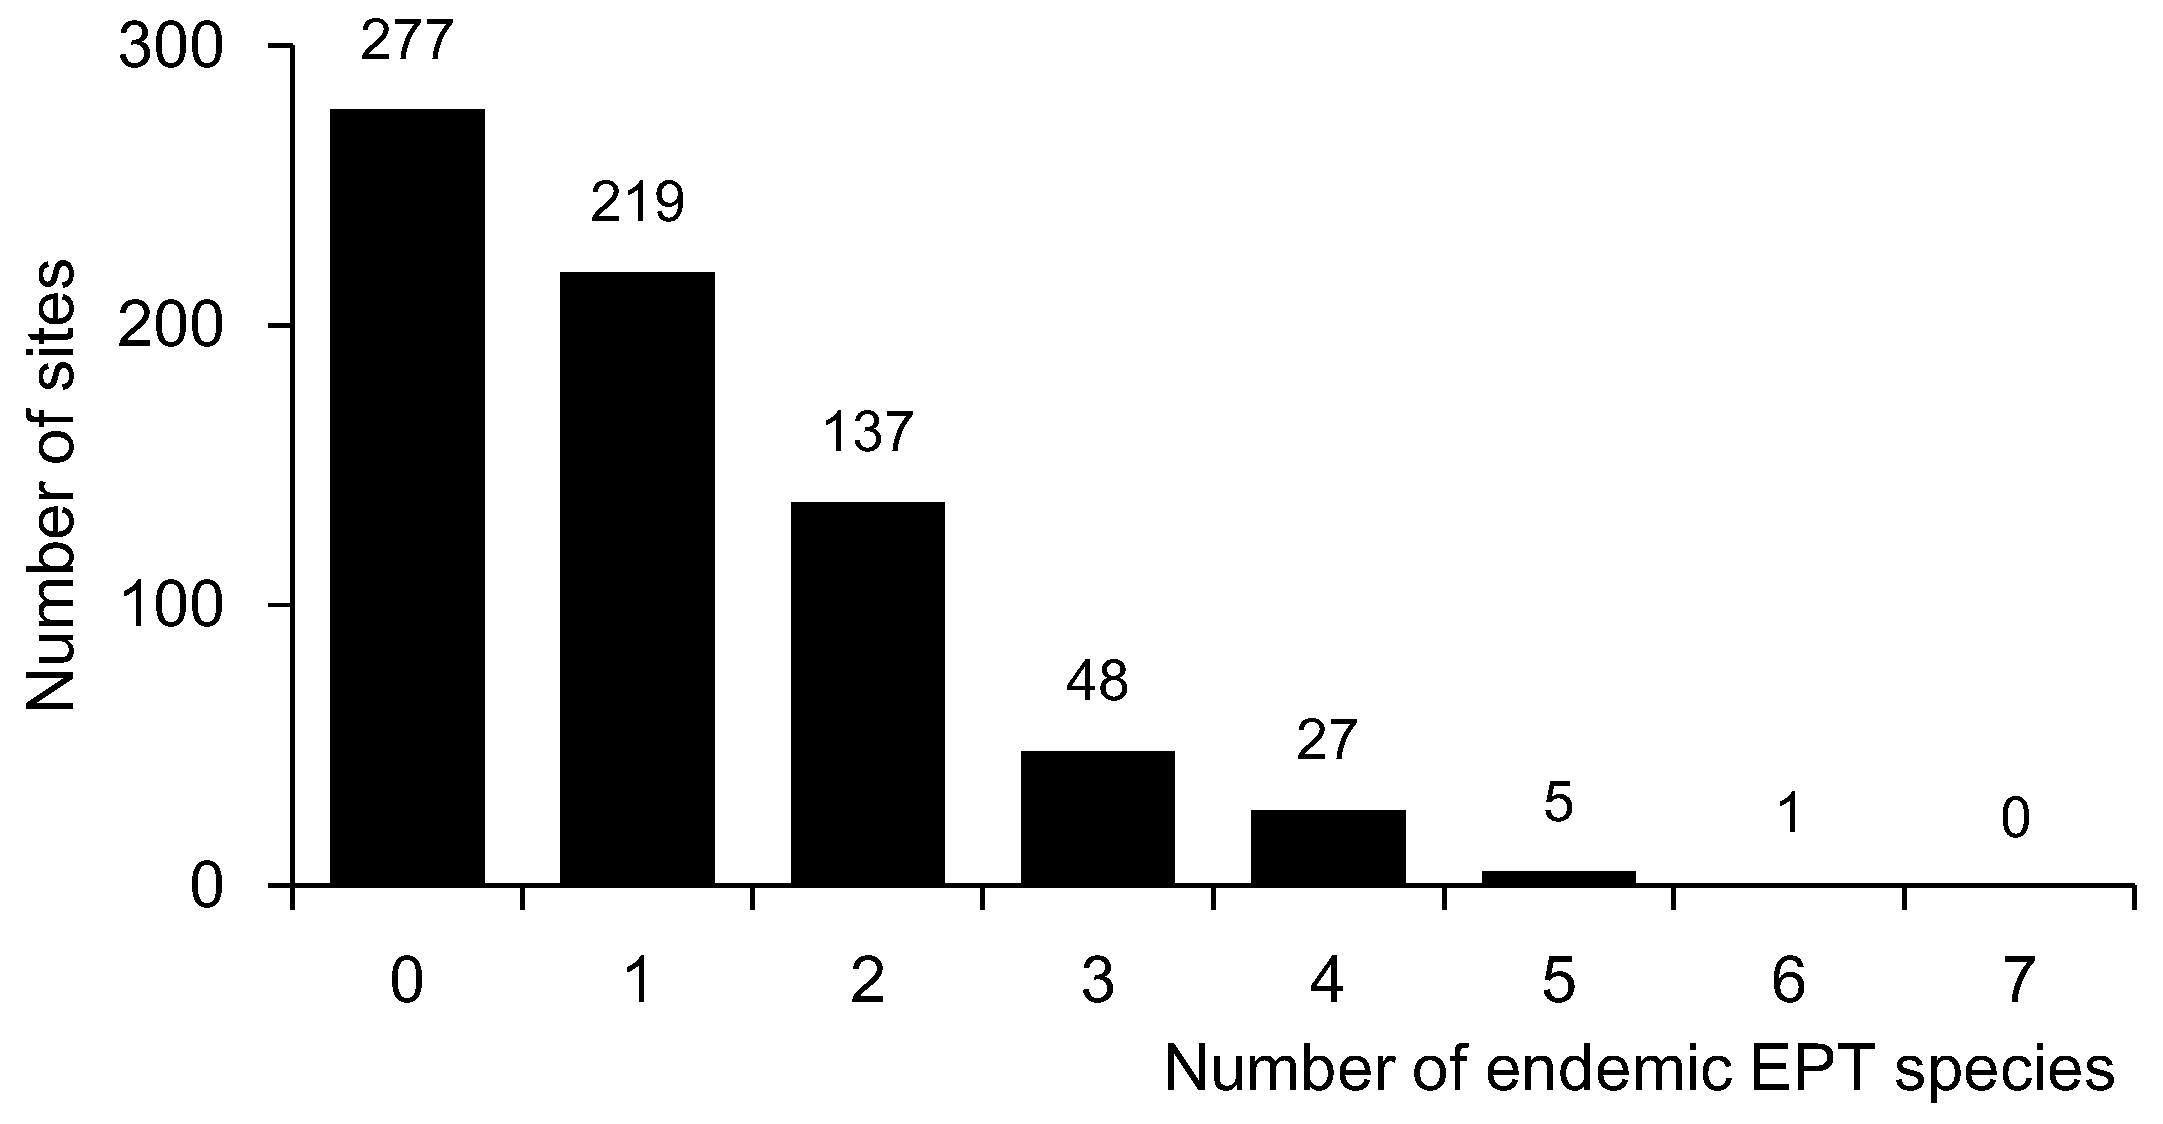
Ten endemic EPT species were identified in the dataset, including five, three, and two species belonging to Ephemeroptera, Plecoptera, and Trichoptera, respectively (Table 1). Out of these 10 species, Rhoenanthus coreanus (Ephemeroptera) was the most widely distributed, with 42.2% occurrence frequency (301 sites), and was found within all four basins (Figure 1 and Table 1). However, most species had very low occurrence frequencies. Pteronarcys macra (Plecoptera) was only recorded at eight sites (1.1% of the occurrence frequency) in only one basin (the Han River basin) in the northern part of South Korea (Figure 1, Table 1). Only four species (i.e., R. coreanus, Drunella aculea, Potamanthus yooni, and Kamimuria coreana) had more than 10% occurrence frequency. Out of these four species, only two (R. coreanus and K. coreana) were observed in all four basins, even though the occurrence frequency of K. coreana was extremely low in the Geum and Yeongseom basins (3.1% in both cases). In addition, out of six species with less than 10.0% of the occurrence frequency, only one (Neoperla coreensis) was recorded in all basins. Overall, the majority of sites did not have any endemic species (i.e., 277 sites, 38.6%) or just one endemic species (i.e., 219 sites, 30.5%) (Figure 2).
3.2. Relationships between Endemic EPT Species and Environmental Factors
The sampling sites were classified into four clusters (1 to 4) based on the similarities of the endemic EPT assemblage composition (Figure 3). MRPP identified significant differences in the endemic EPT assemblage among the four clusters (A = 0.09, p < 0.05). Cluster 1 was characterized by D. aculea, P. macra, K. coreana, N. coreensis, Psilotreta locumtenens, and Ceraclea armata (KW, p < 0.05, Table 2). Cluster 2 was characterized by R. coreanus. Cluster 3 was characterized by P. yooni. Cluster 4 was characterized by Procloeon halla.
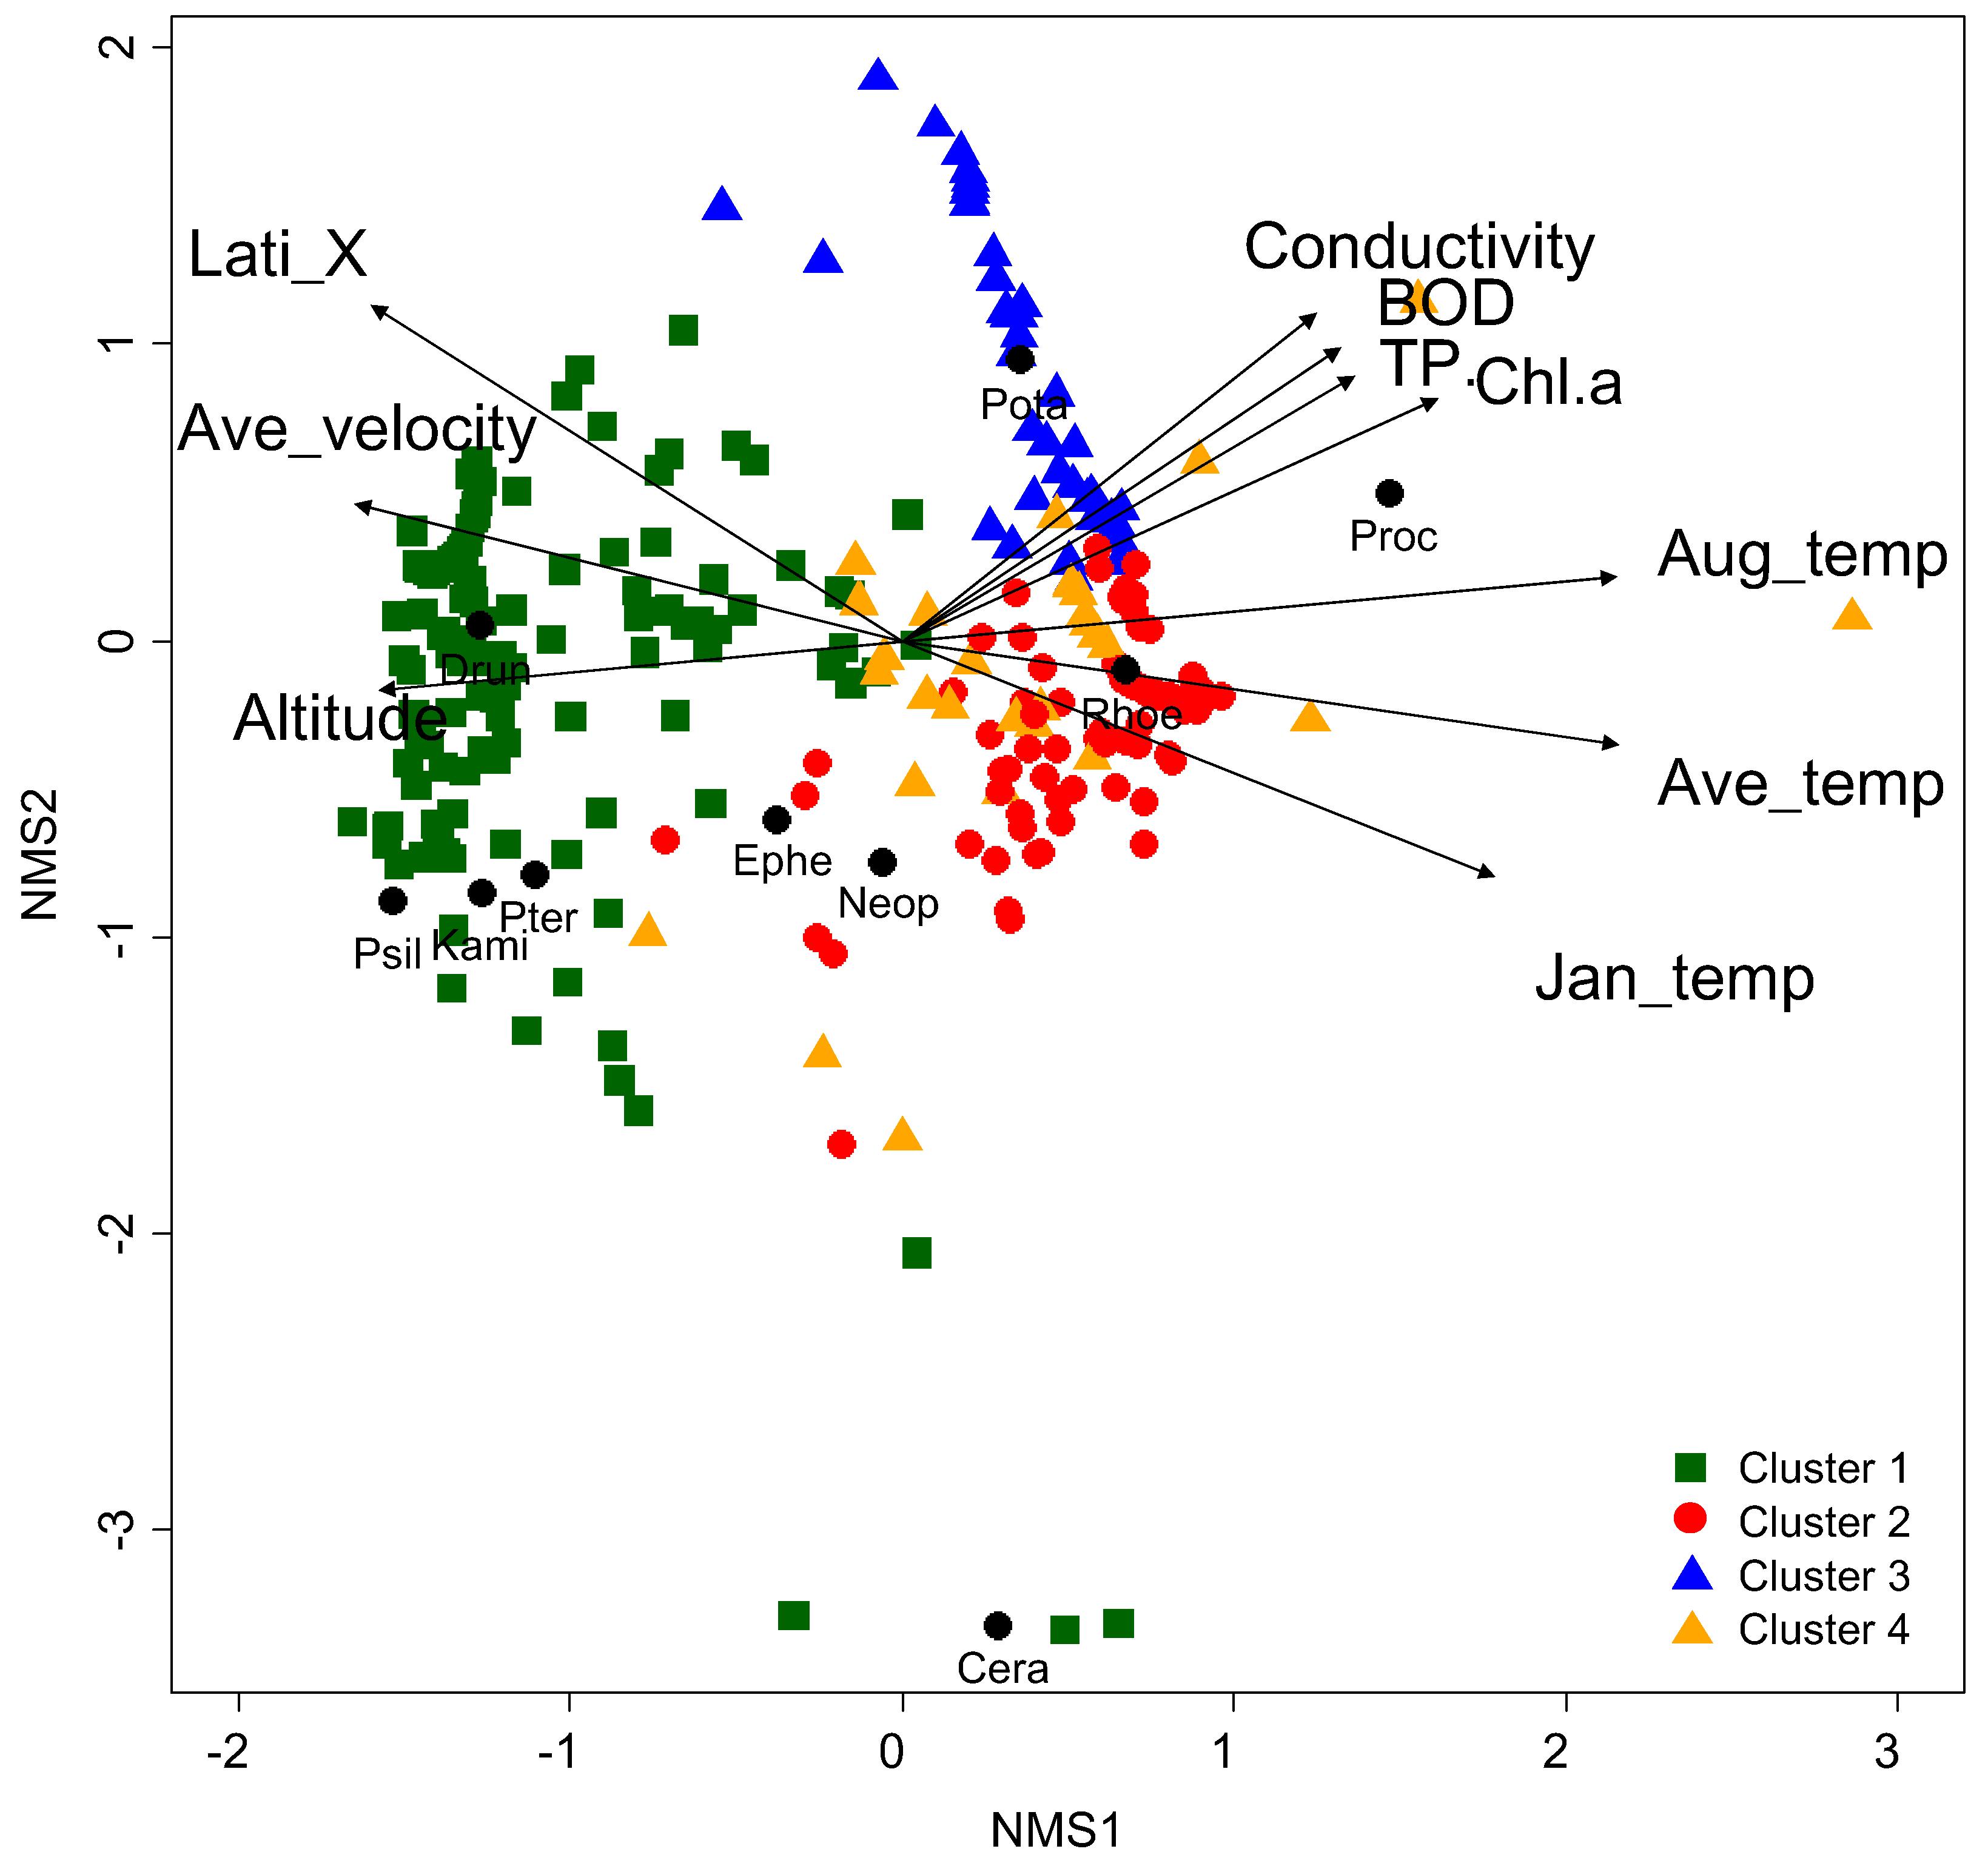
Differences in the composition of the endemic EPT assemblage were also reflected in NMS (Figure 4). In NMS ordination, the first three axes (stress value = 7.32) had the highest relationship with annual average temperature (R2 = 0.598, p < 0.05), followed by August temperature (R2 = 0.561, p < 0.05), January temperature (R2 = 0.503, p < 0.05), latitude (R2 = 0.445, p < 0.05), and altitude (R2 = 0.373, p < 0.05) (Table 3). The sampling sites with high values for latitude, water velocity, and altitude were located on the left parts of axis 1, whereas sites with relatively high values for (Chl-a), poor water quality (i.e., high conductivity, biological oxygen demand (BOD), total phosphate (TP), and chlorophyll a (Chl-a)) were on the right part of axis 1 (Figure 4). Species such as P. halla, were located on the right part of axis 1. These species mainly inhabit the lowland areas of the southern parts of South Korea, where the sampling areas were mostly characterized as having high conductivity, BOD, TP, and Chl-a. Species, such as P. locumtenens, K. coreana, P. macra, and D. aculea, were located on the left part of axis 1. These species were mainly found in the least disturbed freshwater habitats (e.g., with good water quality, high water velocity, and altitude), such as mountain areas.
3.3. Influential Environmental Factors on the Occurrences of Endemic Species
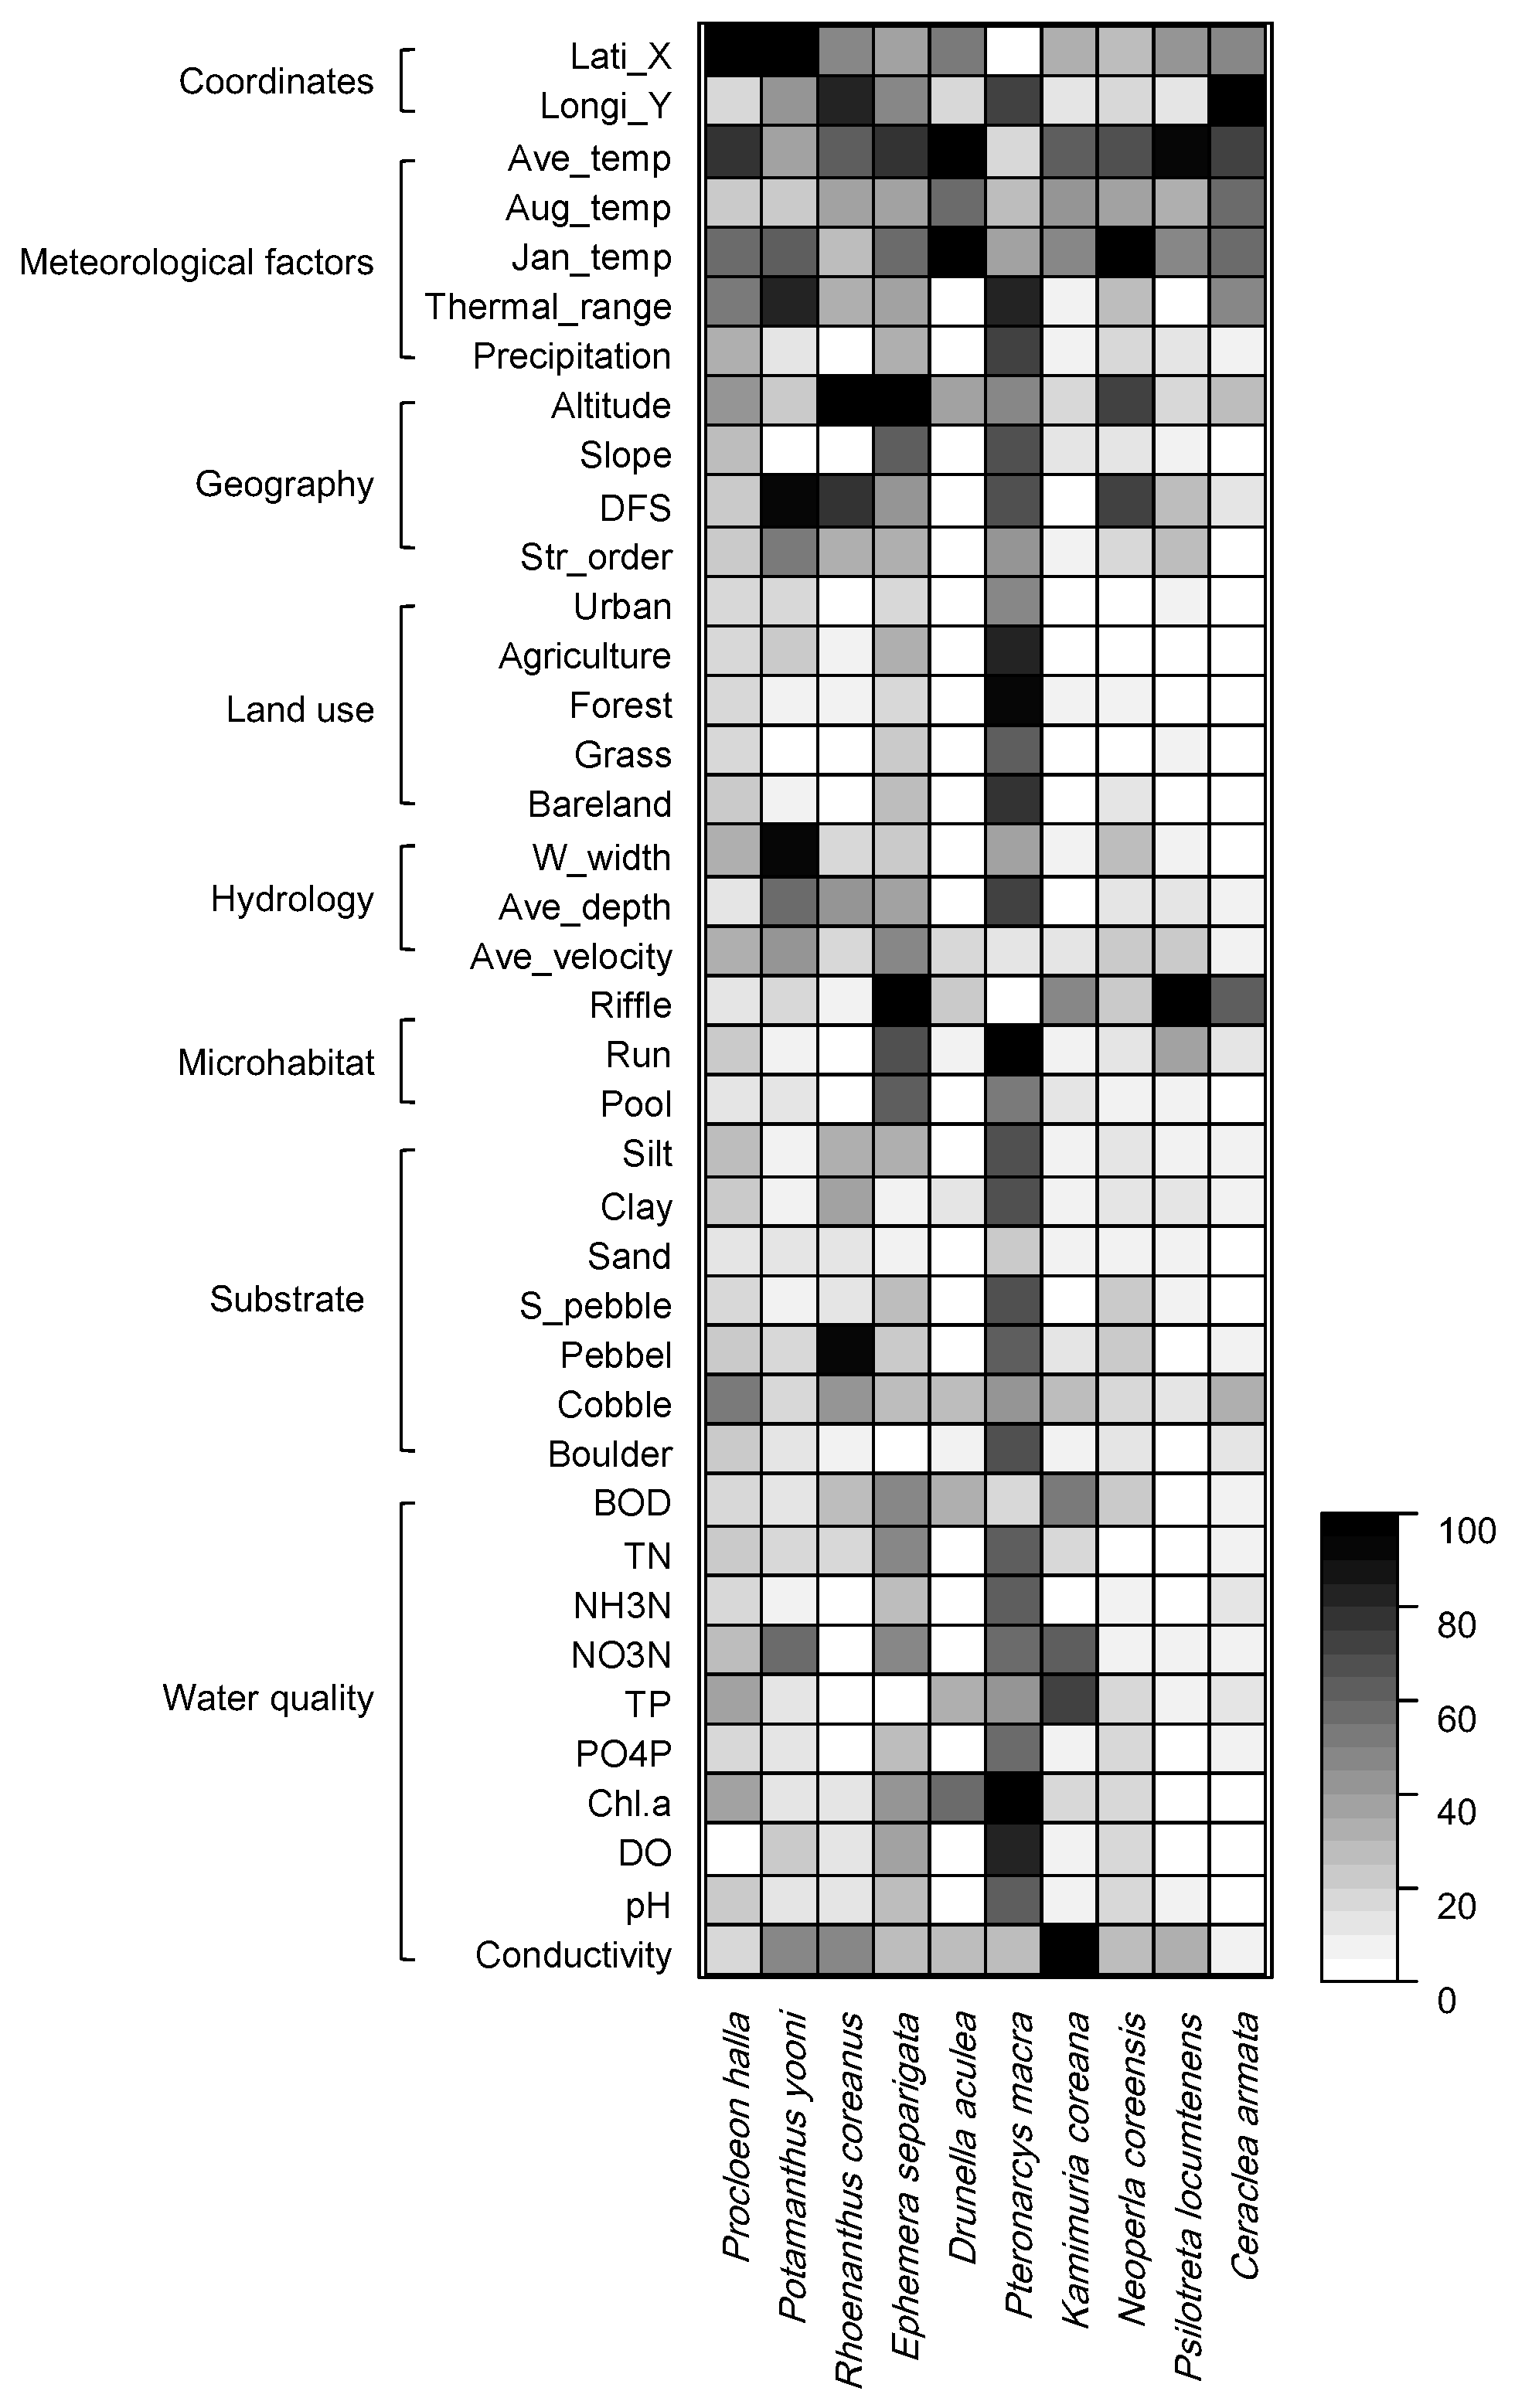
The distribution of each endemic species was predicted well in the range from 0.990 to 0.998 based on environmental factors through the RF learning process (Figure 5). Overall, geographical and meteorological factors represented the main factors influencing species distribution, even though different species responded differently to various environmental factors. For example, altitude was the most important (100) for the occurrence of R. coreanus, which had the highest occurrence frequency in the dataset, followed by pebbles (90.4), longitude (83.1), distance from source (77.4), and annual average temperature (64.7). Meanwhile, D. aculea, which was the second highest occurrence frequency species, was characterized by January temperature (100) and annual average temperature (95.9). P. macra, which rarely occurred, was influenced by the ratio of agriculture area in land use (100), followed by the run ratio in flow type (86.8), forest ratio (85.7), phosphate-phosphorus (PO4P) (84.0), and average depth (52.0).
4. Discussion
4.1. Priority Species for the Conservation
Endemic species are characterized by their limited spatial distribution and poor dispersal, resulting in their being rare. The rarity of endemic species is a major causal factor of their going extinct in both ecological and geological timeframes [44]. Therefore, endemic species are likely to be the first candidates for extinction. In our study, out of the 10 endemic EPT species, the occurrence frequency of six species was less than 10.0%. The frequency of C. armata (1.5%) and P. macra (1.1%) was lower than 2.0%. The species that were widely distributed across several basins might lose their conservation priority when compared with species that are only found within a certain basin and with a limited distribution [12]. In this sense, both species should have high conservation priority. In particular, P. macra should be considered as priority species of conservation concern, because it was only found in a limited northeastern area of the Han River, which has a low annual temperature. P. macra is a cold-adapted species, making it vulnerable to global warming and anthropogenic disturbances, which threaten its existence in their original habitat [23].
4.2. Influential Environmental Factors Related to the Existence of Endemic Species: Conservation Implications
We should be aware of increasing threats to the existence of endemic species. Not surprisingly, endemism is an important criterion for determining national conservation responsibilities [17]. However, measurements for the future extinction of species are hindered by the lack knowledge of the life history, traits, niche, resource requirements, and suitable criteria of endemic species making it difficult to determine their rarity [45,46]. The current study showed that the factors influencing the differentiation of endemic EPT species included geology (i.e., latitude and altitude), meteorology (especially temperature-related factors), hydrology (water velocity), and water chemistry (BOD, TP, Chl-a, and conductivity).
Our results support the environmental filtering hypothesis, which proposes that environmental drivers act as hierarchical filters constraining assemblages [47]. Large-scale factors, such as geological and meteorological factors, strongly influence the local habitat and biological diversity of streams and rivers [48,49]. These factors are closely connected with the diversity and composition of endemic EPT species [6]. Strayer [6] suggested that some range boundaries are set by the climate and other ecological patterns, even though the current distribution patterns of endemic EPT species is based on the history of drainage connections [50]. Freshwater fauna are particularly sensitive and vulnerable to the impacts of climate change, because they usually have limited dispersal abilities [51]. Consequently, current and future changes caused from human activities are likely to have a stronger influence on their diversity than past anthropogenic alterations [52]. Global warming especially threats the potential future distribution and persistence of the sensitive habitats used by endemic Plecoptera [13,53], even though this phenomenon was not directly considered in our study. Several studies have also shown that land use is an influential factor in determining species distribution, even though, in our study, this influence was relatively weak based on NMS. Flather et al. [54] found that forests and rangelands are important factors for differentiating endangered species “hot spots.”
When the suitable habitats and their climatic refuges are degraded, the existence of endemic taxa becomes threatened (e.g., [55]). Since the 20th century, intensive alterations of hydrology have been closely related with the massive constructions of reservoirs and dams, as well as the disappearance of streams and springs, due to human actions [56]. Dams and impoundments alter the hydrological regimes of rivers, resulting in reduced water flow (water level fluctuations), the accumulation of silt, and the loss of habitat diversity. These alterations induce changes of life cycles, block of species dispersal, and reduce the abundance of freshwater fauna [57,58,59]. If these threats align within the zone containing high endemic species richness and if there are no conservation actions in that zone, it would accelerate the further homogenization of these habitats and the simplification of the macroinvertebrate community, which, in turn, would precipitate the loss of rare endemic species.
In addition, we found that endemic species with the lower occurrence frequency (i.e., P. macra, K. coreana and P. locumtenens) were mainly observed in the least-disturbed habitats, such as mountain areas (northerneast part of the Han River catchment). Certain factors (such as low temperature, high altitude, high ratio of forest land use, rapid water velocity, high ratio of riffles, and good water quality) strongly influenced the distribution of these three species based on RF. These three species primarily inhabit zones with little urbanization and extensive forest watersheds. However, the forest area in South Korea has gradually declined (i.e., 6.406 × 10⁶ ha in 2003 and 6.335 × 10⁶ ha in 2015) because of the construction of convenience facilities for humans. Furthermore, the ratio of private forests is high (4.25 × 10⁶ ha, 67.1% of the total forest area); thus, such forest areas are likely to be quickly lost due to potentially disruptive activities by the owners. Therefore, a strict environmental management policy is required to minimize the deforestation of such areas to conserve biodiversity, including endemic species.
5. Conclusions
The conservation, protection, and management of freshwater biodiversity are the ultimate conservation challenge because multiple human stakeholders continue to threaten biodiversity. Various efforts to maintain and protect biodiversity should be conducted globally through establishing a system of protected areas. We suggest that endemic invertebrates should be priority candidate species of conservation concern based on their rarity and the types of environmental factors that determine their diversity and distribution. Out of the 10 species that were found as endemic species in South Korea, P. macra had an occurrence frequency of just 1.1% with an extremely limited distribution (i.e., found in one catchment, especially the least disturbed area), indicating the high conservation priority of this species. RF showed that the distribution of the endemic species was mainly influenced by geographical and meteorological factors. Benthic macroinvertebrates play an important role in many freshwater ecosystems, and are useful for evaluating biological integrity and water and habitat quality. Furthermore, the high diversity of endemic EPT species is a valuable predictor of the diversity of other aquatic invertebrates. Therefore, conservation efforts of sites containing endemic EPT species also guarantee the conservation of other freshwater taxa.
Acknowledgments
We thank the National Aquatic Ecological Monitoring Program (NAEMP) operated by the Ministry of Environment and National Institute of Environmental Research, Korea for providing part of the dataset used. This work was supported by the Nakdonggang National Institute of Biological Resources (Project: Studies on Freshwater Biodiversity in Headwater Streams of the Nakdong River Basin) and by the National Research Foundation of Korea (NRF) funded by the Korean government (MSIP) (grant number NRF-2016R1A2B4011801).
Author Contributions
M.-J.B. and Y.-S.P. conceived the study. M.-J.B. conducted the statistical analysis and interpretation of the data. M.-J.B. and Y.-S.P. wrote and revised the manuscript.
Conflicts of Interest
The authors declare no conflict of interest.
References
- Brown, B.L. Habitat heterogeneity and disturbance influence patterns of community temporal variability in a small temperate stream. Hydrobiologia 2007, 586, 93–106. [Google Scholar] [CrossRef]
- Winterbourn, M.J.; Cadbury, S.; Ilg, C.; Milner, A.M. Mayfly production in a New Zealand glacial stream and the potential effect of climate change. Hydrobiologia 2008, 603, 211–219. [Google Scholar] [CrossRef]
- Gleick, P.H. Water resources. In Encyclopedia of Climate and Weather; Schneider, S.H., Ed.; Oxford University Press: Oxford, UK, 1996; pp. 817–823. [Google Scholar]
- Geist, J. Integrative freshwater ecology and biodiversity conservation. Ecol. Indic. 2011, 11, 1507–1516. [Google Scholar] [CrossRef]
- Hawksworth, D.L.; Kalin-Arroyo, M.T. Magnitude and distribution of biodiversity. In Global Biodiversity Assessment; Heywood, V.H., Watson, R.T., Eds.; Cambridge University Press: Cambridge, UK, 1995; pp. 107–192. [Google Scholar]
- Strayer, D.L. Challenges for freshwater invertebrate conservation. J. N. Am. Benthol. Soc. 2006, 25, 271–287. [Google Scholar] [CrossRef]
- Dudgeon, D.; Arthington, A.H.; Gessner, M.O.; Kawabata, Z.-I.; Knowler, D.J.; Lévêque, C.; Naiman, R.J.; Prieur-Richard, A.-H.; Soto, D.; Stiassny, M.L.J.; et al. Freshwater biodiversity: Importance, threats, status and conservation challenges. Biol. Rev. 2006, 81, 163–182. [Google Scholar] [CrossRef] [PubMed]
- Cowx, I.G.; Collares-Pereira, M.J.; Coelho, M.M. Freshwater Fish Conservation: Options for the Future; Fishing News: Oxford, UK, 2002; pp. 443–452. [Google Scholar]
- Xu, M.; Wang, Z.; Duan, X.; Pan, B. Effects of pollution on macroinvertebrates and water quality bio-assessment. Hydrobiologia 2014, 729, 247–259. [Google Scholar] [CrossRef]
- Nilsson, C.; Reidy, C.A.; Dynesius, M.; Revenga, C. Fragmentation and flow regulation of the world’s large river systems. Science 2005, 308, 405–408. [Google Scholar] [CrossRef] [PubMed]
- Koehn, J.D. Carp (Cyprinus carpio) as a powerful invader in Australian waterways. Freshw. Biol. 2004, 49, 882–894. [Google Scholar] [CrossRef]
- Burlakova, L.E.; Karatayev, A.Y.; Karatayev, V.A.; May, M.E.; Bennett, D.L.; Cook, M.J. Endemic species: Contribution to community uniqueness, effect of habitat alteration, and conservation priorities. Biol. Conserv. 2011, 144, 155–165. [Google Scholar] [CrossRef]
- Muhlfeld, C.C.; Giersch, J.J.; Hauer, F.R.; Pederson, G.T.; Luikart, G.; Peterson, D.P.; Downs, C.C.; Fagre, D.B. Climate change links fate of glaciers and an endemic alpine invertebrate. Clim. Chang. 2011, 106, 337–345. [Google Scholar] [CrossRef]
- Benstead, J.P.; Pringle, C.M. Deforestation alters the resource base and biomass of endemic stream insects in eastern Madagascar. Freshw. Biol. 2004, 49, 490–501. [Google Scholar] [CrossRef]
- Samways, M.J.; Sharratt, N.J.; Simaika, J.P. Effect of alien riparian vegetation and its removal on a highly endemic river macroinvertebrate community. Biol. Invasions 2011, 13, 1305–1324. [Google Scholar] [CrossRef]
- Flather, C.H.; Sieg, C.H. Species rarity: Definition, causes and classification. In Conservation of Rare or Little-Known Species; Island Press: Washington, DC, USA, 2007; pp. 40–66. [Google Scholar]
- Schmeller, D.S.; Gruber, B.; Budrys, E.; Framsted, E.; Lengyel, S.; Henle, K. National responsibilities in European species conservation: A methodological review. Conserv. Biol. 2008, 22, 593–601. [Google Scholar] [CrossRef] [PubMed]
- Couceiro, S.R.M.; Hamada, N.; Forsberg, B.R.; Pimentel, T.P.; Luz, S.L.B. A macroinvertebrate multimetric index to evaluate the biological condition of streams in the Central Amazon region of Brazil. Ecol. Indic. 2012, 18, 118–125. [Google Scholar] [CrossRef]
- Brown, L.E.; Céréghino, R.; Compin, A. Endemic freshwater invertebrates from southern France: Diversity, distribution and conservation implications. Biol. Conserv. 2009, 142, 2613–2619. [Google Scholar] [CrossRef]
- Céréghino, R.; Lavandier, P. Influence of hypolimnetic hydropeaking on the distribution and population dynamics of Ephemeroptera in a mountain stream. Freshw. Biol. 1998, 40, 385–399. [Google Scholar] [CrossRef]
- Santoul, F.; Figuerola, J.; Mastrorillo, S.; Céréghino, R. Patterns of rare fish and aquatic insects in a southwestern French river catchment in relation to simple physical variables. Ecography 2005, 28, 307–314. [Google Scholar] [CrossRef]
- Li, F.; Chung, N.; Bae, M.J.; Kwon, Y.S.; Park, Y.S. Relationships between stream macroinvertebrates and environmental variables at multiple spatial scales. Freshw. Biol. 2012, 57, 2107–2124. [Google Scholar] [CrossRef]
- Li, F.; Chung, N.; Bae, M.J.; Kwon, Y.S.; Kwon, T.S.; Park, Y.S. Temperature change and macroinvertebrate biodiversity: Assessments of organism vulnerability and potential distributions. Clim. Chang. 2013, 119, 421–434. [Google Scholar] [CrossRef]
- Wagenhoff, A.; Townsend, C.R.; Matthaei, C.D. Macroinvertebrate responses along broad stressor gradients of deposited fine sediment and dissolved nutrients: A stream mesocosm experiment. J. Appl. Ecol. 2012, 49, 892–902. [Google Scholar] [CrossRef]
- Bae, M.J.; Kwon, Y.; Hwang, S.J.; Chon, T.S.; Yang, H.J.; Kwak, I.S.; Park, J.H.; Ham, S.A.; Park, Y.S. Relationships between three major stream assemblages and their environmental factors in multiple spatial scales. Ann. Limnol. Int. J. Limnol. 2011, 47, S91–S105. [Google Scholar] [CrossRef]
- Lee, K.S.; Wenner, D.B.; Lee, I. Using H-and O-isotopic data for estimating the relative contributions of rainy and dry season precipitation to groundwater: Example from Cheju Island, Korea. J. Hydrol. 1999, 222, 65–74. [Google Scholar] [CrossRef]
- MOE; NIER. The Survey and Evaluation of Aquatic Ecosystem Health in Korea; The Ministry of Environment and National Institute of Environmental Research: Incheon, Korea, 2008. (In Korean)
- Quigley, M. Invertebrates of Streams and Rivers: A Key to Identification; Edward Arnold: London, UK, 1977. [Google Scholar]
- Pennak, W. Freshwater Invertebrates of the United States; John Wiley and Sons, Inc.: New York, NY, USA, 1978. [Google Scholar]
- Brighnam, A.R.; Brighnam, W.U.; Gnika, A. Aquatic Insects and Oligochaeta of North and South Carolina; Midwest Aquatic Enterprise: Mahomet, IL, USA, 1982. [Google Scholar]
- Yun, I.B. Illustrated Encyclopedia of Fauna and Flora of Korea. Aquatic Insects; Ministry of Education: Seoul, Korea, 1988.
- Merritt, R.W.; Cummins, K.W. An Introduction to the Aquatic Insects of North America; Hunt Publishing Company: Dubugue, IA, USA, 2006. [Google Scholar]
- WAMIS. Available online: http://www.wamis.go.kr (accessed on 21 August 2014).
- Environmental Systems Research Incorporated (ESRI). ArcGIS 10.0. Environmental Systems Research Incorporated: Redlands, CA, USA, 2011. [Google Scholar]
- Ward JHJ. Hierarchical grouping to optimize an objective function. J. Am. Stat. Assoc. 1963, 58, 236–244. [Google Scholar]
- Oksanen, J.; Kindt, R.; Legendre, P.; O’Hara, B.; Simpson, G.L.; Stevens, M.H.H.; Wagner, H. Vegan: Community Ecology Package. R Package Version 1.15-0. Available online: http://vegan.r-forge.r-project.org (accessed on 26 October 2017).
- R Development Core Team. R: A Language and Environment for Statistical Computing, 3-900051-07-0; R Foundation for Statistical Computing: Vienna, Austria, 2011; Available online: http://www.R-project.org (accessed on 26 October 2017).
- De Mendiburu, F. Agricolae: Statistical Procedures for Agricultural Research R Package Version 1.0-9. Available online: http://CRAN.R-project.org/package=agricolae (accessed on 1 April 2017).
- Minchin, P.R. An evaluation of the relative robustness of techniques for ecological ordination. Vegetatio 1987, 69, 89–107. [Google Scholar] [CrossRef]
- Virtanen, R.; Ilmonen, J.; Paasivirta, L.; Muotka, T. Community concordance between bryophyte and insect assemblages in boreal springs: A broad-scale study in isolated habitats. Freshw. Biol. 2007, 54, 1651–1662. [Google Scholar] [CrossRef]
- Breiman, L. Random forests. Mach. Learn. 2001, 45, 5–32. [Google Scholar] [CrossRef]
- Vincenzi, S.; Zucchetta, M.; Franzoi, P.; Pellizzato, M.; Pranovi, F.; De Leo, G.A.; Torricelli, P. Application of a Random Forest algorithm to predict spatial distribution of the potential yield of Ruditapes philippinarum in the Venice lagoon, Italy. Ecol. Model. 2011, 222, 1471–1478. [Google Scholar] [CrossRef]
- Liaw, A.; Wiener, M. Classification and regression by random Forest. R News 2002, 2, 18–22. [Google Scholar]
- Dobson, F.S.; Yu, J.; Smith, A.T. The importance of evaluating rarity. Conserv. Biol. 1995, 9, 1648–1651. [Google Scholar] [CrossRef]
- Kuussaari, M.; Bommarco, R.; Heikkinen, R.K.; Helm, A.; Krauss, J.; Lindborg, R.; Ockinger, E.; Pärtel, M.; Pino, J.; Rodà, F.; et al. Extinction debt: A challenge for biodiversity conservation. Trends Ecol. Evol. 2009, 24, 564–571. [Google Scholar] [CrossRef] [PubMed]
- Pimm, S.L.; Russell, G.J.; Gittleman, J.L.; Brooks, T.M. The future of biodiversity. Science 1995, 269, 347–350. [Google Scholar] [CrossRef] [PubMed]
- De Bello, F.; Lavorel, S.; Lavergne, S.; Albert, C.H.; Boulangeat, I.; Mazel, F.; Thuiller, W. Hierarchical effects of environmental filters on the functional structure of plant communities: A case study in the French Alps. Ecography 2013, 36, 393–402. [Google Scholar] [CrossRef]
- Allan, J.D. Landscapes and riverscapes: The influence of land use on stream ecosystems. Annu. Rev. Ecol. Syst. 2004, 35, 257–284. [Google Scholar] [CrossRef]
- Allan, J.D.; Flecker, A.S. Biodiversity conservation in running waters. BioScience 1993, 43, 32–43. [Google Scholar] [CrossRef]
- Van der Schalie, H. The value of mussel distribution in tracing stream confluence. Mich. Acad. Sci. Arts Lett. 1945, 30, 355–373. [Google Scholar]
- Woodward, G.; Perkins, D.M.; Brown, L.E. Climate change and freshwater ecosystems: Impacts across multiple levels of organization. Philos. Trans. R. Soc. B 2010, 365, 2093–2106. [Google Scholar] [CrossRef] [PubMed]
- Döll, P.; Zhang, J. Impact of climate change on freshwater ecosystems: A global-scale analysis of ecologically relevant river flow alterations. Hydrol. Earth Syst. Sci. 2010, 14, 783–799. [Google Scholar] [CrossRef] [Green Version]
- Li, F.; de Figueroa, J.M.T.; Lek, S.; Park, Y.S. Continental drift and climate change drive instability in insect assemblages. Sci. Rep. 2015, 5, 11343. [Google Scholar] [CrossRef] [PubMed]
- Flather, C.H.; Knowles, M.S.; Kendall, I.A. Threatened and endangered species geography. BioScience 1988, 48, 365–376. [Google Scholar] [CrossRef]
- Deacon, J.E.; Williams, A.E.; Williams, C.D.; Williams, J.E. Fueling population growth in Las Vegas: How large-scale groundwater withdrawal could burn regional biodiversity. BioScience 2007, 57, 688–698. [Google Scholar] [CrossRef]
- Søndergaard, M.; Jeppesen, E. Anthropogenic impacts on lake and stream ecosystems, and approaches to restoration. J. Appl. Ecol. 2007, 44, 1089–1094. [Google Scholar] [CrossRef]
- Petts, G.E. Impounded Rivers: Perspectives for Ecological Management; Wiley: Chichester, UK, 1984; p. 285. [Google Scholar]
- Vaughn, C.C.; Taylor, C.M. Impoundments and the decline of freshwater mussels: A case study of an extinction gradient. Conserv. Biol. 1999, 13, 912–920. [Google Scholar] [CrossRef]
- Watters, G.T. Freshwater mussels and water quality: A review of the effects of hydrologic and instream habitat alterations. In Freshwater Mollusk Symposium Proceedings; Tankersley, R.A., Warmolts, D.I., Watters, G.T., Armitage, B.J., Johnson, P.D., Butler, R.S., Eds.; Ohio Biological Survey: Columbus, OH, USA, 2000; pp. 261–274. [Google Scholar]
Figure 1.
Sampling sites (a) and occurrence patterns of endemic EPT species (b) in South Korea.
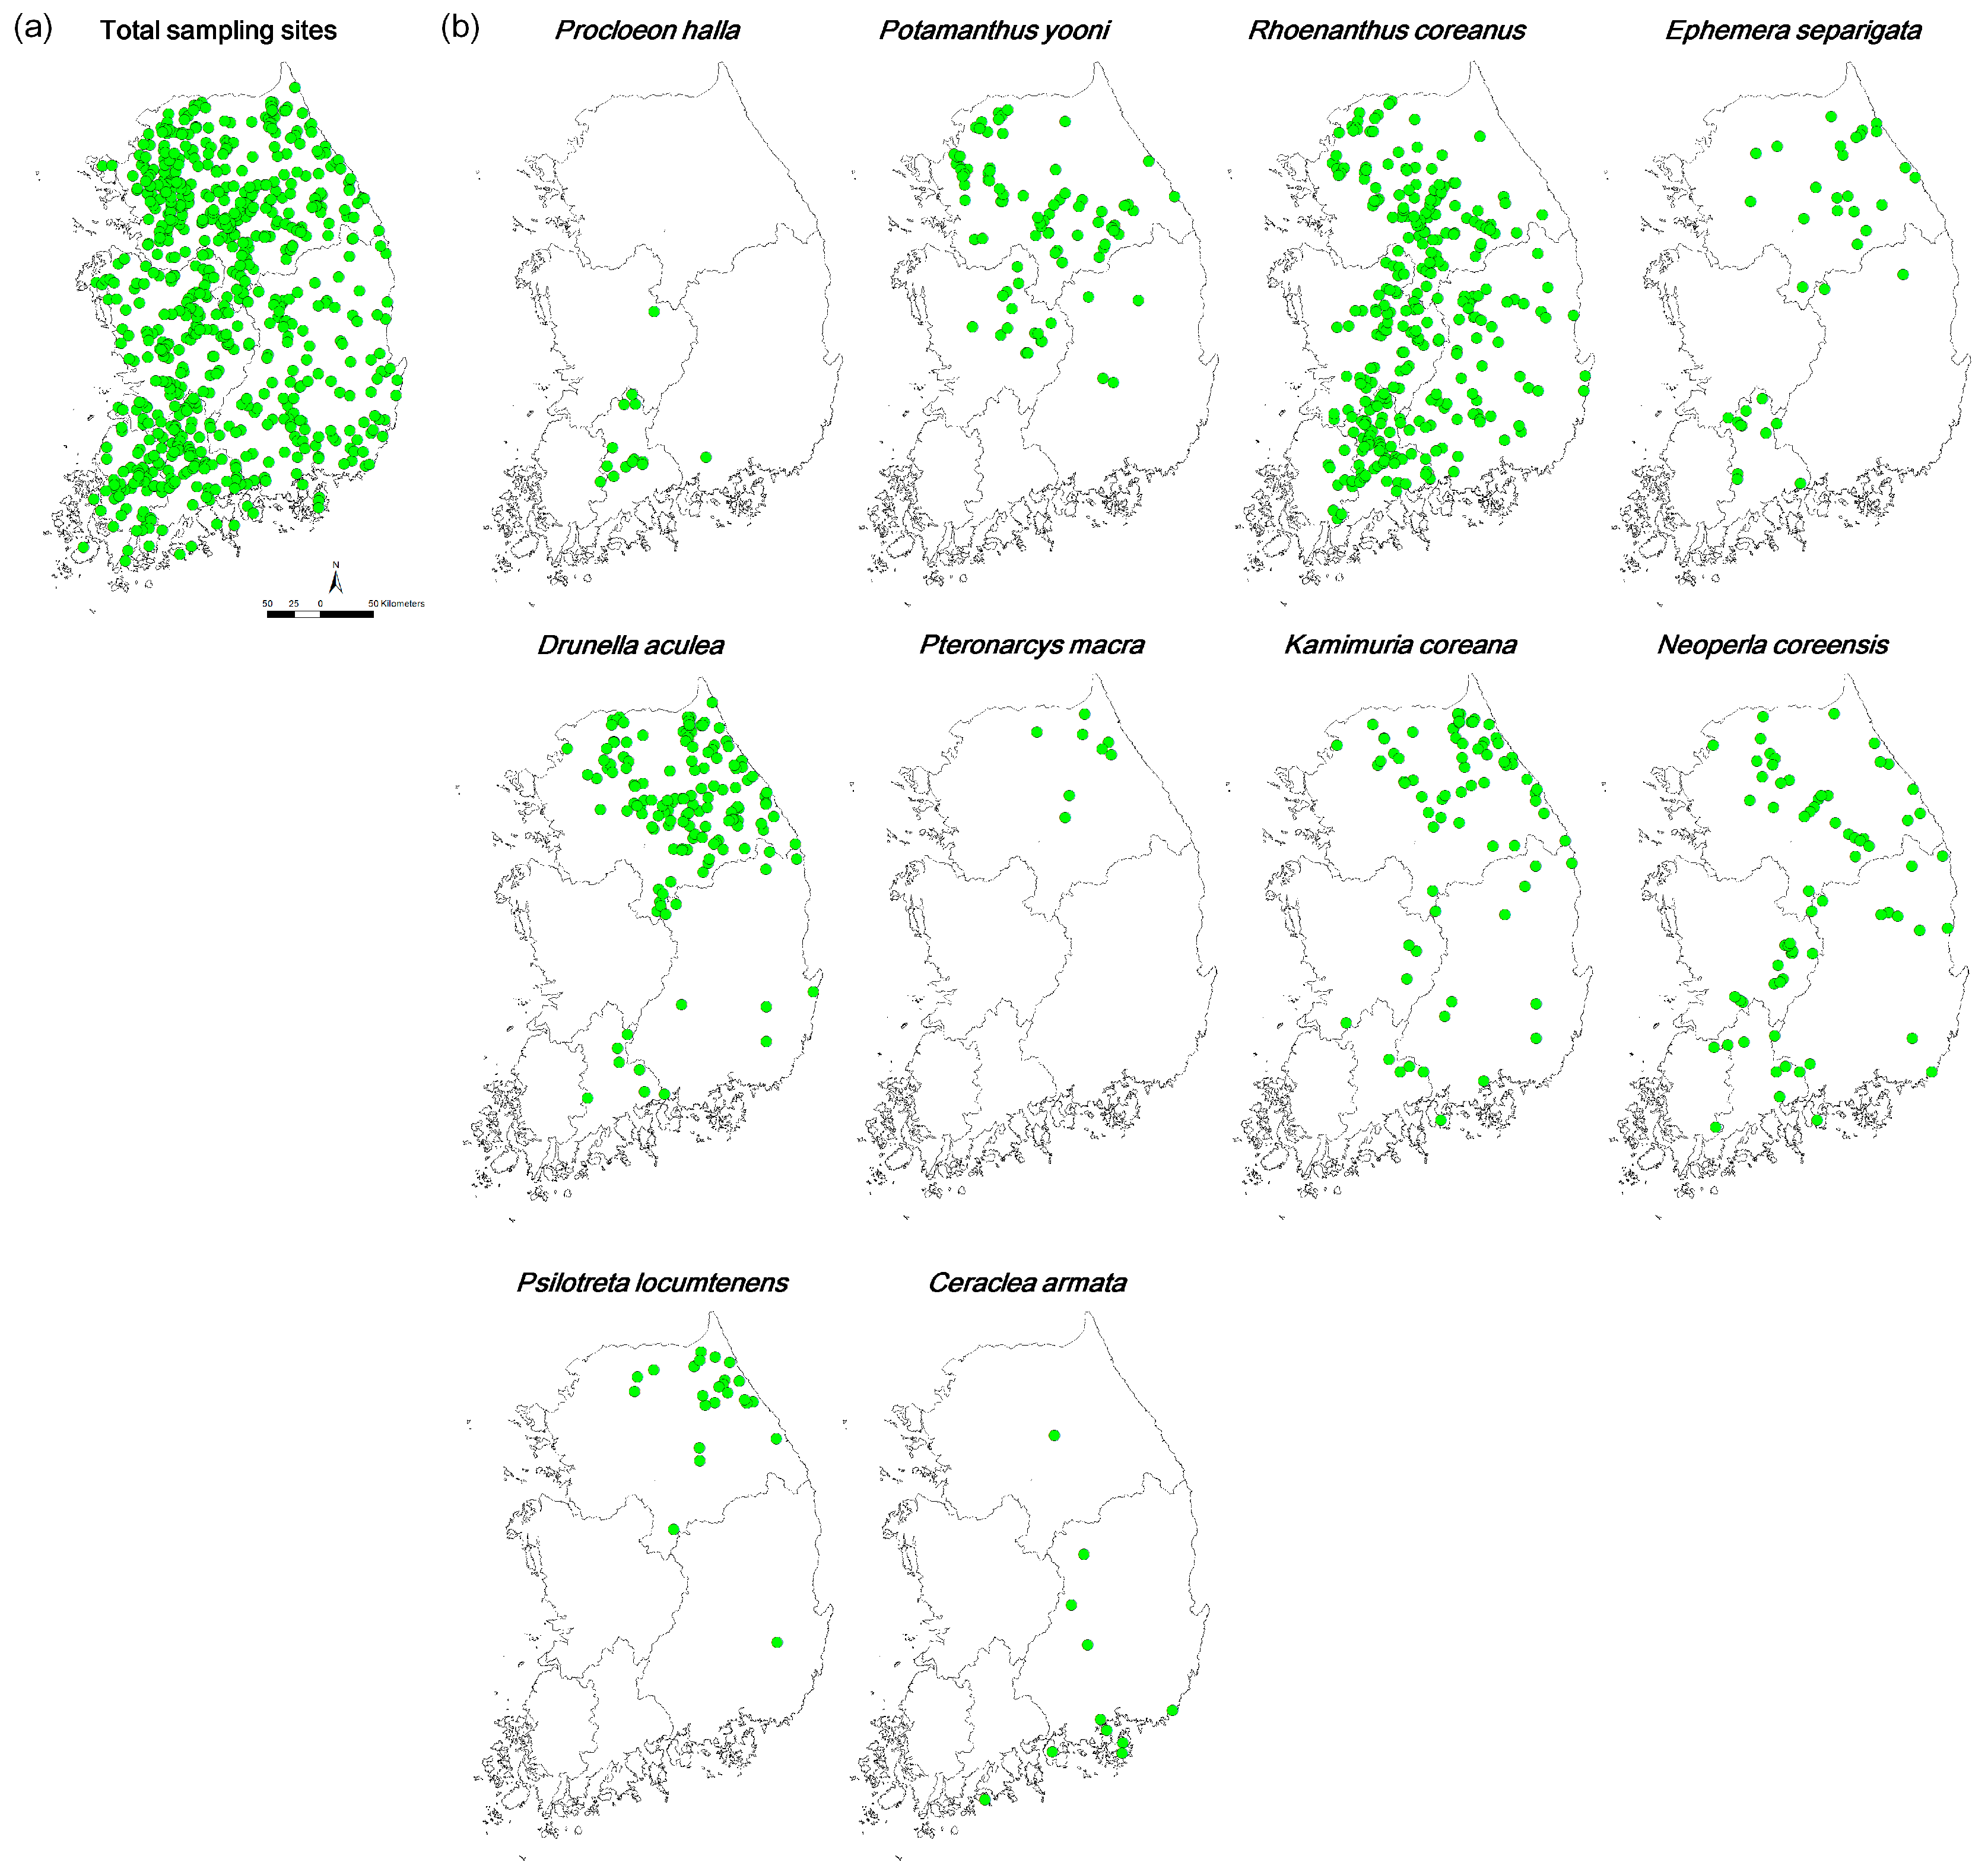
Figure 2.
Number of sampling sites for endemic EPT species.

Figure 3.
Dendrogram of cluster analysis based on the endemic EPT assemblages.
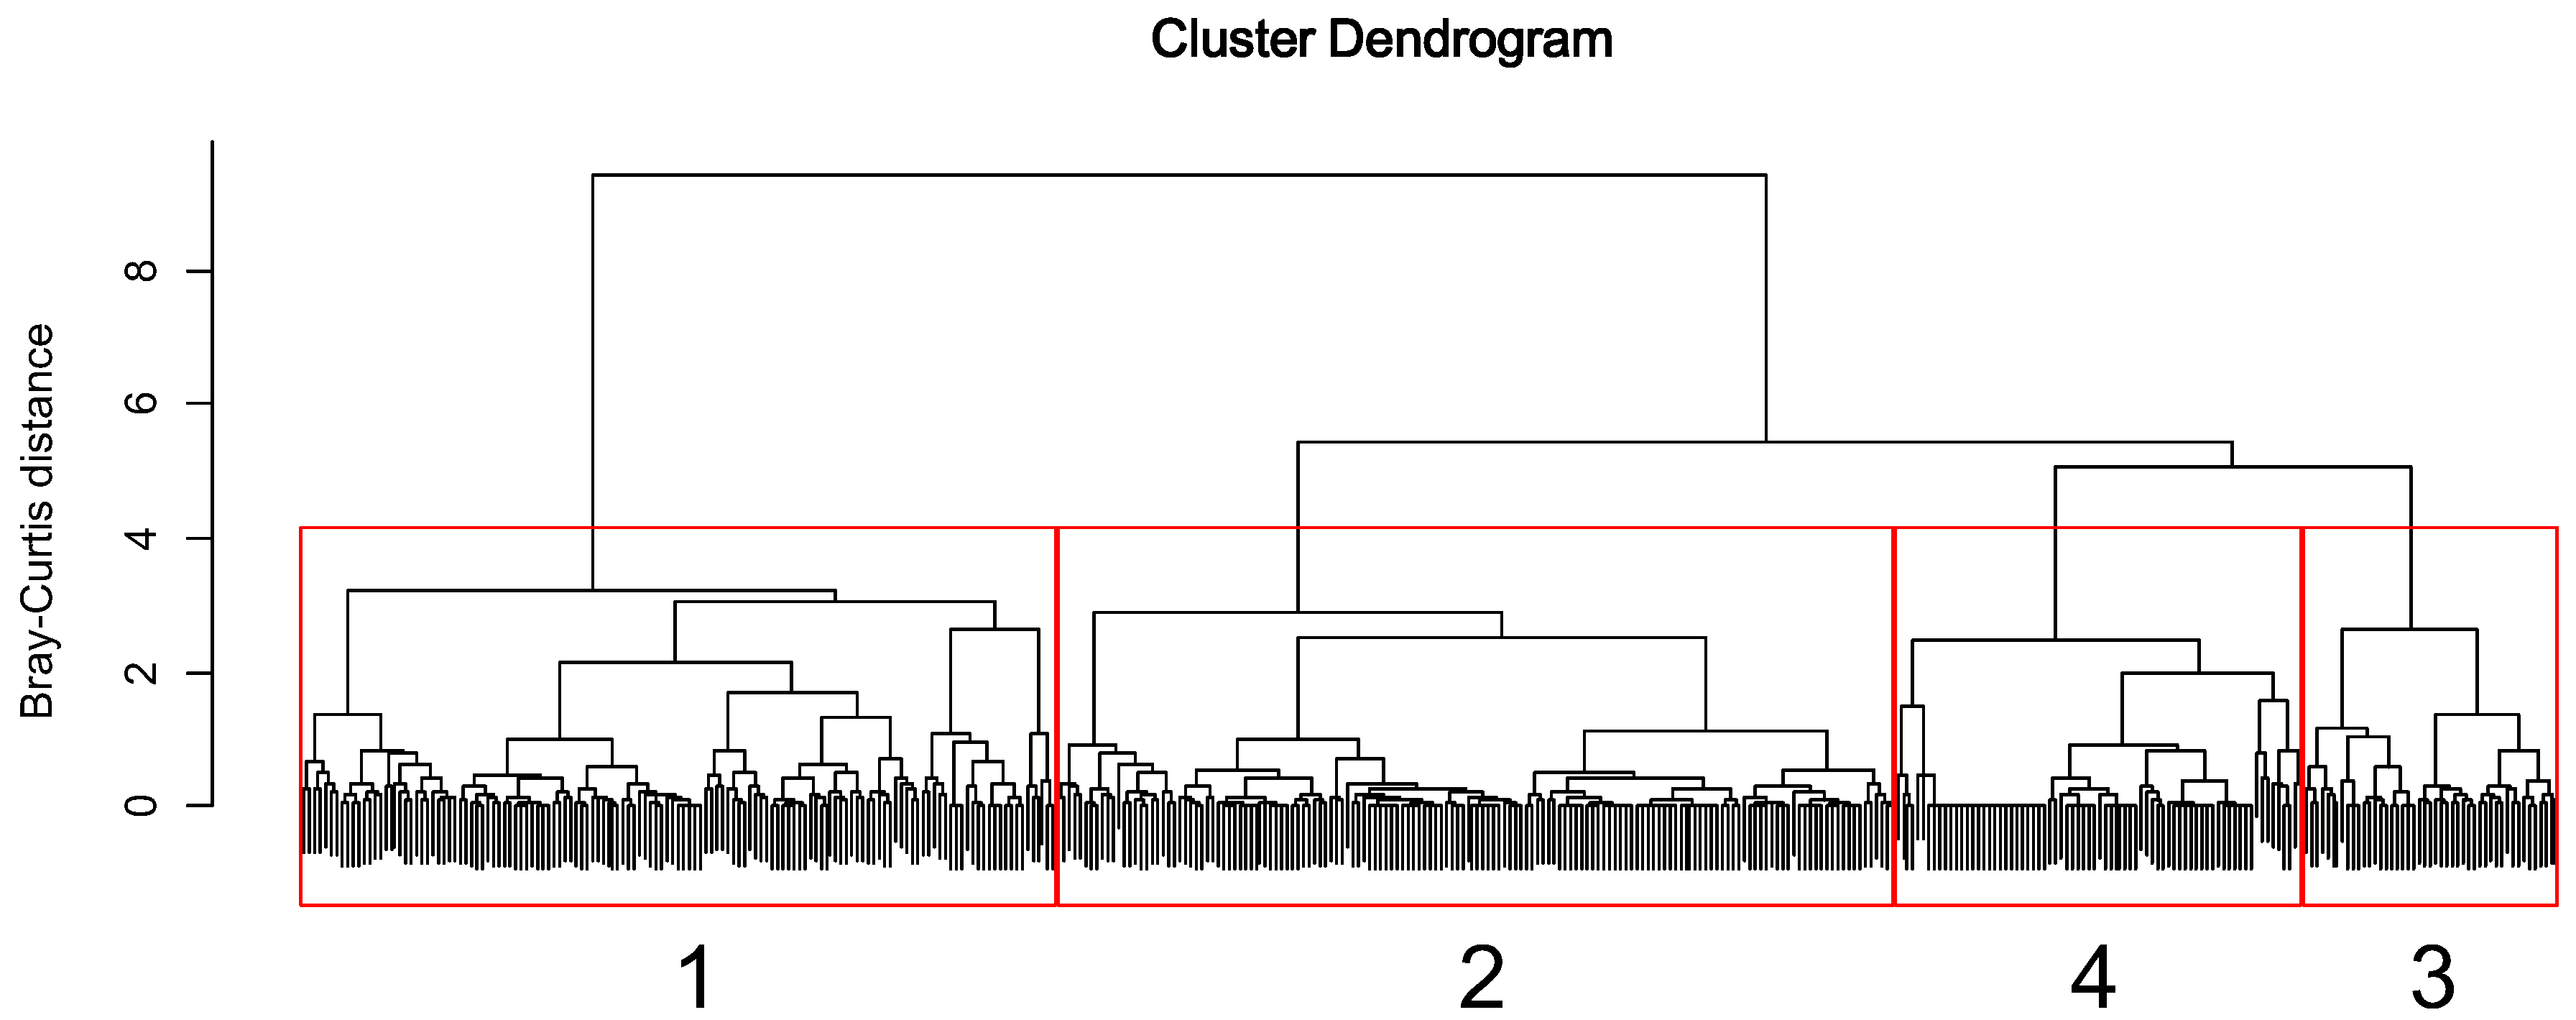
Figure 4.
Non-metric multidimensional scaling (NMS) ordination based on endemic EPT assemblages with fitted vectors of environmental factors. Black circles with four letters represent species, and others without letters indicate sampling sites. The direction and length of arrows represent the strength of the relationship between the environmental variables and the ordination axes. Only 10 environmental factors with R2 values > 0.3 are displayed in the figure. Abbreviation s for species and environmental factors are presented in Table 1 and Table 3, respectively. Cluster 1: square with green color; cluster 2: circle with red color; cluster 3: triangle with blue color, and; cluster 4: triangle with orange color.

Figure 5.
Relative importance in the occurrence of endemic EPT species based on the Random Forest model. Abbreviations of environmental factors are presented in Table 3.
Figure 5.
Relative importance in the occurrence of endemic EPT species based on the Random Forest model. Abbreviations of environmental factors are presented in Table 3.

Table 1.
Occurrence frequency of endemic Ephemeroptera, Plecoptera and Trichoptera (EPT) species recorded in South Korea from 2008 to 2013.
Table 1.
Occurrence frequency of endemic Ephemeroptera, Plecoptera and Trichoptera (EPT) species recorded in South Korea from 2008 to 2013.
| Order | Species | Abbreviation | River Basin (%) | ||||
|---|---|---|---|---|---|---|---|
| Total | Han | Nakdong | Guem | Yeongseum | |||
| Ephemeroptera | Procloeon halla | Proc | 14 (2.0) | 0 (0.0) | 1 (0.8) | 1 (0.8) | 12 (9.0) |
| Potamanthus yooni | Pota | 86 (12.0) | 67 (20.9) | 4 (3.1) | 15 (11.5) | 0 (0.0) | |
| Rhoenanthus coreanus | Rhoe | 301 (42.2) | 112 (35.0) | 57 (43.8) | 59 (45.4) | 73 (54.5) | |
| Ephemera separigata | Ephe | 36 (5.0) | 23 (7.2) | 2 (1.5) | 0 (0.0) | 11 (8.2) | |
| Drunella aculea | Drun | 151 (21.1) | 135 (42.2) | 10 (7.7) | 0 (0.0) | 6 (4.5) | |
| Plecoptera | Pteronarcys macra | Pter | 8 (1.1) | 8 (2.5) | 0 (0) | 0 (0.0) | 0 (0.0) |
| Kamimuria coreana | Kami | 75 (10.5) | 56 (17.5) | 11 (8.5) | 4 (3.1) | 4 (.03) | |
| Neoperla coreensis | Neop | 69 (9.7) | 33 (10.3) | 13 (10.0) | 14 (10.8) | 9 (6.7) | |
| Trichoptera | Psilotreta locumtenens | Psil | 25 (3.5) | 24 (7.5) | 1 (0.8) | 0 (0.0) | 0 (0.0) |
| Ceraclea armata | Cera | 11 (1.5) | 1 (0.3) | 9 (6.9) | 0 (0.0) | 1 (0.0) | |
Table 2.
Differences in the abundance of endemic EPT species among four clusters from a cluster analysis. The values in parenthesis are the standard deviation. Different alphabets indicate significant differences of variables among clusters based on the multiple comparison tests (p < 0.05).
Table 2.
Differences in the abundance of endemic EPT species among four clusters from a cluster analysis. The values in parenthesis are the standard deviation. Different alphabets indicate significant differences of variables among clusters based on the multiple comparison tests (p < 0.05).
| Order | Species | Cluster | |||
|---|---|---|---|---|---|
| 1 | 2 | 3 | 4 | ||
| Ephemeroptera | Procloeon halla | 0.00 (0.00) b | 0.03 (0.10) a | 0.00 (0.00) b | 0.32 (2.26) a |
| Potamanthus yooni | 0.42 (2.52) b | 0.16 (0.49) b | 8.22 (15.28) a | 0.00 (0.00) c | |
| Rhoenanthus coreanus | 0.46 (1.23) c | 25.24 (39.77) a | 9.47 (19.77) b | 0.88 (0.68) b | |
| Ephemera separigata | 0.13 (0.48) a | 0.09 (0.52) ab | 0.02 (0.11) b | 0.04 (0.16) ab | |
| Drunella aculea | 11.83 (16.3) a | 0.06 (0.32) b | 0.03 (0.13) b | 0.04 (0.14) b | |
| Plecoptera | Pteronarcys macra | 0.35 (2.62) a | 0.00 (0.00) b | 0.00 (0.00) b | 0.00 (0.00) b |
| Kamimuria coreana | 2.51 (6.35) a | 0.12 (0.65) b | 0.01 (0.05) b | 0.02 (0.08) b | |
| Neoperla coreensis | 0.19 (0.63) a | 1.23 (3.56) a | 0.02 (0.09) b | 0.03 (0.12) b | |
| Trichoptera | Psilotreta locumtenens | 1.13 (4.57) a | 0.00 (0.00) b | 0.00 (0.00) b | 0.00 (0.00) b |
| Ceraclea armata | 0.09 (0.56) a | 0.00 (0.04) b | 0.00 (0.00) b | 0.00 (0.04) ab | |
Table 3.
Relationship between environmental factors and NMS ordination based on endemic EPT assemblages. The environmental factors of the 10 highest R2 are presented as boldface letters.
Table 3.
Relationship between environmental factors and NMS ordination based on endemic EPT assemblages. The environmental factors of the 10 highest R2 are presented as boldface letters.
| Environmental Factor | Abbreviation | NMS1 | NMS2 | NMS3 | R2 | p |
|---|---|---|---|---|---|---|
| Geology | ||||||
| Latitude | Lati_X | −0.81 | 0.56 | 0.20 | 0.45 | 0.001 |
| Longitude | Longi_Y_ | −0.89 | −0.46 | −0.06 | 0.24 | 0.001 |
| Altitude (m) | −0.85 | −0.08 | 0.51 | 0.37 | 0.001 | |
| Slope (°) | −0.82 | −0.43 | 0.39 | 0.19 | 0.001 | |
| Distance from source | DFS | 0.85 | 0.45 | 0.29 | 0.08 | 0.001 |
| Meteorological factors | ||||||
| Annual average temperature (°C) | Ave_temp | 0.93 | −0.15 | −0.34 | 0.60 | 0.001 |
| August temperature (°C) | Aug_temp | 0.95 | 0.09 | −0.29 | 0.56 | 0.001 |
| January temperature (°C) | Jan_temp | 0.84 | −0.37 | −0.40 | 0.50 | 0.001 |
| Thermal range (°C) | Thermal_range | −0.20 | 0.91 | 0.37 | 0.20 | 0.001 |
| Precipitation (mm) | −0.09 | −0.90 | −0.42 | 0.05 | 0.002 | |
| Land use (%) | ||||||
| Urban | 0.36 | 0.47 | −0.81 | 0.10 | 0.001 | |
| Agriculture | 0.86 | 0.47 | 0.20 | 0.09 | 0.001 | |
| Forest | −0.78 | −0.54 | 0.33 | 0.20 | 0.001 | |
| Grass | 0.48 | 0.25 | −0.84 | 0.01 | 0.281 | |
| Bareland | 0.98 | 0.19 | 0.04 | 0.02 | 0.044 | |
| Hydrology | ||||||
| Stream order | Str_order | 0.87 | 0.46 | 0.20 | 0.23 | 0.001 |
| Water width (m) | W_width | 0.84 | 0.53 | 0.09 | 0.12 | 0.001 |
| Average depth (cm) | Ave_depth | 0.62 | 0.75 | 0.24 | 0.12 | 0.001 |
| Average velocity (cm/s) | Ave_velocity | −0.93 | 0.26 | 0.25 | 0.35 | 0.001 |
| Flow type | ||||||
| Riffle | −0.95 | −0.26 | 0.19 | 0.29 | 0.001 | |
| Run | 0.84 | 0.42 | −0.35 | 0.08 | 0.001 | |
| Pool | 1.00 | −0.02 | 0.10 | 0.07 | 0.001 | |
| Substrate (%) | ||||||
| Silt | 0.67 | 0.31 | −0.68 | 0.02 | 0.037 | |
| Clay | 0.66 | 0.70 | −0.28 | 0.10 | 0.001 | |
| Sand | 0.44 | 0.68 | −0.59 | 0.22 | 0.001 | |
| Small pebble | 0.84 | −0.54 | −0.04 | 0.04 | 0.003 | |
| Pebble | −0.12 | −0.80 | 0.59 | 0.04 | 0.002 | |
| Cobble | −0.61 | −0.46 | 0.64 | 0.22 | 0.001 | |
| Boulder | −0.73 | −0.63 | 0.28 | 0.18 | 0.001 | |
| Physicochemical water quality | ||||||
| Biological oxygen demand (mg/L) | BOD | 0.78 | 0.57 | −0.27 | 0.33 | 0.001 |
| Total nitrogen (mg/L) | TN | −0.03 | 1.00 | −0.09 | 0.15 | 0.001 |
| Ammonia nitrogen (mg/L) | NH3N | 0.55 | 0.82 | −0.16 | 0.05 | 0.002 |
| Nitrate nitrogen (mg/L) | NO3N | 0.23 | 0.97 | 0.12 | 0.13 | 0.001 |
| Total phosphate (mg/L) | TP. | 0.83 | 0.49 | −0.25 | 0.31 | 0.001 |
| Phosphate-phosphorus (mg/L) | PO4P | 0.91 | 0.40 | −0.12 | 0.21 | 0.001 |
| Chlorophyll a (mg/L) | Chl.a | 0.88 | 0.43 | −0.22 | 0.38 | 0.001 |
| Dissolved oxygen (mg/L) | DO | −0.68 | 0.58 | 0.46 | 0.19 | 0.001 |
| pH | pH | 0.80 | 0.46 | 0.39 | 0.10 | 0.001 |
| Conductivity (um/S) | Conductivity | 0.73 | 0.63 | −0.269 | 0.32 | 0.001 |
© 2017 by the authors. Licensee MDPI, Basel, Switzerland. This article is an open access article distributed under the terms and conditions of the Creative Commons Attribution (CC BY) license (http://creativecommons.org/licenses/by/4.0/).
Share and Cite
MDPI and ACS Style
Bae, M.-J.; Park, Y.-S. Diversity and Distribution of Endemic Stream Insects on a Nationwide Scale, South Korea: Conservation Perspectives. Water 2017, 9, 833. https://doi.org/10.3390/w9110833
AMA Style
Bae M-J, Park Y-S. Diversity and Distribution of Endemic Stream Insects on a Nationwide Scale, South Korea: Conservation Perspectives. Water. 2017; 9(11):833. https://doi.org/10.3390/w9110833
Chicago/Turabian StyleBae, Mi-Jung, and Young-Seuk Park. 2017. "Diversity and Distribution of Endemic Stream Insects on a Nationwide Scale, South Korea: Conservation Perspectives" Water 9, no. 11: 833. https://doi.org/10.3390/w9110833
Note that from the first issue of 2016, this journal uses article numbers instead of page numbers. See further details here.