Tree Shelterbelts as an Element to Improve Water Resource Management in Central Asia
by
Niels Thevs
1,*, 
Eva Strenge
2,
Kumar Aliev
1,
Maksat Eraaliev
3,
Petra Lang
2,
Azim Baibagysov
4 and
Jianchu Xu
5 1
World Agroforestry Center, Central Asia Office, Bishkek 720001, Kyrgyzstan
2
Faculty Regional and Environmental Sciences, University of Trier, 54286 Trier, Germany
3
Faculty of Social and Poöitical Sciences, German Kazakh University, Almaty 050010, Kazakhstan
4
Department of Biodiversity and Bioresources, Faculty of Biology and Biotechnology, al Farabi Kazakh National University, Almaty 050040, Kazakhstan
5
Key Laboratory of Economic Plants and Biotechnology, Kunming Institute of Botany, Kunming 650201, China
*
Author to whom correspondence should be addressed.
Water 2017, 9(11), 842; https://doi.org/10.3390/w9110842
Submission received: 24 August 2017
/
Revised: 15 October 2017
/
Accepted: 20 October 2017
/
Published: 31 October 2017
(This article belongs to the Special Issue The Future of Water Management in Central Asia)
Abstract
:In Central Asia, agriculture, notably irrigated agriculture, is the largest water consumer. Currently, flood and furrow irrigation are the dominant irrigation methods in Central Asia, in particular in the post-Soviet countries. Against the background of current and increasing competition for water—e.g., through reduced river runoffs in the course of climate change—water consumption of agriculture needs to be reduced. On the field plot level, improved irrigation technologies, like drip irrigation or plastic mulch, can reduce water consumption substantially. Alternatively, tree lines as wind breaks (shelterbelts) also can reduce crop water consumption, as shown by research from many drylands around the world. As previous research has concentrated on crop water consumption and not on tree water consumption, this paper brings the two together, in order to approach a more holistic picture, in how far shelterbelt systems, including the trees, may have the potential to save water or not. Crop water consumption was assessed through the Penman–Monteith approach for corn, wheat, potato, barley, and pear under open field conditions and under an assumed influence of a tree shelterbelt. Tree water consumption was investigated through sap flow measurements. Crop water consumption was reduced by 10–12% under influence of a shelterbelt compared to open field conditions. When water consumption of shelterbelts was added, a slight reduction of water consumption of the whole crop-shelterbelt system was found for corn, potato, and pear under the assumption 25 ha (500 × 500 m) field sizes. Under an assumption of 4 ha (200 × 200 m) field size, water consumption of the whole crop-shelterbelt system was higher for all crops investigated except for pear. The results suggest that shelterbelts may play a role in improving water resource management in Central Asia in the context of water demanding crops, like corn or cotton. In further research, other effects of shelterbelts, like increased crop yields and additional income from trees, need to be investigated.
Keywords:
agroforestry; poplar; sap flow; evapo-transpiration; irrigated agriculture; Kyrgyzstan; Kazakhstan1. Introduction
Central Asia, which extends from the Caspian Sea into Mongolia, is largely dominated by drylands and mountains [1]. Furthermore, Central Asia is the region with the worldwide highest number of endorheic or closed river basins, i.e., rivers that do not drain into the sea, but in an end-lake or inland delta [2]. The most well-known end-lake was the Aral Sea [3]. The desiccation of the Aral Sea—mostly due to irrigation water withdrawals—is known as one of the worst man-made environmental disasters; and scientists have warned that the “Aral Sea Syndrome” could repeat in other parts of the region [4]. Agriculture is concentrated along the rivers, e.g., along the Amu Darya, Syr Darya, Chui, or Talas and their tributaries as well as in the forelands of the mountain ranges, e.g., along the northern slopes of the Tianshan. Agriculture depends on irrigation due to the semi-arid to arid climate of the agricultural areas of the region. Agriculture also is the major water consumer all over Central Asia, which causes conflicts over water and competition for water between water users, like irrigated agriculture and natural ecosystems [5]. It is expected that water shortages and competition will be aggravated in the future in the course of climate change [6].
Currently, flood and furrow irrigation are the dominant irrigation methods in Central Asia, in particular in the post-Soviet countries. Against the background of current and increasing competition for water, water consumption of agriculture needs to be reduced. On field plot level, improved irrigation technologies, like drip irrigation or plastic mulch, can reduce water consumption substantially, as shown in Xinjiang, China [7,8].
Next to sheer technology driven approaches, sound crop selection and agroforestry systems also may help to reduce water consumption or improve water productivity in irrigated agriculture. Systems of tree lines along field plots, i.e., tree shelterbelt systems, are the most prominent agroforestry system in the irrigated agriculture of Central Asia. Such shelterbelts were promoted during Soviet Union times. After the collapse of the Soviet Union, shelterbelts were largely cut down, as people urgently needed fuel wood to compensate for the collapse of regular energy supplies.
Shelterbelts were widely reported to reduce water consumption (evapo-transpiration) of crops, help to increase crop yields, and help to increase soil moisture, as they trap snow [9,10]. Crop water consumption is reduced mainly as shelterbelts substantially reduce wind speed and to a minor extent as inside a shelterbelt system air temperature is lower and air humidity is higher than outside a shelterbelt system [11,12]. Shelterbelts reduced wind speed on the leeward side to almost zero within a distance of five times the shelterbelt tree height. Moving away from shelterbelt, wind speed increased to half and 70% of the open field wind speed at a distance of 15 to 20 times shelterbelt tree height and 25 to 30 times shelterbelt tree height, respectively [10]. In contrast, after [11] in a distance of 25 times shelterbelt height wind speed was only reduced by 10% compared to open field conditions. An overall wind speed reduction in shelterbelt systems of 36% and a reduction of crop water consumption by 15 to 30% compared to non-shelterbelt conditions, respectively were proposed by [10,13], while [9] only proposed a reduction of crop water consumption by 15–20%. Reduction of wind speed by 30–40% and a decrease of air temperature by 1 °C through the impact of shelterbelts was published by [14]. Reduction of evapotranspiration of 35–45% compared to open field conditions on the windward side of shelterbelts in the vicinity of less than 50 m from the shelterbelt was reported by [15]. On the leeward side, a noticeable reduction of evapotranspiration was found as far as 300 m at a tree height of 8–10 m. In addition, shelterbelts trapped snow so that 70–90 mm of soil moisture was added from snow melt compared to open field conditions [9,15].
Apple yields increased by 50% within a distance of five times the shelterbelt tree height [10]. Wheat yields and potato yields increased by 20–30% and 37%, respectively, in a shelterbelt system in the Kazakh steppe compared to open field conditions [15]. Wheat yield increases of 15% in shelterbelt systems in Kazakhstan were found by [16]. In general, crop yields increased between 5 times to 15 times the shelterbelt tree height leeward of the given shelterbelt [9].
These agroforestry systems could help to reduce water that is consumed by agriculture and thus contribute to a more sustainable and climate change resilient water resource management in Central Asia and beyond.
However, literature so far has concentrated on reduction of water consumption of the crops, while water consumption of the shelterbelt trees has been neglected. Therefore, the general objective of this paper is to help clarify if shelterbelt systems can play a role to improve water resource management in Central Asia in the future. To accomplish that objective, we present a holistic approach to water consumption of shelterbelt systems based upon the integrated analyses of shelterbelt tree water consumption data and crop water consumption data.
2. Materials and Methods
2.1. Study Region
The study was carried out in the village Karasay Batyr, Korday County, in the upper Chui Valley in south-eastern Kazakhstan in 2016. The geographical position is 42.38° N and 75.66° E. The elevation is 1095 m above sea level. The upper Chui Valley stretches from the villages of Karasay Batyr and Kemin, about 100 km east of Bishkek, to Bishkek, the capital of Kyrgyzstan.
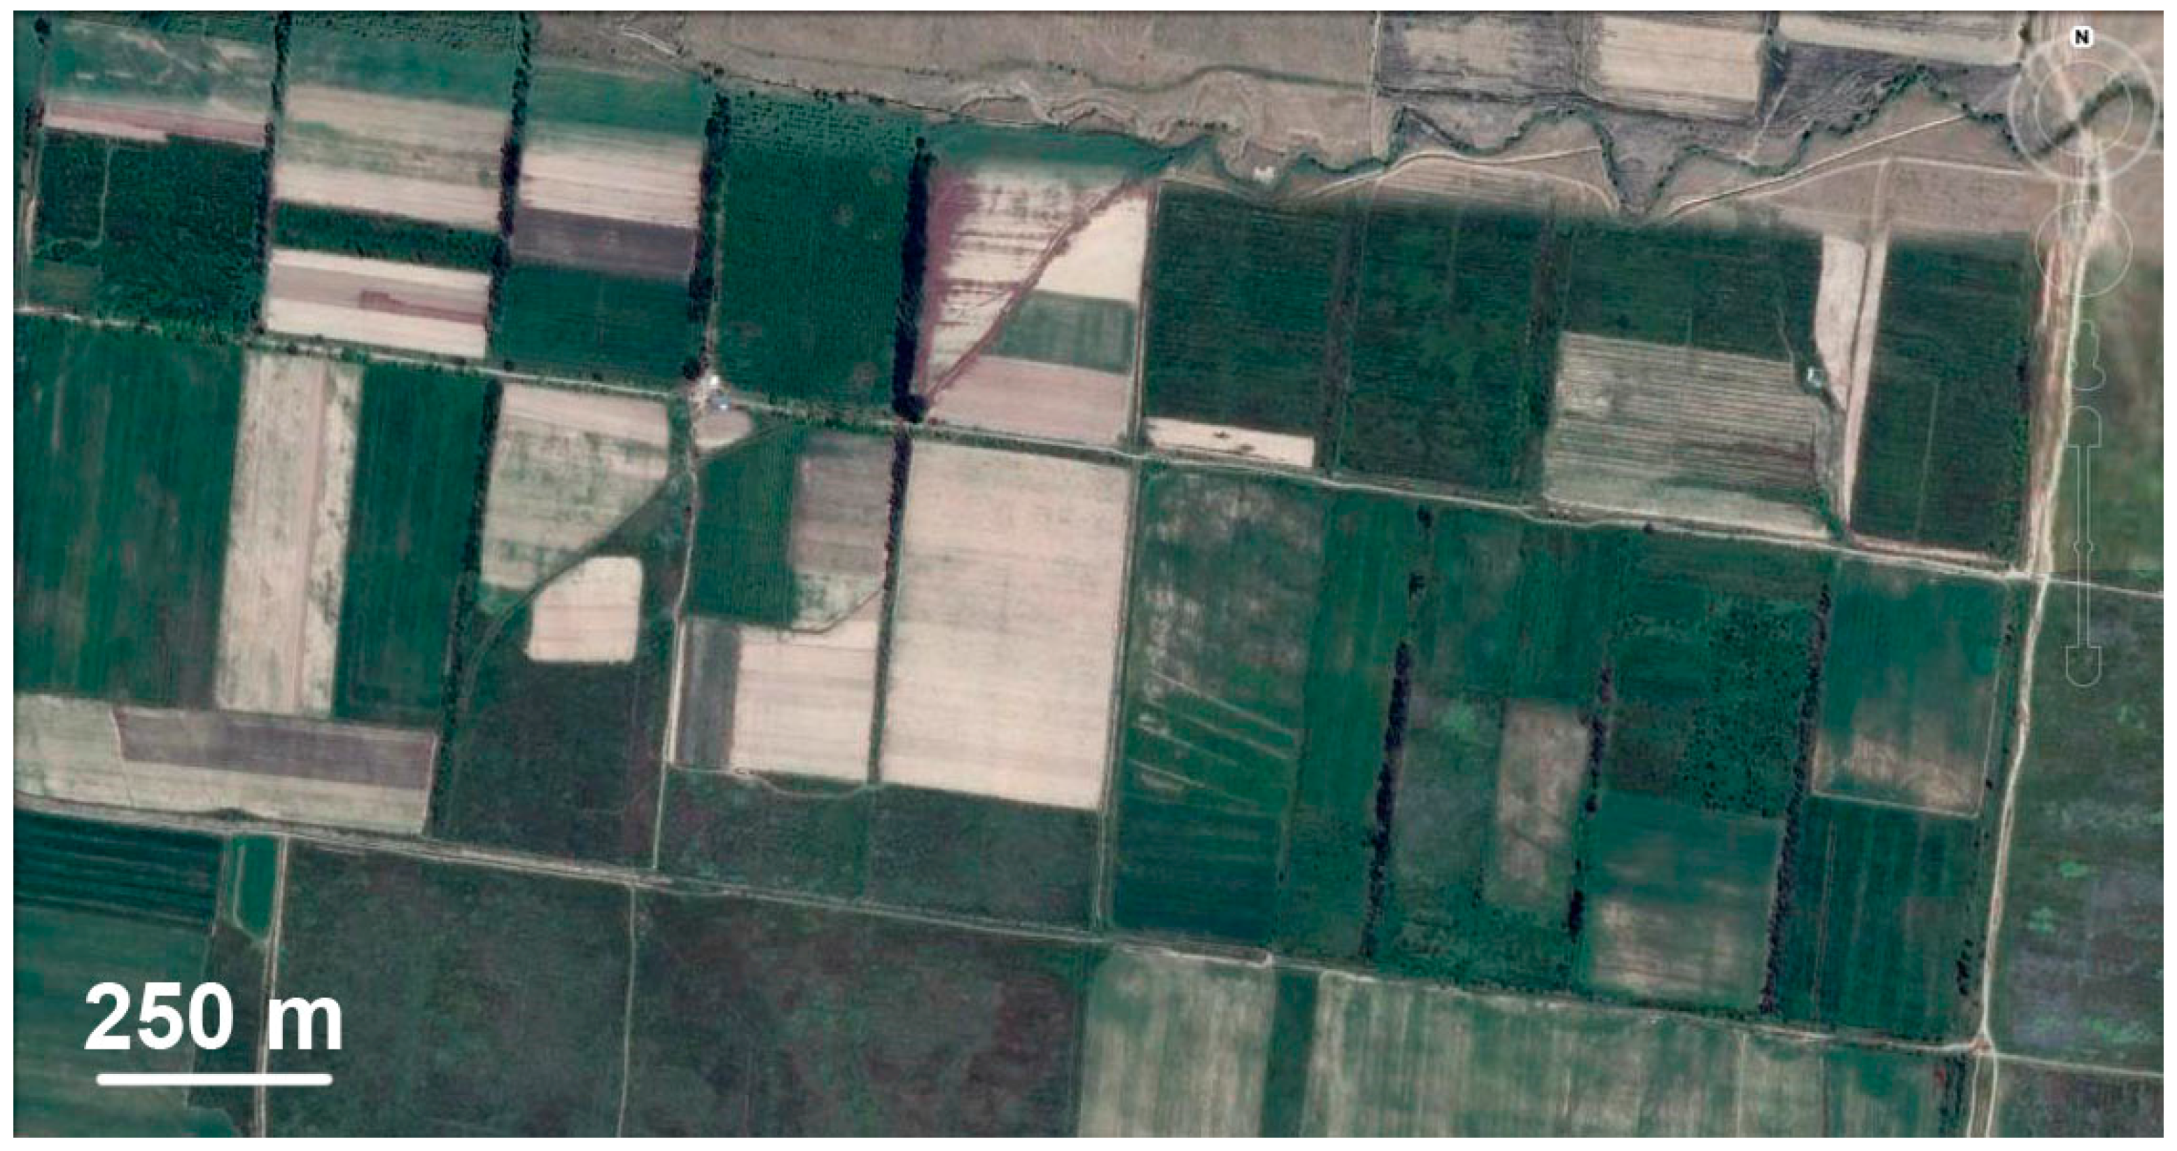
During Soviet Union times, Karasay Batyr was a Kolhoz, which was specialized on fruit production, mainly apple and pear. Field plots were of an average size of 250 × 250 m bordered by shelterbelts of poplars (Populus alba and P. nigra) on all four sides. Thus, the agricultural land in Karasay Batyr was structured by a 250 × 250 m grid of shelterbelts.
Today, most of the field plots are grown with grassy vegetation and are cut once or twice a year for hay-making. The field plots, which are under cultivation, are planted with potato or corn. The field plot and shelterbelt structure of today is illustrated in Figure 1.
The climate is continental and semi-arid with a rainy season in spring and hot, dry summers. The closest climate station is Tokmok (Table 1), which is 34 km from Karasy Batyr.
In the whole Chui Valley, in Kazakhstan and Kyrgyzstan, the major crops today are wheat, potato, corn, fodder plants, and on smaller areas fruit trees and barley (http://www.fao.org/ag/agp/agpc/doc/counprof/kyrgi.htm). Shelterbelt trees are poplars (Populus alba and P. nigra) in the more rainy and more intensively irrigated parts, while elm (mostly Ulmus minor) and Acacia species dominate on drier and less irrigated sites (own field observations and [17]).
2.2. Water Consumption of Shelterbelt System vs. Non Shelterbelt System
The methodological approach of this study was to assess water consumption of major crops of the Chui Valley under open field conditions with no shelterbelts present versus conditions as inside a shelterbelt system. These results are combined with water consumption of the trees of those shelterbelts, in order to obtain the water consumption of crops without shelterbelts versus corresponding crop-shelterbelt systems. Crop water consumption was assessed on the basis of climate data after [18], while tree water consumption was measured through sap flow measurements.
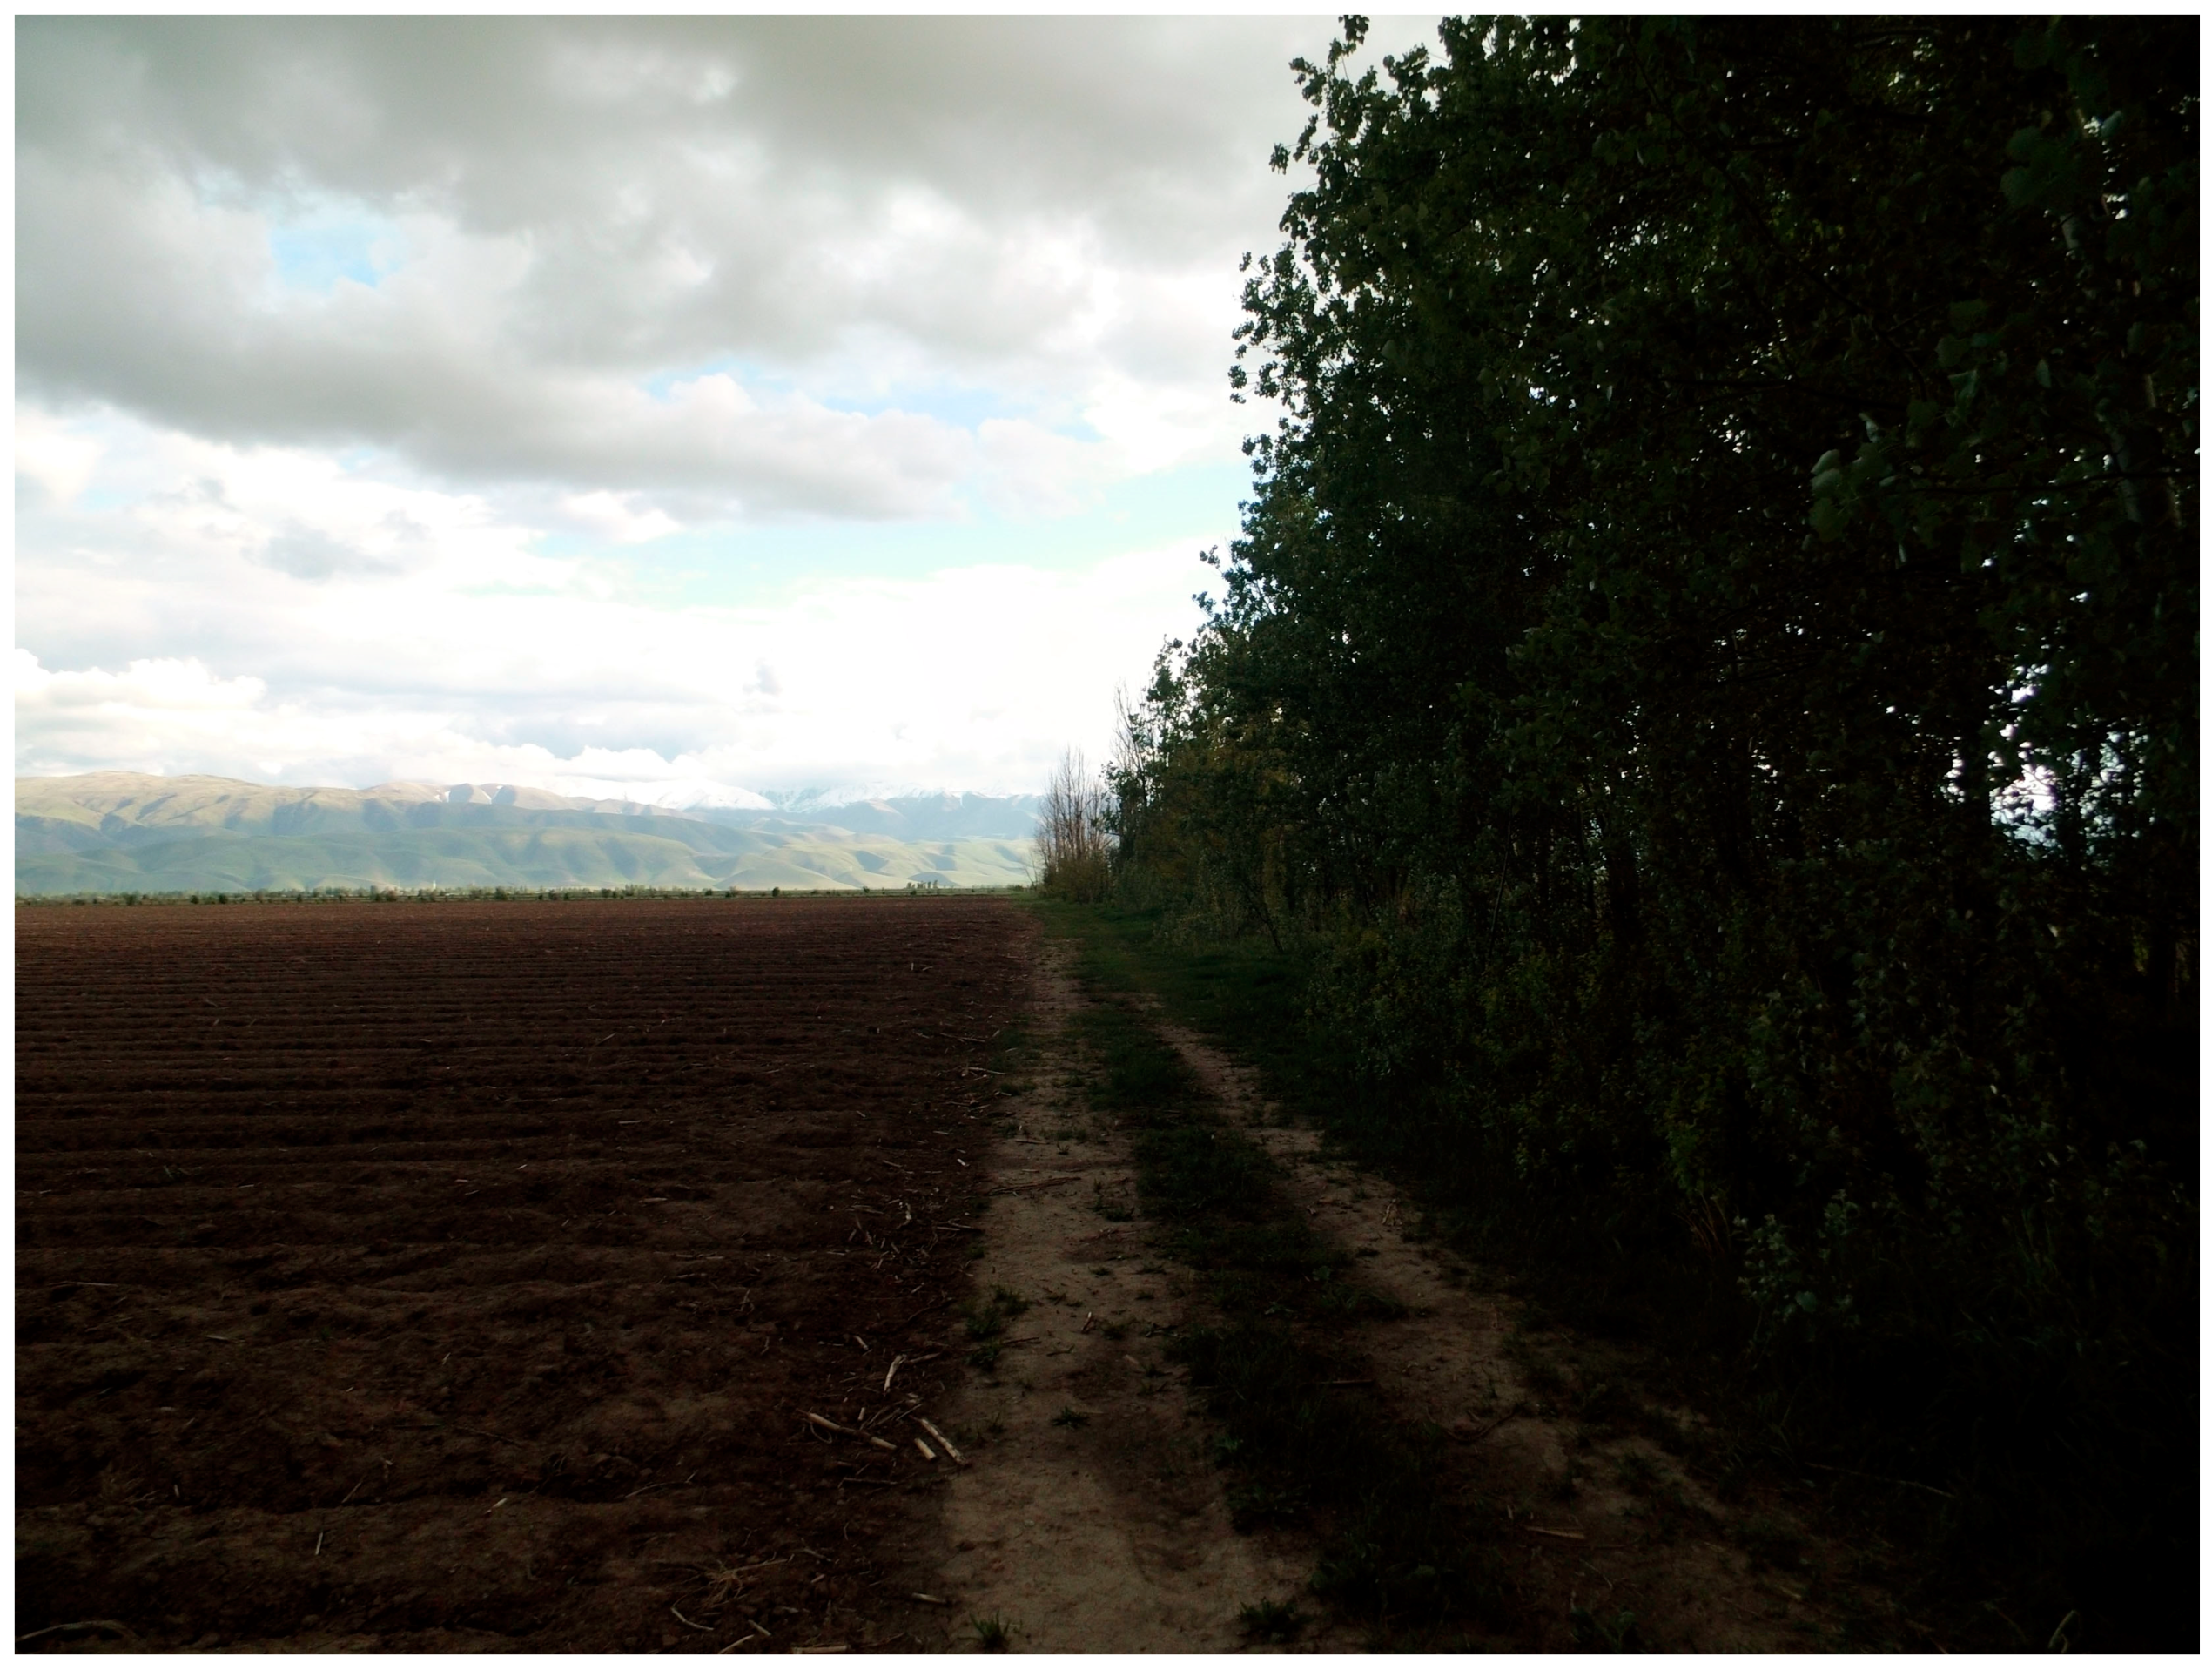
Karasy Batyr was taken as an example to represent the climate, crops, and water consumption conditions of the upper Chui Valley shared by Kyrgyzstan and Kazakhstan. In Karasay Batyr, a shelterbelt was chosen, which still was in good conditions, i.e., dominated by poplars (P. alba) instead of having a mix of tree species, trees of uniform height, not interrupted by gaps between trees, and continuous water supply to the trees (Figure 2).
From this shelterbelt, three representative poplars (P. alba) were chosen (Table 2) for the sap flow measurements [19]. Sap flow was measured through the method of heat dissipation using the system PROSALOG by UP GmbH from Germany [20]. Thereby, a pair of sensor needles (2 cm long) was fixed into each tree at 140 cm and 150 cm tree height, respectively. The top needle released heat pulses into the sapwood every ten minutes. After each heat pulse, the temperature difference between both needles was measured. These temperature differences were calculated into sap flow density as follows [19]
u = 0.714 ((dT/dTmax) − 1)1.231
- u—sap flow density (mL cm−2 min−1)
- dT—temperature difference between the two needles of one needle pair
- dTmax—maximal dT, i.e., dT at zero sap flow
dTmax was chosen as the average temperature difference at the lowest water vapor pressure deficit over two-week periods. The average temperature difference was calculated from the temperature differences 20 min before to 20 min after the lowest water vapor pressure deficit of a given two-week time periods.
Sap flow density was calculated into sap flow by using the equation
ϕ = u SA
- ϕ—sap flow (mL min−1)
- u—sap flow density (mL cm−2 min−1)
- SA—sap wood area (cm2)
The xylem thickness, from which sap wood area was calculated, was determined visually from tree cores. On each tree two perpendicular cores were taken with a tree corer of 5 mm diameter from Suunto, Finland. Sap flow was recorded from 15 June until 3 August 2016.
Leafs started to emerge beginning of April and were fully developed by mid-April. Leafs turned yellow during October and fell completely down by 24 October. Therefore, the growing season for this study was defined as 1 April until 24 October.
Reference and crop evapo-transpiration (ETo and ETc) for conditions with and without shelterbelt were calculated after [18] for this growing season. Thereby, ETc was calculated for wheat, corn, potato, barley, and fruit trees (pear).
Outside of the reach of shelterbelts, a climate station was operated during parts of the growing season, in order not to conflict with farm operations. The climate station was equipped with the following sensors, all from Decagon Devices, USA: Sensor for air temperature and humidity (VP-4), radiation, and wind speed (DS-2 Anemometer). Data were logged by an EM-50 data logger. Climate data were recorded every minute and aggregated to daily values. Data gaps were filled by establishing relationships between air temperature, humidity, and wind speed between data measured at Tomok (https://rp5.ru/Wetterarchiv_in_Tokmok) and Karasay Batyr. Radiation for the data gaps was calculated as suggested by [18]. These filled daily climate data finally yielded ETo and ETc under conditions not influenced by any shelterbelt (open field conditions).
ETo and ETc of the above referred crops, under the influence of a shelterbelt, were assessed under the following assumptions:
Assumption I: Shelterbelts reduce wind speed by 20% of open field conditions.
Assumption II: Shelterbelts reduce wind speed by 35% of open field conditions, decrease mean air temperature by 1 °C, and increase air humidity by 0.05 compared to open field conditions.
Thereby, assumption I is a conservative assumption, which reflects the lower boundary of impacts by shelterbelts on wind speed (cf. [9,10,11,13,14]). Assumption II reflects the average of the impacts by shelterbelts on climatic features taken from [9,10,13,14].
To estimate the water consumption for the shelterbelt systems versus open field conditions, first ETo and ETc was expressed as evapo-transpiration for a 4 ha (200 × 200 m) and a 25 ha (500 × 500 m) field plot under open field conditions, under assumption I, and under assumption II, respectively.
The sap flow results were upscaled to 25 m of homogenous shelterbelt. In these 25 m, all trees were mapped and their DBH was recorded. Xylem thickness and sapwood area were determined from 25 trees which were selected randomly. DBH and sapwood area yielded the relationship
Xylem area = 0.4301 DBH2 + 0.235 DBH, R2 = 0.94
This relationship was used to assess the sapwood area of all trees in the mapped shelterbelt. The sap flow of those 25 m shelterbelt was calculated in 10 min time steps from the average sap flow density of the three sensor trees. Finally, these sap flow values were summed up to daily sap flow values for hose 25 m shelterbelt. Based on the sap flow of those 25 m shelterbelt and on ETo, an average crop coefficient (Kc) was calculated, which was used to assess the water consumption of the shelterbelt during the whole growing season. Under the assumption of square shaped fields, as they were common in Soviet Union shelterbelt systems, there are 800 m and 2000 m of shelterbelt that border the 4 ha and 25 ha field, respectively.
3. Results
Climate data as used for the ETo and further ETc calculations are shown in Table 3.
ETo and ETc, for corn as an example, in the course of the growing season are shown in Figure 3 for open field conditions and for the two sets of assumption regarding the impact of shelterbelts on climate data.
ETo reaches its maximum in June (7–13 June) with over 7 mm/d. During these days, air humidity within a given day ranges between 0.18 and 0.6, which is substantially lower than before and after with values between 0.3 and 0.8. ETc of corn peaks in July with around 9 mm/d, when ETo is high and corn is it its mid development stage.
Regarding ETc over the whole growing season, corn consumes most water (815.1 mm under open field conditions) followed by potato, wheat, and barley (Table 4). Only pears consume more water than corn, 1093 mm over the growing season under open field conditions (Table 4).
The most pronounced reduction of water consumption through the effect of shelterbelts was observed for pear and corn with a reduction by 12% and 6% under the assumption II and assumption I, respectively. As for barley, there is only a reduction of crop water consumption by 8% under assumption II.
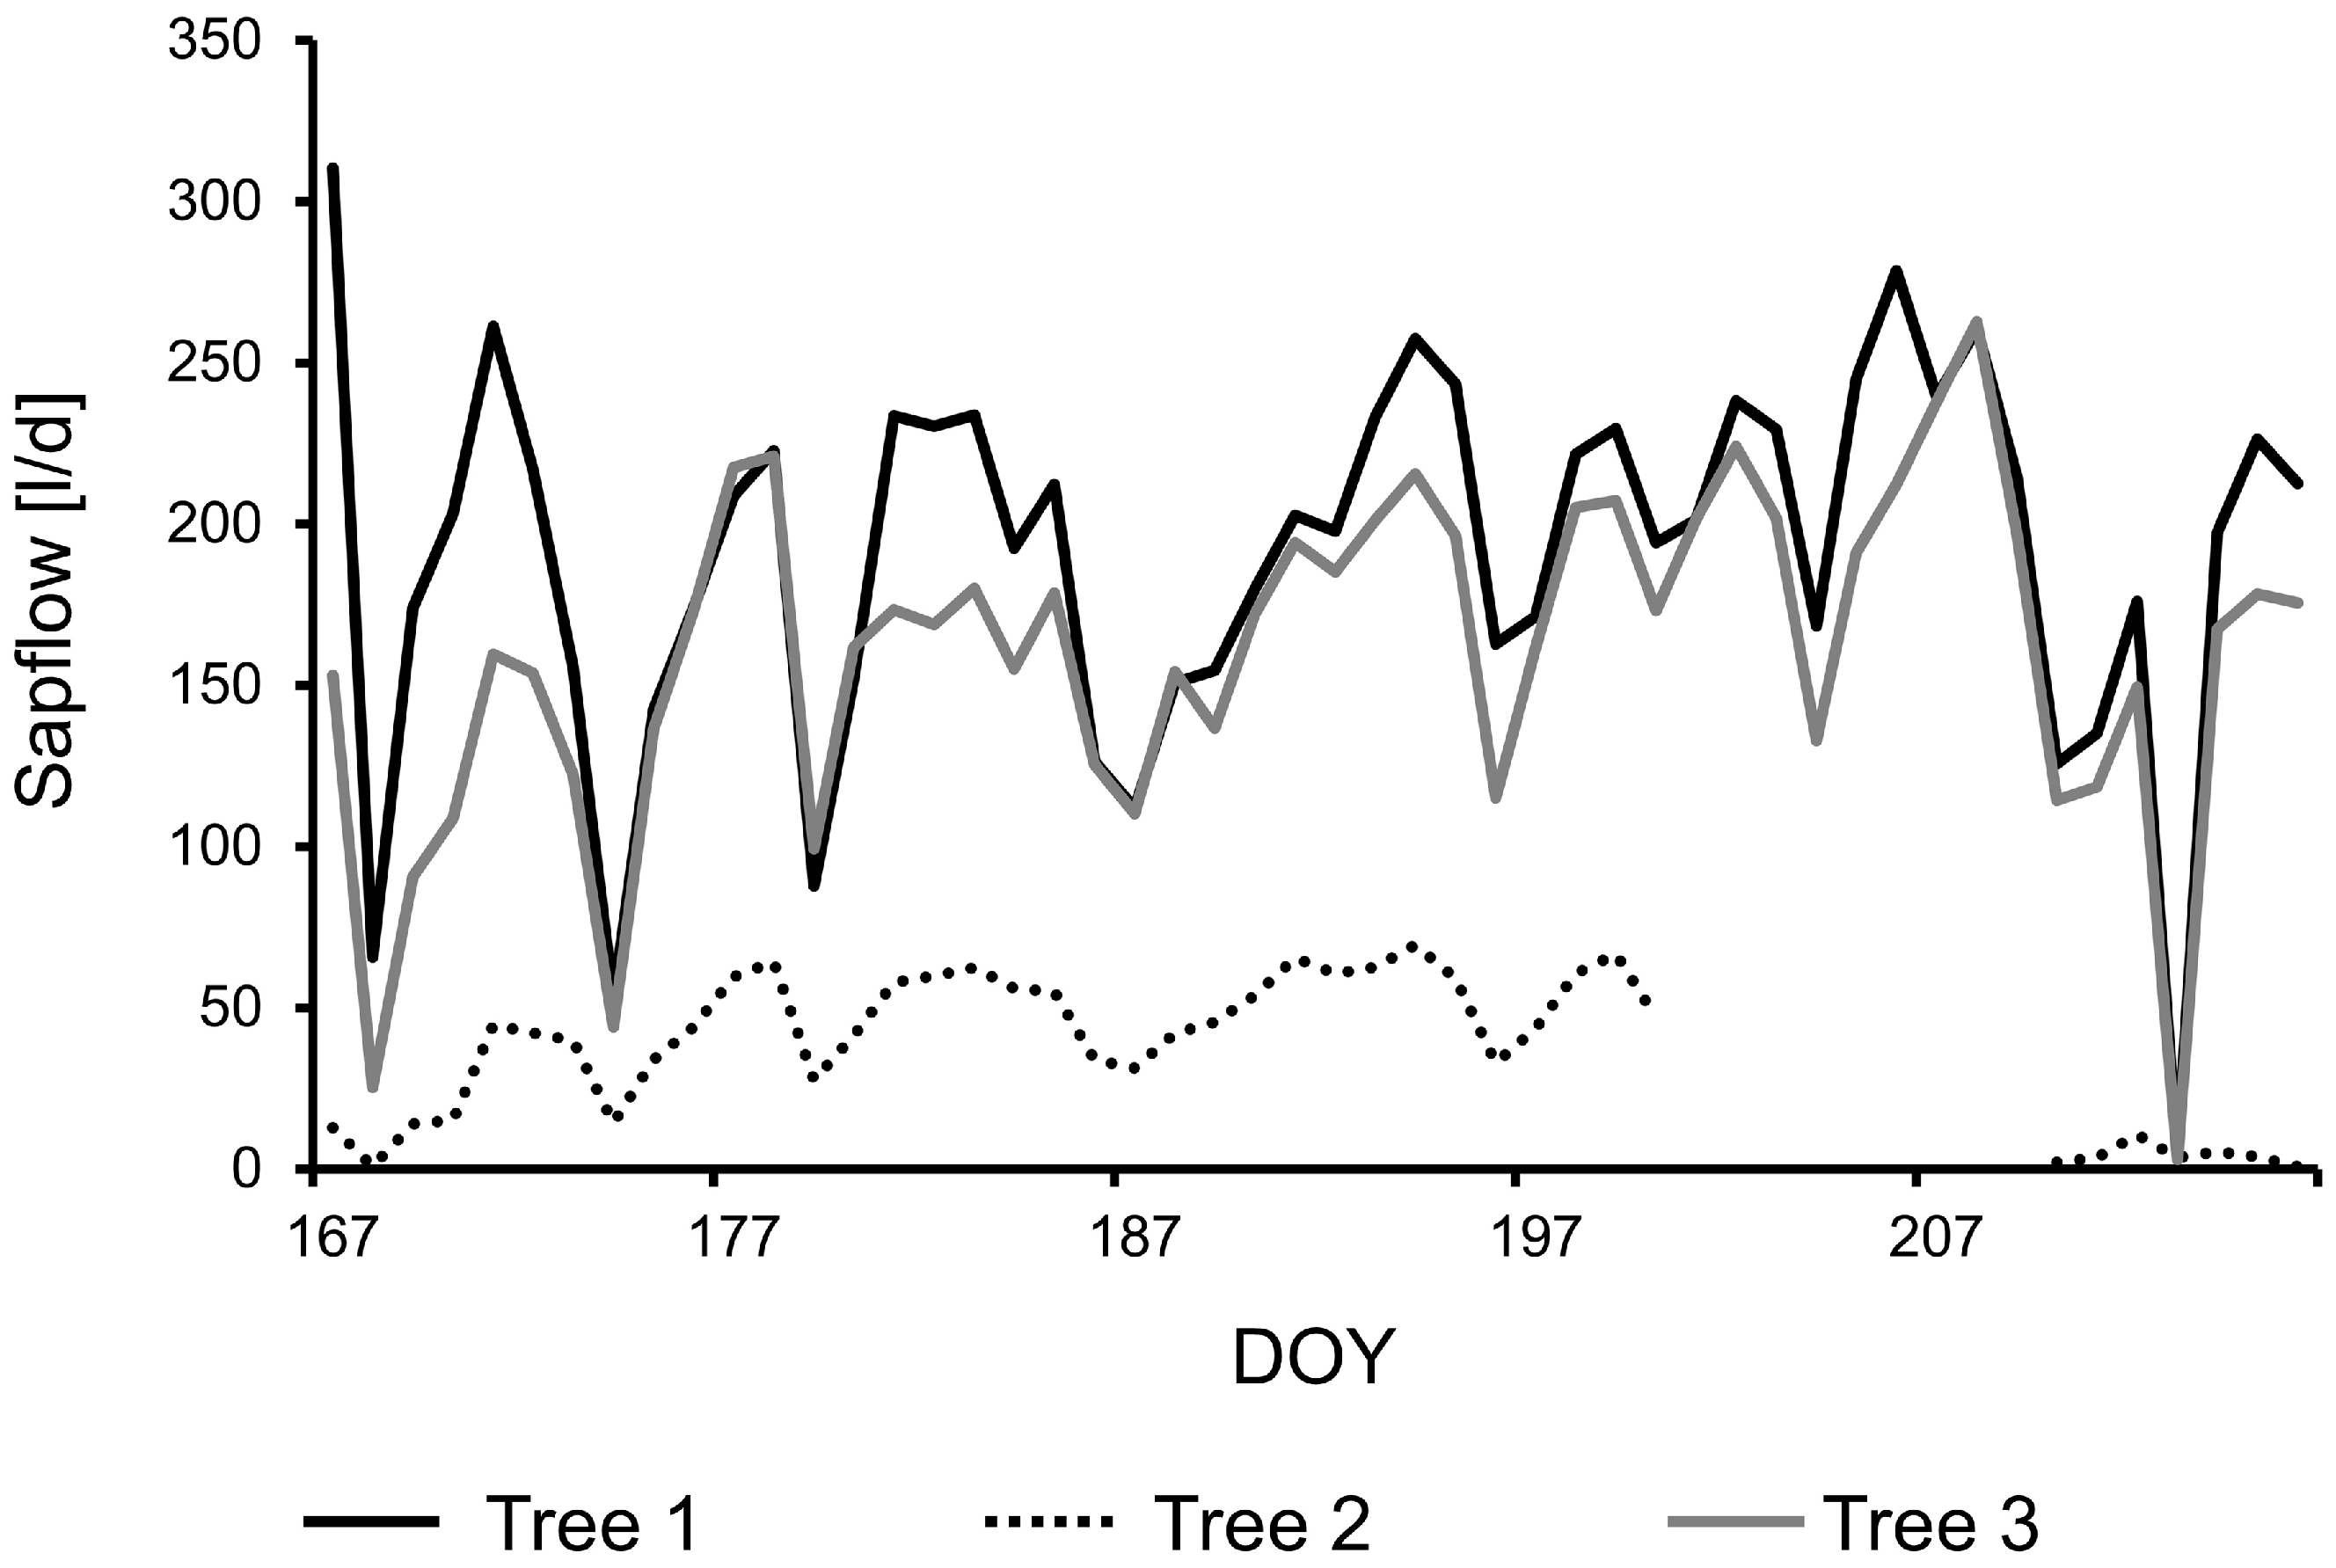
Tree water consumption, as measured from the sap flow sensor trees, is highest for sensor tree 1, which has the highest DBH (46.2 cm), followed by sensor tree 3, and 2 (Figure 4). Sensor tree 2 has the lowest DBH with 19.2 cm (Table 2). Water consumption follows a very similar trend for all trees, despite the huge differences in absolute values of daily water consumption.
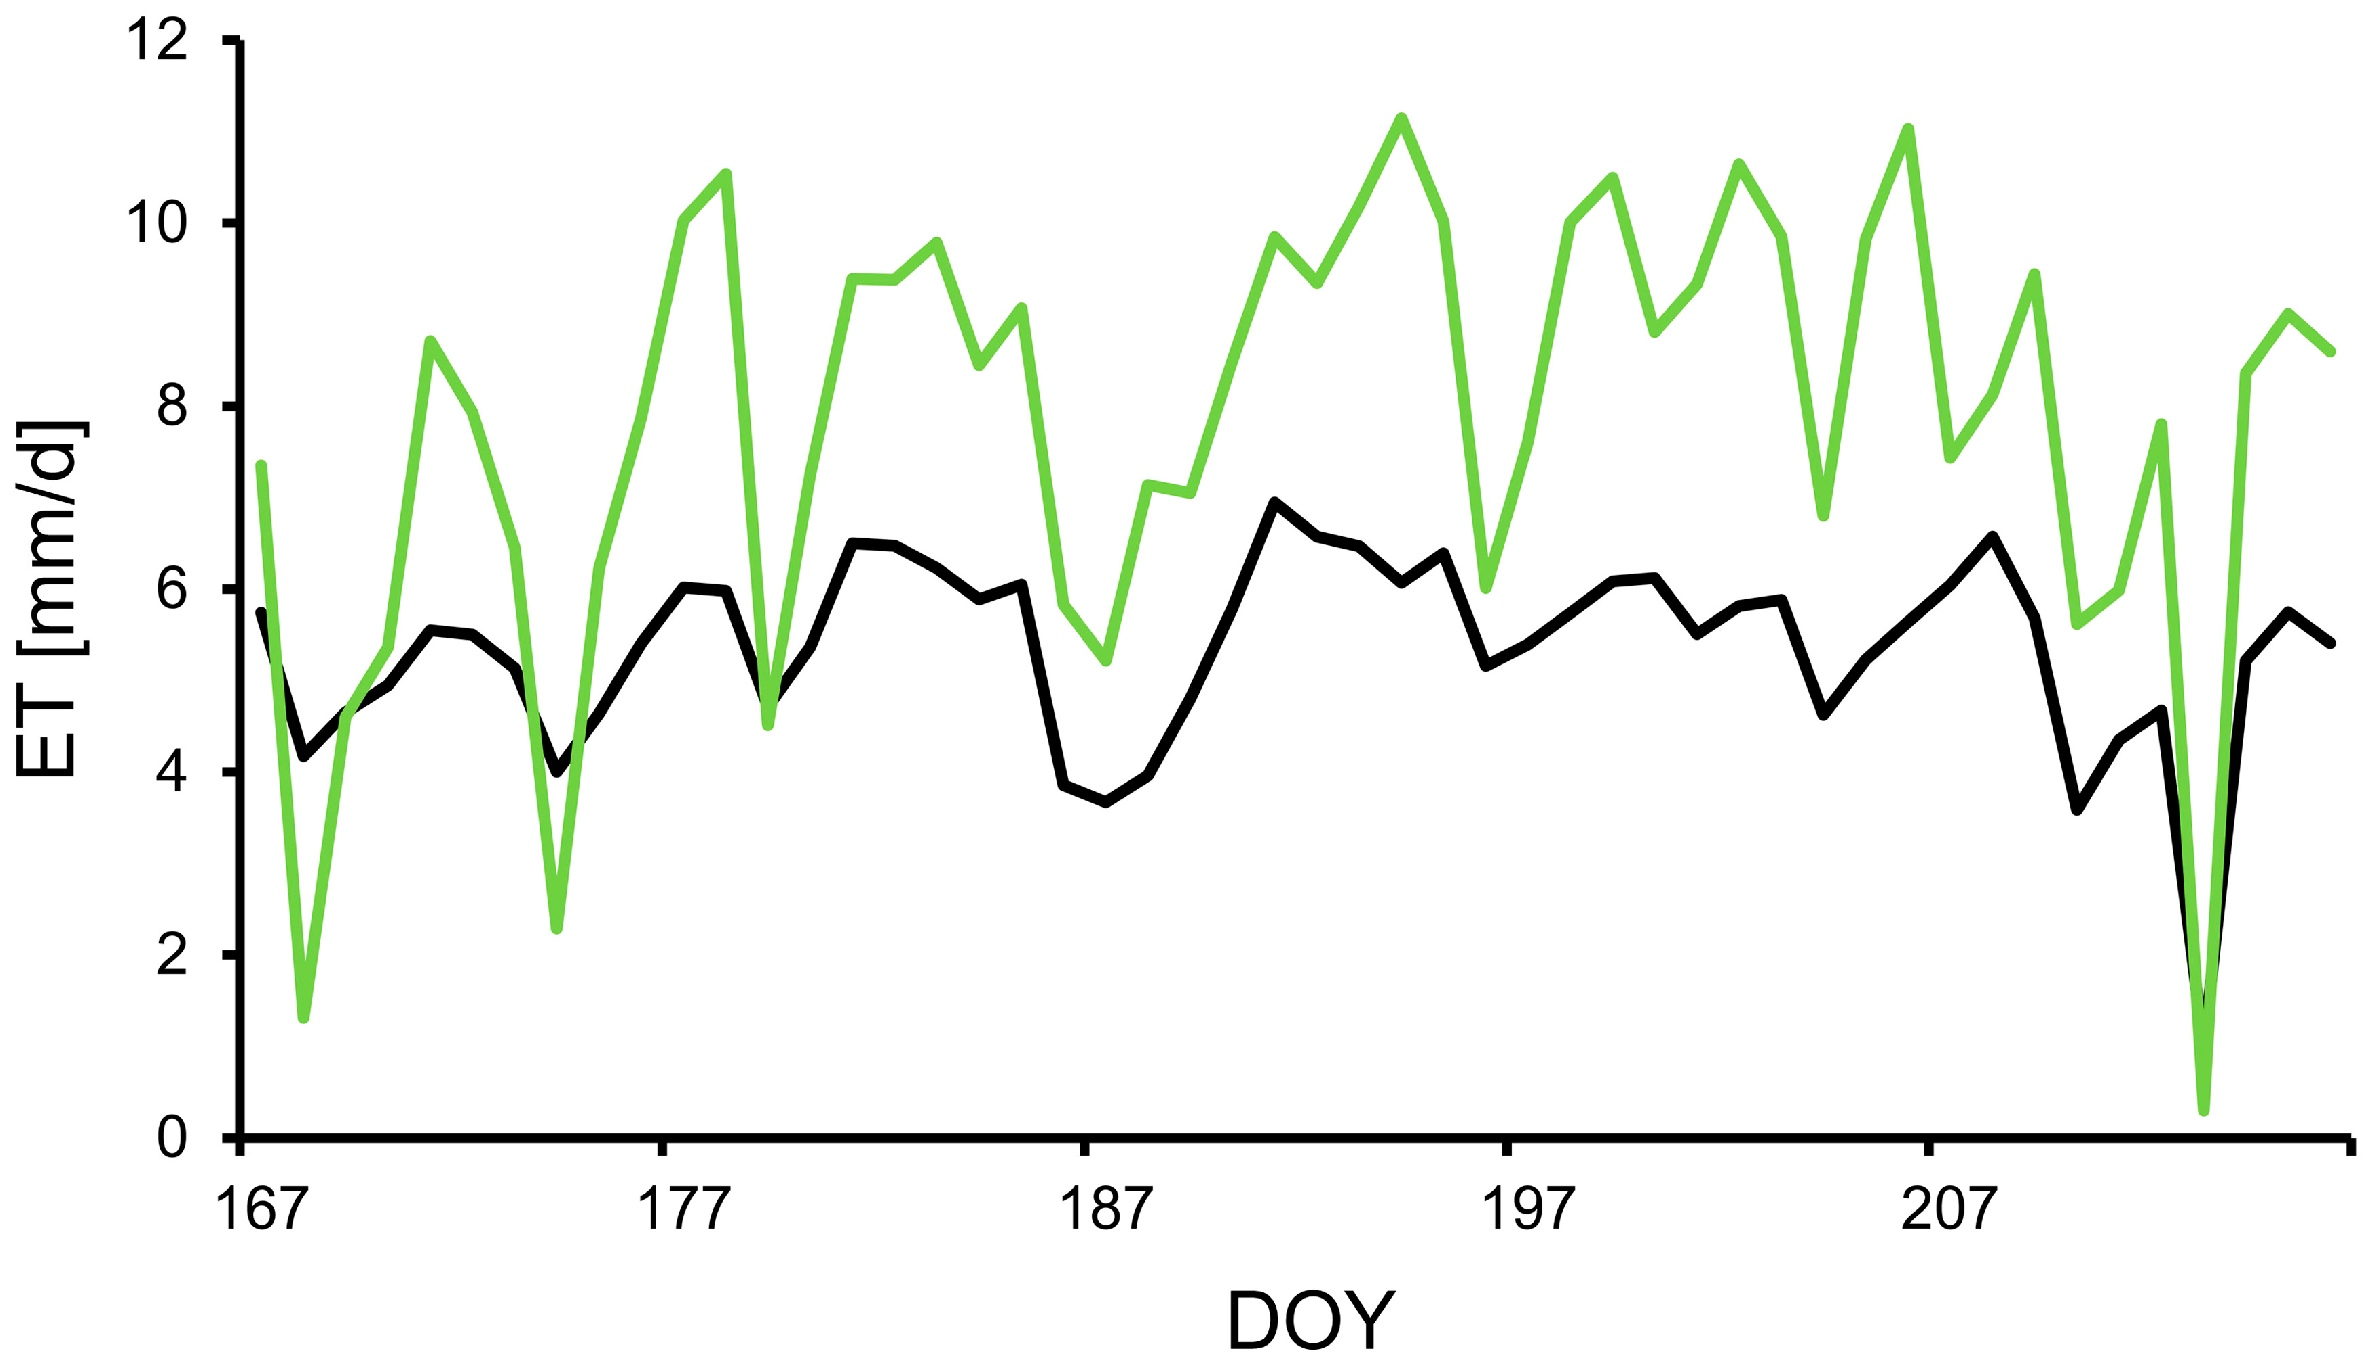
Also ETo and water consumption of the shelterbelt, as shown in Figure 5, follow a similar trend, with water consumption of the shelterbelt mostly being higher than ETo. From the water consumption of the shelterbelt and ETo an average Kc value of 1.43 was obtained. This Kc value was used, in order to calculate the water consumption of the shelterbelt for the whole growing season. Water consumption per 100 m shelterbelt was 1297 m3 for the whole growing season.
A square shaped 25 ha field (500 × 500 m) is bordered by 2000 m of shelterbelt, which would consume 25,940 m3 per growing season. As shelterbelts are shared by neighboring fields, for such a 25 ha field a tree shelterbelt water consumption of 12,970 m3 was considered for the growing season. Only corn and pear showed a substantial reduction of water consumption, which overcompensated the tree shelterbelts’ water consumption (Table 5), so that a shelterbelt system of corn and pear on 25 ha field plots, respectively, with poplar shelterbelts consumes less water than corn and pear without a shelterbelt system.
A square shaped field of 4 ha (200 × 200 m) is surrounded by 800 m of shelterbelt. 800 m of shelterbelt would consume 10,376 m3 of water. Analogous to the 25 ha field, a water consumption of 5188 m3 for the growing season is considered, as shelterbelts are shared by neighboring fields. As for the 4 ha field plot, the shelterbelt system with crops and trees consumes more water than the crops without shelterbelts, except for pears under the set of assumptions II (Table 5).
4. Discussion
Tree water consumption was in the same range as values published by [21] for Poplars in NW China, ranging from 20.1 to 161.4 kg water per day and per tree. Water consumption of sensor tree no. 1 in this study was higher than values of [21]. This difference can be explained by the bigger DBH and sap wood area of sensor tree no. 1 compared to trees from [21]. ETc values of this study are in the range of other studies, e.g., water consumption of corn with values between 741 mm and 841 mm measured in Texas with a lysimeter under sprinkler irrigation [22]. Wheat ETc calculated from climate data from Almaty [23] was the same as wheat ETc under open field conditions of this study. Annual corn water consumption of 668 mm was found in the Heihe Basin in NW China [24]. This value is lower than ETc of corn under all assumptions in this study, because corn in the Heihe Basin was grown under plastic mulch, which considerably reduced evaporation from the soil surface during the initial crop development stage.
Under the calculations for a hypothetical 4 ha (200 × 200 m) field, all crops-shelterbelt systems (except pear) consumed more water than the respective crop without the shelterbelt (Table 4). Only under calculation for the 25 ha (500 × 500 m) field plot did corn, potato, and pear show a reduction of water consumption when combined with a shelterbelt. This difference is due to the relatively shorter shelterbelt compared to field area for the 25 ha field plot (2000 m shelterbelt) versus 800 m shelterbelt around the 4 ha field plot. On the other hand, field plots must not be too large, as the effect of the shelterbelts on wind speed decreases with distance from the shelterbelts and thus decreases with field plot size.
Reduction of ETc under shelterbelts in this study was about 10% (maximum reduction of ETc was 12% with pear, cf. Table 3). These values are well below the reduction of crop water consumption as suggested by the literature from Soviet Union times [9,10,12,14], but in the range of [11]. This difference might be explained by rather conservative assumptions with respect to the impact of shelterbelts on the micro climate of adjacent field plots. Additionally, some investigations cited here were undertaken in areas that are windier compared to the study site of this paper so that a wind speed reduction has a greater effect on crop water consumption.
With respect to only the water consumption, shelterbelt systems reduce water consumption of corn, potato, and pear, which are crops with a high crop water demand, under the conditions of a square shaped 25 ha field. Under the conditions of a 4 ha field, all crop-shelterbelt systems consume more water (except for pear) than the crop without shelterbelts. So, it can be concluded that shelterbelts around large field plots may play a role to improve water resource management in the context of crops with a high crop water demand, like corn or cotton. In this study, other effects of shelterbelts, like increases of crop yields and additional income from timber and fuel wood, have not been considered. So, if water productivity, which is total income by total water consumption, was compared of the whole crop-shelterbelt system versus crops without shelterbelt, then again a different picture, a more substantial contribution of shelterbelts to improved water resource management, might turn out.
Acknowledgments
This study was undertaken with support from the Federal Ministry of Economic Cooperation and Development of Germany (BMZ), through the Advisory Service on Agricultural Research for Development (BEAF) under Deutsche Gesellschaft für Internationale Zusammenarbeit (GIZ), Germany. BMZ funded a research grant of 100,000 EUR and a six-month internship for Eva Strenge, in order to collect sap flow data. Niels Thevs’ position as an integrated expert at the World Agroforestry Center as well as the sap flow equipment and the climate stations were co-funded by BMZ as part of the Center for International Migration and Development (CIM) program.
Author Contributions
Niels Thevs carried out the processing and analysis of climate data for the ETo and ETc calculations together with Maksat Eraaliev. Eva Strange carried out the analysis of sap flow data with supervision from Petra Lang. Kumar Aliev did the necessary tree measurements and tree data analyses. Kumar Aliev, Maksat Eraaliev, and Azim Baibagysov contributed to the literature review, in particular through review of the Russian literature. Jianchu Xu did some editing.
Conflicts of Interest
The authors declare no conflict of interest.
References
- MEA (Millennium Ecosystem Assessment). Ecosystems and Human Well-being: Synthesis; Island Press: Washington, DC, USA, 2005. [Google Scholar]
- Karthe, D. Environmental Changes in Central and East Asian Drylands and their Effects on Large Central and East Asian Lakes and their Effects on Major River-Lake Systems. Quat. Int. 2017. [Google Scholar] [CrossRef]
- UNEP (United Nations Environment Programme). 2004. Available online: http://www.grid.unep.ch/activities/sustainable/balkhash/ (accessed on 20 November 2016).
- Micklin, P. The future Aral Sea: Hope and despair. Environ. Earth Sci. 2016, 75, 1–15. [Google Scholar] [CrossRef]
- CACILM (Central Asian Countries Initiative for Land Management); ADB (Asian Development Bank). Central Asia Atlas of Natural Resources; CACILM and ADB: Manila, Philippines, 2010; Available online: http://www.adb.org/sites/default/files/publication/27508/central-asia-atlas.pdf (accessed on 2 July 2015).
- Unger-Shayesteh, K.; Vorogushyn, S.; Farinotti, D.; Gafurov, A.; Duethmann, D.; Mandychev, A.; Merz, B. What do we know about past changes in the water cycle of Central Asian headwaters? A review. Glob. Planet. Chang. 2013, 110, 4–25. [Google Scholar] [CrossRef]
- Feike, T.; Mamitimin, Y.; Li, L.; Abdusalih, N.; Doluschitz, R. Development of agricultural land and water use and its driving forces in the Aksu-Tarim Basin, P.R. China. Environ. Earth Sci. 2015, 73, 517–531. [Google Scholar] [CrossRef]
- Rumbaur, C.; Thevs, N.; Disse, M.; Ahlheim, M.; Brieden, A.; Cyffka, B.; Duettmann, D.; Feike, T.; Frör, O.; Gärtner, P.; et al. Sustainable management of river oases along the Tarim River (SuMaRiO) in Northwest China under conditions of climate change. Earth Syst. Dyn. 2015, 6, 83e107. [Google Scholar] [CrossRef]
- Albenskii, A.V.; Kalashnikov, A.F.; Ozolin, G.P.; Nikitin, P.L.; Surmach, G.P.; Kulik, N.F.; Senkevich, A.A.; Kasyanov, F.M.; Pavlovskii, E.S.; Roslyakov, N.V. Agroforestry Melioration; Lesnaya Promyshlennost: Moscow, Russia, 1972. [Google Scholar]
- Vasilyev, M.E. Melioration through Forests and Harvest; Kainar: Almaty, Kazakhstan, 1980. [Google Scholar]
- Alemu, M.M. Ecological Benefits of Trees as Windbreaks and Shelterbelts. Int. J. Ecosyst. 2016, 6, 10–13. [Google Scholar] [CrossRef]
- Perry, C.H.; Woodall, C.W.; Liknes, G.C.; Schoeneberger, M.M. Filling the gap: improving estimates of working tree resources in agricultural landscapes. Agrofor. Syst. 2009, 75, 91–101. [Google Scholar] [CrossRef]
- Stepanov, A.M. Agroforestry Melioration in Irrigated Lands; Agropromizdat: Moscow, Russia, 1987. [Google Scholar]
- Dokuchaev Scientific Research Institute of Agriculture. Agroforestry Melioration of Vegetable Cultures and Potato; Voronesh Publishing House: Voronesh, Russia, 1961. [Google Scholar]
- Susa, N.I. Agroforestry Melioration; Governmental Publishing House for Agriculture: Moscow, Russia, 1959. [Google Scholar]
- Kainar. Agroforestry in Kazakhstan; Kainar: Almaty, Kazakhstan, 1983. [Google Scholar]
- Bulychev, A.S.; Onishenko, L.P. Use and Effectiveness of Tree Shelterbelts in Chui Valley; Advisory Report of the Forestry Committee to the Ministries of the Kyrgyz SSR; Publishing House “Kyrgyzstan”: Frunze, Kyrgyzstan, 1979. [Google Scholar]
- Allen, R.G.; Pereira, L.S.; Raes, D.; Smith, M. Crop Evapotranspiration—Guidelines for Computing Crop Water Requirements; FAO Irrigation and Drainage Paper 56; FAO: Rome, Italy, 1998. [Google Scholar]
- Granier, A. Evaluation of transpiration of in a Douglas fir stand by means of sap flow measurements. Tree Physiol. 1987, 3, 309–320. [Google Scholar] [CrossRef] [PubMed]
- Lubczynski, M.W.; Chavarro-Rincon, D.; Roy, J. Novel, cyclic heat dissipation method for the correction of natural temperature gradients in sap flow measurements. Part 1. Theory and application. Tree Physiol. 2012, 32, 894–912. [Google Scholar] [CrossRef] [PubMed]
- Chang, X.X.; Zhao, W.Z.; Zhang, Z.H.; Su, Y.Z. Sap flow and tree conductance of shelter-belt in arid region of China. Agric. For. Meteorol. 2006, 138, 132–141. [Google Scholar] [CrossRef]
- Howell, T.A.; Tolk, J.A.; Schneider, A.D.; Evett, S.R. Evapotranspiration, yield, and water use efficiency of corn hybrids differing in maturity. Agron. J. 1998, 90, 3–9. [Google Scholar] [CrossRef]
- Thevs, N.; Nurtazin, S.; Beckmann, V.; Salmurzauly, R.; Akimalieva, A. Water consumption of agriculture and natural ecosystems along the Ili River in China and Kazakhstan. Water 2017, 9, 207. [Google Scholar] [CrossRef]
- Hochmuth, H.; Thevs, N.; He, P. Water allocation and water consumption of irrigation agriculture and natural vegetation in the Heihe River watershed, NW China. Environ. Earth Sci. 2015, 73, 5269–5279. [Google Scholar] [CrossRef]
Figure 1.
Field structure of Karasay Batyr as of 2016 (Google Earth).

Figure 2.
Shelterbelt in Karasay Batyr, where sap flow was measured during 2016, with neighboring potato field (photo Niels Thevs, April 2016).
Figure 2.
Shelterbelt in Karasay Batyr, where sap flow was measured during 2016, with neighboring potato field (photo Niels Thevs, April 2016).

Figure 3.
ETo (left) and ETc of corn (right) under open field conditions (in red), under the assumption of reduction of wind speed by 20% (in green), and under the set of assumptions of reduction of wind speed by 35%, temperature reduction by 1 °C, and increase of air humidity by 0.05 (in blue). DOY refers to nth day of the year, i.e., data on the x-axis start on 1 April (DOY 92) and end on 24 October.
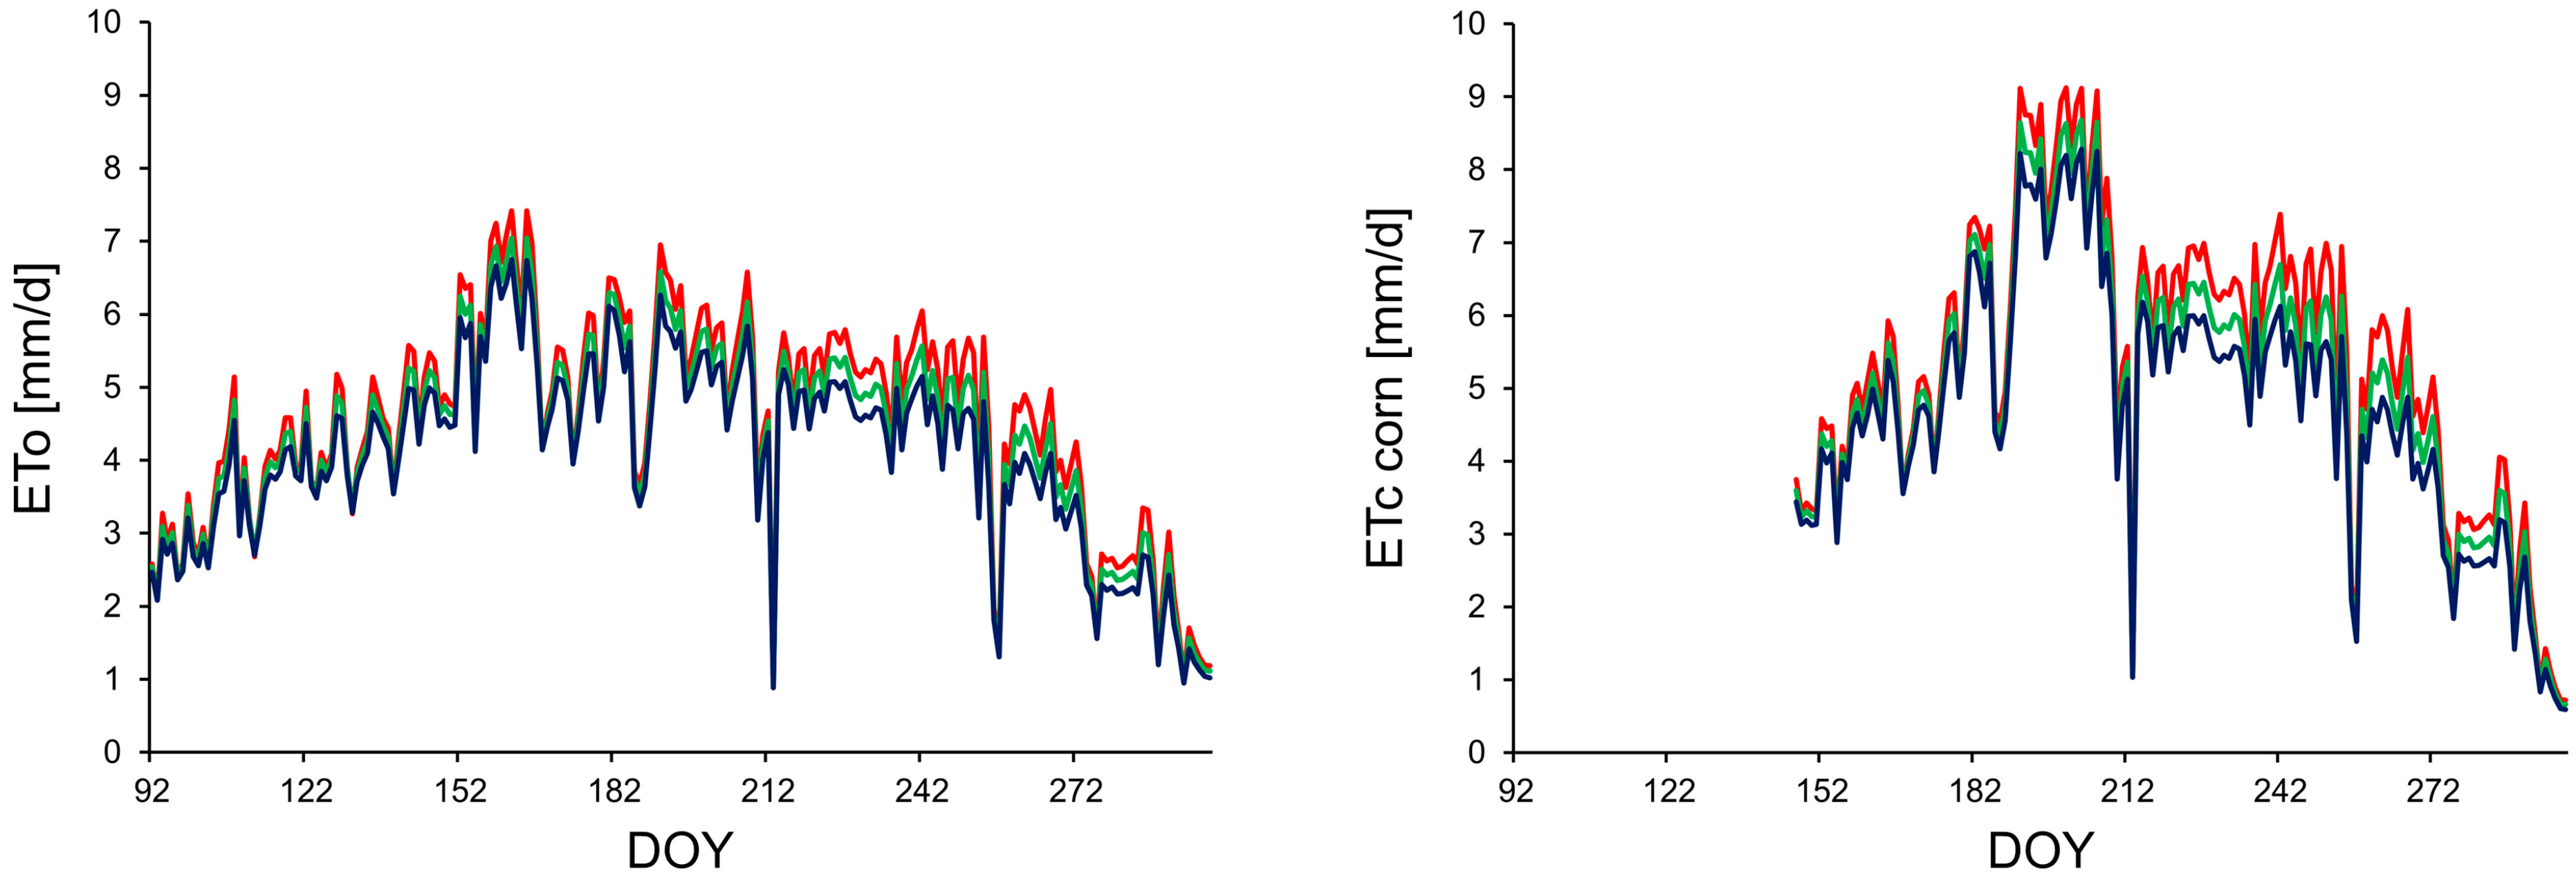
Figure 4.
Daily sapflow (L/d) of the three sensor trees from 15 June (DOY 167) to 3 August (DOY 216). DOY refers to nth day of the year.
Figure 4.
Daily sapflow (L/d) of the three sensor trees from 15 June (DOY 167) to 3 August (DOY 216). DOY refers to nth day of the year.

Figure 5.
ETo (mm/d) and daily ET (mm/d) of shelterbelt from 15 June (DOY 167) to 3 August (DOY 216). DOY refers to nth day of the year.
Figure 5.
ETo (mm/d) and daily ET (mm/d) of shelterbelt from 15 June (DOY 167) to 3 August (DOY 216). DOY refers to nth day of the year.

Table 1.
Climatic features of Tokmok (https://rp5.ru/Wetterarchiv_in_Tokmok). Data range from 2005 to 2016.
Table 1.
Climatic features of Tokmok (https://rp5.ru/Wetterarchiv_in_Tokmok). Data range from 2005 to 2016.
| Climatic Feature | Tokmok Data |
|---|---|
| Geographical position | 42.51° N, 75.18° E |
| Elevation [m a.s.l.] | 824 |
| Annual average temperature [°C] | 11.6 |
| January average temperature [°C] | −2.7 |
| July average temperature [°C] | 24.8 |
| Annual precipitation [mm] | 522 |
| Average wind speed in 10 m height [m/s] | 1.2 |
Table 2.
Data of the three sensor trees.
| No. of Sensor Tree | Diameter at Breast Height (DBH) (cm) | Tree Height (m) | Age (a) | Average Xylem Thickness (cm) | Sapwood Area (cm2) |
|---|---|---|---|---|---|
| 1 | 42.6 | 16 | 27 | 8.07 | 875 |
| 2 | 19.2 | 16.4 | 14 | 3.8 | 183 |
| 3 | 31.5 | 15.2 | 19 | 7.3 | 554 |
Table 3.
Climate data and ETo in Karasy Batyr, monthly averages during the growing season 2016.
| Month | Temperature (°C) | Relative Air Humidity (%) | Wind Speed (m/s) | ETo (mm/d) |
|---|---|---|---|---|
| 4 | 12.7 | 60 | 2.0 | 3.5 |
| 5 | 16.5 | 55 | 2.0 | 4.6 |
| 6 | 21.3 | 49 | 1.9 | 5.9 |
| 7 | 22.0 | 49 | 2.0 | 5.3 |
| 8 | 21.2 | 43 | 2.2 | 5.4 |
| 9 | 19.9 | 40 | 2.3 | 4.4 |
| 10 | 8.7 | 56 | 2.3 | 2.2 |
Table 4.
ETo and ETc of relevant crops under open field conditions and two scenarios on impact of shelterbelts on micro climate for one growing season each. First scenario: leeward of shelterbelt wind speed is reduced by 20% compared to open field conditions. Second scenario: leeward of shelterbelt wind speed is reduced by 35%, maximum temperature is decreased by 1 °C, and minimum air humidity is increased by 0.05 compared to open field conditions.
| ETo and Crops | ETo and ETc under Open Field Conditions | ETO and ETc under Shelterbelt Assumptions | Difference of ETo and ETc between Open Field and Assumption | ||
|---|---|---|---|---|---|
| I | II | I | II | ||
| ET (mm) | |||||
| ETo | 938.9 | 893.2 | 847.3 | 45.7 | 91.6 |
| Wheat | 611.2 | 586.2 | 561 | 25 | 50.2 |
| Corn | 815.1 | 764 | 717.1 | 51.1 | 98 |
| Potato | 660.7 | 632.2 | 603.6 | 28.5 | 57.1 |
| Barley | 584.7 | 561.4 | 537.2 | 23.3 | 47.5 |
| Fruit trees (pear) | 1093.3 | 1025.3 | 962.4 | 68 | 130.9 |
| ET for 4 ha field (m3) | |||||
| Eto | 37,555 | 35,272 | 33,890 | 1828 | 3664 |
| Wheat | 24,446 | 23,448 | 22,439 | 999 | 2007 |
| Corn | 32,604 | 30,560 | 28,683 | 2044 | 3921 |
| Potato | 26,427 | 25,288 | 24,145 | 1139 | 2238 |
| Barley | 23,388 | 22,456 | 21,486 | 931 | 1901 |
| Fruit trees (pear) | 43,732 | 41,012 | 38,494 | 2720 | 5237 |
| ET for 25 ha field (m3) | |||||
| Eto | 234,717 | 223,291 | 211,816 | 11,426 | 22,901 |
| Wheat | 152,790 | 146,547 | 140,246 | 6243 | 12,544 |
| Corn | 203,778 | 191,001 | 179,269 | 12,777 | 24,509 |
| Potato | 165,172 | 158,052 | 150,906 | 7120 | 14,266 |
| Barley | 146,172 | 140,353 | 134,289 | 5819 | 11,883 |
| Fruit trees (pear) | 273,324 | 256,325 | 240,590 | 16,999 | 32,734 |
Table 5.
Water consumption of open field conditions (crop without any shelterbelt) and shelterbelt system (crops and trees) for 4 ha and 25 ha field plot, respectively. Negative differences indicate that the whole shelterbelt system consumes less water than the crop without shelterbelt.
Table 5.
Water consumption of open field conditions (crop without any shelterbelt) and shelterbelt system (crops and trees) for 4 ha and 25 ha field plot, respectively. Negative differences indicate that the whole shelterbelt system consumes less water than the crop without shelterbelt.
| Crop | Water Consumption of | Difference between | |||
|---|---|---|---|---|---|
| Open Field | Shelterbelt System Including Trees, Assumptions | Shelterbelt System and Open Field, Assumptions | |||
| I | II | I | II | ||
| Water consumption for 4 ha field (m3) | |||||
| ETo | 37,555 | 40,460 | 39,078 | 2905 | 1523 |
| Wheat | 24,446 | 28,636 | 27,627 | 4190 | 3181 |
| Corn | 32,604 | 35,748 | 33,871 | 3144 | 1267 |
| Potato | 26,427 | 30,476 | 29,333 | 4049 | 2906 |
| Barley | 23,388 | 27,644 | 26,674 | 4256 | 3286 |
| Fruit trees (pear) | 43,732 | 46,200 | 43,682 | 2468 | −50 |
| Water consumption for 25 ha field (m3) | |||||
| ETo | 234,717 | 236,261 | 224,786 | 1544 | −9931 |
| Wheat | 152,790 | 159,517 | 153,216 | 6727 | 426 |
| Corn | 203,778 | 203,971 | 192,239 | 193 | −11,539 |
| Potato | 165,172 | 171,022 | 163,879 | 5850 | −1293 |
| Barley | 146,172 | 153,323 | 147,259 | 7151 | 1087 |
| Fruit trees (pear) | 273,324 | 269,295 | 253,560 | −4029 | −19,764 |
© 2017 by the authors. Licensee MDPI, Basel, Switzerland. This article is an open access article distributed under the terms and conditions of the Creative Commons Attribution (CC BY) license (http://creativecommons.org/licenses/by/4.0/).
Share and Cite
MDPI and ACS Style
Thevs, N.; Strenge, E.; Aliev, K.; Eraaliev, M.; Lang, P.; Baibagysov, A.; Xu, J. Tree Shelterbelts as an Element to Improve Water Resource Management in Central Asia. Water 2017, 9, 842. https://doi.org/10.3390/w9110842
AMA Style
Thevs N, Strenge E, Aliev K, Eraaliev M, Lang P, Baibagysov A, Xu J. Tree Shelterbelts as an Element to Improve Water Resource Management in Central Asia. Water. 2017; 9(11):842. https://doi.org/10.3390/w9110842
Chicago/Turabian StyleThevs, Niels, Eva Strenge, Kumar Aliev, Maksat Eraaliev, Petra Lang, Azim Baibagysov, and Jianchu Xu. 2017. "Tree Shelterbelts as an Element to Improve Water Resource Management in Central Asia" Water 9, no. 11: 842. https://doi.org/10.3390/w9110842
Note that from the first issue of 2016, this journal uses article numbers instead of page numbers. See further details here.