Convertible Operation Techniques for Pump Stations Sharing Centralized Reservoirs for Improving Resilience in Urban Drainage Systems


1
Research Center for Disaster Prevention Science and Technology, Korea University, Seoul 02841, Korea
2
School of Civil, Environmental and Architectural Engineering, Korea University, Seoul 02841, Korea
*
Author to whom correspondence should be addressed.
Water 2017, 9(11), 843; https://doi.org/10.3390/w9110843
Submission received: 9 August 2017
/
Revised: 16 October 2017
/
Accepted: 30 October 2017
/
Published: 31 October 2017
(This article belongs to the Special Issue Urban Water Cycle Modelling and Management)
Abstract
:Pump stations prevent backwater effects from urban streams and safely drain rainwater in urban areas. Urbanization has increased the required capacity of centralized reservoirs and drainage pumps; yet, their respective designs are based on the runoff of the target watershed at the time of design. In Korea, additional pump stations are constructed to supplement the insufficient capacity of centralized reservoirs and drainage pumps. Two pump stations in the same drainage area share centralized reservoirs, and there are gates between them. Operation of the gates and drainage pumps is based on the water level in the connected centralized reservoirs. The convertible operation is based on changes in flow between two pump stations with different effluent streams in shared centralized reservoirs. Efficient distribution of inflow to both pump stations provides additional storage capacity in centralized reservoirs and rapid drainage. For a rainfall event in 2010, flooding volumes for current and convertible operations were 58,750 and 7507 m3, respectively. For an event in 2011, the corresponding figures were 3697 and 471 m3. This shows that resilience increased by 0.10829 and 0.00756, respectively, for the two events. Accordingly, a new technique to operate multiple pump stations for reducing urban inundation is proposed.
1. Introduction
Structural measures, such as the installation of drainage facilities, and nonstructural measures, such as the operation of such facilities, have been developed and applied to prevent water inundation in urban areas. Structural measures are not only costly and time-consuming, but also need to be complemented by nonstructural measures; these are cheaper and easier to implement because urban areas may not be able to accommodate additional drainage facilities. As urbanization increases, runoff also increases and additional drainage facilities, such as pump stations, are constructed to drain the urban area. Appropriate operation of urban drainage systems, including additional facilities, is required to effectively prevent urban inundation.
The gates in centralized reservoirs are usually closed, and are operated in special cases, such as when receiving inflow from stream. The convertible operation of gates and pumps is based on the flow change in urban drainage systems. If all inflow is driven to a single pump station, drainage efficiency may reduce and the drainage area can be inundated. If there are two pump stations in a single drainage area, it is more effective to distribute inflow to both pump stations as this can improve drainage efficiency and provides additional capacity in centralized reservoirs, which enables more rapid drainage.
Many researchers have studied the real-time control (RTC) of urban drainage facilities as a nonstructural measure. These studies considered different types of operation, such as individual operation, cooperative operation, and convertible operation between centralized reservoirs with drainage pumps and gates in pump stations. In addition, these studies considered a range of operating time periods including yearly, daily, hourly, and per minute operation. The first studies have minutely and individual operations for urban drainage facilities. The optimal control of urban drainage systems has been investigated using a telemetry/telecontrol system [1]. Real-time operation of urban wastewater systems in Quebec was studied and this led to a significant improvement in their performance [2]. A real-time control strategy for the sewer system of Vienna was investigated, which was used to develop a hydrodynamic sewer system [3]. Optimal real-time control of the Quebec urban drainage system was studied to reduce the frequency and volumes of combined sewer overflows [4]. A forecast-based operation method to minimize flood damage in urban areas was used to predict the flow rate in storm sewer pipes and river water levels [5]. Real time control of urban drainage systems was investigated, with the additional efforts needed by this approach were highlighted through a comparison with conventionally operated systems [6]. The real-time operation of a sewer network was optimized using a multi-goal objective function [7]. An optimized adaptive network-based fuzzy inference system was recommended for the intelligent real-time operation of a pump station in an urban drainage system [8]. Proactive pump operation and capacity expansion in an urban drainage system was conducted to improve system resilience [9].
A cooperative operation and a convertible operation differ due to the flow path used. A cooperative operation includes a centralized reservoir located at the downstream end of a drainage area and a decentralized reservoir located at the upstream end. The cooperative operation refers to the concurrent operation of different drainage facilities in an urban drainage area. Only drainage pumps in centralized and decentralized reservoirs were used for the cooperative operation in a previous study [10]. A convertible operation requires two centralized reservoirs, linked by gates that control the rate of inflow; these can be operated to provide additional drainage capacity. Two pump stations can share several centralized reservoirs in the same drainage area.
Many studies on RTC of urban drainage facilities have been conducted since 2000, and some researchers have studied long-term operation across different time periods, including yearly, daily, and hourly operation. Initial research was carried out on screening urban wastewater systems for RTC potential [11]. Optimal real-time operation of multipurpose urban reservoirs was applied to the target area in Singapore [12]. The operation of detention facilities for flood control and multipurpose urban reservoirs in Singapore was also studied [13]. These studies only considered individual operation for the yearly, daily, and hourly operating time periods; cooperative operation and convertible operation across these periods were not investigated. The operations in these studies had a variety of purposes, but involved operation of only one hydraulic facility. In addition, these operations are not appropriate in some urban drainage areas because of the long operating times required.
Studies of cooperative operation of urban drainage facilities with per-minute operating times have been conducted. Inundation in an urban drainage system was simulated with several pump stations having different drainage areas [14]. Modelling and real-time control of an urban wastewater system was conducted with an integrated mathematical model [15]. Cooperative operation between centralized and decentralized reservoirs in an urban drainage system was proposed for reducing urban inundation [10]. Cooperative operations were possible in these studies, but the inflow volume to each drainage facility was not modified, and the direction of inflow could not be changed. This means that the capacity of drainage facilities, such as centralized reservoirs, to prevent urban inundation was not considered.
No studies regarding convertible operations between centralized reservoirs in one drainage area have been undertaken. The convertible operation comprises the gate operation in centralized reservoirs and the pump operation in pump stations. In this study, the pump operation in the convertible operation was used to maintain low water levels in the centralized reservoirs. Early operation of the pumps also enabled rapid drainage in the target drainage area, which reduced the backwater effect from the water level of the centralized reservoirs. The gate operation in the convertible operation was used to distribute the inflow efficiently to the centralized reservoirs, reducing urban inundation and providing additional capacity in centralized reservoirs. The gate operation could change the flow direction in the centralized reservoirs, effectively distributing the inflow between the two pump stations. In addition, resilience in the target watershed was examined by applying system resilience identified in a previous study to the convertible operations [10].
2. Materials and Methods
2.1. Overview
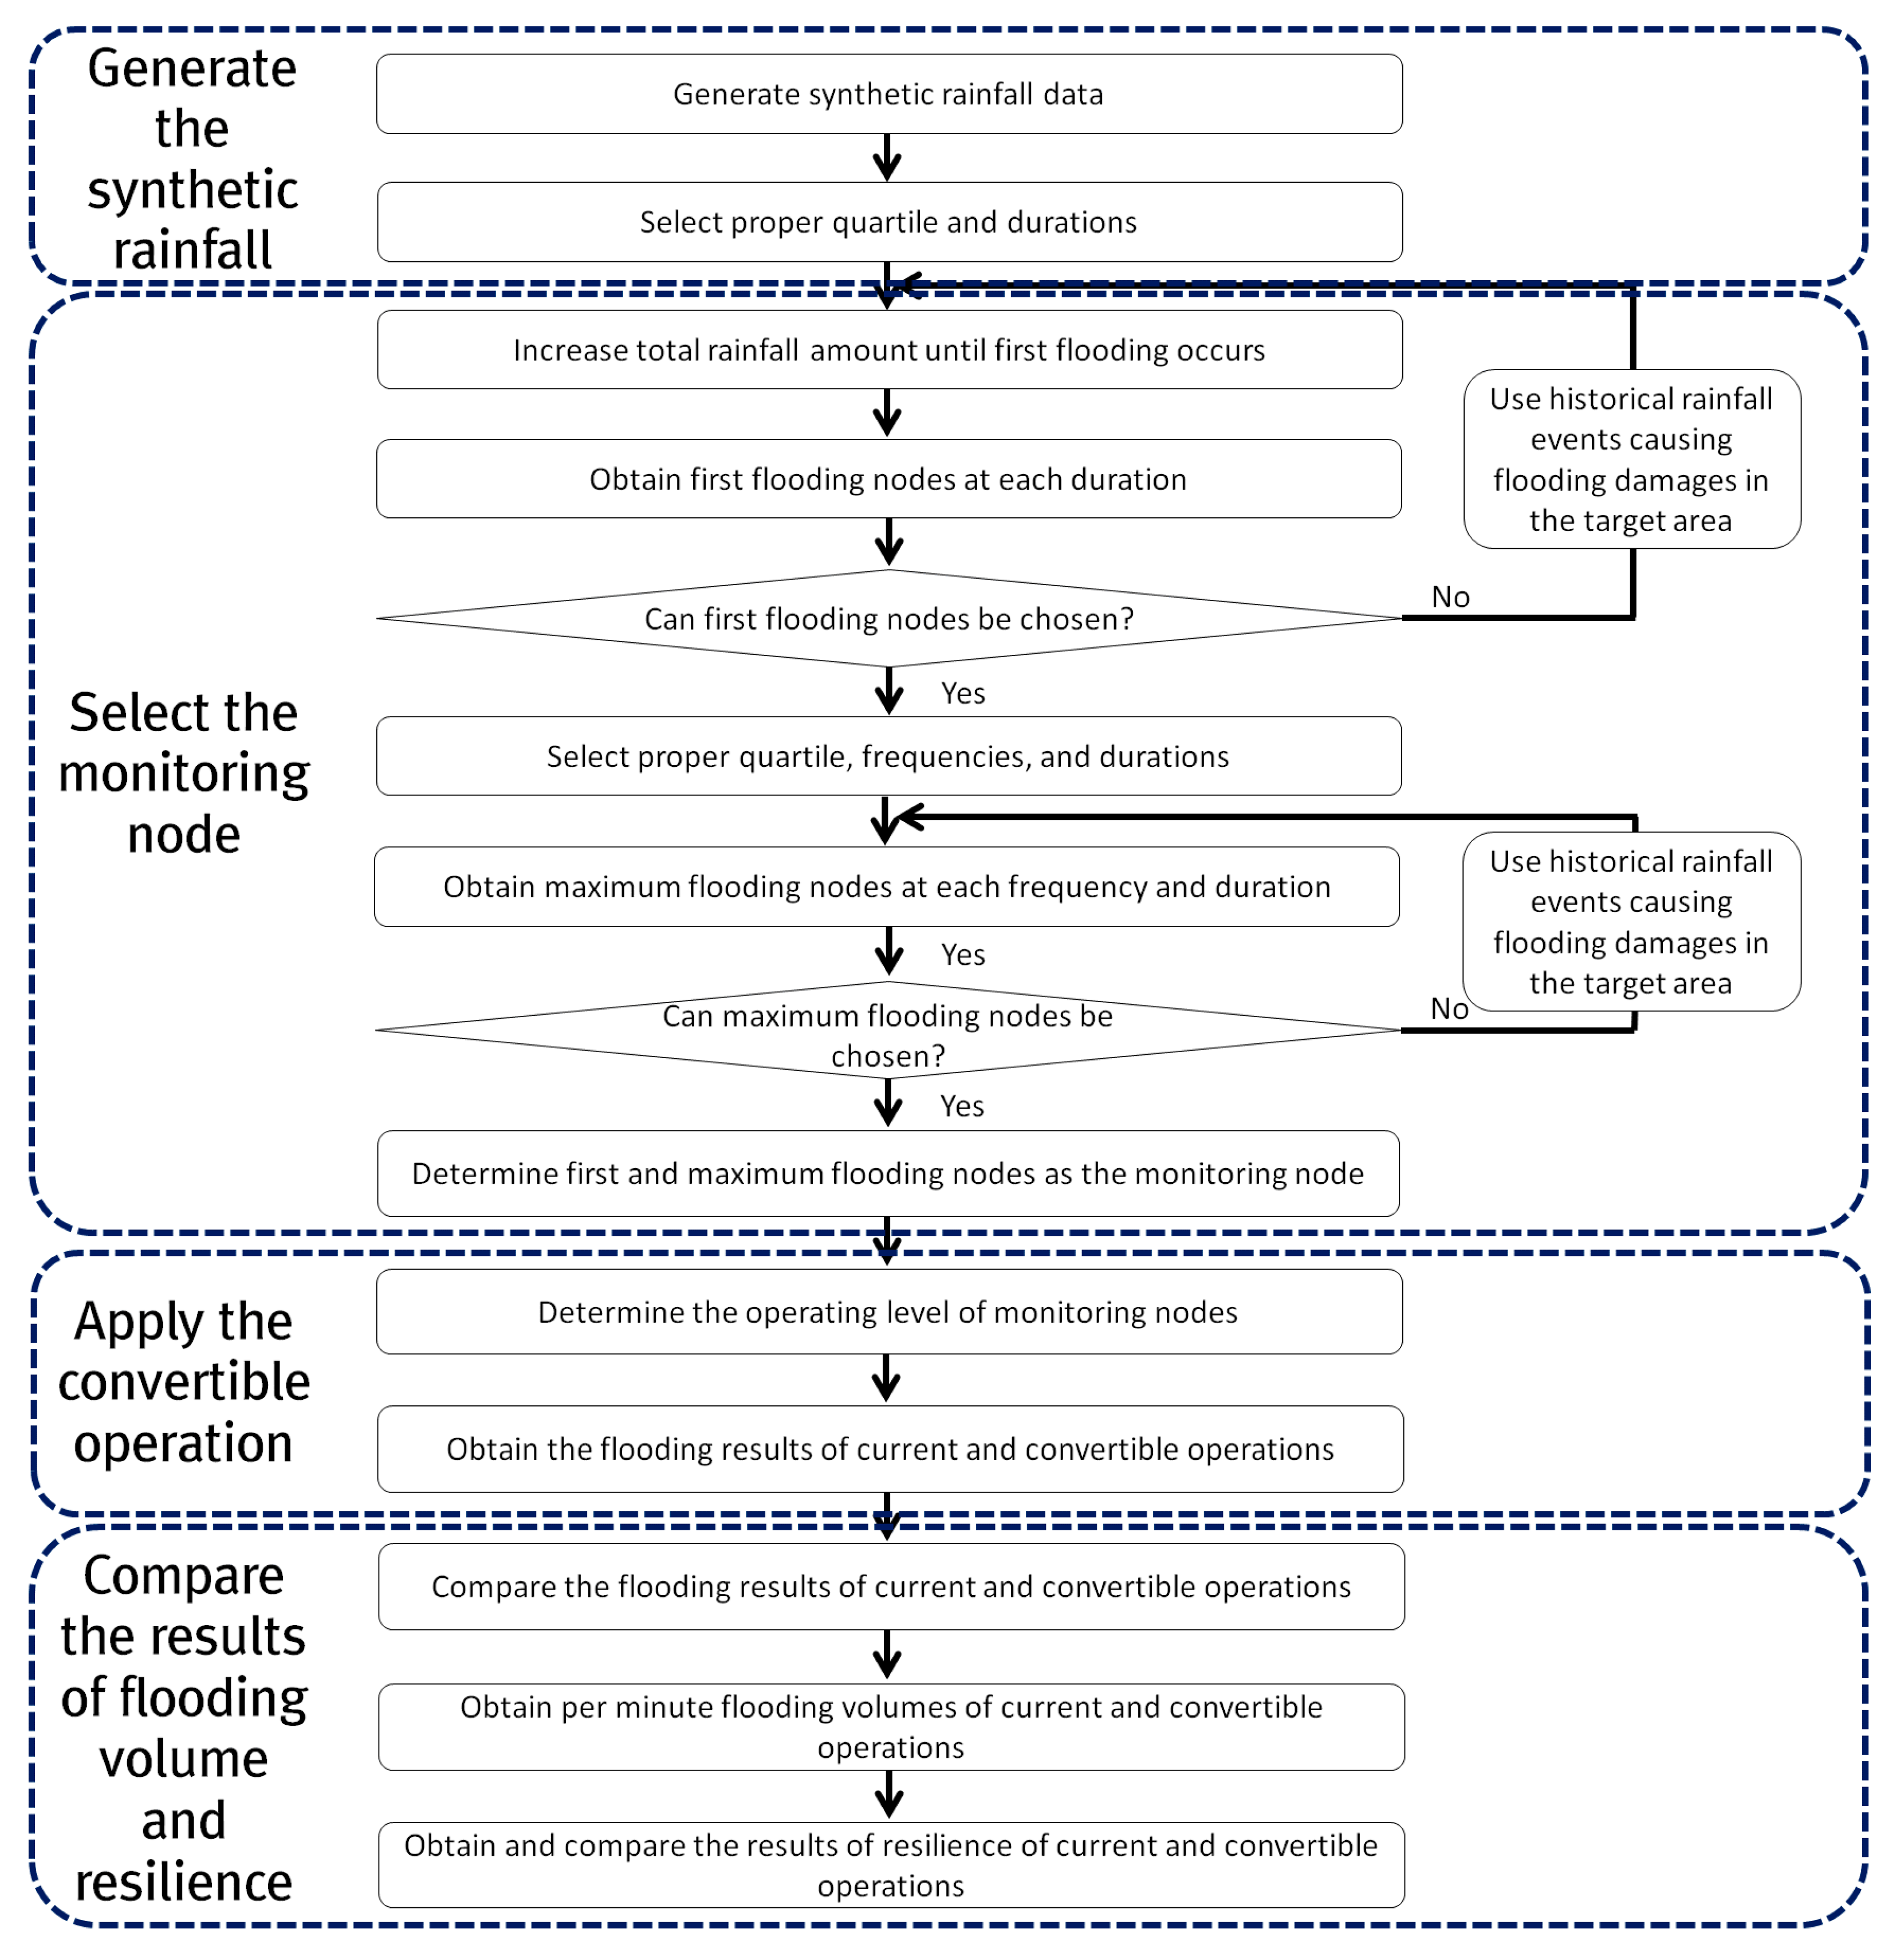
This study consisted of four parts: First, synthetic rainfall data were generated for the rainfall runoff simulation. Second, monitoring nodes were selected for the convertible operation in the centralized reservoirs; these nodes were chosen by searching for the first flooding node and the maximum flooding node. Third, the operating method for the convertible operation in centralized reservoirs was investigated and the convertible operation was applied to the target area. Finally, the results of the convertible operation were compared with the results of the current operation to examine the effects of the convertible operation and to assess system resilience. A flowchart of this study is shown in Figure 1.
2.2. Generation of Synthetic Rainfall Data for Selecting Monitoring Nodes
In this study, monitoring nodes were selected by searching for the first and maximum flooding nodes. This search was based on rainfall runoff simulations using rainfall input data; in Korea, most drainage facilities are designed using synthetic rainfall data based on the Huff distribution [16]. The Huff distribution consists of four quartiles, split according to the peak time of the synthetic rainfall data. If the total time of the synthetic rainfall data is assumed to range between 0% and 100%, then the peak time of each quartile is divided into four regions. The peak values of the first, second, third, and fourth quartiles in the Huff distribution are located between 0% and 25%, 25% and 50%, 50% and 75%, and 75 and 100%, respectively. Each region has an appropriate quartile; the third quartile is appropriate to Korea [17]. The cumulative regression equation of the third quartile for the Huff distribution in Seoul is as follows [18]:
where y represents the ratio of cumulative rainfall, and x is the ratio of the total rainfall duration. The process of generating synthetic rainfall data via the Huff distribution consists of three steps [9,10,19,20]: The first step is the generation of a cumulative rainfall distribution using the cumulative regression equation. The second step is the conversion from the cumulative rainfall distribution to the separated rainfall distribution. The final step is the process of applying the total rainfall amount according to the selected frequency and rainfall duration to the separated rainfall distribution. This process for generating the synthetic rainfall data via the Huff distribution is shown in Figure 2.
2.3. Selecting Monitoring Nodes for the Convertible Operation
Monitoring nodes are important because the convertible operation of centralized reservoirs in pump stations is based upon the level of the monitoring nodes. Selection of the monitoring nodes is based on two methods: finding (1) the first flooding nodes; and (2) the maximum flooding nodes. These methods have been used in previous studies [9,10,19] into the operation of urban drainage facilities.
For the first flooding nodes, three durations were selected by considering the time of concentration. For example, 30, 60, and 90 min durations were chosen if the time of concentration was 30 min. When searching for the first flooding nodes, the initial total amount of synthetic rainfall in the study area was set at 1 mm and this was then increased in 1 mm increments until first flooding occurred at each duration. First flooding nodes at each duration were then selected as the monitoring nodes. If the first flooding nodes were different, the distribution of historical rainfall data was used following the same process. To identify the maximum flooding nodes, the synthetic rainfall data were generated at a minimum of three frequencies and for three durations. Rainfall runoff simulations for all rainfall data were conducted and the maximum flooding nodes at each simulation were chosen; the results were then reviewed and the node with the most frequent occurrence was then selected. If the maximum flooding nodes were different from each other and it was difficult to select appropriate monitoring nodes using the synthetic rainfall data, historical rainfall data were used to identify the monitoring nodes. Historical rainfall events in 2010 (21 September 2010) and 2011 (27 July 2011) were therefore applied for selection of the maximum flooding nodes. Figure 3 shows the detailed process used to identify the first flooding nodes and maximum flooding nodes used in this study.
2.4. Convertible Operation of Centralized Reservoirs in Pump Stations
The general operation of centralized reservoirs in pump stations, such as one centralized reservoir in one pump station, has been recommended in a previous study [10]. Gate operation was not considered in that study because gates were not present in the target watershed. However, in this study, the convertible operation of multiple centralized reservoirs in multiple pump stations with drainage pumps and gates was examined.
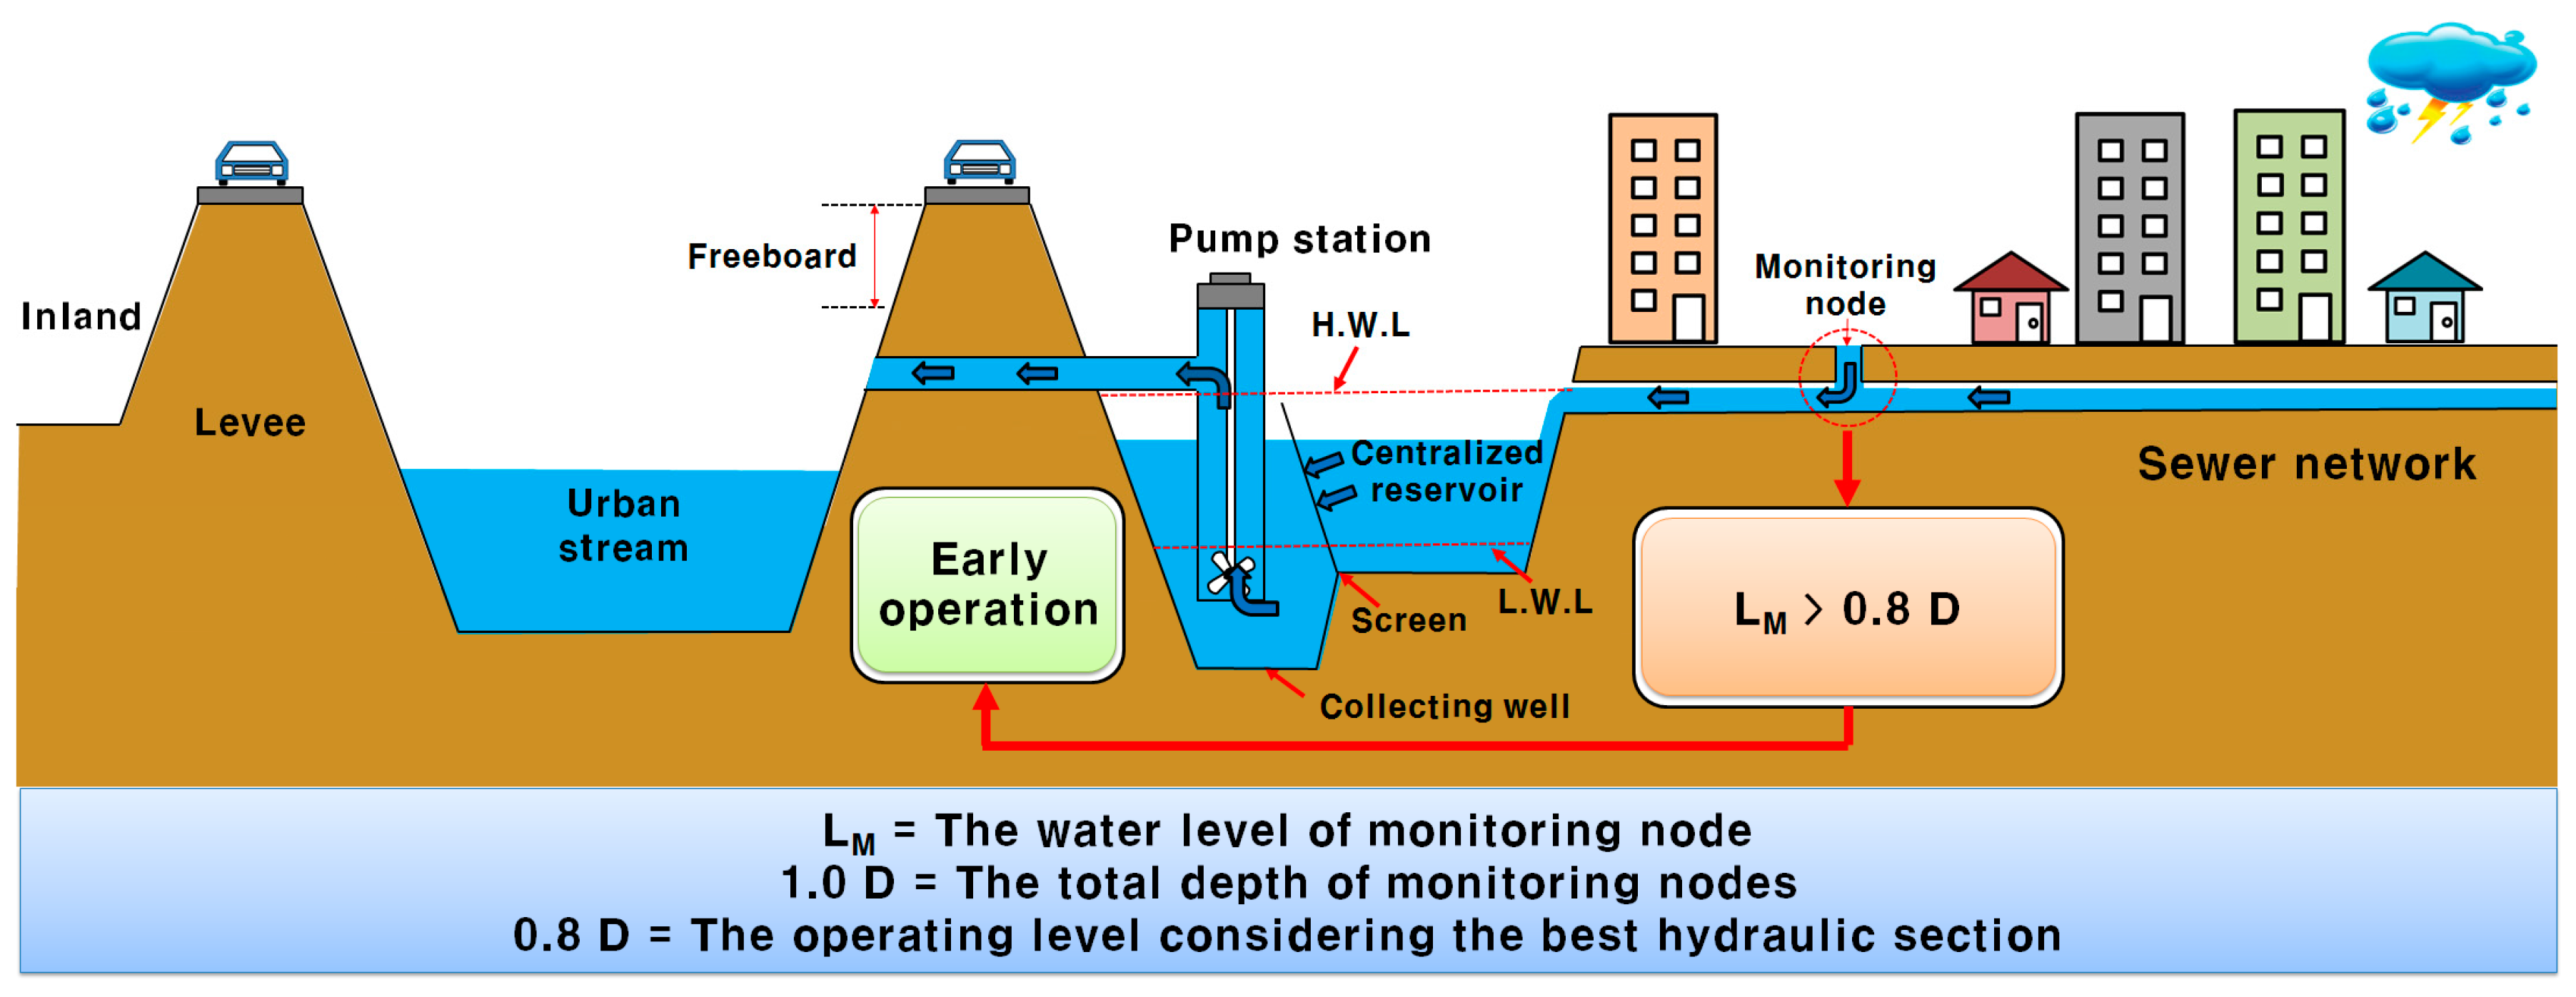
Distribution of water through gate operation in multiple centralized reservoirs is very important for reducing flooding from backwater effects and to obtain additional storage. The flow in centralized reservoirs can be driven to one side by gravity if it is not controlled by drainage pumps or gates. The operation of drainage pumps is based on the level of monitoring nodes, and the operation of gates is based on the level of each centralized reservoir. In Korea, most urban sewer systems are combined sewer systems, and the sewer system in this study was a combined sewer system. Up to 3Q (three times the dry weather flow) is captured by an intercepting sewer in centralized reservoirs and sent to a Waste Water Treatment Plant (WWTP) located outside of the study area. Inflow over 3Q is discharged to urban watercourses by pump stations (Figure 4).
In Korea, the water level of centralized reservoirs in pump stations is a standard used for operating drainage pumps. The initial operating level of the drainage pumps in centralized reservoirs was calculated as the sum of three factors: (1) the required depth; (2) the screen head loss; and (3) the freeboard for mechanical operation. The required depth (1) was obtained by dividing the value of the required volume (1-1) by the average area in a centralized reservoir (1-2). The required volume (1-1) is the product of the pump discharge and the pump preparation time. In this study, the screen head loss ranged between 0.1 to 0.3 m, and the freeboard for mechanical operation was distributed from 0.0 to 0.2 m. Other operating levels are based only on the required depth. The equation used to calculate the initial operating level of the drainage pumps in the centralized reservoirs is shown below:
where Oi is the initial operating level of the drainage pumps in a centralized reservoir and Pi is the initial operating pump discharge. Tp is the preparation time of the initial operating pump and Vr is the required volume in the centralized reservoir. Al is the average area at each elevation in CR and Hs is the screen head loss. Fm is the freeboard for mechanical operation and Bcr is the bed elevation of the centralized reservoir.
The operation of the gates is based on the water level at the discharge location, and the levels of the centralized reservoirs receiving water are considered because of the flow between centralized reservoirs. The schematics of the gate operation in centralized reservoirs referred to in this study are shown in Figure 5.
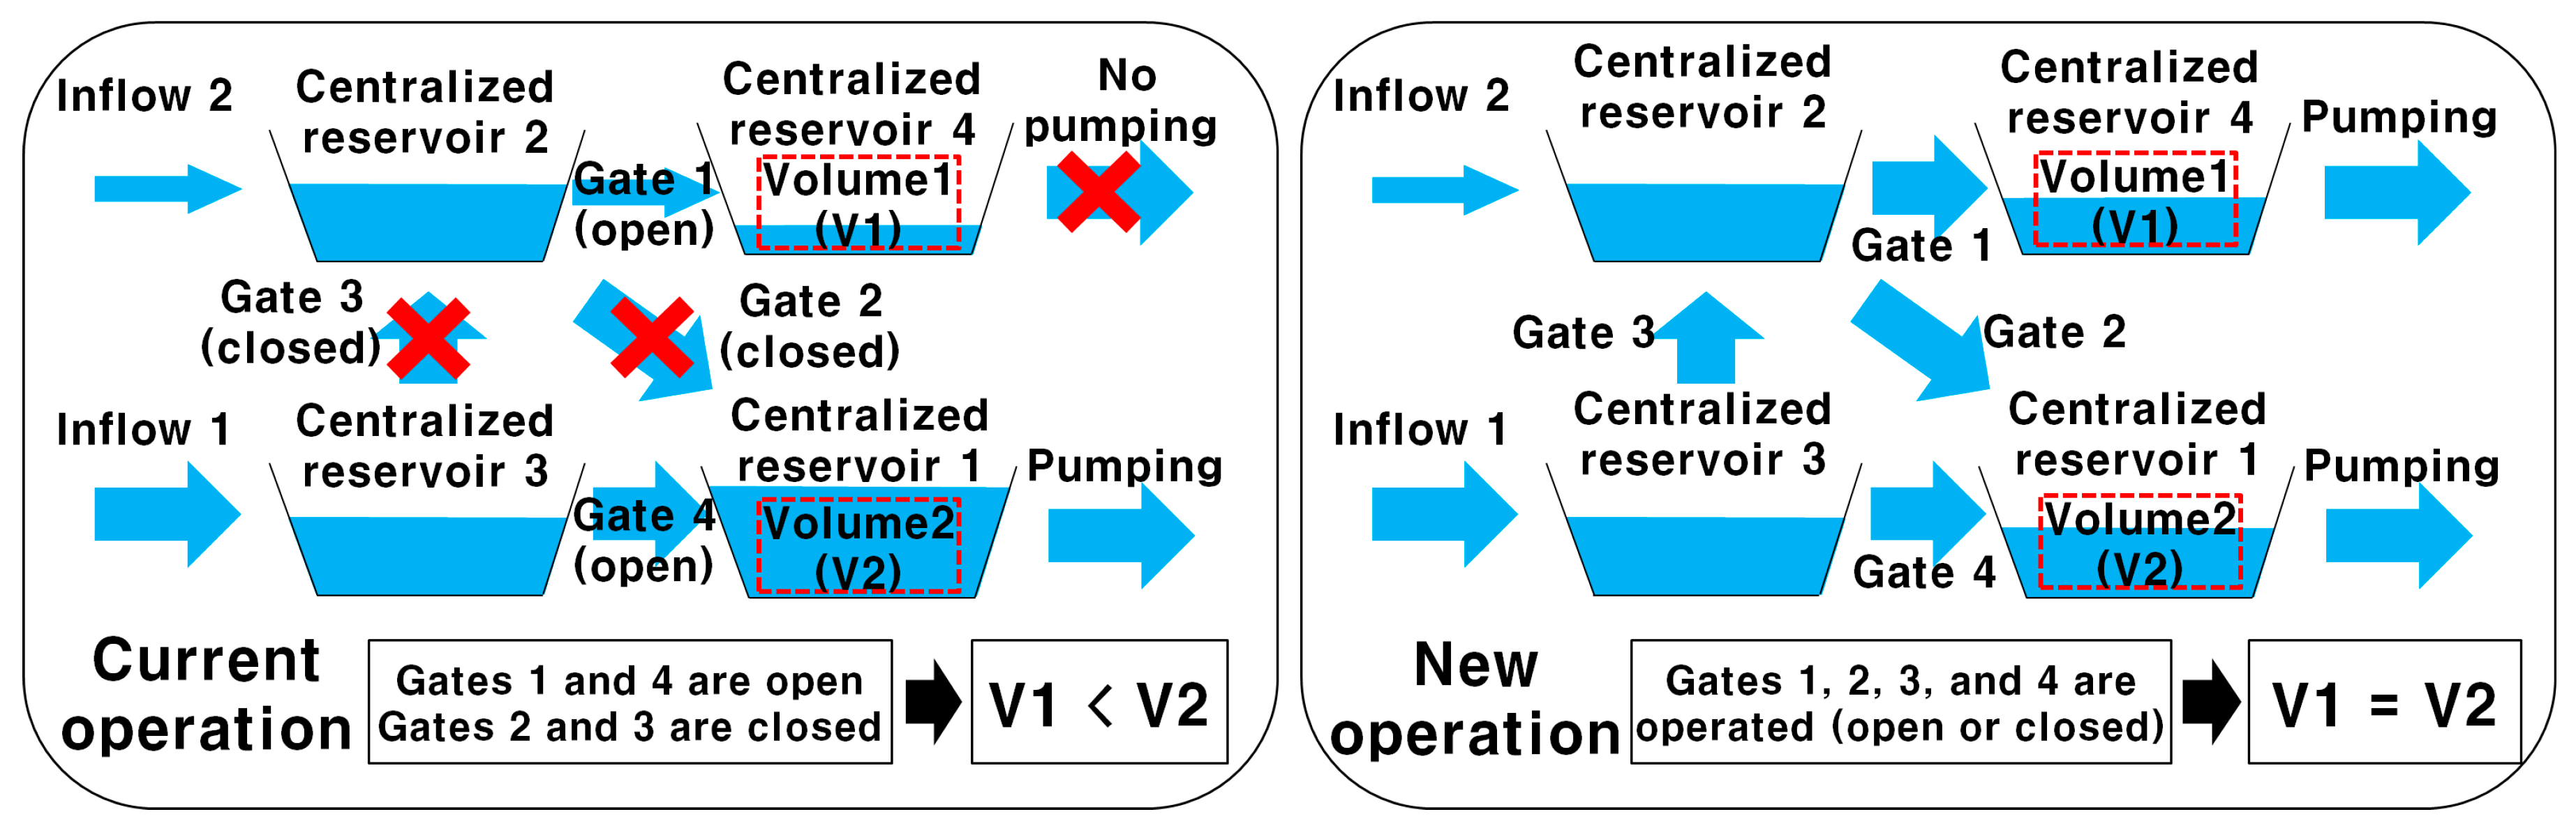
In the current operation, inflows 1 and 2 are divided, and there is no gate operation. If inflow 1 is large and inflow 2 is small, the centralized reservoirs receiving inflow 1 have high levels, while the centralized reservoirs receiving inflow 2 have low levels. When the water is pushed to one side, the levels in the centralized reservoirs increase and the levels of the upstream conduits also increase via backwater effects. In the new operation, inflows 1 and 2 flow into different reservoirs and are distributed through gate operation based on the levels of the centralized reservoirs receiving the water. If inflow 1 is large and inflow 2 is small, gate operation can distribute the water appropriately.
The convertible operation is the operation between the centralized reservoirs that changes the flow path of the inflow. For example, inflow 1 in Figure 5 has several flow paths, including: (1) centralized reservoir 3 to centralized reservoir 2 to centralized reservoir 4; (2) centralized reservoir 3 to centralized reservoir 2 to centralized reservoir 1; and (3) centralized reservoir 3 to centralized reservoir 1. If inflow 1 flows to centralized reservoir 4, it is discharged by pump station 2. However, if inflow 1 flows to centralized reservoir 1, it is discharged by pump station 1. Inflow 2 also has several flow paths.
The volume of runoff from the catchment was based on the amount of rainfall and the catchment area. Two catchments have different runoff rates because rainfall could be distributed unevenly or because the size of the catchment area is different. Additionally, runoff from the catchment is not uniform because concentration time can very between catchments. In the current operation as shown in Figure 5, one pump station discharges inflow into centralized reservoir 4, while the other pump station continues to discharge inflow into centralized reservoir 1 because gates 2 and 3 are closed.
2.5. Determination of the Operating Method for Pumps and Gates in the Decentralized Reservoirs
Historical flooding occurred twice within the study area, once in 2010 and again in 2011. The level of pump operation in the convertible operation was calculated prior to the rainfall runoff simulation. The preparation time was generally considered to take between 5 and 30 min. The average area in the centralized reservoir was published in an official report for the pump station. The screen head loss ranged from 0.1 to 0.3 m, while the freeboard for mechanical operation was between 0.0 and 0.2 m. Other operating levels excluding the initial operating level were determined by the required depth only. Table 1 shows the pump operating levels of the centralized reservoirs in the target watershed.
To determine the appropriate operating level, both the best hydraulic section and local regulation were considered [21]. The appropriate range of operating level based on the best hydraulic section was 0.8 to 1.0 D; this is because the flow rate of a conduit at a depth from 0.8 to 1.0 D was larger than the flow rate when a conduit is filled with water if D represents the total depth of node. In Korea, the large conduits in urban drainage systems should have additional capacity, ranging from between 25% and 50%. Using local regulation, the appropriate range was 0.67 to 0.8 D [19]. Therefore, the level meeting both conditions was 0.8 D and this was the standard applied to this study.
In gate operation, gates 2 and 4 were automatically closed if the stream gate was closed and the inflow gate was open. In this case, reservoir 1 received inflow from the Mokgam Stream and the inflow was discharged via drainage pumps in the Gaebong 1 pump station. All inflow from drainage areas 1, 2, and 3 passed to reservoir 4 and was discharged via the Gaebong 2 pump station. Additional gate operation was conducted when water levels in the Anyang Stream were high. Both the current and new operations included additional gate operation. For the 2010 and 2011 rainfall events, the stream gate was open and the inflow gate was closed. In this study, gates 1, 2, 3, and 4 were opened or closed in the new operation according to the level of each centralized reservoir (whereas gates 2 and 3 were closed in the current operation). Table 2 shows the comparison between the current and new operations.
2.6. Comparison between the Current and Convertible Operations Considering System Resilience
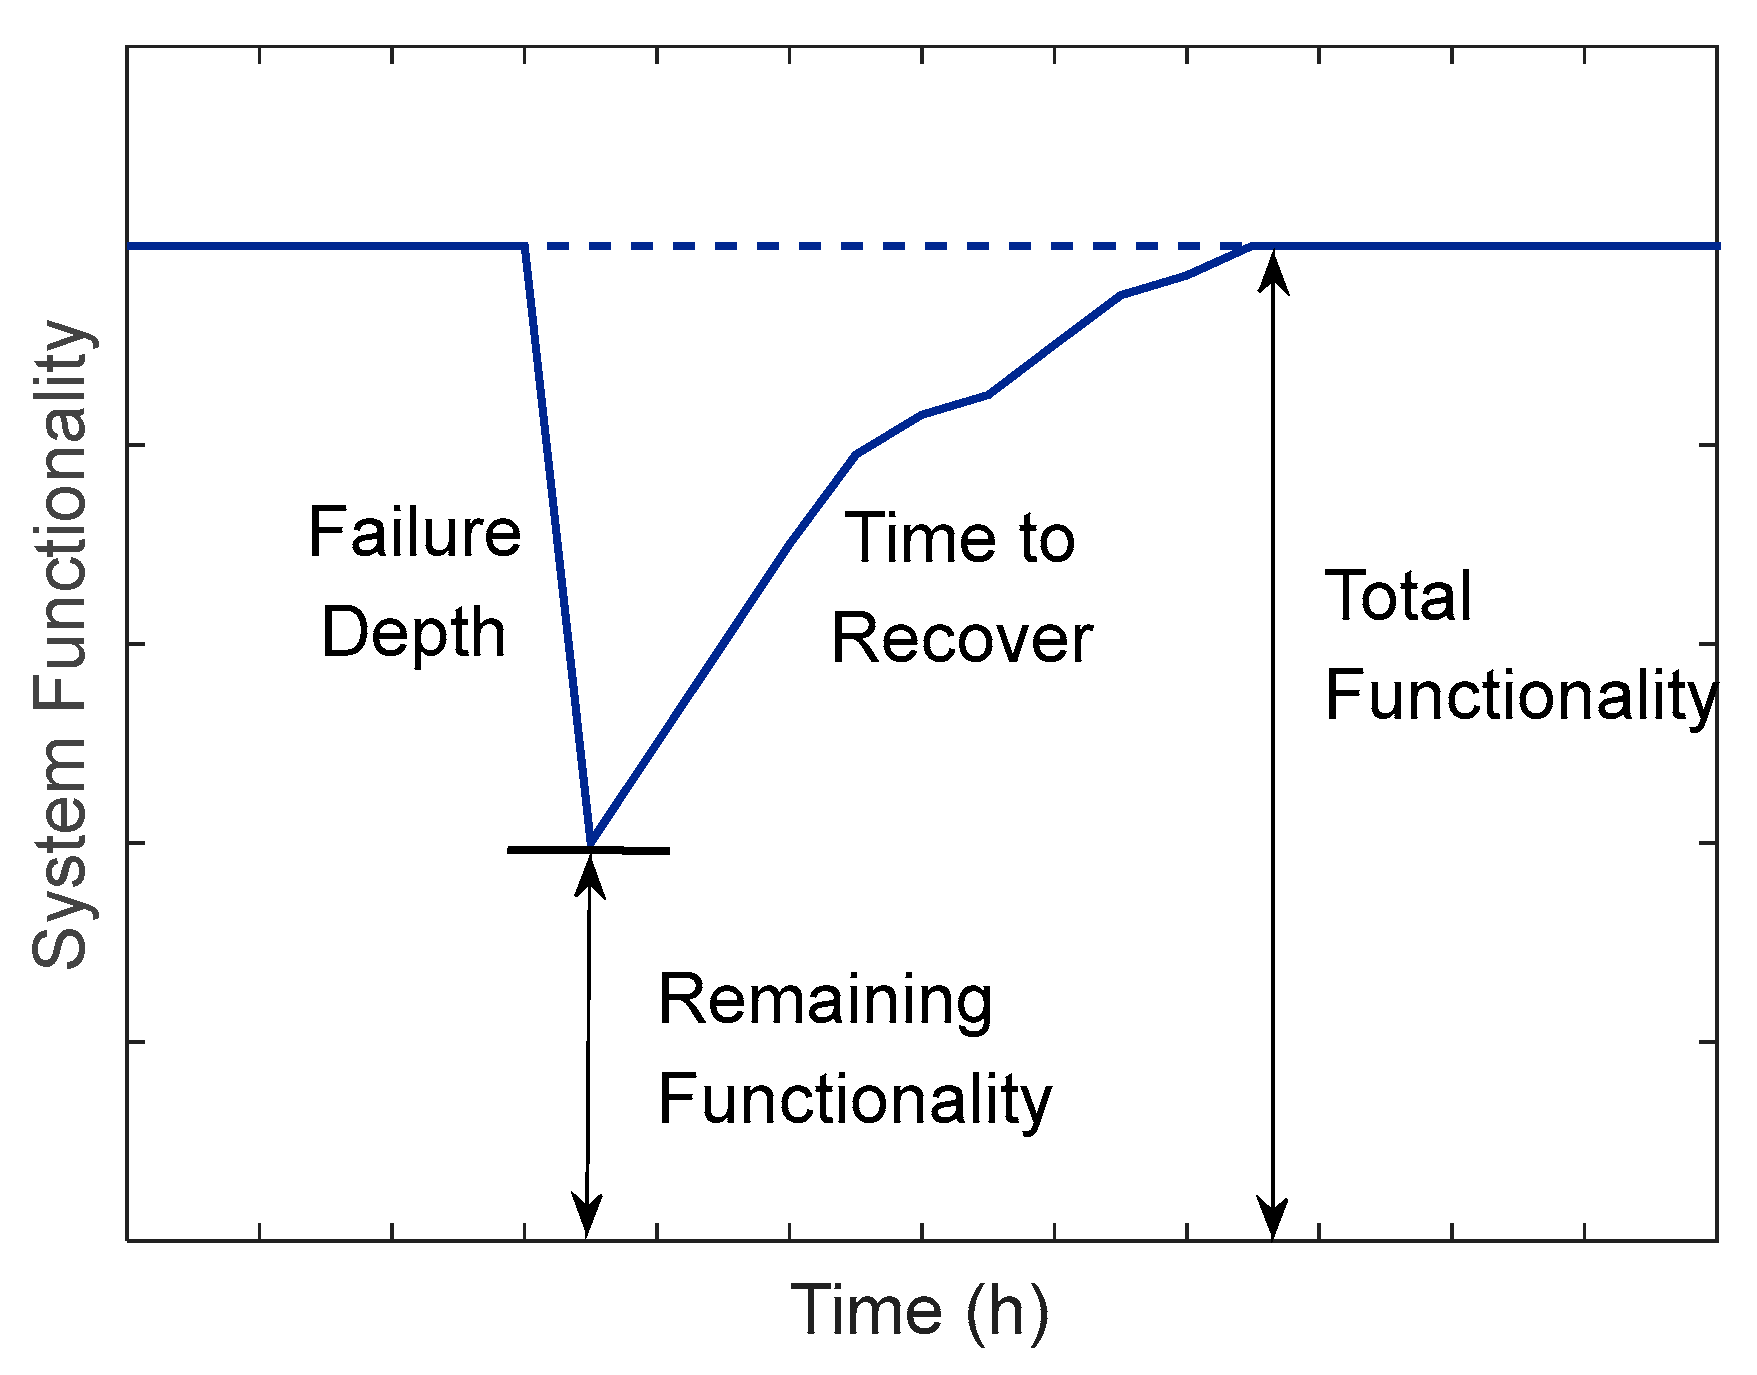
One method used to evaluate structural and nonstructural measures is system resilience. System resilience in urban drainage systems can be defined as the ability to prepare for, and recover from, the malfunction of urban drainage facilities or flooding (failure) [10]. All systems, including urban drainage systems, have risk factors, and it is important to have the ability to recover quickly (resilience), even if the risk is connected to a disaster situation. In water resources engineering, disaster response is formulated through statistical analysis of past events, which is then used to enable prediction of future events. However, risk factors vary over time, and forecasting based on historical statistics can have limitations. Recently, system resilience has been used to evaluate various systems, including urban drainage systems.
A previous study [10] recommended the use of the resilience index, which considers concentration time in urban drainage systems. This resilience index is based on the results of per minute flooding volumes obtained from rainfall runoff simulations. Two factors—flooding volume and system resilience—were examined to compare the effects of operations. Figure 6 shows the concept of system resilience with failure and recovery over time.
The resilience index in urban drainage systems is calculated using a performance evaluation function with per minute flooding volumes, concentration times, and unit drainage areas. The values of the performance evaluation function, as well as the resilience index, are distributed from 0 to 1, with 1 meaning there is no failure (flooding). The performance evaluation function is as follows:
where u(T)t means the performance evaluation function at time t; Ft represents per minute flooding volume at time t (m−3); tc is the time of concentration; t is the current time; Rt is the rainfall volume at time t (10−3 m); and Au means the unit drainage area (1 ha = 10−4 m2). The value of the performance evaluation function was negative if flooding occurred as a result of rainfall. In this case, it was calculated as 0 using Equation (3). The performance evaluation function was high if an urban drainage system showed the ability to recover from failure.
The resilience of the urban drainage system based on the performance evaluation function is shown in the following equation:
where Rs refers to the resilience of the urban drainage system; Tn represents the entire time; T0 is the initial time; and u(T)t is the performance evaluation function at the current time. The results of each operation (the current and convertible operations) were compared and analyzed according to historical rainfall events.
2.7. Study Area
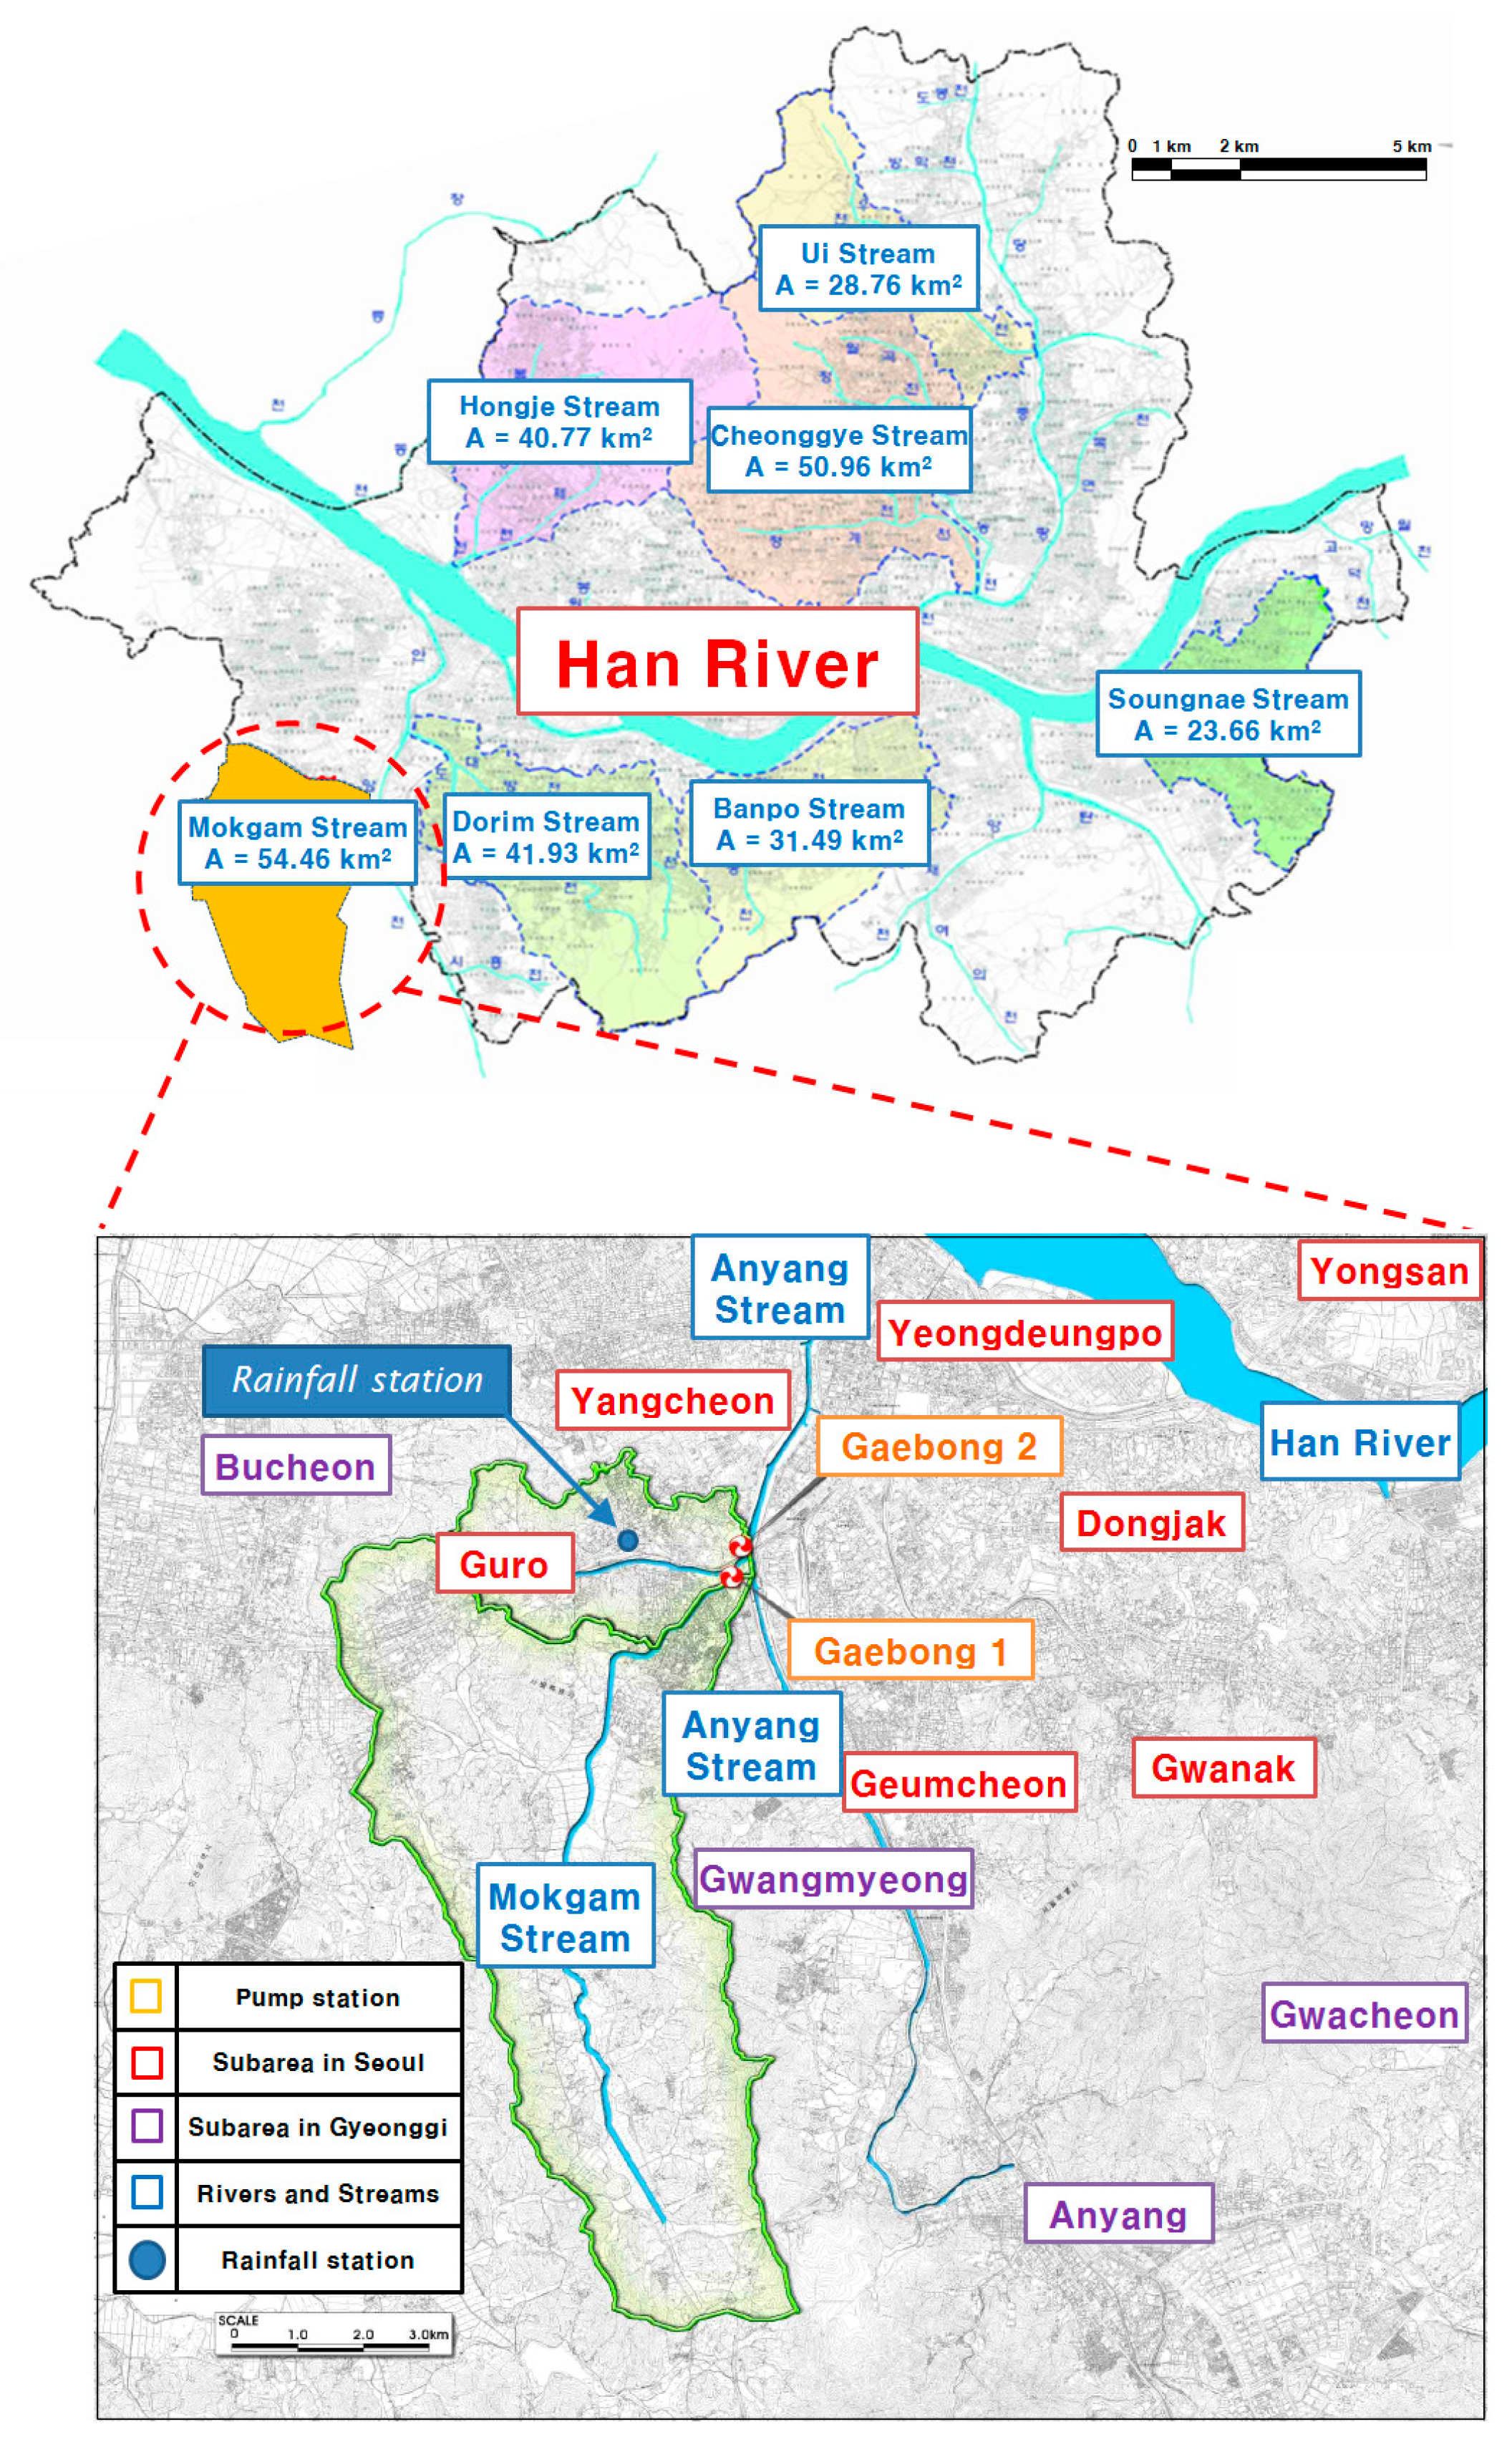
Gyeonggi province is the area surrounding Seoul (Seoul is the capital of Korea and has a population of 13 million people) and has a population of approximately 12.4 million people. Seoul and Gyeonggi province are traversed by the Han River. The Han River has many tributaries, including the Anyang Stream, which in turn has many tributaries, such as the Mokgam Stream. In this study, the area near the Gaebong 1 and Gaebong 2 pump stations, which are located in the lower reaches of the Mokgam Stream, was selected as the target watershed; its drainage area is 1086 ha. Figure 7 shows the location of the target watershed [21].
The target watershed had four centralized reservoirs and an inflow conduit between reservoirs 2 and 4 (Figure 8). The drainage system also had two pump stations, 711 sub-catchments, 618 nodes, and 630 links. The current operation of drainage facilities in the target watershed consisted of two steps. In the first step, the inflow gate from the Mokgam Stream and gate 3, located between reservoirs 2 and 3, were closed while the other gates were open. Inflow from drainage areas 1 and 2 was discharged via the Gaebong 2 pump station, including natural discharge gate 2, while inflow from drainage area 3 was discharged via the Gaebong 1 pump station, including natural discharge gate 1. In the second step, the stream gate was closed to prevent backwater effects from the Anyang Stream, and the inflow gate was open if the water level of the Mokgam Stream was high. Gates 2 and 4 were closed, and inflow from all drainage areas passed to reservoir 4 in the Gaebong 2 pump station. Reservoir 1 received the inflow from the Mokgam Stream [22].
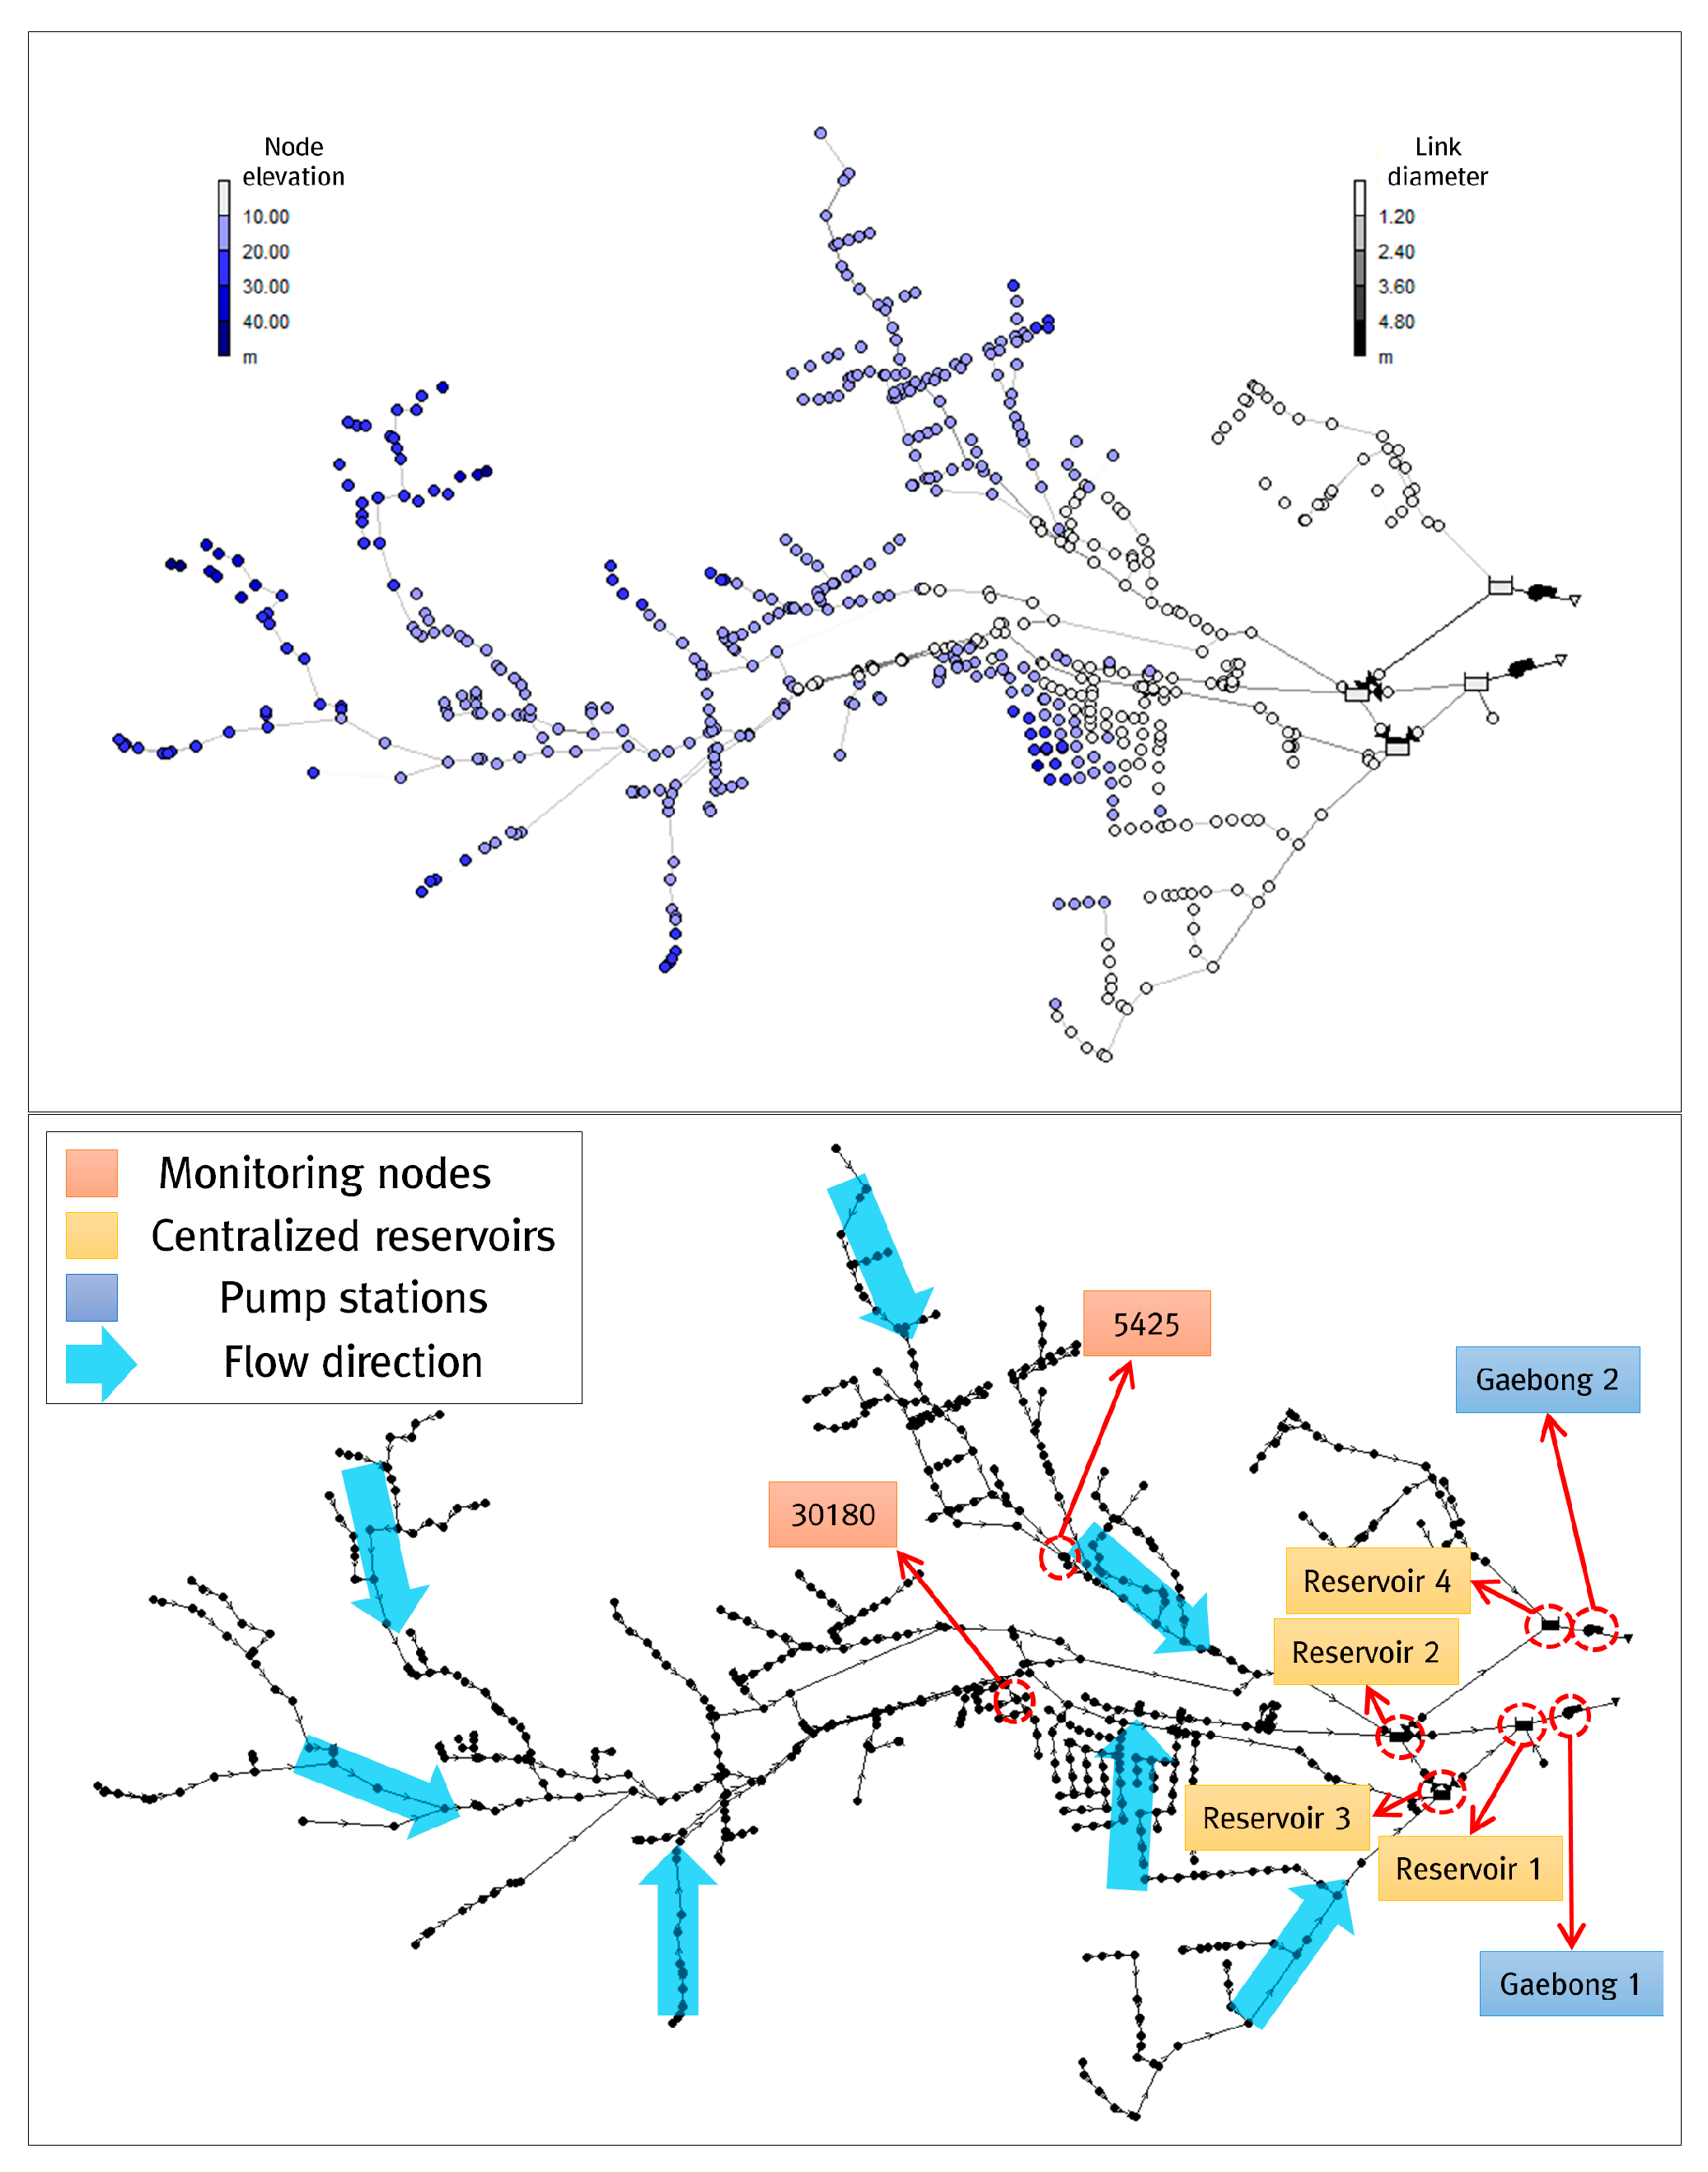
A storm water management model (SWMM) 5.0 was selected as the rainfall runoff model and used to simulate the target watershed [23]. The sewer network and drainage facilities in the target watershed were based on Geographic Information System (GIS) data for Seoul provided by the Seoul Metropolitan Government. Figure 9 shows the sewer network of the target watershed.
Information for the two pump stations, Gaebong 1 and Gaebong 2, consisted of high water level (HWL), low water level (LWL), initial operating level, and drainage pump capacity. Information for the centralized reservoirs consisted of HWL, LWL, area, and effective storage capacity. This information was necessary for the operation of the drainage facilities and is shown in Table 3.
3. Results
3.1. Selection of Monitoring Nodes for Pump Operation
Selection of the monitoring nodes was the first process for pump operation of the centralized reservoirs. First and maximum flooding nodes were selected as the monitoring nodes. First flooding nodes generally occurred in branch conduits. Branch conduits were located downstream of the node where the product of the runoff coefficient (C) and the drainage area (A) was smaller than 0.12 km2 (CA < 0.12 km2). However, it was difficult for branch conduits to represent the entire watershed because they had small drainage areas; hence, main conduits were selected for monitoring nodes. Main conduits were located downstream of the node where the product of C and A was larger than 0.12 km2 (CA ≥ 0.12 km2) [10]. The results of the monitoring node selection for the target watershed are shown in Table 4.
Nodes 30180 and 5425 were selected as monitoring nodes for pump operation of centralized reservoirs in convertible operation. These two nodes were located where the flow rate increased due to the steep slope of the upper conduit (5425) or the meeting of several conduits (30180). Their locations are shown in Figure 10.
3.2. Results of Flooding Volume for the Current and Convertible Operations
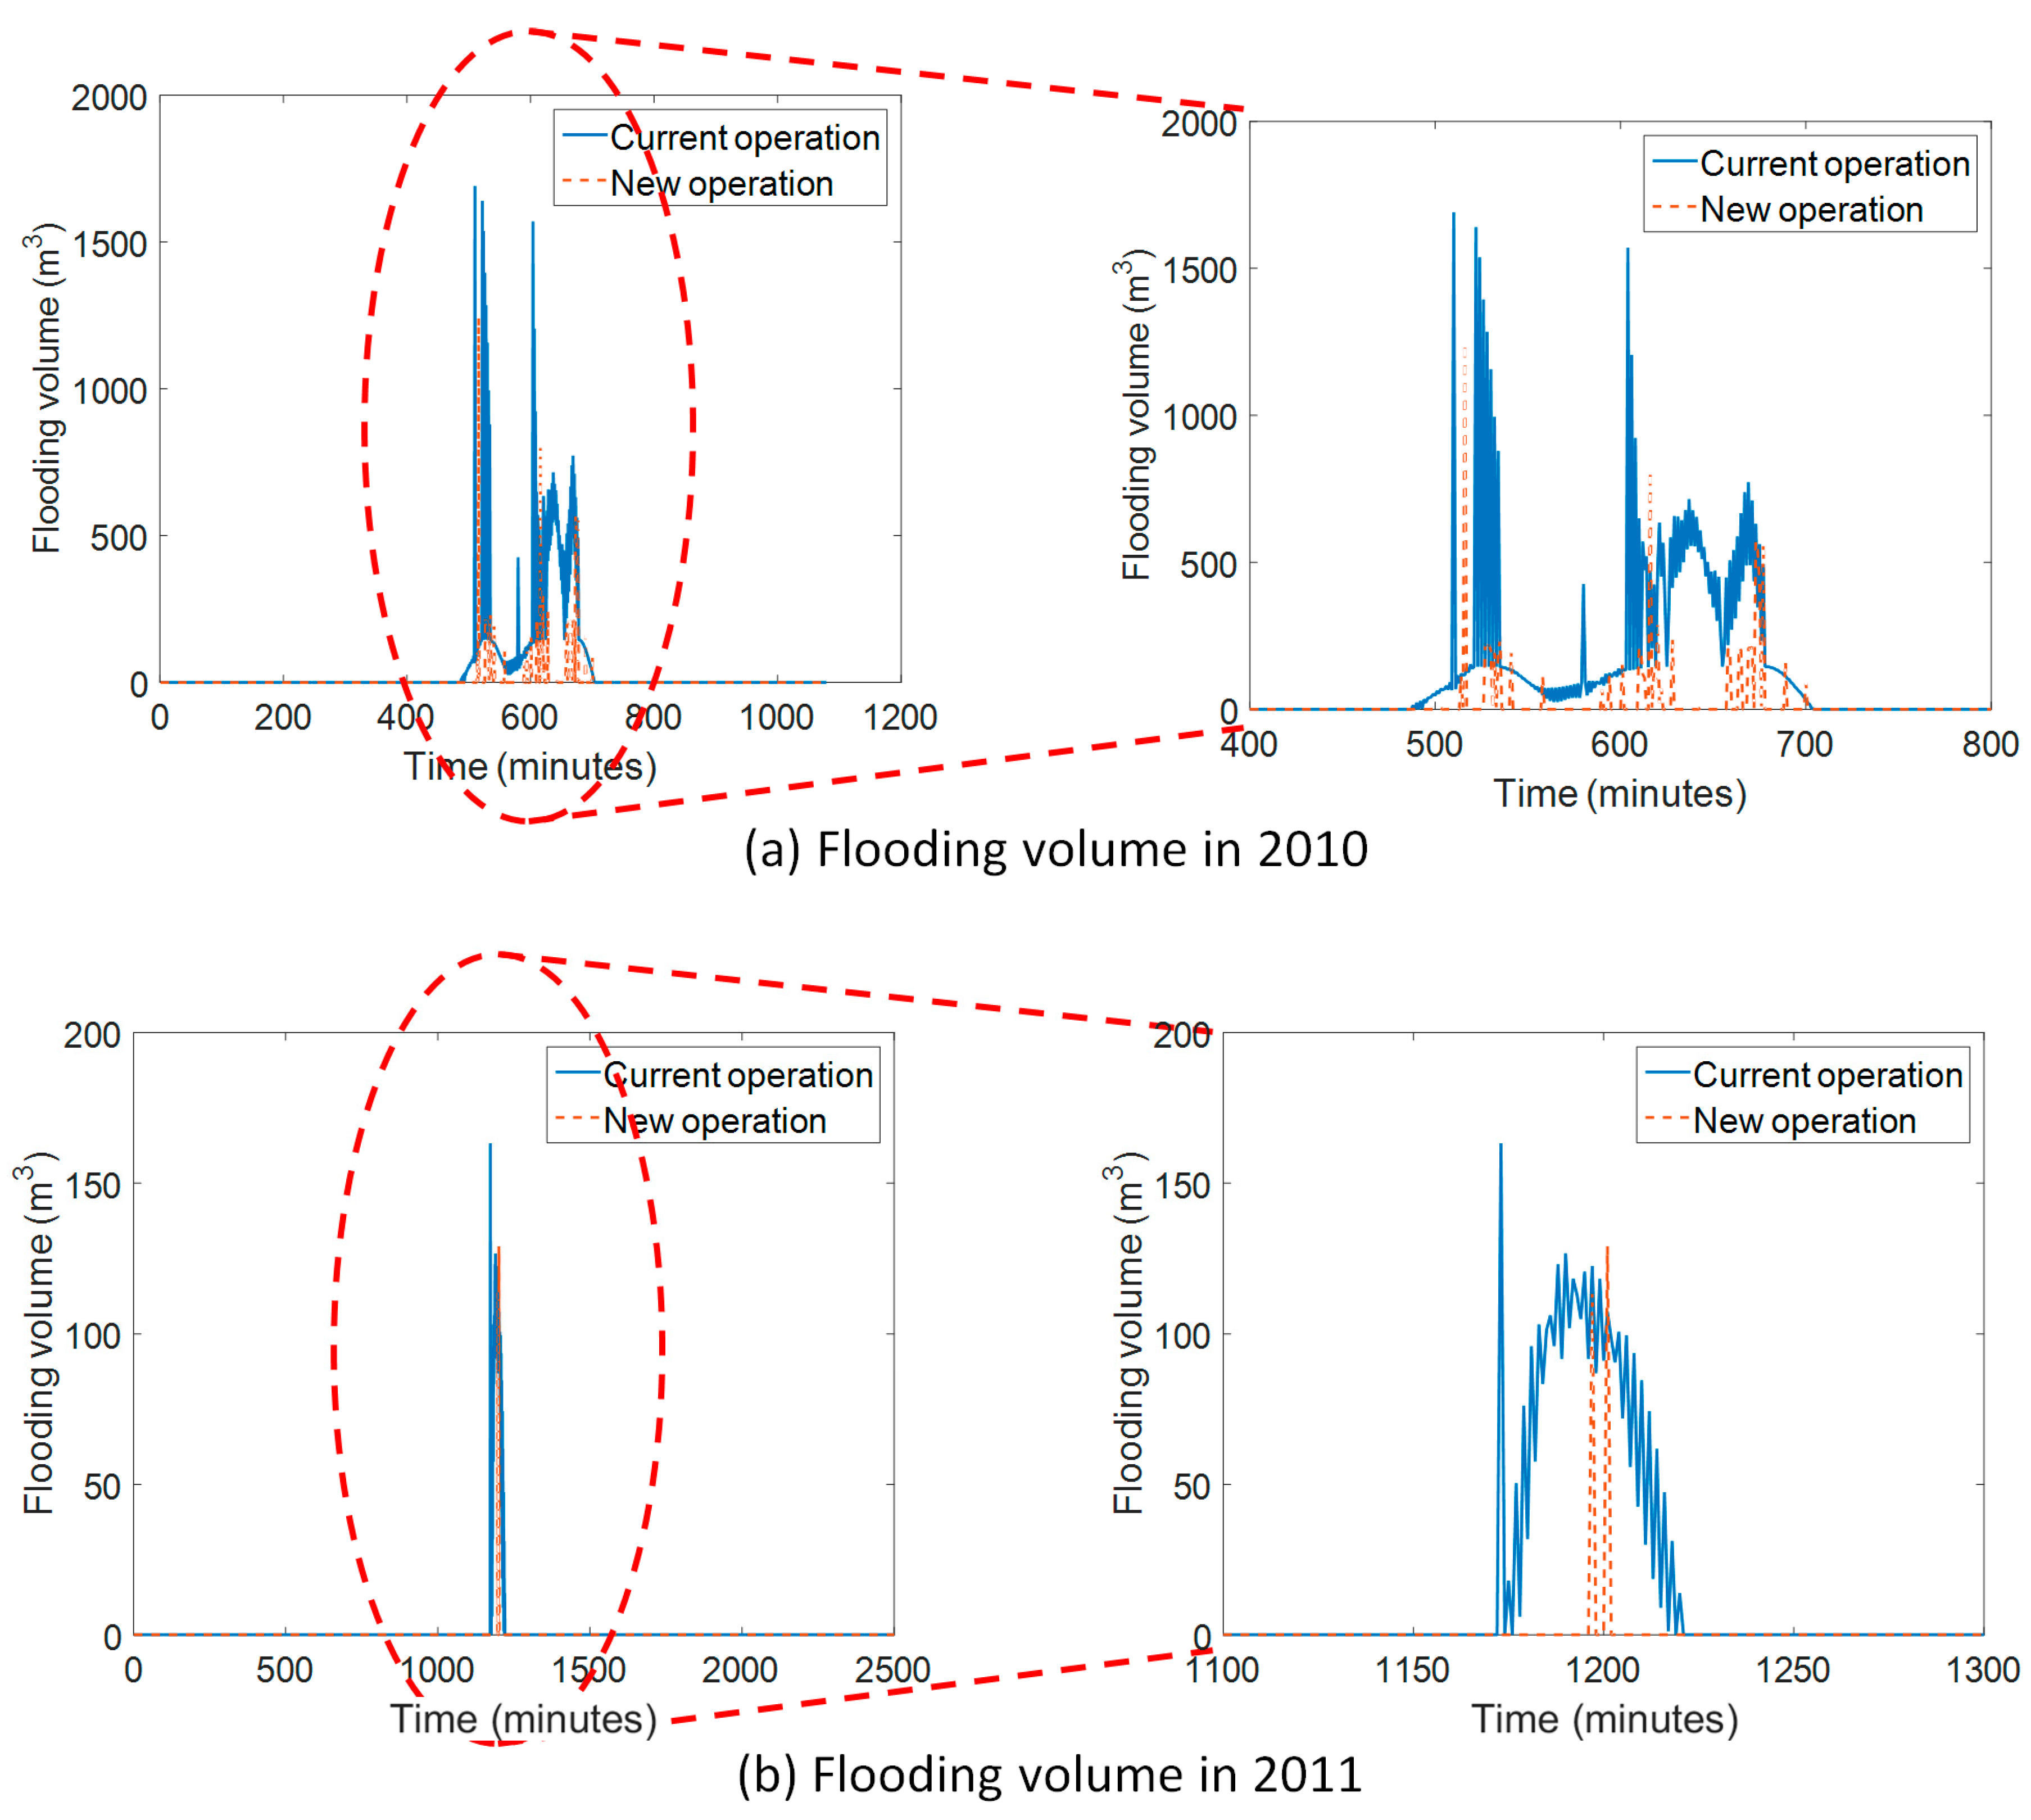
The new convertible operation combined pump operation and gate operation, preventing backwater effects based on the levels of the centralized reservoirs. The new gate operation provided additional storage capacity in the centralized reservoirs. The total flooding volumes for the current and new operations were 58,750 m3 and 7507 m3, respectively, for the 2010 event. For the 2011 event, the total flooding volumes for the current and new operations were 3697 m3 and 471 m3, respectively. The flooding volumes over time for the current and new operations are shown in Figure 11.
As shown in Figure 11a, the flooding volume for the 2010 event for the current operation occurred from 500 to 700 min. The peak flooding volume for the current operation was approximately 1700 m3 at 550 min, and the number of peak flooding volumes over 1500 m3 was three. Two peak flooding volumes occurred consecutively, while one appeared independently. The duration of the flooding for the 2011 event for the new operation was similar to that of the current operation. The peak flooding volume for the 2010 event for the new operation was approximately 1200 m3 at 570 min, and no other flooding volumes were over 1000 m3. The results for the 2010 event clearly showed the difference between the two modes of operation. Two peak flooding volumes occurred continuously because the centralized reservoirs had no additional capacity under the current operation. In contrast to the current operation, the new operation showed a single peak flooding volume, with no additional flooding volume because the centralized reservoirs had additional capacity.
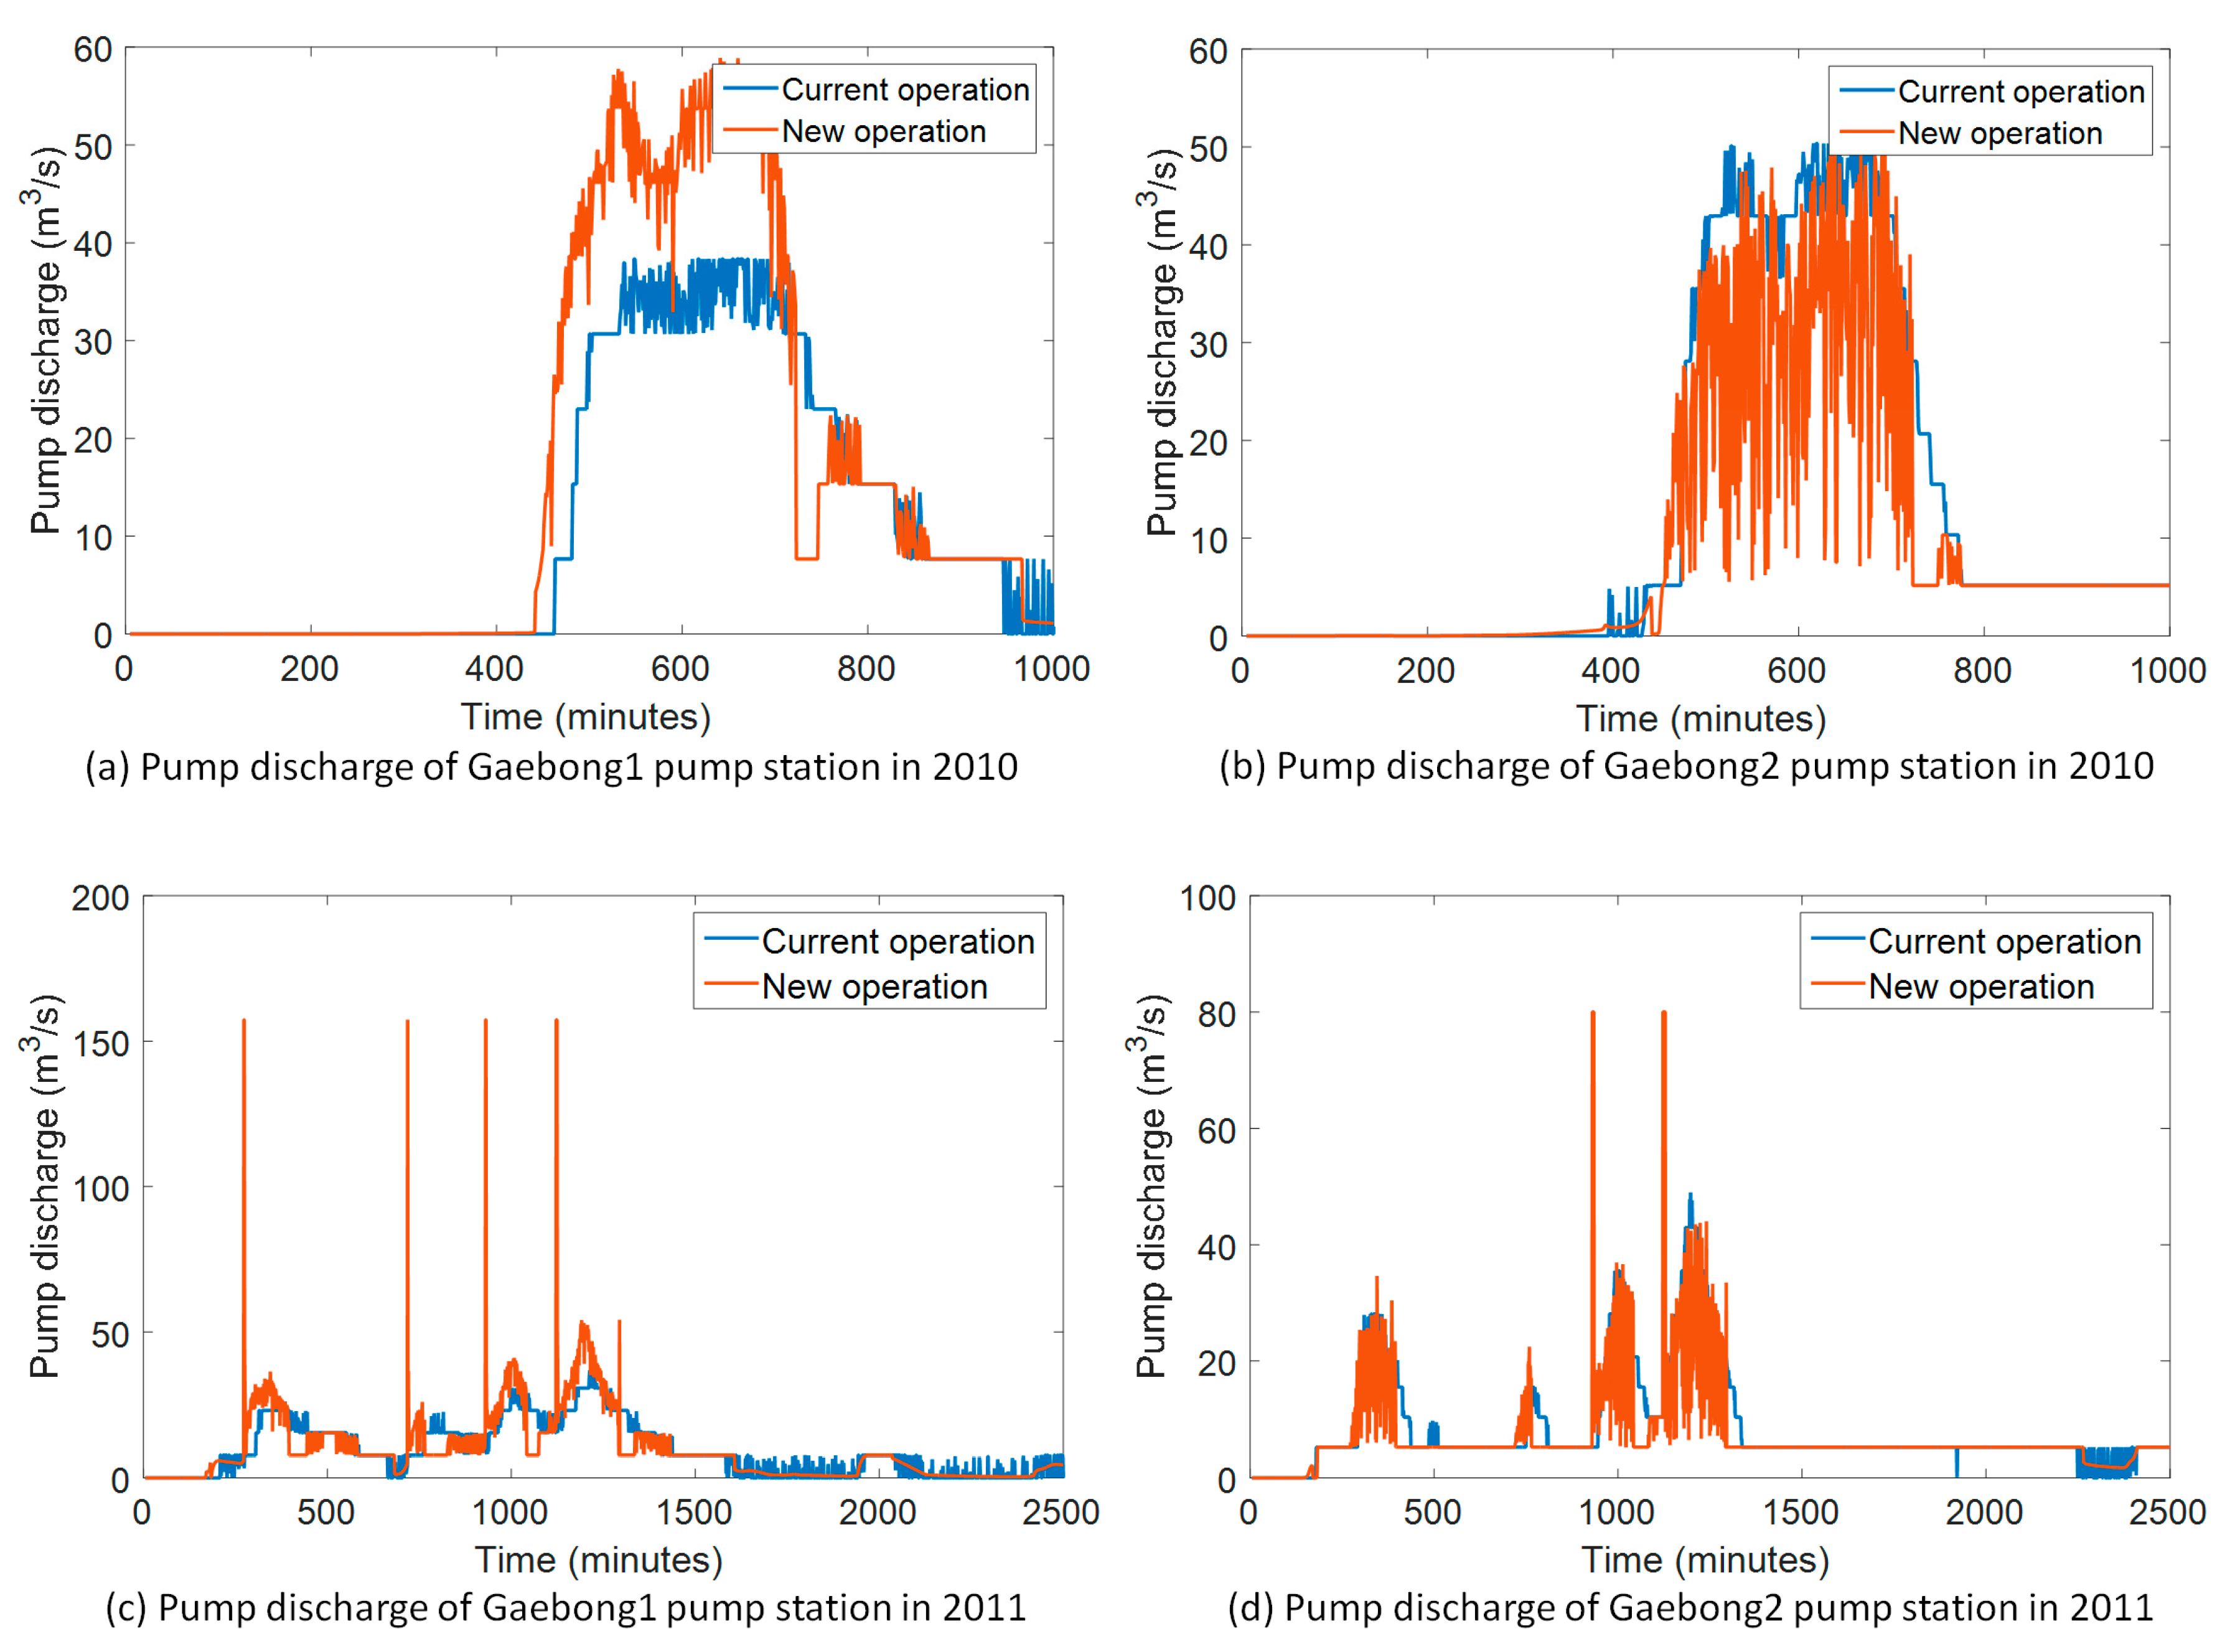
In Figure 11b, the flooding volume for the 2011 event for the current operation occurred from 1150 to 1220 min. The peak flooding volume for the current operation was approximately 160 m3 at 1150 min, and the number of peak flooding volumes over 120 m3 was two. Two peak flooding volumes occurred continuously and the pattern was similar to that of the 2010 event. The peak flooding volume for the 2011 event for the new operation was approximately 130 m3 at 1200 min, with no other flooding volumes over 120 m3. The results for the 2011 event also showed other differences, such as prevention of backwater effects and provision of additional capacity in the centralized reservoirs. The difference between the two operations was examined when the historical rainfall events were applied. Figure 12 shows the results of pump discharge over time for the current and new operations in the 2010 and 2011 events.
As shown in Figure 12a, the peak value of pump discharge in the new operation was higher than the peak value of pump discharge in the current operation. In Figure 12b, the peak value of pump discharge in the new operation is similar to the peak value of pump discharge in the current operation. In Figure 12a,b, the peak values of pump discharge in both operations occurred from 500 min to 700 min; this is because flooding in the 2010 event, as shown in Figure 12a occurred from 500 min to 700 min. In Figure 12c,d, the peak value of pump discharge in the new operation is higher than the peak value of pump discharge in the current operation. Figure 12c shows four peak values and Figure 12d shows two peak values. All peak values of pump discharge in the new operation occurred before 1200 min, although flooding occurred at 1200 min in 2011. This means that the new operation maintained low water levels in the centralized reservoirs as a preemptive response for reducing flooding in the study area.
Flooding at the monitoring nodes was caused by multiple factors, including the backwater effects due to the high water level in centralized reservoirs and insufficient capacity in the sewer conduit downstream of the flooded node. To solve this problem, capacity of the sewer conduit should be increased as a structural measure, requiring cost and time. The purpose of this study was to investigate a new method of operation as a potential nonstructural measure. However, the reduction of back water effects by the convertible operation cannot prevent urban inundation completely. This approach would demonstrate better results if sewer conduit capacity and the convertible operation were both carried out.
3.3. Results of System Resilience for the Current and Convertible Operations
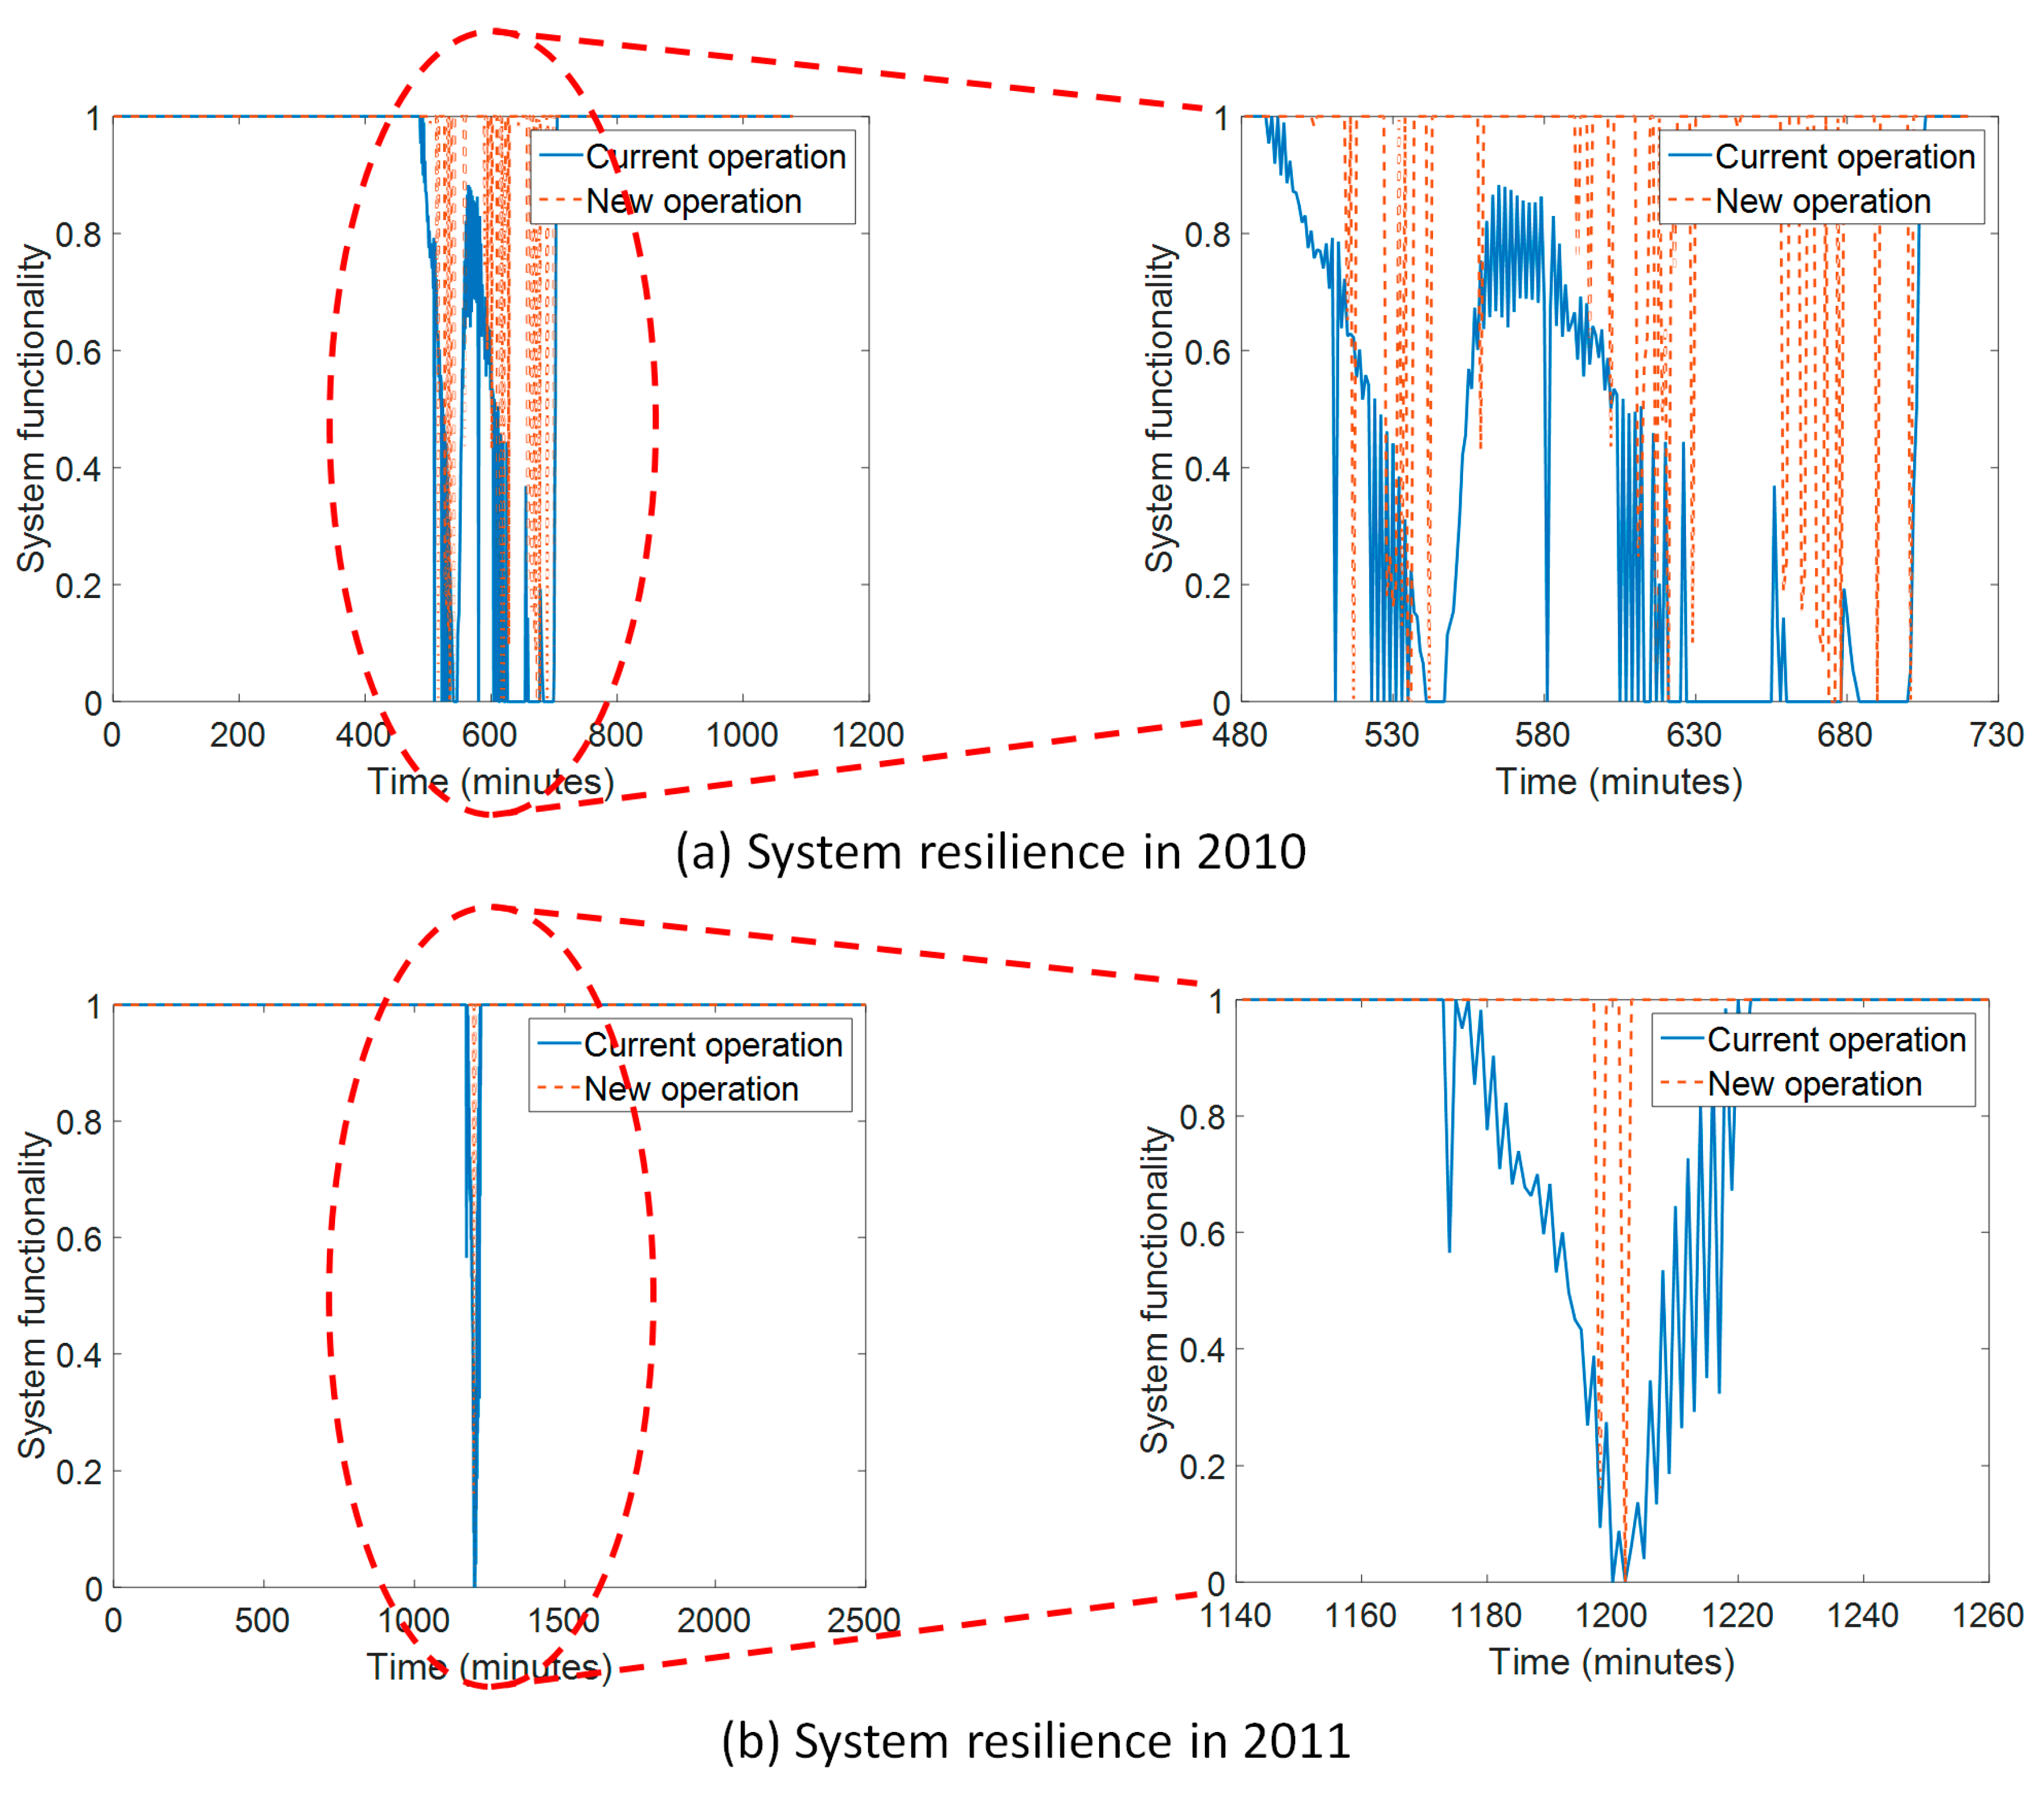
Figure 13 shows the results of system resilience analysis for the current and new operations, and highlights the increase in resilience for the 2010 and 2011 events.
For the 2010 event, the system resilience for the current operation was 0.86529 and the system resilience for the new operation was 0.97358. Therefore, the increase of system resilience for the 2010 event was 0.10829. For the 2011 event, the system resilience for the current operation was 0.99174 and the system resilience for the new operation was 0.99930. The increase of system resilience in 2011 event was 0.00756. The values of system resilience for the 2010 event were lower than those for the 2011 event because rainfall duration for the 2011 event was longer than that for the 2010 event, and rainfall intensity for the 2010 event was higher than that for the 2011 event. If system resilience was low, the potential of system failure was high. Therefore, failure for the 2010 event was larger than the failure for the 2011 event, and the reduction in the failure for the new operation for the 2010 event was larger than that for the 2011 event.
4. Conclusions
This study consisted of four parts: (1) the generation of synthetic rainfall data; (2) selection of monitoring nodes; (3) determination of operating level for drainage pumps and gates; and (4) comparison of flooding volume for the current and new operations, and examination of system resilience. The results of this study lead to the following conclusions.
- The new convertible operation of centralized reservoirs consisted of pump operation for rapid drainage and gate operation for additional storage capacity.
- Pump operation was conducted by the levels of monitoring nodes, which were obtained by finding first and maximum flooding nodes using synthetic rainfall data via the Huff distribution and historical rainfall data.
- Gate operation converted the flow of each drainage area based on the levels of centralized reservoirs and generated the effective runoff distribution for continuous flooding mitigation.
- The new convertible operation could reduce flooding volume and system failure, which are indicators for evaluation of urban drainage systems.
In this study, gate operation in convertible operation changed the drainage flow in each sub-area, and pump operation in convertible operation was used to induce rapid drainage and secure additional capacity in centralized reservoirs. Convertible operation represents a practical method that could be applied to urban drainage areas with pump stations that share centralized reservoirs. In future studies, cooperative operation between pump stations that share discharge streams and various drainage facilities, including underground drainage tunnels, should be investigated.
Acknowledgments
This research was supported by a grant (17AWMP-B066744-05) from the Advanced Water Management Research Program funded by the Ministry of Land, Infrastructure, and Transport of the Korean government and The National Research Foundation (NRF) of Korea, funded by the Korean government (MSIP) (No. 2016R1A2A1A05005306).
Author Contributions
Eui Hoon Lee carried out the survey of previous studies and wrote the draft of the manuscript. Eui Hoon Lee revised the draft until the final version of the manuscript and simulated the results. Eui Hoon Lee and Joong Hoon Kim conceived the original idea of the proposed method.
Conflicts of Interest
The authors declare no conflict of interest.
References
- Cembrano, G.; Quevedo, J.; Salamero, M.; Puig, V.; Figueras, J.; Martí, J. Optimal control of urban drainage systems. A case study. Control Eng. Pract. 2004, 12, 1–9. [Google Scholar] [CrossRef]
- Schütze, M.; Campisano, A.; Colas, H.; Schilling, W.; Vanrolleghem, P.A. Real time control of urban wastewater systems—Where do we stand today? J. Hydrol. 2004, 299, 335–348. [Google Scholar] [CrossRef]
- Fuchs, L.; Beeneken, T. Development and implementation of a real-time control strategy for the sewer system of the city of Vienna. Water Sci. Technol. 2005, 52, 187–194. [Google Scholar] [PubMed]
- Pleau, M.; Colas, H.; Lavallée, P.; Pelletier, G.; Bonin, R. Global optimal real-time control of the Quebec urban drainage system. Environ. Model. Softw. 2005, 20, 401–413. [Google Scholar] [CrossRef]
- Tamoto, N.; Endo, J.; Yoshimoto, K.; Yoshida, T.; Sakakibara, T. Forecast-based Operation Method in Minimizing Flood Damage in Urban Areas. In Proceedings of the 11th International Conference on Urban Drainage, Edinburgh, Scotland, UK, 31 August–5 September 2008; p. 31. [Google Scholar]
- Beeneken, T.; Erbe, V.; Messmer, A.; Reder, C.; Rohlfing, R.; Scheer, M.; Schuetze, M.; Schumacher, B.; Weilandt, M.; Weyand, M. Real time control (rtc) of urban drainage systems—A discussion of the additional efforts compared to conventionally operated systems. Urban Water J. 2013, 10, 293–299. [Google Scholar] [CrossRef]
- Fiorelli, D.; Schutz, G.; Klepiszewski, K.; Regneri, M.; Seiffert, S. Optimised real time operation of a sewer network using a multi-goal objective function. Urban Water J. 2013, 10, 342–353. [Google Scholar] [CrossRef]
- Hsu, N.S.; Huang, C.L.; Wei, C.C. Intelligent real-time operation of a pumping station for an urban drainage system. J. Hydrol. 2013, 489, 85–97. [Google Scholar] [CrossRef]
- Lee, E.H.; Lee, Y.S.; Joo, J.G.; Jung, D.; Kim, J.H. Investigating the impact of proactive pump operation and capacity expansion on urban drainage system resilience. J. Water Resour. Plan. Manag. 2017, 143. [Google Scholar] [CrossRef]
- Lee, E.H.; Lee, Y.S.; Joo, J.G.; Jung, D.; Kim, J.H. Flood reduction in urban drainage systems: Cooperative operation of centralized and decentralized reservoirs. Water 2016, 8, 469. [Google Scholar] [CrossRef]
- Zacharof, A.I.; Butler, D.; Schütze, M.; Beck, M.B. Screening for real-time control potential of urban wastewater systems. J. Hydrol. 2004, 299, 349–362. [Google Scholar] [CrossRef]
- Galelli, S.; Goedbloed, A.; Schwanenberg, D.; van Overloop, P.J. Optimal real-time operation of multipurpose urban reservoirs: Case study in Singapore. J. Water Resour. Plan. Manag. 2012, 140, 511–523. [Google Scholar] [CrossRef]
- Raimondi, A.; Becciu, G. On pre-filling probability of flood control detention facilities. Urban Water J. 2015, 12, 344–351. [Google Scholar] [CrossRef]
- Hsu, M.H.; Chen, S.H.; Chang, T.J. Inundation simulation for urban drainage basin with storm sewer system. J. Hydrol. 2000, 234, 21–37. [Google Scholar] [CrossRef] [Green Version]
- Vanrolleghem, P.A.; Benedetti, L.; Meirlaen, J. Modelling and real-time control of the integrated urban wastewater system. Environ. Model. Softw. 2005, 20, 427–442. [Google Scholar] [CrossRef]
- Huff, F.A. Time distribution of rainfall in heavy storms. Water Resour. Res. 1967, 3, 1007–1019. [Google Scholar] [CrossRef]
- Yoon, Y.N.; Jung, J.H.; Ryu, J.H. Introduction of design flood estimation. J. Korea Water Resour. Assoc. 2013, 46, 55–68. [Google Scholar]
- Korea Precipitation Frequency Data Server. Available online: http://www.k-idf.re.kr (accessed on 20 April 2017).
- Lee, E.H.; Kim, J.H. Design and operation of decentralized reservoirs in urban drainage systems. Water 2017, 9, 246. [Google Scholar] [CrossRef]
- Lee, E.H.; Kim, J.H. Development of resilience index based on flooding damage in urban areas. Water 2017, 9, 428. [Google Scholar] [CrossRef]
- Korea Water and Wastewater Works Association. Standard on Sewer Facility; Ministry of Environment: Seoul, Korea, 2011.
- Seoul Metropolitan Government. Report on Design and Expansion of Gaebong1 Pump Station; Seoul Metropolitan Government: Seoul, Korea, 2009.
- United States Environmental Protection Agency. Storm Water Management Model User’s Manual Version 5.0; EPA: Washington, DC, USA, 2010.
Figure 1.
Flowchart of this study.

Figure 2.
Process for generating the synthetic rainfall data via the Huff distribution (third quartile, 100 mm, 90 min).
Figure 2.
Process for generating the synthetic rainfall data via the Huff distribution (third quartile, 100 mm, 90 min).
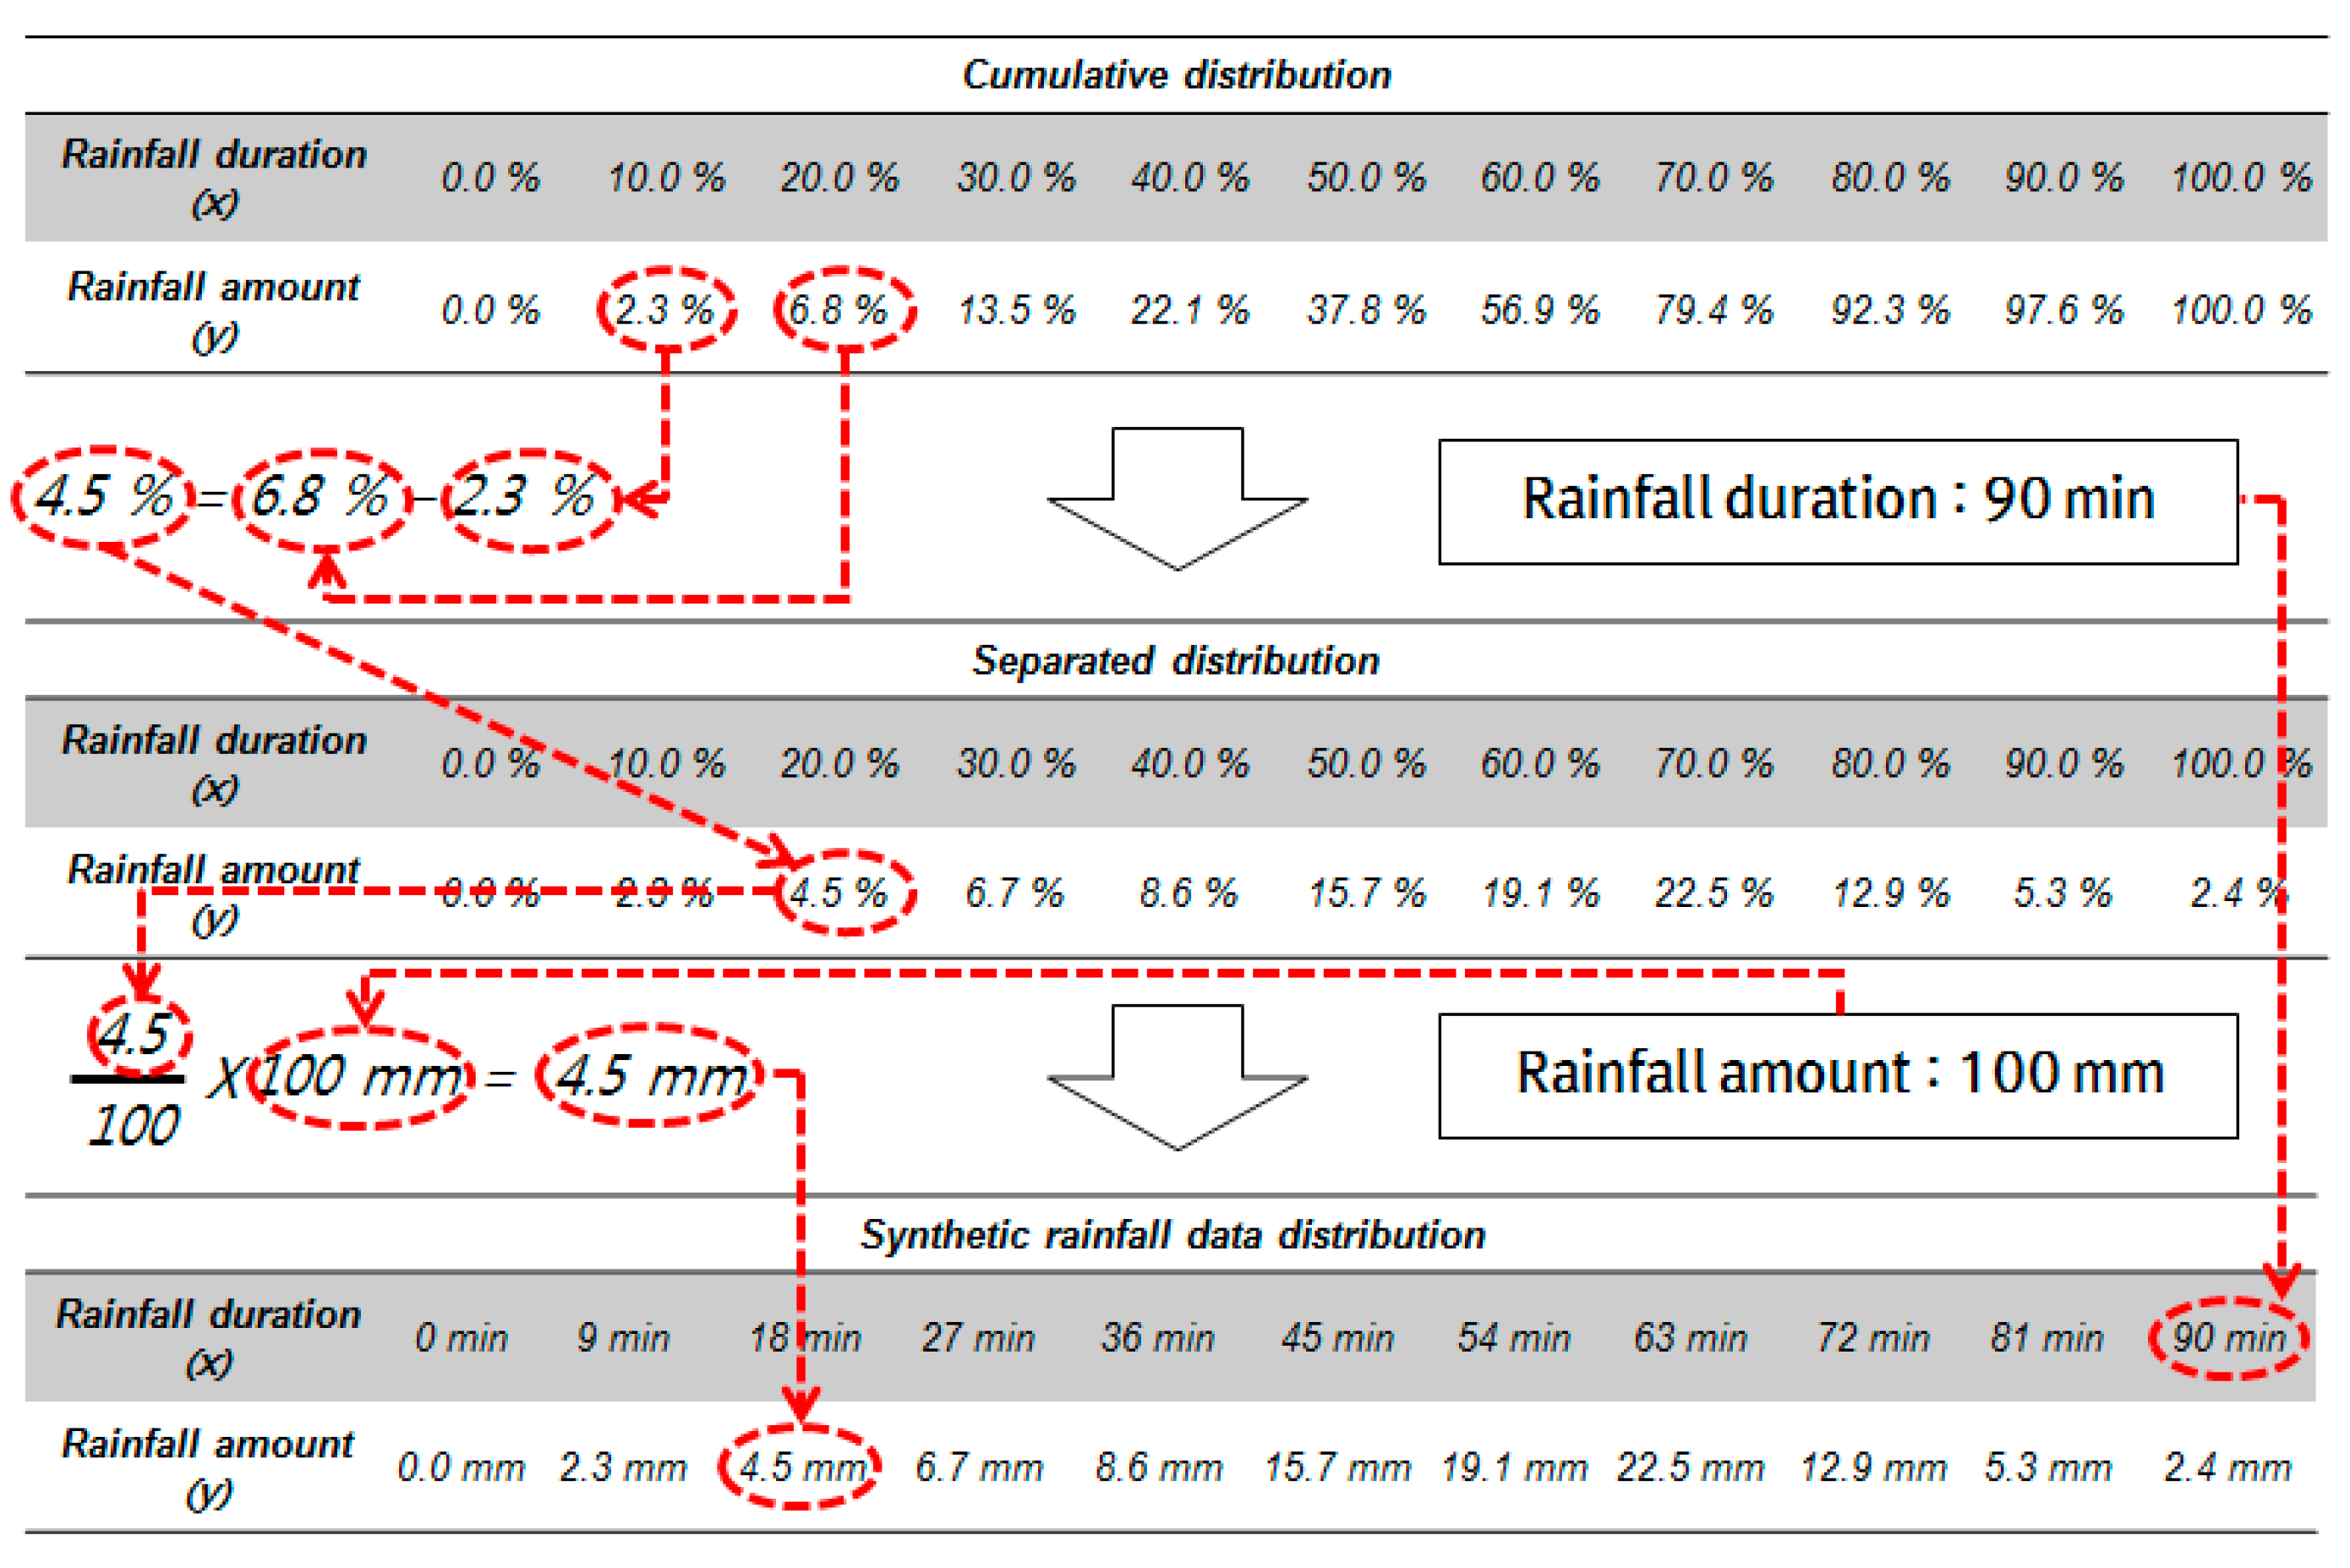
Figure 3.
Process for selecting the first and maximum flooding nodes.
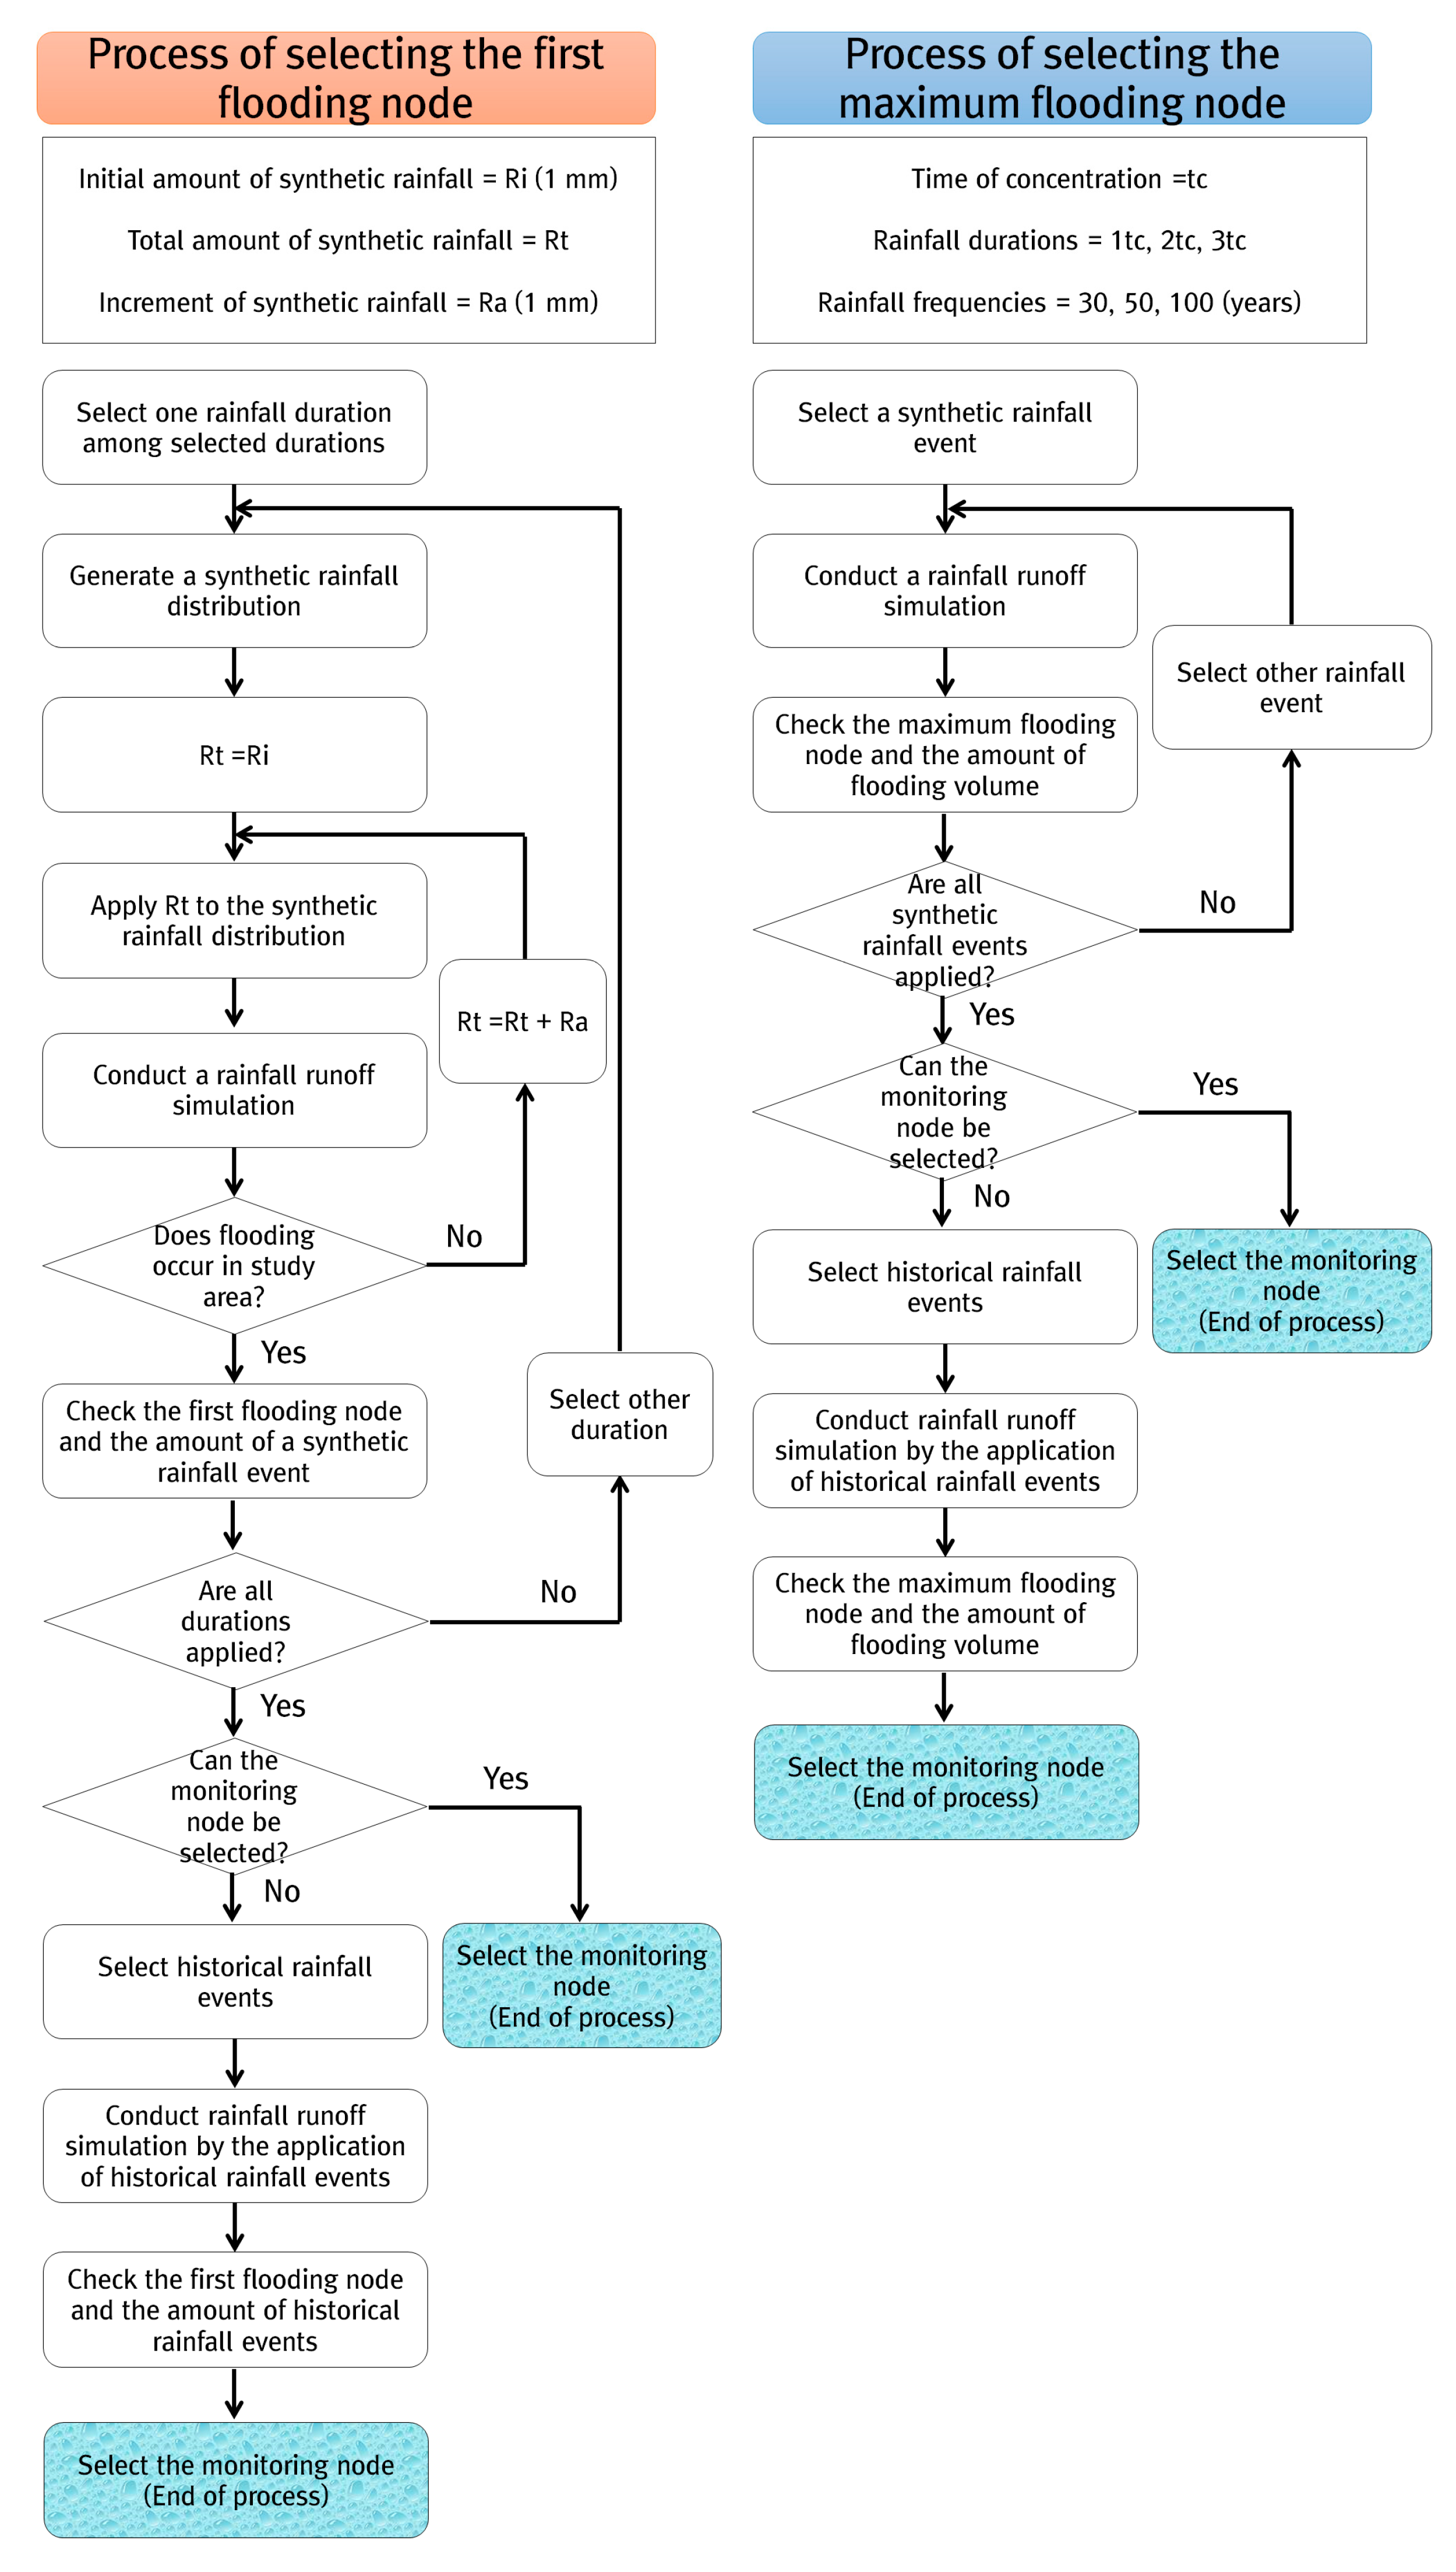
Figure 4.
Pump operation of centralized reservoirs in pump stations.

Figure 5.
Schematics of the gate operation in centralized reservoirs.

Figure 6.
Concept of system resilience.

Figure 7.
Location of the target watershed.

Figure 8.
Drainage facilities of the target watershed.
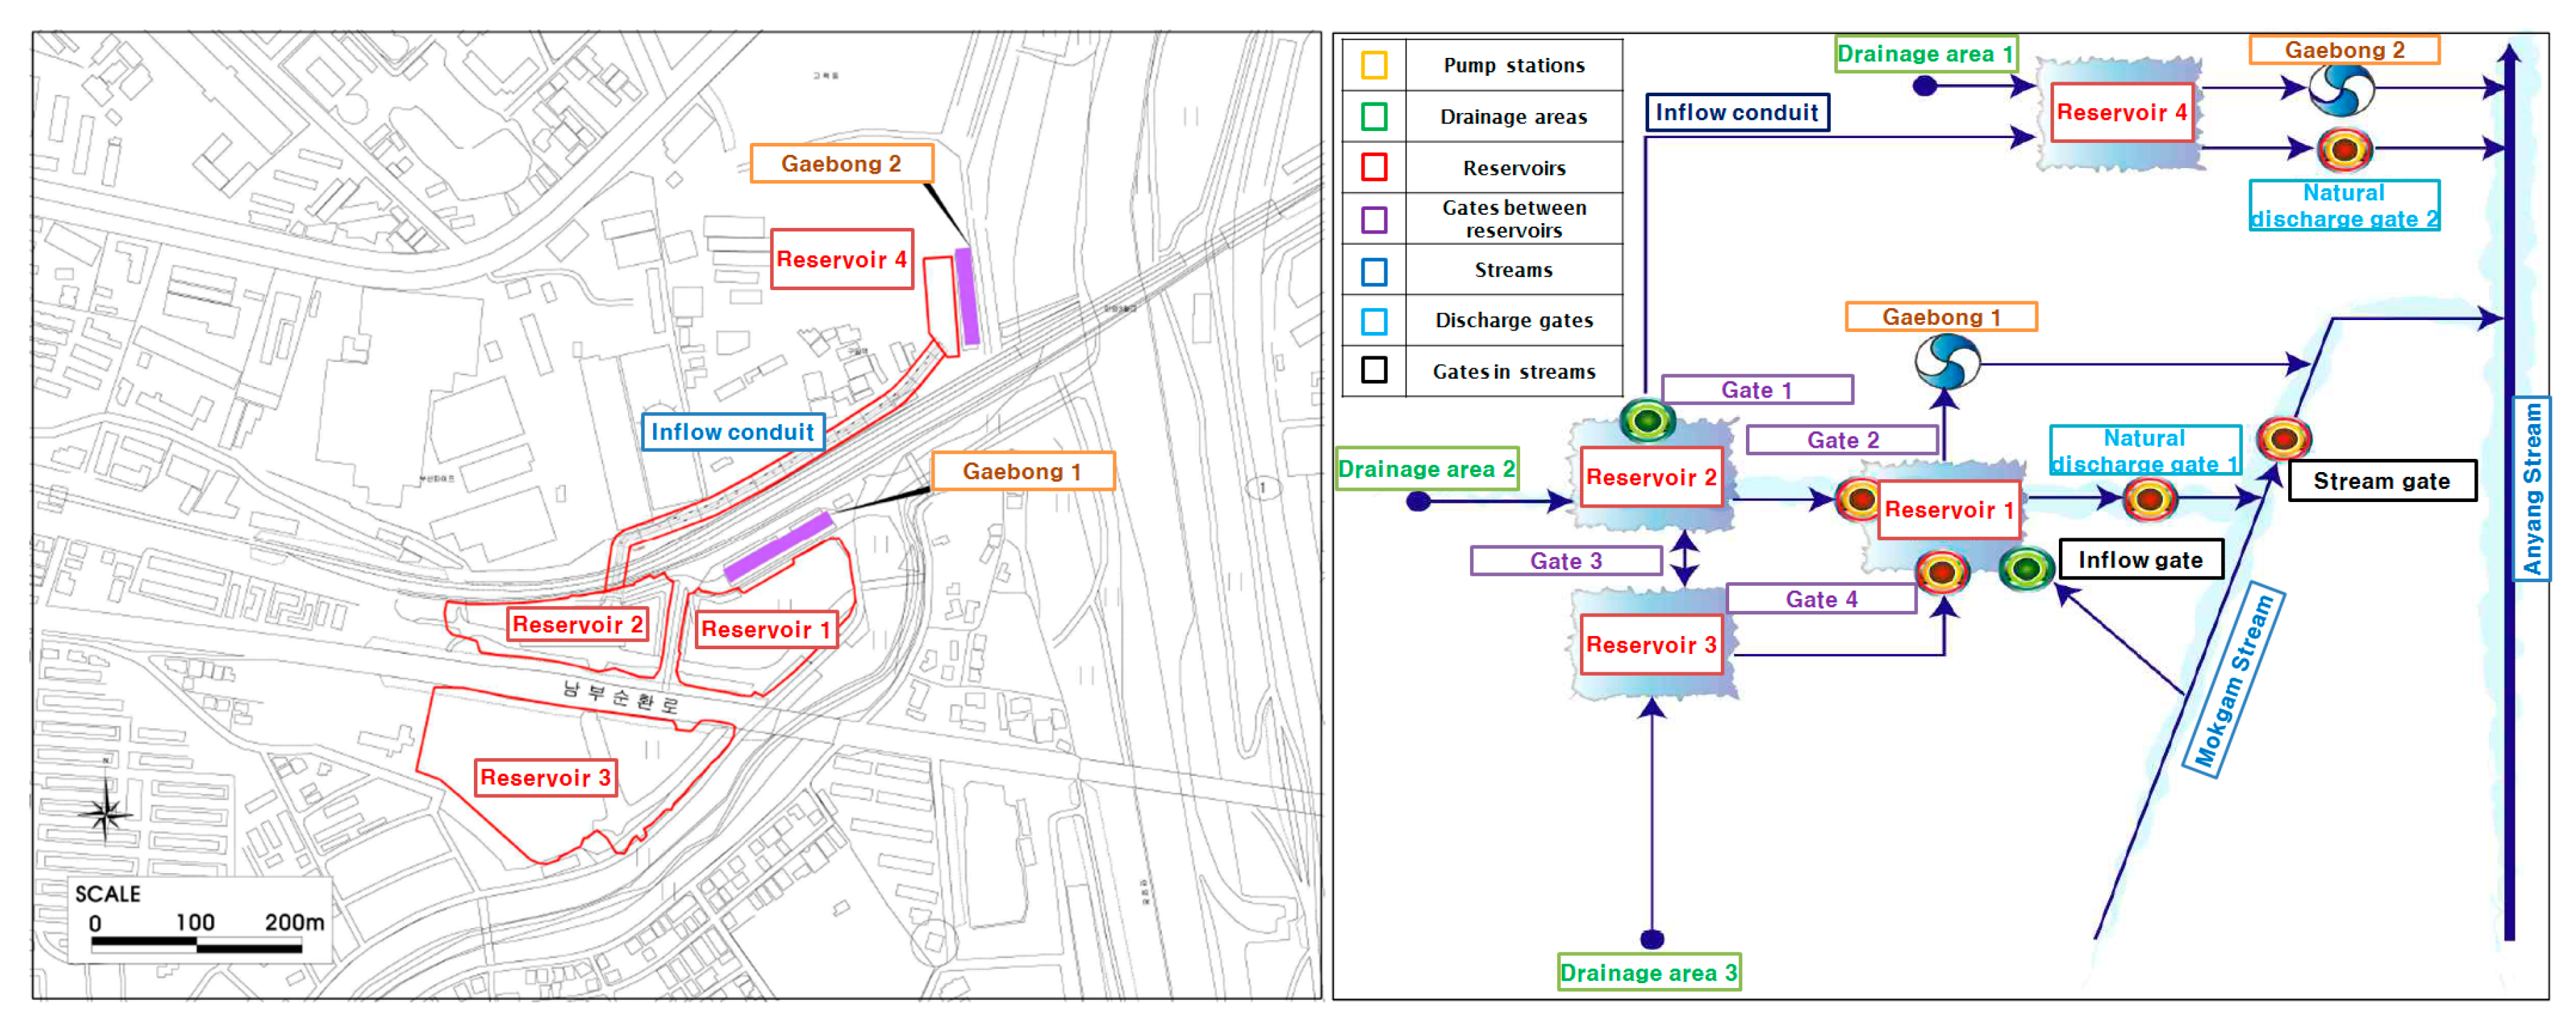
Figure 9.
Sewer network of the target watershed.

Figure 10.
Monitoring node locations in the target watershed.
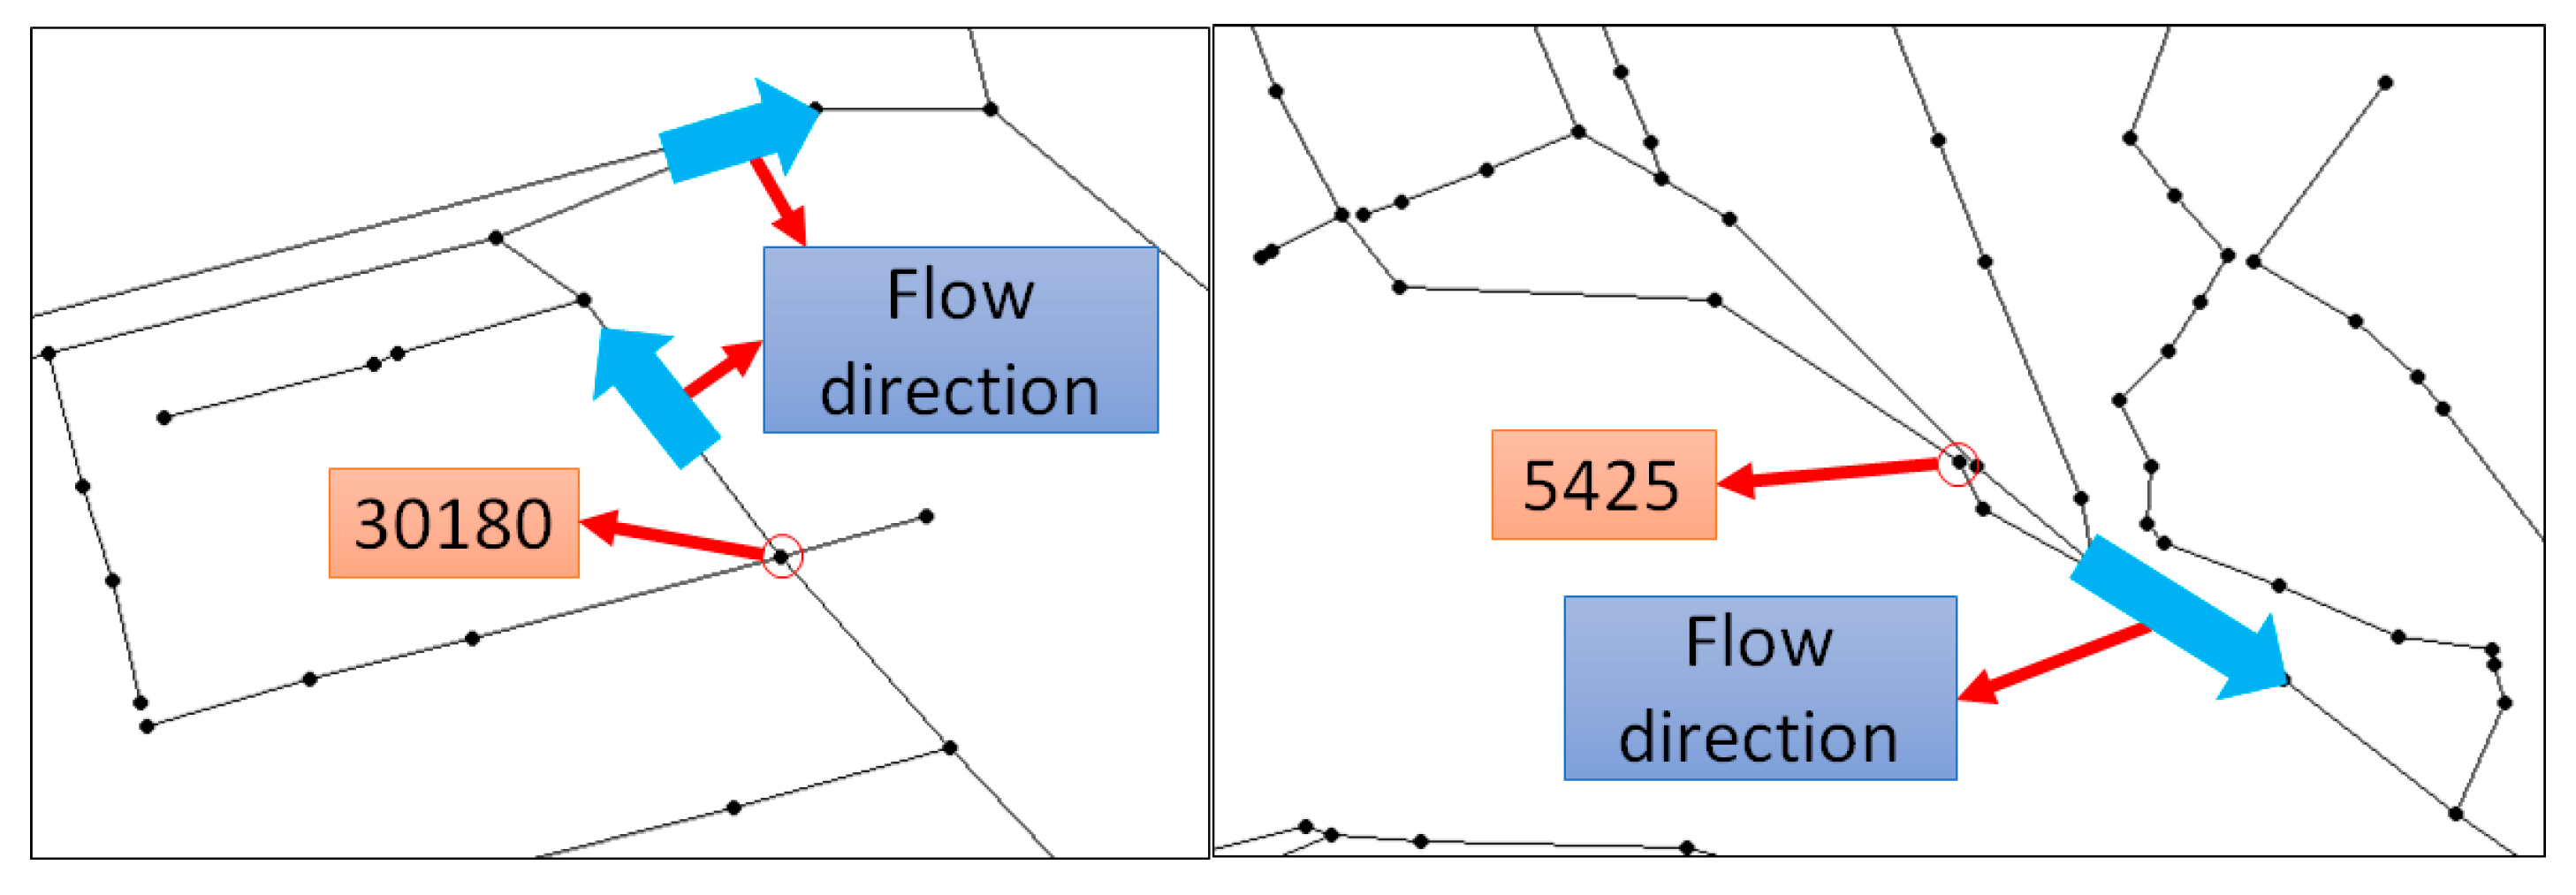
Figure 11.
Flooding volumes over time for the current and new operations in (a) 2010 and (b) 2011.

Figure 12.
Pump discharge over time for the current and new operations.

Figure 13.
System resilience for the current and new operations in (a) 2010 and (b) 2011.

Table 1.
Current and new operations of the drainage pumps in the centralized reservoirs.
| Gaebong 1 Pump Station | Gaebong 2 Pump Station | ||||||
|---|---|---|---|---|---|---|---|
| Elevation of Current Operation in Gaebong 1 (m) | Pump Discharge of Current Operation (m3/s) | Elevation of New Operation in Gaebong 1 (m) | Pump Discharge of New Operation (m3/s) | Elevation of Current Operation in Gaebong 2 (m) | Pump Discharge of Current Operation (m3/s) | Elevation of New Operation in Gaebong 2 (m) | Pump Discharge of New Operation (m3/s) |
| 5.0 | 0.00 | 5.0 | 0.00 | 3.0 | 0.00 | 3.0 | 0.00 |
| 6.5 | 7.67 | 5.5 | 7.67 | 6.0 | 5.17 | 5.0 | 5.17 |
| 6.7 | 15.34 | 5.7 | 15.34 | 6.1 | 10.34 | 5.1 | 10.34 |
| 6.9 | 23.01 | 5.9 | 23.01 | 6.2 | 15.51 | 5.2 | 15.51 |
| 7.1 | 30.68 | 6.1 | 30.68 | 6.3 | 20.68 | 5.3 | 20.68 |
| 7.3 | 38.35 | 6.3 | 38.35 | 6.4 | 28.10 | 5.4 | 28.10 |
| 7.5 | 46.02 | 6.5 | 46.02 | 6.5 | 35.52 | 5.5 | 35.52 |
| 7.8 | 53.69 | 6.8 | 53.69 | 6.6 | 42.94 | 5.6 | 42.94 |
| 8.1 | 61.36 | 7.1 | 61.36 | 6.7 | 50.36 | 5.7 | 50.36 |
| 8.4 | 73.36 | 7.4 | 73.36 | 6.8 | 57.78 | 5.8 | 57.78 |
| 8.7 | 85.36 | 7.7 | 85.36 | 6.9 | 65.20 | 5.9 | 65.20 |
| 9.0 | 97.36 | 8.0 | 97.36 | 7.0 | 72.62 | 6.0 | 72.62 |
| 9.3 | 109.36 | 8.3 | 109.36 | 7.1 | 80.04 | 6.1 | 80.04 |
| 9.6 | 121.36 | 8.6 | 121.36 | - | - | - | - |
| 9.9 | 133.36 | 8.9 | 133.36 | - | - | - | - |
| 10.2 | 145.36 | 9.2 | 145.36 | - | - | - | - |
| 10.5 | 157.36 | 9.5 | 157.36 | - | - | - | - |
Table 2.
Comparison between the current and new operations with gates.
| Inflow | Current Operation | New Operation | Comparison |
|---|---|---|---|
| Drainage area 1 | Reservoir 4 | Reservoir 4 | Same |
| Drainage area 2 | Reservoir 2 → Reservoir 4 | Reservoir 2 → Reservoir 4 | Different |
| (Depth of reservoir 4 < Depth of reservoir 1) | |||
| Reservoir 2 → Reservoir 1 | |||
| (Depth of reservoir 4 > Depth of reservoir 1) | |||
| Drainage area 3 | Reservoir 3 → Reservoir 1 | Reservoir 3 → Reservoir 2 | Different |
| (Depth of reservoir 2 < Depth of reservoir 1) | |||
| Reservoir 3 → Reservoir 1 | |||
| (Depth of reservoir 2 > Depth of reservoir 1) |
Table 3.
Information of the drainage facilities in the target watershed.
| Status | Gaebong 1 | Gaebong 2 | ||
| High water level (m) | 10.9 | 8.0 | ||
| Low water level (m) | 6.0 | 3.0 | ||
| Initial operating level (m) | 6.5 | 4.0 | ||
| Drainage pump capacity (m3/min) | 9440 | 4800 | ||
| Status | Reservoir 1 | Reservoir 2 | Reservoir 3 | Reservoir 4 |
| High water level (m) | 10.90 | 8.00 | 8.00 | 8.00 |
| Low water level (m) | 6.00 | 3.00 | 6.00 | 6.00 |
| Area (m2) | 17,920 | 17,920 | 14,590 | 28,457 |
| Effective storage capacity (m3) | 51,700 | 31,858 | 25,408 | 32,234 |
Table 4.
Results of monitoring node selection.
| Duration (min) | First Flooding Node (Rainfall Amount) | Event (Year) | Maximum Flooding Node (Flooding Volume) |
|---|---|---|---|
| 30 | 30180 (43 mm) | 2010 | 5425 (16,630 m3) |
| 60 | 30180 (48 mm) | 2011 | 5425 (3409 m3) |
| 90 | 02473 (68 mm) | - | - |
© 2017 by the authors. Licensee MDPI, Basel, Switzerland. This article is an open access article distributed under the terms and conditions of the Creative Commons Attribution (CC BY) license (http://creativecommons.org/licenses/by/4.0/).
Share and Cite
MDPI and ACS Style
Lee, E.H.; Kim, J.H. Convertible Operation Techniques for Pump Stations Sharing Centralized Reservoirs for Improving Resilience in Urban Drainage Systems. Water 2017, 9, 843. https://doi.org/10.3390/w9110843
AMA Style
Lee EH, Kim JH. Convertible Operation Techniques for Pump Stations Sharing Centralized Reservoirs for Improving Resilience in Urban Drainage Systems. Water. 2017; 9(11):843. https://doi.org/10.3390/w9110843
Chicago/Turabian StyleLee, Eui Hoon, and Joong Hoon Kim. 2017. "Convertible Operation Techniques for Pump Stations Sharing Centralized Reservoirs for Improving Resilience in Urban Drainage Systems" Water 9, no. 11: 843. https://doi.org/10.3390/w9110843
Note that from the first issue of 2016, this journal uses article numbers instead of page numbers. See further details here.