Removal of Heavy Metals from Urban Stormwater Runoff Using Bioretention Media Mix
by

Jianlong Wang
1,2,*, 
Yuanling Zhao
1,
Liqiong Yang
3,
Nannan Tu
1,
Guangpeng Xi
1 and
Xing Fang
1,4
1
Key Laboratory of Urban Stormwater System and Water Environment, Beijing University of Civil Engineering and Architecture, Ministry of Education, Beijing 100044, China
2
Beijing Advanced Innovation Center for Future Urban Design, Beijing 100044, China
3
Jiuquan Environmental Monitoring Branch, Jiuquan 735000, China
4
Department of Civil Engineering, Auburn University, Auburn, AL 33648, USA
*
Author to whom correspondence should be addressed.
Water 2017, 9(11), 854; https://doi.org/10.3390/w9110854
Submission received: 19 September 2017
/
Revised: 5 October 2017
/
Accepted: 31 October 2017
/
Published: 3 November 2017
Abstract
:Heavy metals from urban stormwater runoff are important sources of surface water pollutants. Sand, zeolite, sandy loam, and quartz-sand were separately mixed with lignin to form four bioretention media mixes for experimental study using synthetic stormwater runoff. The average removal efficiencies of four heavy metals (Cu, Zn, Cd, and Pb) by the four media mixes were all better than 97% at the optimum pH of 6.05 (ranging from 6 to 8) and the seven-day rainfall-event interval. The influence of the influent concentration and the rainfall-event interval on the removal efficiency of heavy metals by the four media mixes was not significant, but the variation of the removal efficiencies at the four-day rainfall-event interval was large. Under acidic conditions, there was a certain heavy metal dissolution in the four reactors, but the effect on the removal efficiency was minor. Heavy metals were present in the media mainly in the form of the residual fraction (>50%). The accumulation of Cu, Zn, and Cd in the surface planting-soil layer (same humus and sandy-loam mixture for all reactors) was significantly larger than the accumulation at deeper depths but not for Pb. Overall, the heavy metal removal efficiencies by the four media mixes were not significantly different, and the choice of the planting-soil layer can become the control factor of heavy metal removal.
1. Introduction
With rapid urbanization, the extent of impervious urban land has increased. The impervious surfaces created by buildings and pavement significantly alter the way water flows through watersheds, conveying additional pollutants with runoff [1]. The accumulation of suspended solids, heavy metals, hydrocarbons, and other pollutants on these surfaces has also increased [2,3]. Atmospheric pollutants and pollutants dispersed in catchments are accumulated during no-rainfall dry periods, are flushed by rainfall and runoff, and eventually enter the receiving waterbodies, causing serious pollution of the urban water environment [4,5,6,7,8]. At present, China is in a critical period of urbanization, and stormwater runoff pollution has become the second largest source of non-point pollution, second only to agricultural pollution [9]. Compared with the chemical oxygen demand (COD), nitrogen (N), phosphorus (P), and other pollutants, heavy metals in the environment are easy to accumulate and pose significant risks for human health through the food chain [10,11,12]. Although the concentrations of heavy metals in stormwater runoff from roads [13,14] and roofs [15] differ when compared with the Chinese Environmental Quality Standard for Surface Water (GB3838-2002) (Table 1) [16], the heavy metal concentrations in stormwater runoff from different surfaces could exceed the level III surface-water standards, except for Cu. Thus, heavy metals from urban stormwater runoff can be an important source of heavy metal pollution in the urban water environment.
In recent years, developed countries have used many ecological measures such as bioretention facilities, ecological tree boxes, and green roofs to control stormwater runoff pollution and have attempted to restore the hydrological conditions of urbanized areas to pre-development conditions [18,19]. Among these measures, bioretention technology can not only control water quality efficiently but also has an ecological function and positive effects on the landscape. Therefore it has been widely applied [20,21]. Bioretention systems treat stormwater via a range of physical, chemical, and biological processes. These include mechanical filtration, sedimentation, adsorption, and plant and microbial uptake [22]. Laboratory studies have shown that bioretention technology can effectively remove particulate and dissolved heavy metals from urban stormwater runoff and more than 80% of the heavy metals retained in bioretention systems [23,24,25]. Li and Davis [26] showed that the vast majority of heavy metals from urban stormwater runoff were intercepted on the surface layer of the bioretention system. Most of the particulate heavy metals were removed by interception (physical filtering), while dissolved heavy metals mainly were removed by adsorption. Bioretention systems are generally soilplant-based systems that typically consist of a filter medium, underlain by a gravel drainage layer [27]. Bioretention studies have mostly examined a single medium (sand, soil, or other material), but, due to the lack of a carbon source in a single medium, plant growth and pollutant removal were negatively affected [22]. Consequently, systematic studies are needed to determine the effect of bioretention media mix on heavy metal removal, as well as the specific form of heavy metals that are internally accumulated in bioretention media under acidic conditions since most of the soil conditions in southern China are acidic. In this study, sand, zeolite, sandy loam, and quartz-sand were separately mixed with lignin (as a carbon source) and used as bioretention media mixes to investigate the removal of four heavy metals (Cu, Zn, Cd, and Pb) in synthetic stormwater runoff, the chemical forms of heavy metals, and the effect of pH on the stability of the heavy metals accumulated in the bioretention media.
2. Experiment Design
2.1. Experimental Device
The experimental device consisted of a water tank (1 m3), a metering pump (Q = 0~1 m3·h−1), pipelines (L = 32 m) for water distribution, and four cylindrical bioretention reactors (Numbers 1, 2, 3, and 4 in Figure 1). Each column has a 20-cm planting soil layer, which is a mixture of humus and sandy loam (1:1 ratio by volume), a 60-cm media layer, and a 20-cm gravel layer (Figure 1). There is a geotextile between the media layer and the gravel layer that can prevent small media particles getting into the gravel layer. The gravel layer has a particle size of about 8 to 15 mm and a perforated drainage pipe with a pore size of 6 mm. The 60-cm media layers for columns 1, 2, 3, and 4 are sand-lignin, zeolite-lignin, sandy-loam-lignin, and quartz-sand-lignin media mixes, respectively. Each media layer has 10% of lignin by volume that is mixed well with the primary media (sand or zeolite or sandy loam or quartz-sand) to form the media mix. The inner wall of the reactor columns was roughened to prevent the flow short-circuiting along the wall. A vertical window was arranged along the column to observe the root growth of plants grown in the media. Perennial Malian (Iris ensata Thunb) was planted, which is an herbaceous and strongly drought-resistant perennial, 10 to 45 cm high and densely clustered, with fibrous roots that are dense and rich.
2.2. The Composition of Bioretention Media
The chemical composition (% by weight) of the bioretention media and planting soil in the four experimental reactors are shown in Table 2, and SiO2 is present at relatively high proportions.
2.3. Experimental and Analytical Methods
Single factor experiments were performed in this study since only one influencing factor was changed in each set of experiments and the other factors remained unchanged. Synthetic stormwater solutions were made to run all experiments using four bioretention columns (Figure 1). The source chemicals (aqueous solutions) used for the four heavy metals are listed in Table 3. For the first group of experiments, the synthetic stormwater solution was based on the mean concentrations of heavy metals (Table 3) measured from the initial flush of road runoff from a previous study [17] as the influent concentrations. For the second group of experiments, to study the impact of influent concentrations, three more synthetic stormwater solutions (Table 4) were made. For the above synthetic solutions, the pH was 6.05 (within the optimum range of pH 6 to 8). To study the impact of pH (acidic rainfall) on the removal efficiency, a fifth synthetic solution was made from the first synthetic solution (Table 3) to have a pH of 4.05 by adding HCl. All these experiments were done without alternating the plant, the top soil layer, and the bioretention media mix in each column after the reactor was originally constructed; therefore, each reactor mimicked the natural conditions of a bioretention facility to receive stormwater runoff from many rainfall events without any maintenance. The interval between any two experimental runs is typically six or more days (except one set of experimental runs); therefore, each reactor maintained high performance when removing heavy metals, as will be approved in Section 3.2. Each experimental run lasted a short period, and the plant absorption of heavy metal can be discarded. It is also assumed that the gravel layer did not intercept any dissolved heavy metal. Therefore, the removal of heavy metal in the column experiments was primarily through the adsorption and interception of heavy metals by the planting soil and the media mix layers.
To measure the concentrations of heavy metals in the effluent, a water sample was collected for each column (Figure 1) from the column-bottom drainage pipe (Figure 1) after the outflow became relatively steady, and then effluent samples were filtered through a 0.45 μm hydrophilic membrane prior to the analysis of the heavy metals to remove suspended solids. Each water sample collected was roughly 100 mL. The filtrate was stored in polyvinyl chloride bottles and kept in a refrigerator at 4 °C for subsequent analysis. The methods, testing equipment, and detection limits (μg·L−1) used for the analysis are given in Table 3.
The morphology of the heavy metals in the bioretention media was analyzed by the Tessier sequential chemical extraction method [28], and its steps are given in Figure 2. Soil samples were collected every 20 cm from the surface of the bioretention media to a depth of 80 cm (sample ports 1 to 5 in Figure 1) for analysis. After being naturally air-dried, the samples were ground, passed through 100 mesh standard sieves, and stored in sealed bags. The samples were accurately weighed to 0.1 mg and packed in 100 mL centrifuge tubes for fractional extraction. The centrifuge was operated at a room temperature of 25 °C at 12,000× g for 30 min to achieve the effective separation of solid and liquid. The supernatant liquor was removed by syringe and stored at a room temperature of 25 °C and a pH of 6.05 for heavy metal analysis. The precipitate was washed with 8 mL of deionized water and centrifuged again for 20 min. Five metal fractions were determined (Figure 2): exchangeable (F1), bound to carbonate (F2), bound to iron and manganese oxides (F3), bound to organic matter (F4), and residual (F5).
The reagents used in all experiments and chemical analyses, including CuCl2·2H2O, Pb(NO3)2, CdCl2·2.5H2O, and ZnSO4·7H2O, for making synthetic stormwater runoff. MgCl2, NaAc, NH2OH·HCl, H2O2, HCl, and HNO3 are high-purity guaranteed reagents for the Tessier sequential chemical extraction method. The chemical solution for analysis was tested with a Hitachi Z-2010 Polarization Zeeman Atomic Absorption Spectrometer (AAS in Table 3). A sample from every single factor experiment was detected three times to get the means as outcomes.
3. Experimental Results and Discussion
3.1. Permeability Coefficients of the Fourreactors
The permeability coefficient, also known as the hydraulic conductivity, is a measure of cross-sectional average velocity with which an incompressible fluid flows in unit time through a porous medium when a unit pressure difference is maintained. The permeability coefficient can be determined by either the constant or variable head methods (http://www.geotechdata.info/geotest/), with the variable head method being generally applicable when the permeability coefficient is expected to be less than 1.0 × 10⁻⁵ m·s−1 [29]. After a preliminary analysis of the permeability coefficients for the four media mixes, the constant head method was used to measure the permeability coefficient for three media mixes (sand, zeolite, and quartz-sand mixed with lignin), and the variable head method was used to measure the permeability coefficient for the sandy-loam media mix at 30 and 60 min. When the variable head method was adopted, a head pipe for adjusting the head was used, with a minimum scale of 1.0 mm and the diameter of no more than 1 cm. Water was injected into the reactor, and the head was maintained to a given level (generally no more than 2 m). To make water flow through the reactor, the outlet should be open. When the flow at the outlet started, the starting time and the initial head height were measured, the change of the head and time was measured at the predetermined time interval, and the temperature of the water from the outlet was recorded. When the constant head method was adopted, flow through porous media was produced under a constant head. Based on the recorded data for a certain period of time and the volume of water, the permeability coefficient was calculated. The average permeability coefficients determined for the Number 1 (sand), 2 (zeolite), 3 (sandy loam), and 4 (quartz-sand) reactors were 2.1 × 10⁻⁴, 3.4 × 10⁻⁴, 5.0 × 10⁻⁶, and 2.7 × 10⁻⁴ m·s−1, respectively. These are the composite permeability of the planting soil and media mix since the permeabilities of well-sorted sand, zeolite, and quartz sand are much larger than the measured permeability coefficients. When using the bioretention technology to deal with stormwater for reuse, there is a requirement for the permeability coefficient to be not less than 1.0 × 10⁻⁵ m·s−1 [30]. The permeability coefficients of sand, zeolite, and quartz-sand media mix have all met the requirement. Even though the permeability coefficient of the sandy-loam media mix did not meet the requirement, there are still some practices and applications in actual projects using it (reduce the cost in conjunction with the use of flood-resistant plants).
3.2. Removal Efficiency of Heavy Metals via Bioretention Media Mix
The removal of heavy metals by bioretention media occurred mainly through interception by the surface media, physical adsorption onto the media, and plant absorption [31]. Tone et al. used bioretention to treat snowmelt from three different urban roads in Norway and found that the removal efficiency of heavy metals in snowmelt was: 25.0% to 90.4% for Cu, 81.2% to 97.5% for Zn, 93.5% to 99.4% for Pb, and 86.4% to 94.1% for Cd. Davis et al. used a pilot scale bioretention system to purify synthetic rainwater and obtained a mean Cu removal efficiency of more than 99.0% [20]. The removal efficiency was determined as the concentration difference of influent and effluent divided by the influent concentration.
Using the synthetic stormwater runoff (Table 3), the experiments were repeated four times (11 May 2014, 18 May 2014, 24 May 2014, and 31 May 2014; the rainfall-event interval was seven days), the outflow concentrations of heavy metals were determined using one water sample per reactor, and the information on the removal efficiencies is summarized in Table 5. The mean removal efficiencies (99.1% to 99.5%) of Cu through the sand and zeolite media mixes are slightly larger than the 97.1% to 97.6% removal through the sandy loam and quartz-sand media mixes. The lowest removal efficiency for Cu was 92.3% for quartz-sand media, and the highest removal efficiency was 100.0% (Table 5). The Tukey’s test indicates that the mean removal efficiencies of Cu by four reactors are not significantly different at the 95% confidence level (α = 0.05).
The mean removal efficiencies (98.4% to 100.0%) of Zn and Cd by the four media were basically the same (p-value > α = 0.05). The quartz-sand media mix had the highest removal efficiency (100.0%) for Zn and Cd (not detectable in outflow). The zeolite media mix had a variable removal efficiency for Zn (95.1% to 100.0%). The sand media mix had a variable removal efficiency got Cd (94.1% to 100.0%, Table 5). The effluent concentration of Pb was always low, and the removal efficiency of Pb was close to 100.0% throughout all the experiments. These high removal efficiencies could be partially explained by the pH 6.05 of the runoff used in the experiments, which was fell within the optimal pH range (6 to 8) for metal adsorption to occur. In general, these four media mixes are suitable for use as bioretention media materials to effectively remove heavy metals.
These heavy metals are typically transferred from a liquid phase to a solid phase and attached or adsorbed to the bioretention media mix. The bioretention media mix should be replaced usually after more than 10 years of use for better pollutants removal performance. Since the media mix is adsorbed with heavy metals and other pollutants, it should be followed with subsequent processing such as desorption.
Lignin was used as a carbon source for the growth of plants and denitrification in the bioretention media mix. Total organic carbon (TOC) concentrations in the effluents of four reactors were measured after a series of experiments were completed. The influent TOC was 1.08 mg·L−1, and the effluent TOC concentrations were 24.5 ± 2.4 (average ± standard deviation from five measurements), 9.1 ± 0.2, 6.3 ± 0.4, and 13.5 ± 3.4 mg·L−1 for the sand, zeolite, sandy-loam, and quartz-sand bioretention reactors, respectively. The Tukey’s test indicates that the effluent TOC concentrations in four reactors were larger than the influent TOC since lignin is biodegradable. The effluent TOC concentrations in the sand and quartz-sand reactors were larger than and different from the TOC concentration in the other two reactors (p-value ≪ 0.05), and the effluent TOC concentrations in the zeolite and sandy-loam media mix was not significantly different.
3.3. Factors Affecting Heavy Metal Removal
3.3.1. Influent Heavy Metal Concentration
The effect of influent concentrations on the heavy metal removal efficiency was investigated using three synthetic runoff solutions for the four heavy metals (Table 4). These three levels cover a relatively wide range of the heavy metal concentrations observed in road runoff (Table 1). The influent concentrations of heavy metals increased from the level I to III.
The removal efficiencies (%) of the four heavy metals by the four bioretention media mixes under three influent concentrations are given in Appendix A (grouped by heavy metal first). The data in Appendix A can be directly used for ANOVA analysis to compare the removal efficiency of each heavy metal under three influent concentrations and using the four reactors. The influent metal concentrations (the first influencing factor) had little effect on removal efficiency for Cu, Pb, Cd, and Zn through four reactors (numbers 1 to 4) with four bioretention media mixes (the second influencing factor) since two-factor ANOVA analysis (without replication) shows all p-values greater than α = 0.05. For Zn’s removal efficiency, a p-value of 0.07 for four reactors is slightly larger than 0.05, but a further Tukey’s test indicates that the mean removal efficiencies of the four reactors were not significantly different, although reactor 1 (sand) had a lower mean removal efficiency of 85% under three levels of influent concentrations in comparison to the mean efficiencies of the other three reactors (98.4% to 99.9%). There is the same conclusion (no significant difference) for Pb removal efficiency under three levels of influent concentration; one removal efficiency was 88.2%.
The removal efficiencies of four heavy metals in the four reactors with different bioretention media mixes is shown in Figure 3: (a) for reactor 1; (b) for reactor 2; (c) for reactor 3; and (d) for reactor 4. The removal efficiencies of Cu, Pb, and Cd all exceeded 97.7% through reactor 1 (sand-lignin media). The inflow concentration had a relatively larger influence on the removal efficiency of Zn through reactor 1 than it did for the other metals examined. The removal efficiency of Zn decreased with increasing inflow concentration, with a minimum removal efficiency of 75.4% when Zn’s influent concentration was 3.5 mg·L−1. One of the reasons for the decrease may be that less favorable adsorption sites become available as the metal concentrations in the aqueous solution increase. The mechanism for the removal of heavy metals in the sand medium is non-specific electrostatic adsorption to negatively charged functional group sites on the sand particle surfaces or a small amount of organic content present in it [32].
In reactor 2 (zeolite), the removal efficiency of Cu, Zn, and Cd all exceeded 97.7%. The removal efficiency of Pb in reactor 2 was the most variable, and the minimum removal efficiency was 88.2%. The processes responsible for the removal of metals in the zeolite reactor are ion exchange, precipitation, and electrostatic adsorption of metal cations to negatively charged sites on the zeolite particle surfaces [32]. The negative charge is balanced by the exchangeable cations (Na, K, or Ca) and these cations are exchangeable with other cations in an aqueous solution such as Pb, Cu, Cd, and Zn [33,34,35]. The removal efficiencies of the four heavy metals in reactors 3 and 4 had similar trends, i.e., regardless of inflow heavy metal concentration, the removal efficiencies of the four metals all exceeded 93.8%. These trends suggest that, while the media were already performing well at the low concentrations, they were still able to maintain high removal performance for the high concentration experiments [36]. In summary, the inflow heavy metal concentration had a relatively minor (not significant) influence on the removal efficiency of the four bioretention media mixes in study. Similar results were reported from other studies on bioretention media mixes [20,24].
3.3.2. Interval between Rainfall Events
The frequency of rainfall, rainfall depth, rainfall duration, and inter-event dry period change substantially over time. As a result, bioretention facilities experience different durations of wet and dry periods. After statistically analyzing the 10-year (2003 to 2013) rainfall data in Beijing, three representative inter-event dry periods (four, seven, and 15 days) were used to analyze the effect of the interval between rainfall events on heavy metal removal (Figure 4). The first set of experiments in the four reactors was performed on 24 October, and the second set was done on 8 November 2014, with 15 days of dry period. The third and fourth sets of experiments were performed on 12 and 19 November with four and seven days of dry period, respectively. Figure 4 shows that the removal efficiencies ranged from 49.3% (Cu in the sand reactor) to 100.0%, with an average of 95.5% (a standard deviation of 11.4%). The results could be more meaningful if the experiments for different rainfall-event intervals were repeated two or three times; then two-factor ANOVA with replication could be performed.
Figure 4 shows the removal efficiencies as a function of the rainfall-event interval (x axis) and by four reactors for each heavy metal; therefore, two-factor ANOVA analysis (without replication) and then Tukey’s test can be done directly. The removal efficiencies for each of the four heavy metals were not significantly different for the three rainfall-event intervals at the 95% confidence interval since all p-values were greater than α = 0.05. When the rainfall-event interval was seven or 15 days, the average removal efficiencies of all four heavy metals by the four reactors were greater than 95.8%. When the rainfall-event interval was four days, the average removal efficiencies by the four reactors for Cu, Zn, Cd, and Pb were 83.5%, 87.6%, 98.7%, and 88.2%, respectively. Figure 4a shows that the removal efficiency of Cu increased with the rainfall-event interval by the sand reactor only, but it was not significantly different for other three reactors. The removal efficiencies of Zn and Pb in the sand reactor were also low at the four-day rainfall-event interval.
The data shown in Figure 4 can be regrouped by the rainfall-event intervals and then by performing ANOVA statistical analysis. When the rainfall-event interval was four days, the removal efficiencies for the four heavy metals by the sand reactor were significantly different from those by the other three reactors (average ≥97.3%). The average removal efficiency of the four heavy metals by the sand reactor was only 64.6%, even though the removal efficiency for Cd was 98.5%. When the rainfall-event interval was seven or 15 days, the removal efficiencies of the four heavy metals by the four reactors were not significantly different since all p-values were greater than α = 0.05.
Lau et al. also found that, when the dry period was extended to six weeks, there was only a slight effect on heavy metal removal [37]. Hatt et al. reported that the dry and wet periods have no significant influence on heavy metal removal [38]. Henderson et al. [39] and Hatt et al. [38] found that, without plants, soil-based filter media may act as a source, rather than a sink, of some pollutants. The uptake of heavy metals by the plant was not a major factor so it was omitted in the present study.
3.3.3. pH
The removal of heavy metals by bioretention media occurs mainly through physical interception and adsorption. In China, especially in the south, rain is typically acidic, with a pH between 4.0 and 5.6, which will leach heavy metals from the soil. The stability of heavy metal accumulation in the bioretention media under acidic conditions was investigated by adjusting the influent pH (addition of HCl to the influent) while retaining the same influent concentrations for heavy metals. The experiment was first conducted at a pH of 6.05 (the base stormwater solution in Table 4) by collecting four effluent samples in 40 min. Then the inflow was stopped for all reactors; HCl was added into the water tank (Figure 1) to make the influent have a pH of 4.05, and the experiment was repeated to collect another four effluent samples. Figure 5 (pH 4.05) shows the effluent heavy metal concentrations from the four reactors and at four different times. Compared with the effluent concentrations of heavy metals at pH 6.05 for influent, all effluent concentrations of Zn, Cu, and Cd at pH 4.05 increased to varying degrees, possibly due to the high concentration of H+ in the influent. The percent of increase of Cu, Zn, and Cd concentrations for the four reactors and four different times from influent with a pH of 6.05 to 4.05 were calculated and ranged from 3.3% to 787.2%. The average increase was 67.9%, and the maximum percent increase occurred for Zn in reactor 1 (sand) when the effluent concentration of Zn at pH 6.05 was very small (4.7 μg·L−1), but this was 41.7 μg·L−1 at pH 4.05. Using the influent concentrations (Table 3), the removal efficiencies for Zn, Cu, and Cd were computed at pH 6.05 and 4.05; then the decrease of removal efficiencies was computed and ranged from −7.8% to 0.0%, with an average decrease of −1.6%. Therefore, acidic rainfall could increase the effluent concentration of Zn, Cu, and Cd, but its effect on removal efficiency was minor.
The H+ ions have a competitive effect on the adsorption of heavy metal ions, and therefore heavy metals adsorbed on the media will be desorbed or dissolved under acidic conditions. The maximum dissolved concentrations of Zn, Cu, and Cd were 550.2, 9.6, and 5.6 μg·L−1, respectively. The leaching of Zn and Cd was similar and exhibited an M shaped trend in all four reactors. The release of Zn was faster in reactors 1 and 2 than in the others, and the leaching concentration increased with time in reactor 4. The release of Cd was faster in reactor 2 than in the others, and the leached concentration of both Cd and Zn increased with time in reactor 4, indicating the poor stability of Zn and Cd retention. The dissolved concentration of Cu first increased and then decreased with time in reactors 1, 3, and 4.
The dissolved concentrations of Pb in all reactors were below the detection limit, which indicated that, once adsorbed, Pb in all media was relatively stable. Overall, the quantity of dissolved heavy metals in the effluent was far less than the heavy metal concentrations typically found in urban stormwater runoff, which indicates that the majority of heavy metals existed in particulate form and were either intercepted by the bioretention media surface or were removed by adsorption of the planting soil. Through a series of bioretention experiments, Davis et al. showed that pH had little influence on the removal efficiency of heavy metals, which is the same as the conclusion of this study because, compared with pH, the medium type and structure of the bioretention media had a relatively greater effect [23].
3.4. Accumulation of Heavy Metals
A large number of studies have shown that bioretention can remove heavy metals in storm runoff through precipitation, filtration, adsorption, and biological conversion and effectively improve the quality of stormwater. However, the impact of the long-term accumulation of heavy metals in the surrounding environment has not yet been studied, and the mechanisms by which heavy metals are removed by bioretention media have not yet been fully understood. By comparing the accumulation of heavy metals within different bioretention media, and analyzing the relationship between the concentrations of heavy metals within different bioretention media and in stormwater runoff, a reference for the environmental risk assessment of reusing bioretention water can be provided. The optimum results of the accumulation of heavy metals should be obtained to operate the bioretention facility over a long period of time. The first experiment using the four reactors (Figure 1) was done on 3 September; about 30 rainfall events or experiments (including some trial runs) were conducted before 4 December 2013, when the soil samples were collected for the accumulation analysis. Even the experimental period was not very long (thee months); the accumulation of heavy metals was determined and still provided us with some insightful information.
To determine the accumulation of heavy metals in bioretention media, soil samples were taken at five depths from four reactors (1 to 4 in Figure 1) after all the above experiments had been conducted. The soil samples were weighed and ranged from 50 to 100 mg. After measuring the amount of the four heavy metals and making the unit conversion, the accumulation of heavy metals at each of the five depths of each column was presented by the unit of mg·kg−1, i.e., mg of metal per kg of soil sample or bioretention media (Figure 6). The accumulation at the first depth is actually in the plant soil (a mixture of humus and sandy loam) not in the bioretention media (Figure 1), and the accumulation at the second depth is at the interface between the plant soil and the bioretention media.
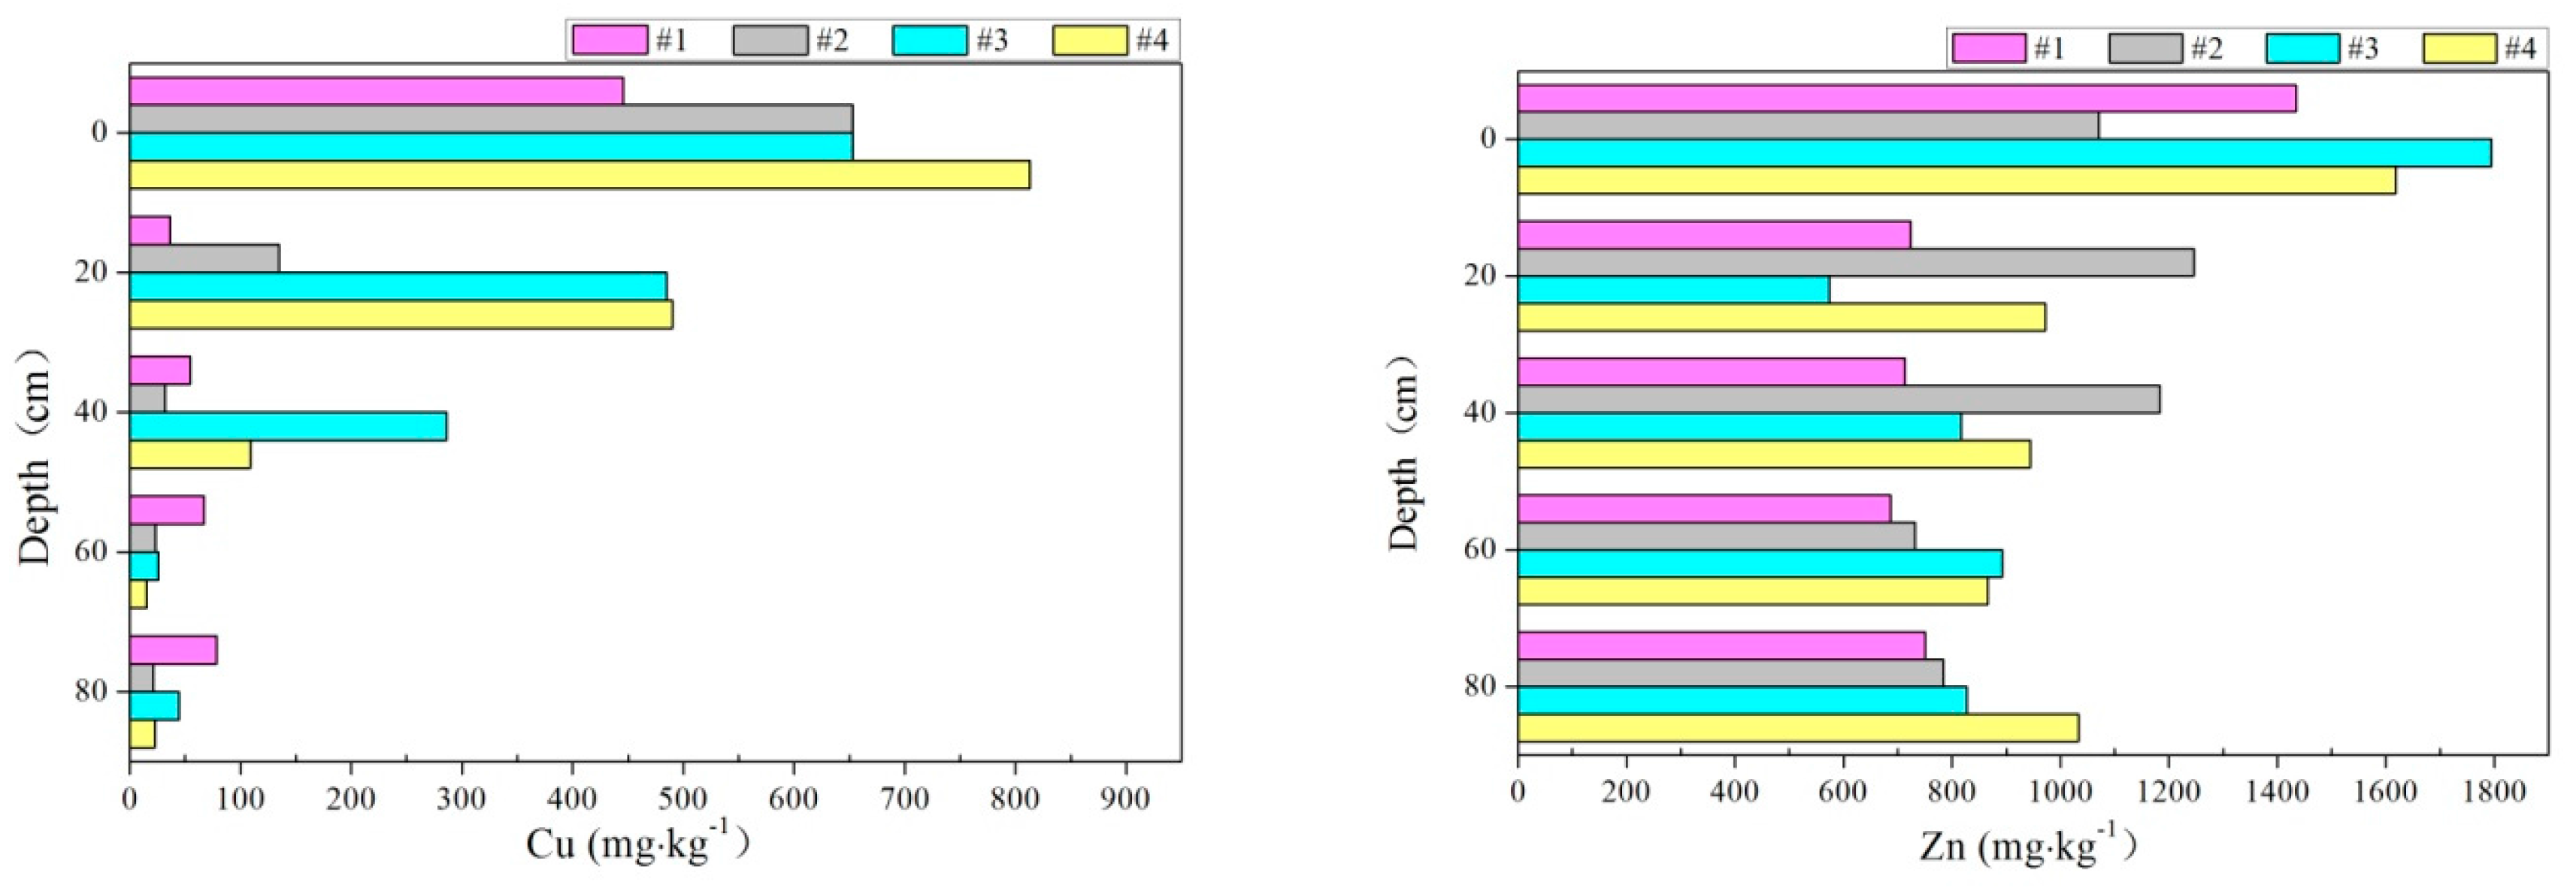
The accumulation of heavy metals in the whole reactor in mg·kg−1 was calculated as the sum of the accumulation at each of the five depths (mg·kg−1) divided by five (since total soil sample weight is increased), which can be considered a mean accumulation over the depth. The total accumulated Cu in the four bioretention media, namely, 1 (sand), 2 (zeolite), 3 (sandy loam), and 4 (quartz sand), are 136.3, 172.9, 298.7, and 290.0 mg·kg−1, respectively, with large standard deviations ranging from 173.5 to 351.0 mg·kg−1 (92% to 158% of averages). The total accumulated Cu in the sandy loam and quartz-sand reactors were almost the same, but there was about 2.1 times the amount of Cu in the sand reactor, which was slightly lower than the Cu in the zeolite reactor. The ANOVA analysis shows that the accumulated Cu in the surface soil (0 to 1 cm) in the four reactors had an average of 641.0 mg·kg−1 (ranging 445.3 to 812.7 mg·kg−1) and was significantly larger than Cu at other depths (p-value ≪ 0.05), which ranged from 41.6 to 286.4 mg·kg−1 (averages). Especially, accumulated Cu at depths of 40, 60, and 80 cm in the four bioretention media mixes was even lower because the average Cu was less than 125 mg·kg−1.
The total accumulation of Zn in the whole column was 862.1, 1003.0, 980.9, and 1086.4 mg·kg−1 in the sand, zeolite, sandy loam, and quartz-sand medium mixes, respectively, with smaller standard deviations, ranging from 233.3 to 470.6 mg·kg−1 (23% to 48% of averages). In comparison to accumulated Cu distribution along with depth, accumulated Zn seems more uniformly distributed with depth. The ANOVA analysis shows that accumulated Zn in the surface soil in the four reactors is, on average, 1479.1 mg·kg−1 (ranging from 1070.0 to 1794.2 mg·kg−1) and is still considered to be significantly larger than Zn at other depths (p-value of 0.003 < 0.05), which ranged from 794.3 to 914.3 mg·kg−1 (averages). For the zeolite reactor, the accumulated Zn at 20 and 40 cm was slightly larger than Zn in the surface soil, which was different from the other three reactors.
The total accumulations of Cd in the whole column were 304.3, 215.0, 275.1, and 202.1 mg·kg−1 in the sand, zeolite, sandy loam, and quartz-sand composite medium reactors, respectively, with standard deviations ranging from 66.2 to 223.3 mg·kg−1 (23% to 111% of averages). The ANOVA analysis shows that the accumulated Cd in the surface soil in the four reactors was, on average, 445.6 mg·kg−1 (ranging from 316.3 to 587.2 mg·kg−1) and was still considered to be significantly larger than Cd at 20, 60, and 80 cm (p-value of 0.02 < 0.05), which ranged from 170.5 to 202.8 mg·kg−1 (averages), while Cd at 40 cm depth (average 236.7 mg·kg−1) was not different from Cd at other depths. For the sand and zeolite reactors (1 and 2), accumulated Cd was more uniformly distributed along five depths (Figure 6), with a small percent of standard deviation from their averages (23% to 31%).
The accumulation of Pb in the whole column was 367.1, 643.2, 538.8, and 566.8 mg·kg−1 in the sand, zeolite, sandy-loam, and quartz-sand composite medium reactors, respectively, with standard deviations ranging from 110.7 to 320.0 mg·kg−1 (24% to 56% of averages). The ANOVA analysis shows that accumulated Pb at five depths in four reactors were not different from each other (p-value of 0.26 ≫ 0.05), which ranged from 357.7 to 702.5 mg·kg−1 (averages), while it had a different distribution (more uniform with depth) in comparison to Cu, Zn, and Cd.
The heavy metals generally accumulated inside four media reactors, especially in the upper layers (0 to 20 cm). The average accumulated heavy metals in the surface soil (0 to 1 cm) of the four reactors were 641.0 (Cu), 1479.1 (Zn), 445.6 (Cd), and 702.5 (Pb) mg·kg−1, respectively. They were all larger than those at the four other depths, indicating that heavy metals were intercepted by the plant soil of the bioretention reactors. Since the metals are enriched mainly in the upper layer of the reactor, maintenance of the biofiltration system by removing the upper layer will have a smaller impact on the system. At the same time, the surface accumulation of heavy metals could be washed off and transported by runoff to other places.
The main mechanism for the enrichment of four metals on different media is by ion-exchange and complexation with the negatively charged surface sites of the media [40]. The average accumulation of Cu, Zn, Cd, and Pb over five depths in four reactors was 224.5, 983.1, 249.1, and 529.0 mg·kg−1, respectively. The ANOVA two-parameter analysis indicates that the accumulation of the four heavy metals among the four reactors was not significantly different (p-value of 0.22 > 0.05). This is because, although the four reactors had different media mixes (20 to 80 cm), the plant soil layer (hummus plus sandy-loam) was the same and also accumulated 48.0% to 82.6% heavy metals. The percentages of the accumulation of heavy metals in the planting soil (0 to 20 cm) over the total accumulation (five depths) for the four reactors were calculated and were 82.6% for Cu, 48.0% for Zn, 52.1% for Cd, and 48.5% for Pb, which supports the above statement and the results from the ANOVA analysis. Therefore, the choice of the planting-soil layer can become the control factor of heavy metal removal. In this study, the hummus and sandy-loam mix was used as the planting soil layer (20 cm) when perennial Malian was planted. In different geographic and climate regions, different plants and planting soils maybe adopted for the bioretention facilities.
The ANOVA analysis indicates that the accumulation of heavy metals could be significantly different (p-value ≪ 0.05). The Tukey’s test shows that the accumulation of Cu and Cd were not different from each other, but the accumulation of Zn or Pb was different from the three other heavy metals. Of the four metals, the lowest accumulation in the four reactors was Cu and Cd, the highest was Zn, and the middle was Pb. Lower levels of Cu accumulation could be explained by the smaller ionic radius of Cu, which resulted in a poorer affinity for metal ions on active adsorption sites [41]. Lower levels of Cd accumulation could be explained by the combination of dissolved organic matters. The combination would increase the mobility of Cd by promoting the dissolution of heavy metals and thus inhibit adsorption. According to Chen and Chen [42], the maximum adsorption capacity of Cd could decrease by up to 94% due to the existence of dissolved organic matter.
3.5. Speciation of Heavy Metals
Bioretention media can effectively improve the quality of stormwater runoff water. The results of the experiments showed that the heavy metal removal efficiencies of bioretention media were high. However, heavy metals within a medium usually exist in different chemical forms. Different forms of heavy metals have different biological toxicities. The energy states of the different chemical forms of heavy metals are different, and, therefore, the mobility of different heavy metals determines the effective bioaccumulation of heavy metals and the extent of their harm to the environment. When heavy metals in stormwater runoff enter the bioretention media layer, their morphological transformation and variation with time and depth will determine the occurrence of specific heavy metals and influence their bioavailability in different media.
To quantify the speciation of each heavy metal, soil samples were taken at five depths (ports) from each reactor (Figure 1) and weighed. After measuring the fractions of the four heavy metals (Figure 2) in the soil samples and making a unit conversion, the adsorption of heavy metals to the four bioretention media in different fractions (F1 to F5) were presented using the unit of mg·kg−1. The ‘total adsorption of a fraction of a heavy metal’ in the whole reactor was calculated and was equal to the mean adsorption of the fraction over the five depths when units of mg·kg−1 were used, and the percent of the total adsorption of each fraction (F1 to F5) in the total accumulation (all fractions) was also calculated.
3.5.1. Cu
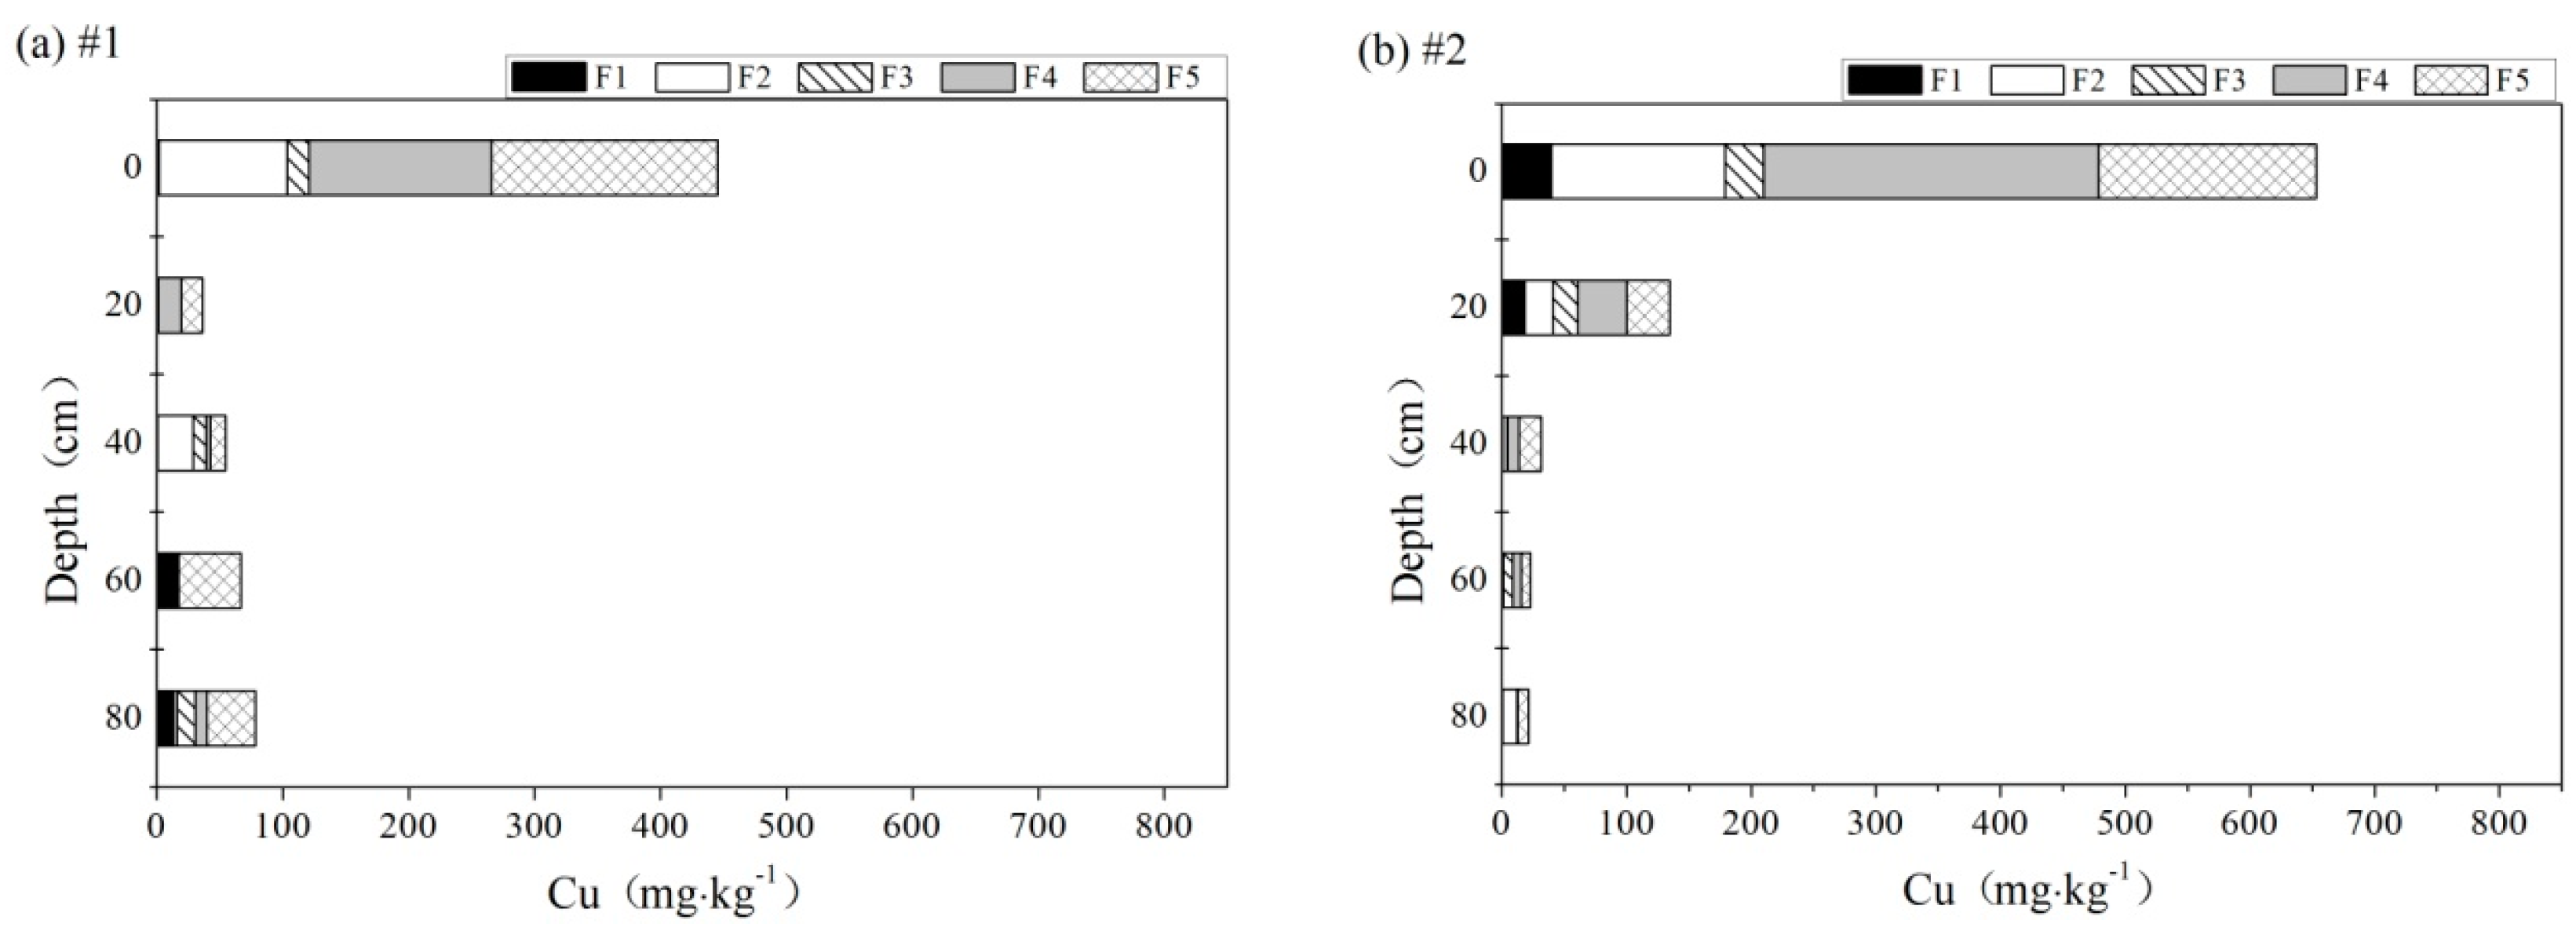
The adsorption of Cu in different chemical forms at the five depths of the four reactors are shown in Figure 7 as an example, and the total adsorption of Cu in the whole column calculated from the data at five depths is given in Figure 8 by the reactor. In the sand media mix, the total adsorption of Cu was 136.3 mg·kg−1; the residual F5 of 59.3 mg·kg−1 accounted for 43.5% of the total Cu adsorption, F4 for 25.9%, F2 for 19.9%, F3 for 6.2%, and F1 for 4.6% (Figure 8). The exchangeable Cu fraction F1 at depths of 60 cm and 80 cm is about 14 mg·kg−1 and much larger than F1, which had values of 0.5 to 2 mg·kg−1 at 0 to 40 cm in the sand reactor. The Cu adsorption near the surface is larger than at other depths, as discussed in Section 3.4.
In the zeolite media mix (reactor 2), F4 accounted for 37.6% of the total Cu adsorption, F5 for 28.1%, F2 for 20.5%, F3 for 6.9%, and F1 for 6.9% (Figure 8). The Cu adsorption in all five fractions decreased gradually with depth (Figure 7b).
In the sandy loam media mix, F5 accounted for 51.4% of the total Cu adsorption, F4 for 19.5%, F2 for 17.7%, F3 for 10.0%, and F1 for 1.3%. In the quartz-sand media mix, F5 accounted for 54.0% of the total Cu adsorption, F3 for 15.4%, F2 for 15.2%, F4 for 13.1%, and F1 for 2.3%. The Cu adsorption in F5 first increased and then decreased, while the Cu adsorption in the other fractions gradually decreased over time.
The total Cu adsorption in the sand, zeolite, sandy-loam, and quartz-sand media mixes was 136.3, 172.9, 298.7, and 290.0 mg·kg−1, respectively. The two-factor ANOVA analysis (without replication) gave a p-value of 0.17 (>0.05), which indicates that the total Cu adsorption in the four reactors was not significantly different at the 95% confidence level. The adsorptions of Cu in F5 in the sand, zeolite, sandy-loam, and quartz-sand media mixes were 59.2, 48.5, 153.6, and 156.5 mg·kg−1, respectively. The Tukey’s test after the two-factor ANOVA analysis shows that F5 (residual of Cu, average 104.5 mg·kg−1 for four columns) is significantly larger than the first three types of absorptions (F1 to F3, with an average of 7.2 to 39.9 mg·kg−1). Mahmoud et al. studied the speciation of heavy metals in sediments and found that the residual phase of Cu was dominant [43]. A large proportion was also found in F4 that could be released if the sediment was exposed to reducing conditions [44]. When the percentages of F1 to F5 over the total adsorption were calculated for each reactor, Tukey’s test (95% confidence level) also shows that the average percent and the adsorption of F5 in the four reactors (44.2% or 104.5 mg·kg−1) are significantly different from the four other fractions (F1 to F4), and F4 (average 24.0% or 42.4 mg·kg−1) is also different from F1 (the lowest average 3.8% or 7.2 mg·kg−1).
3.5.2. Zn
The different forms of Zn were dispersed along the depth of the bioretention media in the four reactors. The residual F5 had the highest Zn fraction (Figure 9), and the values were 564.3, 781.3, 558.2, and 695.9 mg·kg−1 in the sand, zeolite, sandy-loam, and quartz media mixes, respectively. In the sand media mix, Zn was mainly present in F5 at 65.5%, followed by F2 at 12.2%, F3 at 11.7%, F1 at 9.0%, and F4 at 1.7%. The adsorption of Zn in F5 increased with depth in the media, reaching a value of 613.2 mg·kg−1, while the Zn adsorption in the other fractions decreased with depth gradually. In the zeolite media mix, Zn was mainly present in F5 at 77.9%, and other fractions ranged from 7.6% (F2) to 1.3% (F4). In the sandy-loam media mix, Zn was mainly present in F5 at 56.9%, and other fractions ranged from 16.0% (F2) to 2.8% (F4). In the quartz-sand media mix, F5 accounted for 64.1% of the total Zn adsorption, and other fractions ranged from 13.8% (F1) to 1.4% (F4) (Figure 9).
The mean Zn adsorption by the fraction in the sand, zeolite, sandy-loam, and quartz-sand media mixes was 172.4, 200.6, 196.2, and 217.3 mg·kg−1, respectively. The two-factor ANOVA analysis (without replication) gave a p-value of 0.68 (≫0.05), which indicates that the Zn adsorption by the fraction in the four reactors is not significantly different at the 95% confidence level. The Tukey’s test after the two-factor ANOVA analysis shows that F5 (residual of Zn, average 66.1% or 649.9 mg·kg−1 in the four reactors) is significantly larger than the other four fractions of adsorption (average 1.8% to 11.6% or 17.5% to 113.8 mg·kg−1), with a p-value of 1.8 × 10⁻⁸ (≪0.05). The Zn adsorptions in F2 and F3 were relatively high (average 11.3% or 110.2 mg·kg−1), indicating that the adsorption of heavy metal ions is relatively strong and not easy to release [40]. Mo et al. also showed that most Zn in soil is present in F5 [45].
3.5.3. Cd
The different forms of Cd were dispersed at different depths in the bioretention media in the four reactors. The residual F5 had the highest Cd fractions in the four bioretention media (Figure 10). The mean adsorption of Cd in F5 in the sand, zeolite, sandy-loam, and quartz media mixes was 267.5, 199.1, 212.1, and 168.1 mg·kg−1, respectively.
In the sand media mix, Cd was mainly present in F5 at 87.9%, and other fractions ranged from 9.2% (F1) to 0.1% (F4). The residual Cd (F5) was 186.6 mg·kg−1 at the surface and 355.7 mg·kg−1 at 60 cm. In the zeolite media mix, Cd was mainly present in F5 at 92.6%, and the other fractions were very small and ranged from 3.1% (F1) to 0.1% (F4). In the sandy-loam media mix, Cd was mainly present in F5 at 77.1%, and the other fractions ranged from 14.0% (F1) to 0.2% (F4). In the quartz-sand media mix, F5 accounted for 83.2% of the total Cd adsorption, and the other fractions ranged from 12.9% (F1) to 0.1% (F4).
The mean Cd adsorption by the fraction in the sand, zeolite, sandy-loam, and quartz-sand media mixes was 60.9, 43.0, 55.0, and 40.4 mg·kg−1, respectively. The two-factor ANOVA analysis (without replication) gave a p-value of 0.32 (≫0.05), which indicates that the Cd adsorption by the fraction in the four reactors is not significantly different at the 95% confidence level. The Tukey’s test after the two-factor ANOVA analysis shows that F5 (residual of Cd, average 85.2% or 211.7 mg·kg−1 in the four reactors) is significantly larger than the other four fractions of adsorption (average 0.1% to 9.8% or 0.2 to 24.8 mg·kg−1) with a p-value of 7.4 × 10⁻⁹ (≪0.05).
Wang et al. studied the effect of soluble inorganic salts on the distribution and transformation of Cd and the bioavailability of Cd. The results showed that soluble Cd was present in the residual fraction after entering the soil [46]. It can also be seen from Figure 10 that the majority of Cd was present in the residual fraction in different media, indicating that Cd was stable and persistent in all bioretention media and was not easily absorbed by plants. Except for F5, the amount of Cd in F1 was on average 9.8% or 24.8 mg·kg−1, indicating that Cd could be relatively easily released into the water with changing the environmental conditions, posing certain risks to aquatic biota because only small amounts would be mobilized if environmental conditions changed [47].
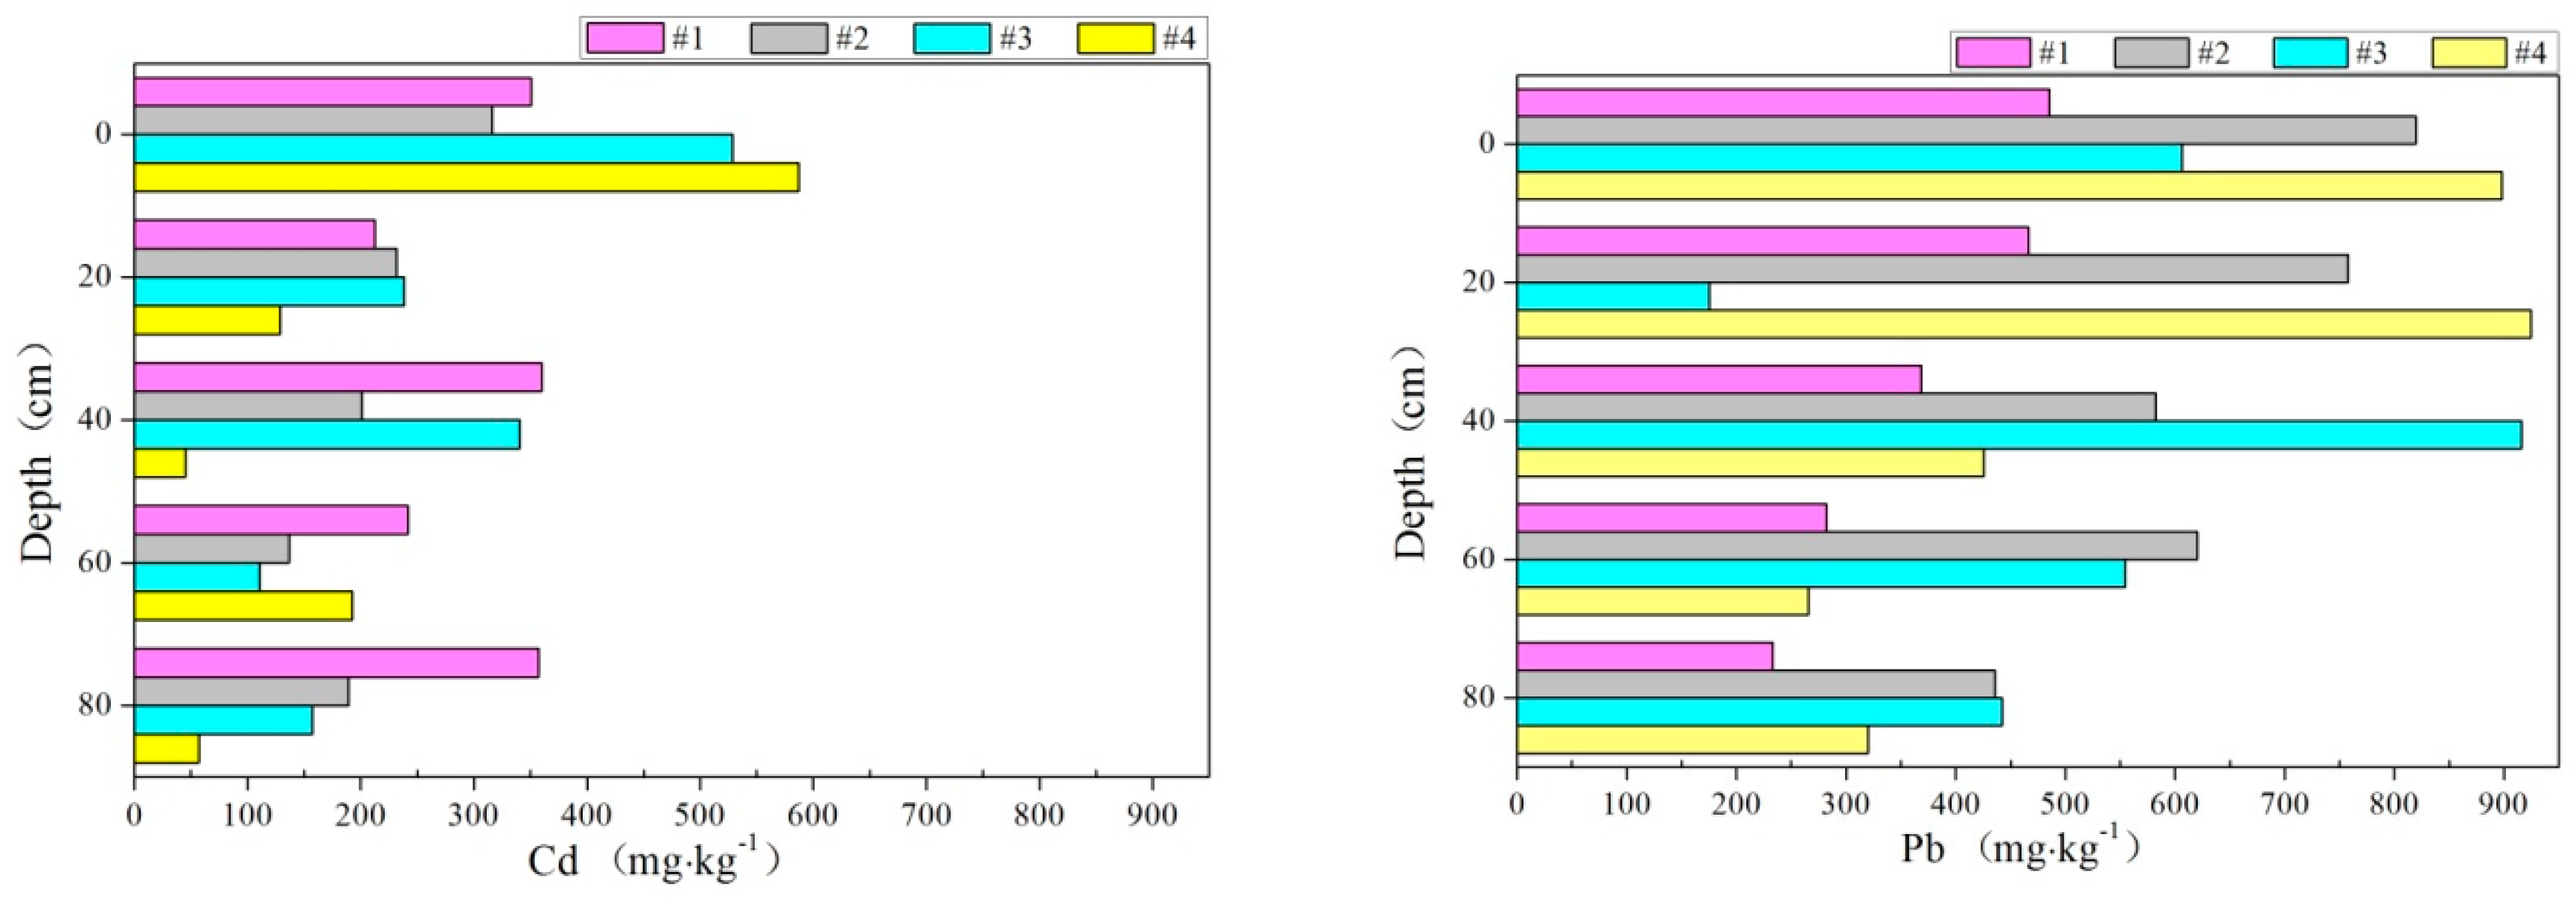
3.5.4. Pb
For the different forms of Pb absorptions, the residual F5 had the highest Pb fraction in the four bioretention media (Figure 11). The adsorptions of Pb in F5 in the sand, zeolite, sandy-loam, and quartz media mixes were 258.5, 510.8, 414.3, and 416.6 mg·kg−1, respectively. Wei et al. investigated the transformation and speciation of typical heavy metals in a soil aquifer and found that the heavy metals they studied were preferentially partitioned into the residual fraction, which accounted for as much as 82.4% of the total Pb content [48], and, in this study, the adsorption of Pb in F5 was on average 75.1% in the four reactors. In the sand media mix, F5 accounted for 70.4% of the total Pb adsorption, and the other fractions ranged from 14.6% (F3) to 2.4% (F1). In the zeolite media mix, Pb was mainly present in F5 at 79.4%, and the other fractions were less than 8%. In the sandy-loam media mix, F5 accounted for 76.9% of the total Pb adsorption, and the other fractions ranged from 11.9% (F3) to 1.5% (F1). In the quartz media mix, F5 accounted for 73.5% of the total Pb adsorption, and the other fractions ranged from 12.4% (F3) to 2.4% (F1).
The mean Pb adsorption by the fraction in the sand, zeolite, sandy-loam, and quartz-sand media mixes was 73.4, 128.6, 107.8, and 113.4 mg·kg−1, respectively. The two-factor ANOVA analysis (without replication) gave a p-value of 0.34 (≫0.05) that indicates that the Pb adsorption by the fraction in four reactors is not significantly different at the 95% confidence level. The Tukey’s test after the two-factor ANOVA analysis shows that F5 (residual of Pb, average 75.1% or 400.1 mg·kg−1 in the four reactors) is significantly larger than the other four fractions of adsorption (average of 2.6% to 11.3% or 13.7 to 56.9 mg·kg−1) with a p-value of 2.3 × 10⁻⁷ (≪0.05). The fraction of Pb in F3 was, on average, 11.3%, indicating that Pb was relatively stable in the environment, which is consistent with the outcome of the former analysis of the influence of pH.
4. Summary and Conclusions
The four bioretention media mixes, sand, zeolite, sandy loam, and quartz-sand, that were separately mixed with lignin were investigated experimentally using cylindrical reactors, including 20 cm of the plant soil layer (a mixture of humus and sandy loam) and 60 cm of the media. These four media mixes were all well capable of removing four heavy metals (Cu, Zn, Cd, and Pb) from urban runoff at the optimum pH of 6.05 (between 6 and 8), during the seven-day rainfall-event interval when the removal efficiencies ranged from 92.3% to 100.0%. The average removal rate of the four heavy metals from synthetic stormwater runoff exceeded 97.0% (standard deviations ranging from 0.0% ro 3.3%) in all four media reactors. The removal efficiency of Pb by all four media was nearly 100%. The removal efficiency of Zn and Cd exceeded 99% in the quartz-sand reactor, whereas Cu removal was slightly lower.
Within the concentration ranges expected for urban runoff, the influent heavy metal concentration had a relatively small effect on heavy metal removal (not significantly different since all p-values were greater than 0.05), although the sand reactor had a lower mean removal efficiency of 85% under three levels of influent concentrations in comparison to the mean efficiencies of the other three reactors (98.4% to 99.9%). The removal efficiencies of the four heavy metals were not significantly different for the three rainfall-event intervals at the 95% confidence interval. When the rainfall-event interval was four days, the removal efficiencies for the four heavy metals by the sand reactor (average of 64.6% removal) were significantly different from those by the other three reactors (average ≥97.3%). The removal efficiency of Cu increased with the rainfall-event interval by the sand reactor only.
The acidic rainfall (pH 4.05) could increase the effluent concentration of Zn, Cu, and Cd, but its effect on removal efficiency was minor. The dissolved concentrations of Pb in all reactors were below the detection limit, which indicated that, once adsorbed, it stays inside the media. Overall, the heavy metal removal efficiencies by the four media mixes were not significantly different with the changes of influent concentration (Table 4), pH, and rainfall-event interval (≥ four days), which was supported by the ANOVA statistical analyses and the Tukey’s tests. This is because the removal of heavy metals by the bioretention facility was primarily due to the adsorption and interception of the planting soil (20 cm) and media mix layers (60 cm). The same humus and sandy loam mixture was used for the planting-soil layer for all reactors, and there was a strong tendency for Cu, Zn, and Cd to accumulate in the surface planting-soil layer (0 to 20 cm); i.e., the surface accumulation was significantly higher than the accumulation at deeper depths. Therefore, the choice of the planting-soil layer can become the control factor of heavy metal removal. In different geographic and climatic regions, different plants and planting soils may be adopted for the bioretention facilities, and the same media mix could result in different performance in the removal of heavy metal. Since it is easier and more economical to replace planting soils and plants, the planting soils that have somewhat less permeability than the media mix could be the optimum design for bioretention facilities in order to intercept more heavy metals in the planting soil layer. Future studies should use different planting soil layers with different plants to test the removal efficiency of heavy metals. Considering the cost, permeability, and stable high performance of the removal of heavy metals, quartz-sand-lignin media mix is recommended based on this study’s results.
Heavy metals within the bioretention media were present mainly in the residual fraction (F5). Except for the residual fraction, the relatively large proportions in F1 to F4 are different for the four heavy metals: Cu was present in F4 in the bound to organic matter fraction, Zn was present in F2 and F3 in the bound to carbonate and bound to iron and manganese oxides fractions, Cd was present in F1 in the exchangeable fraction, and Pb was present in F3 in the bound to iron and manganese oxides fraction.
The removal efficiency of heavy metals in the present study was experimentally studied by varying a single factor at each time. Generally, in full-scale operational conditions, there are multiple factors simultaneously affecting the performance of bioretention facilities. Thus, for further research, focus may be put on the accumulation and transport of heavy metals under the influence of multiple factors, combined with actual practical applications.
Acknowledgments
We gratefully acknowledge the support from the Beijing social science fund (15JGB052), the Beijing municipal science and technology project (D161100005916004), and the Beijing outstanding talent project for excellent youth team (2015000026833T0000).
Author Contributions
Jianlong Wang supervised the entire study and designed the experiment. Liqiong Yang and Yuanling Zhao performed the experiments. Nannan Tu and Guangpeng Xi prepared the first version of the manuscript. Yuanling Zhao revised and edited the paper. Xing Fang revised the paper, conducted statistical analysis, and worked closely with Yuanling Zhao to improve the paper.
Conflicts of Interest
The authors declare no conflicts of interest.
Appendix A

Table A1.
Measured influent and effluent concentrations of heavy metals and calculated removal efficiencies (%).
Table A1.
Measured influent and effluent concentrations of heavy metals and calculated removal efficiencies (%).
| Heavy Metal (Units) | Reactor (Media Mix) | Influent Concentrations | Effluent Concentrations | Removal Efficiency |
|---|---|---|---|---|
| Cu (μg·L−1) | No.1 (sand) | 303.6 | 0.1 | 100.0% |
| 710.0 | 7.9 | 98.9% | ||
| 1116.4 | 26.4 | 97.7% | ||
| No.2 (zeolite) | 303.6 | 5.4 | 98.2% | |
| 710.0 | 7.4 | 99.0 | ||
| 1116.4 | 14.7 | 98.7 | ||
| No.3 (sandy loam) | 303.6 | 0.0 | 100.0% | |
| 710.0 | 3.2 | 99.6% | ||
| 1116.4 | 7.0 | 99.4% | ||
| No.4 (quartz-sand) | 303.6 | 0.0 | 100.0% | |
| 710.0 | 5.2 | 99.3% | ||
| 1116.4 | 7.6 | 99.3% | ||
| Pb (μg·L−1) | No.1 (sand) | 138.9 | 0.1 | 99.9% |
| 216.6 | 0.5 | 99.8% | ||
| 327.1 | 6.3 | 98.1% | ||
| No.2 (zeolite) | 138.9 | 0.1 | 99.9% | |
| 216.6 | 25.6 | 88.2% | ||
| 327.1 | 1.0 | 99.7% | ||
| No.3 (sandy loam) | 138.9 | 0.1 | 99.9% | |
| 216.6 | 13.4 | 93.8% | ||
| 327.1 | 0.0 | 100.0% | ||
| No.4 (quartz-sand) | 138.9 | 1.8 | 98.3% | |
| 216.6 | 12.3 | 99.3% | ||
| 327.1 | 1.0 | 99.7% | ||
| Cd (μg·L−1) | No.1 (sand) | 557.8 | 2.2 | 99.6% |
| 771.5 | 9.0 | 98.8% | ||
| 1017.2 | 14.8 | 98.5% | ||
| No.2 (zeolite) | 557.8 | 9.8 | 97.7% | |
| 771.5 | 5.3 | 99.3% | ||
| 1017.2 | 10.8 | 98.9% | ||
| No.3 (sandy loam) | 557.8 | 12.9 | 97.7% | |
| 771.5 | 3.3 | 99.6% | ||
| 1017.2 | 7.9% | 99.2% | ||
| No.4 (quartz-sand) | 557.8 | 9.8 | 98.3% | |
| 771.5 | 5.3 | 99.3% | ||
| 1017.2 | 6.0 | 99.4% | ||
| Zn (μg·L−1) | No.1 (sand) | 1808.8 | 30.7 | 98.3% |
| 2457.7 | 462.1 | 81.2% | ||
| 3461.8 | 851.3 | 75.4% | ||
| No.2 (zeolite) | 1808.8 | 69.0 | 96.2% | |
| 2457.7 | 16.7 | 99.3% | ||
| 3461.8 | 7.1 | 99.8% | ||
| No.3 (sandy loam) | 1808.8 | 18.9 | 99.0% | |
| 2457.7 | 3.7 | 99.8% | ||
| 3461.8 | 0.2 | 100% | ||
| No.4 (quartz-sand) | 1808.8 | 0.7 | 100.0% | |
| 2457.7 | 6.9 | 99.7% | ||
| 3461.8 | 0.3 | 100.0% |
References
- Christina, M.C.; Hession, W.C.; Donna, M.R. Watershed imperviousness impacts on stream channel ondition in southeastern pennsylvania. J. Am. Water Resour. Assoc. 2006, 42, 941–956. [Google Scholar]
- Liu, J.; Sample, D.; Bell, C.; Guan, Y. Review and research needs of bioretention used for the treatment of urban stormwater. Water 2014, 6, 1069–1099. [Google Scholar] [CrossRef]
- Davis, B.; Birch, G. Comparison of heavy metal loads in stormwater runoff from major and minor urban roads using pollutant yield rating curves. Environ. Pollut. 2010, 158, 2541–2545. [Google Scholar] [CrossRef] [PubMed]
- Wang, J.; Zhang, P.; Yang, L.; Huang, T. Cadmium removal from urban stormwater runoff via bioretention technology and effluent risk assessment for discharge to surface water. J. Contam. Hydrol. 2016, 185–186, 42–50. [Google Scholar] [CrossRef] [PubMed]
- Li, L.Q.; Yin, C.Q.; He, Q.C.; Kong, L.L. Contribution of pollution load of storm runoff in urban areas of Hanyang, Wuhan City on the receiving water. China Environ. Sci. 2007, 3, 312–316. (In Chinese) [Google Scholar]
- Pan, G.Q.; Che, W.; Li, J.-Q.; Li, H.-Y. Urban runoff pollution control quantity and Its design rainfall in China. China Water Wastewater 2008, 22, 25–29. (In Chinese) [Google Scholar]
- Cederkvist, K.; Jensen, M.; Ingvertsen, S.; Holm, P. Controlling stormwater quality with filter soil—event and dry weather testing. Water 2016, 8, 349. [Google Scholar] [CrossRef]
- Helmreich, B.; Hilliges, R.; Schriewer, A.; Horn, H. Runoff pollutants of a highly trafficked urban road—Correlation analysis and seasonal influences. Chemosphere 2010, 80, 991–997. [Google Scholar] [CrossRef] [PubMed]
- Ellis, J.B.; Revitt, D.M.; Harrop, D.O.; Beckwith, P.R. The contribution of highway surfaces to urban stormwater sediments and metal loadings. Sci. Total Environ. 1987, 59, 339–349. [Google Scholar] [CrossRef]
- Gao, J.J.; Zhang, L.P.; Huang, S.B.; Ma, M.; Wang, Z.J. Preliminary health risk assessment of heavy metals in drinking waters in Beijing. Environ. Sci. 2004, 25, 47–50. (In Chinese) [Google Scholar]
- Wang, J.; Zhang, P.; Yang, L.; Huang, T. Adsorption characteristics of construction waste for heavy metals from urban stormwater runoff. Chin. J. Chem. Eng. 2015, 23, 1542–1550. [Google Scholar] [CrossRef]
- Murakami, M.; Nakajima, F.; Furumai, H. The sorption of heavy metal species by sediments in soakaways receiving urban road runoff. Chemosphere 2008, 70, 2099–2109. [Google Scholar] [CrossRef] [PubMed]
- Li, H.Y.; Hu, L.; Wang, C.C. The measuring of heavy metal content in road runoff. Environ. Chem. 2009, 28, 145–146. (In Chinese) [Google Scholar]
- Li, Q.Q.; Li, T.L.; Zhao, Q.; Liu, D.; Jin, Z. Characteristics of heavy metal pollution in road rainfall-runoff of Tianjin city. Ecol. Environ. Sci. 2011, 1, 143–148. (In Chinese) [Google Scholar]
- Zhang, K.; He, L.I.; Dafang, F.U.; Fang, Z. Characteristics of heavy metal pollution in runoff from three different types of roofs. Acta Sci. Circumst. 2011, 31, 724–730. (In Chinese) [Google Scholar]
- Chinese Environmental Quality Standard for Surface Water(GB 3838–2002); China Environmental Science Press: Beijing, China, 2002.
- Ouyang, W.; Wang, W.; Haom, F.; Song, K.; Wang, Y. Pollution characterization of urban stormwater runoff on different underlying surface conditions. China Environ. Sci. 2010, 30, 1249–1256. (In Chinese) [Google Scholar]
- Davis, A.P. Green Engineering Principles Promote Low-impact Development. Environ. Sci. Technol. 2005, 39, 338A–344A. [Google Scholar] [CrossRef] [PubMed]
- Peng, J.; Cao, Y.; Rippy, M.; Afrooz, A.; Grant, S. Indicator and pathogen removal by low impact development best management practices. Water 2016, 8, 600. [Google Scholar] [CrossRef]
- Davis, A.P.; Shokouhian, M.; Sharma, H.; Winogradoff, D. Water quality improvement through bioretention: Lead, copper, and zinc removal. Water Environ. Res. 2003, 75, 73–75. [Google Scholar] [CrossRef] [PubMed]
- Khan, U.; Valeo, C.; Chu, A.; He, J. A data driven approach to bioretention cell performance: Prediction and design. Water 2013, 5, 13–28. [Google Scholar] [CrossRef]
- Lucke, T.; Nichols, P.W.B. The pollution removal and stormwater reduction performance of street-side bioretention basins after ten years in operation. Sci. Total Environ. 2015, 536, 784–792. [Google Scholar] [CrossRef] [PubMed]
- Davis, A.P.; Mohammad, S.; Himanshu, S.; Christie, M. Laboratory study of biological retention for urban stormwater management. Water Environ. Res. 2001, 71, 5–14. [Google Scholar] [CrossRef]
- Sun, X.; Davis, A.P. Heavy metal fates in laboratory bioretention systems. Chemosphere 2007, 66, 1601–1609. [Google Scholar] [CrossRef] [PubMed]
- Marchand, L.; Mench, M.; Jacob, D.L.; Otte, M.L. Metal and metalloid removal in constructed wetlands, with emphasis on the importance of plants and standardized measurements: A review. Environ. Pollut. 2010, 158, 3447–3461. [Google Scholar] [CrossRef] [PubMed]
- Li, H.; Davis, A.P. Heavy metal capture and accumulation in bioretention media. Environ. Sci. Technol. 2008, 42, 5247–5253. [Google Scholar] [CrossRef] [PubMed]
- Dietz, M.E. Lowimpact development practices: A reviewof current 17 research and recommendations for future directions. Water Air Soil Pollut. 2007, 186, 351–363. [Google Scholar] [CrossRef]
- Tessier, A.; Campbell, P.G.C.; Bisson, M. Sequential extraction procedure for the speciation of particulate trace metals. Anal. Chem. 1979, 51, 844–851. [Google Scholar] [CrossRef]
- Xu, H.; Ni, F.J.; Liu, Q.Q.; Shen, H.; Chen, R.S. Research on hydraulic conductivity of porous asphalt mixture. China J. Highw. Transp. 2004, 17, 1–5. (In Chinese) [Google Scholar]
- Wu, C.; Junqi, L. Urban Stormwater Utilization Technology and Management; China Architecture & Building Press: Beijing, China, 2006. [Google Scholar]
- Deletic, A.; McCarthy, D.; Chandresena, G.; Li, Y.; Hatt, B.; Payne, E.; Zhang, K.; Henry, R.; Kolotelo, P.; Randjelovic, A.; et al. Biofilters and Wetlands for Stormwater Treatment and Harvesting; Cooperative Research Centre for Water Sensitive Cities, Monash University: Melbourne, Australia, 2014; p. 67. [Google Scholar]
- Reddy, K.R.; Xie, T.; Dastgheibi, S. Removal of heavy metals from urban stormwater runoff using different filter materials. J. Environ. Chem. Eng. 2014, 2, 282–292. [Google Scholar] [CrossRef]
- Rios, C.A.; Williams, C.D.; Roberts, C.L. Removal of heavy metals from acid mine drainage (AMD) using coal fly ash, natural clinker and synthetic zeolites. J. Hazard. Mater. 2008, 156, 23–35. [Google Scholar] [CrossRef] [PubMed]
- Wu, P.; Zhou, Y.S. Simultaneous removal of coexistent heavy metals from simulated urban stormwater using four sorbents: A porous iron sorbent and its mixtures with zeolite and crystal gravel. J. Hazard. Mater. 2009, 168, 674–680. [Google Scholar] [CrossRef] [PubMed]
- Genç-Fuhrman, H.; Mikkelsen, P.S.; Ledin, A. Simultaneous removal of As, Cd, Cr, Cu, Ni and Zn from stormwater: Experimental comparison of 11 different sorbents. Water Res. 2007, 41, 591–602. [Google Scholar] [CrossRef] [PubMed]
- Lim, H.S.; Lim, W.; Hu, J.Y.; Ziegler, A.; Ong, S.L. Comparison of filter media materials for heavy metal removal from urban stormwater runoff using biofiltration systems. J. Environ. Manag. 2015, 147, 24–33. [Google Scholar] [CrossRef] [PubMed]
- Lau, Y.L.; Marsalek, J.; Rochfort, Q. Use of a biofilter for treatment of heavy metals in highway runoff. Water Qual. Res. J. Can. 2000, 35, 563–580. [Google Scholar]
- Hatt, B.E.; Fletcher, T.D.; Deletic, A. Hydraulic and pollutant removal performance of stormwater filters under variable wetting and drying regimes. Water Sci. Technol. 2007, 56, 11–19. [Google Scholar] [CrossRef] [PubMed]
- Henderson, C.; Greenway, M.; Phillips, I. Removal of dissolved nitrogen, phosphorus and carbon from stormwater by biofiltration mesocosms. Water Sci. Technol. 2007, 55, 183–191. [Google Scholar] [CrossRef] [PubMed]
- Zhang, C.; Shan, B.; Tang, W.; Dong, L.; Zhang, W.; Pei, Y. Heavy metal concentrations and speciation in riverine sediments and the risks posed in three urban belts in the Haihe Basin. Ecotoxicol. Environ. Saf. 2017, 139, 263–271. [Google Scholar] [CrossRef] [PubMed]
- Anirudhan, T.S.; Sreekumari, S.S. Adsorptive removal of heavy metal ions from industrial effluents using activated carbon derived from waste coconut buttons. J. Environ. Sci. 2011, 23, 1989–1998. [Google Scholar] [CrossRef]
- Chen, T.; Chen, Z. Cadmium adsorption in soil influenced by dissolved organic matter derived from rice straw and sediment. Chin. J. Appl. Ecol. 2002, 13, 183–186. [Google Scholar]
- Neyestani, M.R.; Bastami, K.D.; Esmaeilzadeh, M.; Shemirani, F.; Khazaali, A.; Molamohyeddin, N.; Afkhami, M.; Nourbakhsh, S.; Dehghani, M.; Aghaei, S.; et al. Geochemical speciation and ecological risk assessment of selected metals in the surface sediments of the northern Persian Gulf. Marine Pollut. Bull. 2016, 109, 603–611. [Google Scholar] [CrossRef] [PubMed]
- Anju, M.; Banerjee, D.K. Comparison of two sequential extraction procedures for heavy metal partitioning in mine tailings. Chemosphere 2010, 78, 1393–1402. [Google Scholar] [CrossRef] [PubMed]
- Mo, Z.; Wang, C.X.; Chen, Q. Form distribution and transformation of heavy metals of Cu, Pb, Zn, Cr and Cd in soils. Agro-Environ. Prot. 2002, 21, 9–12. (In Chinese) [Google Scholar]
- Wang, Z.W.; Liu, X.; Yao, X.S.; Hou, X. Effects of soluble inorganic salts on the distribution and bioavailability of cadmium in soil. J. Agric. Environ. Sci. 2008, 27, 884–888. (In Chinese) [Google Scholar]
- Xu, L.; Wang, T.; Wang, J.; Lu, A. Occurrence, speciation and transportation of heavy metals in 9 coastal rivers from watershed of Laizhou Bay, China. Chemosphere 2017, 173, 61–68. [Google Scholar] [CrossRef] [PubMed]
- Wei, L.; Wang, K.; Noguera, D.R.; Jiang, J.; Oyserman, B.; Zhao, N.; Zhao, Q.; Cui, F. Transformation and speciation of typical heavy metals in soil aquifer treatment system during long time recharging with secondary effluent: Depth distribution and combination. Chemosphere 2016, 165, 100–109. [Google Scholar] [CrossRef] [PubMed]
Figure 1.
Experimental set-up consisting of four bioretention reactors. Each reactor has one to five ports for collecting small-amount soil samples at five depths for analysis, but the ports are only graphically shown for Number 1 (Sand) reactor.
Figure 1.
Experimental set-up consisting of four bioretention reactors. Each reactor has one to five ports for collecting small-amount soil samples at five depths for analysis, but the ports are only graphically shown for Number 1 (Sand) reactor.
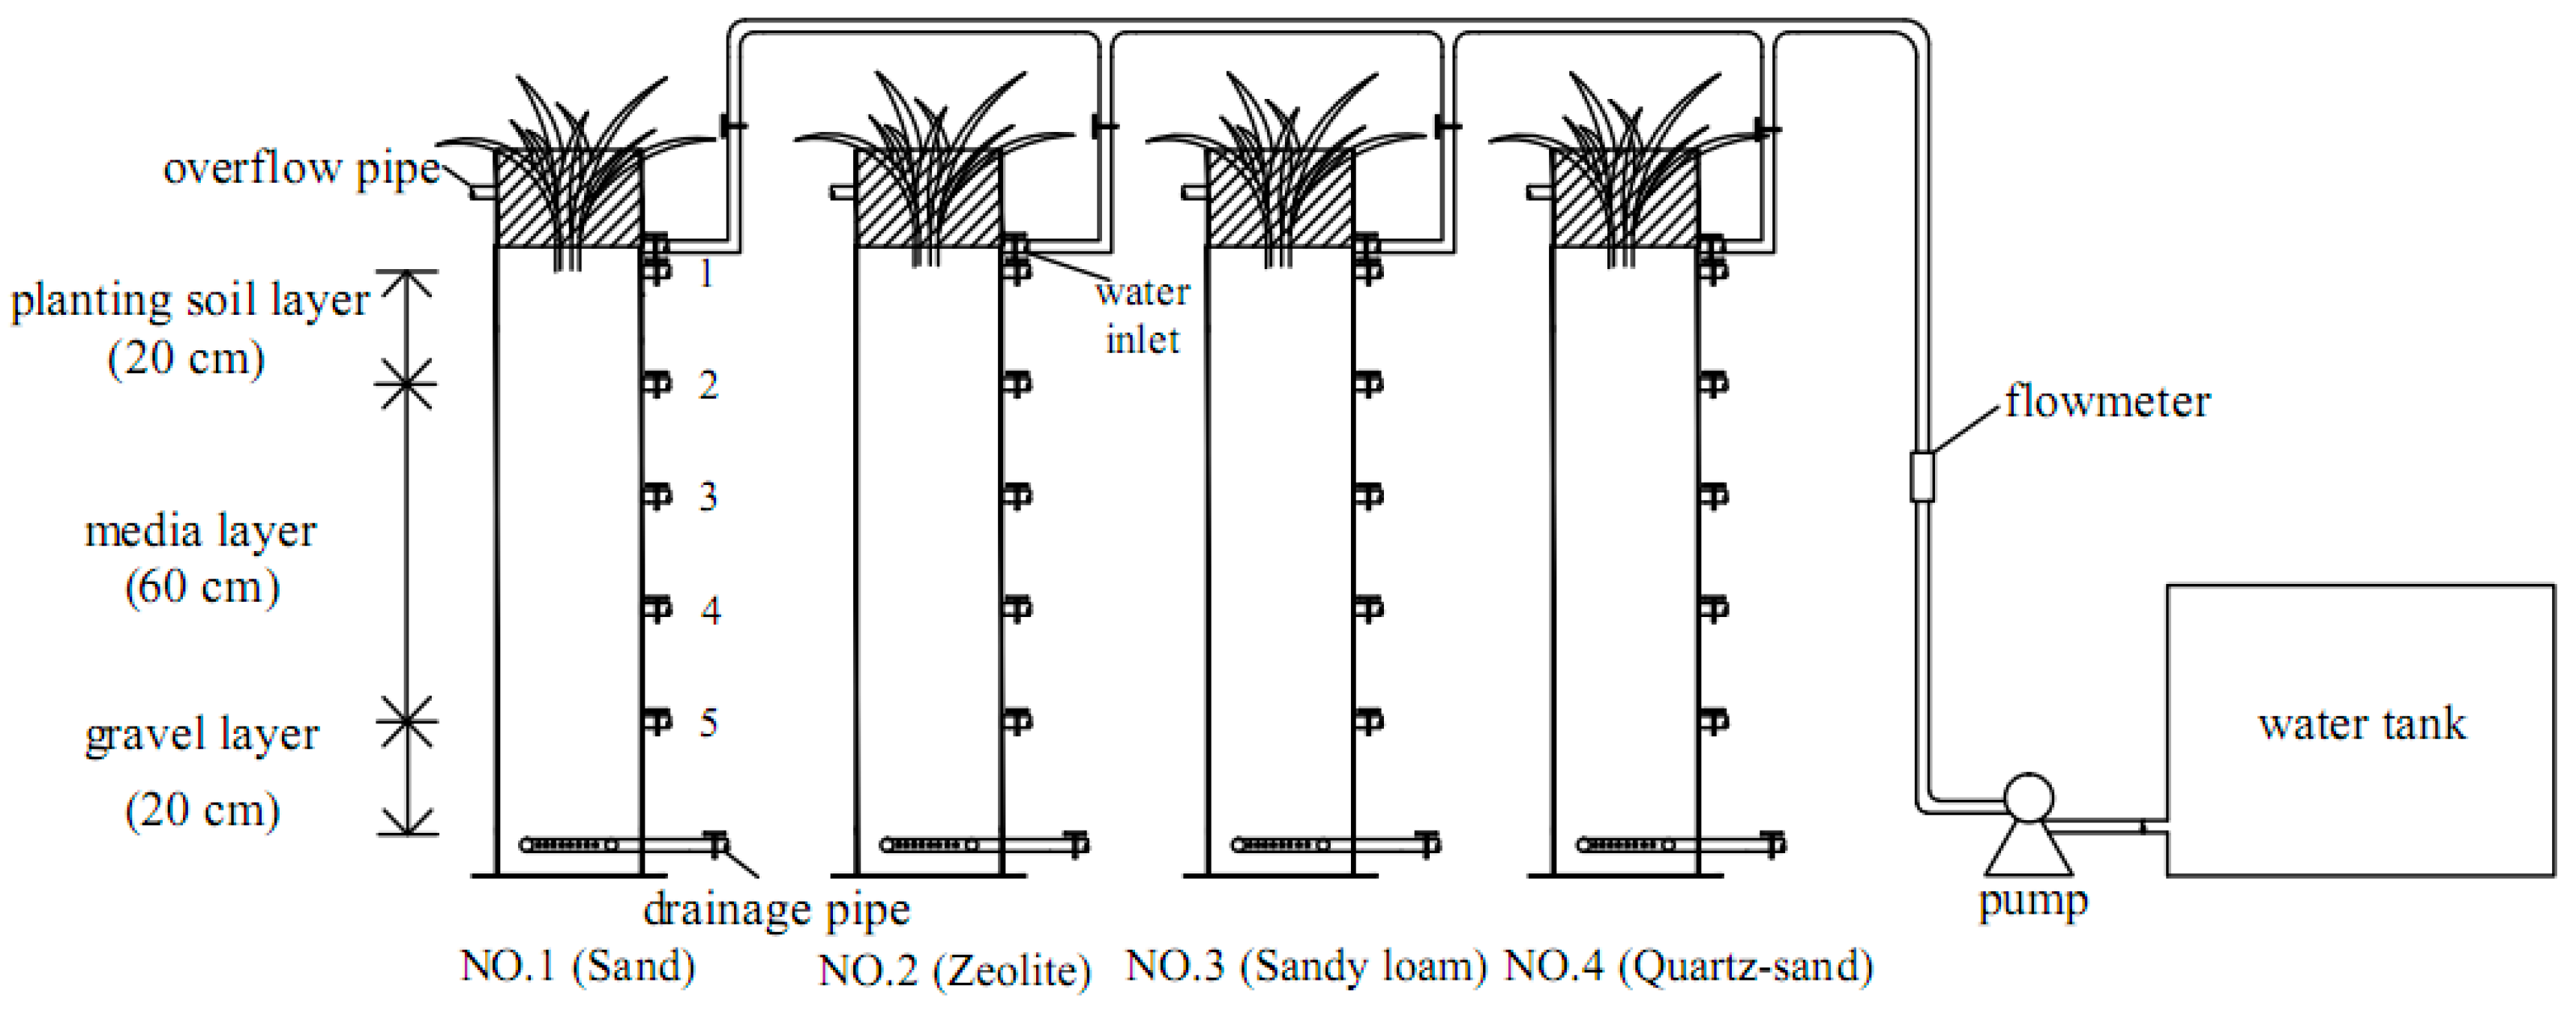
Figure 2.
Tessier sequential chemical extraction method.
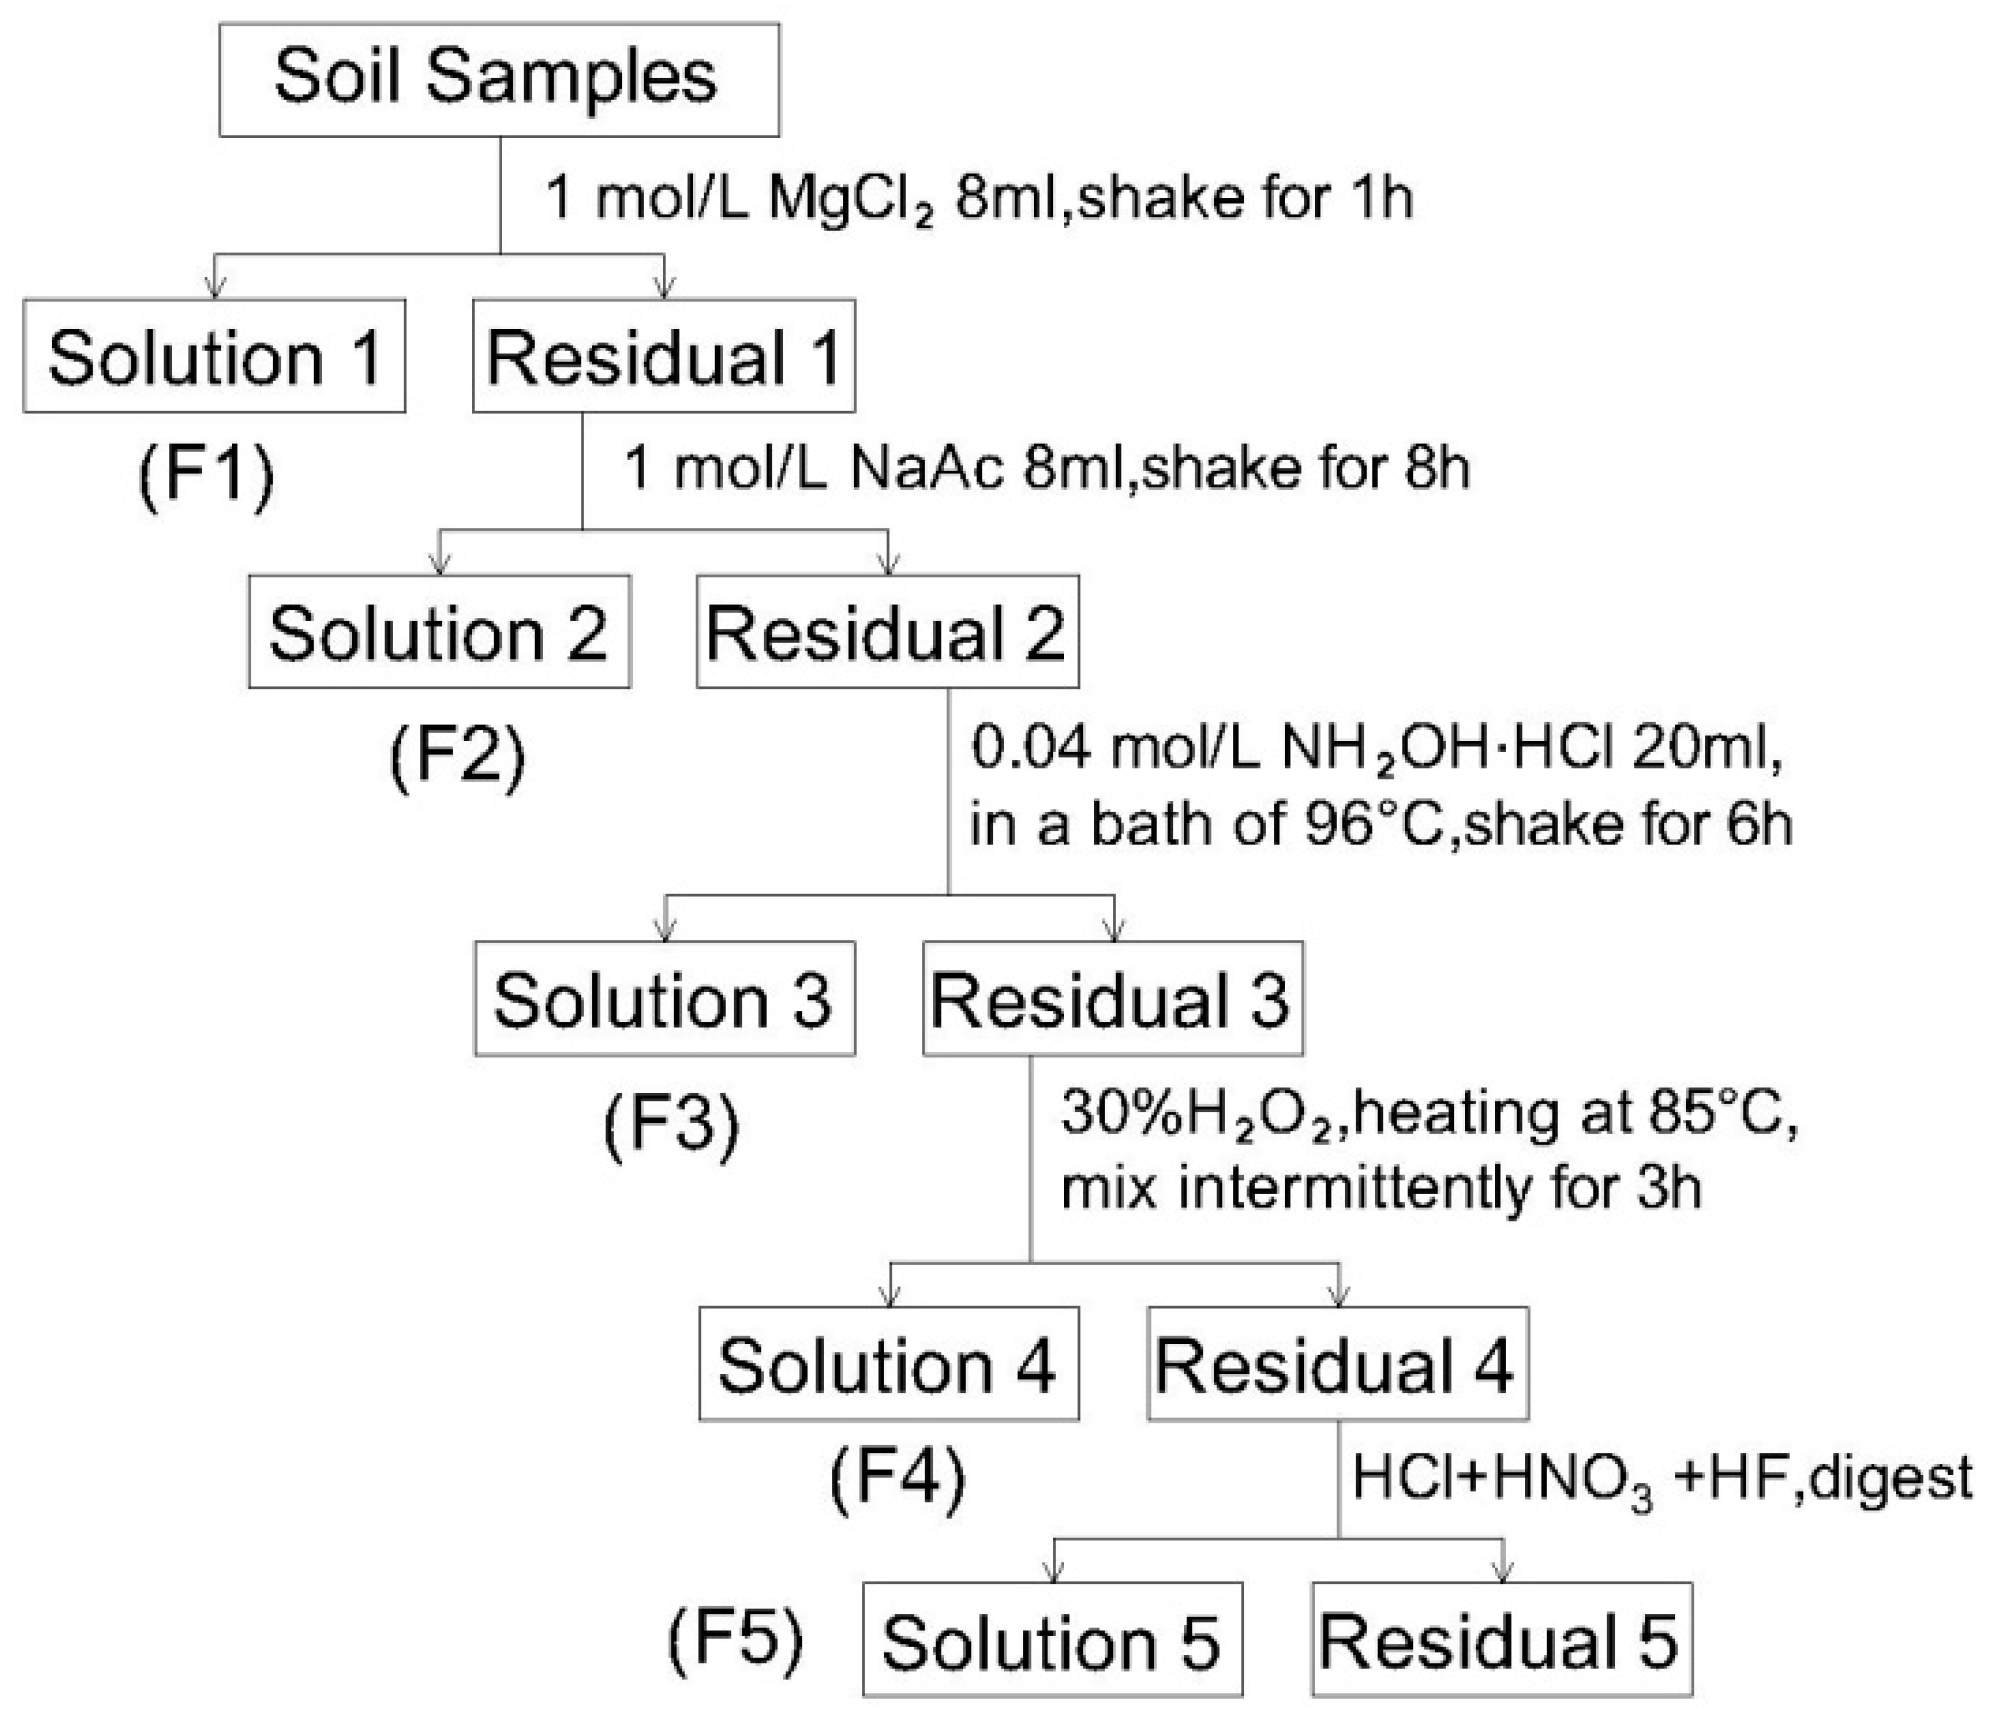
Figure 3.
The effect of influent concentrations on the removal efficiency of heavy metals in four reactors with different bioretention media mixes (reactor 1: sand, reactor 2: zeolite, reactor 3: sandy loam, reactor 4: quartz-sand).
Figure 3.
The effect of influent concentrations on the removal efficiency of heavy metals in four reactors with different bioretention media mixes (reactor 1: sand, reactor 2: zeolite, reactor 3: sandy loam, reactor 4: quartz-sand).
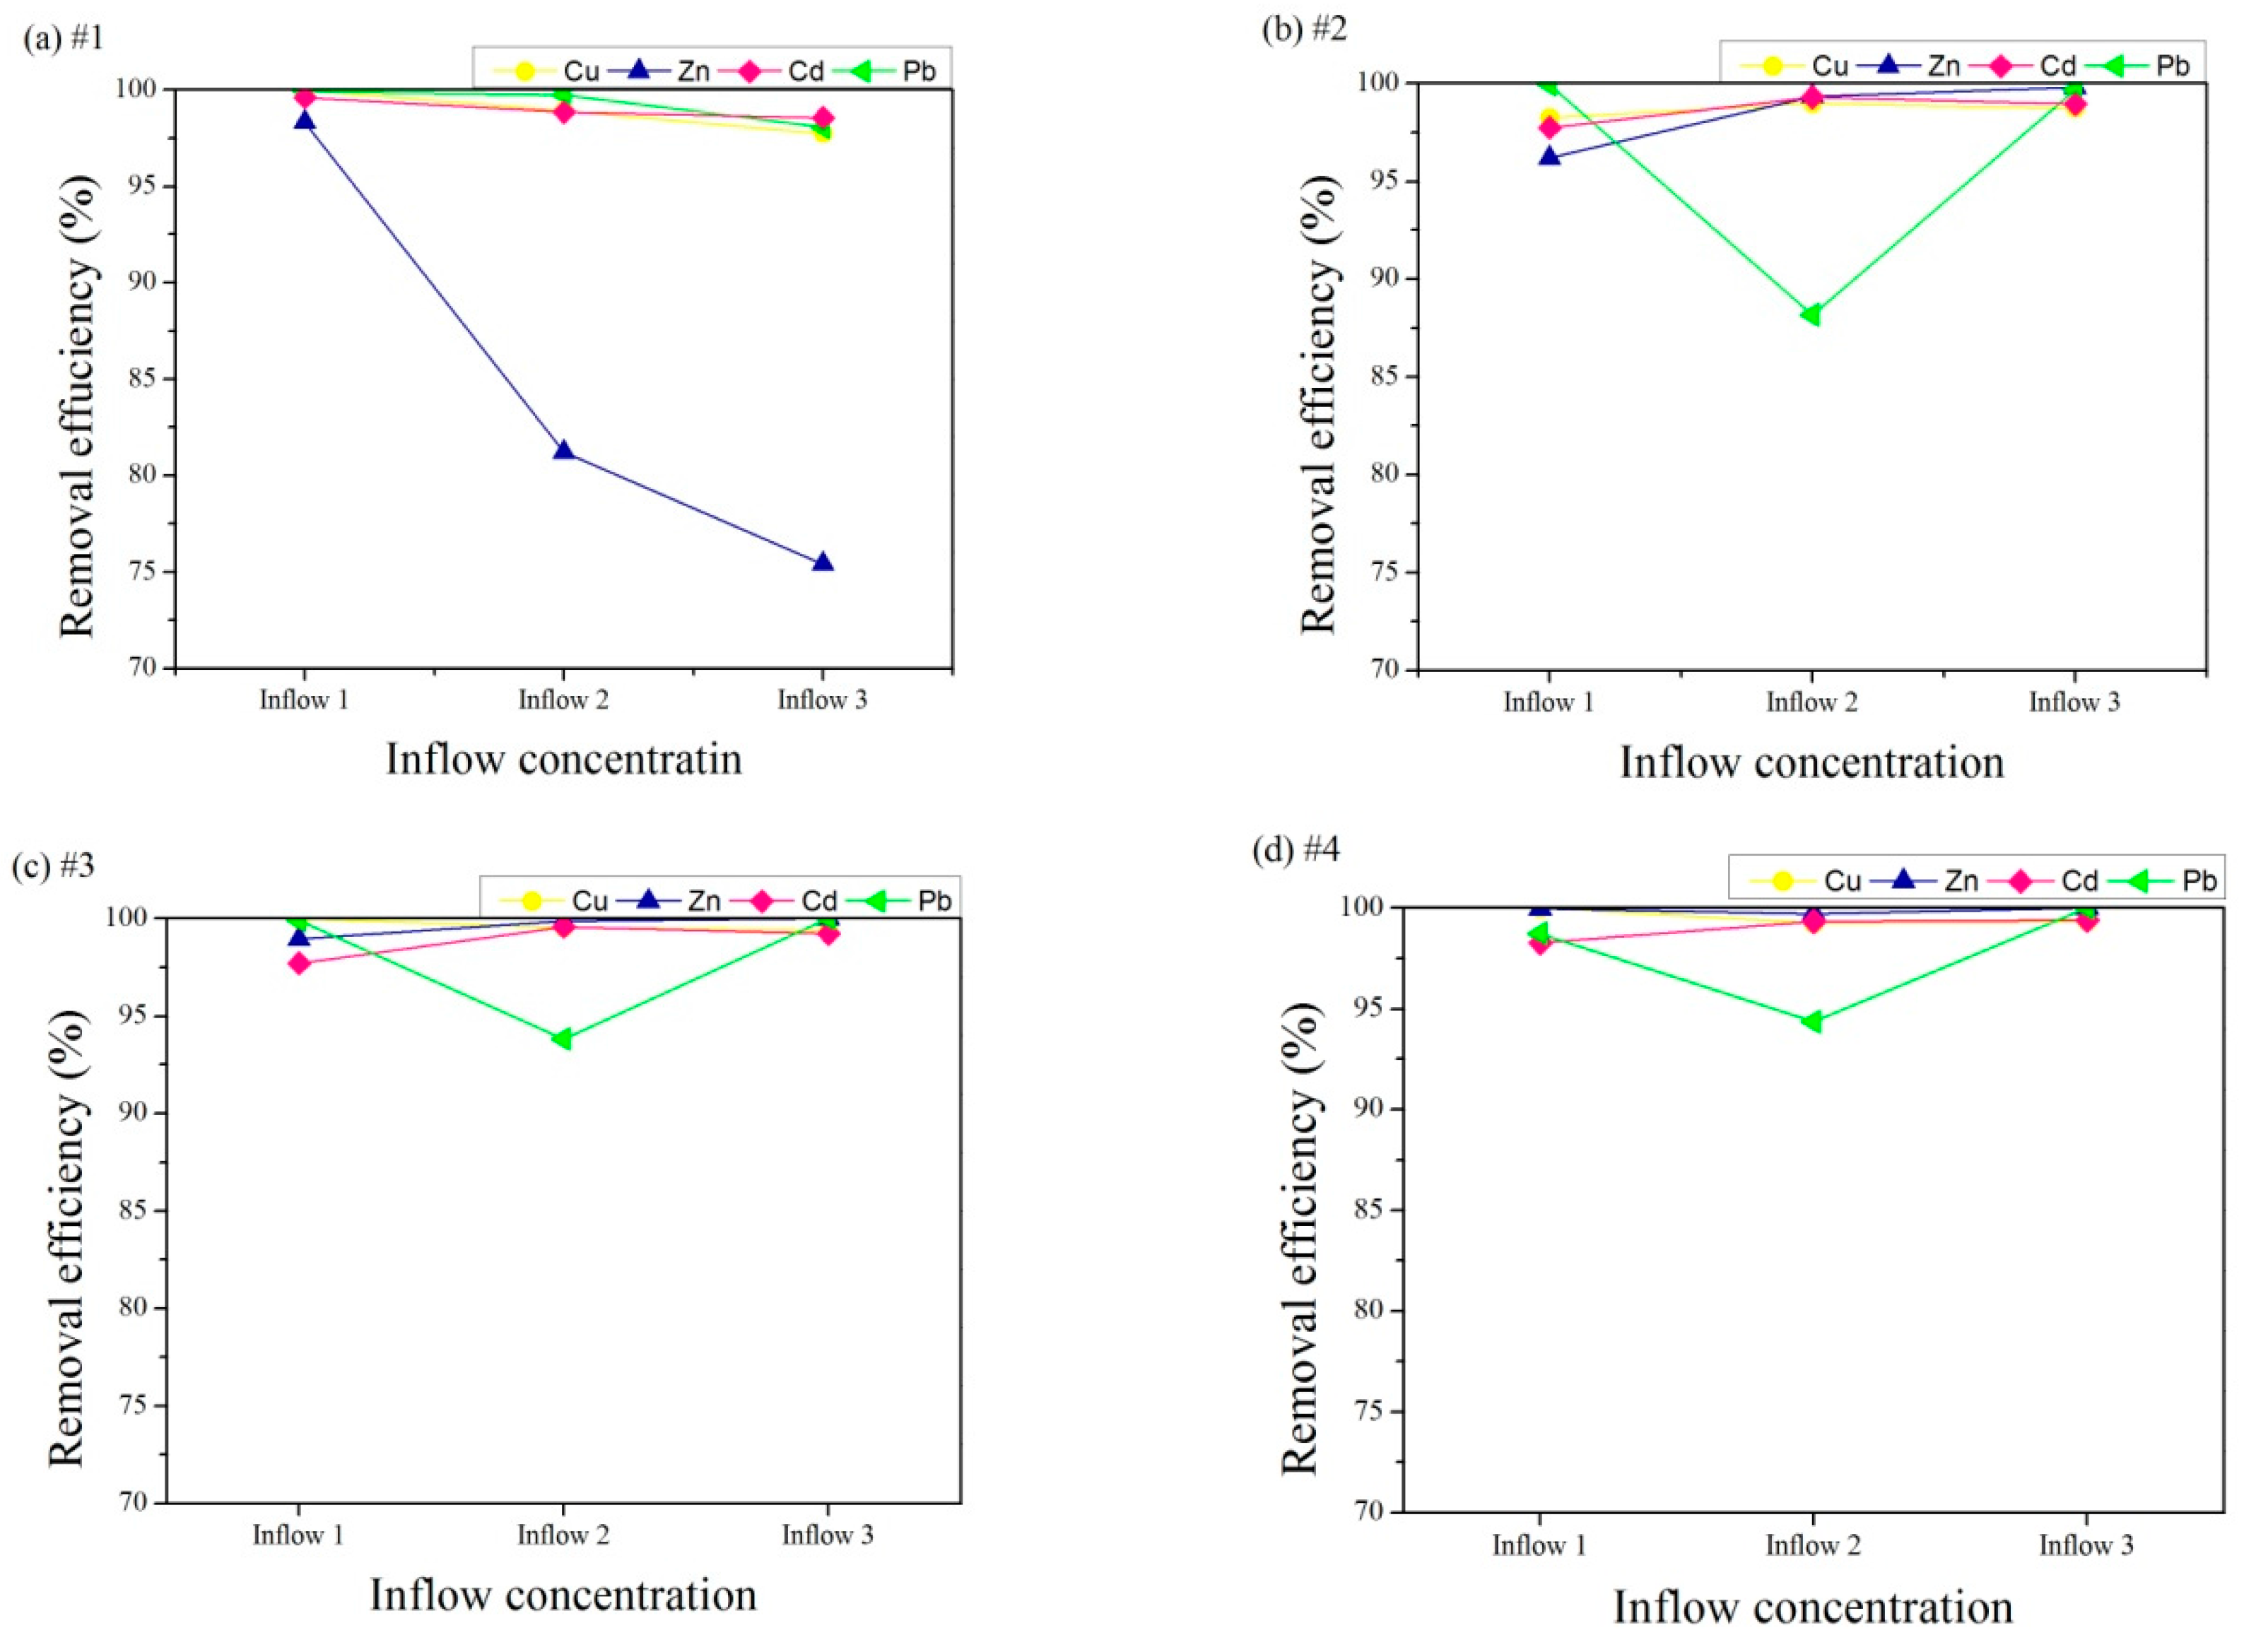
Figure 4.
The removal efficiencies for four heavy metals of the four bioretention media as a function of inter-event dry period (reactor 1: sand, reactor 2: zeolite, reactor 3: sandy loam, reactor 4: quartz-sand).
Figure 4.
The removal efficiencies for four heavy metals of the four bioretention media as a function of inter-event dry period (reactor 1: sand, reactor 2: zeolite, reactor 3: sandy loam, reactor 4: quartz-sand).
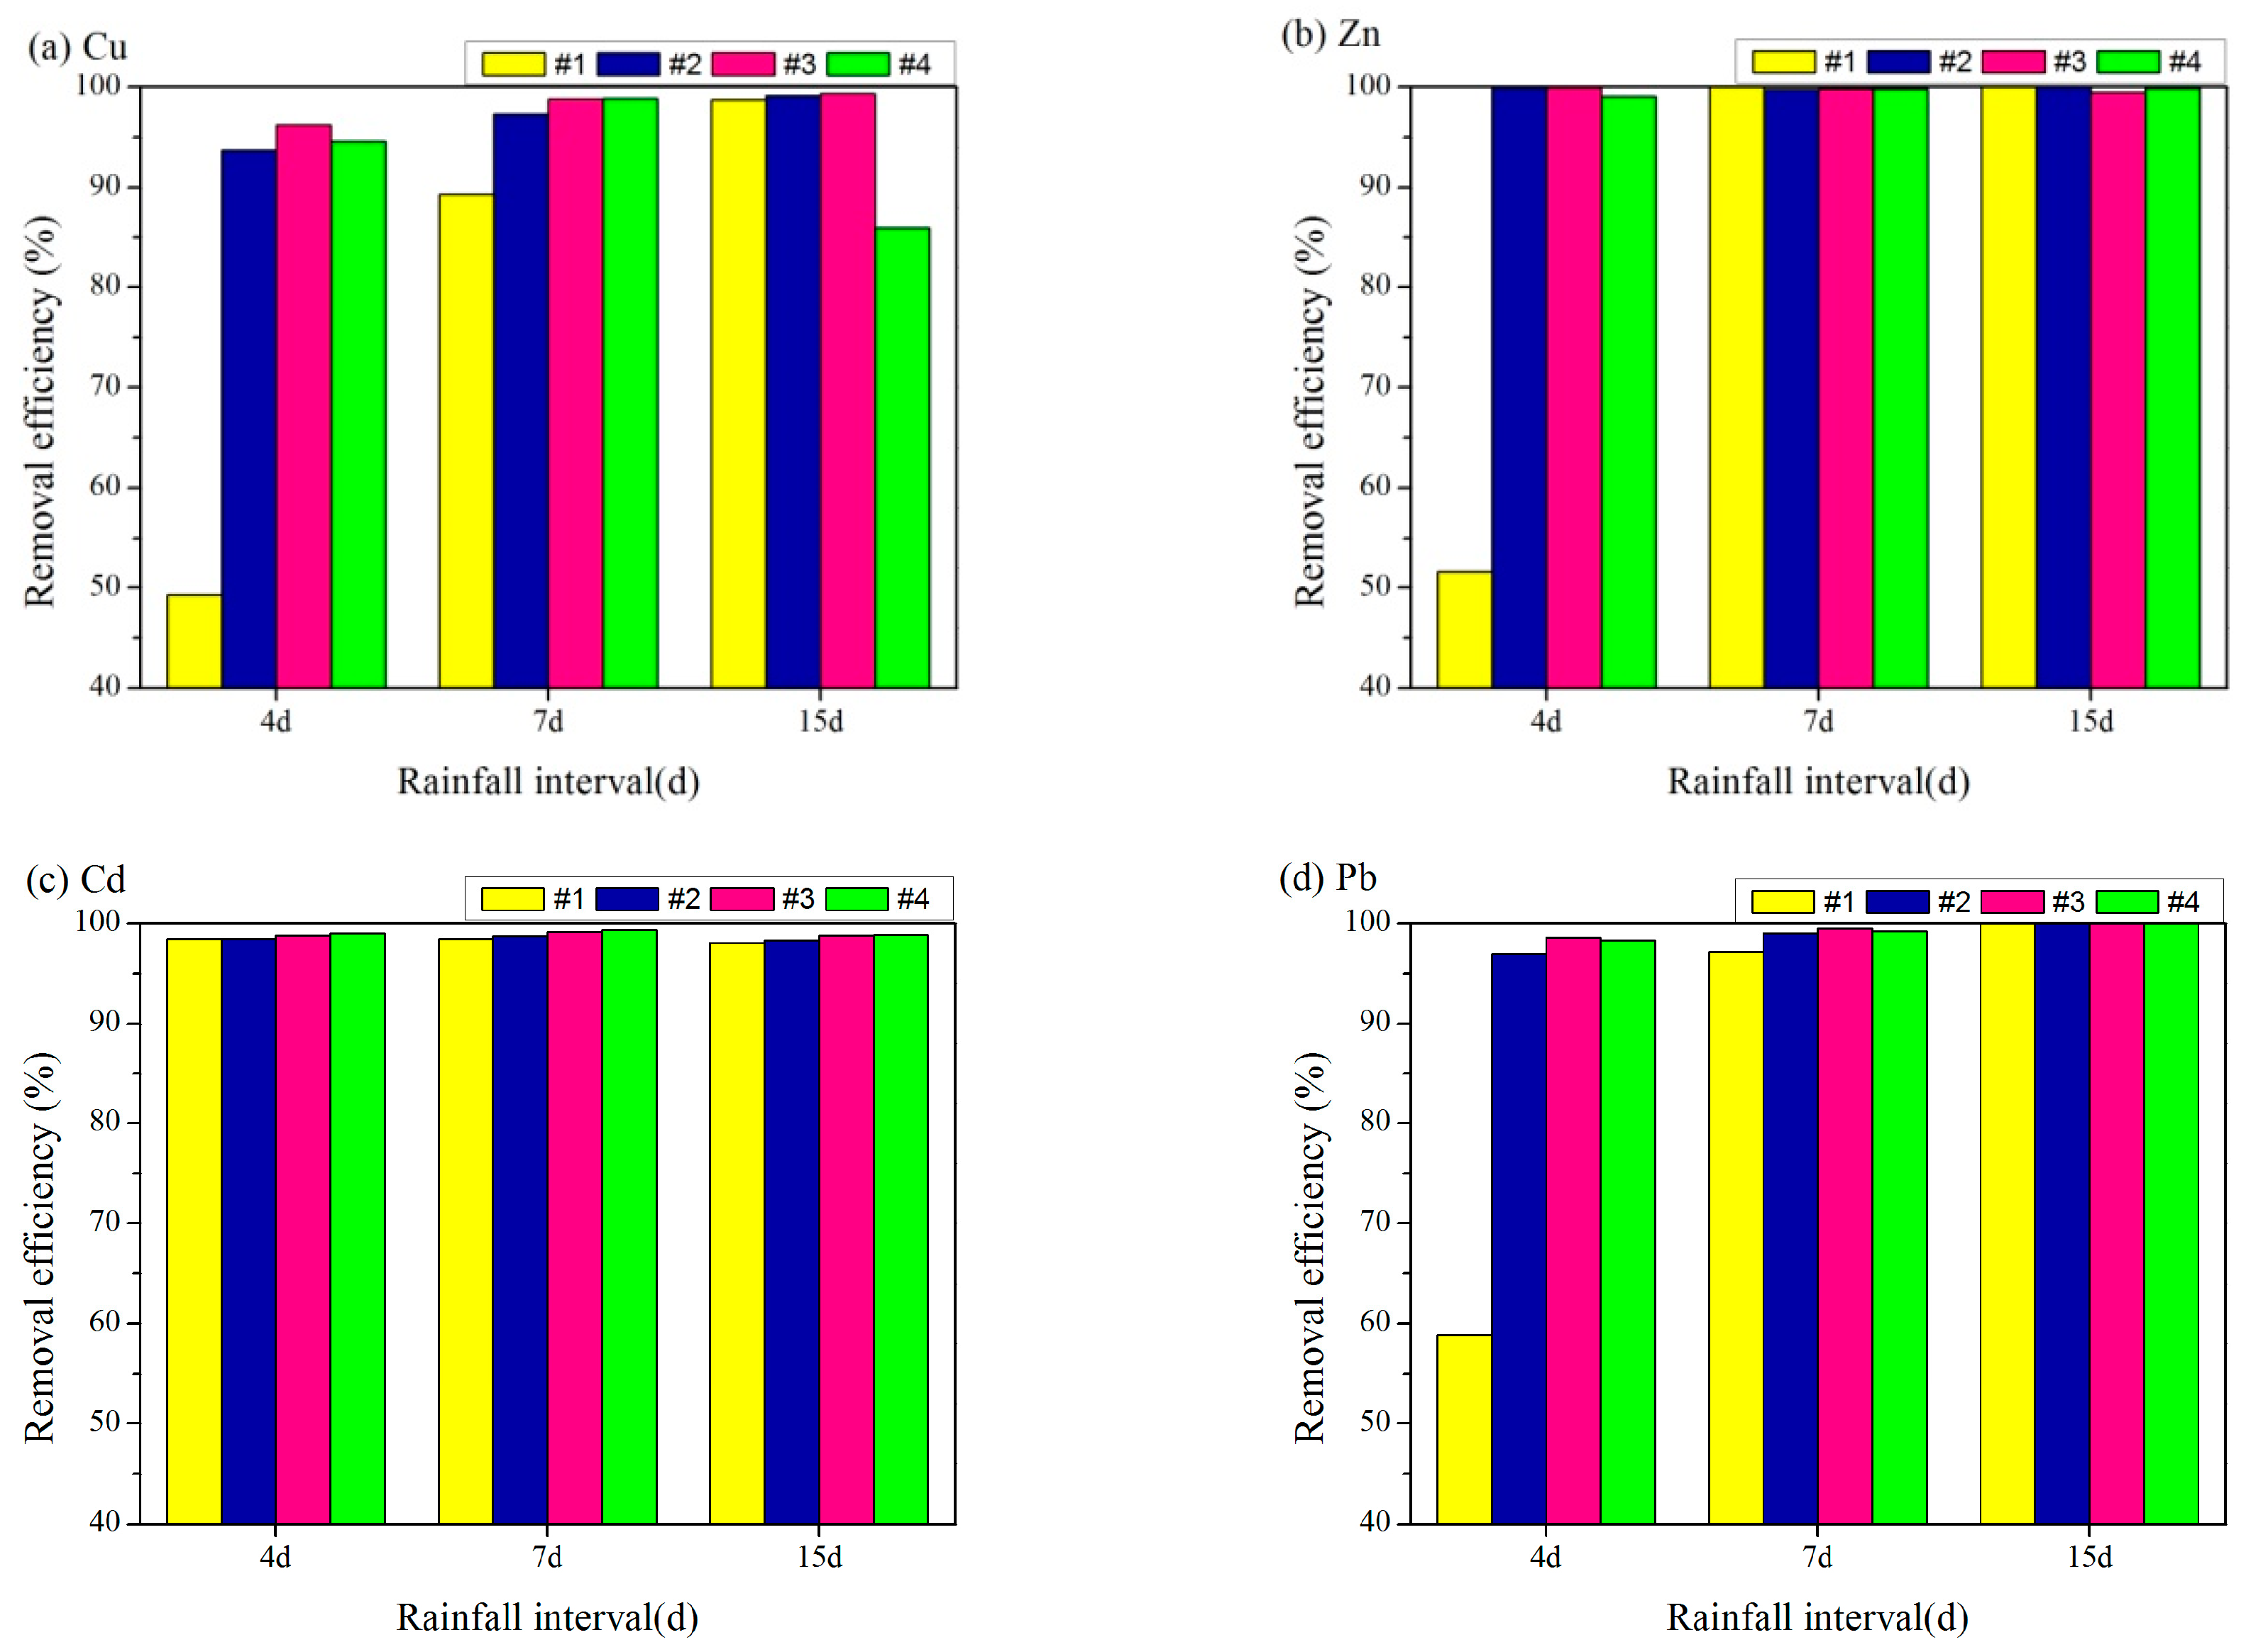
Figure 5.
Heavy metal concentrations in the effluent at different times from four bioretention columns when the pH of the influent was 4.05 (reactor 1: sand, reactor 2: zeolite, reactor 3: sandy loam, reactor 4: quartz-sand).
Figure 5.
Heavy metal concentrations in the effluent at different times from four bioretention columns when the pH of the influent was 4.05 (reactor 1: sand, reactor 2: zeolite, reactor 3: sandy loam, reactor 4: quartz-sand).
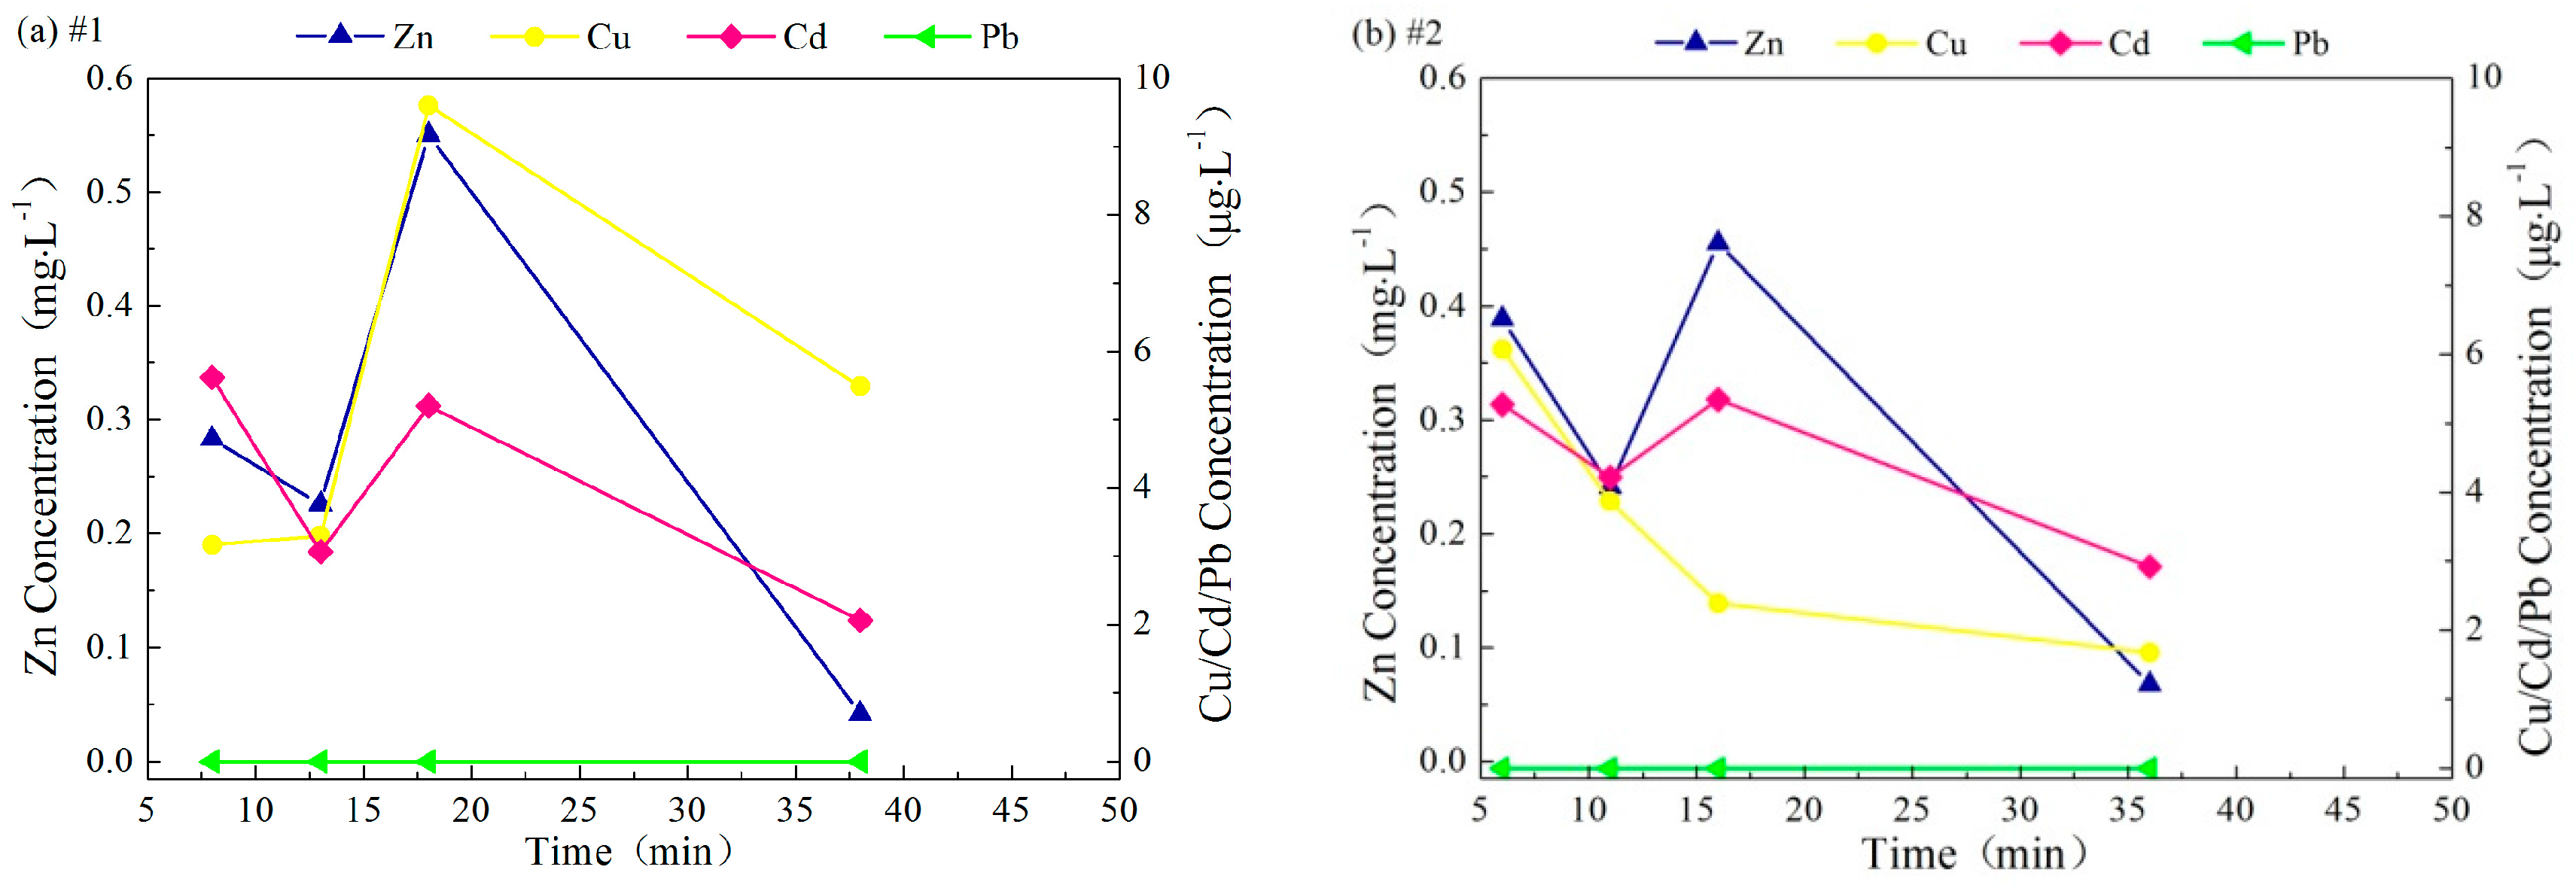
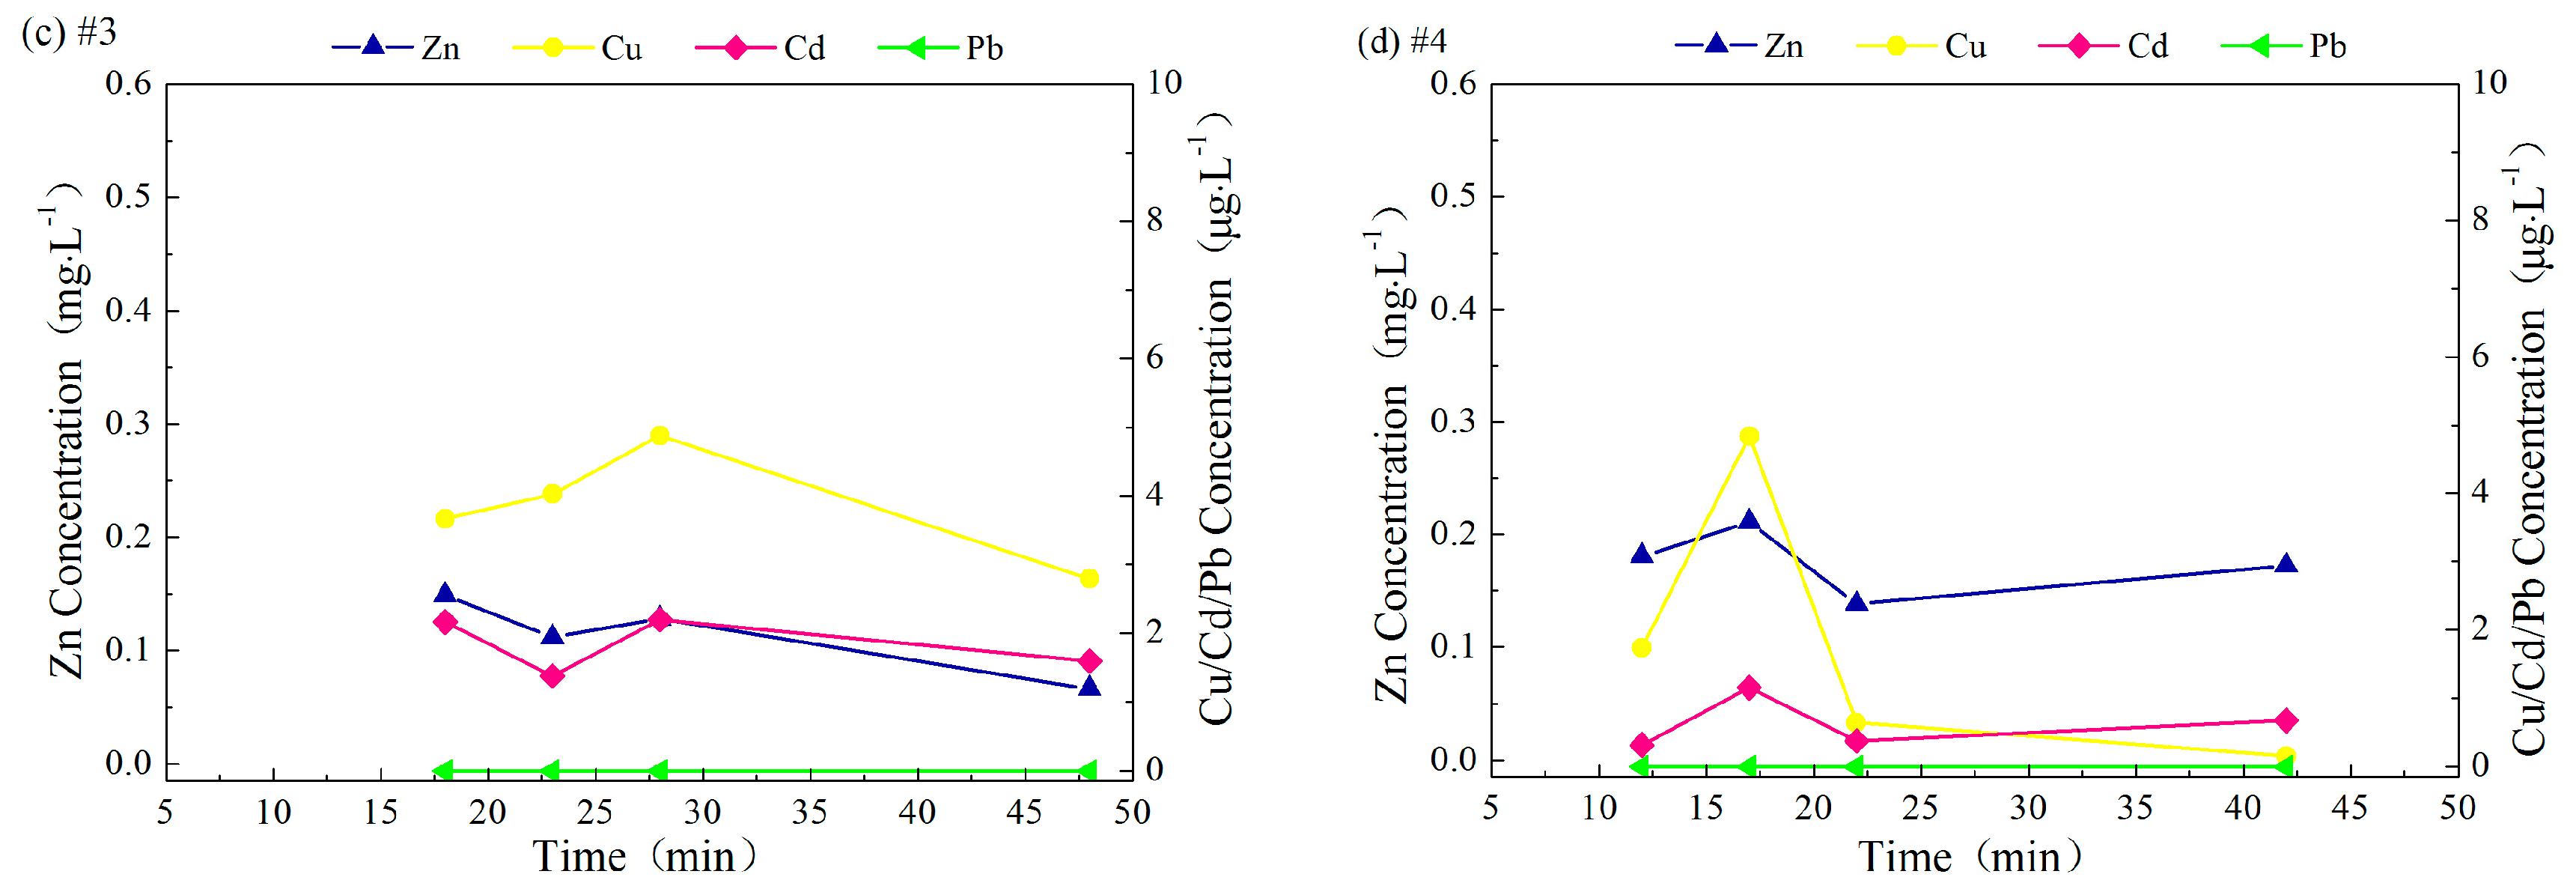
Figure 6.
Accumulated heavy metals (mg·kg−1) measured at five depths in four reactors (the plot for Zn has a different scale on the x axis) (reactor 1: sand, reactor 2: zeolite, reactor 3: sandy loam, reactor 4: quartz-sand).
Figure 6.
Accumulated heavy metals (mg·kg−1) measured at five depths in four reactors (the plot for Zn has a different scale on the x axis) (reactor 1: sand, reactor 2: zeolite, reactor 3: sandy loam, reactor 4: quartz-sand).


Figure 7.
Copper adsorptions in different fractions (exchangeable [F1], bound to carbonate [F2], bound to iron and manganese oxides [F3], bound to organic matter [F4], and residual [F5]) at five depths for the four reactors (reactor 1: sand, reactor 2: zeolite, reactor 3: sandy loam, reactor 4: quartz-sand).

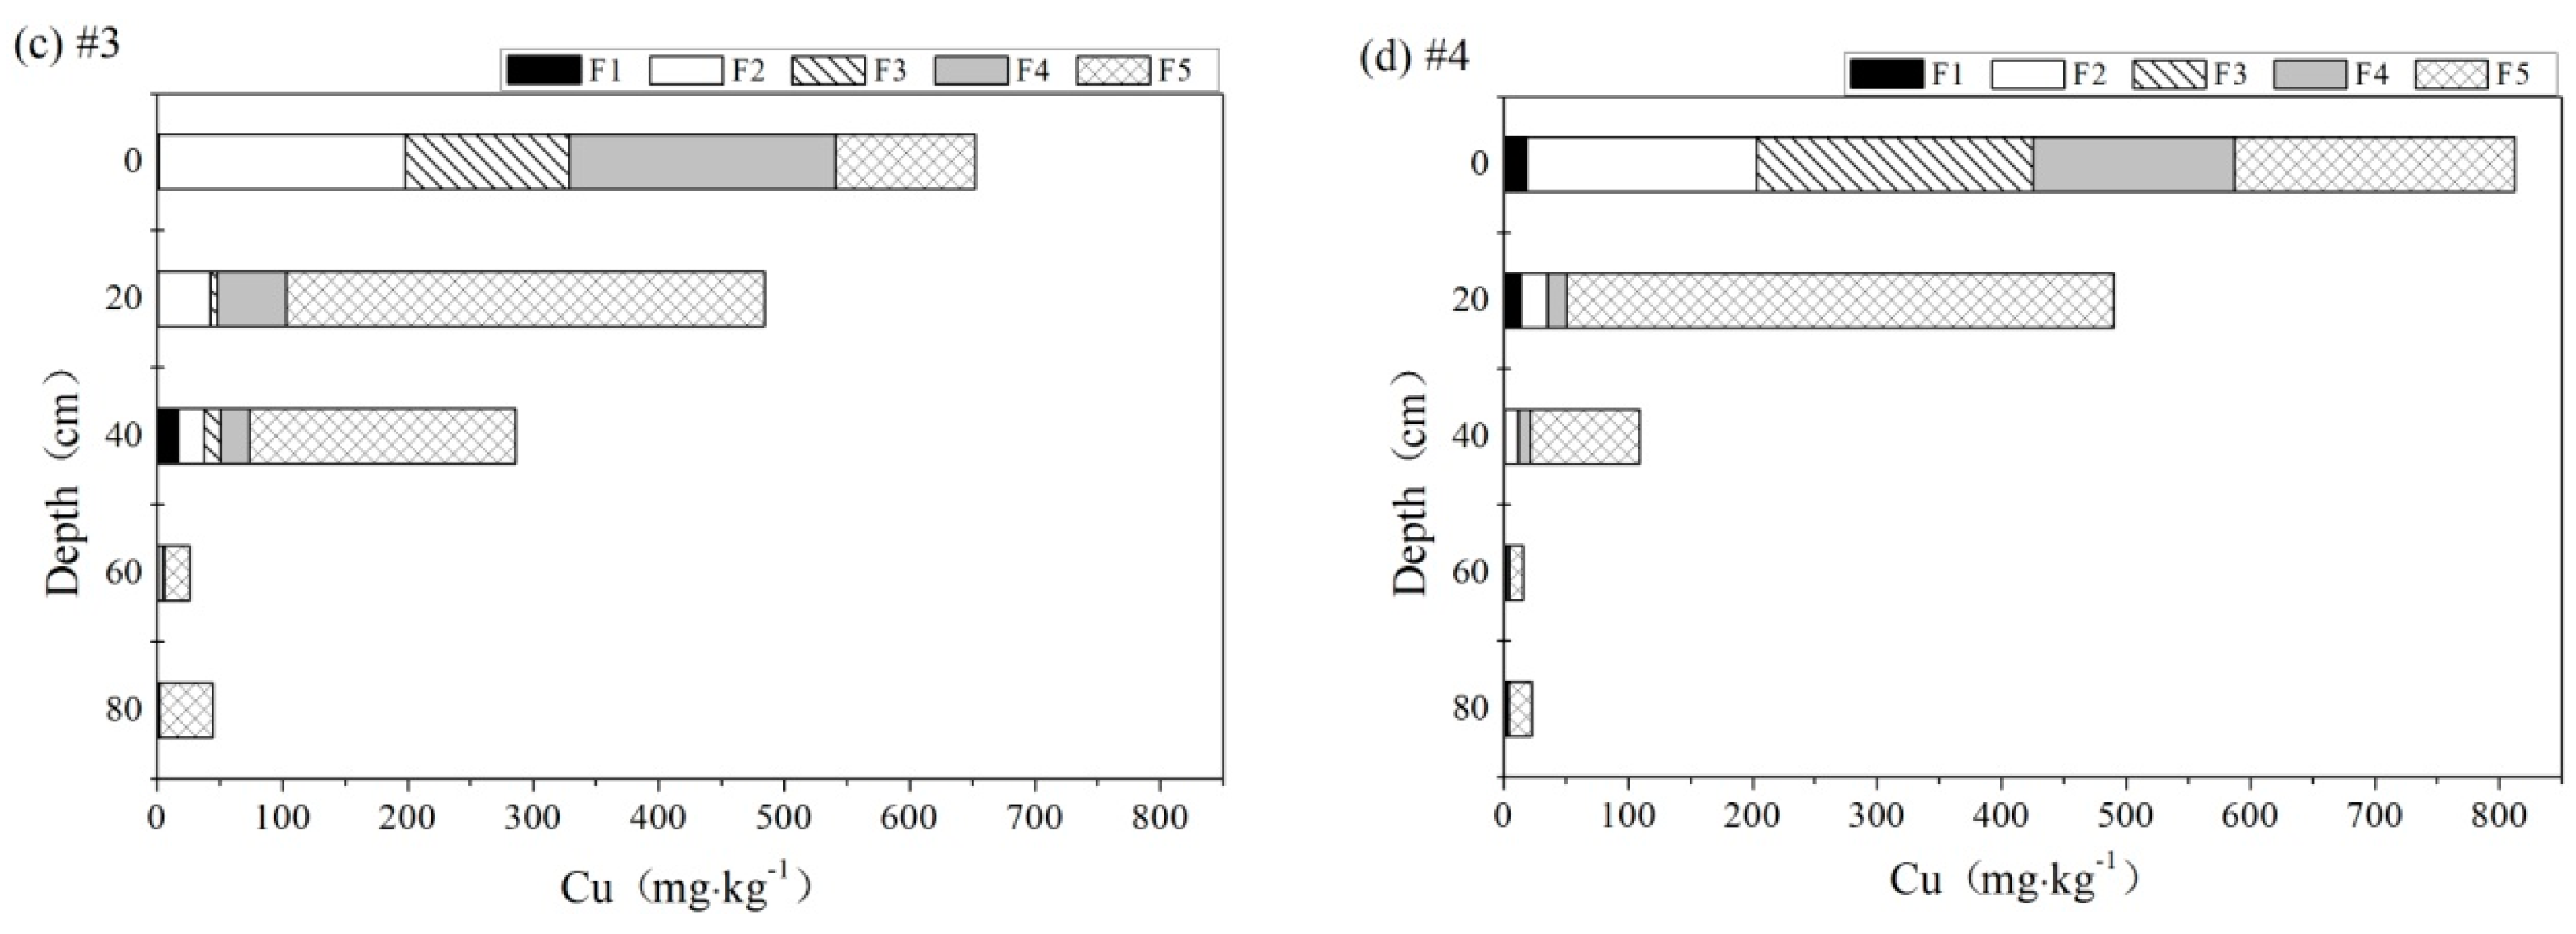
Figure 8.
Copper adsorptions (mg·kg−1) and percentages in different fractions (exchangeable [F1], bound to carbonate [F2], bound to iron and manganese oxides [F3], bound to organic matter [F4], and residual [F5]) at the four bioretention reactors.
Figure 8.
Copper adsorptions (mg·kg−1) and percentages in different fractions (exchangeable [F1], bound to carbonate [F2], bound to iron and manganese oxides [F3], bound to organic matter [F4], and residual [F5]) at the four bioretention reactors.
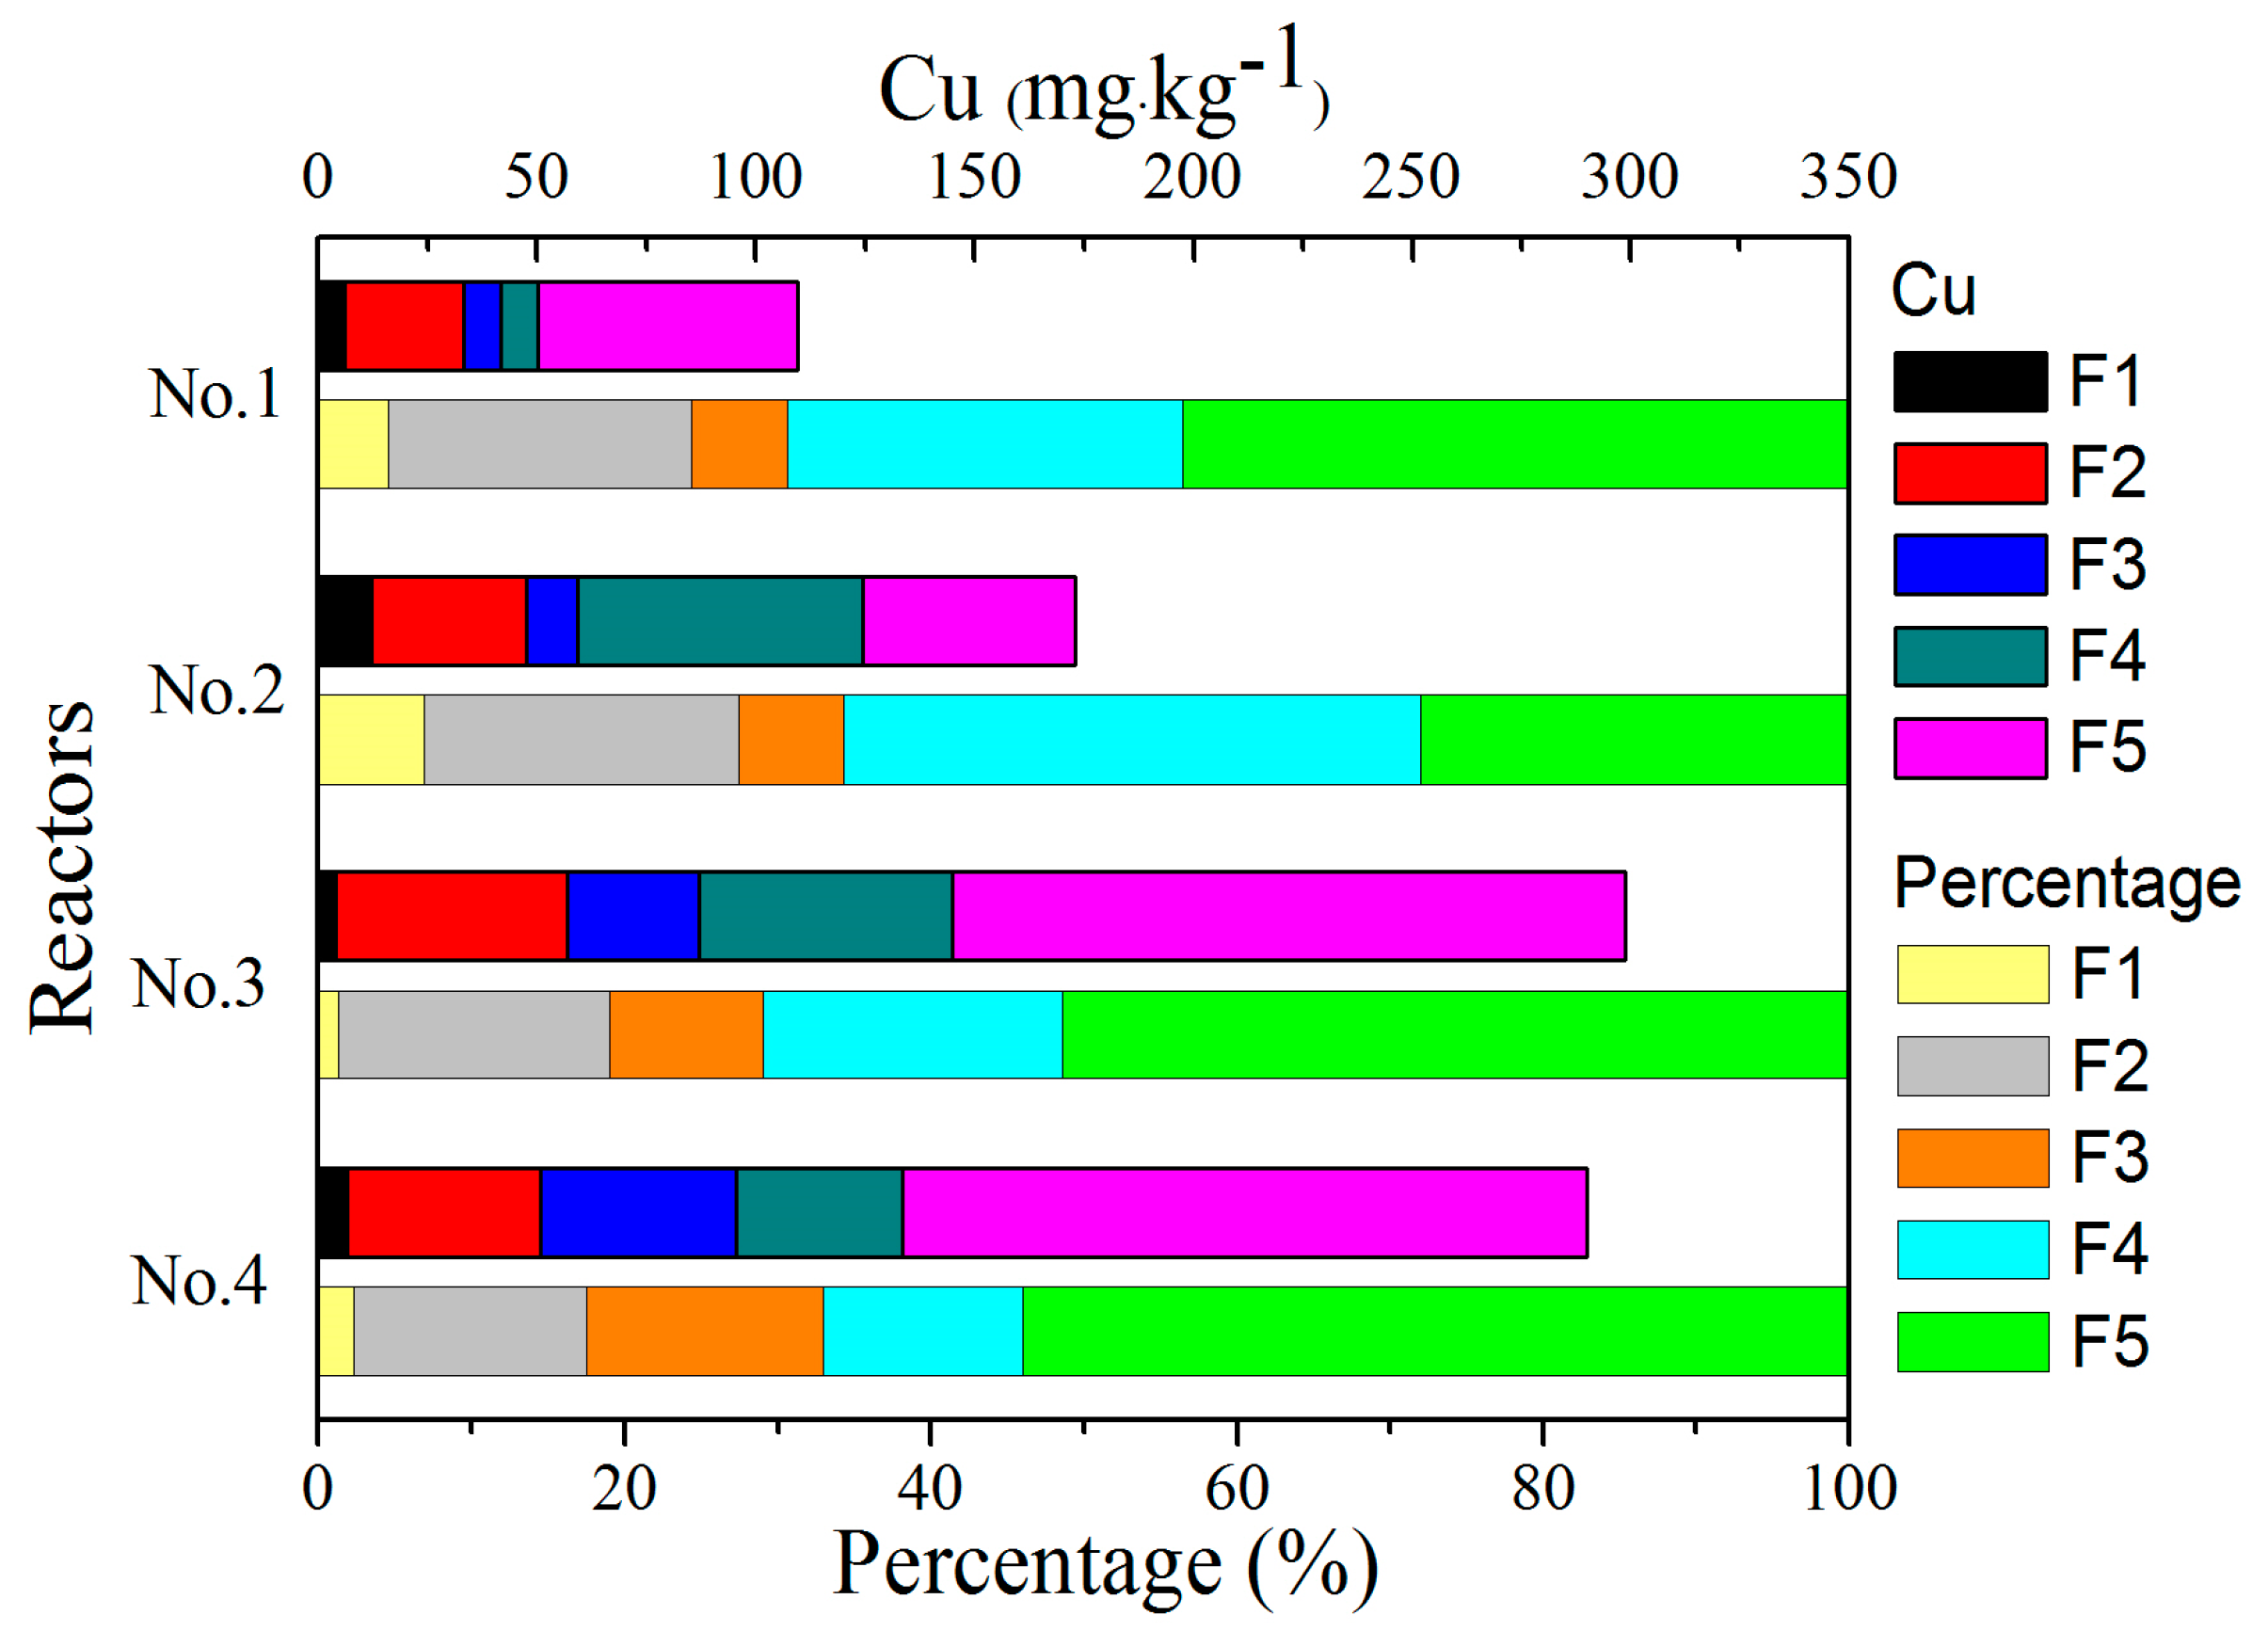
Figure 9.
Zinc adsorptions (mg·kg−1) and percentages in different fractions (exchangeable [F1], bound to carbonate [F2], bound to iron and manganese oxides [F3], bound to organic matter [F4], and residual [F5]) at the four bioretention reactors.
Figure 9.
Zinc adsorptions (mg·kg−1) and percentages in different fractions (exchangeable [F1], bound to carbonate [F2], bound to iron and manganese oxides [F3], bound to organic matter [F4], and residual [F5]) at the four bioretention reactors.
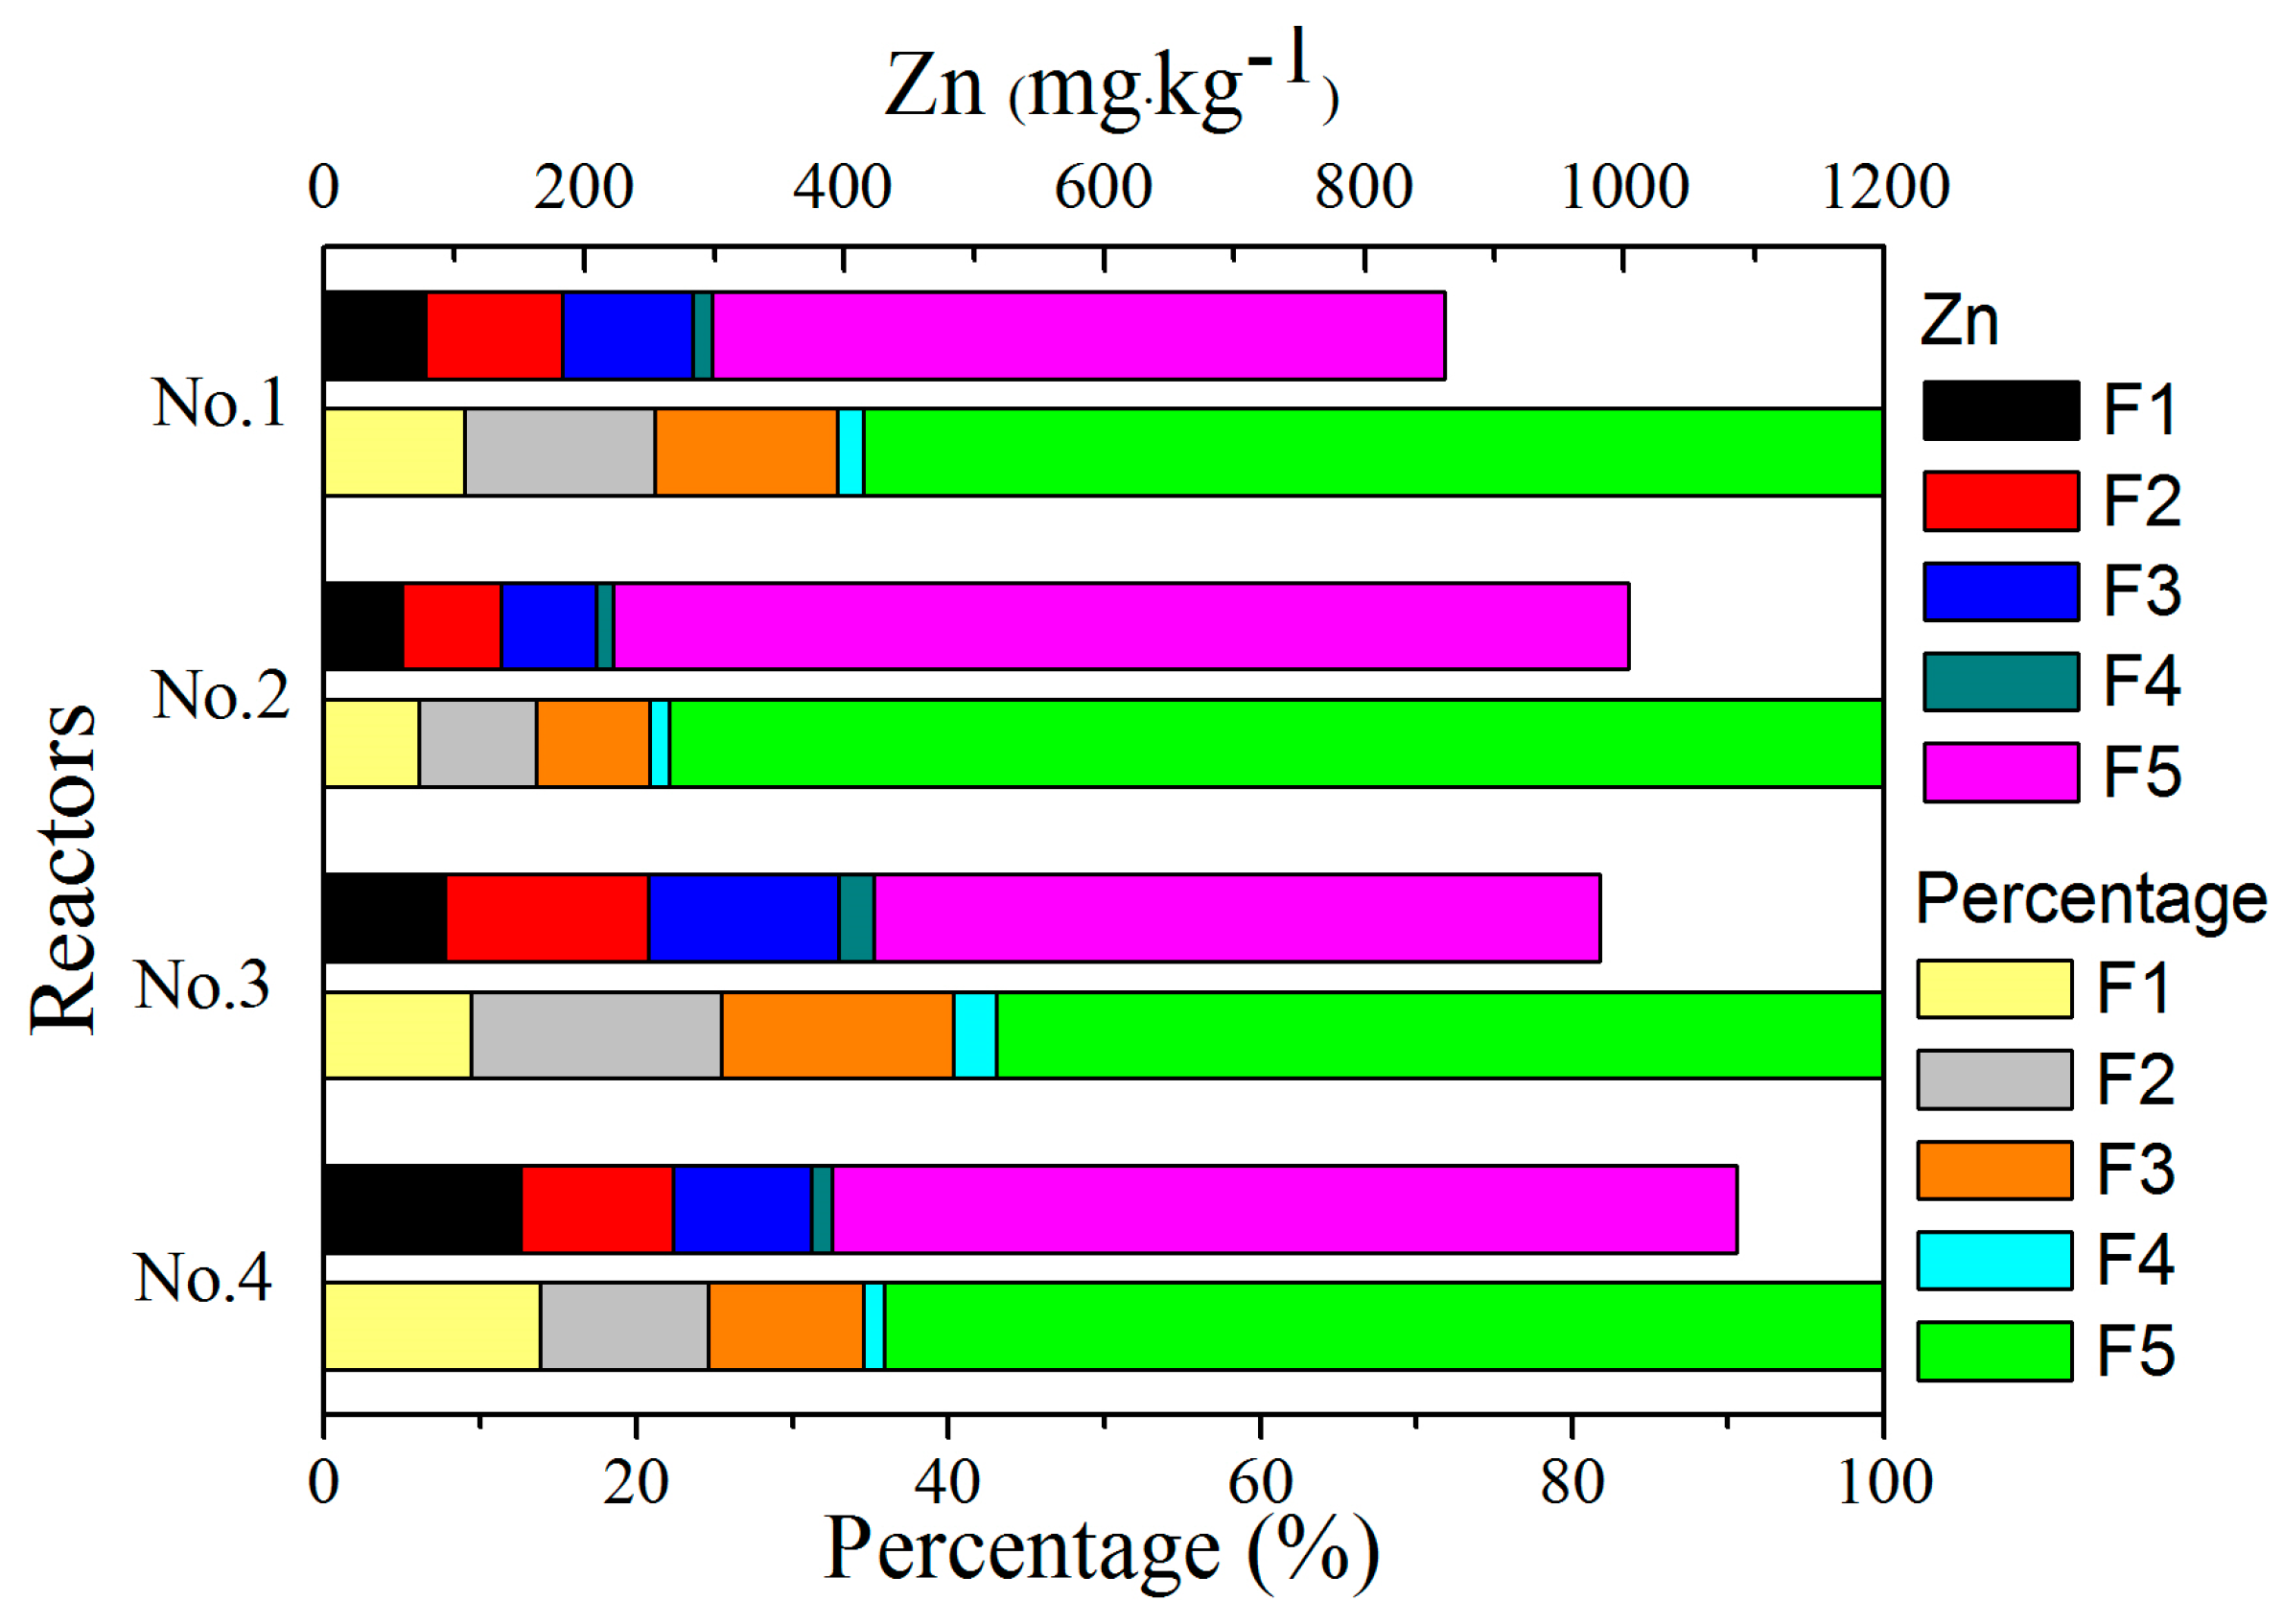
Figure 10.
Cadmium adsorptions (mg·kg−1) and percentages in different fractions (exchangeable [F1], bound to carbonate [F2], bound to iron and manganese oxides [F3], bound to organic matter [F4], and residual [F5]) at the four bioretention reactors.
Figure 10.
Cadmium adsorptions (mg·kg−1) and percentages in different fractions (exchangeable [F1], bound to carbonate [F2], bound to iron and manganese oxides [F3], bound to organic matter [F4], and residual [F5]) at the four bioretention reactors.
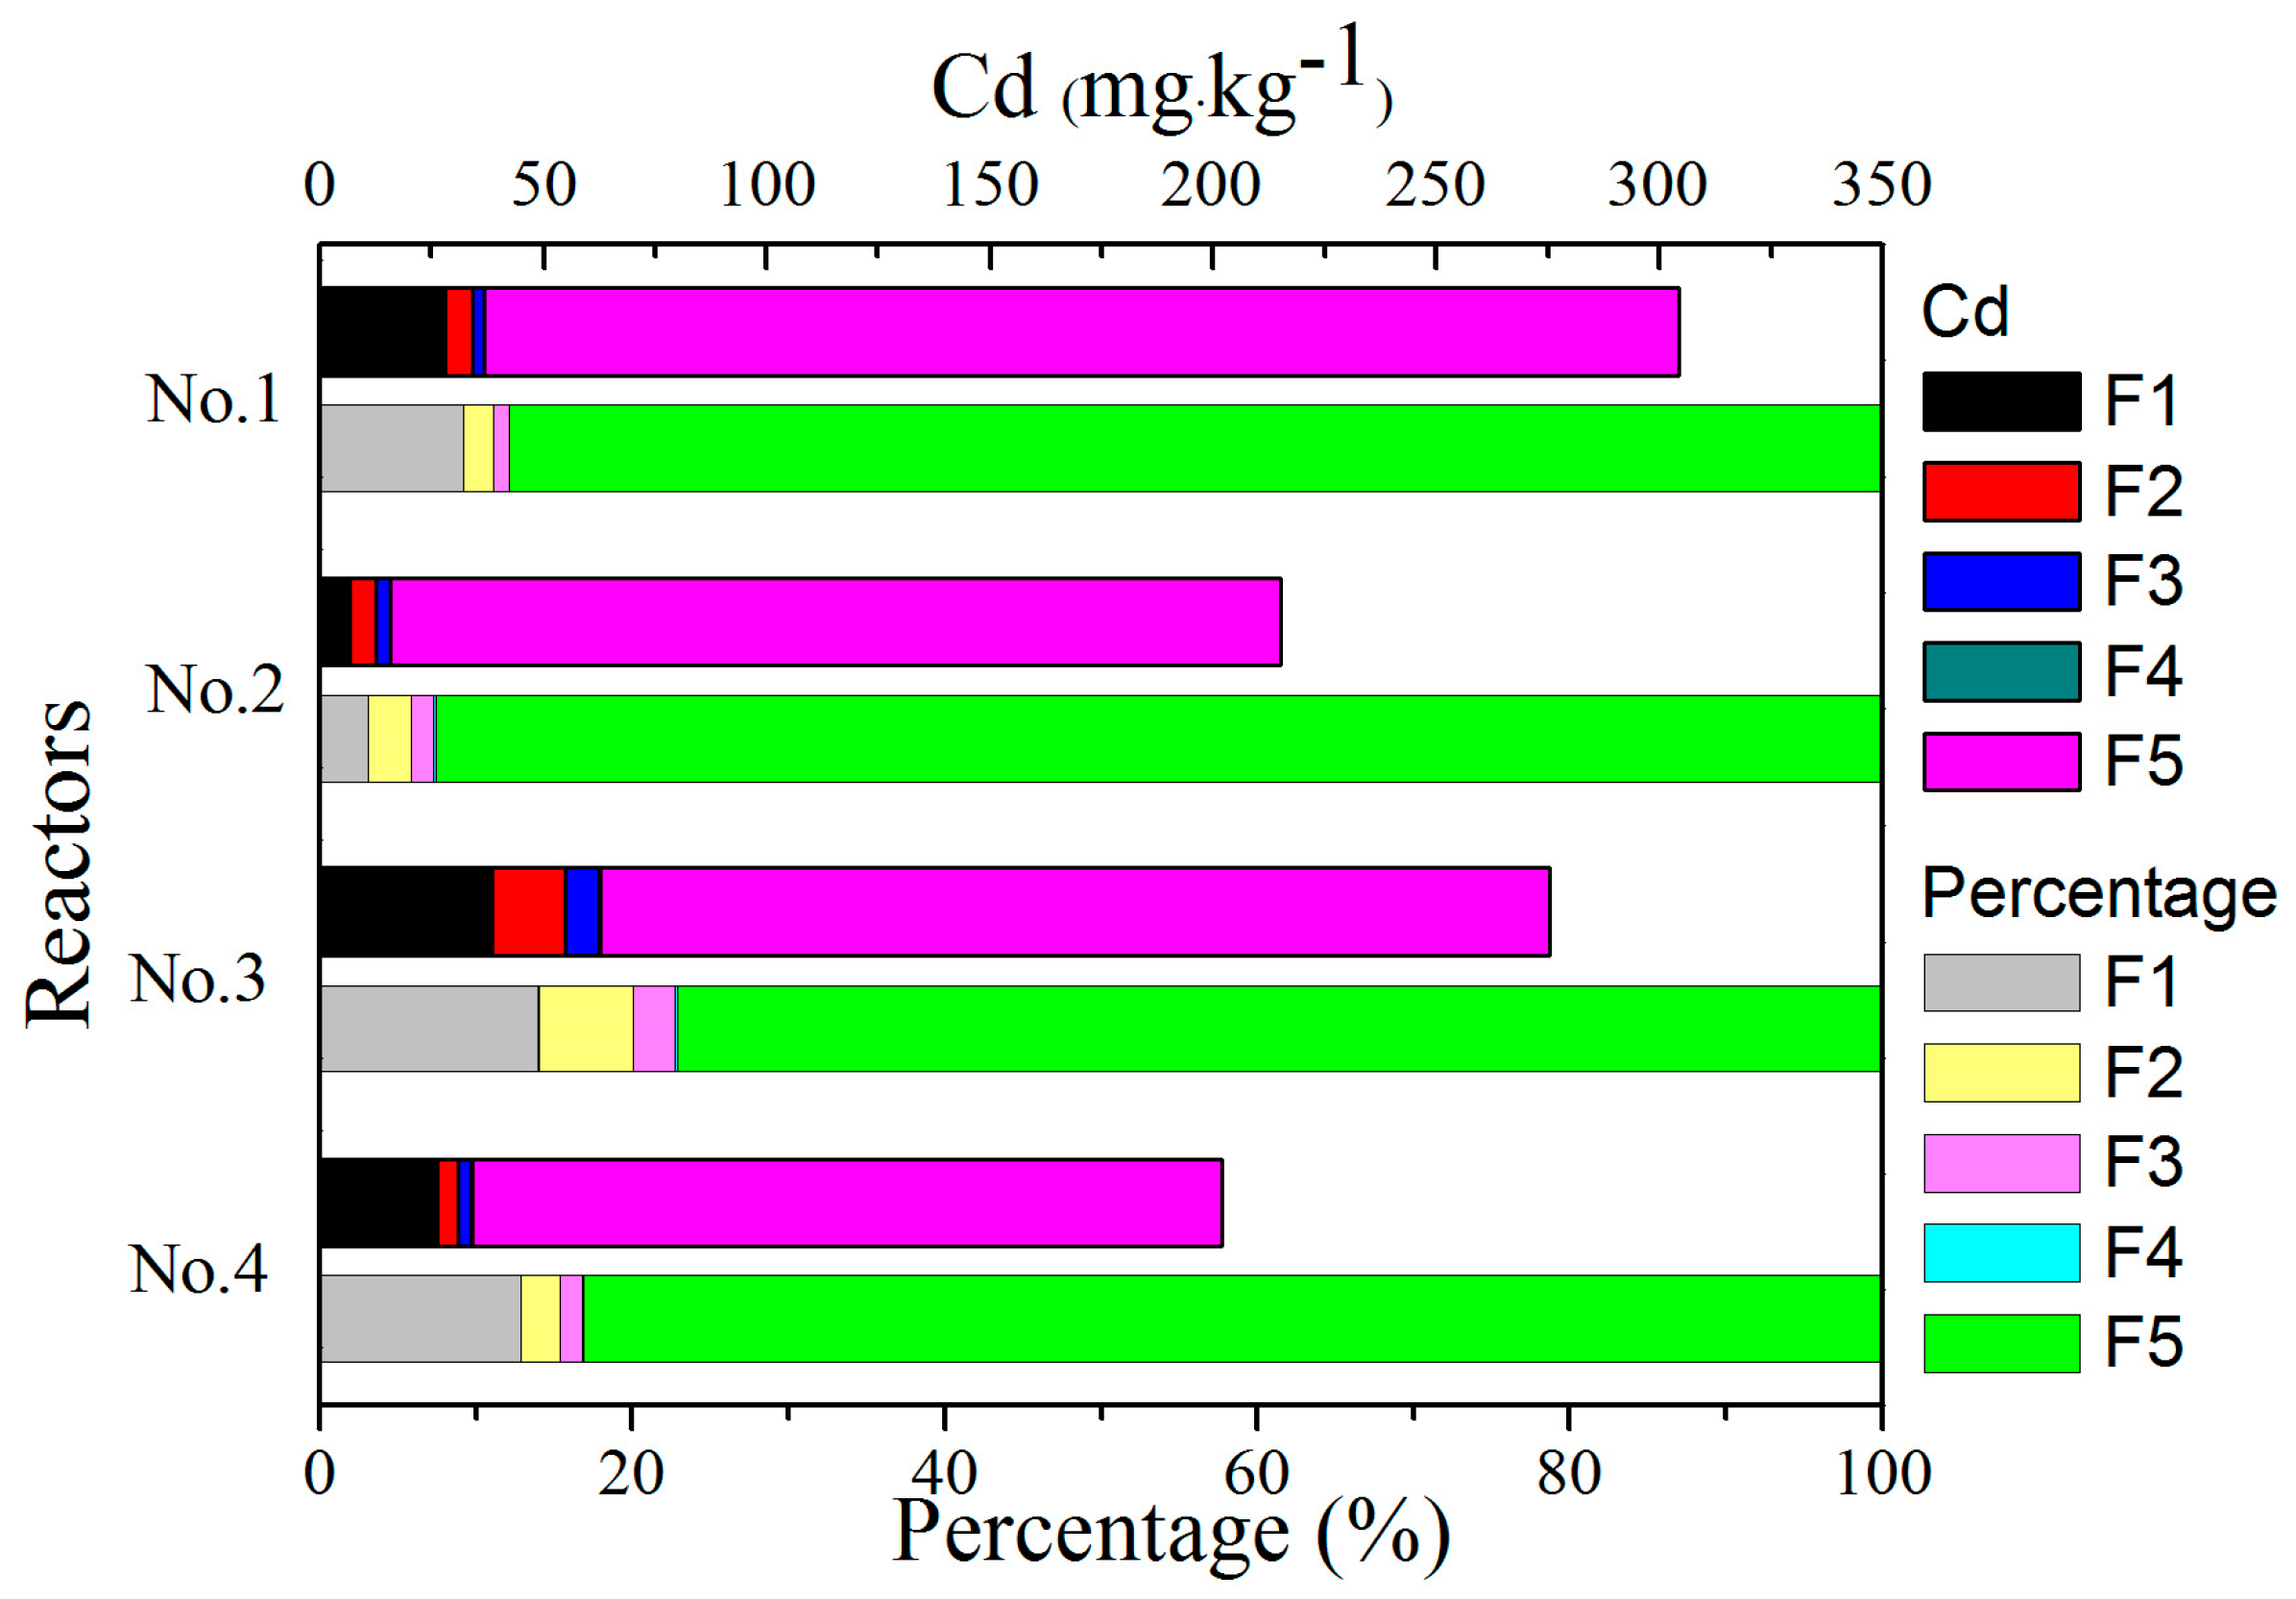
Figure 11.
Lead adsorptions (mg·kg−1) and percentages in different fractions (exchangeable [F1], bound to carbonate [F2], bound to iron and manganese oxides [F3], bound to organic matter [F4], and residual [F5]) at the four bioretention reactors.
Figure 11.
Lead adsorptions (mg·kg−1) and percentages in different fractions (exchangeable [F1], bound to carbonate [F2], bound to iron and manganese oxides [F3], bound to organic matter [F4], and residual [F5]) at the four bioretention reactors.

Table 1.
Heavy metal concentrations (μg·L−1) in surface water (GB3838-2002) and in runoff from four studies.
Table 1.
Heavy metal concentrations (μg·L−1) in surface water (GB3838-2002) and in runoff from four studies.
| Sources | Cu | Pb | Cd | Zn |
|---|---|---|---|---|
| Level I [16] | 10.0 | 10.0 | 1.0 | 50.0 |
| Level II [16] | 1000.0 | 10.0 | 5.0 | 1000.0 |
| Level III [16] | 1000.0 | 50.0 | 50.0 | 1000.0 |
| Beijing [13] 1 | 53.0–987.0 | 56.0–774.0 | 20.0–162.0 | 1421.0–59,855.0 |
| Tianjin [14] 1 | 2.0–19.0 | -- | 1.0–19.0 | -- |
| Nanjing [15] 2 | 8.0–34.0 | 25.0–121.0 | 540.0–2340.0 | 240.0–1030.0 |
| Beijing [17] 3 | 500.0 | 80.0 | 40.0 | 2000.0 |
Note: 1 for runoff from roads, 2 for runoff from different roofs, 3 mean concentration from the first flush of road runoff (no event mean concentration in the study).
Table 2.
Main chemical composition of the bioretention media.
| Media Mix | Main Chemical Composition (%) | ||||||
|---|---|---|---|---|---|---|---|
| CO2 | SiO2 | Al2O3 | CaO | MgO | Fe2O3 | K2O | |
| Sand + lignin | 36.6 | 42.6 | 9.73 | 3.02 | 1.29 | 1.64 | 2.06 |
| Zeolite + lignin | 40.2 | 43.6 | 9.15 | 2.17 | 0.89 | 1.13 | 1.4 |
| Sandy-loam + lignin | 16.5 | 53.2 | 13.1 | 5.87 | 2.57 | 3.69 | 2.47 |
| Quartz-sand+ lignin | 9.32 | 81.7 | 4.15 | 0.78 | 0.44 | 0.86 | 2.18 |
| Planting soil | 43.6 | 34.8 | 10.5 | 1.75 | 1.9 | 2.53 | 1.42 |
Table 3.
The sources of heavy metals and the methods used for their analysis.
| Heavy Metal | Source | Analysis Method | Testing Equipment | Detection Limit (μg·L−1) |
|---|---|---|---|---|
| Cu | CuCl2·2H2O | Graphite furnace-AAS 1 | Hitachi Z-2010 Polarization Zeeman AAS 2 | 1.0 |
| Pb | Pb(NO3)2 | Graphite furnace-AAS | 1.0 | |
| Cd | CdCl2·2.5H2O | Graphite furnace-AAS | 0.2 | |
| Zn | ZnSO4·7H2O | Flame method | 0.1 |
Note: 1 Atomic Absorption Spectroscopy, 2 the equipment is used to analyze all four metals by one of the two analysis methods.
Table 4.
The different inflow concentrations (μg·L−1) of four heavy metals.
| Heavy Metals | Base 1 | Level 1 | Level 2 | Level 3 |
|---|---|---|---|---|
| Cu | 500.0 | 303.6 | 710.0 | 1116.4 |
| Pb | 80.0 | 138.9 | 216.6 | 327.1 |
| Cd | 40.0 | 557.8 | 771.5 | 1017.2 |
| Zn | 2000.0 | 1808.8 | 2457.7 | 3461.8 |
Note: 1 The base synthetic stormwater solution used mean concentrations of heavy metals from the first flush of road runoff in Beijing [17].
Table 5.
Statistical information on the removal efficiencies (%) of heavy metals from the four experimental runs on 11, 18, 24, and 31 May 2014.
Table 5.
Statistical information on the removal efficiencies (%) of heavy metals from the four experimental runs on 11, 18, 24, and 31 May 2014.
| Heavy Metals | Reactor No. 1 (Sand) | Reactor No. 2 (Zeolite) | ||||||
| Cu | Pb | Cd | Zn | Cu | Pb | Cd | Zn | |
| Minimum | 98.0 | 100.0 | 94.1 | 95.7 | 98.2 | 99.1 | 100.0 | 95.1 |
| Maximum | 100.0 | 100.0 | 100.0 | 100.0 | 100.0 | 100.0 | 100.0 | 100.0 |
| Mean 1 | 99.5 ± 1.0 | 100.0 ± 0.0 | 98.4 ± 2.9 | 98.5 ± 2.0 | 99.1 ± 0.9 | 99.8 ± 0.4 | 100.0 ± 0.0 | 98.6 ± 2.4 |
| Reactor No. 3 (Sandy Loam) | Reactor No. 4 (Quartz Sand) | |||||||
| Minimum | 94.6 | 100.0 | 99.5 | 99.2 | 92.3 | 100.0 | 100.0 | 100.0 |
| Maximum | 100.0 | 100.0 | 100.0 | 100.0 | 100.0 | 100.0 | 100.0 | 100.0 |
| Mean 1 | 97.6 ± 2.8 | 100.0 ± 0.0 | 99.8 ± 0.3 | 99.5 ± 0.5 | 97.1 ± 3.3 | 100.0 ± 0.0 | 100.0 ± 0.0 | 100.0 ± 0.0 |
Note: 1 mean plus standard deviation of the four experiments.
© 2017 by the authors. Licensee MDPI, Basel, Switzerland. This article is an open access article distributed under the terms and conditions of the Creative Commons Attribution (CC BY) license (http://creativecommons.org/licenses/by/4.0/).
Share and Cite
MDPI and ACS Style
Wang, J.; Zhao, Y.; Yang, L.; Tu, N.; Xi, G.; Fang, X. Removal of Heavy Metals from Urban Stormwater Runoff Using Bioretention Media Mix. Water 2017, 9, 854. https://doi.org/10.3390/w9110854
AMA Style
Wang J, Zhao Y, Yang L, Tu N, Xi G, Fang X. Removal of Heavy Metals from Urban Stormwater Runoff Using Bioretention Media Mix. Water. 2017; 9(11):854. https://doi.org/10.3390/w9110854
Chicago/Turabian StyleWang, Jianlong, Yuanling Zhao, Liqiong Yang, Nannan Tu, Guangpeng Xi, and Xing Fang. 2017. "Removal of Heavy Metals from Urban Stormwater Runoff Using Bioretention Media Mix" Water 9, no. 11: 854. https://doi.org/10.3390/w9110854
Note that from the first issue of 2016, this journal uses article numbers instead of page numbers. See further details here.