Building Blocks: A Quantitative Approach for Evaluating Coastal Vulnerability


1
Research and Innovation-Maritime, Technology and Environment Hub, Southampton Solent University, Southampton SO14 0YN, UK
2
German Remote Sensing Data Center (DFD), German Aerospace Center (DLR), 82234 Wessling, Germany
3
Key Laboratory of Digital Earth, Institute of Remote Sensing and Digital Earth (RADI), Chinese Academy of Sciences, Beijing 100094, China
4
Department of Geography, S.N. Arts, D.J.M. Commerce & B.N.S. Science College, Sangamner 422605, India
5
Department of Civil and Environmental Engineering, University of Surrey, Thomas Telford Building, Guildford GU2 7XH, UK
*
Author to whom correspondence should be addressed.
Water 2017, 9(12), 905; https://doi.org/10.3390/w9120905
Submission received: 23 August 2017
/
Revised: 28 October 2017
/
Accepted: 6 November 2017
/
Published: 25 November 2017
(This article belongs to the Special Issue Assessment of Current and Future Vulnerability of Flooding with Hydrologic/Hydraulic Modeling and Remote Sensing Techniques)
Abstract
:Climate change and associated factors such as global and regional sea-level rise; the upsurge in high-intensity flooding events; and coastal erosion are pulse and press disturbances that threaten to increase landslides in coastal regions. Under these circumstances; a rigorous framework is required to evaluate coastal vulnerability in order to plan for future climate change scenarios. A vast majority of coastal vulnerability assessments across the globe are evaluated at the macro level (city scale) but not at the micro level (small town scale); particularly in the United Kingdom (UK). In order to fill this vital research gap; the current study established a coastal vulnerability index termed here as the Micro Town Coastal Vulnerability Index (MTCVI) and then applied it to Barton-on-Sea; which is a small coastal town of the Hampshire region; England; UK. MTCVI was evaluated for Barton-on-Sea coastal vulnerability by integrating both novel and existing parameters. Results suggest that the entire shoreline frontage (2 km) exhibits very high coastal vulnerability and is prone to various coastal hazards such as landslides; erosion; and wave intrusion. This suggests that Barton-on-Sea coastal amenities will require a substantial improvement in shoreline protection measures. In this study; GIS (geographic information system) coastal vulnerability and landslide maps were generated; and these maps can be used by the local authorities; district councils; coastal engineers; and planners to improve and design coastal management strategies under the climate change scenarios. Meanwhile; the methodology used in this study could also be applied to any other suitable location in the world depending on the availability of the data.
1. Introduction
Several coastal regions around the world are vulnerable to diverse natural hazards such as floods, landslides, storm surges, and erosion [1,2,3,4,5,6,7,8,9,10] due to climatic variations [11,12]. Predictions highlight that 12% of the global population over the next 50 years will reside in coastal flood risk zones [13,14,15]. The average population density in coastal areas is more than 80 persons per square kilometre, which is double the global average population density [16], and continues to increase [15,17]. McGranahan et al. [14] also suggested that many urbanised coastal zones will require improved drainage, flood risk management, and flood protection arrangements. Global sea levels have risen almost 20 cm since the mid-19th century [18], and these trends are in line with the results reported by Antunes and Taborda [19] and the United Kingdom (UK) climate projections reported by Murphyet al. [20]. In the long-term, an increasing sea level has consequences for both policy and adaptation approaches. The frequency and intensity of storms are predicted to increase with the potential to cause significant damage to coastal infrastructure and potential economic loss [21,22,23,24,25]. Damage costs due to coastal land loss and involuntary migration will be significant, as nearly 150 million people living at locations within 1 m of high tides will have to move [26].
Some coastal regions around the world have been categorised and evaluated using various coastal vulnerability indices [27], which have been developed in recent decades by incorporating various physical, geomorphological, socio-economic, and geological parameters within a myriad of formulations [28,29,30,31,32,33,34,35,36,37,38,39,40]. Vulnerability assessments have now become commonplace in the fields of physical and economic geography, environmental science, and other related research areas, such as climate change, sustainability, and ecology [41]. Initially, coastal vulnerability index (CVI) was developed by Gornitz et al. [28] and then later modified by, again, Gornitz et al. [29] through the addition of new parameters. Subsequently, several scientists have established many CVI methodological frameworks to identify and assess the world’s coastal vulnerability hotspots [14,28,29,34,36,42,43,44,45,46,47]. However, the majority of the coastal vulnerability assessments are evaluated at the macro level (city scale) but not at the micro level (small town scale), particularly in the United Kingdom (UK). To fill this vital research gap, the present study established a coastal vulnerability index named here as the Micro Town Coastal Vulnerability Index (MTCVI) and then applied it to Barton-on-Sea which is a small coastal town of the Hampshire region, England, UK. In addition, GIS (geographic information system) coastal vulnerability and landslide maps were also generated to identify the intensity of vulnerability at a particular coastal stretch.
2. Study Area
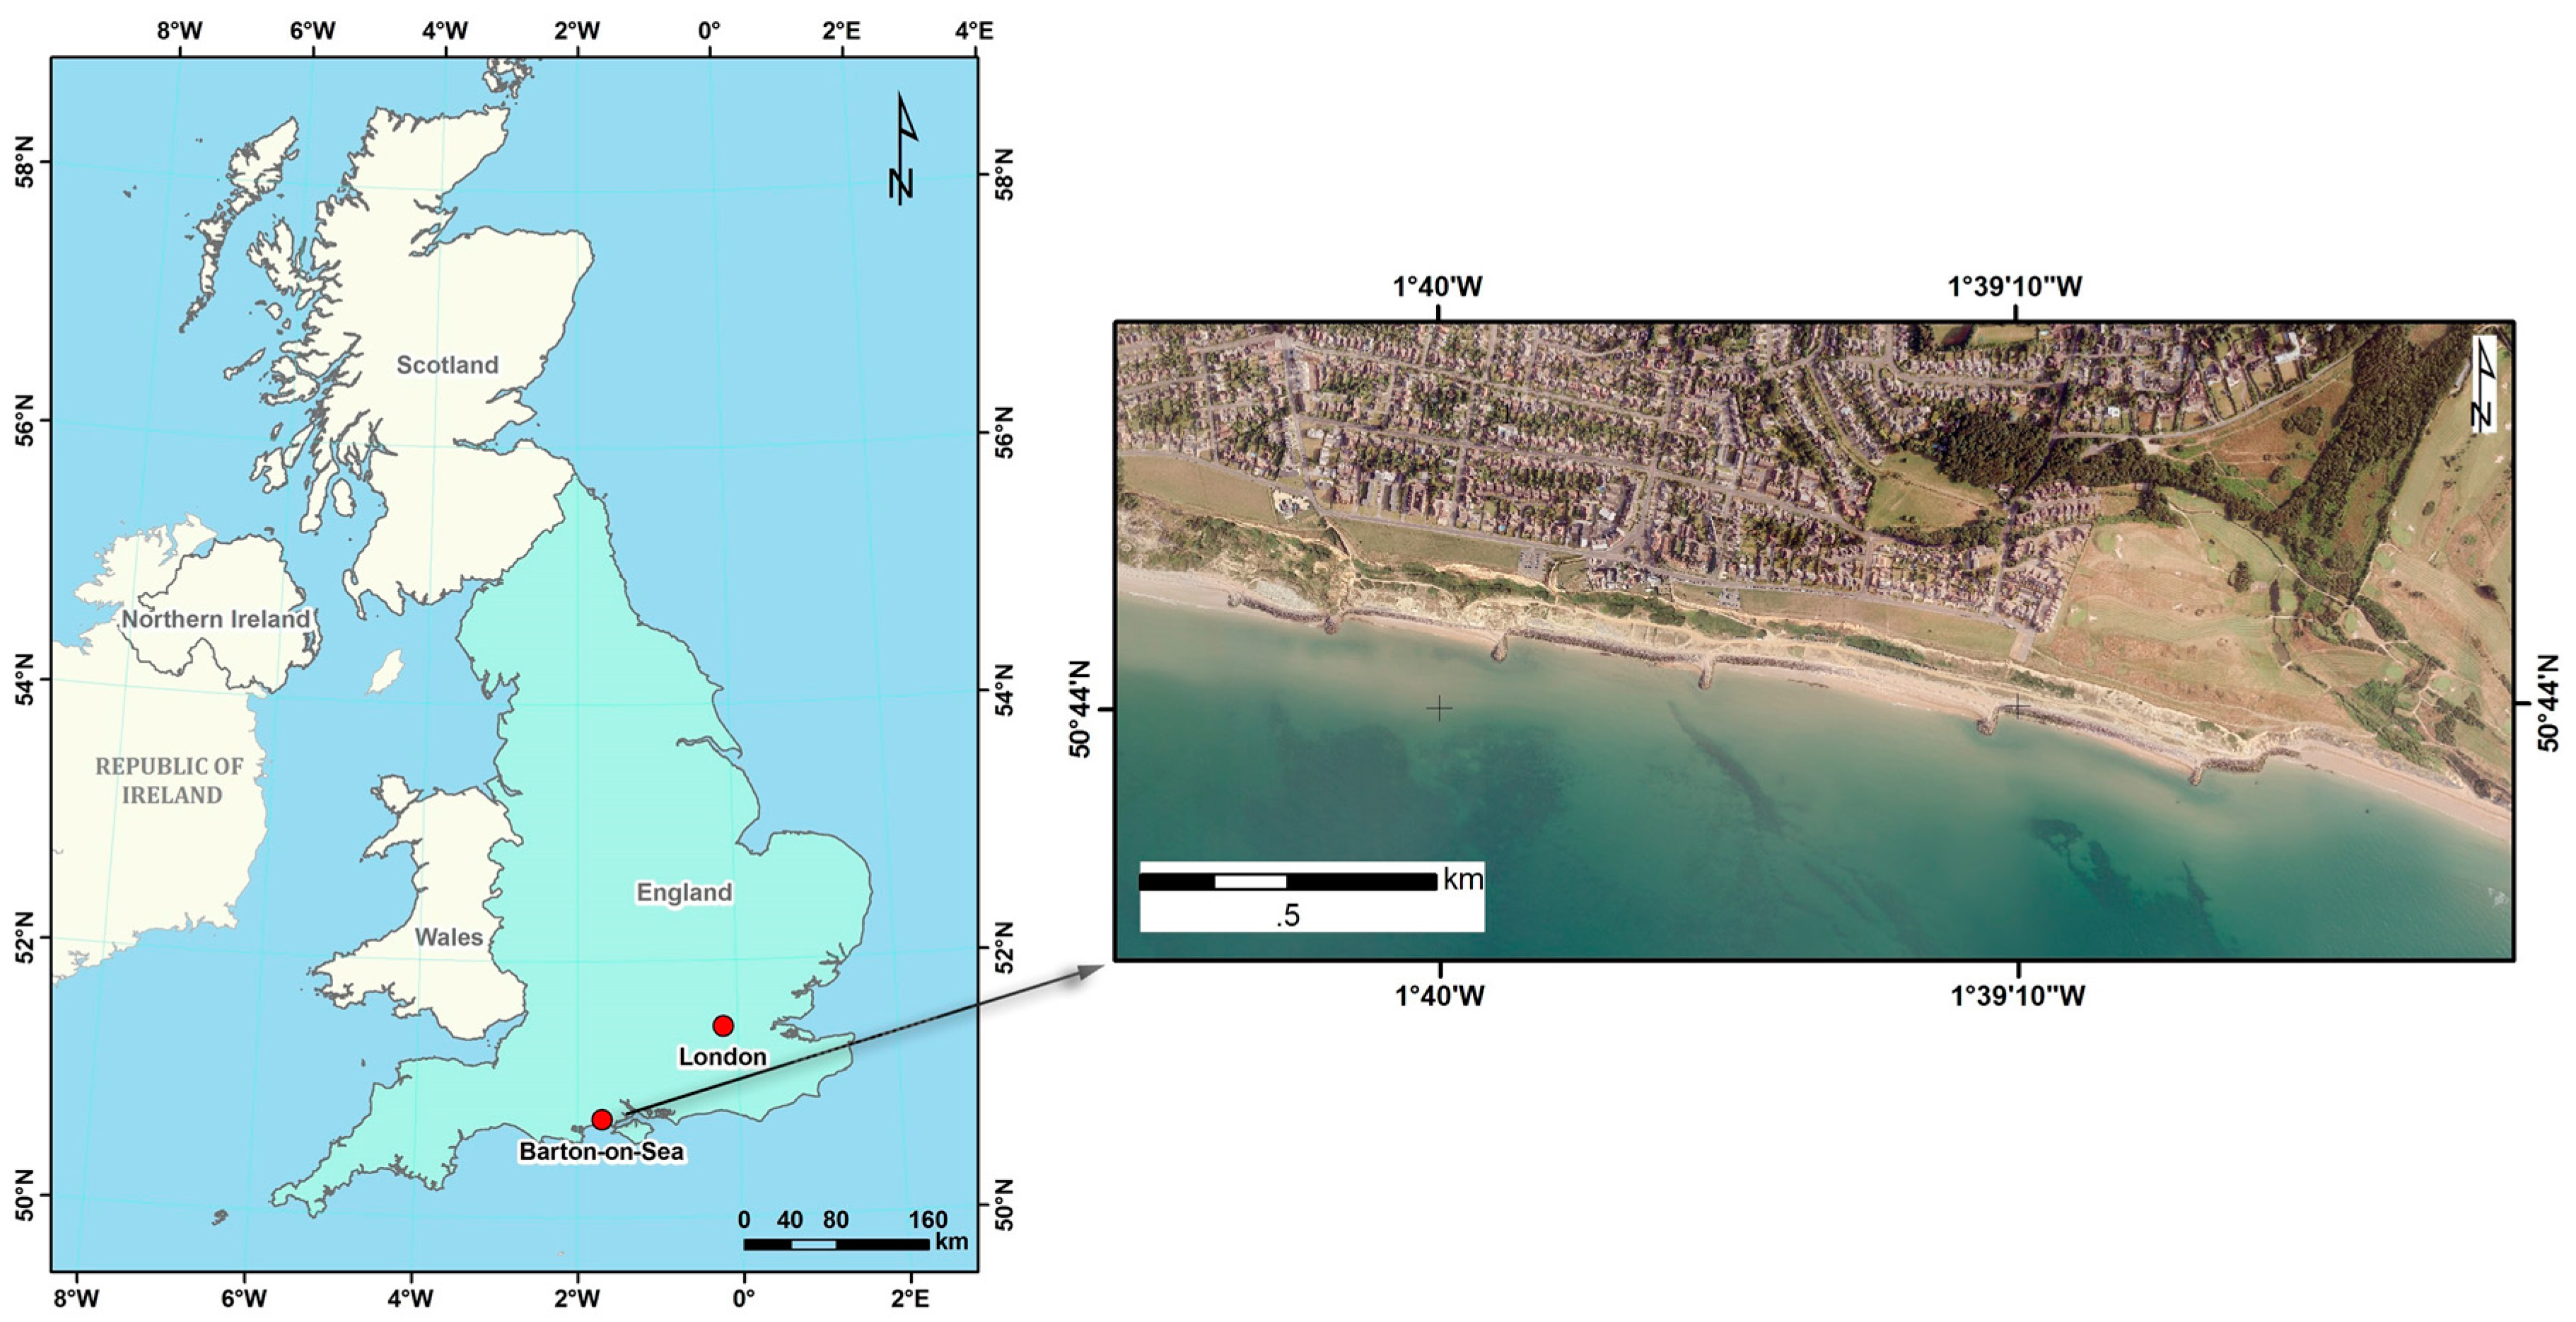
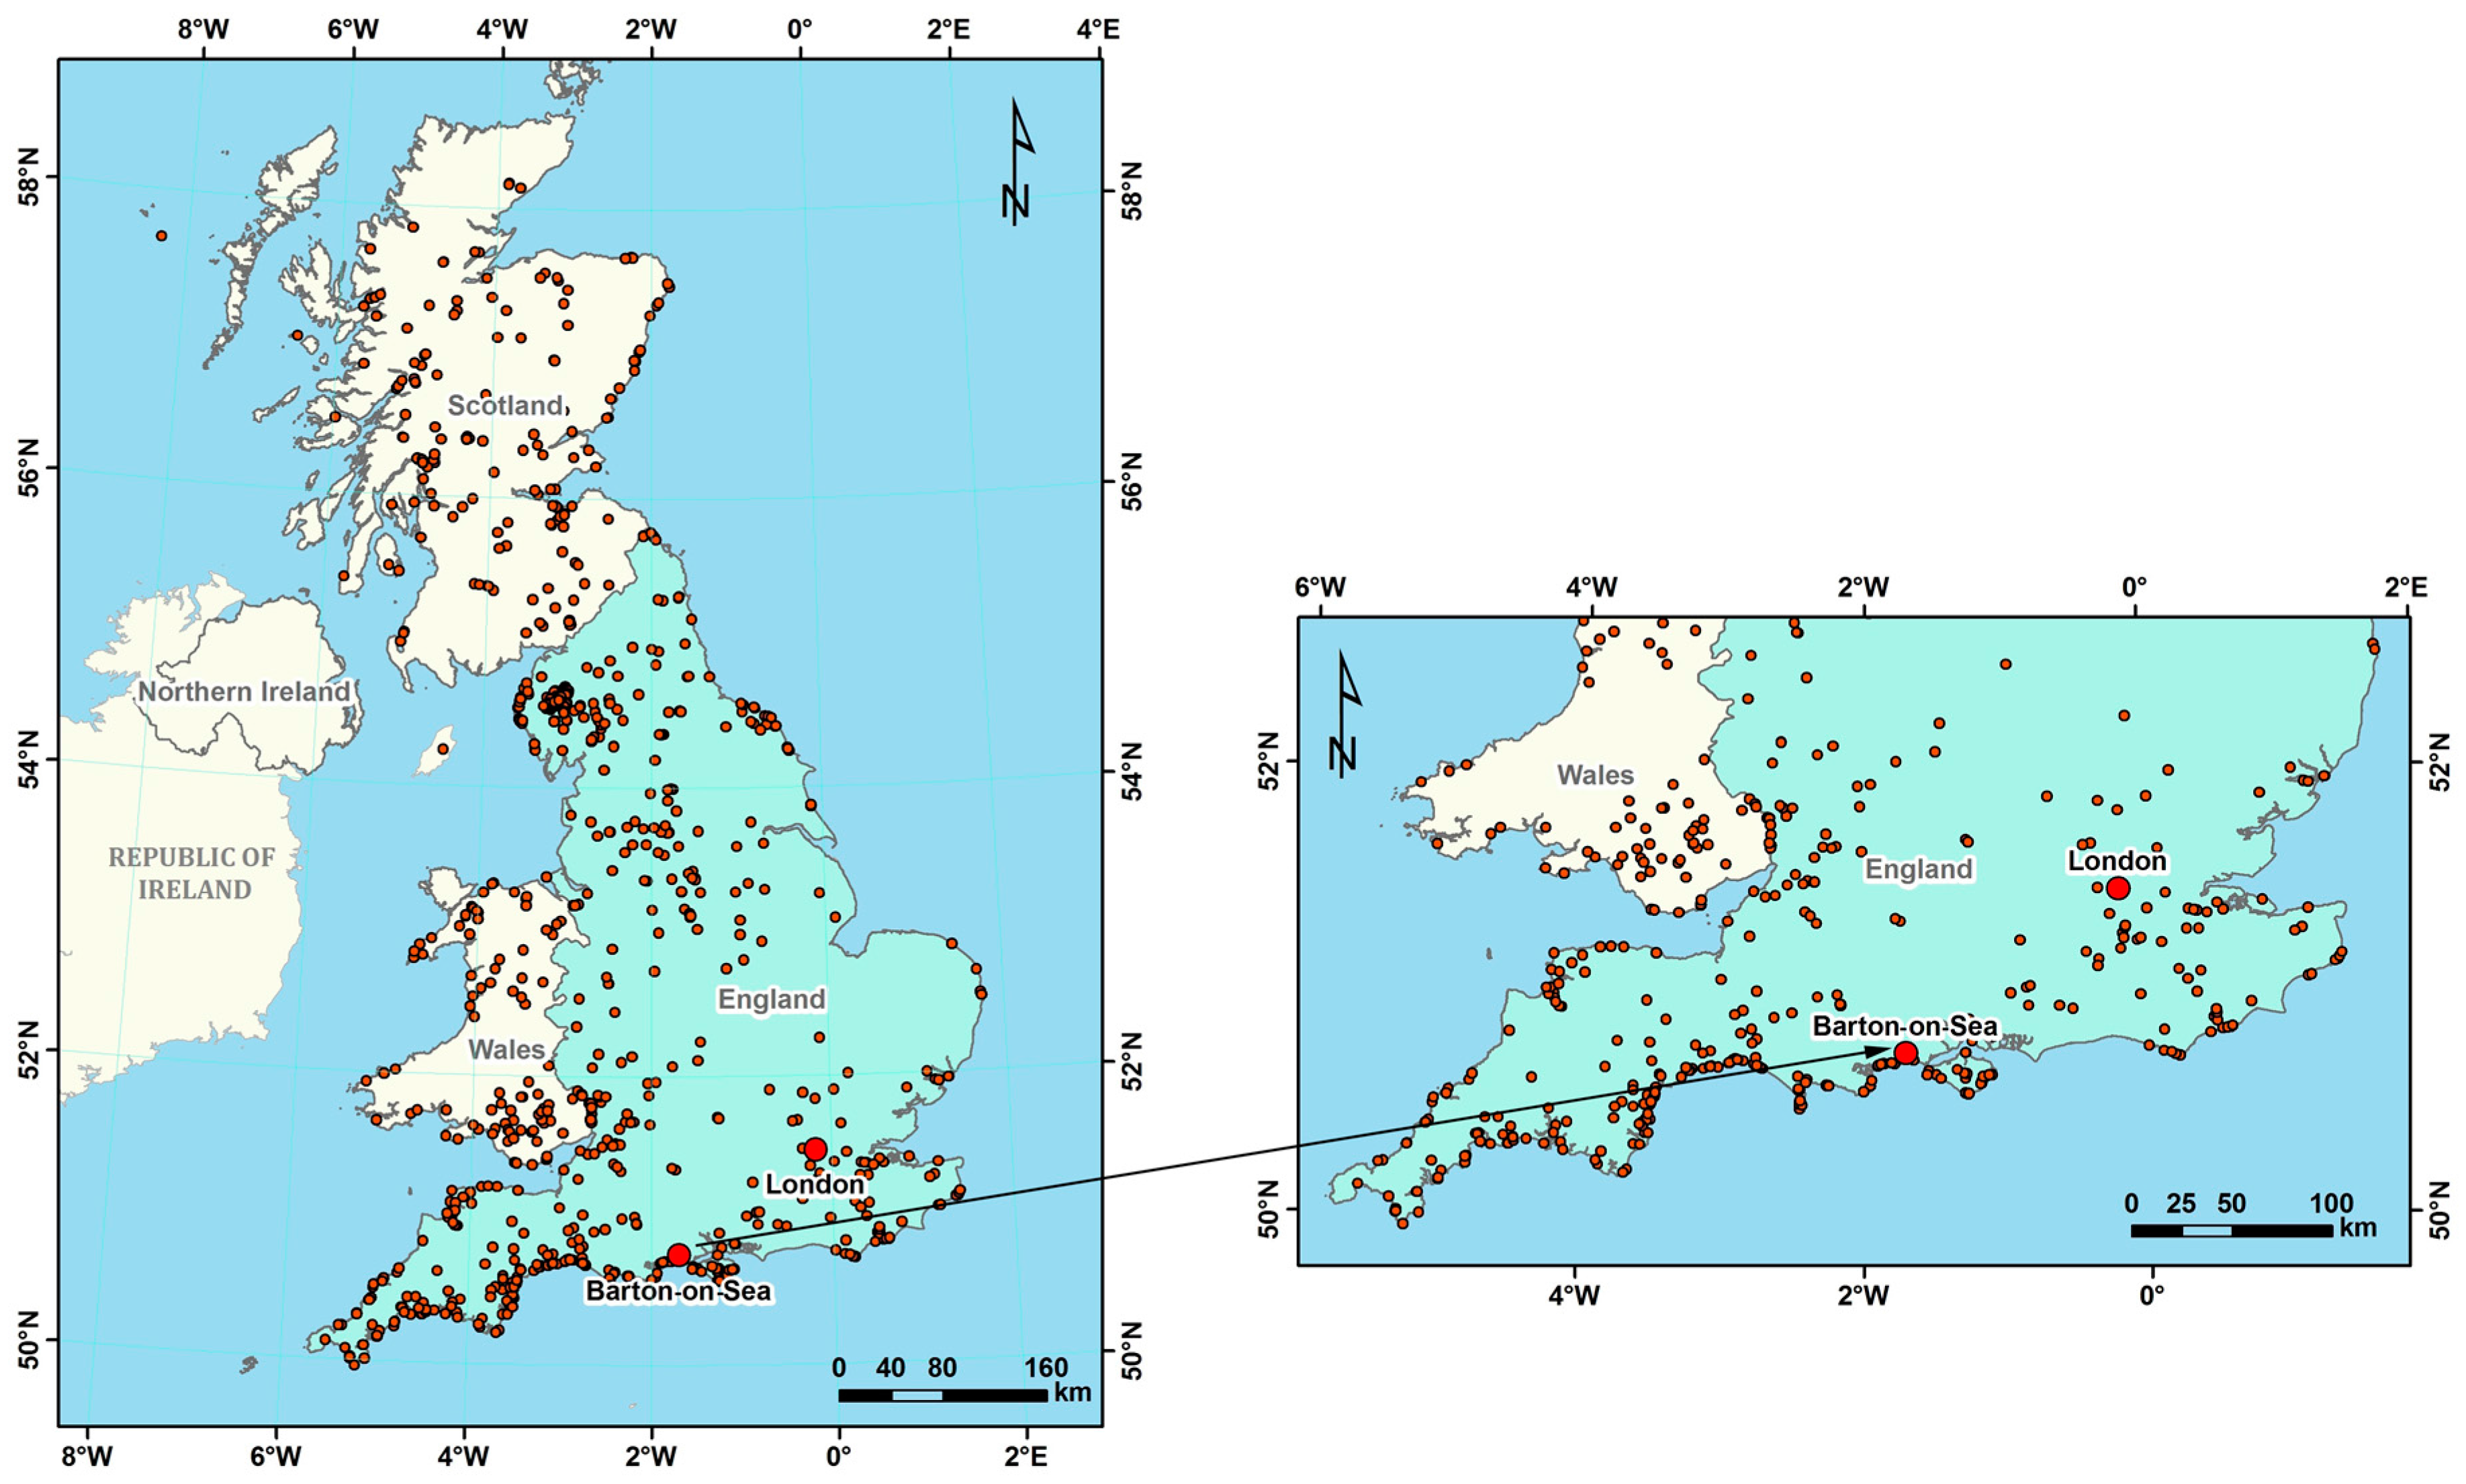
Barton-on-Sea (Latitude 50.7366° N; Longitude 1.6633° W) is a small rural coastal town in Hampshire County, UK, located near to Christchurch Bay on the south coast of England (Figure 1). The population is more than five thousand ONS [48] and contains nearly 2 km of coastline New Forest District Council [49]. Barton-on-Sea is a popular tourist location that generates millions (£) of revenue every year, contributing significantly to the local and national economy. The current study area is categorised by an array of terraced slopes as well as cliffs expanding from a narrow beach to a highland at about 31 m to 33 m [50] and storm surge [51]. The upper cliffs contain nearly vertical slopes varying between 5 m and 10 m in height, while an undercliff is comprised of an array of steep scarps parted by benches between the widths of 5 m and 10 m, and most of the cliffs are characterised by sandy clay Clark [52]. During the storm events, the rainwater does not drain downwards from the cliffs because of the absence of good drainage and low permeability of local geology. This results in adding more weight and an increase in pore water pressure to the cliff region, which causes cliff erosion and landslides. The coastal protection procedures were initially started in 1930 by constructing wooden groynes and revetment [49], but these structures have been severely damaged by intense and repeated storm events. Recently, £4.5 million worth of new coastal protection procedures (rock armour and the planting of vegetation) were implemented to protect the coastal frontage from diverse coastal hazards New Forest District Council [49].
3. Methodology
Several modified versions of geometric and statistical CVI approaches (explained in Section 1) have been developed across the globe in recent decades. These diverse CVI procedures were established to appraise coastal vulnerability at various levels (regional, sub-regional, national, and international), but not at the micro town levels, particularly in the UK. Accordingly, existing methods are not sufficiently suitable to evaluate Barton-on-Sea vulnerability. Consequently, a CVI (i.e., the Micro Town Coastal Vulnerability Index (MTCVI) has been established. A part of Denner et al.’s [34] formulation concept has been adapted for the current study and subsequently modified based upon geomorphological and physical characteristics of the study area. Therefore, new and existing parameters (Table 1) were integrated to evaluate vulnerability, and these methodological adaptations make this study distinctive. Denner et al. [34] evaluated the Loughor Estuary coastline (Wales, UK) vulnerability by applying CVI methodology as well as by implementing five physical parameters including beach width and dune width. They assessed coastal risk by dividing 100 m × 10 m cells along 11 km of the Loughor Estuary coastline and accordingly ranked total relative vulnerability into five groups: very low, low, medium, high, and very high. Their methodological tool identified the intensity of coastal risk at different coastal segments along Loughor Estuary coastline.
Data and Parameters Measurement
As shown in Table 2, data regarding four parameters was collected from diverse organisations. Coastal landslides data was obtained from the British Geological Survey (BGS) and New Milton Town Council for the period of 2000–2016. BGS data was used to estimate UK’s coastal landslides and to generate GIS coastal landslide maps. New Milton Town Council data was used to identify coastal landslide events at Barton for the same period (2000–2016), because Town Council data is regularly updated. The current study also analysed the coastal landslides impact based on the Town Council Data. In addition, opinions of experts and local people were also considered to evaluate the impact of landslides for this particular coastal site. Data of the coastal slope elevation was obtained from National Aeronautics and Space Administration (NASA)-Google Earth Pro—2015. Vegetation behind the back beach and rocky outcrop data was obtained from Channel Coastal Observatory (CCO) aerial maps—2013. Based on these data sets, four parameters were estimated.
Landslide events play a significant role in coastal change coupled with a rising global and regional sea level. Particularly, coastal landslides are the greatest threat to the coastal communities. Coastal landslide activity increases the coastal erosion significantly in the UK and causes £126 million damage on average per year and more than £50 billion worth of residential properties are at risk [53]. Therefore, the current study selected coastal landslide impact as one of the parameters. The parameter was evaluated based on decadal damage and associated issues for the period of 2000–2016. From historical information, it is possible to outline where the most landslide events affected major coastal segments along the coastline. Beach width was measured from the back-beach coordinates to the mean low water level (MLW) mark using GIS and Ordnance Survey maps. Determination of coastal slope provides an indication of relative vulnerability to inundation and the rapidity of shoreline retreat [54]. Therefore, the coastal slope is a very important parameter in coastal vulnerability appraisal studies, and accordingly, for this study, a distance of 100 m was established to backside of beach by using Google Earth Pro. Vegetation and rocky outcrop were measured from Channel Coastal Observatory (CCO) aerial maps by using GIS. A distance of 100 m was chosen to measure the distance of vegetation behind the back of the beach. In areas where foliage did not extend beyond built structures, vegetation was measured to that point. Built structures such as paths, roads, and railways were measured for width and deducted from the total vegetation if there was significant vegetation expanse beyond these structures. Rocky outcrops were measured based upon percentage shoreline coverage within each cell.
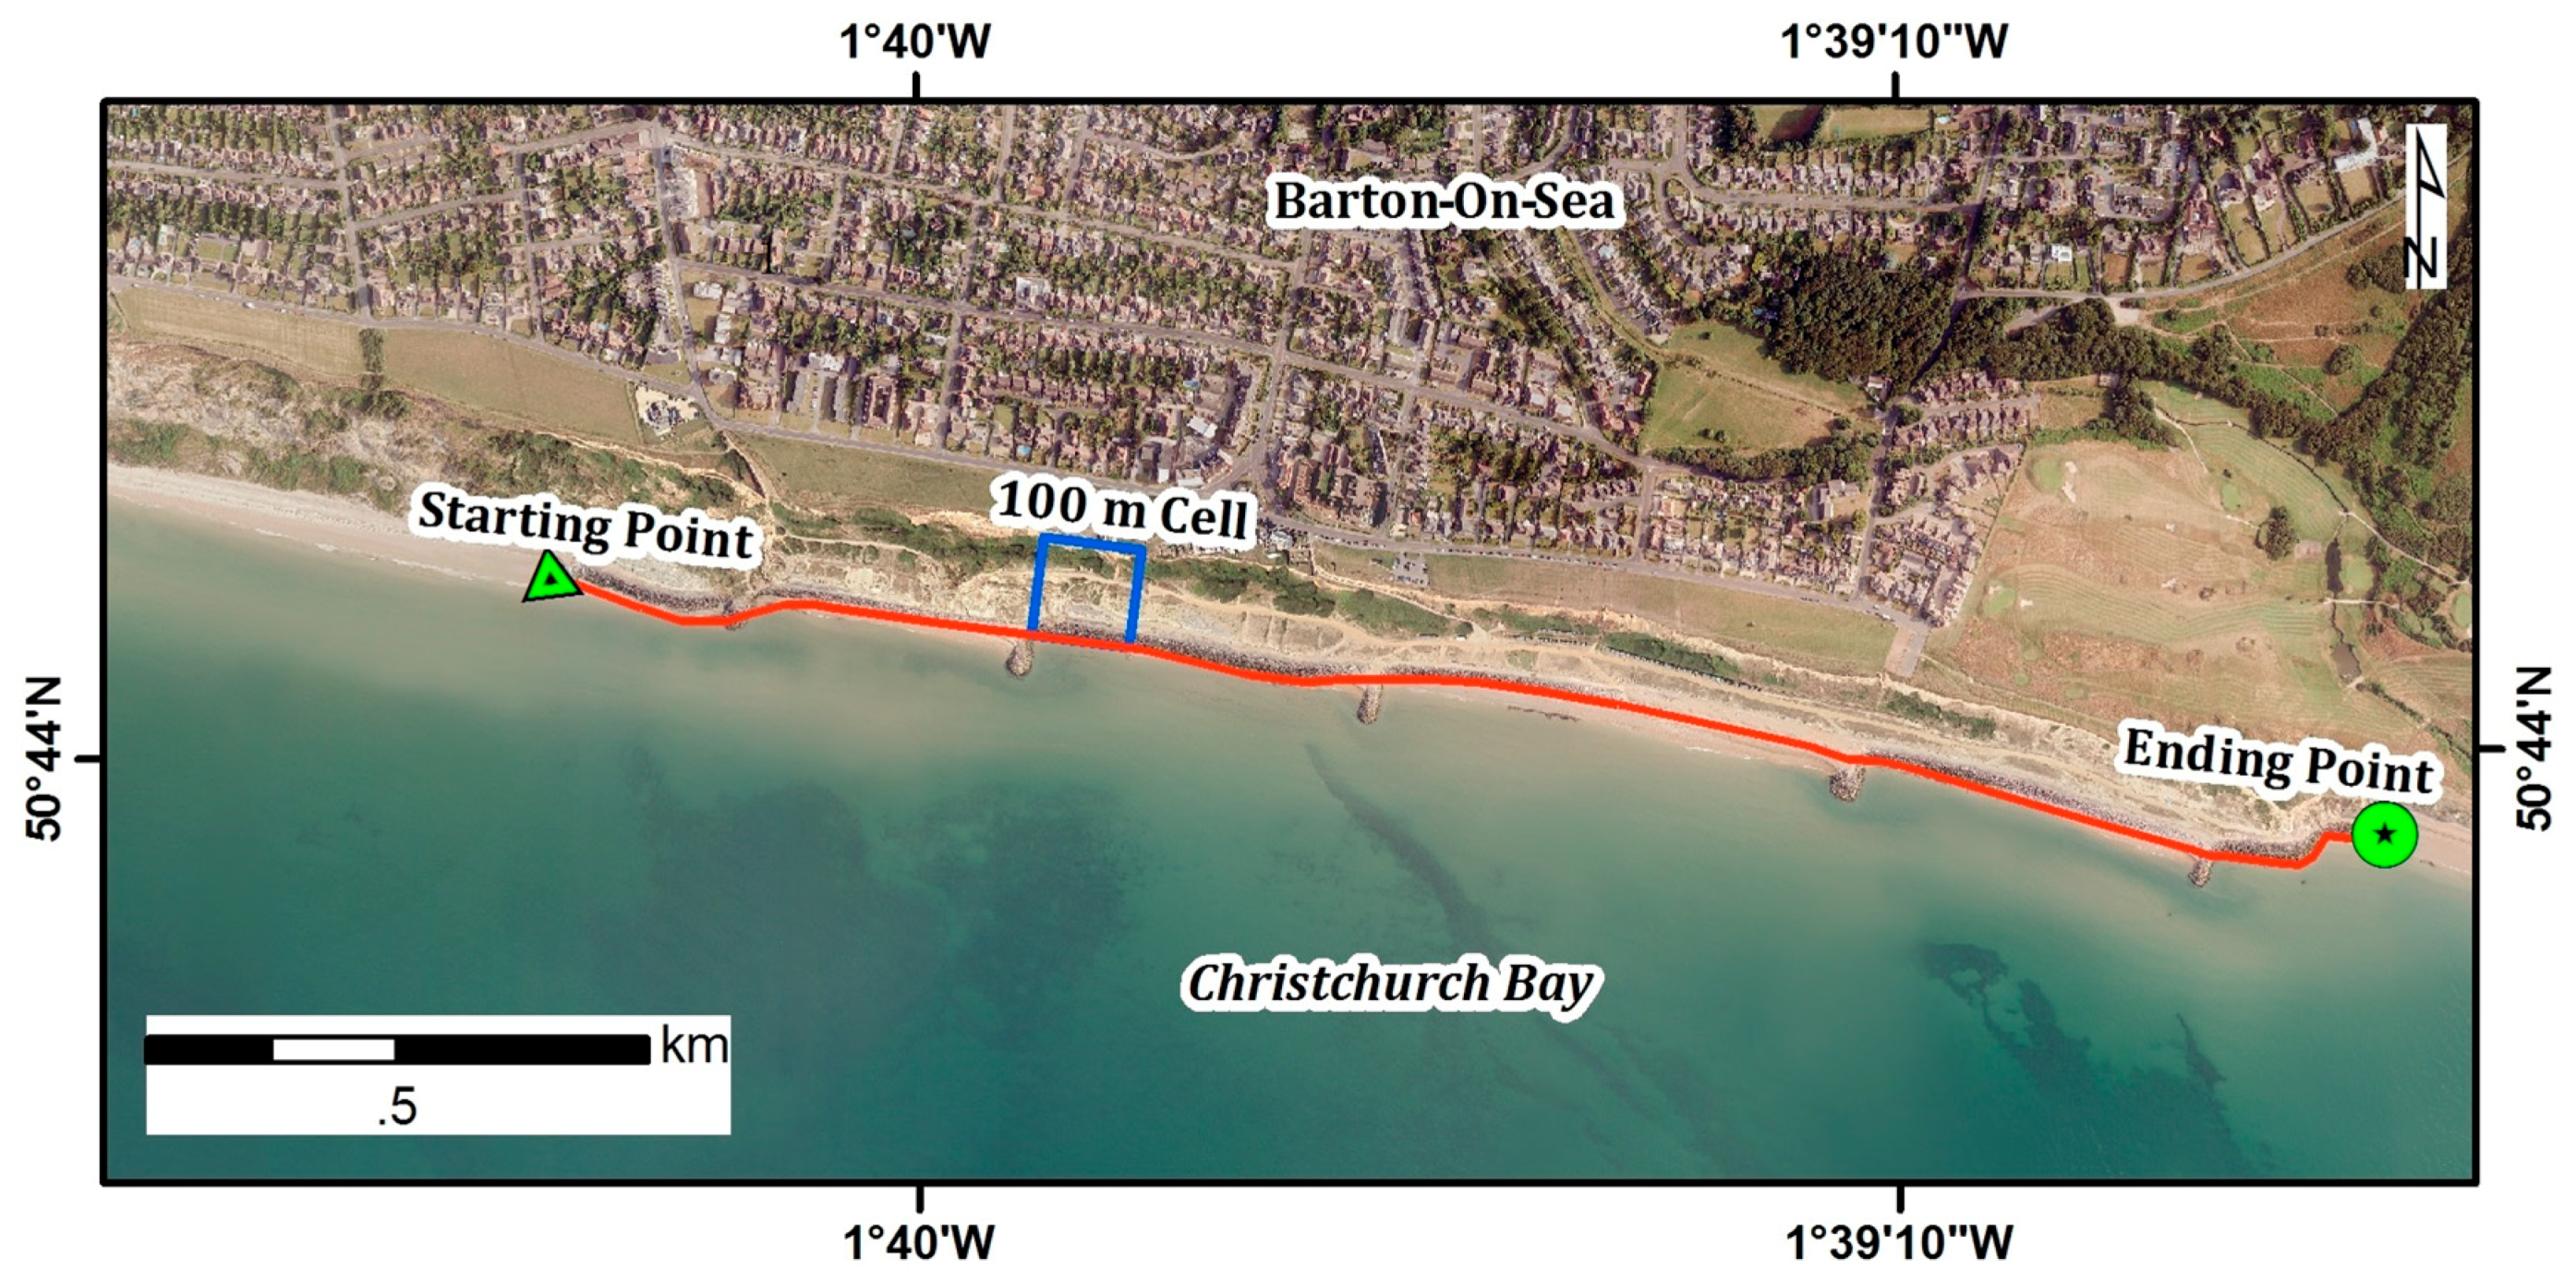
The current study used the four parameters (Table 2) to evaluate the coastal vulnerability of Barton-on-Sea. Accordingly, transect lines were drawn vertically to the coast at 100 m × 100 m cell spacing on 2 km of coastline (Figure 2). In line with Denner et al. [34], the back beach was used as a proxy baseline; measurements extended to a line drawn 100 m inland nearly parallel to the baseline and as far as mean low water in a seaward direction. Consequently, in-depth measurements based on each and every parameter were recorded along each transect.
Table 3 details the thresholds for each parameter and assigns a ranking score between 1 and 4. This is after allocation of a numerical value for each and every single coastal cell of assessed coastline based upon the specific parameters. Then, the MTCVI was developed by allocating CVI scores in between one and four. Each and every measurement was compared with Table 3 and assigned a ranking score between low (1) and very high (4) to evaluate vulnerability. Later, these values were summed up for each coastal cell to offer relative CVI scores using the following equation:
where
MTCVI = a + b + c + d
- a = coastal landslides impact
- b = coastal slope
- c = distance of vegetation behind the back beach
- d = rocky outcrop.
The MTCVI value ranges between a minimum value of 4 (if all parameters score the lowest score) and a maximum of 16 (if all parameters score the highest score) as presented in Table 4. These scores were further given ratings in order to categorise the level of MTCVI for Barton-on-Sea.
4. Results
4.1. Coastal Landslides Impact
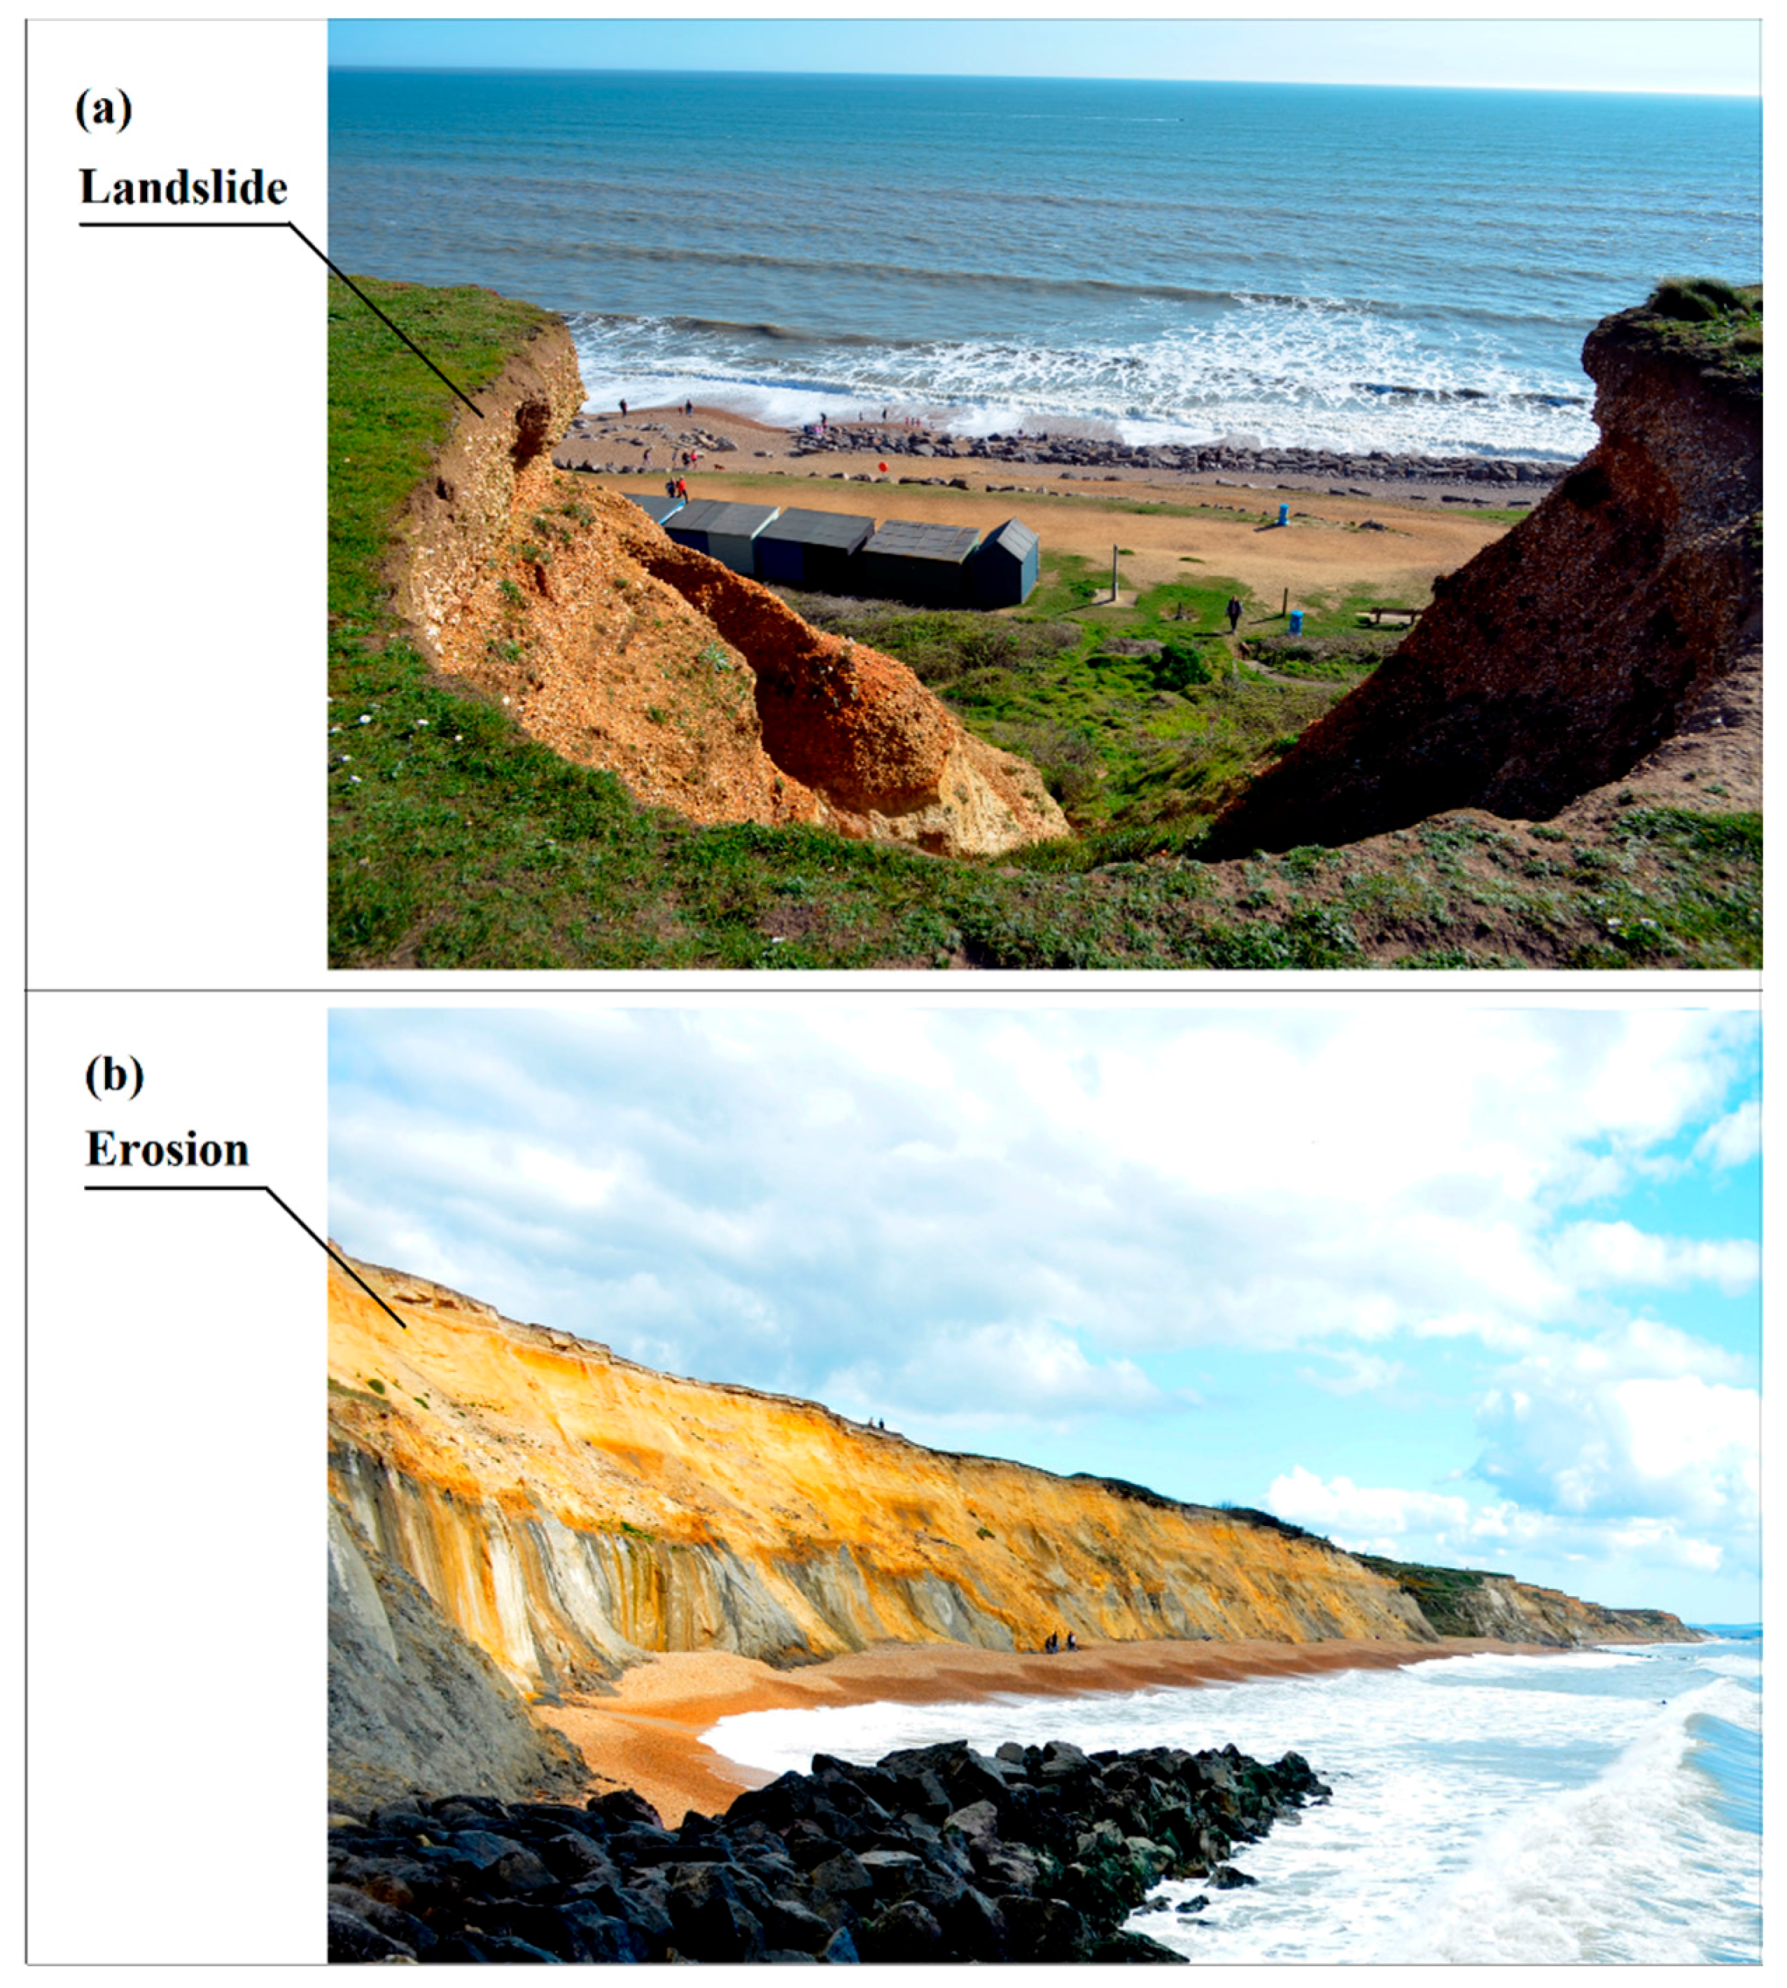
Overall, seven coastal landslide events were recorded for the period of 2000–2016, and these hazards are always in an active state and record ongoing mass movement in this vulnerable coastal site (Figure 3). These movements can cause severe damage to the coast and coastal infrastructure at anytime, particularly apparent from the 2007, 2009, and 2012 landslide events. However, accurate prediction of coastal landslides in this area is not an easy process because of diverse hydro-geological characteristics and, therefore, the Barton-on-Sea coastline always records the active mass movements. Accordingly, analysis confirmed that the coastal landslides impact is very high along the coastline of Barton-on-Sea.
4.2. Parameters Measurement Analysis
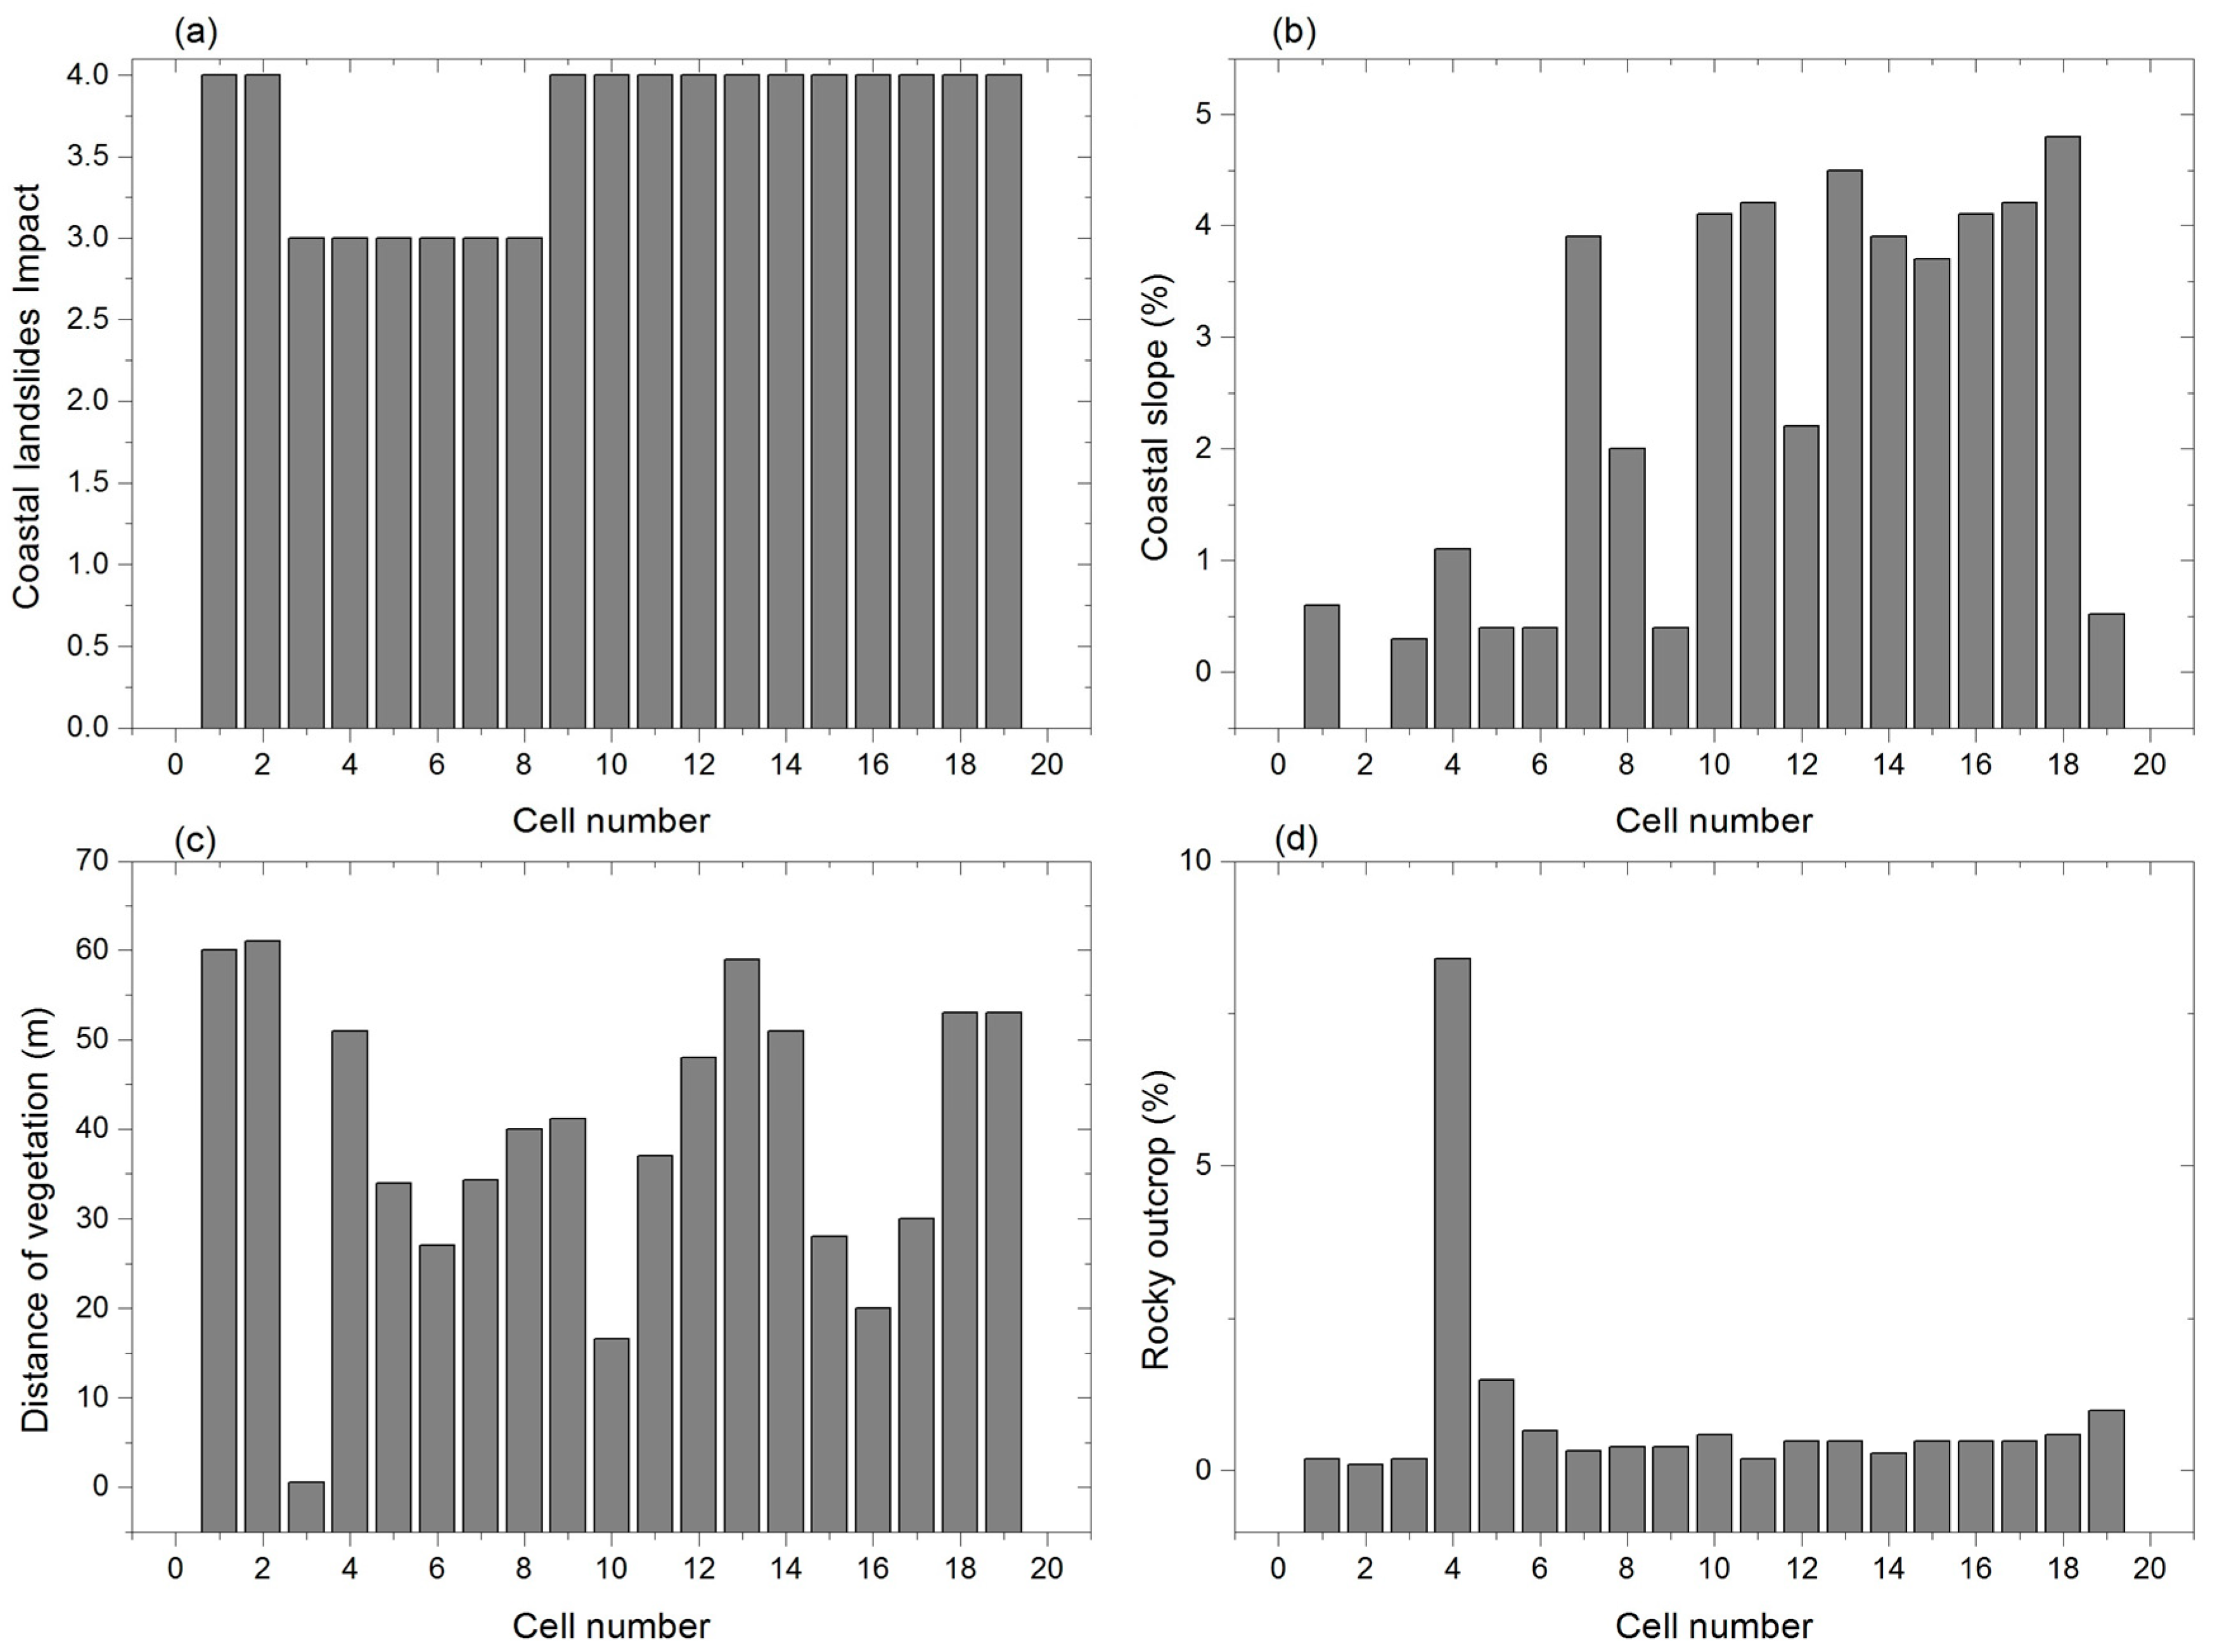
Figure 4 shows significant variations in the four parameters for the 19 cells investigated in this study. Coastal landslides impact scored very high for 13 cells (65%) and the rest of the 6 cells (32%) scored a high impact (Figure 4a). Considerable variance existed for coastal slope; the maximum value was 4.8%, recorded at the eighteenth cell, and the lowest was 0.3%, recorded at the third cell, with the average of 2.3% (Figure 4b). The distance of vegetation behind the back beach also showed variations in the minimum and maximum values, which were 0.5 m and 61 m, scored at the third and second cells, respectively, and the average value of distance of vegetation was 39 m (Figure 4c). There was a considerable variation exhibited among the 19 coastal cells for rocky outcrop. The maximum was 5.4%, recorded at the fourth cell, and the minimum was 0.1%, scored at the second cell (Figure 4d). The average rocky outcrop value was 0.9, and 100% of the cells fell into the very high vulnerability category.
4.3. MTCVI Analysis
As shown in Figure 5, a considerable variance exists for nineteen cells. The average MTCVI score for coastal landslide impact was 3.6, and the highest was 4, recorded for 13 cells (69%). The lowest score was 3, and 6 cells (31%) recorded this value. These MTCVI scores indicate that a majority of the coastal cells for coastal hazards impact have a very high vulnerability (Figure 5a). For coastal slope, the average CVI score was 3.5, and the highest score was 4, recorded at 14 cells (69%), while the minimum was 2 recorded at the twelfth cell. The CVI scores for the coastal slope reflect very high vulnerability at the majority of the survey areas with some site-specific variations (Figure 5b). No variance exists between the CVI values for the distance of vegetation behind the back beach. The average, maximum, and minimum CVI score was 4. The CVI scores for this parameter explicitly specified that Barton-on-Sea has the highest vulnerability in the subject of vegetation (Figure 5c). No difference exists for the nineteen cells for rocky outcrop. The average, maximum, and minimum CVI score was 4, that indicates very high coastal vulnerability. The CVI scores for rocky outcrop suggest that Barton-on-Sea requires more robust coastal protection procedures (Figure 5d).
4.4. Aggregated MTCVI Scores and Their Distribution
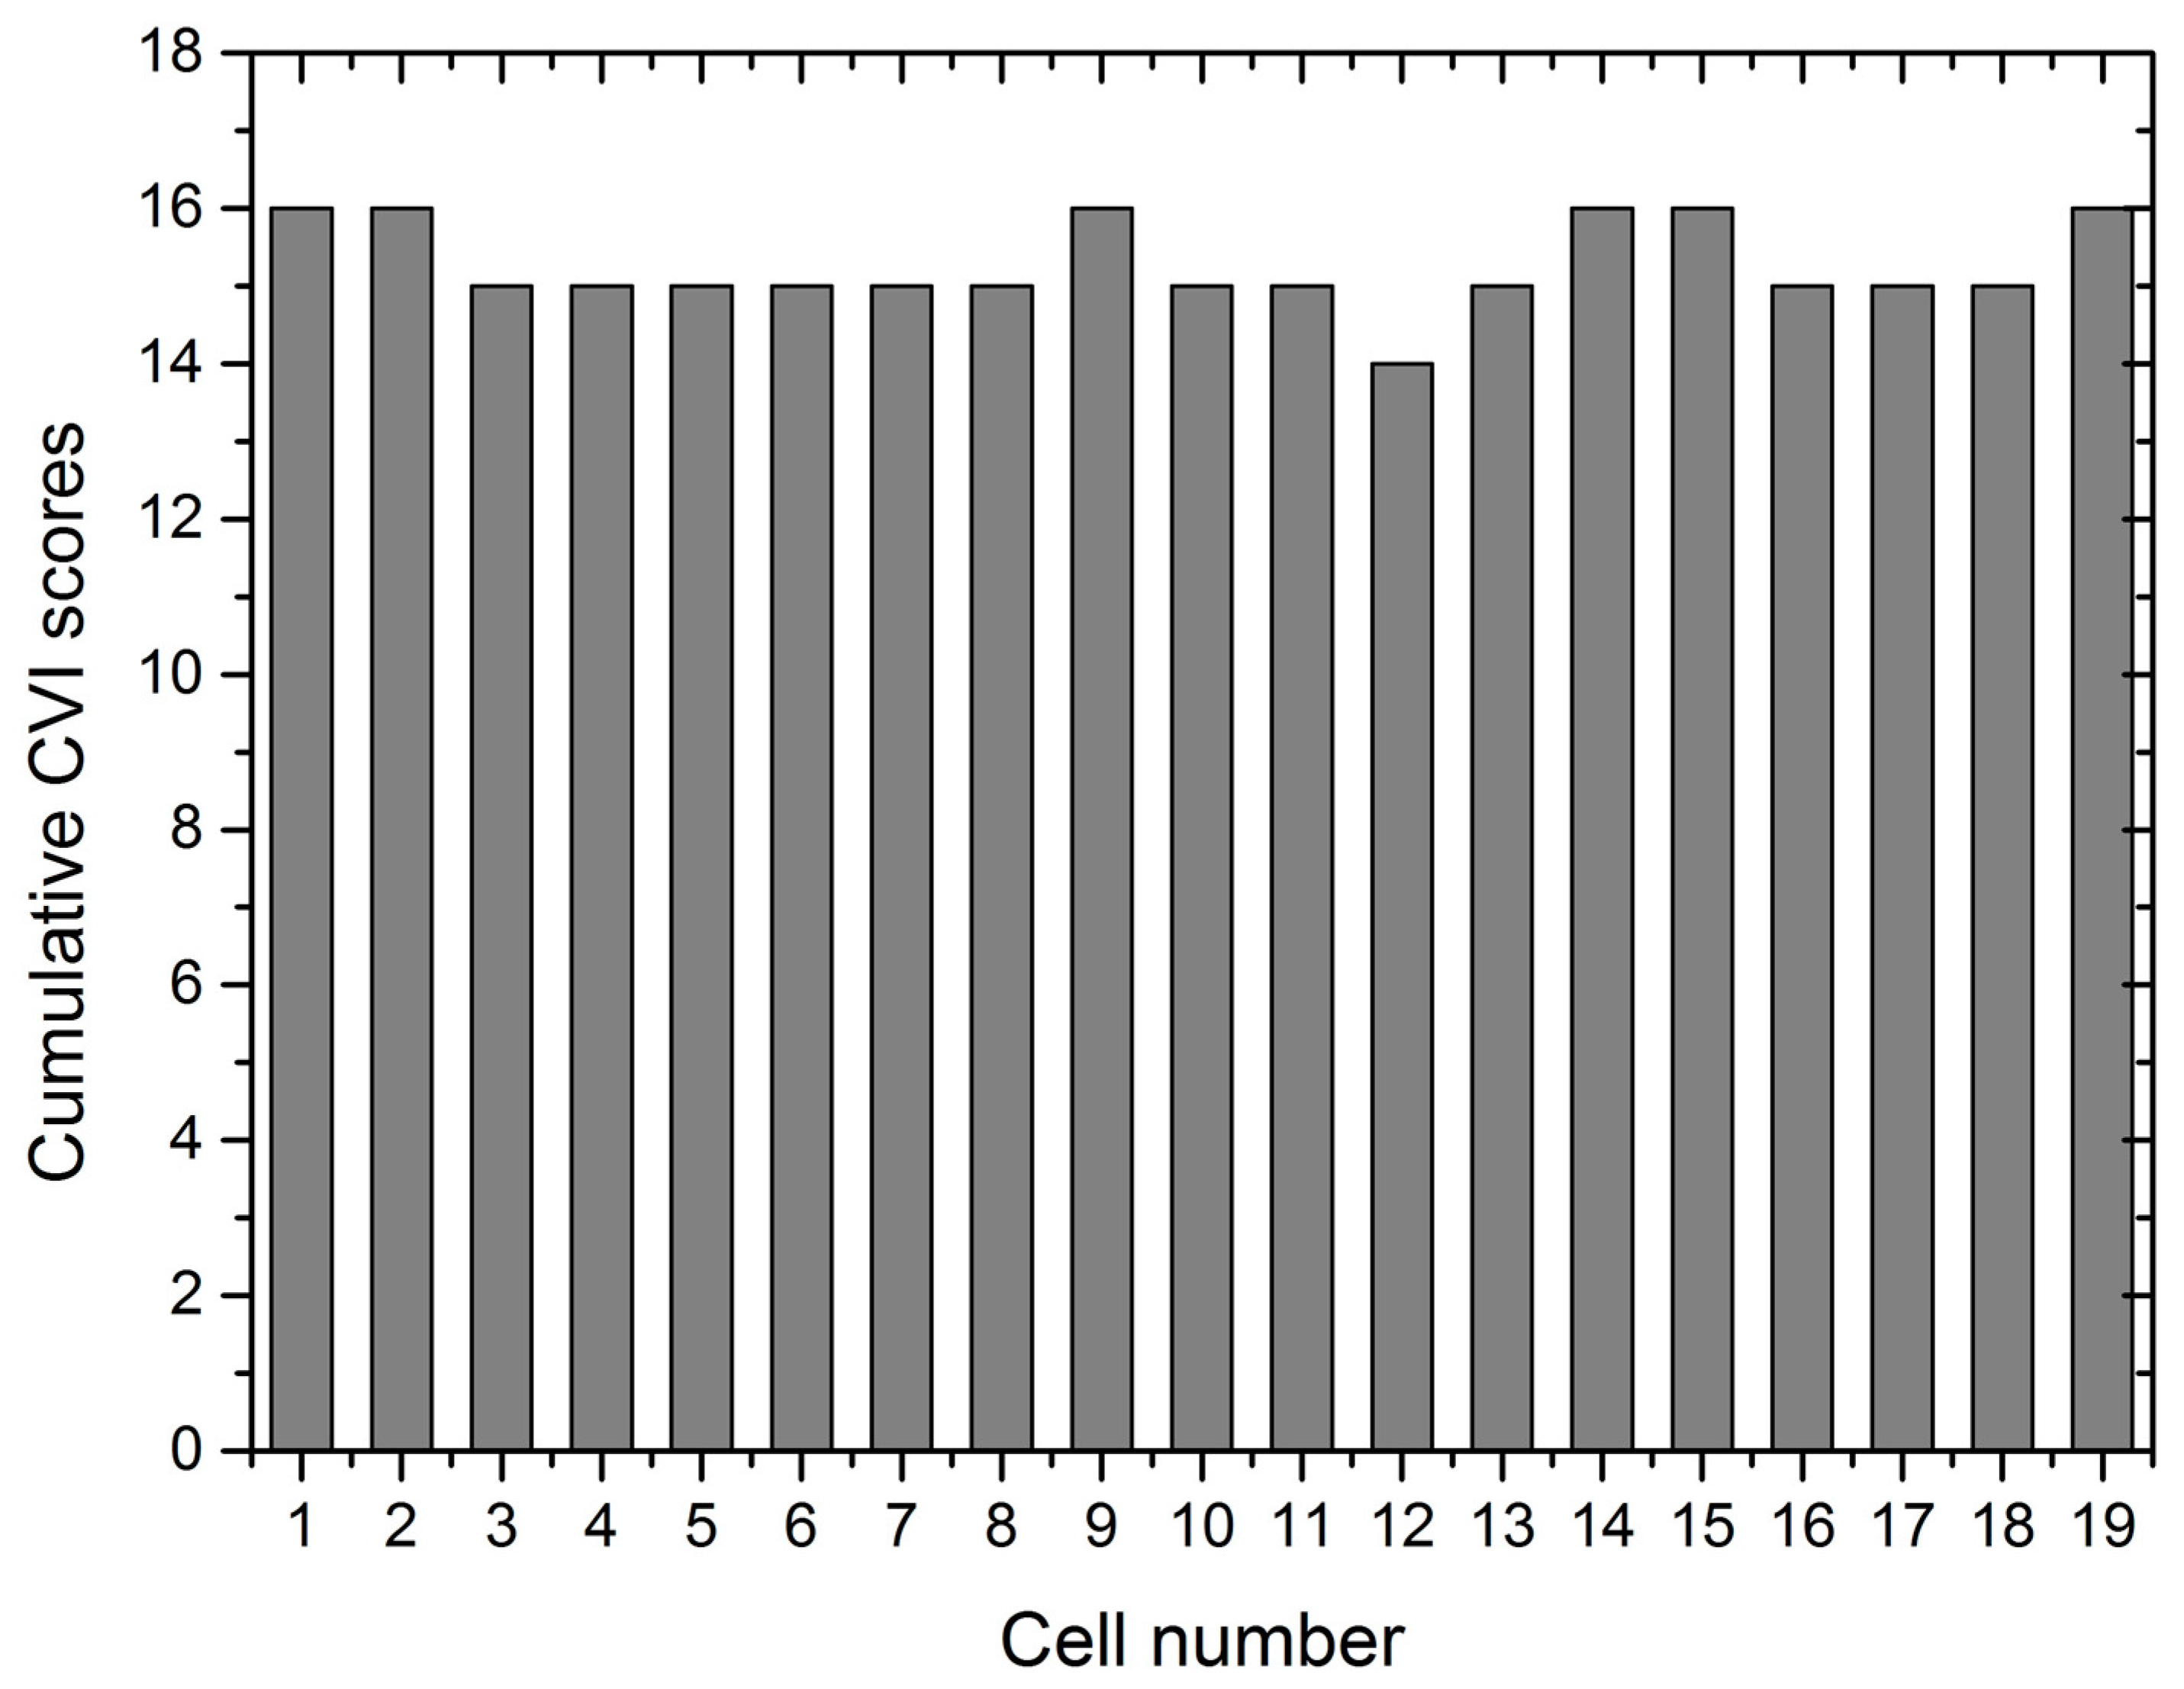
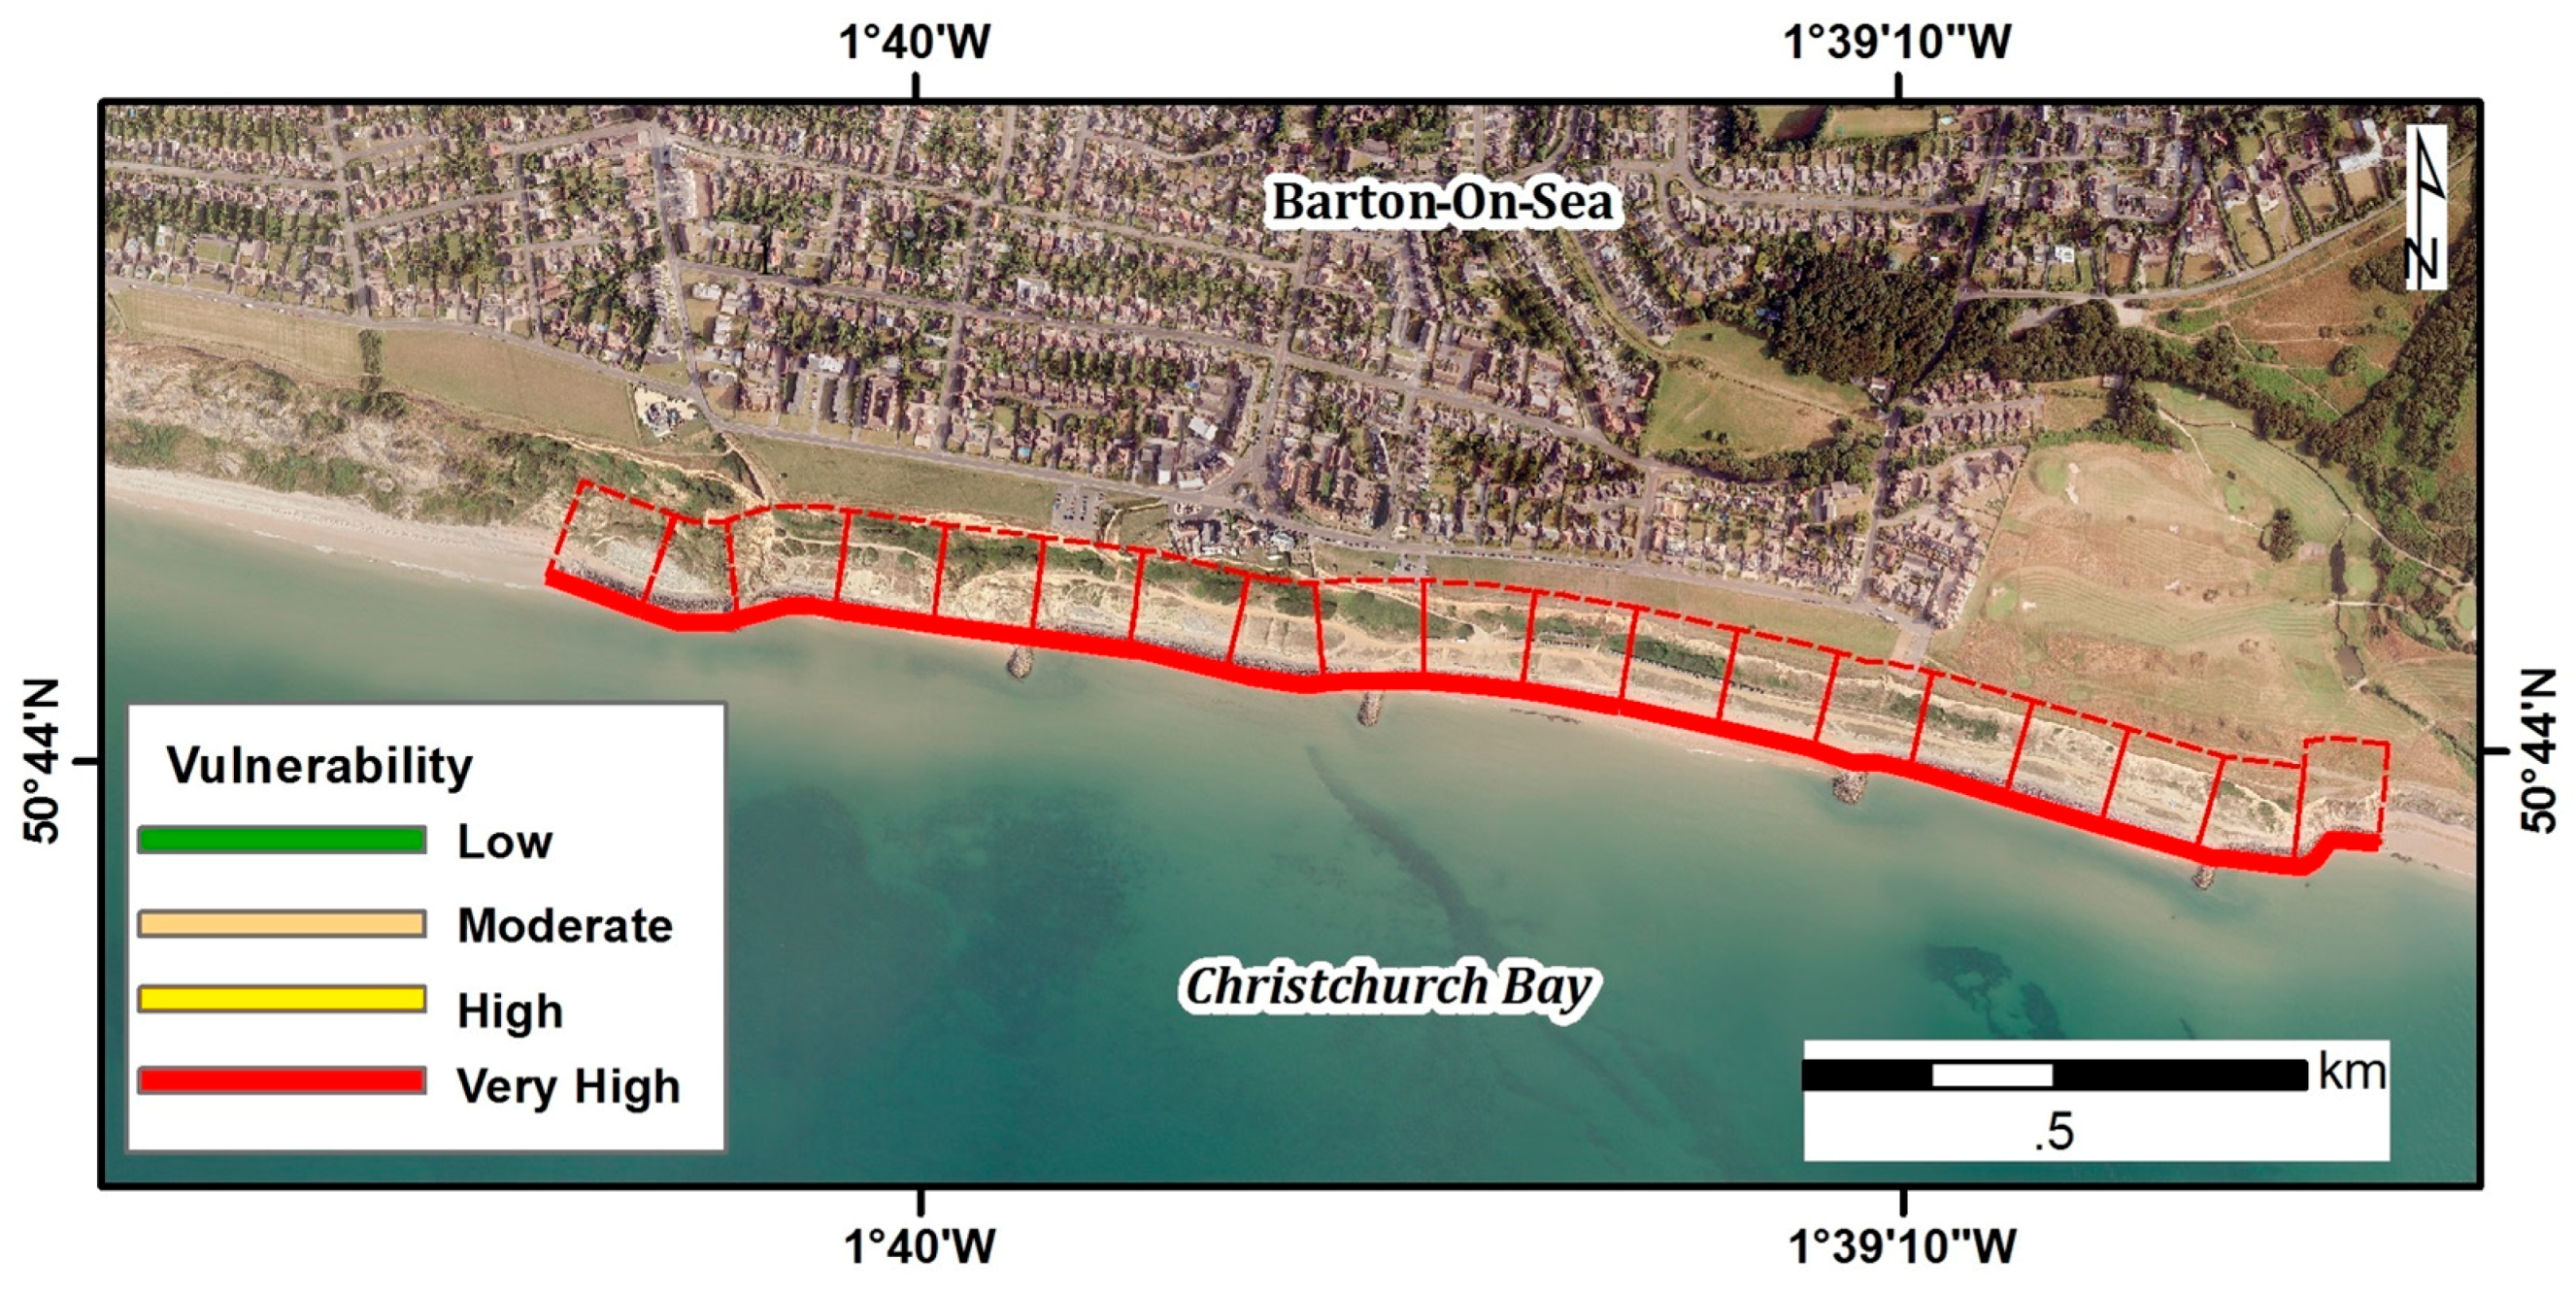
Analysis results revealed that the entire coastline (2 km) of Barton-on-Sea is highly vulnerable, and this is because of coastal landslides together with erosion and the lack of robust shoreline protection measures. Though this region has a rocky outcrop, it is not strong enough to protect the shoreline from high tidal waves, erosion, and associated natural hazards. Figure 6 shows a slight difference exists between the nineteen cells with respect to MTCVI values. The average value was 15.26, which falls in the very high category. However, the maximum MTCVI value (16) was recorded for five cells (26%), and the minimum was 14, scored at the thirteenth cell. The maximum and minimum scores fall in the very high coastal vulnerability category. All cells (100%) were rated with very high vulnerability (14–16), and none of the cells fall between the low and high vulnerability categories. Overall, MTCVI scores indicate that Barton-on-Sea has a very high coastal vulnerability for current scenarios, as shown in Figure 7.
5. Discussion
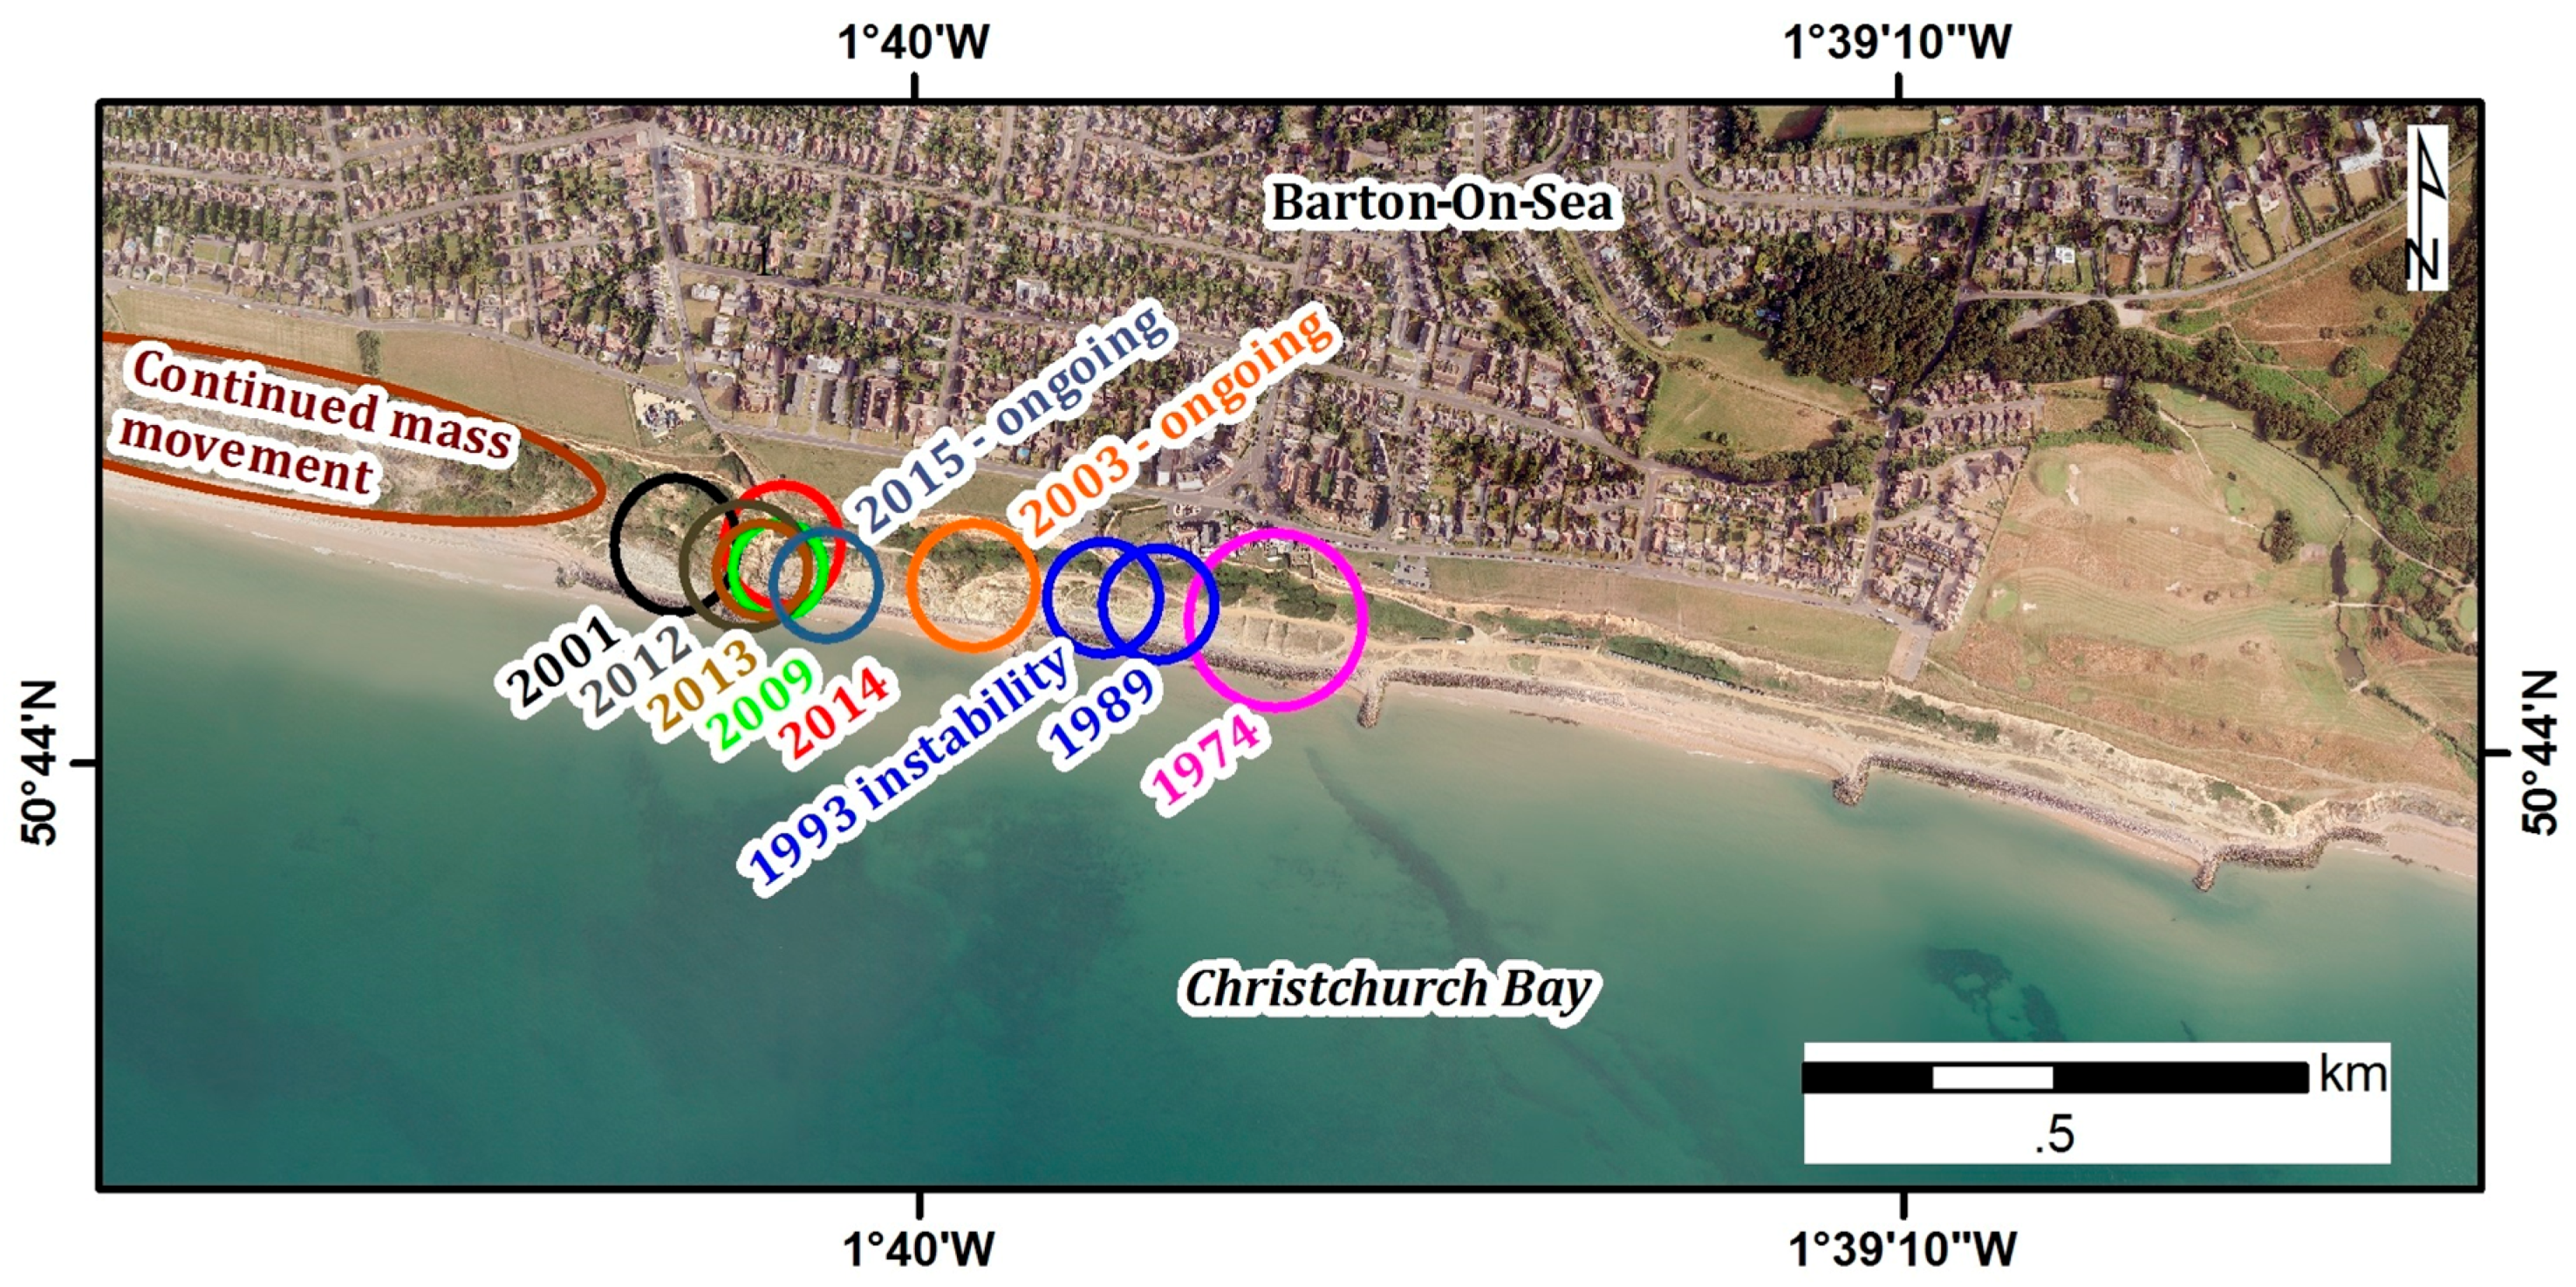
Most of the global coastal regions are under increasing climatic, anthropogenic, and physical pressures, which can lead to rapid coastal vulnerability in a short span. The current study adapted a part of the methodological framework of Denner et al. [34] for an evaluation of Barton-on-Sea coastal vulnerability and modified the procedures based upon study area characteristics. Consequently, coastal landslide impact was introduced in this study for the development of a new index called the MTCVI. O’Connor and Jackson [55] and Thomas et al. [56] revealed that physical and geomorphological coastal process trends can be observed via historic timescales, which was evident in the current study for landslide events. Historical landslide events showed significant negative impacts on Barton-on-Sea coastal frontage evident from 1974, 1989, 1993, 2001, 2003, 2009, 2012, 2013, 2014, and 2015 events (Figure 8). A single storm event caused a massive coastal landslide in this region in 2012, probably because of strong tides and severe storm scenarios from the English Channel. There are two recently active areas in this coastal site, but, in general, landslide areas are always active, and consequently, the events are ongoing. Therefore, unique hydro-geology and climate change make this coastal site highly vulnerable.
The current study also generated landslide GIS maps of the UK to identify the coastal landslide strikes across the country for the period of 2000–2016 based upon BGS data. As shown in Figure 9, more than 900 (967) landslides (all types) were recorded and >50% of them struck the various coastal sites during the period. Only one coastal landslide was recorded at Barton-on-Sea during this period, and this record clearly differed from Town Council data reported. However, there are conflicting opinions about coastal landslide events, and no accurate information on the definite number is available. Coastal erosion characteristically results in the inland retreat of the shoreline. This can increase the coastal flooding risk, landslides, loss of land, and damage to coastal infrastructure. However, rocky outcrops play a vital natural role in shoreline protection by delaying the erosion [36]. It has been estimated that Barton-on-Sea coastal erosion and coastal landslides are caused by its uneven and diverse hydro-geological nature and high tides and waves [57]. Thomas et al. [58] revealed that variations in external forces may also be accountable for coastline erosion. Tenacious waves and sporadic storms provide substantial vigour to the coastal atmosphere, affecting sediment transport, distressing ecosystems, and damaging infrastructure Gopalakrishnan [59]. However, vegetation (plantation) provides a protective defence for infrastructure, including commercial and residential properties, from high waves. Unfortunately, Barton-on-Sea does not have that much thick vegetation, which makes this region more vulnerable.
The current study also compares with some prior CVI frameworks at different levels. Kantamaneni’s [36] regional coastal infrastructure vulnerability study evaluated Aberystwyth–North Wales’s coastal vulnerability with a similar framework and reported that the majority of the infrastructure and population are very vulnerable due to the repeated storm events, high waves, and erosion, even though the coastal region had coastal defences. Similarly, the current study also evaluated Barton-on-Sea’s coastal vulnerability with similar procedures and found that this site has very high vulnerability, although it has some coastal protection structures. Kantamaneni [43] stated that the CVI index is a powerful tool for vulnerability mapping and to specify the severity of vulnerability at certain coastal regions. Therefore, the current study also generated vulnerability maps by means of the relative coastal vulnerability score. However, both Kantamaneni’s [36,43] studies were fiscal evaluations while the MTCVI in the current study is a physical and geomorphological assessment.
McLaughlin and Cooper [60] established a multi-scale CVI, which was a socio-economic study for assessing erosion impacts of Northern Ireland (macro scale assessment). The index assimilates three sub-indices and consists of geology, morphology, and socio-economic parameters. Similarly, the current study also has geomorphological and geological parameters (coastal slope, vegetation behind the back beach, landslides impact) and is applied to Barton-on-Sea. However, socio-economic factors were not considered in this study. Furthermore, Palmer et al. [33] and Denner et al. [34] studies evaluated the vulnerability of KwaZulu-Natal coast (South Africa) and Llanelli (South Wales, UK), respectively. These studies’ formulations are very similar to the MTCVI but differ in the parameters. Alexandrakis et al. [31] developed the Beach Vulnerability Index (BVI) and applied it to 18 beaches around the Greek coastline by applying seven indicators including erosion of associated coastal landforms. The aim of their study was very similar to the MTCVI, but formulation and parameter selection criteria were very different. Bosom and Jiménez [61] evaluated 50 km along a coastal stretch of the Catalonia beach in Spain by developing storm-induced coastal vulnerability. Part of their study was similar to the MTCVI, but the assessment criteria was entirely different. The current study measured the coastal slope by using Google Earth (GE) Pro which is different from the earlier studies. In addition, the general accuracy of elevations on GE Pro is about 10~16 m (SRTM—Shuttle Radar Topography Mission-1-arcsecond, 30 m) and it is more accurate in flat regions (up to 1~2 m) when compared with high mountains such as the Alps and Himalayas [62]. This elevation is quite suitable to the current study area, and, accordingly, GE Pro was used to measure Barton-on-Sea coastal slope rather than Airborne Lidar. Airborne Lidar is a time consuming and expensive process, although it has a very good accuracy. Lidar-derived DEM (Digital Elevation Model) is the primary option for microscale research. However, the GE Pro is easy to use, and it is an ideal alternative.
The use of the MTCVI in defining the vulnerability of specific sites can classify the shoreline stretches that are less vulnerable and, therefore, will inform future redevelopment decisions. Several physical and geomorphological coastal vulnerability indices have been developed and many tools have been employed to assess the scale of coastal vulnerability around the world. However, these have not been extensively applied in the UK, with the exception of the fiscal evaluation study by Kantamaneni [36]. The present MTCVI was developed using existing parameters and a new parameter which is recognised as significant in relation to vulnerability. Coastal planners and developers can use this kind of MTCVI analysis in conjunction with socio-economic conditions without the need for in-depth knowledge of technical issues and coastal processes. The current study also developed GIS coastal vulnerability maps that can support coastal managers and engineers to make informed decisions for managing coastal vulnerability in Barton-on-Sea. These aspects are subjects of on-going research, but this method of estimating vulnerability will ultimately allow cost-benefit analysis. This work establishes the methodology that can be amended for similar coastal environments at regional and global scales, and can be used for assessments of coastal defences.
6. Limitation of Research
Though the current research has achieved valuable results, there are some limitations which will underpin recommendations for future work. The UK does not presently have a systematised framework to deal with landslides. Due to the lack of data regarding the actual number of landslide strikes and asset damage as well as deaths caused by coastal landslides events in Barton-on-Sea, the current research was unable to consider fiscal consequences for local populations. It was not possible to determine the future dynamic hydro-geological nature of this region due to data restrictions. Due to resource restrictions, it was not possible to fully assess implications of infrastructure such as buildings and roads for the MTCVI. This study could not assess accurate landslide damage information before 2000, because information is unavailable for the earlier periods. The current study did not compare with other similar studies due to the lack of similar coastal vulnerability studies in the UK. However, the use of BGS data to augment data acquired from the Town Council would have improved estimates.
7. Conclusions
Evaluating the coastal vulnerability of a specific coastal segment is crucial for future infrastructure planning and development. The current study quantified the coastal vulnerability of Barton-on-Sea by the development of a new model, i.e., the MTCVI. A new parameter (coastal landslide impact) and existing parameters were used to identify the intensity of shoreline susceptibility. Overall results showed that the entire shoreline (2 km) frontage exhibited very high coastal vulnerability and is prone to various coastal hazards such as frequent landslides, storms, erosion, and waves. Coastal landslide events together with coastal erosion accelerate the intensity of coastal vulnerability of the 2 km of a coastal stretch. All of these factors were cumulatively critical for the Barton-on-Sea shoreline. However, the shoreline will eventually crumble into the sea in the future if accurate policies and coastal protection measures are not implemented. This also suggests that Barton-on-Sea coastal amenities will require a substantial improvement in shoreline protection measures. While, an essential feature of the MTCVI is the ease of its application to any geographical area based on the availability of relevant data. This method also makes it easier to generate data and quantify the risk to fulfil the requirements delegated to local authorities in the National Strategy for landslide hazards and coastal erosion risk management in the UK. The coastal vulnerability and landslides are marked on GIS maps and these maps can be used by coastal engineers, local authorities, and district councils to improve and design new coastal management procedures to protect the shoreline.
Acknowledgments
Xiaoping Du is funded by the National Natural Science Foundation of China (NSFC), Grant No. 41301486 and Natural Science Foundation of Hainan Province of China, Grant No. 417214 and Sino-German (CSC-DAAD) Postdoc Scholarship Program. We would like to give special thanks for the comments of three anonymous reviewers on an earlier version, which contributed significantly to the improvement of the manuscript. We are also very grateful to the staff of New Forest District Council for providing updated statistics on landslides. We wish to give special thanks to the Channel Coastal Observatory (CCO) team for the aerial photographs which are used in the study.
Author Contributions
Komali Kantamaneni and Xiaoping Du designed the study, and Komali Kantamaneni performed coastal visits and written the paper; Xiaoping Du and Sainath Aher generated GIS maps; Rao Martand Singh modified the manuscript and advised on physical activity of coastal landslides.
Conflicts of Interest
The authors declare no conflict of interest.
References
- Tralli, D.M.; Blom, R.G.; Zlotnicki, V.; Donnellan, A.; Evans, D.L. Satellite remote sensing of earthquake, volcano, flood, landslide and coastal inundation hazards. ISPRS J. Photogramm. Remote Sens. 2005, 59, 185–198. [Google Scholar] [CrossRef]
- Dilley, M. Natural Disaster Hotspots: A Global Risk Analysis; World Bank Publications: Washington, DC, USA, 2005; Volume 5. [Google Scholar]
- Bromhead, E.; Ibsen, M.-L. A review of landsliding and coastal erosion damage to historic fortifications in south east England. Landslides 2006, 3, 341–347. [Google Scholar] [CrossRef]
- Papathoma-Köhle, M.; Neuhäuser, B.; Ratzinger, K.; Wenzel, H.; Dominey-Howes, D. Elements at risk as a framework for assessing the vulnerability of communities to landslides. Nat. Hazards Earth Syst. Sci. 2007, 7, 765–779. [Google Scholar] [CrossRef]
- Bollmann, W. Crystal Defects and Crystalline Interfaces; Springer: Berlin, Germany, 2012. [Google Scholar]
- Brakenridge, G.; Syvitski, J.; Overeem, I.; Higgins, S.; Kettner, A.; Stewart-Moore, J.; Westerhoff, R. Global mapping of storm surges and the assessment of coastal vulnerability. Nat. Hazards 2013, 66, 1295–1312. [Google Scholar] [CrossRef]
- Pranzini, E.; Williams, A.T. Coastal Erosion and Protection in Europe; Routledge: London, UK, 2013. [Google Scholar]
- Bhaskaran, P.K.; Gayathri, R.; Murty, P.; Bonthu, S.; Sen, D. A numerical study of coastal inundation and its validation for thane cyclone in the bay of Bengal. Coast. Eng. 2014, 83, 108–118. [Google Scholar] [CrossRef]
- Passeri, D.L.; Hagen, S.C.; Medeiros, S.C.; Bilskie, M.V.; Alizad, K.; Wang, D. The dynamic effects of sea level rise on low-gradient coastal landscapes: A review. Earth’s Future 2015, 3, 159–181. [Google Scholar] [CrossRef]
- Bilskie, M.V.; Hagen, S.; Alizad, K.; Medeiros, S.; Passeri, D.; Needham, H.; Cox, A. Dynamic simulation and numerical analysis of hurricane storm surge under sea level rise with geomorphologic changes along the northern gulf of mexico. Earth’s Future 2016, 4, 177–193. [Google Scholar] [CrossRef]
- Zsamboky, M.; Fernández-Bilbao, A.; Smith, D.; Knight, J.; Allan, J. Impacts of Climate Change on Disadvantaged UK Coastal Communities; Joseph Rowntree Foundation: New York, UK, 2011. [Google Scholar]
- Nicholls, R.J.; Kebede, A.S. Indirect impacts of coastal climate change and sea-level rise: The UK example. Clim. Policy 2012, 12, S28–S52. [Google Scholar] [CrossRef]
- Huq, S.; Kovats, S.; Reid, H.; Satterthwaite, D. Reducing Risks to Cities from Disasters and Climate Change; SAGE Publications Sage UK: London, UK, 2007. [Google Scholar]
- McGranahan, G.; Balk, D.; Anderson, B. The rising tide: Assessing the risks of climate change and human settlements in low elevation coastal zones. Environ. Urban. 2007, 19, 17–37. [Google Scholar] [CrossRef]
- Neumann, B.; Vafeidis, A.T.; Zimmermann, J.; Nicholls, R.J. Future coastal population growth and exposure to sea-level rise and coastal flooding-a global assessment. PLoS ONE 2015, 10, e0118571. [Google Scholar] [CrossRef] [PubMed]
- Creel, L. Ripple Effects: Population and Coastal Regions; Population Reference Bureau: Washington, DC, USA, 2003. [Google Scholar]
- Kantamaneni, K.; Alrashed, I.; Phillips, M. Cost vs. Safety: A novel design for tornado proof homes. HBRC J. 2017, 13, 223–232. [Google Scholar] [CrossRef]
- Douglas, B.C. Sea level change in the era of the recording tide gauge. Int. Geophys. 2001, 75, 37–64. [Google Scholar]
- Antunes, C.; Taborda, R. Sea level at cascais tide gauge: Data, analysis and results. J. Coast. Res. 2009, 1, 218–222. [Google Scholar]
- Murphy, J.M.; Sexton, D.; Jenkins, G.; Booth, B.; Brown, C.; Clark, R.; Collins, M.; Harris, G.; Kendon, E.; Betts, R. UK Climate Projections Science Report: Climate Change Projections; Meteorological Office Hadley Centre: Exeter, UK, 2009.
- Benson, C.; Clay, E.J. Understanding the Economic and Financial Impacts of Natural Disasters; World Bank Publications: Washington, DC, USA, 2004. [Google Scholar]
- Nicholls, R.J.; Wong, P.P.; Burkett, V.; Codignotto, J.; Hay, J.; McLean, R.; Ragoonaden, S.; Woodroffe, C.D.; Abuodha, P.; Arblaster, J. Coastal Systems and Low-Lying Areas. Climate Change 2007: Impacts, Adaptation and Vulnerability; Parry, M.L., Canziani, O.F., Palutik, J.P., van der Linden, P.J., Hanson, C.E., Eds.; Cambridge University Press: Cambridge, UK, 2007; pp. 315–356. [Google Scholar]
- Kantamaneni, K.; Du, X. Is catastrophic climate change turning britain into a hurricane hotspot? Int. J. Environ. Res. 2017. [Google Scholar] [CrossRef]
- Cutter, S.L. The changing context of hazard extremes: Events, impacts, and consequences. J. Extreme Events 2016, 3, 1671005. [Google Scholar] [CrossRef]
- Kidwell, D.M.; Dietrich, J.C.; Hagen, S.C.; Medeiros, S.C. An earth’s future special collection: Impacts of the coastal dynamics of sea level rise on low-gradient coastal landscapes. Earth’s Future 2017, 5, 2–9. [Google Scholar] [CrossRef]
- Moore, J.C.; Jevrejeva, S.; Grinsted, A. Efficacy of geoengineering to limit 21st century sea-level rise. Proc. Natl. Acad. Sci. USA 2010, 107, 15699–15703. [Google Scholar] [CrossRef] [PubMed] [Green Version]
- Kumar, T.S.; Mahendra, R.; Nayak, S.; Radhakrishnan, K.; Sahu, K. Coastal vulnerability assessment for orissa state, east coast of india. J. Coast Res. 2010, 26, 523–534. [Google Scholar] [CrossRef]
- Gornitz, V. Vulnerability of the east coast, USA to future sea level rise. J. Coast Res. 1990, 9, 201–237. [Google Scholar]
- Gornitz, V.M.; Daniels, R.C.; White, T.W.; Birdwell, K.R. The development of a coastal risk assessment database: Vulnerability to sea-level rise in the US southeast. J. Coast Res. 1994, 327–338. [Google Scholar]
- Mendoza, E.T.; Jimenez, J.A. Factors controlling vulnerability to storm impacts along the Catalonian coast. In Coastal Engineering Conference; American Society of Civil Engineers: Reston, VA, USA, 2004; Volume 3, pp. 3087–3099. [Google Scholar]
- Alexandrakis, G.; Poulos, S.; Petrakis, S.; Collins, M. The development of a beach vulnerability index (bvi) for the assessment of erosion in the case of the north Cretan coast (Aegean Sea) Hellenic. J. Geosci. 2011, 45, 11–22. [Google Scholar]
- Alexandrakis, G.; Poulos, S.E. An Holistic Approach to Beach Erosion Vulnerability Assessment Scientific Reports; Nature Publisher Group: London, UK, 2014; Volume 4, p. 6078. [Google Scholar]
- Palmer, B.; Van der Elst, R.; Mackay, F.; Mather, A.; Smith, A.; Bundy, S.; Thackeray, Z.; Leuci, R.; Parak, O. Preliminary coastal vulnerability assessment for kwazulu-natal, south africa. J. Coast Res. 2011, 64, 1390. [Google Scholar]
- Denner, K.; Phillips, M.; Jenkins, R.; Thomas, T. A coastal vulnerability and environmental risk assessment of loughor estuary, south wales. Ocean Coast. Manag. 2015, 116, 478–490. [Google Scholar] [CrossRef]
- Barros, J.L.; Tavares, A.O.; Santos, A.; Fonte, A. Territorial vulnerability assessment supporting risk managing coastal areas due to tsunami impact. Water 2015, 7, 4971–4998. [Google Scholar] [CrossRef]
- Kantamaneni, K. Counting the cost of coastal vulnerability. Ocean Coast. Manag. 2016, 132, 155–169. [Google Scholar] [CrossRef]
- Monioudi, I.N.; Karditsa, A.; Chatzipavlis, A.; Alexandrakis, G.; Andreadis, O.P.; Velegrakis, A.F.; Poulos, S.E.; Ghionis, G.; Petrakis, S.; Sifnioti, D. Assessment of vulnerability of the eastern Cretan Beaches (Greece) to sea level rise. Reg. Environ. Chang. 2016, 16, 1951–1962. [Google Scholar] [CrossRef]
- Samanta, B.; Das, S.; Hazra, S. Micro level vulnerability assessment of a community living in mousuni island in the Indian sundarban: An integrated study employing geoinformatics. In Environment and Earth Observation; Springer: Berlin, Germany, 2017; pp. 195–213. [Google Scholar]
- Hsu, T.-W.; Shih, D.-S.; Li, C.-Y.; Lan, Y.-J.; Lin, Y.-C. A study on coastal flooding and risk assessment under climate change in the mid-western coast of Taiwan. Water 2017, 9, 390. [Google Scholar] [CrossRef]
- Peña-Alonso, C.; Fraile-Jurado, P.; Hernández-Calvento, L.; Pérez-Chacón, E.; Ariza, E. Measuring geomorphological vulnerability on beaches using a set of indicators (gvi): A tool for management. J. Environ. Manag. 2017, 204, 230–245. [Google Scholar] [CrossRef] [PubMed]
- Adger, W.N. Vulnerability. Glob. Environ. Chang. 2006, 16, 268–281. [Google Scholar] [CrossRef]
- Thieler, E.R.; Hammar-Klose, E.S. National Assessment of Coastal Vulnerability to Sea-Level Rise; US Atlantic Coast; US Geological Survey: Reston, VA, USA, 1999.
- Kantamaneni, K. Coastal infrastructure vulnerability: An integrated assessment model. Nat. Hazards 2016, 84, 139–154. [Google Scholar] [CrossRef]
- Harik, G.; Alameddine, I.; Maroun, R.; Rachid, G.; Bruschi, D.; Garcia, D.A.; El-Fadel, M. Implications of adopting a biodiversity-based vulnerability index versus a shoreline environmental sensitivity index on management and policy planning along coastal areas. J. Environ. Manag. 2017, 187, 187–200. [Google Scholar] [CrossRef] [PubMed]
- Sadeghi-Pouya, A.; Nouri, J.; Mansouri, N.; Kia-Lashaki, A. An indexing approach to assess flood vulnerability in the western coastal cities of mazandaran, Iran. J. Disaster Risk Reduct. 2017, 22, 304–316. [Google Scholar] [CrossRef]
- Bárcena, J.F.; Gómez, A.G.; García, A.; Álvarez, C.; Juanes, J.A. Quantifying and mapping the vulnerability of estuaries to point-source pollution using a multi-metric assessment: The estuarine vulnerability index (EVI). Ecol. Indic. 2017, 76, 159–169. [Google Scholar] [CrossRef]
- González-Baheza, A.; Arizpe, O. Vulnerability assessment for supporting sustainable coastal city development: A case study of La Paz, Mexico. Clim. Dev. 2017. [Google Scholar] [CrossRef]
- ONS (Office of National Statistics). Census Data-2011. Available online: https://www.ons.gov.uk/census/2011census/2011censusdata (accessed on 15 April 2016).
- New Forest District Council. Barton on Sea Coastal Protection Information Leaflet & Barton on Sea Instability. Available online: http://www.newforest.gov.uk/CHttpHandler.ashx?id=23392&p=0; http://www.scopac.org.uk/3_Peter_Ferguson.pdf; (accessed on 8 December 2016).
- Fort, D.; Clark, A.; Cliffe, D. The investigation and monitoring of coastal landslides at Barton-on-sea, Hampshire, UK. Landslides Res. Theory Pract. 2000, 2, 567–572. [Google Scholar]
- West, I. Barton & Highcliffe Coast Erosion. Available online: http://www.southampton.ac.uk/~imw/Barton-Erosion-History.htm (accessed on 21 November 2017).
- Clark, A. Barton-on-Sea, Hampshire, UK. Available online: http://www.risknat.org/projets/riskydrogeo/docs/guide_pratique/Acivite1_Ateliers/Presentations%20Atelier1/A1P13-Coastal%20changes/programs/barton.html (accessed on 10 December 2016).
- Gibson, A.; Culshaw, M.; Dashwood, C.; Pennington, C. Landslide management in the UK—The problem of managing hazards in a ‘low-risk’environment. Landslides 2013, 10, 599–610. [Google Scholar] [CrossRef] [Green Version]
- Pilkey, O.H.; Davis, T.W. An Analysis of Coastal Recession Models: North Carolina Coast; Society for Sedimentary Geology: Tulsa, OK, USA, 1987. [Google Scholar]
- O’Connor, M.; Cooper, J.; Jackson, D. Morphological behaviour of headland-embayment and inlet-associated beaches, northwest Ireland. J. Coast. Res. 2007, 59, 626–630. [Google Scholar]
- Thomas, T.; Williams, A.; Rangel-Buitrago, N.; Phillips, M.; Anfuso, G. Assessing embayed equilibrium state, beach rotation and environmental forcing influences; Tenby southwest wales, UK. J. Mar. Sci. Eng. 2016, 4, 30. [Google Scholar] [CrossRef]
- Mansour, M.F.; Morgenstern, N.R.; Martin, C.D. Expected damage from displacement of slow-moving slides. Landslides 2011, 8, 117–131. [Google Scholar] [CrossRef]
- Thomas, T.; Phillips, M.; Williams, A. Mesoscale evolution of a headland bay: Beach rotation processes. Geomorphology 2010, 123, 129–141. [Google Scholar] [CrossRef]
- Gopalakrishnan, S.; Landry, C.E.; Smith, M.D.; Whitehead, J.C. Economics of coastal erosion and adaptation to sea level rise. Annu. Rev. Resour. Econ. 2016, 8, 119–139. [Google Scholar] [CrossRef]
- McLaughlin, S.; Cooper, J.A.G. A multi-scale coastal vulnerability index: A tool for coastal managers? Environ. Hazards 2010, 9, 233–248. [Google Scholar] [CrossRef]
- Bosom, E.; Jiménez, J. Probabilistic coastal vulnerability assessment to storms at regional scale-application to Catalan beaches (NW Mediterranean). Nat. Hazards Earth Syst. Sci. 2011, 11, 475. [Google Scholar] [CrossRef] [Green Version]
- Du, X.; Guo, H.; Fan, X.; Zhu, J.; Yan, Z.; Zhan, Q. Vertical accuracy assessment of freely available digital elevation models over low-lying coastal plains. Intl. J. Digit. Earth 2016, 9, 252–271. [Google Scholar] [CrossRef]
Figure 1.
Study area: Barton-on-Sea coastal frontage.

Figure 2.
Coastal cell measurement on a shoreline.

Figure 3.
Barton-on-Sea: Landslide and coastal erosion damage along the shoreline in March 2017. (a) Landslide’s damage; (b) Coastal erosion.
Figure 3.
Barton-on-Sea: Landslide and coastal erosion damage along the shoreline in March 2017. (a) Landslide’s damage; (b) Coastal erosion.

Figure 4.
Distribution of all parameters scores. (a) Coastal landslide’s impact; (b) Coastal slope; (c) Distance of vegetation; (d) Rocky outcrop.
Figure 4.
Distribution of all parameters scores. (a) Coastal landslide’s impact; (b) Coastal slope; (c) Distance of vegetation; (d) Rocky outcrop.

Figure 5.
Distribution of overall Micro Town Coastal Vulnerability Index (MTCVI) scores. (a) Coastal landslides impact ; (b) Coastal slope; (c) Distance of vegetation ; (d) Rocky outcrop.
Figure 5.
Distribution of overall Micro Town Coastal Vulnerability Index (MTCVI) scores. (a) Coastal landslides impact ; (b) Coastal slope; (c) Distance of vegetation ; (d) Rocky outcrop.
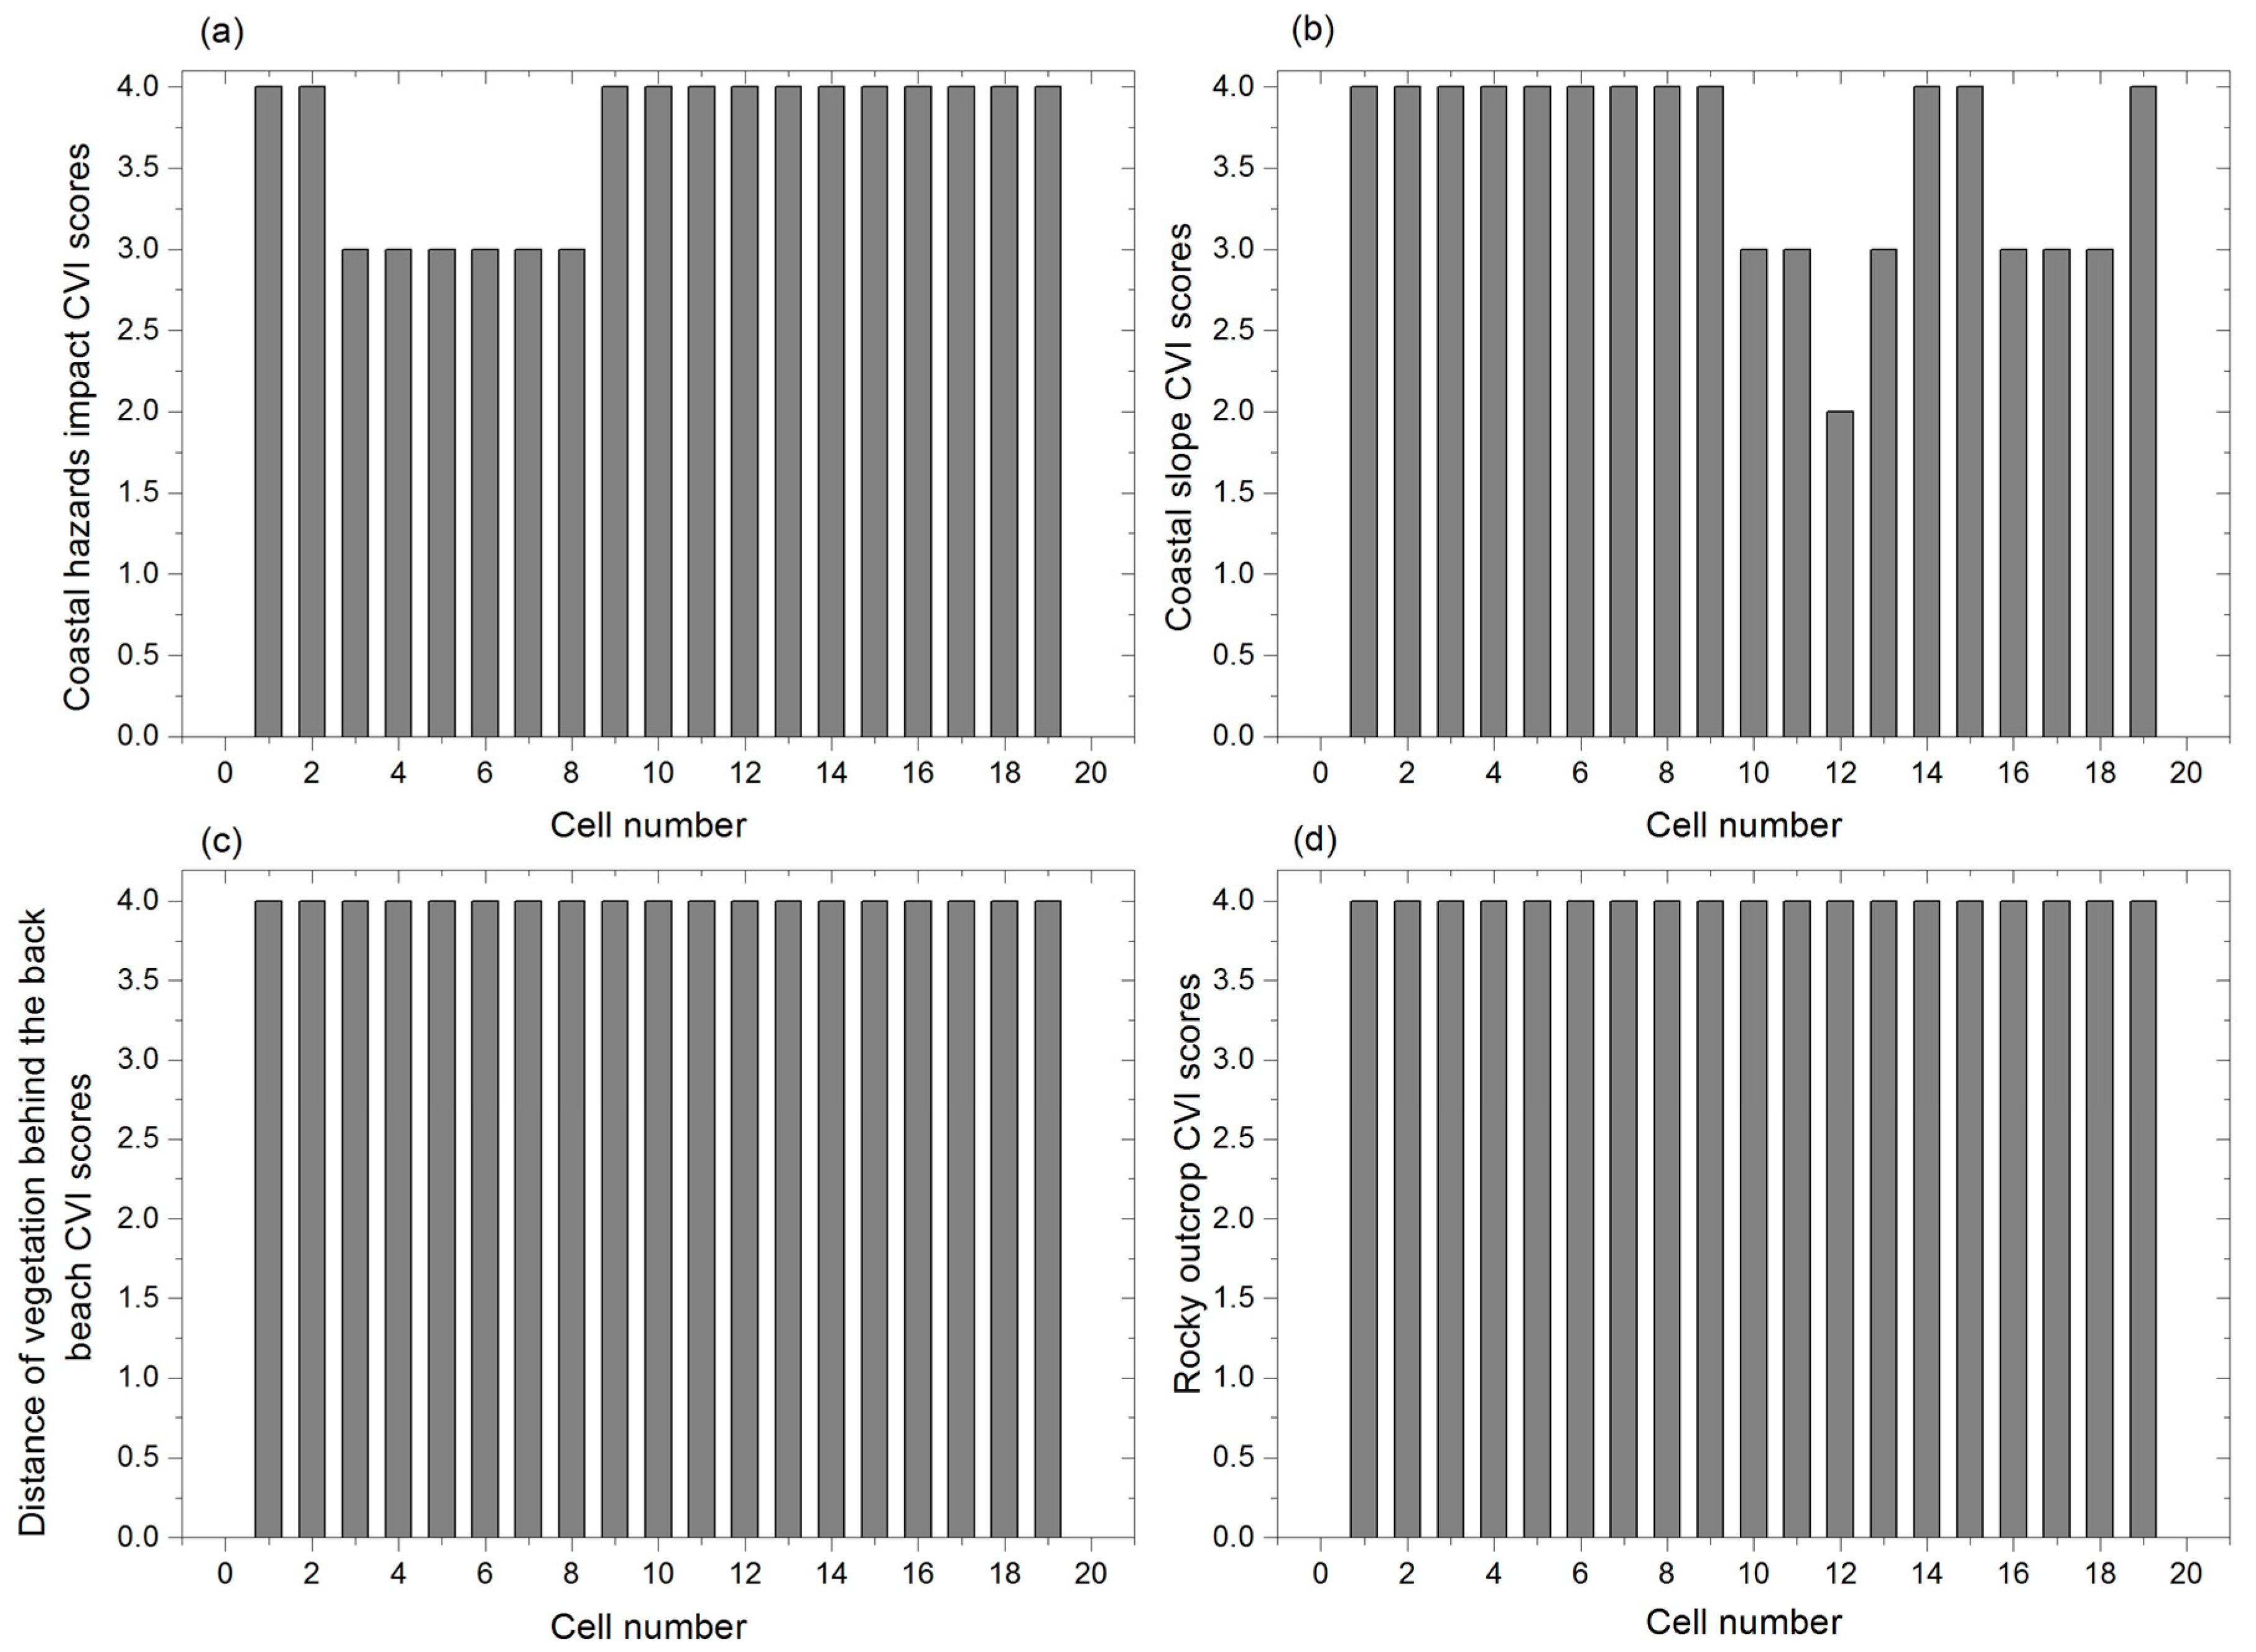
Figure 6.
Aggregated CVI scores.

Figure 7.
Coastal vulnerability map.

Figure 8.
Landslide events and active areas at Barton-on-Sea. Source: Adapted from New Forest District Council [49].
Figure 8.
Landslide events and active areas at Barton-on-Sea. Source: Adapted from New Forest District Council [49].

Figure 9.
Landslide maps of the United Kingdom (UK) with south east coastal frontage as inset picture.
Figure 9.
Landslide maps of the United Kingdom (UK) with south east coastal frontage as inset picture.


Table 1.
New and existing parameters for coastal vulnerability evaluation.
| Parameter | Name |
|---|---|
| New parameter | Coastal landslides impact |
| Existing parameters | Coastal slope |
| Distance of vegetation behind the back beach | |
| Rocky outcrop |
Table 2.
Data sources.
| Parameter | Source | Period |
|---|---|---|
| Coastal landslides impact | BGS and New Milton Town Council | 2000–2016 |
| Coastal slope | NASA-Google Earth Pro | 2015 |
| Distance of vegetation behind the back of beach | Channel Coastal Observatory High Resolution Aerial Maps | 2013 |
| Rocky outcrop | Channel Coastal Observatory High Resolution Aerial Maps | 2013 |
Table 3.
Parameters and ranking.
| Parameters Threshold | ||||
|---|---|---|---|---|
| Parameter | Low (1) | Moderate (2) | High (3) | Very High (4) |
| Coastal landslides impact | Low | Moderate | High impact | Very high impact |
| Coastal slope (%) | >12% | 12–8% | 8–4% | <4% |
| Distance of vegetation behind the back of beach (m) | >600 m | 200–600 m | 100–200 m | <100 m |
| Rocky outcrop (%) | >50% | 20–50% | 10–20% | <10% |
Table 4.
Relative vulnerability level ratings.
| Total Relative Vulnerability Score | Vulnerability |
|---|---|
| 7 | Low |
| 8–10 | Moderate |
| 11–13 | High |
| 14–16 | Very High |
© 2017 by the authors. Licensee MDPI, Basel, Switzerland. This article is an open access article distributed under the terms and conditions of the Creative Commons Attribution (CC BY) license (http://creativecommons.org/licenses/by/4.0/).
Share and Cite
MDPI and ACS Style
Kantamaneni, K.; Du, X.; Aher, S.; Singh, R.M. Building Blocks: A Quantitative Approach for Evaluating Coastal Vulnerability. Water 2017, 9, 905. https://doi.org/10.3390/w9120905
AMA Style
Kantamaneni K, Du X, Aher S, Singh RM. Building Blocks: A Quantitative Approach for Evaluating Coastal Vulnerability. Water. 2017; 9(12):905. https://doi.org/10.3390/w9120905
Chicago/Turabian StyleKantamaneni, Komali, Xiaoping Du, Sainath Aher, and Rao Martand Singh. 2017. "Building Blocks: A Quantitative Approach for Evaluating Coastal Vulnerability" Water 9, no. 12: 905. https://doi.org/10.3390/w9120905
Note that from the first issue of 2016, this journal uses article numbers instead of page numbers. See further details here.