The Source, Flow Rates, and Hydrochemical Evolution of Groundwater in an Alluvial Fan of Qilian Mountain, Northwest China

School of Earth Sciences and Engineering, Hohai University, No.1 Xikang Road, Nanjing 210098, China
*
Author to whom correspondence should be addressed.
Water 2017, 9(12), 912; https://doi.org/10.3390/w9120912
Submission received: 31 October 2017
/
Revised: 19 November 2017
/
Accepted: 21 November 2017
/
Published: 23 November 2017
(This article belongs to the Special Issue Isotopes in Hydrology and Hydrogeology)
Abstract
:Major ions and selected environmental tracers (D, 18O, 3H and chlorofluorocarbons (CFCs)) were employed to determine the source, flow rates, and hydrochemical evolution of groundwater in an alluvial fan along the front of the Qilian Mountains, which serves as an important groundwater reservoir in northwest China. Temporal and spatial variations in ion concentrations were limited near the upper portion of the alluvial fan. However, groundwater quality deteriorated along the flow path as concentrations of Mg2+, Na+, SO42−, and Cl− increased toward the fan toe and into the center of the valley. The relative abundance of the major cations and anions also changed down-fan from Ca2+ to Na+ and Mg2+, and from HCO3− to SO42− and Cl−, respectively. Isotopic data suggests that precipitation within the Qilian Mountains, which recharged the alluvial deposits near the mountain front, was the primary source of groundwater. Apparent groundwater ages determined by CFCs varied from 23 to 40 years, and in general, increased in age from south to north (down-fan). It is concluded that groundwater in the study area was recharged by the Qilian Mountains, flowed through the alluvial fan from south to north, and was subsequently discharged several decades later from springs located along the toe of the fan, after which it re-entered the Shule River.
1. Introduction
Shortages in water resources represent a serious problem in many areas of the planet particularly within semi-arid and arid regions [1,2]. Northwestern China, characterized by low precipitation, high temperatures, and high rates of evapotranspiration is a classic example. In recent years, the ecologically fragile nature of these environments is being impacted by both climate change and anthropogenic activities, both of which may alter hydrological processes (e.g., the magnitudes and rates of groundwater recharge, flow, and discharge) and water resource availability [2,3,4].
In most semi-arid and arid regions, the scarcity and uncertainty of surface water supplies prompts most communities to tap groundwater for domestic, agricultural and industrial purposes [5,6]. However, the intensive use of groundwater in semi-arid and arid areas, particularly for irrigation of agricultural lands, has led to a depletion of many groundwater systems, and a host of related environmental problems, including desertification, soil salinization, and alterations in the abundance and diversity of both native and exotic vegetation [7,8,9,10]. Unfortunately, these problems are likely to increase with increases in population density and economic activity. It is therefore vital to develop a sound understanding of the physical and geochemical nature of groundwater flow systems in arid areas to effectively manage the region’s water resources.
The geochemical evolution of groundwater is strongly influenced by both natural and human factors. Recent studies, for instance, have shown that specific hydrogeochemical processes are associated with distinct hydrogeological settings, the latter of which are determined by such factors as topography, geology (lithology and structure of the consolidated and unconsolidated materials), and both regional and local meteorological conditions [11]. Anthropogenic activities (such as agriculture, industry, and groundwater withdrawals) may also have profound effects on groundwater chemistry [12,13,14]. The influence of natural and anthropogenic factors on groundwater geochemical processes can be assessed by quantitatively evaluating spatial and temporal variations in major dissolved ion concentrations along the groundwater flow path [15,16,17]. In fact, patterns in groundwater flow have been identified by documenting the evolutionary changes in the chemistry of groundwater as it migrates from zones of recharge to discharge. In most cases, zones of groundwater recharge are characterized by dissolution, whereas zones of discharge are dominated by evaporation, precipitation, and ion exchange. Ion exchange is also a dominant process effecting groundwater chemistry as waters move from areas of recharge to discharge.
Isotope hydrology, including the application of the stable isotopes of hydrogen and oxygen (D and 18O), has proven to be useful in deciphering the sources of groundwater, the mechanisms of, and variability in groundwater recharge at both regional and local scales [18,19,20]. Isotopic tracers have also been used to assess the flow rates, mixing and relative residence time of groundwater [21,22]. The benefit of using stable water isotopes is that they are conservative in hydrological environments. Chlorofluorocarbons (CFCs), in particular CFC-11, CFC-12, and CFC-113, are also used widely to determine the age and flow paths of groundwater [23,24,25,26]. The use of CFCs is based on the fact that their concentrations in the atmosphere have varied significantly through time and are well known. Since recharging waters possess the CFC concentrations in the atmosphere at the time of recharge, a comparison of the concentrations observed in groundwater to the historical concentrations documented for the atmosphere provides insights into groundwater age [27]. In recent years, many investigators have combined hydrogeochemical methods with isotopic and geochemical tracer techniques to determine the source of the groundwater, its rate of migration, its age and residence time, and its geochemical evolution along the subsurface flow path [28,29,30]. An understanding of these parameters is vital for the effective management of groundwater resource.
During the past decade, a host of studies have been conducted in arid areas of northwestern China to characterize the region’s groundwater and to more effectively utilize its limited water resources. The majority of these analyses have focused on the Zhangye, Ejina, Minqin, and Dunhuang Basins [1,2,7,13,31,32,33]. For instance, Feng et al. [31] and Wang et al. [13] studied the hydrochemical evolution and residence time of groundwater in the Zhangye and Ejina Basins, respectively. Other investigations have studied the hydrogeochemical evolution processes in the Minqin Basin where groundwater levels have dropped by as much as 35 m since the 1960s [1,7,33,34]. More recently, the Dunhuang Basin has been analyzed in response to rapid shrinkage of Crescent Lake, a phenomenon that is thought to be due to groundwater depletion [2,35]. However, few studies have focused on the Shule River Basin, an area which is in need of more effective and sustainable management of its water resources. Wang et al. [30] used hydrochemical and stable isotopic data to determine the recharge source and evolution of groundwater in the upper-middle reaches of the Shule River Basin. Guo et al. [36] and He et al. [37] assessed the groundwater evolution and recharge source in the middle reaches of the Yumen-Tashi and the lower reaches of the Guazhou Basin in the Shule River Basin. However, further studies are necessary to better understand the spatial and temporal variability of groundwater and residence time in the alluvial fan of Qilian Mountains. Due to the dynamics of the groundwater hydrochemistry, its spatial and temporal distribution as well as chemical and isotopic characterization can provide valuable information.
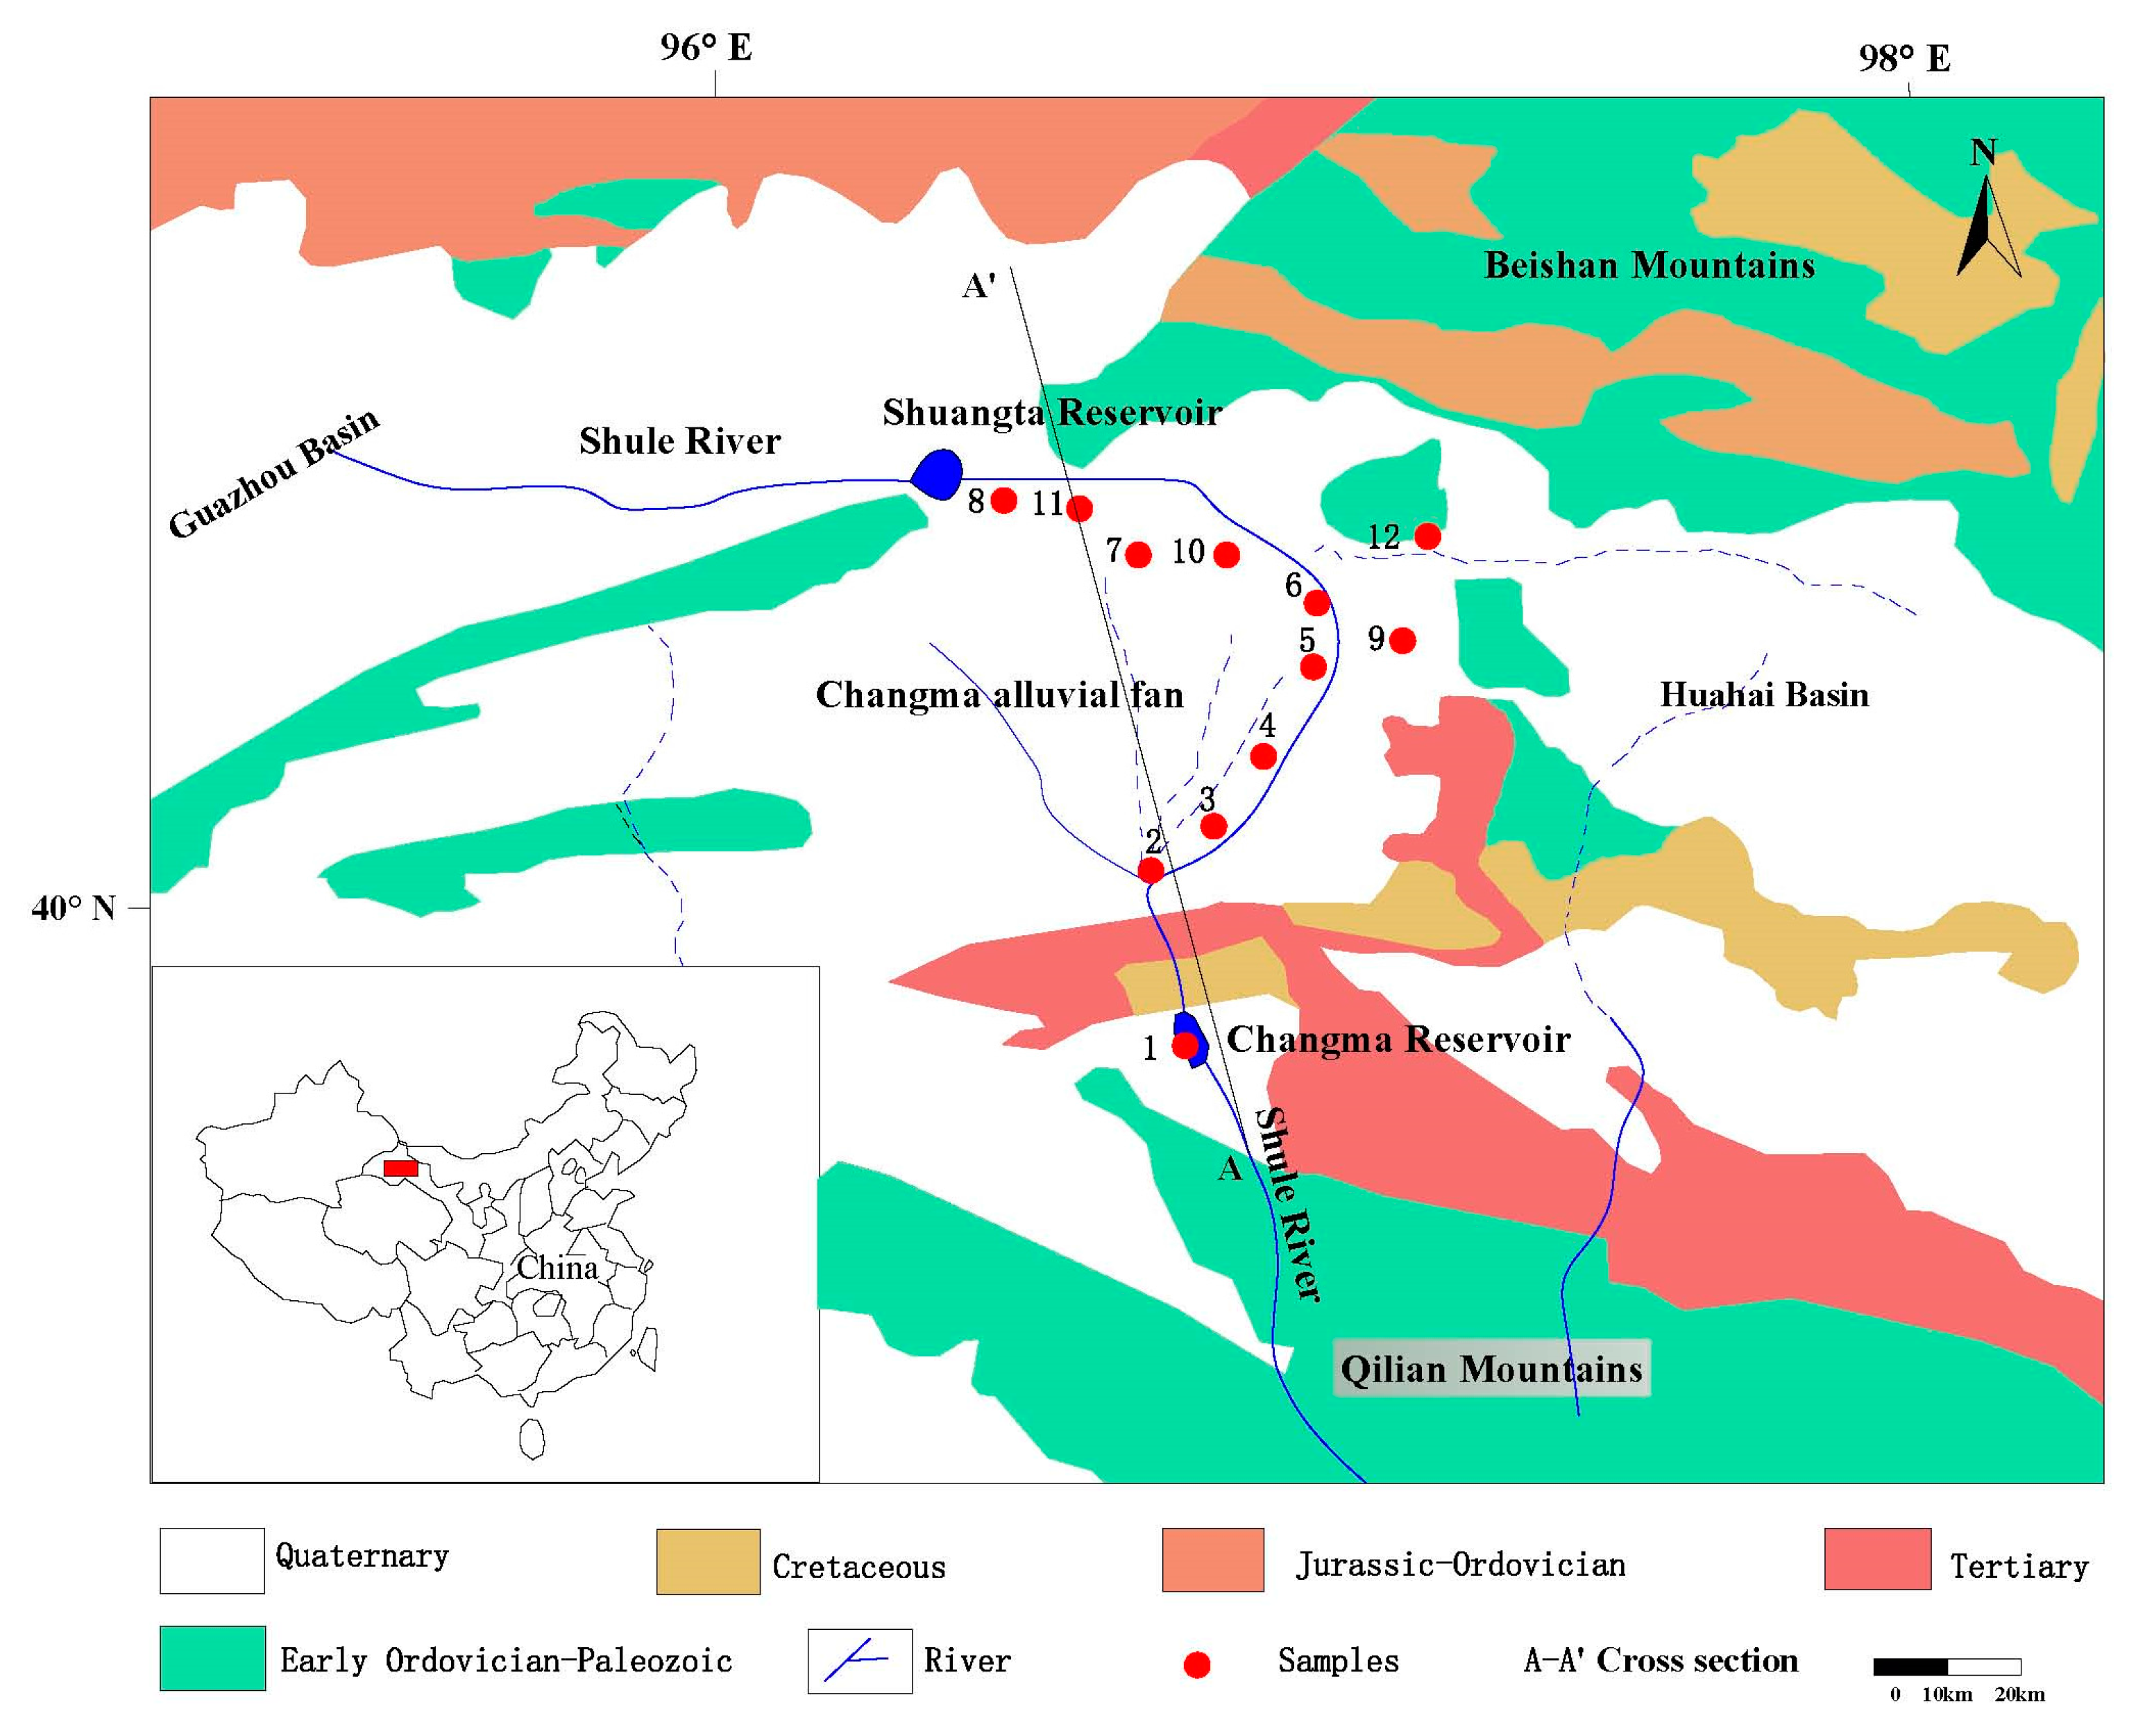
The Shule River Basin is located in the mid-western part of the arid Hexi Corridor in northwestern China (Figure 1). The Shule River, which originates from a glacier in the Qilian Mountains, is one of the three largest inland rivers in Gansu Province. Its upstream reach was dammed to irrigate agricultural fields located along the middle and lower reaches of the Shule River Basin [36]. Despite the created reservoir, increasing domestic and agriculture demands have begun to deplete groundwater resources within the basin, and have led to a reduction in the discharge of water from springs and the disappearance of some lakes and wetlands along the lower reaches of the Shule River valley [38,39]. Therefore, understanding the groundwater recharge and evolution processes is vital for management of the water resources in this area. Alluvial fan deposits along the front of the Qilian Mountains serve as a particularly important groundwater reservoir that is being extensively utilized within the Shule River Basin. However, the hydro-geochemical characteristics of the reservoir are poorly known, and no systematic age information was available prior to this study. In this paper, the processes responsible for the geochemical evolution of groundwater in an alluvial fan located along the Qilian Mountains were investigated using a spatial analysis of major ions within the groundwater as well as selected environmental tracers. The primary objectives of the study were to document the geochemical evolution of the groundwater along its predominant flow paths, and assess the sources and residence time of groundwater within the alluvial fan. Trilinear Piper diagrams were employed to understand the characteristics of the variability of groundwater. The environmental isotopic tracers (D, 18O) and artificial release materials (3H, CFCs) were used to determine the recharge sources and the ages of groundwater in the alluvial fan of the front of Qilian Mountain.
2. Study Area
2.1. General Setting
The Shule River Basin (located between 96°15′ and 98°30′ E longitude and 39°40′ and 41°00′ N latitude) lies within the mid-western portion of Hexi Corridor in northwest China’s Gansu Province (Figure 1). The basin is bound by the Qilian Mountains in the south and the Beishan Mountains in the north, and extends from Huahai village of Yumen city in the east to Guazhou county in the west. The basin encompasses an area of approximately 4.13 × 10⁴ km2. A significant geomorphic feature within the basin is the low-relief piedmont located along the Qilian Mountains, which includes the Changma alluvial fan. The general characteristic of the terrain in the south is higher than that in north, whereas the terrain in the east is higher than that in the west. The altitude from Changma dam is 1850 m; the river gradually declines to an elevation of about 1040 m in the west, lake area. The average slope is 10~15 m per thousand from south to north, and 2~3 m per thousand from east to west. The Changma alluvial fan is located in the upper part of the Shule River Basin. The fan covers a total area of 2.1 × 10³ km2. Nine wide and shallow erosion ditches have developed on the surface of the alluvial fan. The middle-lower part of the Shule River basin is covered by oases, consisting of the Changma, Shuangta and Huahai irrigation areas.
The Shule River originates in the Qilian Mountains at an elevation of around 4800 m; the length of the main stream is 670 km. Most of the flow within the Shule River is impounded by the Changma dam and used for irrigation in the adjacent oases. A large amount of water infiltrates into the gravel of the Changma alluvial fan to recharge the groundwater system. A portion of the water is discharged from springs located in fine-grained soil within the adjacent plain. These springs later converge to form the channel of the Shule River. The river flows through Yumen City and the Guazhou-Dunhuang basins where it eventually disappears as a result of infiltration and evaporation.
The Shule River Basin is located within the continental desert of mainland China and, thus, is extremely arid. Mean annual precipitation in the area is less than 60 mm, and decreases from southeast to the northwest. Annual precipitation is characterized by a distinct rainy season, which occurs from June through August. Mean annual temperatures range from 5.0 to 6.9 °C. The lowest temperature (−28 °C) occurred in January and the highest of 36 °C occurred in July. Potential annual evapotranspiration is approximately 3000 mm, with the highest evaporation intensities occurring from May to September (data from the Hydrological Bureau in Lanzhou of Gansu province, China).
2.2. Geology and Hydrogeology
Uplift of the Qilian Mountains began at the end of the Paleozoic era and continued through the Mesozoic era. The Qilian Mountains are linked to the adjacent Changma basin by high-angle reverse faults. Subsidence of the Changma basin continued until the Quaternary era, and allowed Tertiary- and Quaternary-age alluvial deposits to accumulate along the mountain front as a large alluvial apron (piedmont), which included the Changma alluvial fan (Figure 2). The alluvial deposits are underlain by impermeable basement rocks composed of low-grade, Paleozoic amphibolite. The thickness of the Quaternary sediments range from 700 m in the south to 100 m in the north (Figure 2).
A relatively fine-grained, low-relief plain is located at the toe of the alluvial fan, and extends approximately 60 km from south to north between the Changma Dam and the Beishan Mountains. The plain is composed of gravel, sand, and clay-sized sediments deposited during the Quaternary era. The apex and mid-section of the alluvial fan is dominated by gravel, and forms an unconfined aquifer with a thickness ranging from 100 m to 400 m. The aquifer is highly productive; its transmissivity ranges from 7000 to 10,000 m2 day−1 [40]. Depth to groundwater is currently greater than 100 m, and reaches a maximum of about 200 m near the apex of the alluvial fan. Groundwater becomes shallower near the fan toe where depths range from 10 m to 30 m.
Near the toe of the fan, the subsurface deposits consist of fine-grained sediments associated with the alluvial plain that overlie coarser fan gravels. The thickness of the surficial clay-rich layer ranges from 10 m to 15 m. The lower gravel and sand dominated layer exhibits a thickness ranging from 20 m to 90 m. Variations in the grain size of the deposits create a layered (confined) aquifer system characterized by a low-permeability surface layer that is underlain by a high-permeability layer. Groundwater in this area is close to the surface and locally emerges as springs along the toe of the alluvial fan. Shallow groundwater along the toe of the fan has led to soil salinization, a process that has become a serious problem in the region.
Upon emerging from the Qilian Mountains, water from the Shule River infiltrates into the coarse-grain deposits of the Changma alluvial fan, and accounts for about 80% of groundwater recharge in the basin [41]. Groundwater within the fan mainly flows from south to north along a hydraulic gradient that changes from 7‰ to 2‰. Groundwater recharge within the adjacent low-relief plain is primarily associated with infiltration along canals and irrigation. The groundwater flows from shallow to deeper zones in the aquifer within the southern portion of the basin. It then flows from deeper to shallower areas of the aquifer, and emerges as springs at the surface, after which it finally merges to form the channel of the Shule River. The Shule River flows from southwest to northeast along this lower reach of the study area; discharge is reduced along the middle and lower reaches of the Shule River because of evaporation and infiltration.
3. Materials and Methods
3.1. Sampling Profiles
Field work was carried out from July 2013 to November 2014. Twelve sampling sites were positioned from the apex to the toe of the Changma alluvial fan, all of which were located along and adjacent to the Shule River (Figure 1). The sampling sites were selected on the basis of the trend of the Shule River and groundwater flow. Selected characteristics of the sampling sites are listed in Table 1.
In situ sampling was performed at each site six times, which included once in July 2013, October 2013, March 2014, June 2014, September 2014, and November 2014. A total of 73 samples were collected. They included one sample of rainwater from Yumen City, six surface water samples from the Shule River, and 66 groundwater samples from water supply and irrigation boreholes within the Quaternary aquifer as well as from springs near the toe of the fan. Spring samples were collected where they emerged from the ground to be representative of in situ conditions. To ensure the groundwater samples came from the aquifer, the groundwater was pumped from the wells for about 10 min prior to sample collection. All sample bottles were washed at least three times using water from the wells or river (depending on sampled media). Water samples analyzed for major ions were collected in 1L bottles and labeled. Samples obtained for stable isotope analysis were collected in 100-mL plastic bottles with gas-tight caps. Samples for CFC analyses were collected by filling and capping glass bottles under water to ensure that the sample was not contaminated by atmosphere constituents [25]. Following collection, all samples were transported to the laboratory where they were stored below 5 °C. A portable conductivity meter (HANNA, HI9835) and a microcomputer acidity pH-temperature measuring instrument (HANNA, HI9124) were used to measure water temperature, electrical conductivity (EC), total dissolved solids (TDS), and pH in the field.
3.2. Chemical and Isotopic Analysis
Cations and anions were analyzed at the State Key Laboratory of Hydrology-Water Resources and Hydraulic Engineering at Hohai University, China. After filtering, subsamples were collected for the analysis of HCO3−, Cl−, SO42−, and NO3− (100 mL) as well as Na+, K+, Ca2+, and Mg2+ (20 mL). HCO3− was measured by direct titration. The anions of Cl−, SO42−, and NO3− were analyzed using ion chromatography (IC). Na+, K+, Ca2+, and Mg2+ concentrations were measured using ICP-AES (Thermo ICAP6300). The detection limit for all ions was 0.01 mg/L. Accuracy of duplicate analyses was estimated from the ionic balance error [42], and was within ±5% for most of the samples (Table 2).
Isotopic analysis of D and 18O were performed at the State Key Laboratory of the Institute of Cold and Arid Regions Environmental and Engineering Research, Chinese Academy of Sciences. Isotopic compositions for both are reported using the standard per mil () notation, which is calculated in terms of the ‰ deviation of the isotope ratio of the sample relative to the ratio in the V-SMOW (Vienna Standard Mean Ocean Water) standard. 18O was prepared using the CO2 equilibration method [43]. The determination of D was based on the zinc reduction method [44]. The ratios of 18O/16O and 2H/1H were measured with a MAT253 mass spectrometer. Reproducibility of the samples calculated from standards systematically interspersed in the analytical batches was ±0.20‰ for 18O, and ±0.20‰ for D. Measurements of 3H were performed by direct counting using a liquid scintillation counter (Tri-Carb 3170 TR/SL). Results are reported in tritium units (TU) with a typical error of ±0.10 TU. The detection limit for 3H measurement in the laboratory is about 0.8 TU.
The water samples were analyzed for CFCs at the Groundwater Dating Laboratory of the Institute of Geology and Geophysics, Chinese Academy of Sciences (ICG-CAS). The concentrations of CFC-11, CFC-12, and CFC-113 were detected by a purge-and-trap gas chromatography procedure, and an Electron Capture Detector (ECD) [23]. The detection limit for each CFC is about 0.01 pmol/L of water. The analytical error of the CFC measurement is less than ±5%.
4. Results and Discussion
4.1. Hydrogeochemistry of Groundwater
The total dissolved solids (TDS), pH, electronic conductivity, temperature and major ion concentrations measured in the groundwater samples are shown in Table 2. Electrical conductivity (EC) ranges from 746 μs/cm to 8840 μs/cm (Table 2). In general, the samples are near neutral or slightly alkaline with pH values ranging between 6.4 and 8.4. The temperature of the water samples is lower than 20 °C throughout the year. Temporally, TDS concentrations varied with season at each sampling site; the values of TDS in June 2014 were much higher than the TDS values during the other months. Evaporation and condensation are intense in June because of the higher temperatures, and may be responsible for the higher values. Spatially, TDS values in groundwater ranged from 418 mg/L to 788 mg/L (No. 2, 3, 4 and 5) in the upper fan area, indicating that it is relatively fresh water. TDS values in the groundwater were similar to those measured in the surface water, the latter of which ranged from 412 to 886 mg/L; the mean value was 602 mg/L. The similarity in TDS values suggests that the surface and groundwater have a close hydraulic relationship.
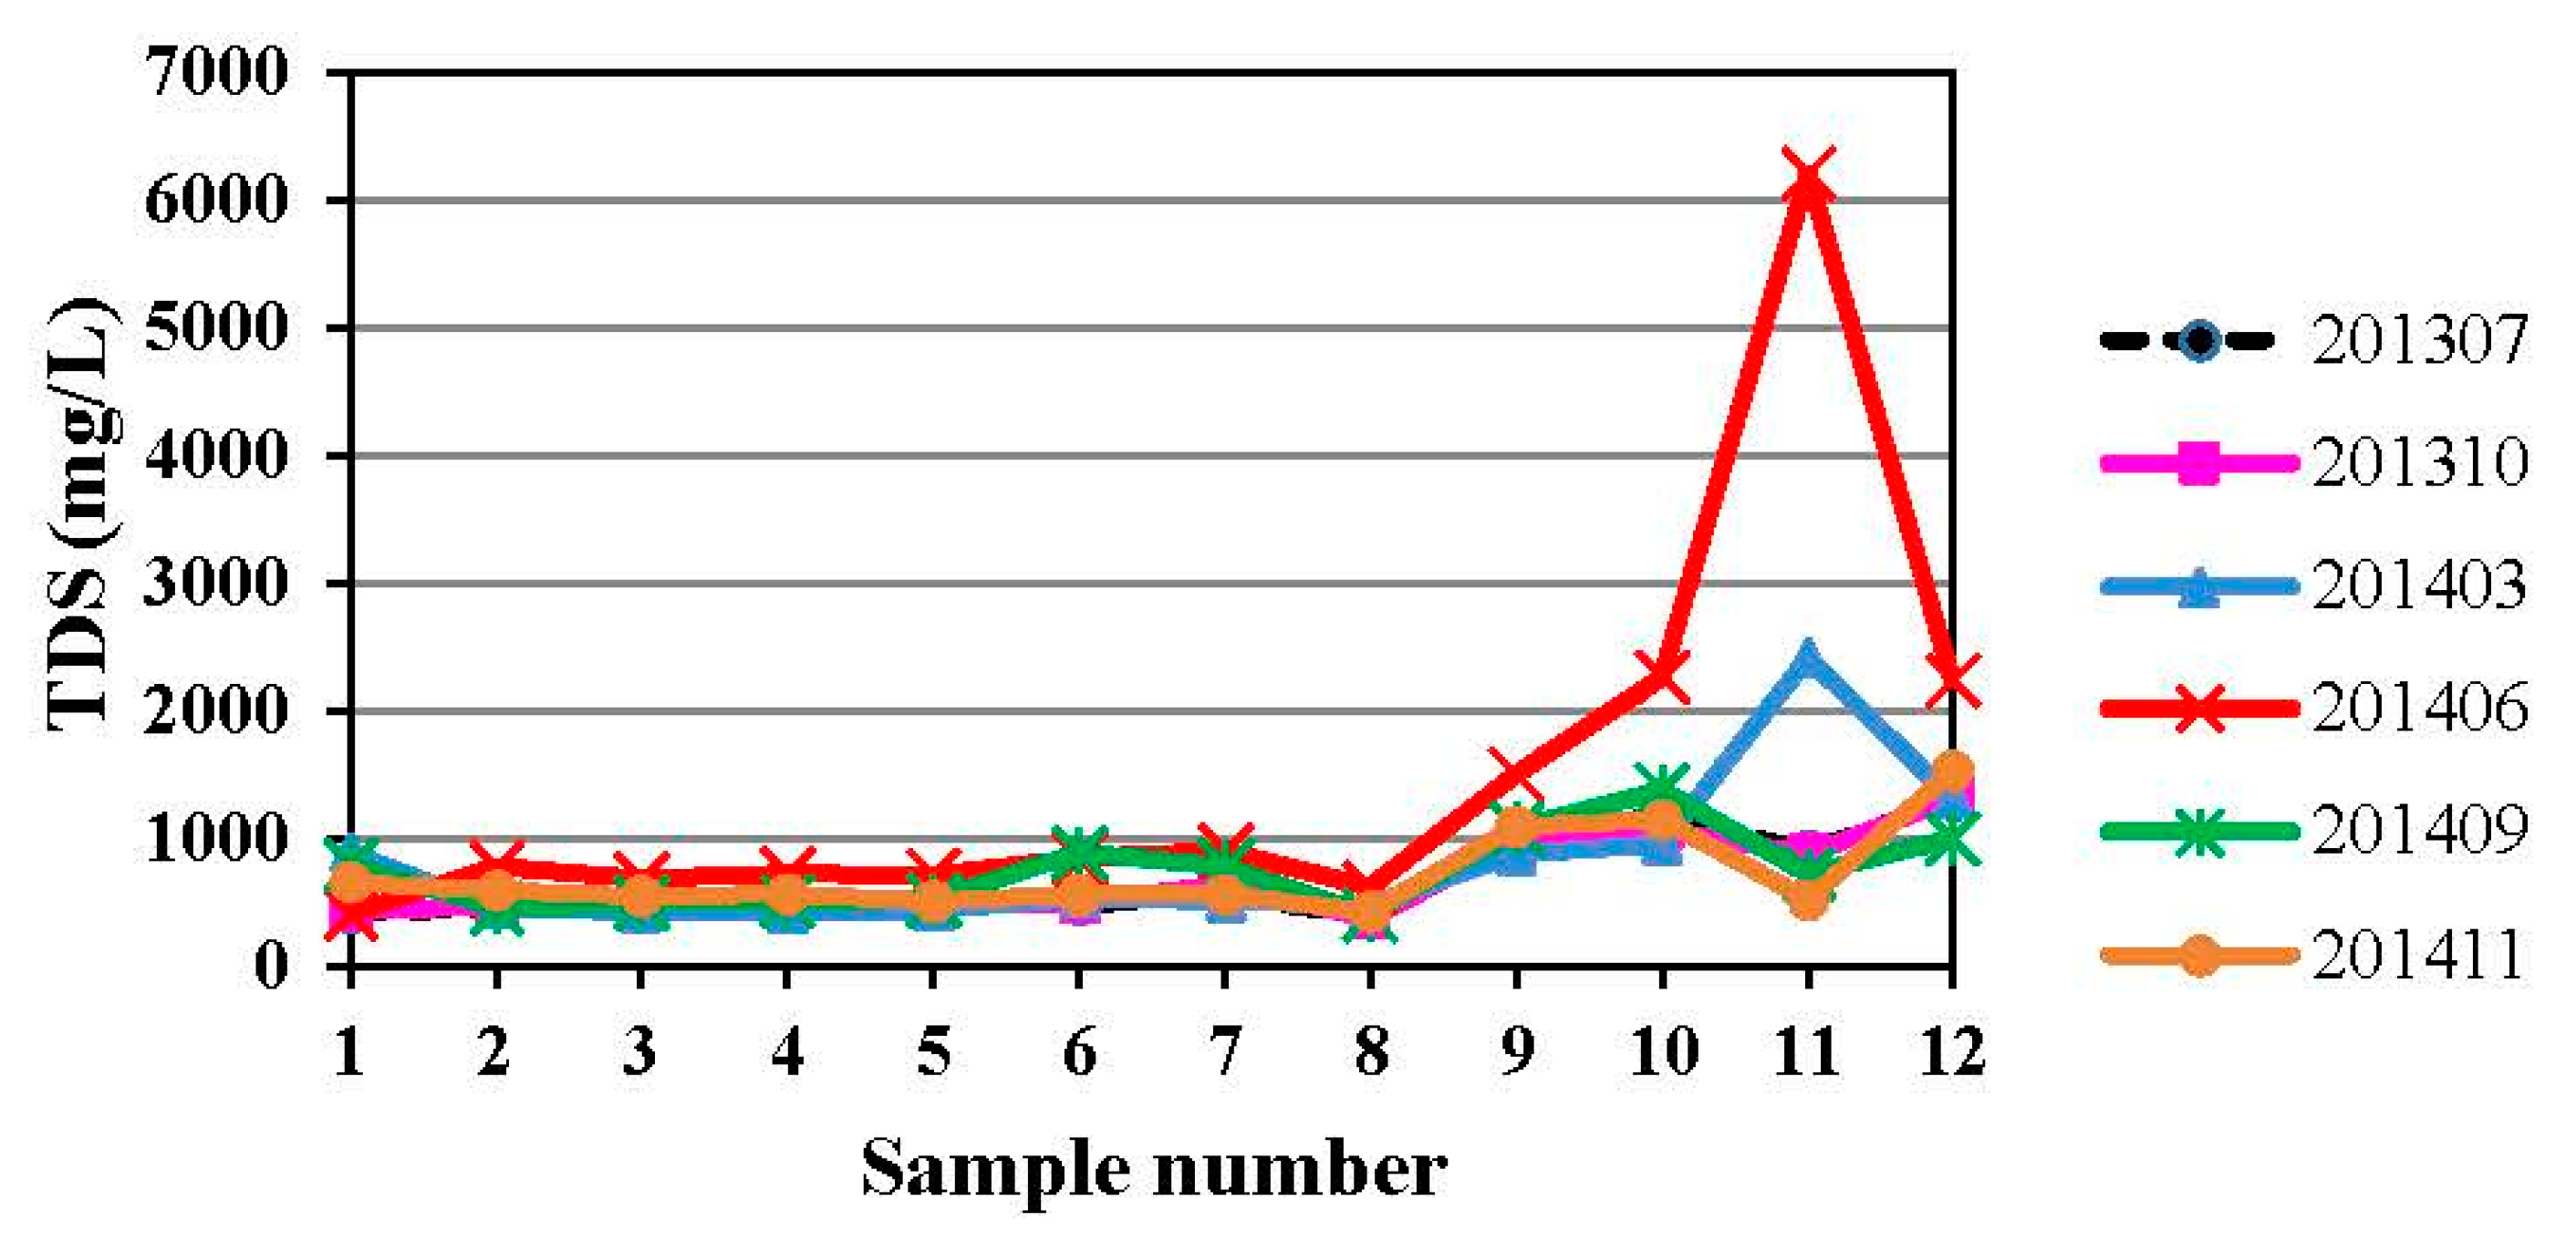
TDS values increased gradually northward along the path of groundwater flow, resulting in relatively high TDS values in spring water emerging along the toe of the alluvial fan. For example, the TDS of spring water at sampling site No. 11 reached 6220 mg/L in June 2014 (Figure 3), presumably in response to strong evaporation, whereas TDS was consistently higher than 1000 mg/L at sampling site No. 12 located in the fine soil plain. Therefore, groundwater quality, as expressed by TDS, declines from the upper section of the alluvial fan toward the center of the basin.
Table 2 shows that major ion concentrations are spatially and temporally variable. Temporally, sulfate concentration ranged from 59.0 mg/L at site No. 2 on 16 October 2013 to 1617.76 mg/L at site No. 11 on 28 June 2014. The maximum and minimum concentration of nitrate was 18.12 mg/L (site No. 9, 5 November 2014), and 0.42 mg/L (site No. 1, 18 July 2013), respectively. The reason for the differences in the ion concentrations may be related to soil type, evaporation, the Shule River, groundwater, and human factors (e.g., groundwater pumping).
Concentrations of Ca2+, Mg2+, Na+, HCO3−, Cl−, and SO42− are often used to evaluate spatial and temporal variations in groundwater quality (Figure 4). Figure 4a shows the variations in Ca2+ concentration through time at each sampling site. For surface water sample No. 1, Ca2+ concentrations varied through time from 29.5 to 92.8 mg/L. For groundwater samples at sites No. 2–8, Ca2+ concentrations were higher in July and October 2013 than during the sampled months of 2014, suggesting that Ca2+ concentrations were diluted by groundwater flow over time. From March to November 2014, Ca2+ changes little through time at sites located from the top to middle of the alluvial fan. However, Ca2+ concentrations increased significantly in the spring water at the toe of the alluvial fan (sites No. 9, 10 and 11), and within groundwater samples collected from the downstream fine soil plain (site No. 12). The maximum Ca2+ concentration reached 229.3 mg/L in March 2014 at the spring water sampling site No. 11. The reason is that the temperature is low in March 2014, as is the evaporation intensity. The down-flow variations in Ca2+ concentration, observed every month that was sampled, indicates that groundwater quality tends to deteriorate from the top to bottom of the alluvial fan.
Figure 4b shows that Mg2+ concentration does not change significantly between seasons for most sampling sites. However, Mg2+ concentration is higher in March 2014 within spring water at site No. 11 than during the other months in 2013 and 2014. The maximum value reached was 313.2 mg/L. This high value is related to the low evaporation intensity and low temperature in March 2014. Mg2+ concentration varied little from the top to bottom of the alluvial fan, and was consistently below 50 mg/L for most groundwater samples (from sites No. 2–8). Mg2+ concentrations increased toward the toe of the alluvial fan (sites No. 9, 10, and 11) and into the fine soil plain (No. 12). Thus, spatial changes in Mg2+ concentration were similar to those observed for Ca2+.
Na+ concentration was typically larger in November 2014 than the other months in 2013 and 2014 for samples collected from sites No. 2–10 (Figure 4c). This implies that the Na+ was easily dissolved in groundwater in November when evaporation intensity and temperature are low. However, maximum Na+ concentrations reached 341.9 mg/L in June 2014 in spring water collected at site No. 11, which is related to evaporation. As the evaporation in June 2014 is relatively large, Na+ concentration increases, especially along the toe of the alluvial fan (site No. 11) and the downstream fine soil plain (site No. 12).
Variations in HCO3− concentration through time differ between sampling sites (Figure 4d). At most sites, HCO3− concentration undergoes large changes through time. Spatially, for sampling sites No. 2–8, HCO3− concentration is relatively stable from the top to the bottom of the alluvial fan. However, its concentration increases significantly along the toe of the alluvial fan and within the downstream fine soil plain. It was especially high here in March 2014 when it reached a maximum HCO3− concentration of 938.2 mg/L.
Temporal changes in the Cl− concentration of groundwater samples from sites No. 2–8 are weak, except for July 2013 (Figure 4e). The Cl− concentration in July may be related to relatively high evaporation. Cl− concentrations increased along the toe of the alluvial fan (sites No. 9–11), where they reached a maximum value of 398.17 mg/L in June 2014. These high Cl− concentrations in spring water likely reflected high evaporation. In the downstream fine-soil plain (site No. 12), the Cl− concentration in groundwater continued to increase, reaching a maximum value of 451.56 mg/L in June 2014.
Figure 4f shows that SO42− concentration in groundwater is high. However, it is relatively stable through time, except for the samples collected in July 2013–November 2014 at sampling site No. 11. The variation in SO42− concentration was similar to that of Cl−. Spatial changes in SO42− concentration in groundwater are weak from sites No. 2–8, except for samples collected in July 2013. However, it increases along the edge of the alluvial fan (from sites No. 9–11). It reached a maximum value of 1617.76 mg/L in June 2014 in the spring water from site No. 11. The observed temporal and spatial patterns may reflect the influence of evaporation on SO42− concentration.
In summary, the temporal and spatial variation in ion concentrations differed between sampling sites. However, for most samples, the variation of ion concentration is relatively stable through time within the main body of the alluvial fan, indicating that the aquifer is hydraulically connected. However, along the toe of the alluvial fan and the downstream fine soil plain, ion concentrations typically increased, showing that the groundwater quality deteriorated near the toe of the alluvial fan.
4.2. Isotope Analysis
The environmental isotopes D, 18O, 3H are excellent tracers for determining the origin of groundwater and are widely used to study groundwater movement [45,46,47,48]. Precipitation is an important source of water for recharging groundwater systems. The D and 18O values in samples of precipitation often differ from those measured in groundwater. These differences result from the isotopic fractionation of the isotopes, which is primarily driven by the evaporation and condensation of the water. Since both processes (evaporation and condensation) are influenced by latitude, elevation, temperature, and the amount of precipitation, these factors also influence the hydrogen and oxygen isotope compositions of meteoric, surface, and groundwater. The local meteoric water line (LMWL) defines the relationship between hydrogen and oxygen isotopes for local meteoric waters. It is controlled by local hydrometeorological factors, including the origin of the water vapor, the re-evaporation of water during rainfall and the seasonality of precipitation [49].
Within the study area, the isotope composition of precipitation measured at sampling site No. 13, surface water (site No. 1), groundwater (from sites No. 2–8 and No. 12), and spring water (from sites No. 9–11) were measured in July and October of 2013 (Table 3). The D and 18O values of rainwater from Yumen City are 16.32 and 1.68‰, respectively (Table 3, Sample No. 13), indicating that precipitation is relatively enriched with heavy isotopes. Excess deuterium (d) is another important parameter describing the isotopic composition of precipitation, and is defined as D-818O [50]. The d value measured within the study area is 2.88‰, which is relatively low in comparison to the global meteoric water line (GMWL). It is important to note, however, that only one precipitation sample was collected during the summer season and, thus, it may not be representative of the entire Shule River Basin. Therefore, the local meteoric water line (LMWL) developed for Zhangye station was used. The Zhangye station LMWL is expressed as D = 7.518O + 2.7 [51]. Both the slope and intercept of this line are lower than those of the GMWL (D = 818O + 10) as shown in Figure 5. The lower values suggest the occurrence of secondary evaporation during rainfall, which is not surprising given the arid conditions in northwestern China. The LMWL calculated for the Qilian Mountains using the data from Yeniugou station is expressed as D = 7.618O + 12.4 [30].
The D and 18O isotopic composition of Shule River water samples collected in July and October 2013 ranged from −55.57 to −55.74‰ and from −8.51 to −9.09‰, respectively (Table 3, Sample No. 1). The d values varied between 12.51 and 16.98‰. The mean values are −55.65 and −8.8‰ for the Shule River. Observed difference in the isotopic composition of the collected surface water is presumably related to seasonal variations in isotopic values. In summer, the values of D and 18O of river water were slightly more positive than water collected in autumn. Thus, river water was enriched in the heavy stable isotopes during the summer when evaporation was relatively high.
In July 2013, groundwater samples collected from sites No. 2–8, and No. 12 had D values ranging from −64.38 to −55.67‰; 18O values ranged from −10.13 to −8.52‰. Average D and 18O values were −58.43 and −9.07‰, respectively, whereas d varied between 10.19 and 16.74‰ (the mean was 14.14‰). However, in October 2013, groundwater specimens exhibited D and 18O values of −65.4 to −55.4‰ and −10.06 to −8.82‰, respectively, with corresponding mean values of −59.4 and −9.0‰. The parameter d varied between 11.65 and 15.08‰, and averaged 13.07‰. For most groundwater samples, the values of D and 18O during the summer were slightly higher than those in autumn (Table 3), indicating that the heavy stable isotopes were enriched in groundwater during the summer. Groundwater from the confined aquifer located at sampling site No. 5 exhibited D and 18O values that were lower than in groundwater samples obtained from the unconfined aquifer (i.e., from water collected from sites No. 2, 3, 4, 6, 7, 8, and 12). Because the shallow groundwater samples have been subjected to more evaporation than groundwater in the confined aquifer, the stable isotopic composition of deep groundwater is depleted in heavy isotopes.
The D and 18O values of spring samples, collected from sites No. 9–11 in July 2013 along the toe of the alluvial fan, ranged from −57.03 to −52.69‰ (mean= −54.14‰) and from 8.87 to −8.03‰ (mean=−8.33‰), respectively. Values of d varied from 11.53 to 13.93‰ (mean = 12.52‰) (Table 3). The D and 18O values of spring water were strongly related to each other. In October 2013, the D of spring waters ranged from −57.4 to −52.63‰ (with a mean value of −55.58‰), whereas 18O ranged from −9.09 to −8.26‰ (with a mean of −8.74‰). Values of d varied from 13.45 to 16.0‰ (14.39‰ on average). The average values of D and 18O of spring waters in summer were relatively higher than those in autumn, indicating that heavy stable isotopes were enriched in the spring water during the summer. The isotopic composition of the spring water was similar to those of groundwater within the upper part of the alluvial fan (from sites No. 2–8). This similarity may be due to the discharge of spring water from shallow groundwater supplies along the mountain front.
Figure 5 shows the relationship between D and 18O for rainwater (LMWL, GMWL), groundwater and surface water, respectively. Most groundwater samples are located to the left of the GMWL, and near the surface water samples (Figure 5). The isotopic composition of groundwater in the alluvial fan was similar to the values measured in surface water, suggesting that the groundwater was derived from the infiltration of river water coming from the mountains. Most groundwater samples in the alluvial fan exhibit isotopic values that are distributed along the Yeniugou LMWL, which indicates that precipitation in the Qilian Mountains is the primary source of the river water, and thus groundwater, in the upper fan deposits.
4.3. Tritium Content in Groundwater
Variations in the concentration of 3H have been used to gain insight into the mechanisms of local recharge. 3H is a radioactive isotope of hydrogen with a half-life of 12.3 years. Thus, the use of tritium as a hydrologic tracer is generally suitable for the analysis of shallow groundwater that was recharged within the past 50 years. The level of 3H in precipitation has increased by a few thousand TU since 1952 because of nuclear weapons testing, most of which occurred in the northern hemisphere. The maximum 3H concentration measured in the northern hemisphere was 6000 TU during the summer of 1962–1963 [52]. The maximum 3H concentration prior to nuclear bomb testing in 1952 is less than 1 TU.
During this study, the 3H value measured in a surface water samples collected in July 2013 was 10.91 TU, whereas it was 12.45 TU in October 2013. The values of 3H in groundwater samples (including the spring water samples) ranged from 0.8 to 25.69 TU in July and from 0.9 to 25.99 TU in October 2013. The corresponding average values were 15.28 TU and 14.54 TU, respectively. For most shallow groundwater samples (sites No. 3, 4, 6, 7, 10 and 11), the measured 3H values were between 15.0 TU and 25.0 TU. The observed range of 3H values indicate either that the groundwater is composed of recently infiltrated meteoric or surface waters, or the water is relatively old (>~50 years) and 3H values have decreased significantly through time as a result of radioactive decay. The groundwater sample collected from site No. 5, which exhibits 3H values less than 1 TU, is likely to represent older groundwater.
4.4. CFC Apparent Ages
CFCs are anthropogenic gases whose atmospheric concentrations increased linearly from 1960 to 1990 (when they were banned). Since 1990, their concentration has been gradually decreasing. As the concentration of CFCs in infiltrating waters reflects the concentrations within the atmosphere at the time of recharge, a comparison of the values measured in groundwater to the known variations in CFCs in the atmosphere allows for a determination of the average age of the groundwater. The comparison of aqueous concentrations to atmospheric concentrations is based on Henry’s Law [53], which requires an estimate of the recharge temperature and elevation. The recharge temperature is the water-air equilibrium temperature at the time the groundwater was isolated from the atmosphere. The mean annual air temperature in this area is 5.5 °C. The change in total atmospheric pressure with altitude was estimated by the equation,
where H represents the recharge elevation. Only a rough estimation of recharge elevation by isotopes is possible. Recharge elevation was calculated as,
where is the isotopic value of groundwater at the sampling site, is the isotopic value of precipitation near the sampling site, denotes the elevation, and is the isotopic altitude gradient. The value of 18O/altitude ranges from −0.1 to −0.155‰ in typical arid and semi-arid regions [49]. Therefore, the calculated recharge elevation is about 2500 m for the study area.
The apparent ages calculated on the basis of CFCs is summarized in Table 3. The concentrations of CFC-11, CFC-12 and CFC-113 in groundwater and spring water ranged from 1.7–7.41 pmol/kg, 0.83–3.24 pmol/kg and 0.06–0.54 pmol/kg, respectively. The results showed that based on the piston flow model, the average apparent age determined for a total of 22 samples ranged from 23 to 40 a. Utilization of the different CFCs (CFC-11, CFC-12 and CFC-113) yield different apparent ages. Thus, estimated ages of groundwater on the basis of CFCs was inconclusive. Nearly all samples have concentrations of CFCs that are within the range expected for air-saturated water at the sampling time. Six groundwater samples (CFC-11 at site No. 7, CFC-12 at site No. 4 and No. 11, collected in July and October 2013) had CFCs concentrations that exceeded those that should be in equilibrium with modern air and were considered “contaminated”. Twelve samples obtained from sites No. 2–4, 7, 9, and 10 in July and October 2013 had CFCs concentrations close to those in equilibrium with modern air, and yielded younger than average CFC apparent ages of less than 30 a. The other 10 samples collected from sites No. 5, 6, 8, 11 and 12 in July and October 2013 showed relatively low CFC concentrations, and therefore yielded older than average CFC apparent ages that were larger than 30 a.
The apparent age of groundwater and springs is considered to represent the residence time of the groundwater in the subsurface. In general, groundwater and spring waters in the study area were mainly recharged from 1973 to 1990. Based on the area’s hydrogeology and geomorphology, the apparent ages of groundwater in the upper part of the alluvial fan ranged from 23 to 26 a (at sites No. 2–4), which indicates that the groundwater residence time is short, and that the groundwater circulation rate is relatively fast (Figure 6). However, the groundwater age of site No. 5 is older than that at sites No. 2–4, which indicates that the groundwater may come from the confined aquifer. In addition, the field investigation shows that No. 5 well is an original artesian well. Groundwater collected from along the toe of the alluvial fan from springs varied between 26 and 32a (at sites No. 9–11). These ages are older than those calculated for the upper part of the alluvial fan. Groundwater from the fine soil plain, such as at site No. 12, exhibited an age greater than 30 a, which indicates that groundwater circulation rate in this area had decreased. The spatial pattern in CFC apparent ages suggests that groundwater was recharged within and along the front of the Qilian Mountains, flowed through the alluvial fan from the south to north, and was discharged to the river through springs near the toe of the fan. The age of the water also indicates that a few decades are needed for groundwater to complete the entire flow path, in part because of the influence of strata characterized by low-permeability, particularly near the toe of the alluvial fan.
4.5. Evolution of Groundwater in the Alluvial Fan
Piper diagrams can be used to describe the geochemical evolution of groundwater along a flow path. Cation and anion concentrations determined for each sample were converted to total meq/L and plotted as percentages of their respective totals. The relative percentages of cations and anions in each triangle are then projected into a quadrilateral polygon that describes the water type or hydrochemical facies. In this study, piper diagrams were used to understand variations in groundwater chemistry during the different seasons of 2014 (Figure 7). From March to September 2014, Ca2+ and Mg2+ are the predominant cations, whereas HCO3− and SO42− were the predominant anions within the upper and medial sections of the alluvial fan (sites No. 2–8). The concentrations of Ca2+, Mg2+, and HCO3− tend to differ between the wet and dry seasons, but the hydrochemical type is uniform, which is defined by Ca2+-Mg2+-HCO3−-SO42− type. However, the concentration of Mg2+ increases, and the hydrochemical type changes to the Mg2+-HCO3−-SO42− type, for most groundwater samples collected in November 2014. The hydrochemical type of spring water (from sites No. 9–11) plotted as the Ca2+-Mg2+-HCO3−-SO42− type in March 2014. Due to high evaporation rates in June 2014, the concentrations of Na+ and Cl− increased, and the hydrochemical type of spring water changed to the Na+-Mg2+-SO42−-Cl− type. The concentration of Cl− subsequently decreased while that of HCO3− increased in spring water in September and November 2014, resulting is the Na+-Mg2+-SO42−-HCO3− geochemical type. Within the fine soil plain, the relative occurrences of both cations and anions in the groundwater samples varied with seasons, yielding hydrochemical water types ranging from Ca2+-Mg2+-HCO3−-SO42, to Na+-Mg2+-Cl− to Na+-Mg2+-SO42−-Cl− to Na+-Mg2+-SO42−. Given that the groundwater was recharged by the Shule River in the apex of the alluvial fan, and that the major groundwater is dominated by the Ca2+-Mg2+-HCO3−-SO42− type in this area, dissolution appears to have been the predominant hydrochemical process. As groundwater flowed from the apex to the toe of the alluvial fan, the major cations and anions changed from Ca2+ to Na+ and Mg2+, and from HCO3− to SO42− and Cl−, respectively. This change in groundwater chemistry was probably promoted by slow rates of groundwater flow, and shallow depths to the table, particularly within the fine soil plain. The shallow groundwater depths allow the chemistry of the groundwater to be effected by both evaporation and seepage irrigation. The most abundant cations are Na+ and Mg2+, and the most abundant anions are SO42− and Cl−. Generally, this is consistent with the evolutionary trend of groundwater from zones of recharge to discharge in arid regions.
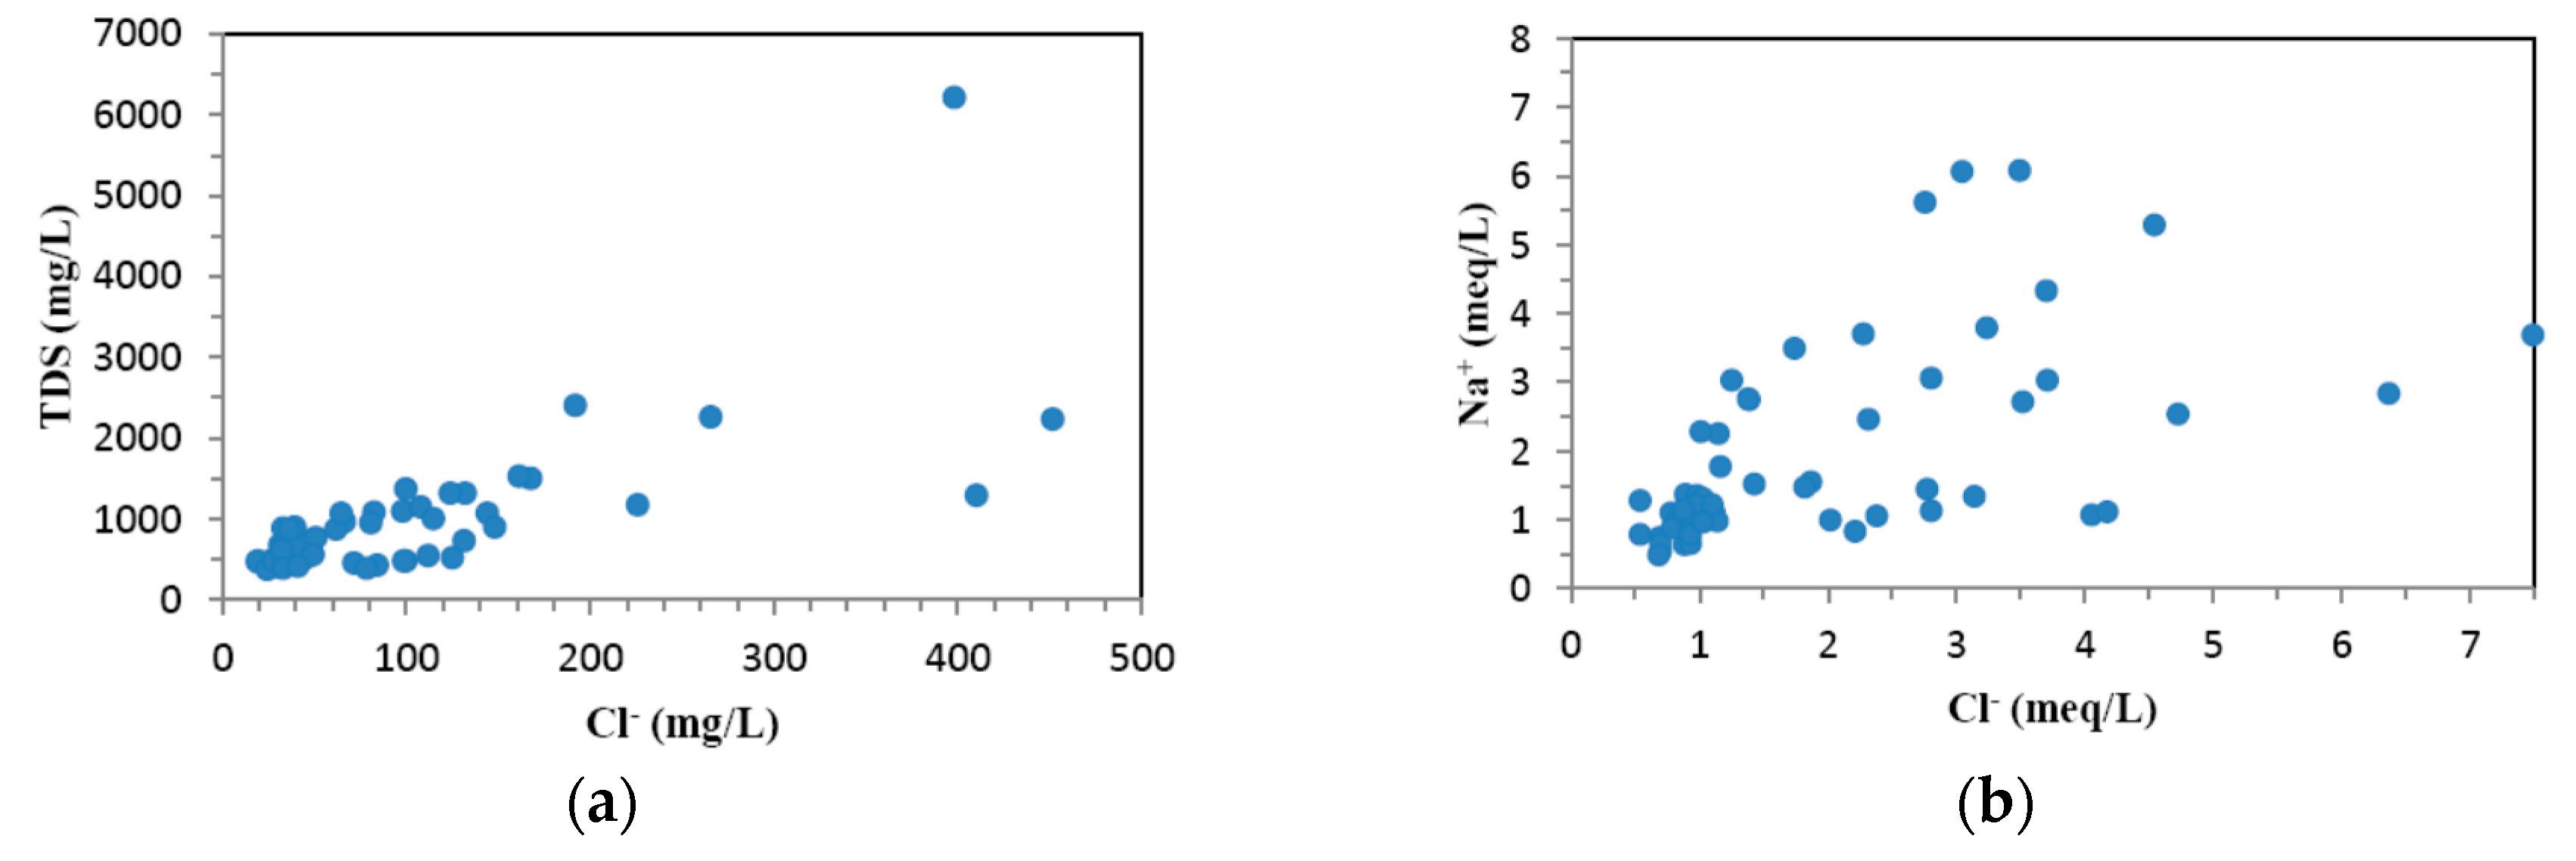
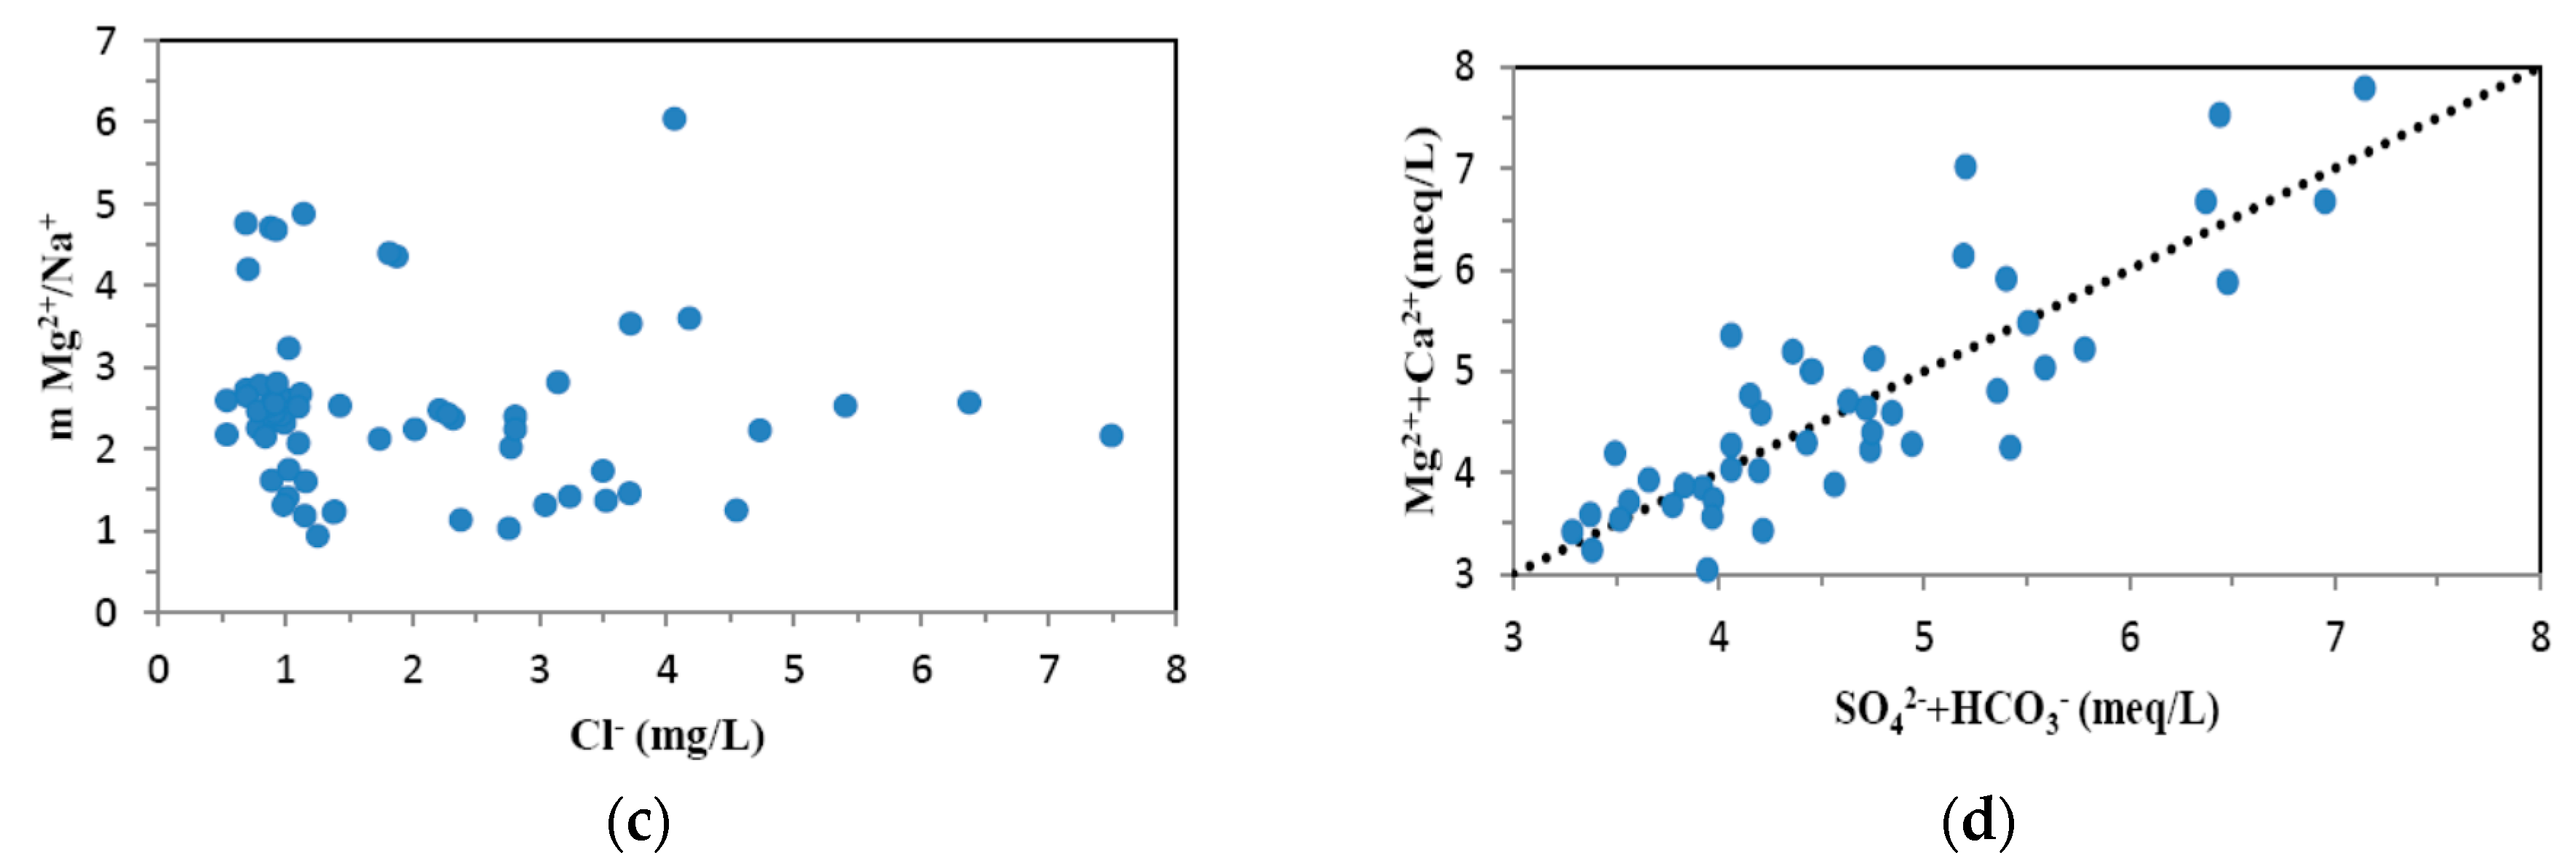
The chemical species dissolved in groundwater are not independent, and the relationship between various ions can be used to study the characteristics and water-rock interaction. The Cl− ion undergoes few chemical reactions in the natural environment, and mainly originates from the dissolution of halite in evaporate deposits. In this arid area, the Cl− concentration is correlated with TDS, as shown in Figure 8a, suggesting that Cl− and TDS increase continuously along the groundwater flow path. The other ions also have good linear correlation with TDS, which demonstrates that dissolution is a major hydrogeochemical process in this region. The ions of Cl− and Na+ have a linear relationship Na+ = 0.6 Cl− + 0.9 (R2 = 0.5) as shown in Figure 8b. The molar ratio mNa+/Cl− is lower than one, which indicates that Na+ is mainly derived from dissolution of halite. The ions of Cl− and K+ are also correlated, and mK+/Cl− is 0.04, indicating that K+ is from dissolution of sylvite. The mMg2+/Na+ ratio ranges from 0.92 to 6.04, with a mean value of 2.47 (Figure 8c). It is consistent with the abundant Mg-rich lithology of this area, indicating that carbonate with high magnesium is rich in the aquifer. Furthermore, there is a good correlation between Ca2+ + Mg2+ and SO42− + HCO3− (Figure 8d, R2 = 0.94), and the slope is 0.9. It indicates that the ions of Ca2+, Mg2+, SO42− and HCO3− are mainly derived from dolomite, gypsum and calcite.
In addition, ion exchange processes were assessed using the chloroalkaline (CLA) index,
CLA = [Cl− − (Na+ + K+)]/Cl−
If the CLA value is positive, Ca2+ and Mg2+ ions in the aquifer system are gradually replaced by Na+ and K+; if the value is negative, then reverse ion exchange occurs. CLA indices were employed to assess the extent of ion exchange. The results show that about 74.2% of the calculated indices were more than zero. It implies that the Ca2+ and Mg2+ ions in the groundwater mainly come from ion exchange reactions.
5. Conclusions
In this paper, the source, flow rates, and geochemical evolution of groundwater within an alluvial fan located along the front of Qilian Mountain were investigated by analyzing spatial and temporal trends in major ions and environmental isotopic tracers. TDS measured in surface waters was similar to that in groundwater near the mountain front, implying that the surface water and groundwater in this area are hydraulically link and closely related. Ionic salts accumulated gradually during the northward flow of groundwater through the fan deposits. Upon reaching springs located along the toe of the fan, discharged waters exhibited TDS concentrations that were higher than those of the groundwater samples from the upper part of the alluvial fan.
For most samples, down-fan spatial variations in ion concentration were relatively stable through time, suggesting that groundwater within the upper and medial sections of the fan exhibits a high level of hydraulic connection. However, the concentration of most ions increased near the toe of the alluvial fan and within the fine soil plain. The increased concentrations show that groundwater quality tended to deteriorate from the top to bottom of the alluvial fan. Specific alterations in groundwater chemistry along the predominant flow path included a down-fan change from Ca2+ to Na+ and Mg2+, and from HCO3− to SO42− and Cl−. Geochemical changes in water chemistry were consistent with the evolutionary trend typically observed for groundwater migrating from zones of recharge to discharge in arid regions.
Several environmental tracers (D, 18O, 3H and CFCs) were used to assess the source and residence time of groundwater in the alluvial fan. The values of D and 18O of river waters in July were slightly more positive than those observed in autumn, indicating that the river water was enriched in heavy stable isotopes in summer, presumably because of high rates of evaporation. The isotopic compositions of groundwater samples from the unconfined aquifer were higher than those measured from the confined aquifer. In comparison to samples collected from shallow groundwater, evaporation had less of an impact on the isotope composition of the groundwater within the confined aquifer. The isotopic composition of springs was similar to those of the groundwater found in the upper part of the alluvial fan, due to the spring samples from the mountain front as the discharge of shallow groundwater. Most groundwater samples from the alluvial fan exhibit isotopic values that are distributed near the Yeniugou LMWL, indicating that precipitation in the Qilian Mountains is the primary source of groundwater. For most shallow groundwater samples, the measured 3H values are between 15.0 TU and 25.0 TU, which indicates either (1) the groundwater is very young, or (2) the groundwater is relatively old (>~50 years), and the low tritium concentrations reflecting the significant decline in concentrations by radioactive decay. However, the groundwater sample from site No. 5 exhibited tritium values less than 1TU, which are much lower than those expected in “young” waters. Thus, groundwater at this site may be older than 50 years. The apparent groundwater ages determined by CFCs varied from 23 to 40 a; the mean age was 30 a. Groundwater samples in the south part (fan apex) were younger than those in north part (fan toe) within the study area. It is concluded that groundwater was recharged within and along the front of the Qilian Mountains, flowed down-fan from south to north before being discharged to the river, in part through springs. The age data indicate that several decades are needed for groundwater to flow from the upper fan area to the springs at the fan toe. Groundwater flow rates may have been reduced by the low-permeable layers, particularly fine-grained strata near the fan toe and within the fine soil plain.
Acknowledgments
This research was supported by the National Natural Science Foundation of China (No. 41772235, No. 41402201), and the Natural Science Foundation of Jiangsu Province of China (No. BK20140843). It was also supported by the Fundamental Research Funds for the Central Universities (No. 2016B05814).
Author Contributions
Qiaona Guo conceived and designed the study; Qiaona Guo and Zhifang Zhou collected and analyzed field data; Shan Wang analyzed laboratory data; Qiaona Guo wrote the paper with the assistance of Zhifang Zhou.
Conflicts of Interest
The authors declare no conflict of interest.
References
- Zhu, G.F.; Li, Z.Z.; Su, Y.H.; Ma, J.Z.; Zhang, Y.Y. Hydrogeochemical and isotope evidence of groundwater evolution and recharge in Minqin Basin, Northwest China. J. Hydrol. 2007, 333, 239–251. [Google Scholar] [CrossRef]
- Ma, J.Z.; He, J.H.; Qi, S.; Zhu, G.F.; Zhao, W.; Edmunds, W.M.; Zhao, Y.P. Groundwater recharge and evolution in the Dunhuang Basin. Appl. Geochem. 2013, 28, 19–31. [Google Scholar] [CrossRef]
- Scanlon, B.R.; Keese, K.E.; Flint, A.L.; Flint, L.E.; Gaye, C.B.; Edmunds, W.M.; Simmers, I. Global synthesis of groundwater recharge insemiarid and arid regions. Hydrol. Process. 2006, 20, 3335–3370. [Google Scholar] [CrossRef]
- Vairavamoorthy, K.; Gorantiwar, S.D.; Pathirana, A. Managing urban water supplies in developing countries-climate change and water scarcity scenarios. Phys. Chem. Earth Parts A/B/C 2008, 33, 330–339. [Google Scholar] [CrossRef]
- Vanderzalm, J.L.; Jeuken, B.M.; Wischusen, J.D.H.; Pavelic, P.; La Salle, C.L.; Knapton, A.; Dillon, P.J. Recharge sources and hydrogeochemical evolution of groundwater in alluvial basins in arid central Australia. J. Hydrol. 2011, 397, 71–82. [Google Scholar] [CrossRef]
- Keesari, T.; Kulkarni, U.P.; Deodhar, A.; Ramanjaneyulu, P.S.; Sanjukta, A.K.; Kumar, U.S. Geochemical characterization of groundwater from an arid region in India. Environ. Earth Sci. 2014, 71, 4869–4888. [Google Scholar] [CrossRef]
- Edmunds, W.M.; Ma, J.; Aeschbach-Hertig, W.; Kipfer, R.; Darbyshire, D.P.F. Groundwater recharge history and hydrogeochemical evolution in the Minqin Basin, North West China. Appl. Geochem. 2006, 21, 2148–2170. [Google Scholar] [CrossRef]
- Qi, S.Z.; Luo, F. Hydrological indicators of desertification in the Heihe River Basin of arid northwest China. J. Hum. Environ. 2006, 35, 319–321. [Google Scholar]
- Aeschbach-Hertig, W.; Gleeson, T. Regional strategies for the accelerating global problem of groundwater depletion. Nat. Geosci. 2012, 5, 853–861. [Google Scholar] [CrossRef]
- Lapworth, D.J.; MacDonald, A.M.; Tijani, M.N.; Darling, W.G.; Gooddy, D.C.; Bonsor, H.C.; Araguas-Araguas, L.J. Residence times of shallow groundwater in West Africa: implications for hydrogeology and resilience to future changes in climate. Hydrogeol. J. 2013, 21, 673–686. [Google Scholar] [CrossRef] [Green Version]
- Shen, Z.L.; Zhu, W.H.; Zhong, Z.S. Basis of Hydrogeochemistry; Geology Press: Beijing, China, 1993. (In Chinese) [Google Scholar]
- He, J.H.; Ma, J.Z.; Zhang, P.; Tian, L.M.; Zhu, G.F.; Edmunds, W.M.; Zhang, Q.H. Groundwater recharge environments and hydrogeochemical evolution in the Jiuquan Basin, Northwest China. Appl. Geochem. 2012, 27, 866–878. [Google Scholar] [CrossRef]
- Wang, P.; Yu, J.J.; Zhang, Y.C.; Liu, C.M. Groundwater recharge and hydrogeochemical evolution in the Ejina Basin, northwest China. J. Hydrol. 2013, 476, 72–86. [Google Scholar] [CrossRef]
- Liu, F.; Song, X.; Yang, L.; Zhang, Y.; Han, D.; Ma, Y.; Bu, H. Identifying the origin and geochemical evolution of groundwater using hydrochemistry and stable isotopes in the Subei Lake basin, Ordos energy base, Northwestern China. Hydrol. Earth Syst. Sc. 2015, 19, 551–565. [Google Scholar] [CrossRef]
- Kamtchueng, B.T.; Fantong, W.Y.; Ueda, A.; Tiodjio, E.R.; Anazawa, K.; Wirmvem, M.J.; Mvondo, J.O.; Nkamdjou, L.S.; Kusakabe, M.; Ohba, T.; et al. Assessment of shallow groundwater in Lake Nyos catchment (Cameroon, Central-Africa): implications for hydrogeochemical controls and uses. Environ. Earth Sci. 2014, 72, 3663–3678. [Google Scholar] [CrossRef]
- Huang, Y.; Zhou, Z.F.; Wang, J.G.; Dou, Z.; Guo, Q.N. Spatial and temporal variability of the chemistry of the shallow groundwater in the alluvial fan area of the Luanhe river, North China. Environ. Earth Sci. 2014, 72, 5123–5137. [Google Scholar] [CrossRef]
- Ledesma-Ruiz, R.; Pasten-Zapata, E.; Parra, R. ; Harter, T; Mahlknecht, J. Investigation of the geochemical evolution of groundwater under agricultural land: A case study in northeastern Mexico. J. Hydrol. 2015, 521, 410–423. [Google Scholar] [CrossRef]
- Peng, T.R.; Huang, C.C.; Wang, C.H.; Liu, T.K.; Lu, W.C.; Chen, K.Y. Using oxygen, hydrogen, and tritium isotopes to assess pond water’s contribution to groundwater and local precipitation in the pediment tableland areas of northwestern Taiwan. J. Hydrol. 2012, 450, 105–116. [Google Scholar] [CrossRef]
- Peng, T.R.; Lu, W.C.; Chen, K.Y.; Zhan, W.J.; Liu, T.K. Groundwater-recharge connectivity between a hills-and plains’ area of western Taiwan using water isotopes and electrical conductivity. J. Hydrol. 2014, 517, 226–235. [Google Scholar] [CrossRef]
- Liu, Y.; Yamanaka, T.; Zhou, X.; Tian, F.; Ma, W. Combined use of tracer approach and numerical simulation to estimate groundwater recharge in an alluvial aquifer system: A case study of Nasunogahara area, central Japan. J. Hydrol. 2014, 519, 833–847. [Google Scholar] [CrossRef]
- Edmunds, W.M.; Walton, N.R.C. A geochemical and isotopic approach to recharge evaluation in semi-arid zones; past and present. In Arid-Zone Hydrology, Investigation with Isotope Techniques; International Atomic Energy Agency (IAEA): Vienna, Austria, 1980; pp. 47–68. [Google Scholar]
- Lee, E.S.; Krothe, N.C. A four-component mixing model for water in a karst terrain in south-central Indiana, USA. Using solute concentration and stable isotopes as tracers. Chem. Geol. 2001, 179, 129–143. [Google Scholar] [CrossRef]
- Oster, H.; Sonntag, C.; Munnich, K.O. Groundwater age dating with chlorofluorocarbons. Water Resour. Res. 1996, 32, 2989–3001. [Google Scholar] [CrossRef]
- Happell, J.D.; Opsahlb, S.; Top, Z.; Chanton, J.P. Apparent CFC and 3H/3He age differences in water from Floridan Aquifers springs. J. Hydrol. 2006, 319, 410–426. [Google Scholar] [CrossRef]
- Qin, D.J.; Qian, Y.P.; Han, L.F.; Wang, Z.M.; Li, C. , Zhao, Z.F. Assessing impact of irrigation water on groundwater recharge and quality in arid environment using CFCs, tritium and stable isotopes, in the Zhangye Basin, Northwest China. J. Hydrol. 2011, 405, 194–208. [Google Scholar] [CrossRef]
- Qin, D.J.; Zhao, Z.F.; Han, L.F.; Qian, Y.P.; Ou, L.; Wu, Z.Q.; Wang, M.C. Determination of groundwater recharge regime and flow path in the Lower Heihe River basin in an arid area of Northwest China by using environmental tracers: Implications for vegetation degradation in the Ejina Oasis. Appl. Geochem. 2012, 27, 1133–1145. [Google Scholar] [CrossRef]
- Prinn, R.G.; Weiss, R.F.; Fraser, P.J.; Simmonds, P.G.; Cunnold, D.M.; Alyea, F.N.; O’Doherty, S.; Salameh, P.; Miller, BH.R.; Huang, J.; et al. A history of chemically and radiatively important gases in air deduced from ALE/GAGE/AGAGE. J. Geophys. Res. 2000, 105, 17751–17792. [Google Scholar] [CrossRef]
- Parisi, S.; Paternoster, M.; Kohfahl, C.; Pekdeger, A.; Meyer, H.; Hubberten, H.W.; Spilotro, G.; Mongelli, G. Groundwater recharge areas of a volcanic aquifer system inferred from hydraulic, hydrogeochemical and stable isotope data: Mount Vulture, southern Italy. Hydrogeol. J. 2011, 19, 133–153. [Google Scholar] [CrossRef]
- Diaw, M.; Faye, S.; Stichler, W.; Maloszewski, P. Isotopic and geochemical characteristics of groundwater in the Senegal River delta aquifer: Implication of recharge and flow regime. Environ. Earth Sci. 2012, 66, 1011–1020. [Google Scholar] [CrossRef]
- Wang, L.H.; Li, G.M.; Dong, Y.H.; Han, D.M.; Zhang, J.Y. Using hydrochemical and isotopic data to determine sources of recharge and groundwater evolution in an arid region: A case study in the upper-middle reaches of the Shule River basin, northwestern China. Environ. Earth Sci. 2015, 73, 1901–1915. [Google Scholar] [CrossRef]
- Feng, Q.; Wei, L.; Su, Y.H.; Zhang, Y.W.; Si, J.H. Distribution and evolution of water chemistry in Heihe River Basin. Environ. Geol. 2005, 45, 947–956. [Google Scholar] [CrossRef]
- Chen, Z.Y.; Nie, Z.L.; Zhang, G.H.; Wan, L.; Shen, J.M. Environmental isotopic study on the recharge and residence time of groundwater in the Heihe River Basin, northwestern China. Hydrogeol. J. 2006, 14, 1635–1651. [Google Scholar] [CrossRef]
- Chen, L.J.; Feng, Q. Geostatistical analysis of temporal and spatial variations in groundwater levels and quality in the Minqin oasis, Northwest China. Environ. Earth Sci. 2013, 70, 1367–1378. [Google Scholar] [CrossRef]
- Ma, J.Z.; Wang, X.S.; Edmunds, W.M. The characteristics of ground-water resources and their changes under the impacts of human activity in the arid northwest China-a case study of the Shiyang River Basin. J. Arid Environ. 2005, 61, 277–295. [Google Scholar] [CrossRef]
- Jiao, J.J. Crescent Moon Spring: A disappearing natural wonder in the Gobidesert, China. Ground Water 2010, 48, 159–163. [Google Scholar] [CrossRef] [PubMed]
- Guo, X.Y.; Feng, Q.; Liu, W.; Li, Z.X.; Wen, X.H.; Si, J.H.; Xi, H.Y.; Guo, R.; Jia, B. Stable isotopic and geochemical identification of groundwater evolution and recharge sources in the arid Shule River Basin of Northwestern China. Hydrol. Process. 2015, 29, 4703–4718. [Google Scholar] [CrossRef]
- He, J.H.; Ma, J.Z.; Zhao, W.; Sun, S. Groundwater evolution and recharge determination of the Quaternary aquifer in the Shule River basin, Northwest China. Hydrogeol. J. 2015, 23, 1745–1759. [Google Scholar] [CrossRef]
- Yan, C.Y. Study on the change of groundwater recharge and environment change caused by surface water redistribution. Arid Zone Res. 2007, 24, 428–433, (In Chinese with English abstract). [Google Scholar]
- Ma, C.F. Analysis on the variation of groundwater recharges and levels in the Shulehe River basin after the Changma reservoir running. J. Arid Land Resour. Environ. 2008, 22, 49–55, (In Chinese with English abstract). [Google Scholar]
- Gansu Geology Survey. The Report and Map for Hydrogeological Survey in the Shule River Basin (1:200,000), Gansu Science and Technology Press: Lanzhou, China, 1978.
- Han, W.; Hu, L.T.; Chen, C.X.; Zhang, H.S.; Cheng, X.X. Problems about numerical simulation of groundwater flow in Yumen-Tashi Basin, Shulehe River, China. Site Investig. Sci. Technol. 2005, 1, 15–18, (In Chinese with English abstract). [Google Scholar]
- Freeze, R.A.; Cherry, J.A. Groundwater; Prentice Hall: Englewood Cliffs, NJ, USA, 1979. [Google Scholar]
- Epstein, S.; Mayeda, T. Variation of 18O content of waters from natural sources. Geochim. Cosmochim. Acta 1953, 4, 213–224. [Google Scholar] [CrossRef]
- Coleman, M.L.; Shepherd, T.J.; Durham, J.J.; Rouse, J.E.; Moore, G.R. Reduction of water with zinc for hydrogen isotope analysis. Anal. Chem. 1982, 54, 993–995. [Google Scholar] [CrossRef]
- Joussaume, S.; Sadourny, R.; Jouzel, J. A general-circulation model of water isotope cycles in the atmosphere. Nature 1984, 311, 24–29. [Google Scholar] [CrossRef]
- Yamanaka, T.; Tsujimura, M.; Oyunbaatar, D.; Davaa, G. Isotopic variation of precipitation over eastern Mongolia and its implication for the atmospheric water cycle. J. Hydrol. 2007, 333, 21–34. [Google Scholar] [CrossRef]
- Adomako, D.; Osae, S.; AkitiT, T.; Faye, S.; Maloszewski, P. Geochemical and isotopic studies of groundwater conditions in the Densu River Basin of Ghana. Environ. Earth Sci. 2011, 62, 1071–1084. [Google Scholar] [CrossRef]
- Wang, Y.; Chen, Y.N.; Li, W.H. Temporal and spatial variation of water stable isotopes(18O and 2H) in the Kaidu River basin, Northwestern China. Hydrol. Process. 2014, 28, 653–661. [Google Scholar] [CrossRef]
- Clark, I.D.; Fritz, P. Environmental Isotopes in Hydrogeology; CRC Press/Lewis Publishers: Boca Raton, FL, USA, 1997. [Google Scholar]
- Dansgaard, W. Stable isotopes in precipitation. Tellus B 1964, 16, 436–468. [Google Scholar]
- International Atomic Energy Agency/World Meteorological Organization (IAEA/WMO). Global Network of Isotopes in Precipitation: The GNIP Database. 2006. Available online: http://www.iaea.org/water (accessed on 20 July 2011).
- Mook, W.G. Environmental Isotopes in the Hydrological Cycle: Principles and Applications; UNESCO and the International Atomic Energy Agency (IAEA): Paris, France, 2001. [Google Scholar]
- Busenberg, E.; Plummer, L.N. Dating young groundwater with sulfur hexafluoride: Natural and anthropogenic sources of sulfur hexafluoride. Water Resour. Res. 2000, 36, 3011–3030. [Google Scholar] [CrossRef]
Figure 1.
Location and geological sketch of the study area showing the location of sampling sites.

Figure 2.
Hydrogeological cross section of the study area from the Qilian Mountains to the Beishan Mountains.
Figure 2.
Hydrogeological cross section of the study area from the Qilian Mountains to the Beishan Mountains.
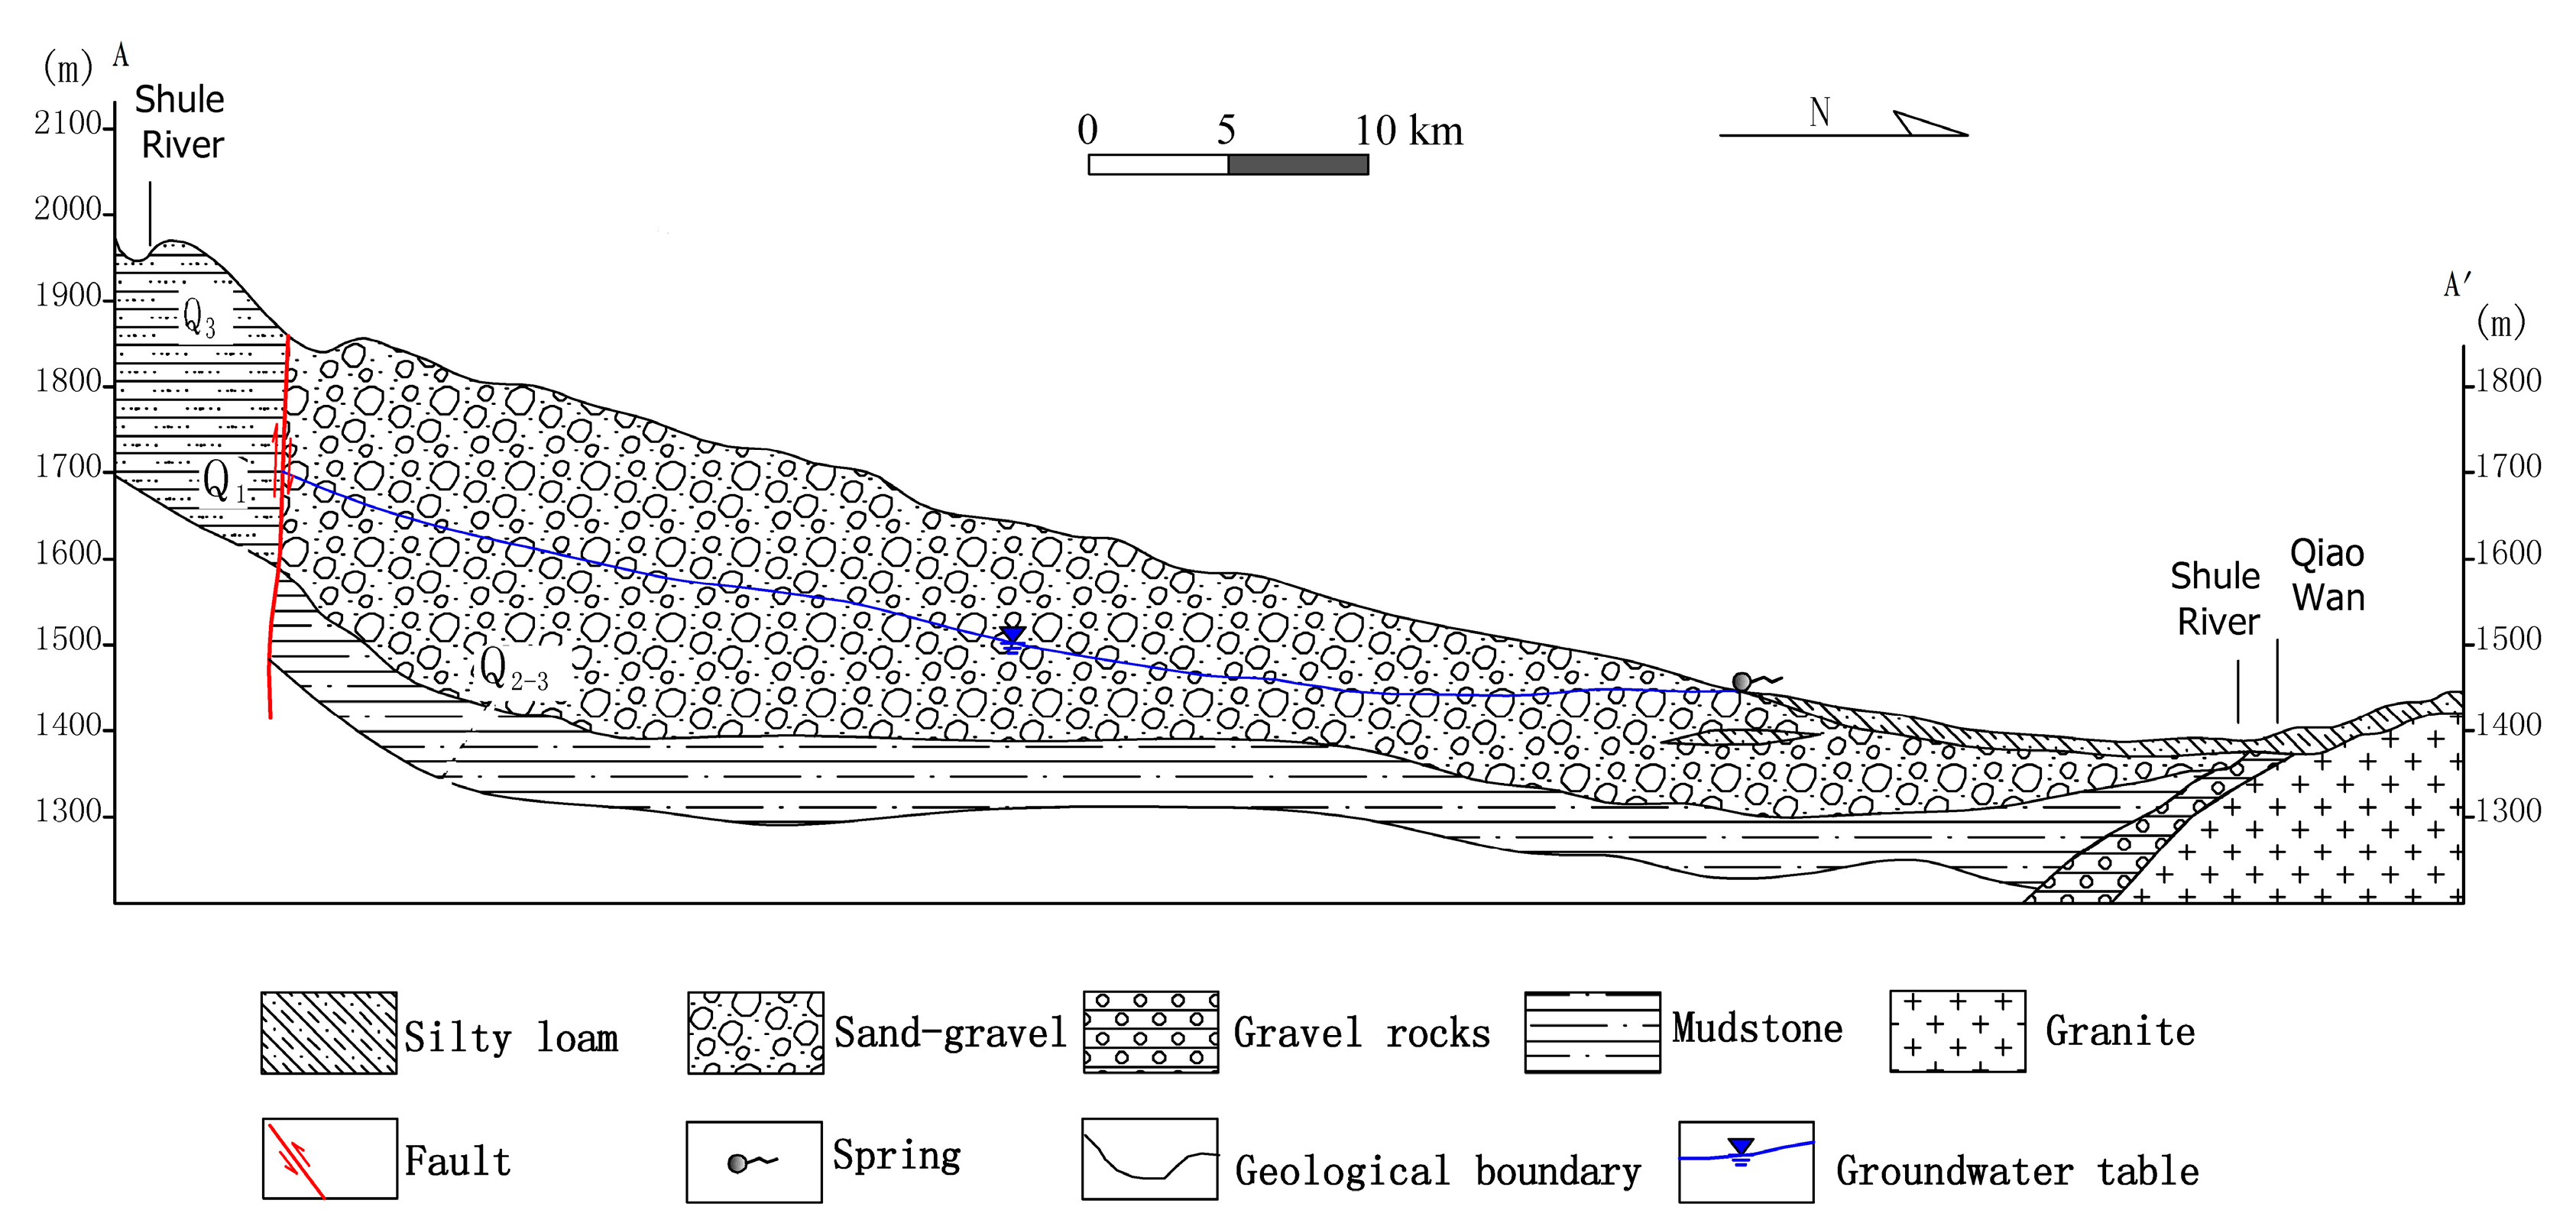
Figure 3.
Spatial and temporal variations in TDS concentration in collected water samples. See Figure 1 for sample locations.
Figure 3.
Spatial and temporal variations in TDS concentration in collected water samples. See Figure 1 for sample locations.

Figure 4.
Spatial and temporal variations in the concentrations of: (a) Ca2+; (b) Mg2+; (c) Na+; (d) HCO3−; (e) Cl−, and (f) SO42− ions. See Figure 1 for sample locations.
Figure 4.
Spatial and temporal variations in the concentrations of: (a) Ca2+; (b) Mg2+; (c) Na+; (d) HCO3−; (e) Cl−, and (f) SO42− ions. See Figure 1 for sample locations.
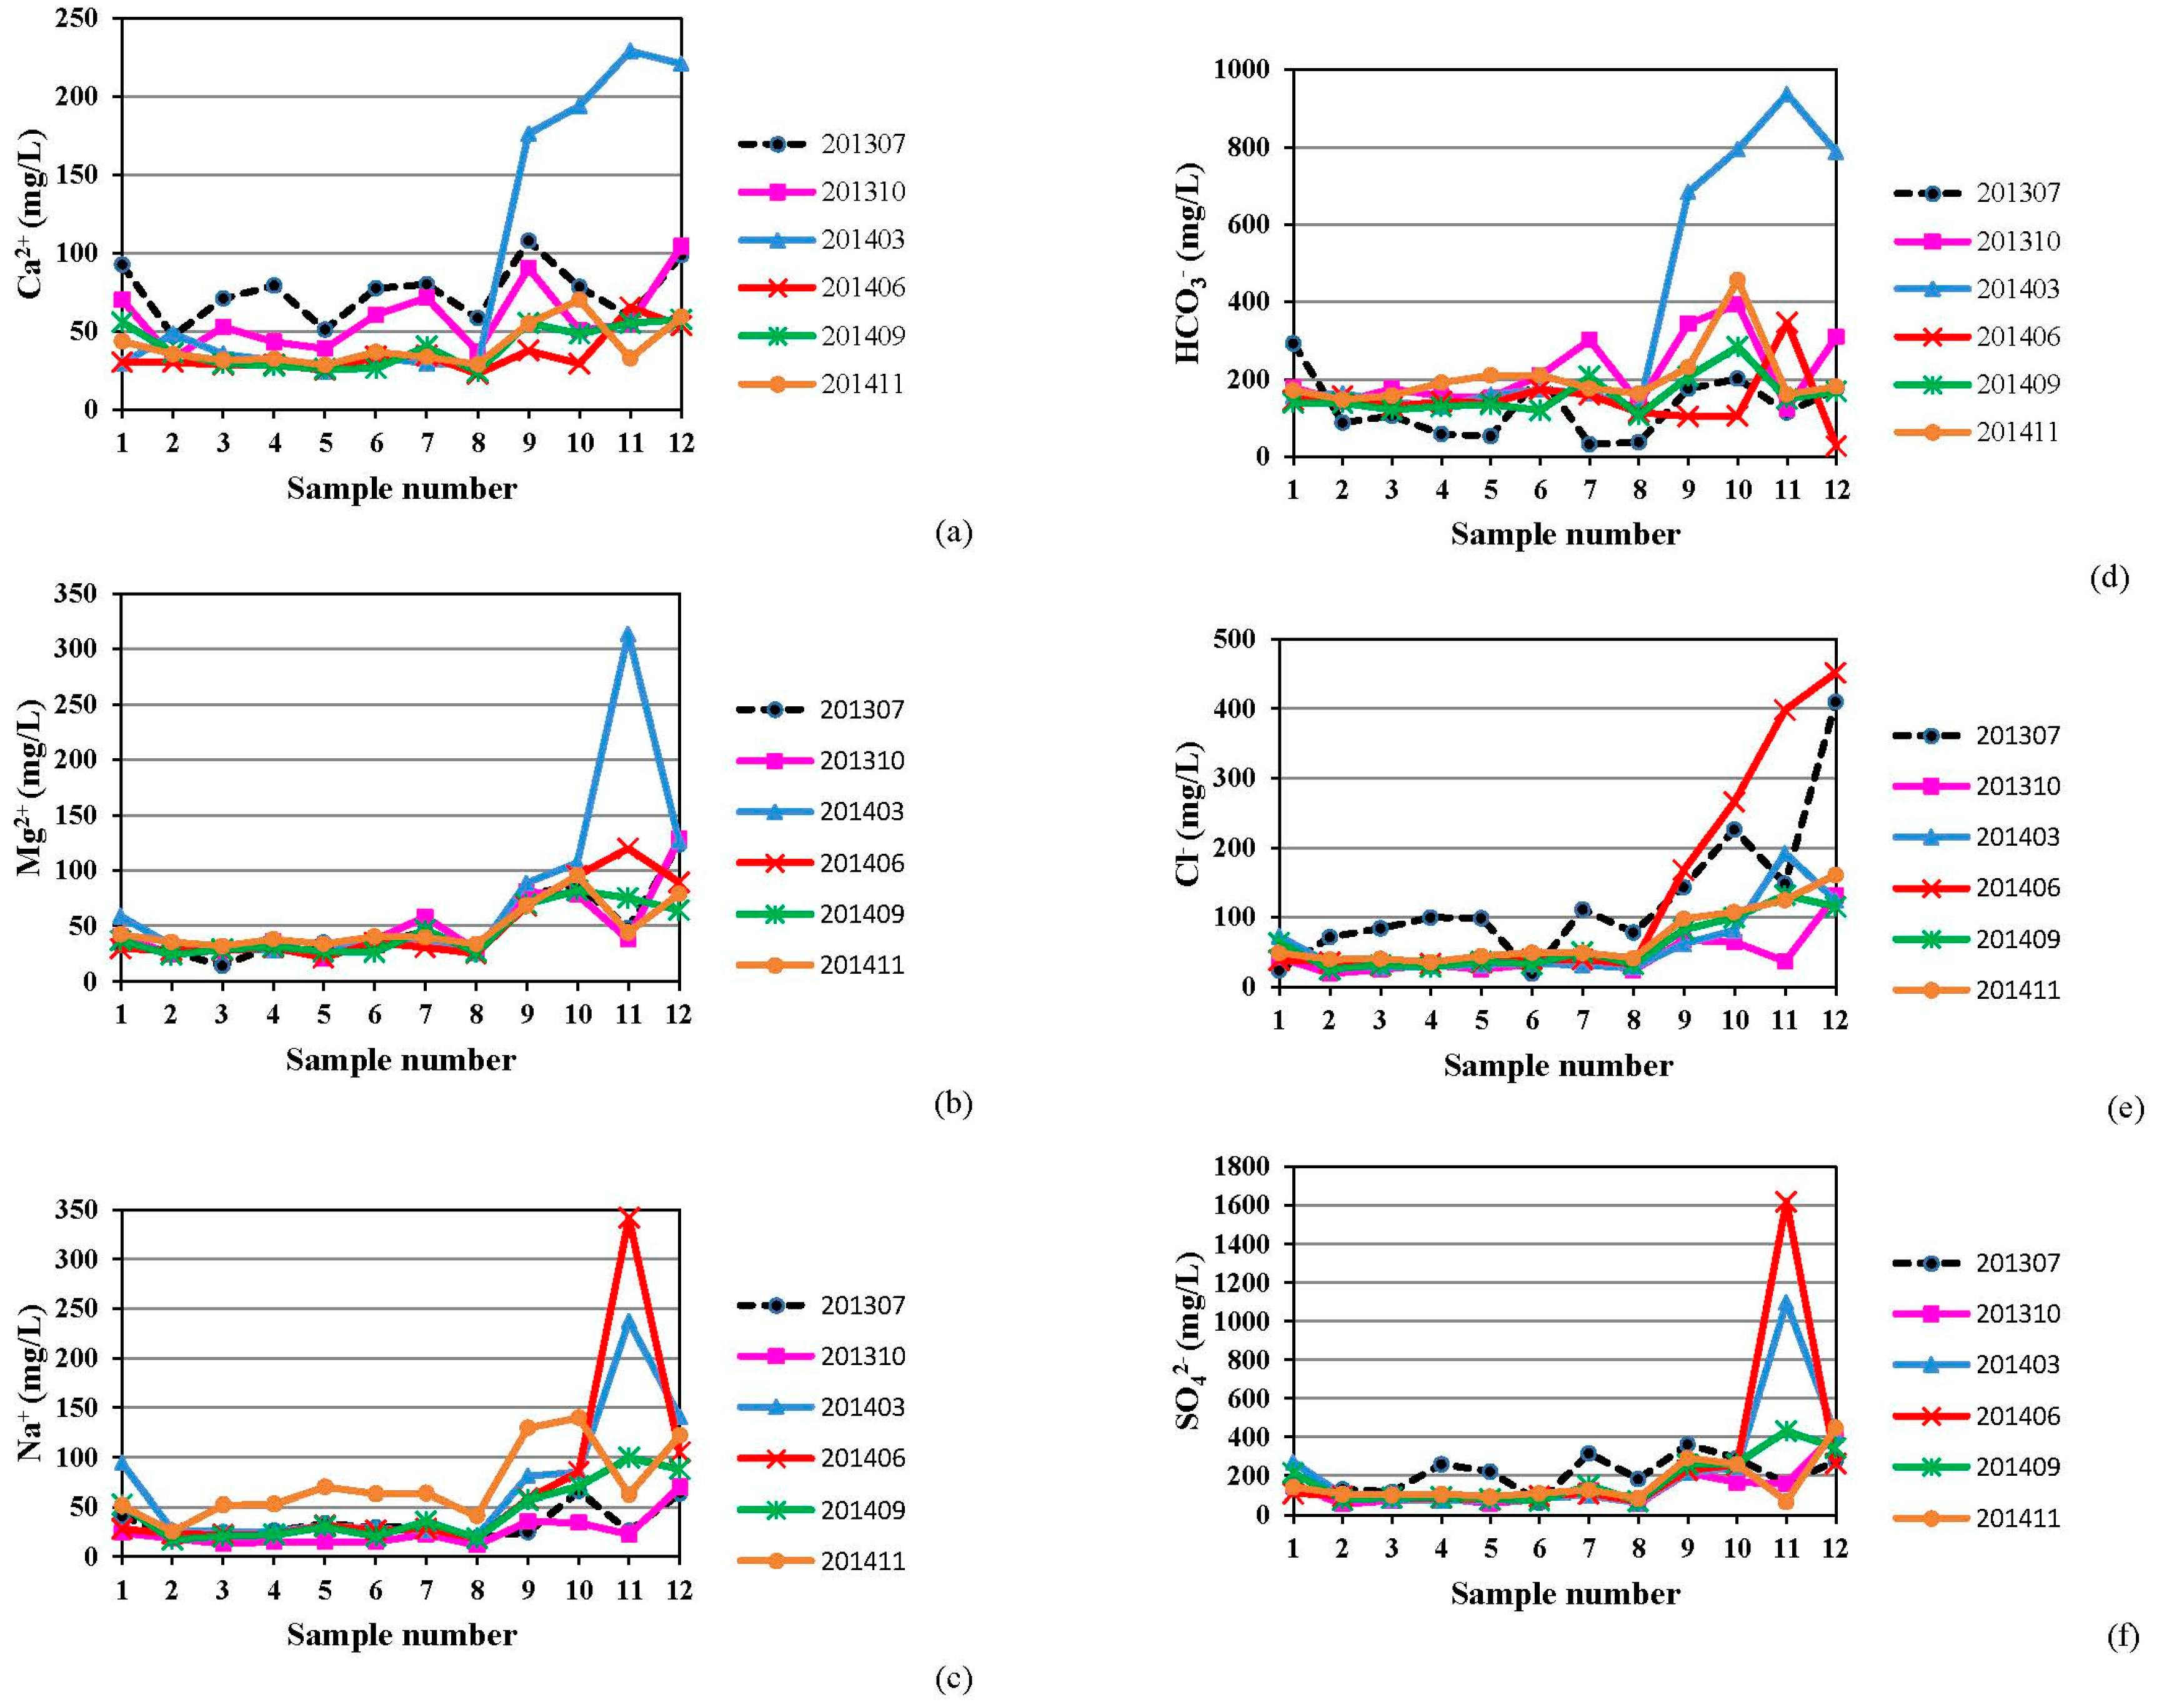
Figure 5.
Plot of D versus 18O for groundwater and surface water in the study area.
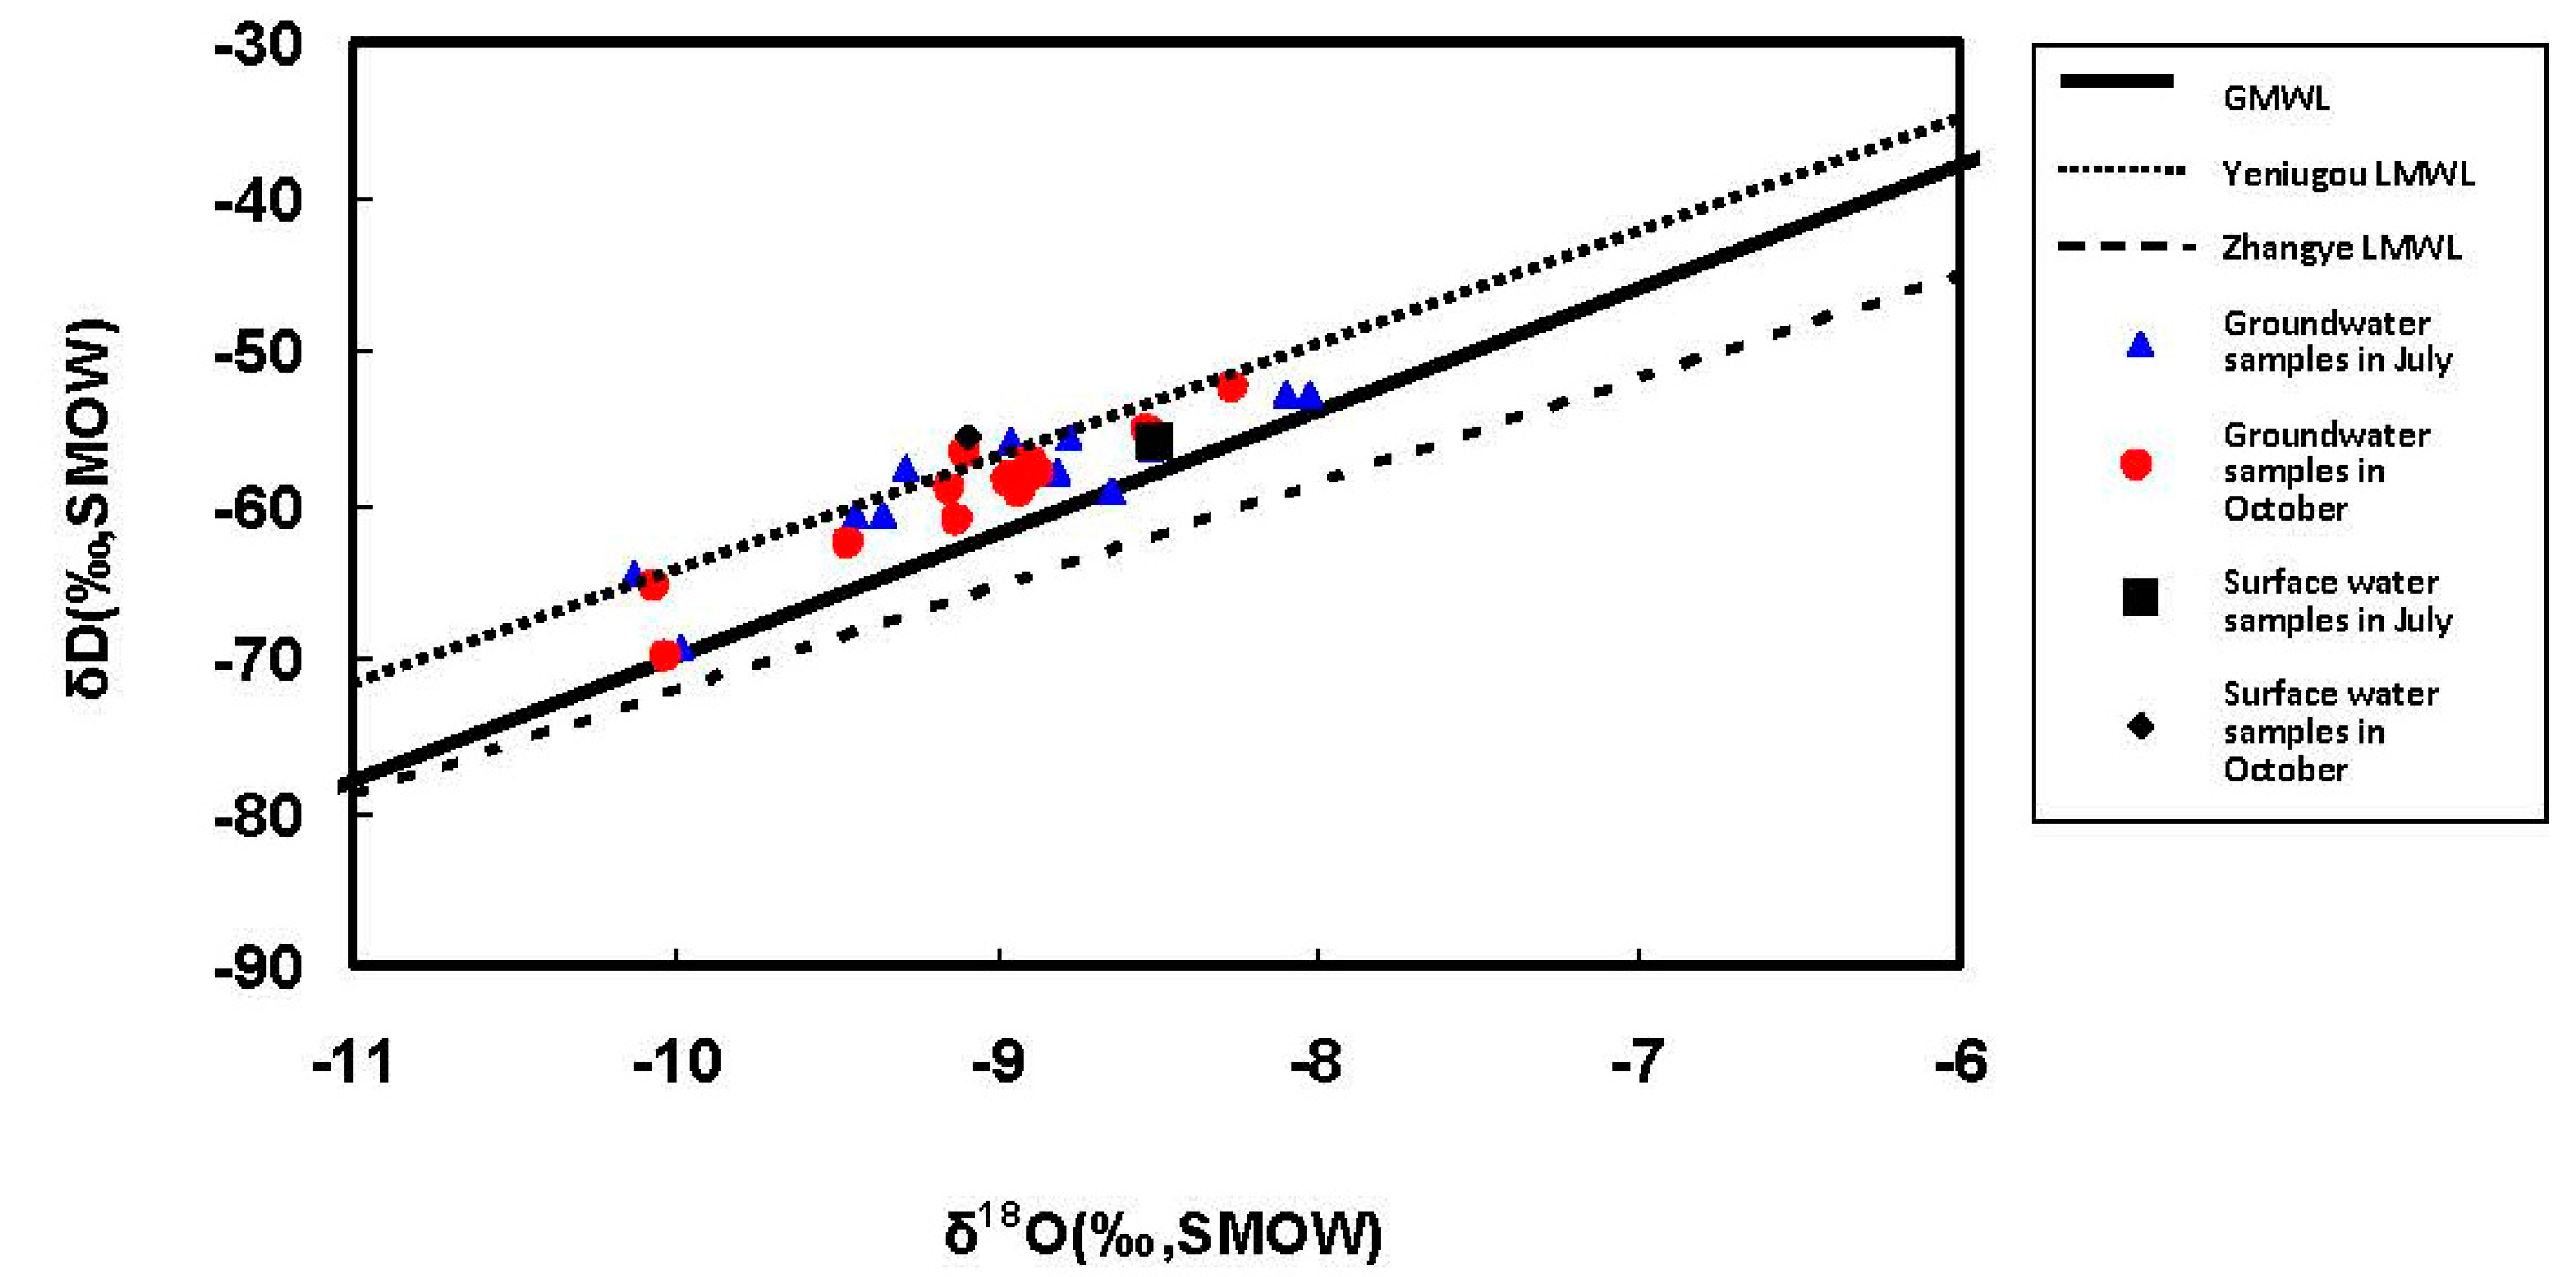
Figure 6.
Groundwater age distribution of shallow groundwater in the Changma alluvial fan, (a) 18 July 2013; (b) 16 October 2013.
Figure 6.
Groundwater age distribution of shallow groundwater in the Changma alluvial fan, (a) 18 July 2013; (b) 16 October 2013.
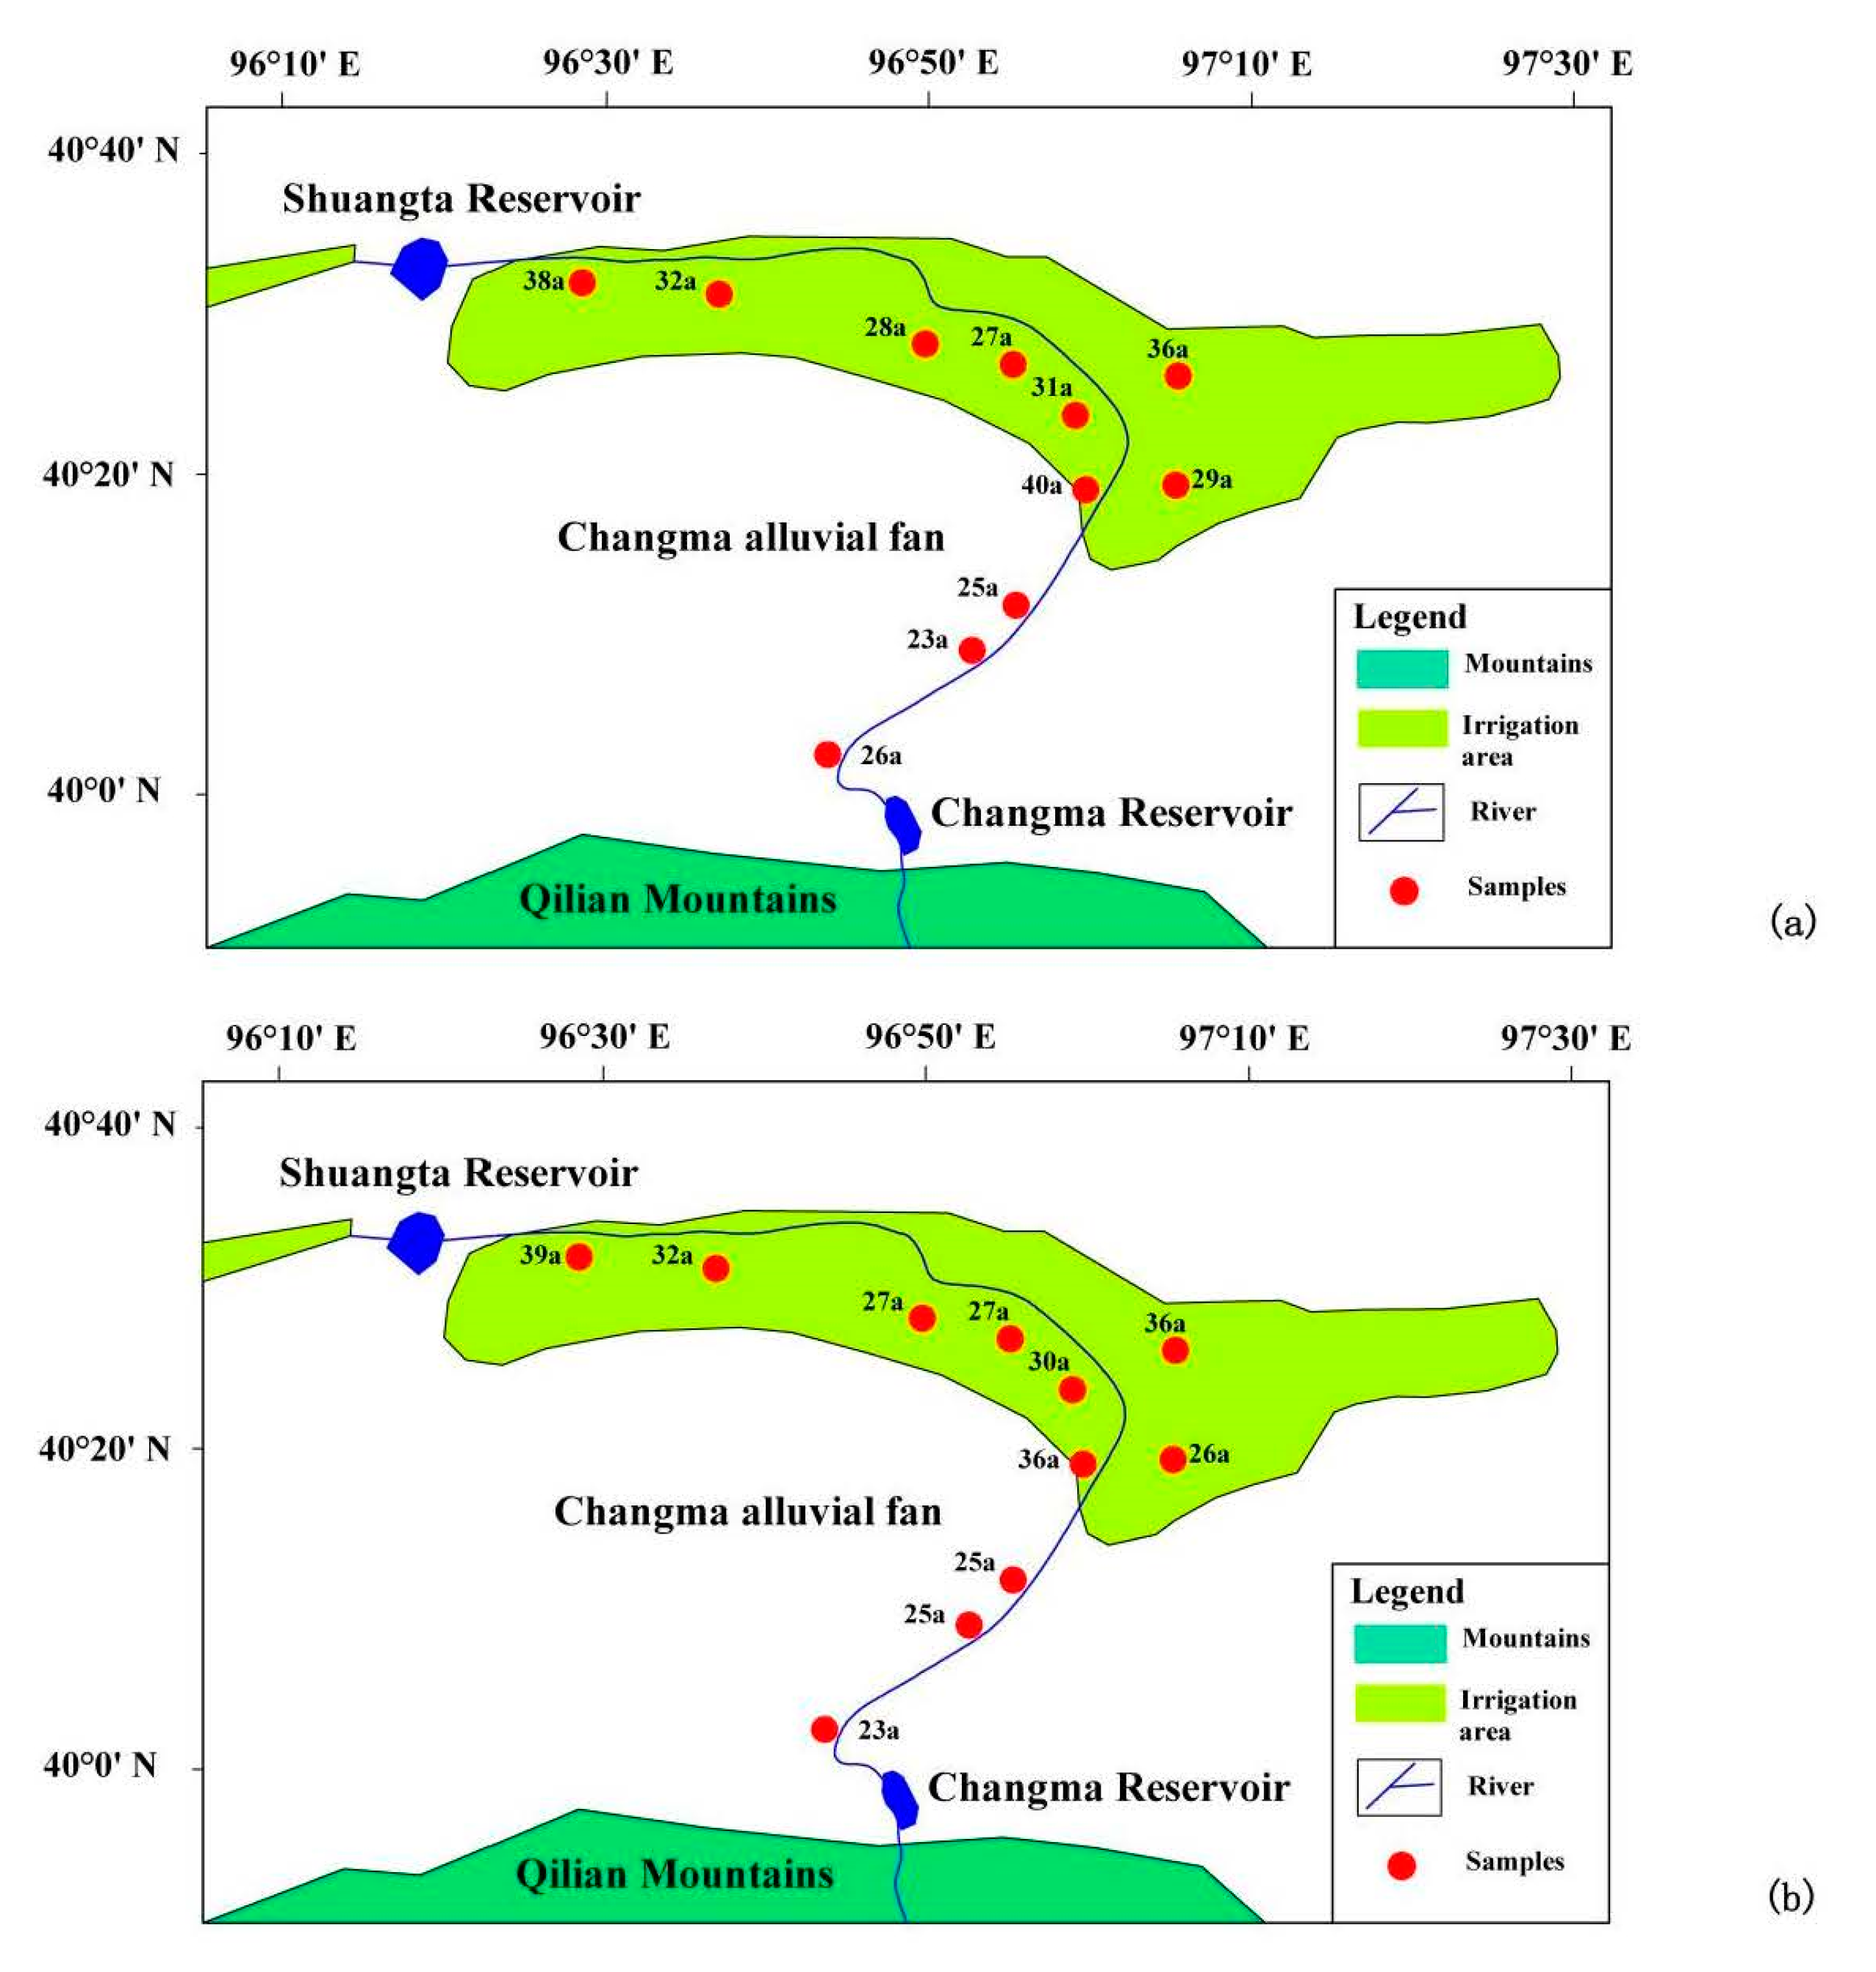
Figure 7.
Piper diagram of groundwater quality for samples collected in (a) March 2014; (b) June 2014; (c) September 2014; and (d) November 2014.
Figure 7.
Piper diagram of groundwater quality for samples collected in (a) March 2014; (b) June 2014; (c) September 2014; and (d) November 2014.
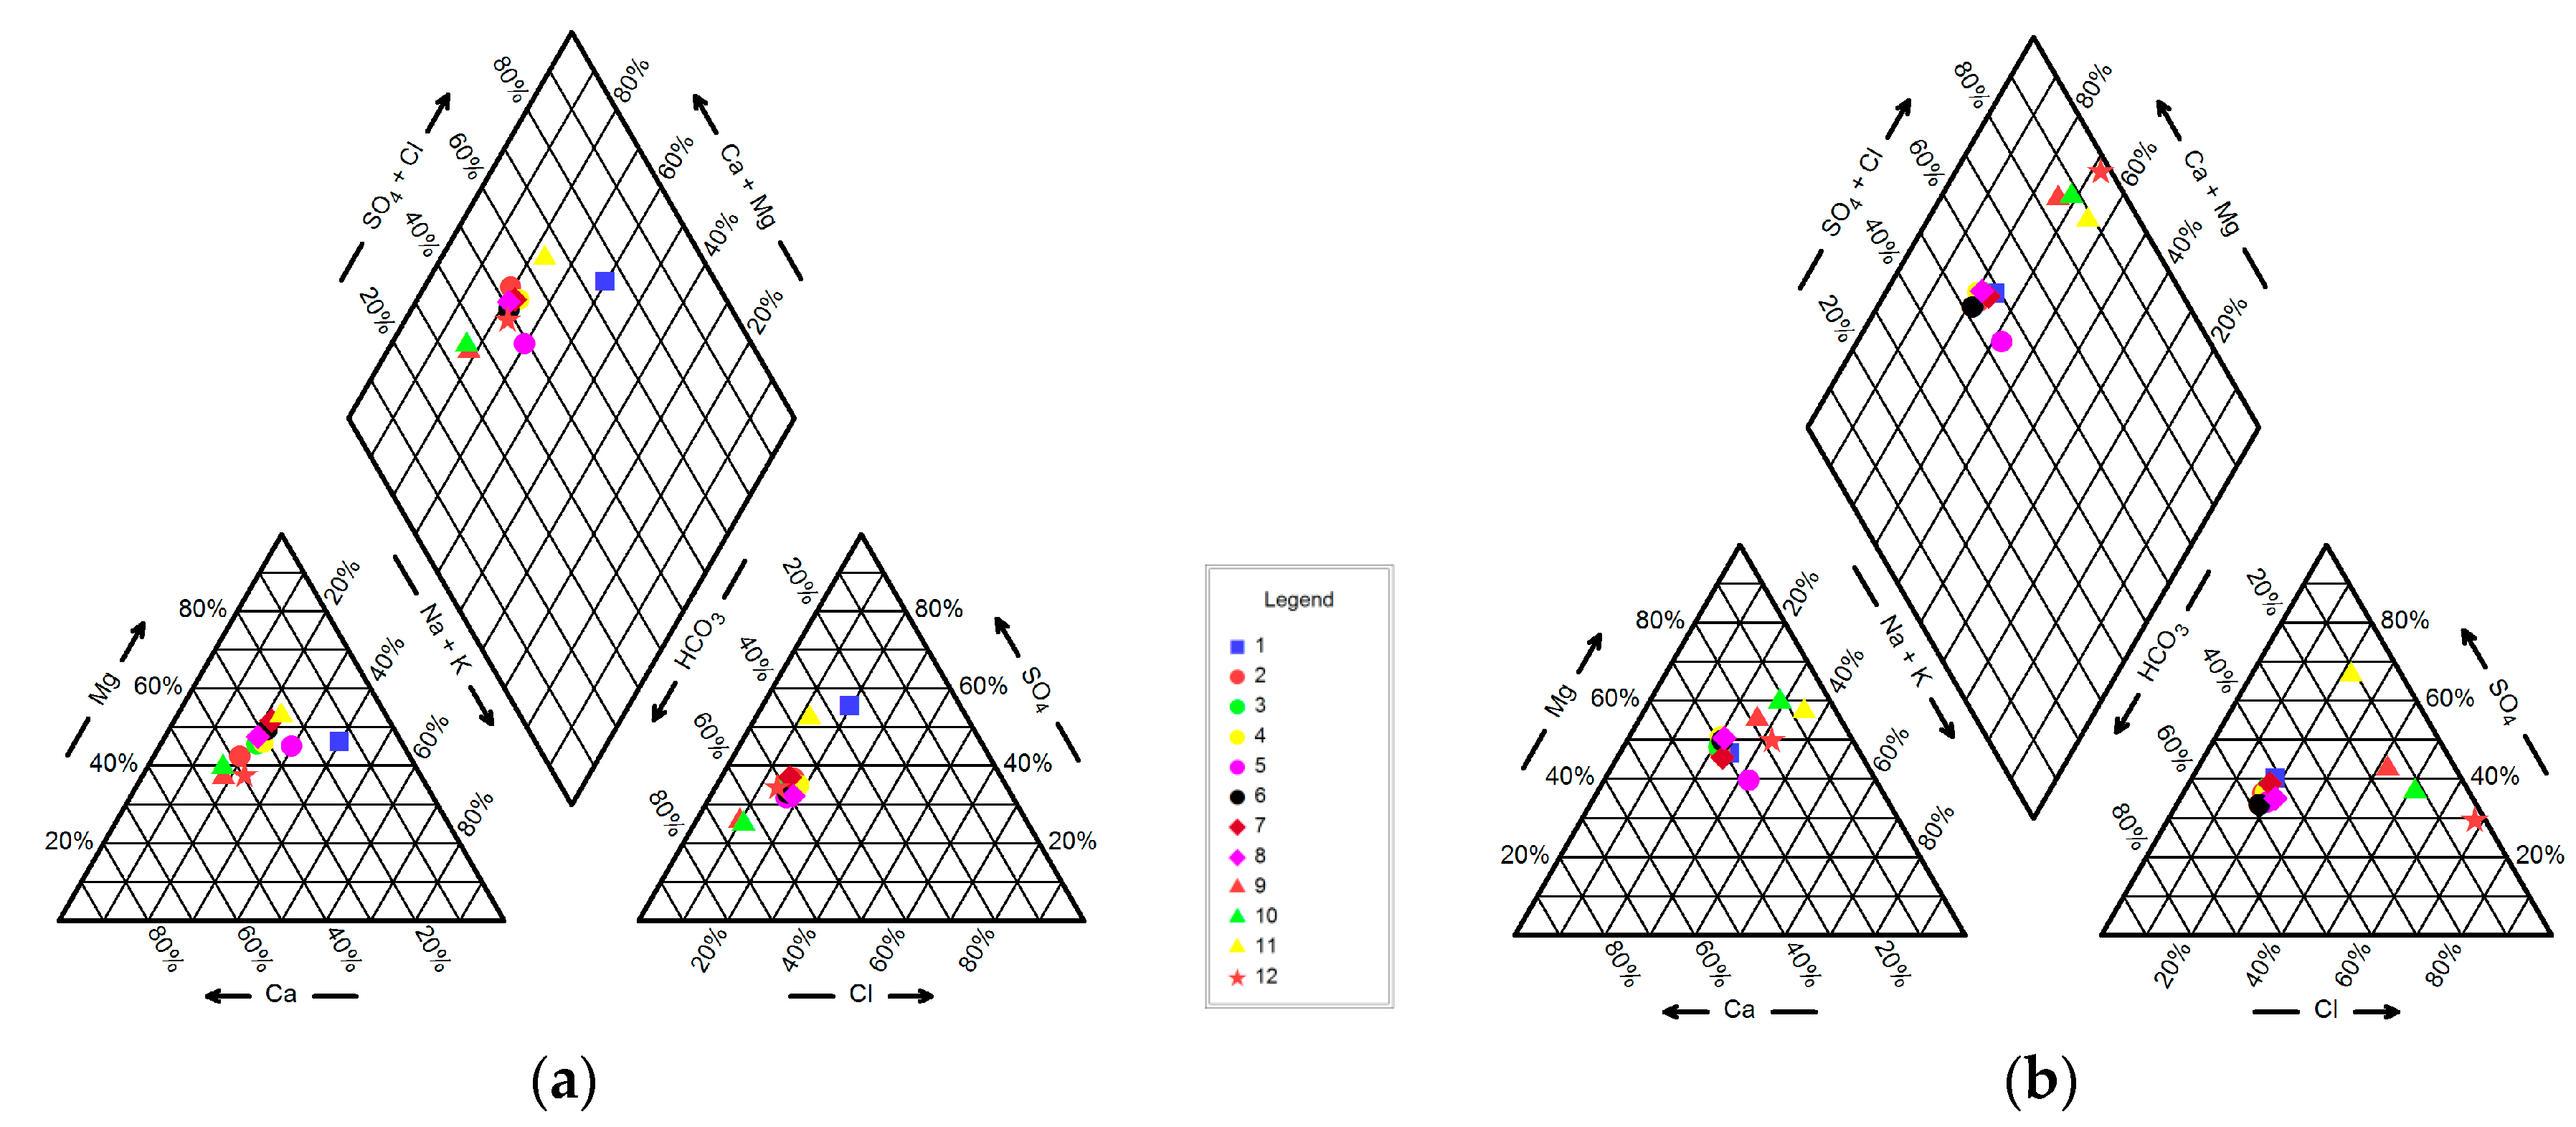
Figure 8.
Relationships between various ions in groundwater of the study area, (a) Cl− and TDS; (b) Cl− and Na+; (c) Cl− and mMg2+/Na+; and (d) Ca2+ + Mg2+ and SO42− + HCO3−.
Figure 8.
Relationships between various ions in groundwater of the study area, (a) Cl− and TDS; (b) Cl− and Na+; (c) Cl− and mMg2+/Na+; and (d) Ca2+ + Mg2+ and SO42− + HCO3−.

Table 1.
Location and general characteristics of sampling sites.
| No. | Longitude | Latitude | Elevation (m) | Well Depth (m) | Water Table Depth (m) |
|---|---|---|---|---|---|
| 1 | 96°48′52.14″ | 39°57′36.33″ | 1960 | Shule River water | - |
| 2 | 96°45′4.71″ | 40°2′28.74″ | 1872 | 70 | 27 |
| 3 | 96°54′0.52″ | 40°7′48.37″ | 1698 | 180 | 120 |
| 4 | 96°56′52.05″ | 40°11′4.11″ | 1627 | 100 | 55 |
| 5 | 97°0′36.99″ | 40°17′10.49″ | 1519 | 100 | 7 |
| 6 | 97°1′29.43″ | 40°20′52.69″ | 1453 | 66 | 8.3 |
| 7 | 96°52′8.47″ | 40°26′11.37″ | 1427 | 50 | 10 |
| 8 | 96°32′24.48″ | 40°31′59.90″ | 1340 | 10 | 2 |
| 9 | 97°8′37.21″ | 40°19′24.84″ | 1441 | Spring water | - |
| 10 | 96°57′19.72″ | 40°24′55.43″ | 1422 | Spring water | - |
| 11 | 96°38′13.6″ | 40°31′31.10″ | 1363 | Spring water | - |
| 12 | 97°7′32.99″ | 40°25′34.24″ | 1390 | 90 | 30 |
Table 2.
Summary of physical and chemical data obtained for surface and groundwater samples in the study area.
Table 2.
Summary of physical and chemical data obtained for surface and groundwater samples in the study area.
| No. | Sampling Date | pH | Temp °C | EC (μs/cm) | TDS (mg/L) | Na+ (mg/L) | K+ (mg/L) | Mg2+ (mg/L) | Ca2+ (mg/L) | Cl− (mg/L) | HCO3− (mg/L) | SO42− (mg/L) | NO3− (mg/L) | Ionic Balance Error (%) |
|---|---|---|---|---|---|---|---|---|---|---|---|---|---|---|
| 1 | 18 July 2013 | 7.5 | 18.2 | 825 | 412 | 40.06 | 3.46 | 32.64 | 92.8 | 24.29 | 291.69 | 131.84 | 0.42 | 5.0 |
| 16 October 2013 | 7.6 | 16.2 | 900 | 446 | 23.83 | 1.81 | 41.28 | 70.4 | 42.7 | 178.09 | 149.84 | 2.76 | 4.9 | |
| 22 March 2014 | 7.8 | 10.6 | 1413 | 886 | 93.52 | 4.57 | 58.84 | 29.5 | 72.32 | 155.43 | 272.4 | 1.87 | 1.3 | |
| 28 June 2014 | 6.9 | 12 | 830 | 413 | 27.98 | 2.44 | 29.48 | 30.47 | 38.13 | 146.06 | 111.67 | 2.86 | −5.0 | |
| 23 September 2014 | 7.7 | 12.9 | 1586 | 794 | 52.16 | 3.16 | 36.84 | 56.11 | 63.81 | 139.03 | 215.55 | 2.97 | −2.3 | |
| 5 November 2014 | 7.9 | 11 | 1338 | 664 | 51.62 | 4.34 | 42.14 | 43.67 | 49.3 | 171.22 | 141.31 | 3.93 | 5.5 | |
| 2 | 18 July 2013 | 7.5 | 17.3 | 920 | 460 | 23.04 | 2.87 | 26.88 | 47.2 | 71.66 | 87.47 | 133 | 2.24 | −4.9 |
| 16 October 2013 | 7.3 | 15.1 | 952 | 474 | 18.4 | 1.16 | 24.88 | 32.8 | 19.02 | 142.15 | 59.08 | 1.67 | 4.8 | |
| 22 March 2014 | 7.3 | 9.7 | 912 | 456 | 26.71 | 2.52 | 32.59 | 48.35 | 33.91 | 162.46 | 100.29 | 4.11 | 4.8 | |
| 28 June 2014 | 6.6 | 11 | 1240 | 788 | 23.53 | 2.08 | 28.42 | 30.38 | 35.1 | 155.43 | 96.6 | 2.87 | −5.9 | |
| 23 September 2014 | 7.6 | 13.6 | 904 | 452 | 17.09 | 1.79 | 24.23 | 36.59 | 24.51 | 138.25 | 79.22 | 2.64 | −0.1 | |
| 5 November 2014 | 7.4 | 10.9 | 1170 | 586 | 25.35 | 3.29 | 35.3 | 35.4 | 39.51 | 147.62 | 105.94 | 4.56 | 0.7 | |
| 3 | 18 July 2013 | 7.4 | 15 | 858 | 428 | 24.46 | 2.91 | 14.4 | 71.2 | 84.38 | 104.64 | 116.85 | 2.51 | −5.3 |
| 16 October 2013 | 8 | 13.9 | 860 | 430 | 12.92 | 1.49 | 28.32 | 52.8 | 24.9 | 174.97 | 75.65 | 2.84 | 3.8 | |
| 22 March 2014 | 7.1 | 15.2 | 856 | 426 | 25.56 | 2.39 | 29.97 | 35.46 | 27.75 | 142.63 | 82.56 | 3.67 | 5.3 | |
| 28 June 2014 | 6.8 | 12 | 1342 | 684 | 21.86 | 2.03 | 27.59 | 28.79 | 31.17 | 130.44 | 88.01 | 3.12 | −1.6 | |
| 23 September 2014 | 7.7 | 16.8 | 970 | 494 | 20.75 | 2.11 | 28.83 | 29.47 | 31.79 | 120.28 | 89.21 | 3.08 | 0.6 | |
| 5 November 2014 | 7.6 | 11.8 | 1082 | 548 | 52 | 4.39 | 31.91 | 31.52 | 40.74 | 157.16 | 103.69 | 4.89 | 5.1 | |
| 4 | 18 July 2013 | 7.4 | 15.1 | 962 | 480 | 26.09 | 2.95 | 32.64 | 79.2 | 99.66 | 57.49 | 260.49 | 1.61 | −7.6 |
| 16 October 2013 | 7.9 | 11.1 | 906 | 452 | 14.84 | 1.75 | 36.48 | 43.2 | 31.38 | 156.69 | 85.8 | 2.8 | 5.0 | |
| 22 March 2014 | 7.7 | 13.7 | 840 | 418 | 25.28 | 2.43 | 28.32 | 31.51 | 29.76 | 127.31 | 75.38 | 2.4 | 5.8 | |
| 28 June 2014 | 6.9 | 15 | 1162 | 726 | 22.32 | 2.23 | 30.89 | 28.97 | 33.64 | 141.37 | 90.14 | 2.01 | −1.2 | |
| 23 September 2014 | 7.4 | 15.7 | 994 | 506 | 21.85 | 2.22 | 31.56 | 28.23 | 28.43 | 129.66 | 92.67 | 2.37 | 1.5 | |
| 5 November 2014 | 7.5 | 10.6 | 1084 | 560 | 52.59 | 4.88 | 38.27 | 32.36 | 35.96 | 191.22 | 106.43 | 2.79 | 5.9 | |
| 5 | 18 July 2013 | 7.4 | 18.5 | 970 | 484 | 33.28 | 3.28 | 35.04 | 51.2 | 98.39 | 53.49 | 222.07 | 1.57 | −8.4 |
| 16 October 2013 | 7.7 | 18.4 | 952 | 474 | 15 | 1.45 | 20.64 | 39.2 | 24.79 | 153.09 | 60.65 | 1.79 | −1.4 | |
| 22 March 2014 | 7.7 | 14.5 | 882 | 442 | 31.54 | 2.87 | 26.51 | 24.46 | 31.66 | 158.55 | 77.54 | 2.54 | −2.7 | |
| 28 June 2014 | 6.9 | 15 | 1110 | 716 | 31.22 | 2.72 | 21.4 | 25.19 | 34.74 | 138.25 | 80.45 | 2.44 | −5.0 | |
| 23 September 2014 | 7.4 | 17.7 | 1058 | 528 | 30.13 | 2.6 | 27.28 | 26.01 | 36.48 | 135.12 | 83.97 | 2.63 | −0.8 | |
| 5 November 2014 | 7.5 | 11.2 | 1012 | 505 | 69.86 | 5.54 | 33.85 | 28.54 | 44.39 | 210.28 | 94.51 | 4.26 | 4.9 | |
| 6 | 18 July 2013 | 7.6 | 13.8 | 990 | 484 | 29.57 | 3.28 | 33.6 | 77.6 | 19.15 | 343.05 | 63.62 | 0.67 | 3.5 |
| 16 October 2013 | 7.6 | 11.4 | 978 | 490 | 15.24 | 1.68 | 37.2 | 60.8 | 32.91 | 210.18 | 83.65 | 4.29 | 5.0 | |
| 22 March 2014 | 8.0 | 13.8 | 1066 | 532 | 28.2 | 2.91 | 35.34 | 33.79 | 34.31 | 173.39 | 89.86 | 5.38 | 1.4 | |
| 28 June 2014 | 6.7 | 11 | 1330 | 848 | 26.72 | 2.49 | 34.94 | 33.7 | 38.99 | 174.18 | 95.39 | 4.8 | −1.6 | |
| 23 September 2014 | 7.7 | 15.2 | 916 | 894 | 20.81 | 2.27 | 26.5 | 26.66 | 32.62 | 118.72 | 75.34 | 2.62 | 0.3 | |
| 5 November 2014 | 7.2 | 10.5 | 1120 | 562 | 63.13 | 5.51 | 40.63 | 36.76 | 49.25 | 210.09 | 112.22 | 6.92 | 5.0 | |
| 7 | 18 July 2013 | 7.5 | 14.2 | 1128 | 556 | 31.07 | 3.52 | 45.6 | 80 | 111.57 | 31.06 | 318.56 | 4.66 | −5.7 |
| 16 October 2013 | 7.5 | 13.9 | 1296 | 648 | 22.82 | 2.38 | 58.08 | 71.6 | 40.41 | 300.8 | 125.99 | 7.38 | 3.6 | |
| 22 March 2014 | 7.2 | 13.9 | 1006 | 504 | 26.57 | 2.84 | 35.05 | 29.65 | 31.12 | 162.46 | 99.91 | 5.19 | −0.6 | |
| 28 June 2014 | 6.7 | 11 | 1424 | 908 | 28.32 | 2.75 | 30.61 | 34.68 | 39.04 | 158.86 | 112 | 5.62 | −4.6 | |
| 23 September 2014 | 7.5 | 14.2 | 1588 | 776 | 35.22 | 3.84 | 46.34 | 40.29 | 50.57 | 206.2 | 148.61 | 7.76 | −3.3 | |
| 5 November 2014 | 6. | 10.7 | 1114 | 562 | 63.49 | 5.32 | 40.12 | 33.84 | 48.86 | 176.99 | 128.98 | 6.88 | 5.7 | |
| 8 | 18 July 2013 | 7.7 | 15.2 | 790 | 394 | 19.34 | 2.74 | 24.96 | 58.4 | 78.38 | 36.71 | 185.01 | 1.82 | −6.2 |
| 16 October 2013 | 7.7 | 13.7 | 746 | 374 | 11.31 | 1.54 | 28.08 | 37.2 | 24.34 | 137.79 | 59.19 | 2.32 | 5.7 | |
| 22 March 2014 | 8.4 | 16.7 | 892 | 486 | 20.19 | 2.57 | 25.91 | 28.55 | 27.85 | 124.19 | 64.15 | 2.58 | 3.8 | |
| 28 June 2014 | 6.7 | 11.5 | 964 | 622 | 18.74 | 2.19 | 24.97 | 23.14 | 32.45 | 114.82 | 71.97 | 2.1 | −2.6 | |
| 23 September 2014 | 7.5 | 12.1 | 820 | 398 | 18.12 | 2.22 | 26.48 | 24.3 | 33.1 | 107 | 73.49 | 2.38 | 0.1 | |
| 5 November 2014 | 7.4 | 10 | 786 | 422 | 40.81 | 4.5 | 33.98 | 29.23 | 41.21 | 162.47 | 84.61 | 3.24 | 4.6 | |
| 9 | 18 July 2013 | 7.0 | 19 | 2176 | 1080 | 24.66 | 3.04 | 77.76 | 108 | 143.89 | 175.44 | 362.77 | 3.15 | −5.4 |
| 16 October 2013 | 7 | 14.4 | 1940 | 970 | 35.73 | 3.07 | 81.12 | 90.4 | 66.4 | 342.13 | 215.53 | 17.27 | 2.6 | |
| 22 March 2014 | 7.8 | 9.2 | 1756 | 874 | 80.45 | 5.67 | 88.9 | 176.5 | 61.73 | 684.32 | 215.58 | 11.95 | 5.9 | |
| 28 June 2014 | 6.8 | 14.5 | 2368 | 1506 | 58.43 | 4.73 | 67.85 | 37.68 | 167.9 | 102.76 | 228.24 | 15.69 | −5.0 | |
| 23 September 2014 | 7.2 | 16.3 | 2174 | 1084 | 56.79 | 4.91 | 70.04 | 55.28 | 82.33 | 206.2 | 259.34 | 16.54 | −0.7 | |
| 5 November 2014 | 7.0 | 10.8 | 2040 | 1100 | 129.2 | 8.83 | 68.65 | 55.05 | 97.93 | 231.77 | 291.04 | 18.12 | 5.0 | |
| 10 | 18 July 2013 | 6.8 | 18.8 | 2338 | 1176 | 65.41 | 5.28 | 87.72 | 78.5 | 226.17 | 202.08 | 293.82 | 1.61 | −5.3 |
| 16 October 2013 | 6.9 | 17.1 | 2142 | 1070 | 34.11 | 2.82 | 78.24 | 50.8 | 64.48 | 392.87 | 168.12 | 2.25 | −5.2 | |
| 22 March 2014 | 7.4 | 6.1 | 1934 | 960 | 85.14 | 4.8 | 107.3 | 194.1 | 80.91 | 793.67 | 243.39 | 3.95 | 4.8 | |
| 28 June 2014 | 6.4 | 12.5 | 3382 | 2266 | 85.01 | 5.09 | 95.85 | 29.66 | 265.84 | 105.37 | 258.72 | 3.92 | −4.9 | |
| 23 September 2014 | 7.0 | 15.8 | 2794 | 1380 | 70.45 | 4.99 | 82.21 | 48.36 | 99.49 | 283.5 | 264.5 | 7.73 | −2.4 | |
| 5 November 2014 | 6.9 | 11.2 | 2308 | 1152 | 139.5 | 8.82 | 95.54 | 70.24 | 107.99 | 456.94 | 261.47 | 8.07 | 4.9 | |
| 11 | 18 July 2013 | 8 | 19.1 | 1778 | 906 | 25.8 | 10.7 | 48.5 | 59.6 | 148.23 | 114.8 | 159.2 | 0.52 | −5.4 |
| 16 October 2013 | 7.6 | 14.2 | 1758 | 878 | 22.45 | 1.76 | 37.92 | 55.2 | 36.36 | 124.97 | 160.77 | 1.26 | 3.7 | |
| 22 March 2014 | 7.2 | 9.4 | 4870 | 2410 | 237.1 | 40.69 | 313.2 | 229.3 | 191.77 | 938.2 | 1097.89 | 5.31 | 5.6 | |
| 28 June 2014 | 6.6 | 11 | 8840 | 6220 | 341.9 | 59.96 | 320.1 | 65.5 | 398.17 | 346.01 | 1617.76 | 0.89 | −4.3 | |
| 23 September 2014 | 7.9 | 15.8 | 1478 | 728 | 99.56 | 6.6 | 75.49 | 55.58 | 131.37 | 149.18 | 431.49 | 2.19 | −5.5 | |
| 5 November 2014 | 7.4 | 11.2 | 1054 | 528 | 62.52 | 5.13 | 44.34 | 33.17 | 124.98 | 160.91 | 68.28 | 1.84 | 3.7 | |
| 12 | 18 July 2013 | 7.3 | 11.9 | 2598 | 1296 | 63.8 | 5.82 | 123.6 | 98.9 | 410.03 | 175.06 | 280.28 | 2.57 | −5.5 |
| 16 October 2013 | 7.3 | 12.7 | 2660 | 1320 | 69.8 | 5.49 | 128.88 | 104.4 | 131.75 | 310.1 | 417.73 | 3.17 | 4.3 | |
| 22 March 2014 | 7.3 | 12.7 | 2660 | 1320 | 140.1 | 12.29 | 126.52 | 220.8 | 124.05 | 786.2 | 411.09 | 1.77 | 5.6 | |
| 28 June 2014 | 6.9 | 12.3 | 3478 | 2244 | 104.9 | 8.49 | 89.45 | 53.6 | 451.56 | 26.06 | 262.88 | 2.55 | −11.1 | |
| 23 September 2014 | 7.6 | 11.3 | 2012 | 1004 | 87.52 | 5.9 | 64.42 | 57.86 | 114.9 | 168.71 | 343.66 | 12.63 | −4.5 | |
| 5 November 2014 | 7.2 | 10.5 | 3064 | 1532 | 121.7 | 11.23 | 79.33 | 59.31 | 161.3 | 179.64 | 450.85 | 8.97 | −5.8 | |
| Mean | 7.3 | 13.4 | 1575 | 855.5 | 51.6 | 5.2 | 55.8 | 56.8 | 82.4 | 205.6 | 197.8 | 4.3 | - | |
| Min. | 6.4 | 6.1 | 746 | 374 | 11.3 | 1.16 | 14.4 | 23.1 | 19.0 | 26.1 | 59.08 | 0.4 | - | |
| Max. | 8.4 | 19.1 | 8840 | 6220 | 341.9 | 59.9 | 320.1 | 229.3 | 451.56 | 938.2 | 1617.76 | 18.12 | - |
Table 3.
Summary of isotopic and geochemical tracer data collected for samples in the study area.
| No. | Sampling Date | δ18O (‰) | δD (‰) | d (‰) | 3H (TU) | CFC Concentration pmol/kg CFC-11 CFC-12 CFC-113 | Apparent Age Years CFC-11 CFC-12 CFC-113 Average | |||||
|---|---|---|---|---|---|---|---|---|---|---|---|---|
| 1 | 18 July 2013 | −8.51 | −55.57 | 12.51 | 10.91 | - | - | - | - | - | - | - |
| 16 October 2013 | -9.09 | −55.74 | 16.98 | 12.45 | - | - | - | - | - | - | - | |
| 2 | 18 July 2013 | −8.78 | −55.67 | 14.57 | 14.85 | 4.7 | 2.41 | 0.35 | 27 | 25 | 25 | 26 |
| 16 October 2013 | −8.95 | −58.28 | 13.32 | 14.48 | 5.32 | 2.51 | 0.54 | 25 | 25 | 19 | 23 | |
| 3 | 18 July 2013 | −8.96 | −55.92 | 15.76 | 16.16 | 5.17 | 2.77 | 0.4 | 25 | 20 | 25 | 23 |
| 16 October 2013 | −9.14 | −59.13 | 13.99 | 13.50 | 5.5 | 2.57 | 0.36 | 24 | 24 | 26 | 25 | |
| 4 | 18 July 2013 | −8.52 | −56.34 | 11.82 | 19.76 | 5.05 | 3.24 | 0.46 | 26 | Contam. | 24 | 25 |
| 16 October 2013 | −8.52 | −55.41 | 12.75 | 16.77 | 5.13 | 3.09 | 0.49 | 26 | Contam. | 23 | 25 | |
| 5 | 18 July 2013 | −10.13 | −64.38 | 16.66 | 0.80 | 1.78 | 0.95 | 0.06 | 40 | 40 | 39 | 40 |
| 16 October 2013 | −10.06 | −65.4 | 15.08 | 0.90 | 2.12 | 1.05 | 0.18 | 39 | 39 | 32 | 36 | |
| 6 | 18 July 2013 | −9.44 | −60.72 | 14.8 | 18.32 | 3.14 | 2.08 | 0.25 | 35 | 29 | 29 | 31 |
| 16 October 2013 | −9.11 | −61.23 | 11.65 | 15.84 | 3.86 | 2.07 | 0.22 | 31 | 29 | 29 | 30 | |
| 7 | 18 July 2013 | −9.28 | −57.5 | 16.74 | 25.69 | 5.91 | 2.25 | 0.22 | Contam. | 27 | 29 | 28 |
| 16 October 2013 | −8.96 | −58.55 | 13.13 | 25.99 | 7.41 | 2.29 | 0.28 | Contam. | 26 | 28 | 27 | |
| 8 | 18 July 2013 | −8.81 | −57.9 | 12.58 | 8.89 | 2.58 | 0.83 | 0.11 | 38 | 41 | 36 | 38 |
| 16 October 2013 | −8.92 | −59.37 | 11.99 | 10.74 | 1.7 | 0.85 | 0.1 | 40 | 41 | 36 | 39 | |
| 9 | 18 July 2013 | −8.87 | −57.03 | 13.93 | 10.11 | 3.58 | 2.24 | 0.28 | 32 | 27 | 28 | 29 |
| 16 October 2013 | −8.89 | −57.4 | 13.72 | 11.53 | 4.4 | 2.63 | 0.34 | 29 | 23 | 27 | 26 | |
| 10 | 18 July 2013 | −8.1 | −52.69 | 12.11 | 20.69 | 4.18 | 2.52 | 0.34 | 29 | 24 | 27 | 27 |
| 16 October 2013 | −8.26 | −52.63 | 13.45 | 17.61 | 3.46 | 2.68 | 0.32 | 33 | 22 | 27 | 27 | |
| 11 | 18 July 2013 | −8.03 | −52.71 | 11.53 | 18.64 | 3.14 | 3.0 | 0.28 | 35 | Contam. | 28 | 32 |
| 16 October 2013 | −9.09 | −56.72 | 16. | 18.40 | 3.16 | 3.2 | 0.29 | 35 | Contam. | 28 | 32 | |
| 12 | 18 July 2013 | −8.65 | −59.01 | 10.19 | 14.16 | 1.90 | 1.52 | 0.17 | 40 | 35 | 33 | 36 |
| 16 October 2013 | −8.86 | −58.19 | 12.69 | 14.18 | 1.92 | 1.53 | 0.18 | 40 | 35 | 32 | 36 | |
| 13 | 18 July 2013 | 1.68 | 16.32 | 2.88 | - | - | - | - | - | - | - | |
Note: Contam.: CFC concentrations in water samples that are higher than values in equilibrium with 2013 atmospheric concentrations in the northern hemisphere.
© 2017 by the authors. Licensee MDPI, Basel, Switzerland. This article is an open access article distributed under the terms and conditions of the Creative Commons Attribution (CC BY) license (http://creativecommons.org/licenses/by/4.0/).
Share and Cite
MDPI and ACS Style
Guo, Q.; Zhou, Z.; Wang, S. The Source, Flow Rates, and Hydrochemical Evolution of Groundwater in an Alluvial Fan of Qilian Mountain, Northwest China. Water 2017, 9, 912. https://doi.org/10.3390/w9120912
AMA Style
Guo Q, Zhou Z, Wang S. The Source, Flow Rates, and Hydrochemical Evolution of Groundwater in an Alluvial Fan of Qilian Mountain, Northwest China. Water. 2017; 9(12):912. https://doi.org/10.3390/w9120912
Chicago/Turabian StyleGuo, Qiaona, Zhifang Zhou, and Shan Wang. 2017. "The Source, Flow Rates, and Hydrochemical Evolution of Groundwater in an Alluvial Fan of Qilian Mountain, Northwest China" Water 9, no. 12: 912. https://doi.org/10.3390/w9120912
Note that from the first issue of 2016, this journal uses article numbers instead of page numbers. See further details here.