Article

In Situ and Satellite Observation of CDOM and Chlorophyll-a Dynamics in Small Water Surface Reservoirs in the Brazilian Semiarid Region

1
Department of Agricultural Engineering, Federal University of Ceará, Fortaleza 60356-000, Brazil
2
Alfred Wegener Helmholtz Center for Polar and Marine Research, Telegrafenberg, 14473 Potsdam, Germany
3
Helmholtz Centre Potsdam, GFZ German Research Centre for Geosciences, Section 1.4 Remote Sensing, Telegrafenberg, 14473 Potsdam, Germany
4
Institute of Earth and Environmental Science, University of Potsdam, Karl-Liebknecht-Str. 24-25, 14476 Potsdam, Germany
*
Author to whom correspondence should be addressed.
Water 2017, 9(12), 913; https://doi.org/10.3390/w9120913
Submission received: 17 October 2017 / Revised: 12 November 2017 / Accepted: 20 November 2017 / Published: 4 December 2017

Abstract

:
We analyzed chlorophyll-a and Colored Dissolved Organic Matter (CDOM) dynamics from field measurements and assessed the potential of multispectral satellite data for retrieving water-quality parameters in three small surface reservoirs in the Brazilian semiarid region. More specifically, this work is comprised of: (i) analysis of Chl-a and trophic dynamics; (ii) characterization of CDOM; (iii) estimation of Chl-a and CDOM from OLI/Landsat-8 and RapidEye imagery. The monitoring lasted 20 months within a multi-year drought, which contributed to water-quality deterioration. Chl-a and trophic state analysis showed a highly eutrophic status for the perennial reservoir during the entire study period, while the non-perennial reservoirs ranged from oligotrophic to eutrophic, with changes associated with the first events of the rainy season. CDOM characterization suggests that the perennial reservoir is mostly influenced by autochthonous sources, while allochthonous sources dominate the non-perennial ones. Spectral-group classification assigned the perennial reservoir as a CDOM-moderate and highly eutrophic reservoir, whereas the non-perennial ones were assigned as CDOM-rich and oligotrophic-dystrophic reservoirs. The remote sensing initiative was partially successful: the Chl-a was best modelled using RapidEye for the perennial one; whereas CDOM performed best with Landsat-8 for non-perennial reservoirs. This investigation showed potential for retrieving water quality parameters in dry areas with small reservoirs.

1. Introduction

The Brazilian semiarid region has a dense network of surface reservoirs, with storage capacities typically ranging from 1 to 103 hm3. Small (<10 hm3) and medium-sized reservoirs (10–50 hm3) prevail. They are embanked streams that collect water in the rainy season (January–May) to secure water supply during the dry season (June–December). In fact, about 90% of the water demand in the state of Ceará is supplied by surface reservoirs [1]. However, these systems show low standards of water quality, mainly due to eutrophication, which causes water use conflicts and calls for an improvement of water resource management [2]. Due to operational and financial difficulties, conventional in situ monitoring of water quality in such a complex system is limited in spatial coverage and sample representativeness. Therefore, remote sensing is seen as a complementary to traditional approaches of water resources monitoring, providing a synoptic view of environmental systems.
Satellite Remote Sensing (RS) has been used for inland water monitoring in the Brazilian semiarid region with regard to the water extents and bathymetries of surface reservoirs [3,4,5]. Furthermore, for quality monitoring, several authors presented encouraging results for satellite RS application in rivers and large lakes of different locations [6,7,8,9,10,11,12,13,14]. However, there are only a few studies applying satellite RS to small complex inland water bodies such as the water-surface reservoirs in semiarid Brazil, where monitoring and understanding the magnitude and composition of optically visible water constituents, in particular the concentration of Chlorophyll-a (Chl-a) and Colored Dissolved Organic Matter (CDOM), are highly relevant given the dense population that relies on the water supply.
The photosynthetic pigment Chl-a serves as a proxy for phytoplankton and is one of the major indicators of the trophic state [15]. RS algorithms for deriving inland water Chl-a concentration mainly use the absorption in the red wavelength region versus the near-infrared (NIR) reflectance in the case of eutrophic lakes [16]. The maximum red-absorption around 675 nm of Chl-a has been standardized as the most important wavelength to extract information on Chl-a in eutrophic waters [17]. In turn, CDOM is the most abundant fraction of dissolved organic material in natural surface waters, being the major light absorbing constituent in surface waters, in the case of high concentrations causing the yellowish-brown color of the water. Besides the light absorbance, organic matter water concentration affects the ecosystem functioning through its influence on acidity, transportation and reactivity of toxic substances, photochemistry and energy supply [15,18,19,20]. The increase in the CDOM concentration lowers the reflectance values mainly in the blue and the green ranges of the spectrum (especially below ~500 nm), and its absorbance increases exponentially with decreasing wavelength [21]. CDOM in water bodies originates from allochthonous and autochthonous sources. The main source of allochthonous CDOM are humic and fulvic substances derived from terrestrial vegetation and soil in the drainage basin area, whereas the main contributors for autochthonous CDOM are phytoplankton and submersed aquatic vegetation [22,23,24,25].
The amount and type of Dissolved Organic Matter (DOM) are important factors for understanding the sources of organic compounds and their possible effect on inland water ecology. Autochthonous CDOM is more biologically labile, less chromophoric and constituted by molecules of low molecular weight. Therefore, it is less affected by photodegradation and more susceptible to biodegradation. Contrastingly, terrigenous CDOM is less biologically labile and has aromatic molecules, being more resistant to overall degradation, but more susceptible to photodegradation processes [21,24,25,26]. The specific absorption coefficient (aCDOM) provides the magnitude of DOM influencing the transparency of column water [15,19]. Spectral slope (S) describes the exponential reduction of absorption at a given wavelength range, being an important parameter for studying CDOM type and CDOM dynamics. Spectral slope is used as an indicator for the CDOM source (allochthonous versus autochthonous) and for the status of degradation. The spectral slope ratio (Sr) between the ultraviolet region (275–295 nm) and the visible region (350–500 nm) is used as a weight molecular indicator of source and photobleaching of CDOM [21,25,26,27,28].
Presently, there is a scientific community effort in designing and validating RS algorithms to assess CDOM [8,9,10,11,16,29,30]. Nonetheless, there is no universal wavelength and/or spectral range to retrieve CDOM, since it may vary according to spectral interference levels of high concentrations of other optically-active constituents in water. Inland water RS has been a challenge, because these environments are optically complex and their optical properties are highly variable (even within the same water body), limiting the development of algorithms and their applicability [30,31].
Eutrophication corresponds to an imbalance in aquatic environments due to the excess of nutrients, mainly phosphorus and nitrogen [15]. This is even more harmful in drylands, such as the Brazilian semiarid region, due to the low runoff coefficient and the excessive evapotranspiration leading to recurrent droughts, which causes water level reduction [5]. Consequently, the water residence time of the reservoirs is high (2–3 years on average), and the water quality is often low [32,33,34]. Land use/land cover changes in the sub-catchments, including agricultural runoff and poor sewage treatment infrastructure, are interfering factors leading to environmental vulnerability of water bodies and anthropogenic eutrophication [34,35,36].
The Trophic State Index (TSI) was initially proposed for temperate regions by [37] and comprises Chl-a, phosphorus concentration and Secchi disk depth measurements. Later, the trophic state classification was adjusted for warm-water tropical lakes [38,39], and some authors have also applied it to the tropical semiarid reservoirs, obtaining satisfactory results [32,34,36,40].
Few studies address the relation between CDOM and other trophic level indicators. However, organic compounds are one important factor affecting phosphorus precipitation and mobilization in the aquatic system [15,41]. Phosphorus is recognized as a limiting nutrient of eutrophication process, while DOM contributes to control this nutrient, thus regulating the trophic level of the water body. Moreover, CDOM concentration interferes in the transparency of the water and consequently in the availability of light in the water column, regulating the photosynthetic activity. The term “dystrophy” is used as a category for systems rich in humic substances, and these present low productivity associated with high humic color [15]; the trophic levels are associated with different input loads (phosphorus or CDOM) and also are related to internal processes. Generally, eutrophic ecosystems receive high concentrations of phosphorus and have high primary productivity, whereas dystrophic systems have a higher intake of CDOM, and the bacterial metabolism in these systems can be suppressed by low pH [19,20,42].
This study aims at analyzing the dynamics of Chl-a and CDOM from in situ measurements, as well as at assessing the potential of multispectral satellite data for retrieving Chl-a concentration and specific absorption coefficient of Colored Dissolved Organic Matter (aCDOM) in three small surface reservoirs in the semiarid Brazil region. More specifically, this work comprises three steps: (i) analysis of in situ Chl-a and the dynamics of attributes related to the eutrophication process; (ii) characterization of in situ Dissolved Organic Matter (DOM) obtained from absorption and spectral slope of CDOM; (iii) estimation of Chl-a and CDOM through OLI/Landsat-8 (https://earthexplorer.usgs.gov/) and RapidEye satellite data. Furthermore, limitations of satellite monitoring of small complex tropical inland water bodies are discussed and recommendations for future in situ data collections and satellite monitoring strategies presented.

2. Materials and Methods
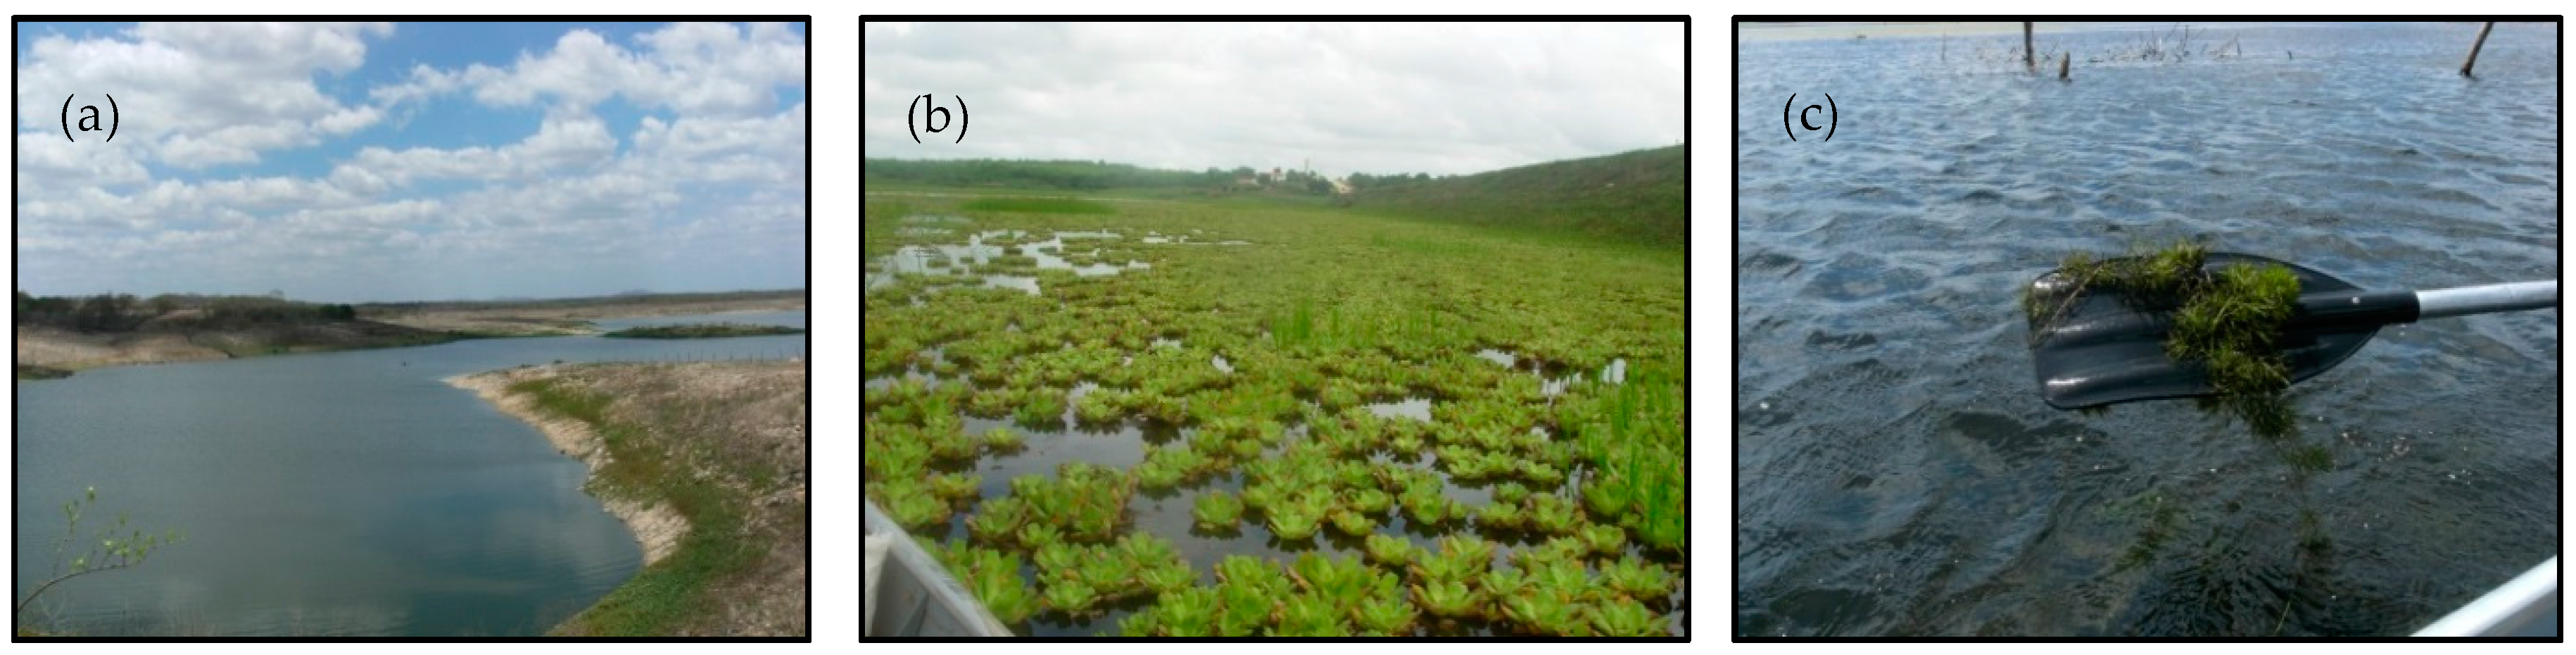
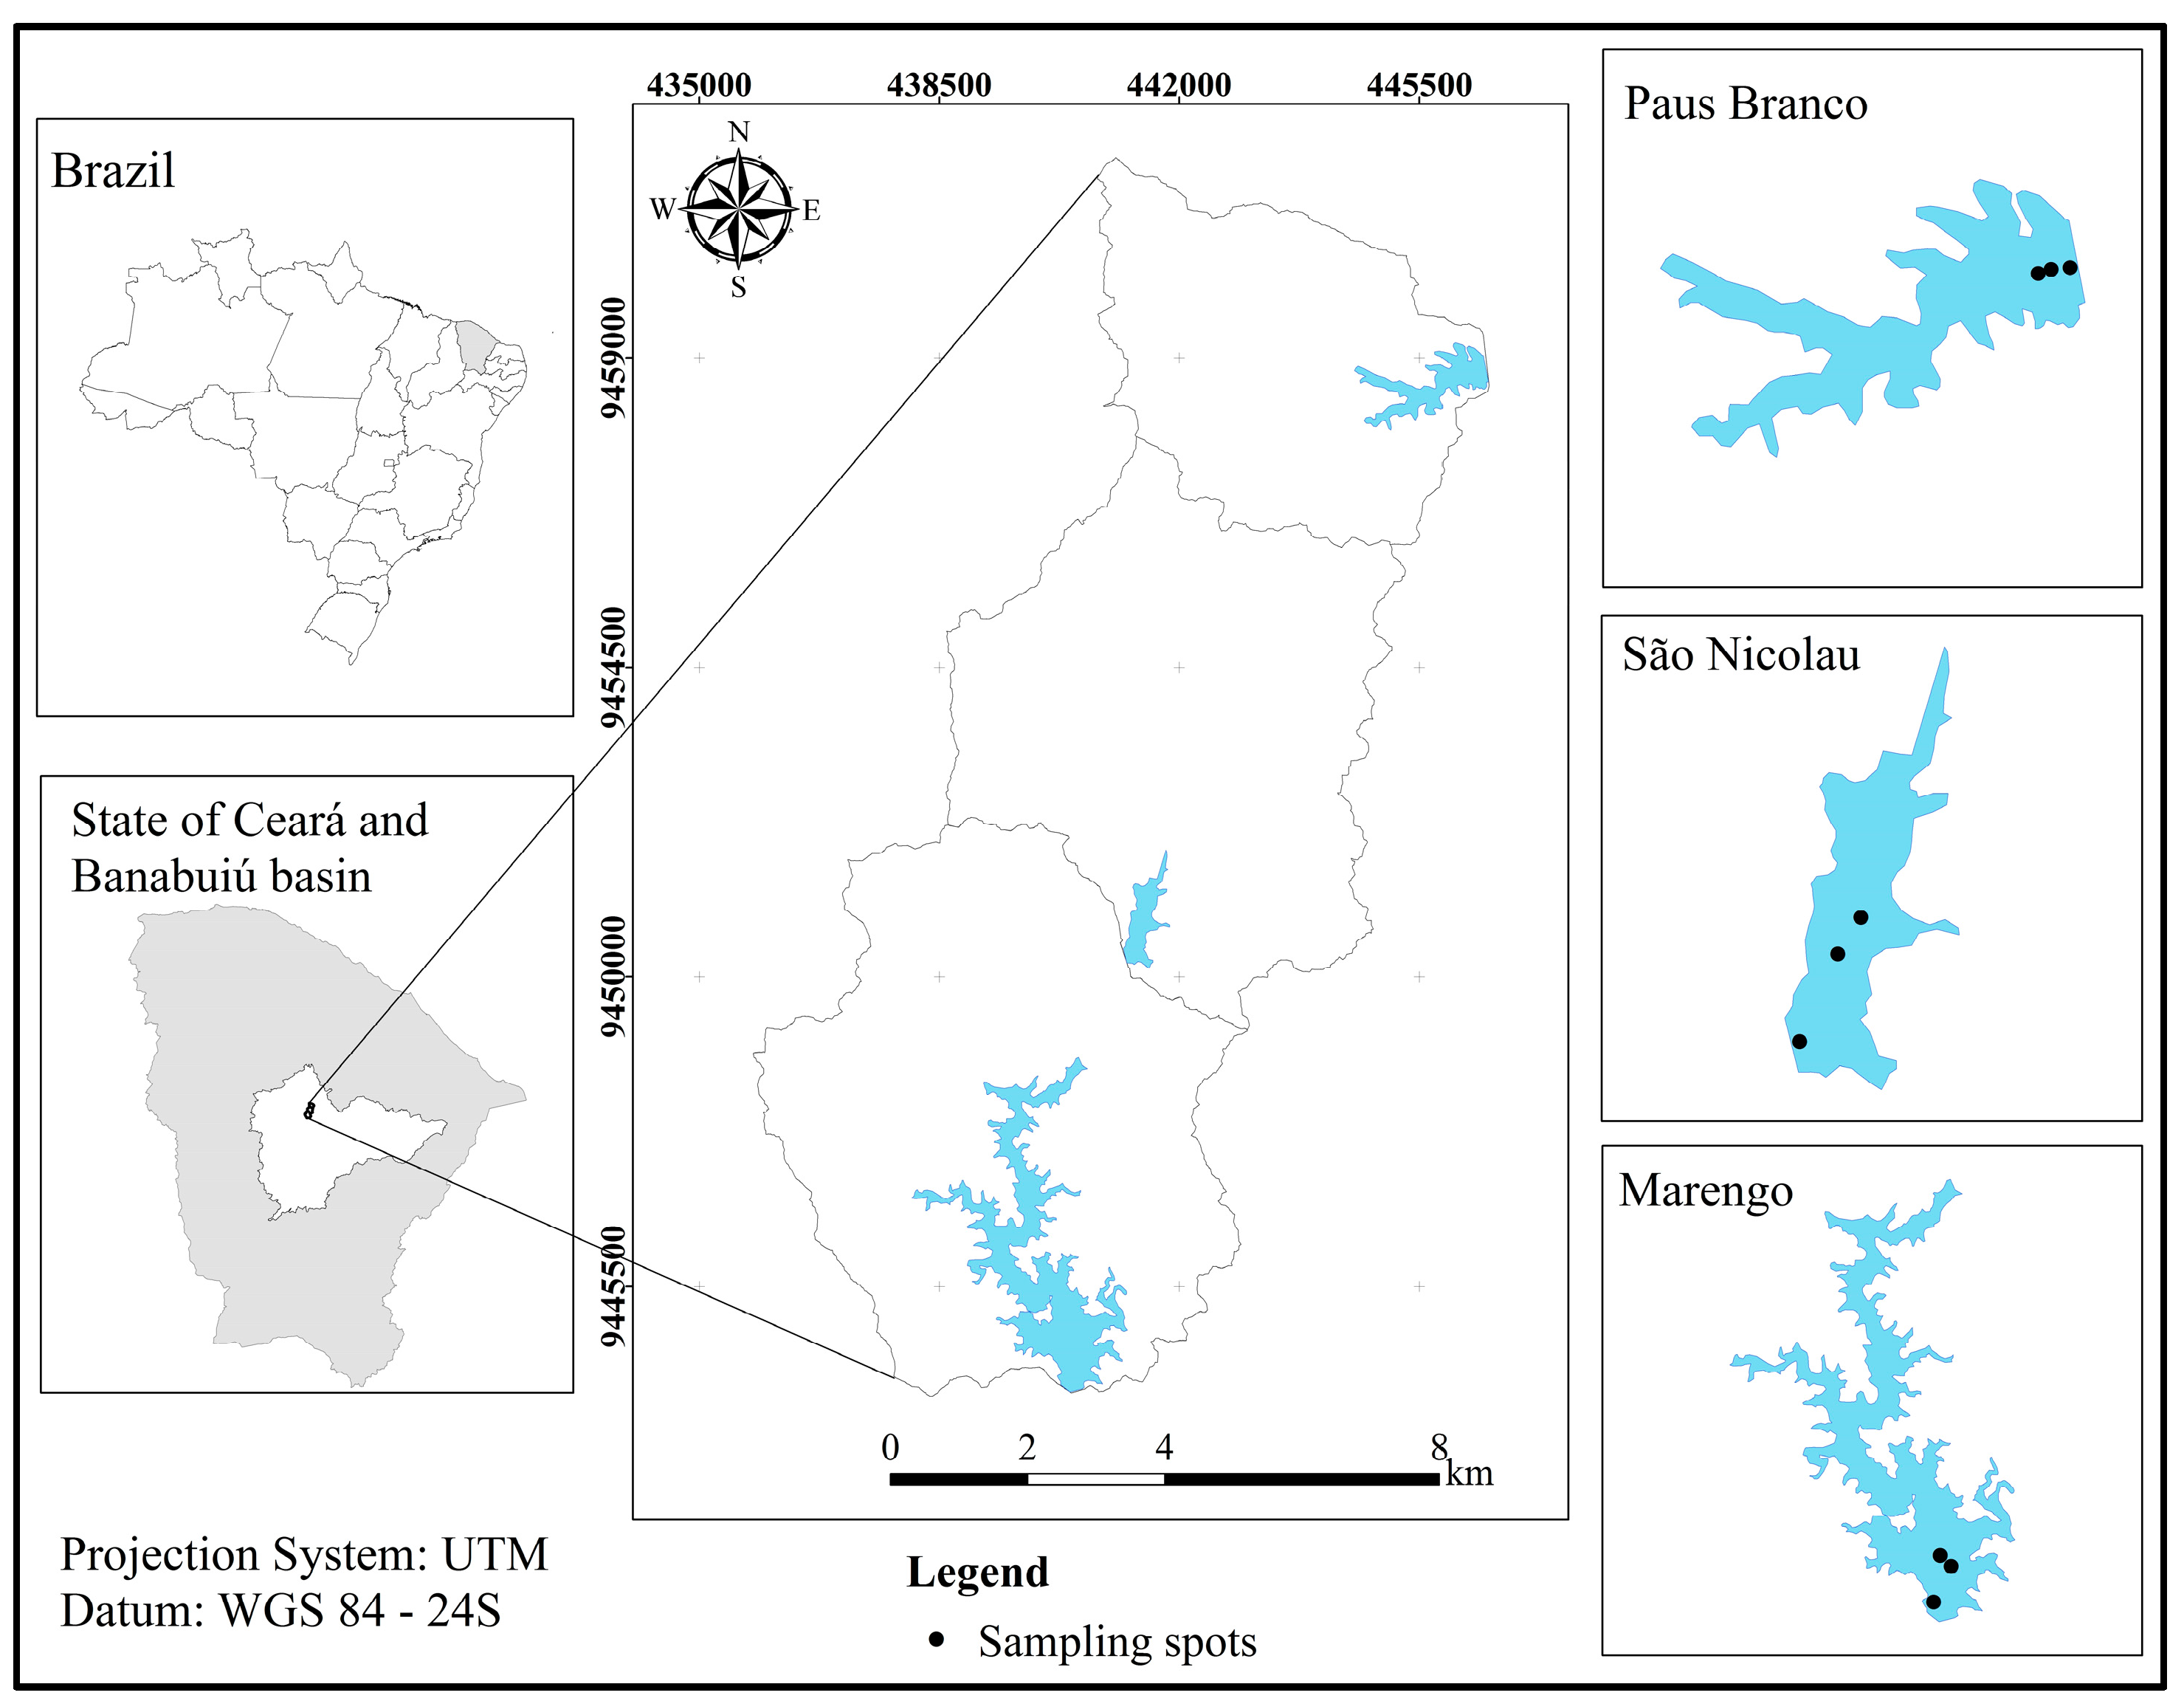
2.1. Study Area

The study focuses on three reservoirs: Marengo (MAR), Paus Branco (PB) and São Nicolau (SN), located in the Madalena Basin (124 km2, see Figure 1), nested in the Banabuiú River Basin, State of Ceará, Brazil. This region has a semiarid climate with water scarcity in the dry season (most prominently between July and December) and high inter-annual rainfall variability. The total average precipitation is approximately 600 mm·year−1; the potential evaporation is around 2500 mm·year−1; the monthly temperatures range from 26 °C to 28 °C. The basin is vulnerable to droughts, and the investigation occurred during a pluriannual recorded drought, which started in 2012 [43].
The Madalena Basin is located within the Land Reform Settlement “25 de Maio”. The main water source for the local population (around 600 families), for animal supply, for fishing and for small-scale irrigation is comprised by the surface reservoirs. The three reservoirs were chosen for this study because they are distinct in terms of size and limnological characteristics. Marengo is a Perennial (PR) and highly dendritic reservoir with 75.3 km2 of hydrographic basin and a maximum storage capacity of 15.3 hm3, whereas Paus Branco and São Nicolau are Non-Perennials (NPR) and have 36.1 km2 and 22.5 km2 of hydrographic basin and a maximum storage capacity of 5.5 hm3 and 0.89 hm3, respectively.
The catchment areas of the focus reservoirs are subject to a similar land use and land cover: free access of animals to water bodies, floodplain crops (called “vazantes”), agrochemical use, practice of soil burning, exposed soil (areas prepared for agriculture or livestock farming) and poor sanitary infrastructure. These practices favor the process of eutrophication. No occurrence of macrophytes is noticeable in the Marengo reservoir (Figure 2a), whereas there was a dense presence of emerged macrophytes in Paus Branco (Figure 2b) and the occurrence of submersed species in São Nicolau (Figure 2c) during the investigation period.

2.2. Limnological and Environmental Data

2.2.1. Hydrochemistry and Hydro-Optics

Water samples were collected by boat at a water depth of 30 cm from the surface, stored in cooled Styrofoam containers and carried to the laboratory for the analysis of Total Phosphorus (TP), orthophosphate (PO43−) and Chlorophyll-a (Chl-a). The water filtration for the subsequent CDOM lab analysis was carried out in loco through cellulose acetate membranes (pore size: 0.45 µm). Water transparency was measured with a Secchi disc (25-cm diameter). The sampling was conducted from May 2014 to January 2016, totaling 16 field campaigns (Table 1) and covering both dry and rainy seasons.
In situ reflectance spectra were measured with an ASDFieldSpec®3 Hi-Res spectroradiometer (Analytical Spectral Devices, Inc.; Boulder, CO, USA) with a field-of-view of 25°, spectral resolution of 1.4 nm and a 350–2500 nm spectral range. A Spectralon reference panel was used to represent a Lambertian surface and to provide the reflected measurement of the downwelling component. Measurements of the upwelling signal were taken between 10 a.m. and 2 p.m. and with an azimuth angle away from the Sun in accordance with NASA’s protocols. Measurements of water radiance were carried out simultaneously with the water samplings on 27 December 2014 (in Marengo), on 3 February 2015 (in Marengo and São Nicolau) and on 11 November 2015 (in Marengo and Paus Branco). The values of the upwelling and downwelling measurements were normalized into the reflectance, R, using Equation (1), according to [44].
R λ = D N a , λ D N r , λ
where Rλ represents the reflectance factor (dimensionless); DNa,λ is the upwelling spectral radiance as the Digital Number (DN) measurement; and DNr,λ is the downwelling spectral radiance reflected from the reference panel.
Concentration of Chl-a was obtained using a spectrophotometry method from extraction with acetone 90%, while TP was measured by digestion with persulfate followed by the ascorbic acid method [45]. PO43− and Total Suspended Solid (T.S.S.) concentration were also obtained, according to American Public Health Association (APHA) [45]. The absorbance of CDOM (Aλ) was measured within wavelength range 250–800 nm by a Lambda 950 UV-VIS spectrometer, (PerkinElmer, Inc., Norwalk, EUA) with a 5-cm quartz cuvette. This measurement was converted to CDOM absorption (m−1) according to Equation (2):
aCDOM ( λ ) = 2.303 × A CDOM ( λ ) l
where aCDOM corresponds to the absorption coefficient of CDOM per wavelength (λ); ACDOM stands for spectral absorbance per wavelength (λ); and ‘l’ is the cuvette path length in meters [46]. Furthermore, according to the authors op cit., we applied Equation (3) to determine the spectral slope in both the ultraviolet SUV (S275–295) and in the visible SVIS (S350–500) domains. Subsequently, the slope ratio Sr (S275–295:S350–500) was obtained to characterize CDOM types.
a C D O M ( 440 ) = a C D O M ( 440 ) S ( λ 0 λ )
In Equation (3), aCDOM(440) is the specific absorption coefficient at 440 nm (m−1); and S (λ0λ) is equal to the spectral slope over a particular wavelength domain of aCDOM(440) (nm−1).

2.2.2. Calculation of the Trophic State Index

The Trophic State Index (TSI) proposed by [37] was applied, as modified by [38], as expressed in Equations (4)–(6), which takes into account the Secchi dick transparency depth (m); as well as TP and Chl-a concentration (mg·m−3):
TSI S D = 10 × ( 6 0.64 + L n   ( S D ) L n ( 2 ) )
TSI T P = 10 × ( 6 Ln ( 80.32 T P ) L n ( 2 ) )
TSI C h l a = 10 × ( 6 2.04 0.695 × L n ( C h l a ) L n ( 2 ) )
The average value among Equations (4)–(6) was assumed as the representative TSI. The criterion for the classification of the trophic state is: ultra-oligotrophic (TSI ≤ 24), oligotrophic (24 < TSI ≤ 44), mesotrophic (44 < TSI ≤ 54), eutrophic (54 < TSI ≤ 74) and hypereutrophic (TSI > 74), as adopted by [38].

2.2.3. Environmental Data

Precipitation: Monthly data on precipitation were taken from the Madalena city rain gauge because it is the nearest gauge to the reservoirs. The period of data coincides with that of the field campaigns (from May 2014 to January 2016), and the data were obtained from Foundation of meteorology and water resources of State of Ceará—FUNCEME [47].

2.3. Optical Satellite Data Processing

Assessing water quality of inland waters by means of optical RS requires sensors that operate in the visible to near infrared wavelength range with a sufficient spatial/temporal resolution to adequately capture the magnitude of the optically active constituents of the water body. The Landsat program provides more than 40 years of satellite observations and is currently continued with LDCM (Landsat Data Continuity Mission) operating with the Operational Land Imager (OLI) on board of Landsat-8 (L8). L8 was launched on 11 February 2013 with a revisit time of 16 days and a spatial resolution of 30 m for Bands 1–7 [48]. It has five bands in the visible to near-infrared wavelength range: b1 (blue; 435–451 nm), b2 (blue; 452–512 nm), b3 (green; 533–590 nm), b4 (red; 636–673 nm) and b5 (NIR; 851–879 nm).
While the Landsat series is considered as a medium resolution mission, the RapidEye Earth Imaging System (REIS) provides a much higher spatial resolution. The RapidEye (RE) products used in this study were provided by the RapidEye Science Archive (RESA) at German Aerospace Center (Köln, Germany) and have a pre-processing level of 3A, i.e., they are orthorectified resulting in a spatial resolution of 5 m [49]. RE imagery has five bands in the VNIR interval: blue (440–510 nm), green (520–590 nm), red (630–685 nm), red edge (690–730 nm) and near-infrared (760–850 nm). The main feature that distinguishes RE from most other multispectral satellites is the red edge band. It is spectrally located between the red band and the NIR band without overlap, and it covers the portion of the spectrum where the reflectance of vegetated surfaces drastically increases from the red wavelength region towards the NIR reflectance plateau providing additional information about vegetation characterization [50]. The optical satellite datasets were selected on dates closest to the field samplings, with the restriction of cloud cover lower than 20%. The satellite dataset used in this investigation consisted of six L8 scenes (Path 217/Row 63) and eleven RE tiles (2436712 and 2436812), as indicated in Table 1.
L8 satellite images were obtained from the United States Geological Survey (USGS) as the Landsat Surface Reflectance L1T product that had been preprocessed (georeferenced and atmospherically corrected) using the L8SR software (USGS, Sioux Falls, EUA) [51]. The atmospheric correction of the RE images was carried out in -2 within ERDAS IMAGINE® (ATCOR 3, version 9.0.2, Wessling, Germany; and Wil, Switzerland) using the MODTRAN-4 code (MODerate Resolution Atmospheric TRANsmittance Algorithm). For this processing, a pre-defined calibration file was used for flat terrain with an elevation of 200 m and the option for the atmospheric model for “dry tropical areas” [52].
We masked out water with higher NIR reflectance to ensure that these pixels were free from floating vegetation and did not include areas of exposed mud flats. Subsequently, we defined Regions Of Interest (ROIs) to extract reflectance values at or close to the in situ sampling sites and calculated an averaged reflectance per ROI based only on open water pixels. We investigated the sensitivity of the spectral L8 and RE bands related to Chl-a, in particular the ‘relative greenness’, i.e., the height of the green reflectance peak versus the absorption by phytoplankton pigments in the blue and red wavelength region of the first and second Chl-a main absorption bands using [(2 × green)/(blue + red)].
For CDOM the green/red ratio approach according to [8] was tested. However, a high CDOM concentration and therefore absorption in some of the surface waters spectrally flattened the surface reflectance over a very broad wavelength range resulting in a too small range of the ratio values. Therefore, the blue instead of the green wavelength region was chosen in order to increase the value range utilizing the blue/red ratio, for both satellite products (L8 and RE) and keeping the principle of Kutser’s CDOM band ratio algorithm of using a shorter wavelength band with exponentially higher CDOM absorption versus the longer wavelength red spectral band.
Regressions of the ‘relative greenness’ versus in situ Chl-a and also of the blue/red ratio values versus in situ CDOM were established. Additionally, several bands or bands’ combination for retrieving these limnological attributes were tested. The Nash–Sutcliffe coefficient (NSE) [53] was adopted for validation and calibration as a performance indicator for all models tested. RMSE observations’ Standard Deviation Ratio (RSR) and Percent Bias (PBIAS) were also carried out as model evaluation statistics [54].

3. Results

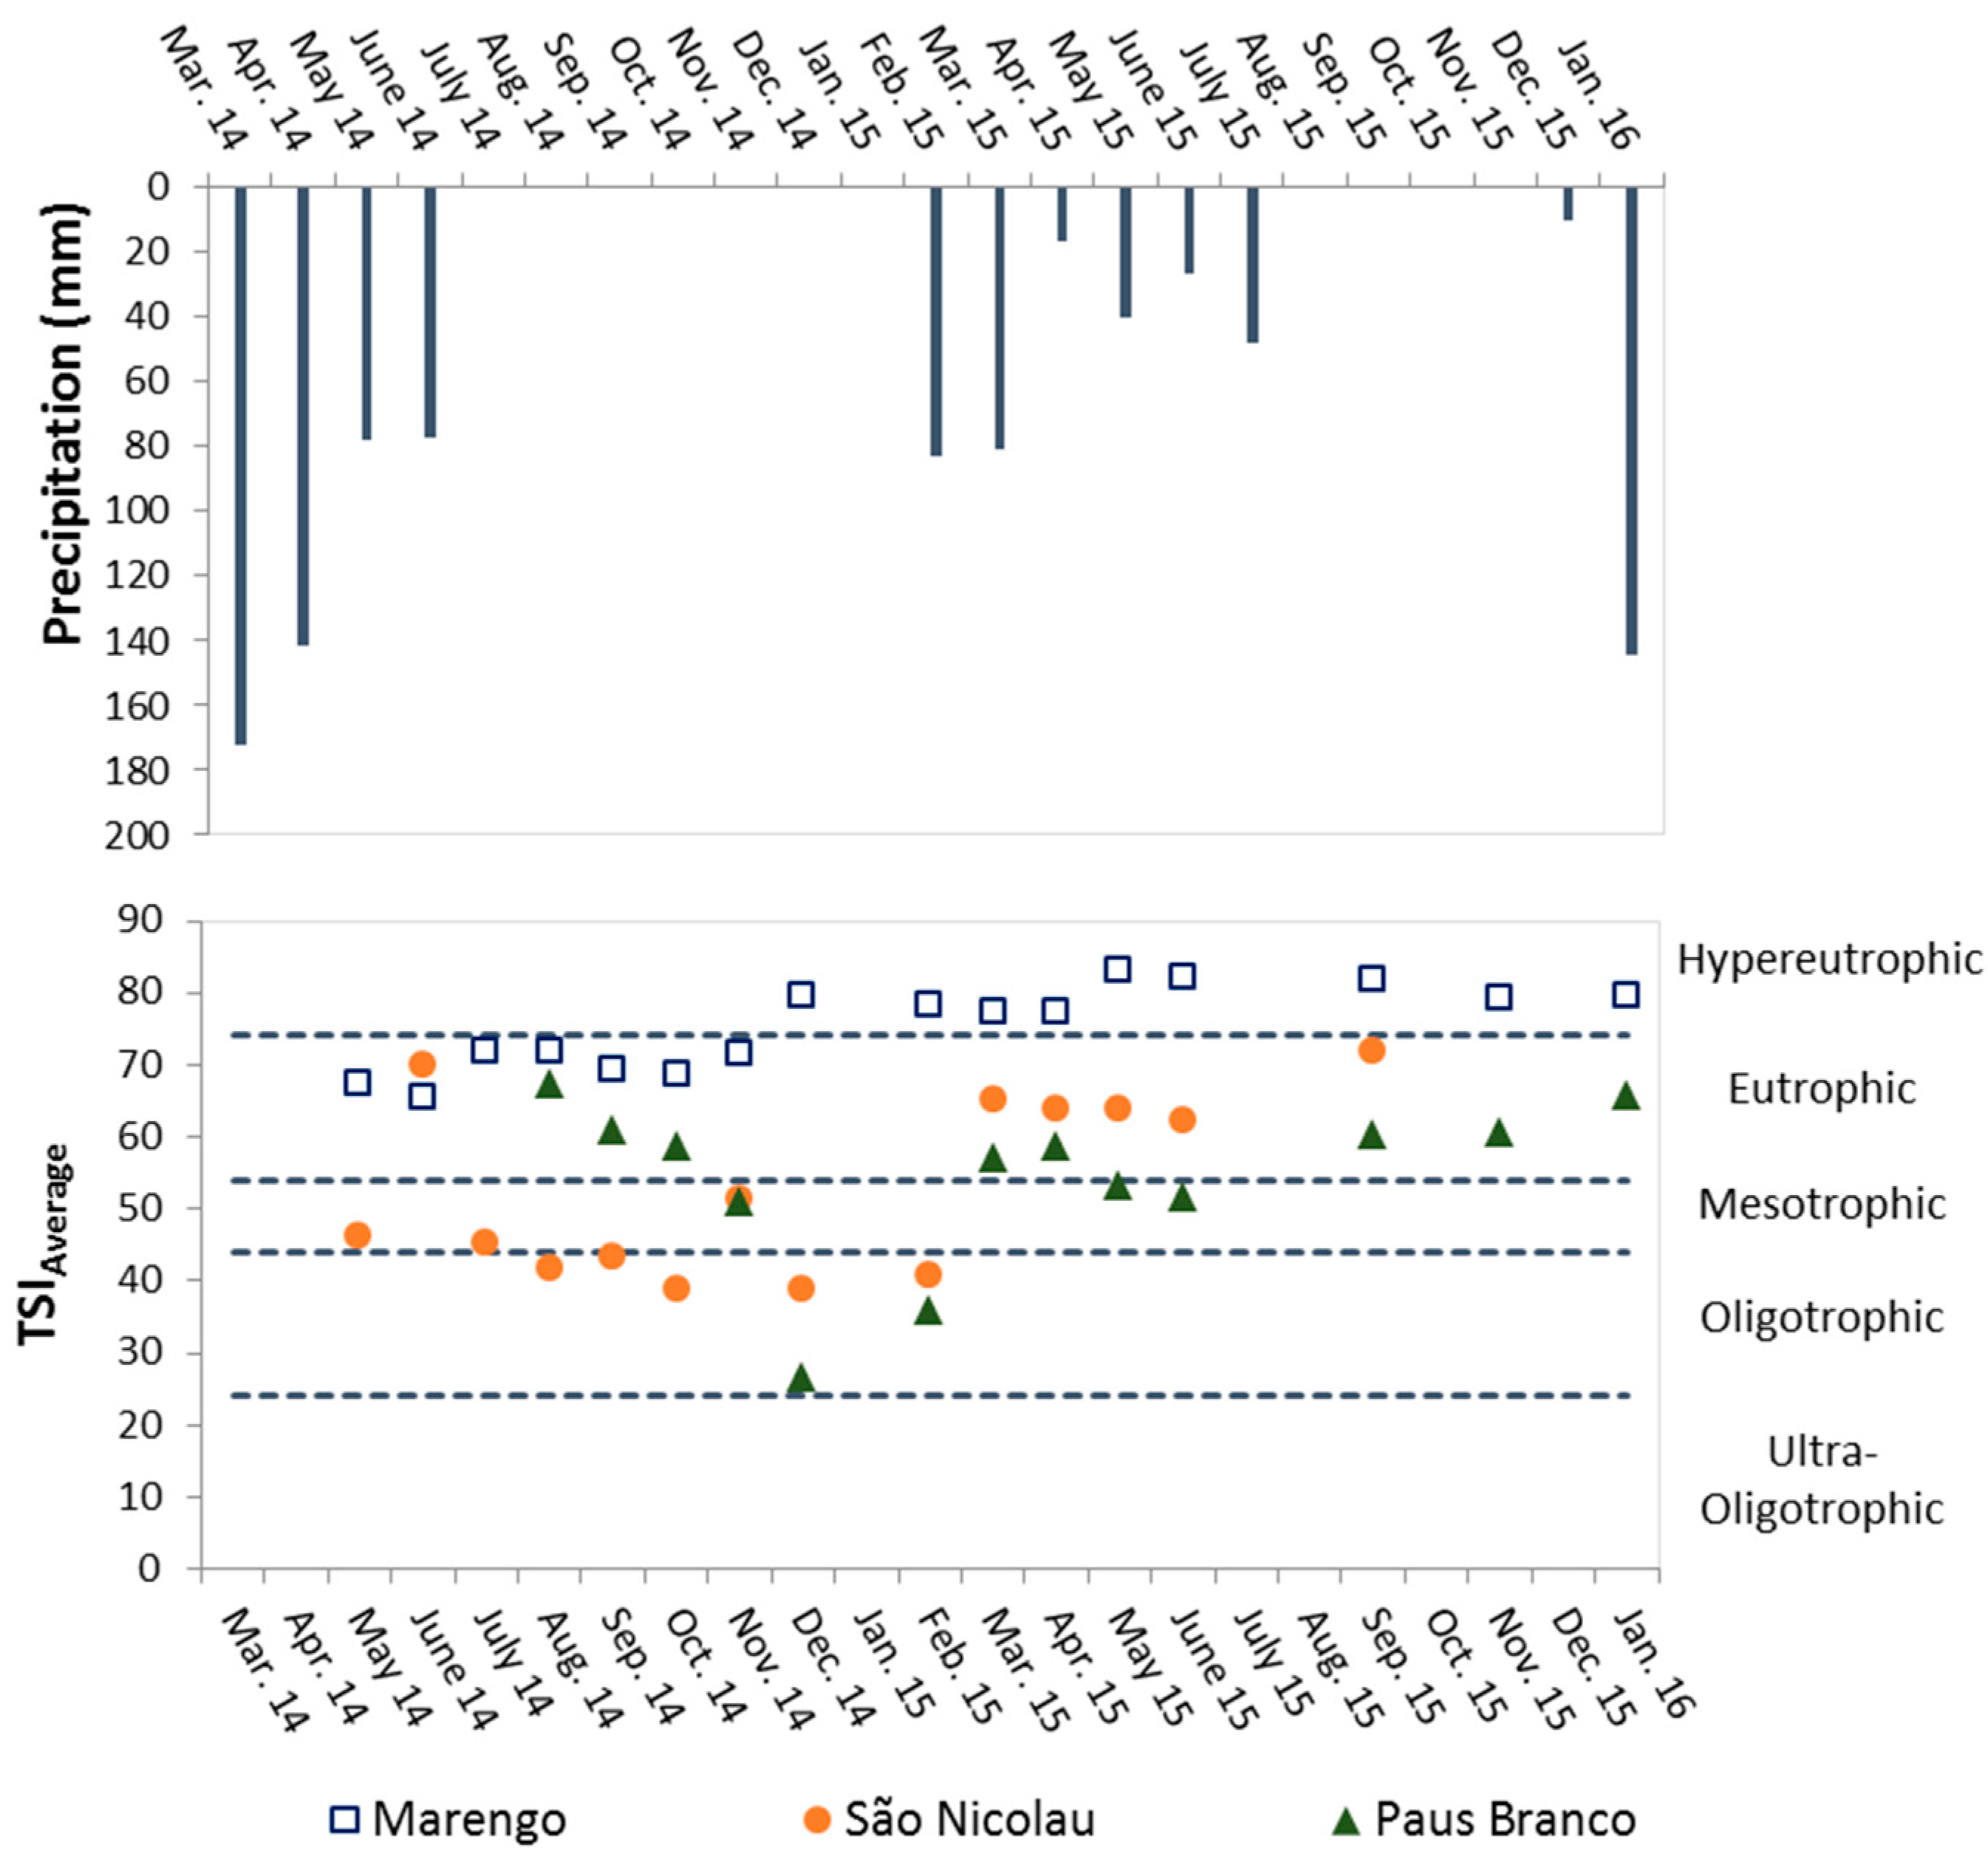
3.1. Assessment of Chlorophyll-a Dynamics and Trophic State Level

The results related to trophic state show a high trophic status for Marengo reservoir during the entire study period, reaching its highest value of hypertrophy (TSI = 83.0) at the end of the wet season in May 2015. Paus Branco and São Nicolau reservoirs presented lower values for mean TSI than Marengo, and they varied between oligotrophic, mesotrophic and eutrophic levels. Both reservoirs showed changes in the trophic level significantly related to the first rains in March 2015 (Figure 3).
SN remained eutrophic, and later, it completely dried, preventing sampling in this reservoir after September 2015 when it was at the limit level of hypereutrophic status. PB showed a highly dynamic behavior. It was eutrophic from August to October 2014, showing better trophic conditions between November 2014 and February 2015 up to reaching an oligotrophic level (TSI = 26.8 in December 2014 and TSI = 35.9 in February 2015), returning to a eutrophic level in March and April 2015 (rainy season) and a mesotrophic level in May and June 2015 (end of rainy season); from September 2015 and subsequent months, PB was classified as a eutrophic lake.
The occurrence of submersed macrophytes is usually correlated with lower trophic levels. This trophic level estimate was also supported by Secchi disk depth >1.0 m from August 2014 to February 2015 for SN reservoir and equal to 0.9 m (on average) from September 2014 to June 2015 for PB, being much higher than those observed for MAR. This parameter indicates the amount of light penetration into the water.
The third limnological attribute considered in the TSI estimate is TP, which stimulates the growth of algae and is a proxy indicator of water fertility. It was above 30 mg·m3 for all reservoirs during the studied period. This value corresponds to the threshold for Case 2 waters according to Brazilian Council of Environment—Resolution No. 357 [55]. The orthophosphate (PO43−) organic fraction available to aquatic plants was higher for PB and SN possibly due to the proliferation of macrophytes. The attributes measured in our investigation are summarized in the Table 2.

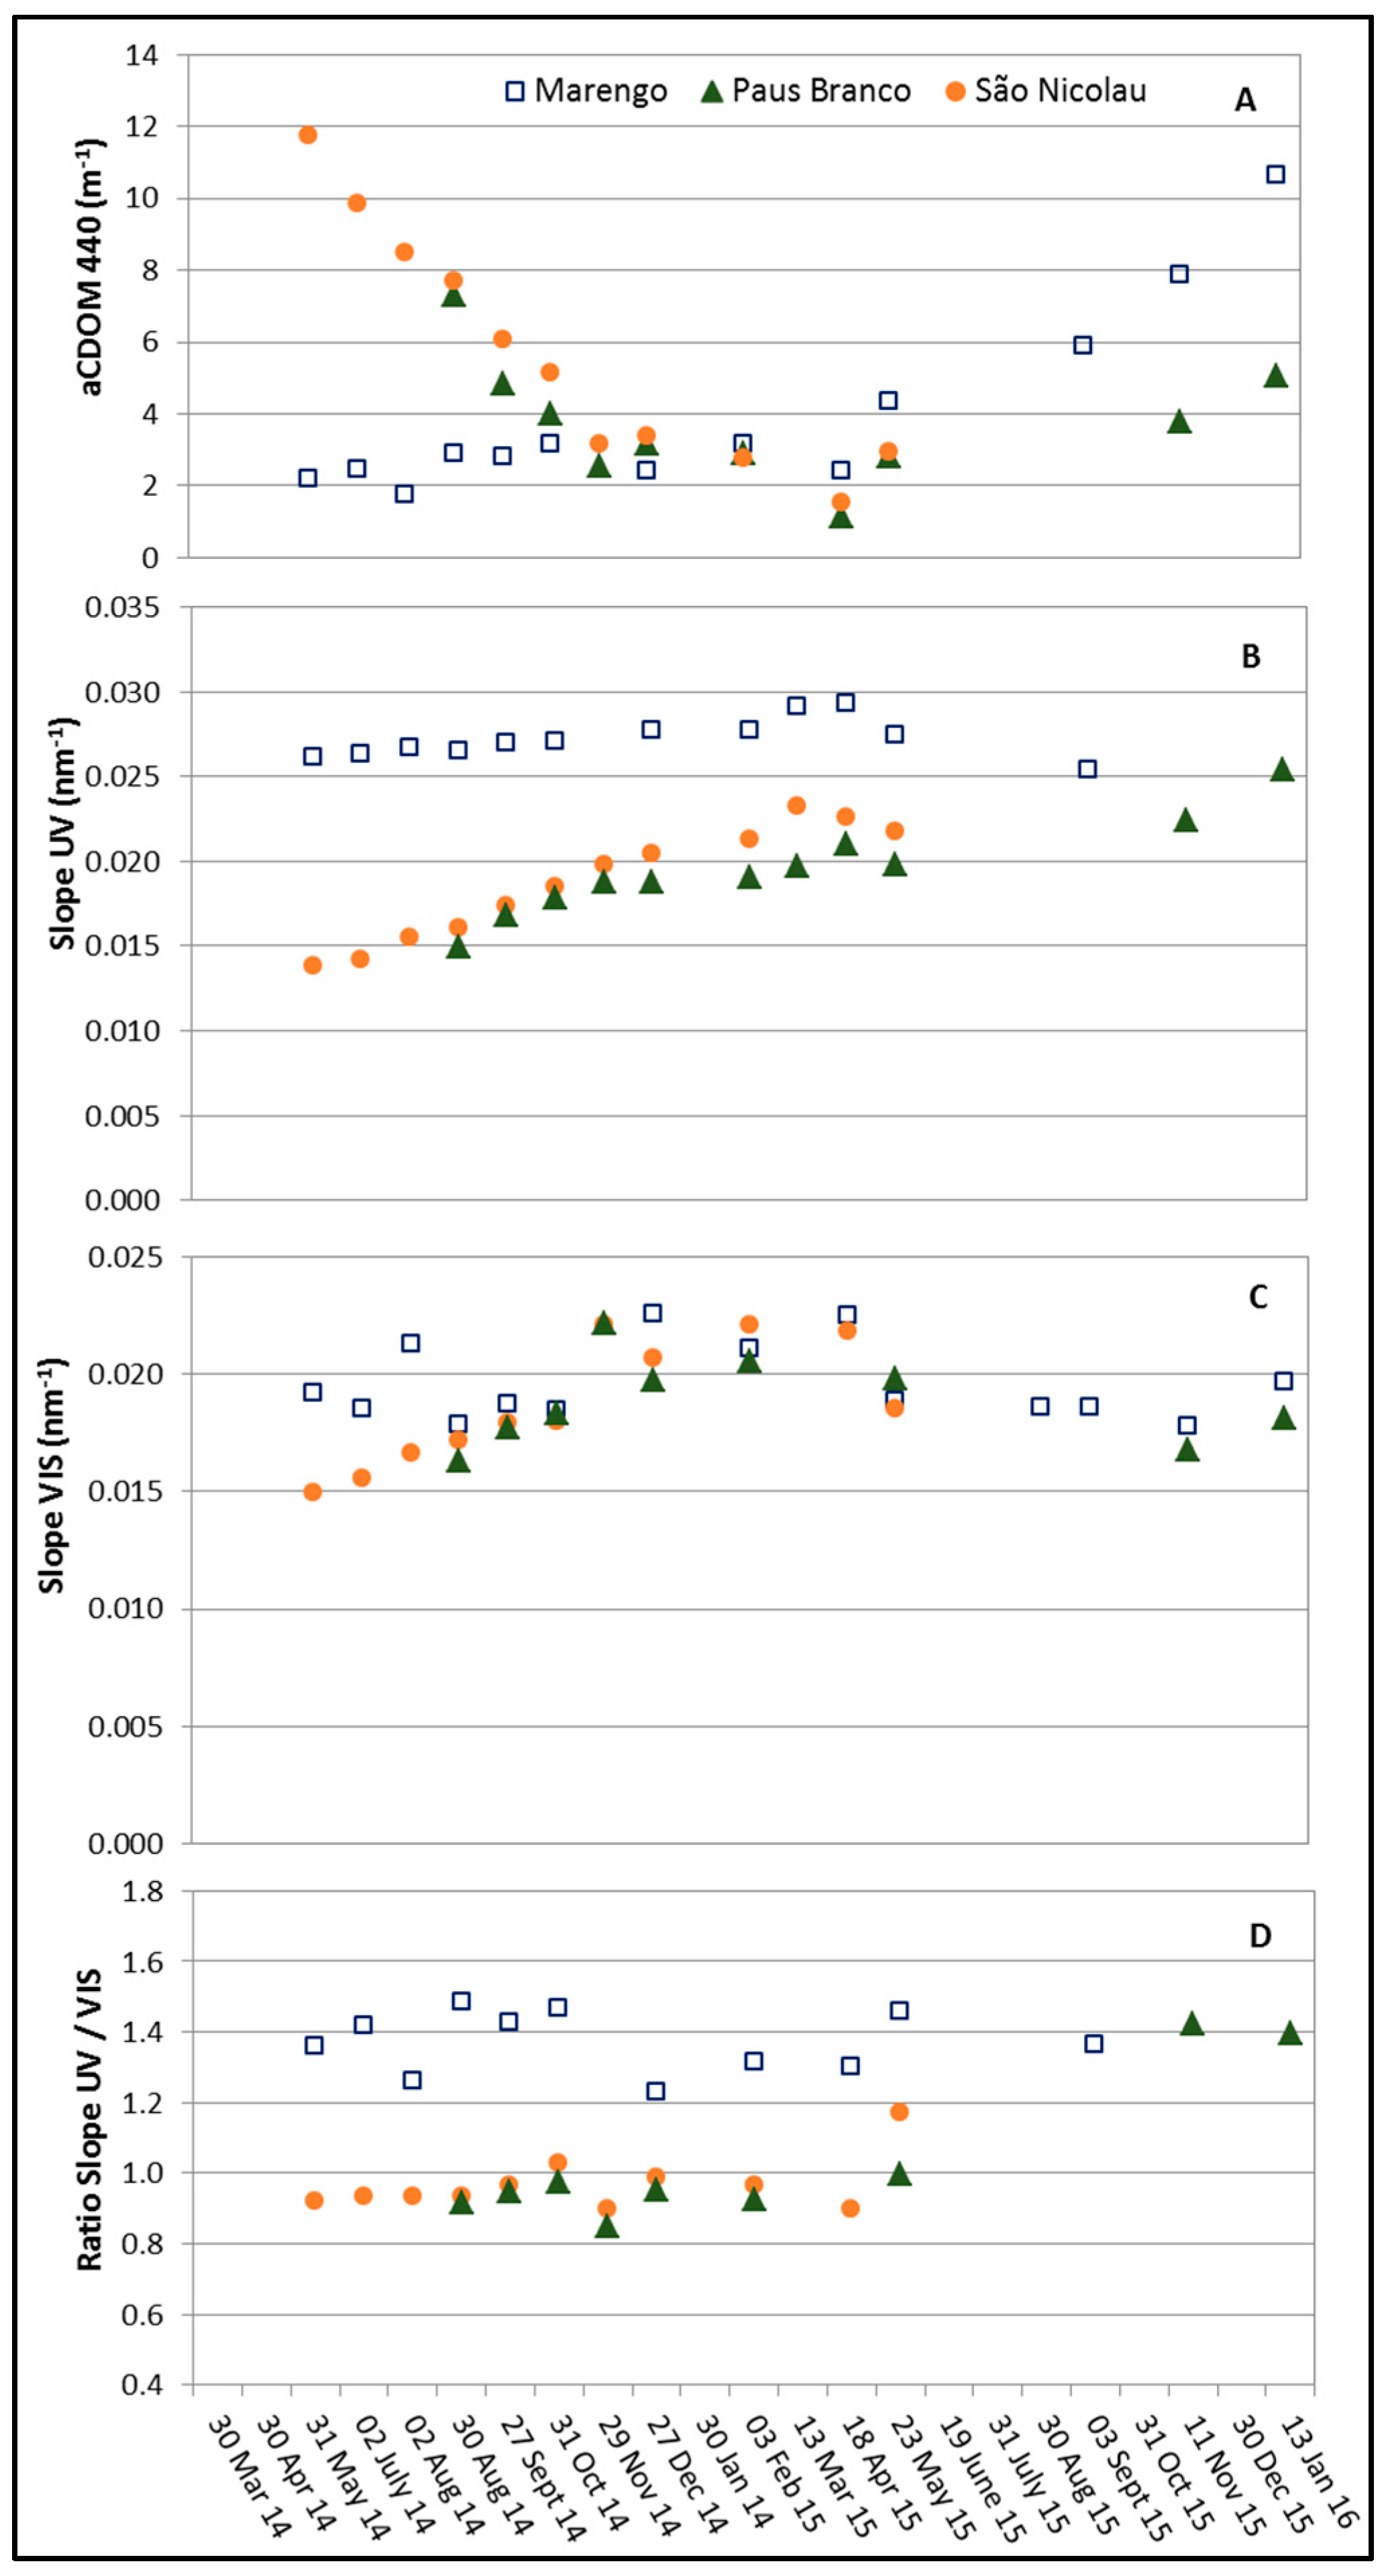
3.2. Characterization of Dissolved Organic Matter

When analyzing the CDOM absorption spectra, high variation between the three studied water bodies and high seasonal dynamics were observed. The values ranged from very low aCDOM(440) = 0.8 m−1 (for SN, in April 2015) up to high values of aCDOM(440) = 12.9 m−1 (for Marengo, in January 2016), as shown in Figure 4a and also described in Table 2. Marengo reservoir presented aCDOM(440) equal to 2.6 m−1 on average from May 2014 to April 2015; from this period onwards, there was a gradual increase, reaching its maximum value in the last month of the study period. Different from MAR reservoir, SN reservoir showed a CDOM decrease from the beginning of samplings until April 2015, when a tendency towards an upward behavior developed. PB reservoir showed a similar behavior to SN starting at an aCDOM(440) average equal to 7.3 m−1 in August 2014 and gradually decreasing until 1.1 m−1 (in April 2015) and increasing again in the following months.
CDOM showed an inverse relationship with water transparency being remarkably observed for SN and PB reservoirs. SN had lower Secchi disk measurements in the initial months (from May to July 2014) with an average equal to 0.5 m and brownish water, showing higher transparency and clearest water between October and December 2014 with an average depth of 1.3 m. Simultaneously, aCDOM(440) showed higher values in rain season months in 2014 (10.1 m−1, on average) and had in general much lower concentrations in the dry period of 2014 (equal to 3.8 m−1, on average) for this reservoir. The same result is observed for PB where the lower transparency water observed was equal to 0.5 m in August 2014, whereas aCDOM(440) in this sampling was 7.3 m−1, the highest aCDOM value for this reservoir. These findings indicate the interference of CDOM concentration in the transparency of water as also found in the relevant publications on water organic matter interactions [15,19].
Spectral Slope (S) gives information on CDOM structure and composition and also its susceptibility to photo- and bio-degradation. SN and PB showed low SUV values (within the spectral range between 275 and 295 nm; SUV = 0.02 nm−1 on average), in contrast to Marengo, which showed higher SUV values. All reservoirs presented a heterogeneous behavior with regard to SVIS (within the spectral range between 350 and 500 nm), where the values ranged on average from 0.015 nm−1 (for SN reservoir in May 2014) to 0.023 nm−1 (for Marengo in April 2015). Very close values between the three reservoirs studied (±0.002 nm−1) were observed. Regarding the Slope ratio (Sr), the values ranged between 0.8 (for SN in June 2014) and 1.5 (for Marengo in August 2014). A similar behavior as for SUV was observed with Marengo reservoir presenting the highest values in comparison to SN and PB. All results are shown in Figure 4.

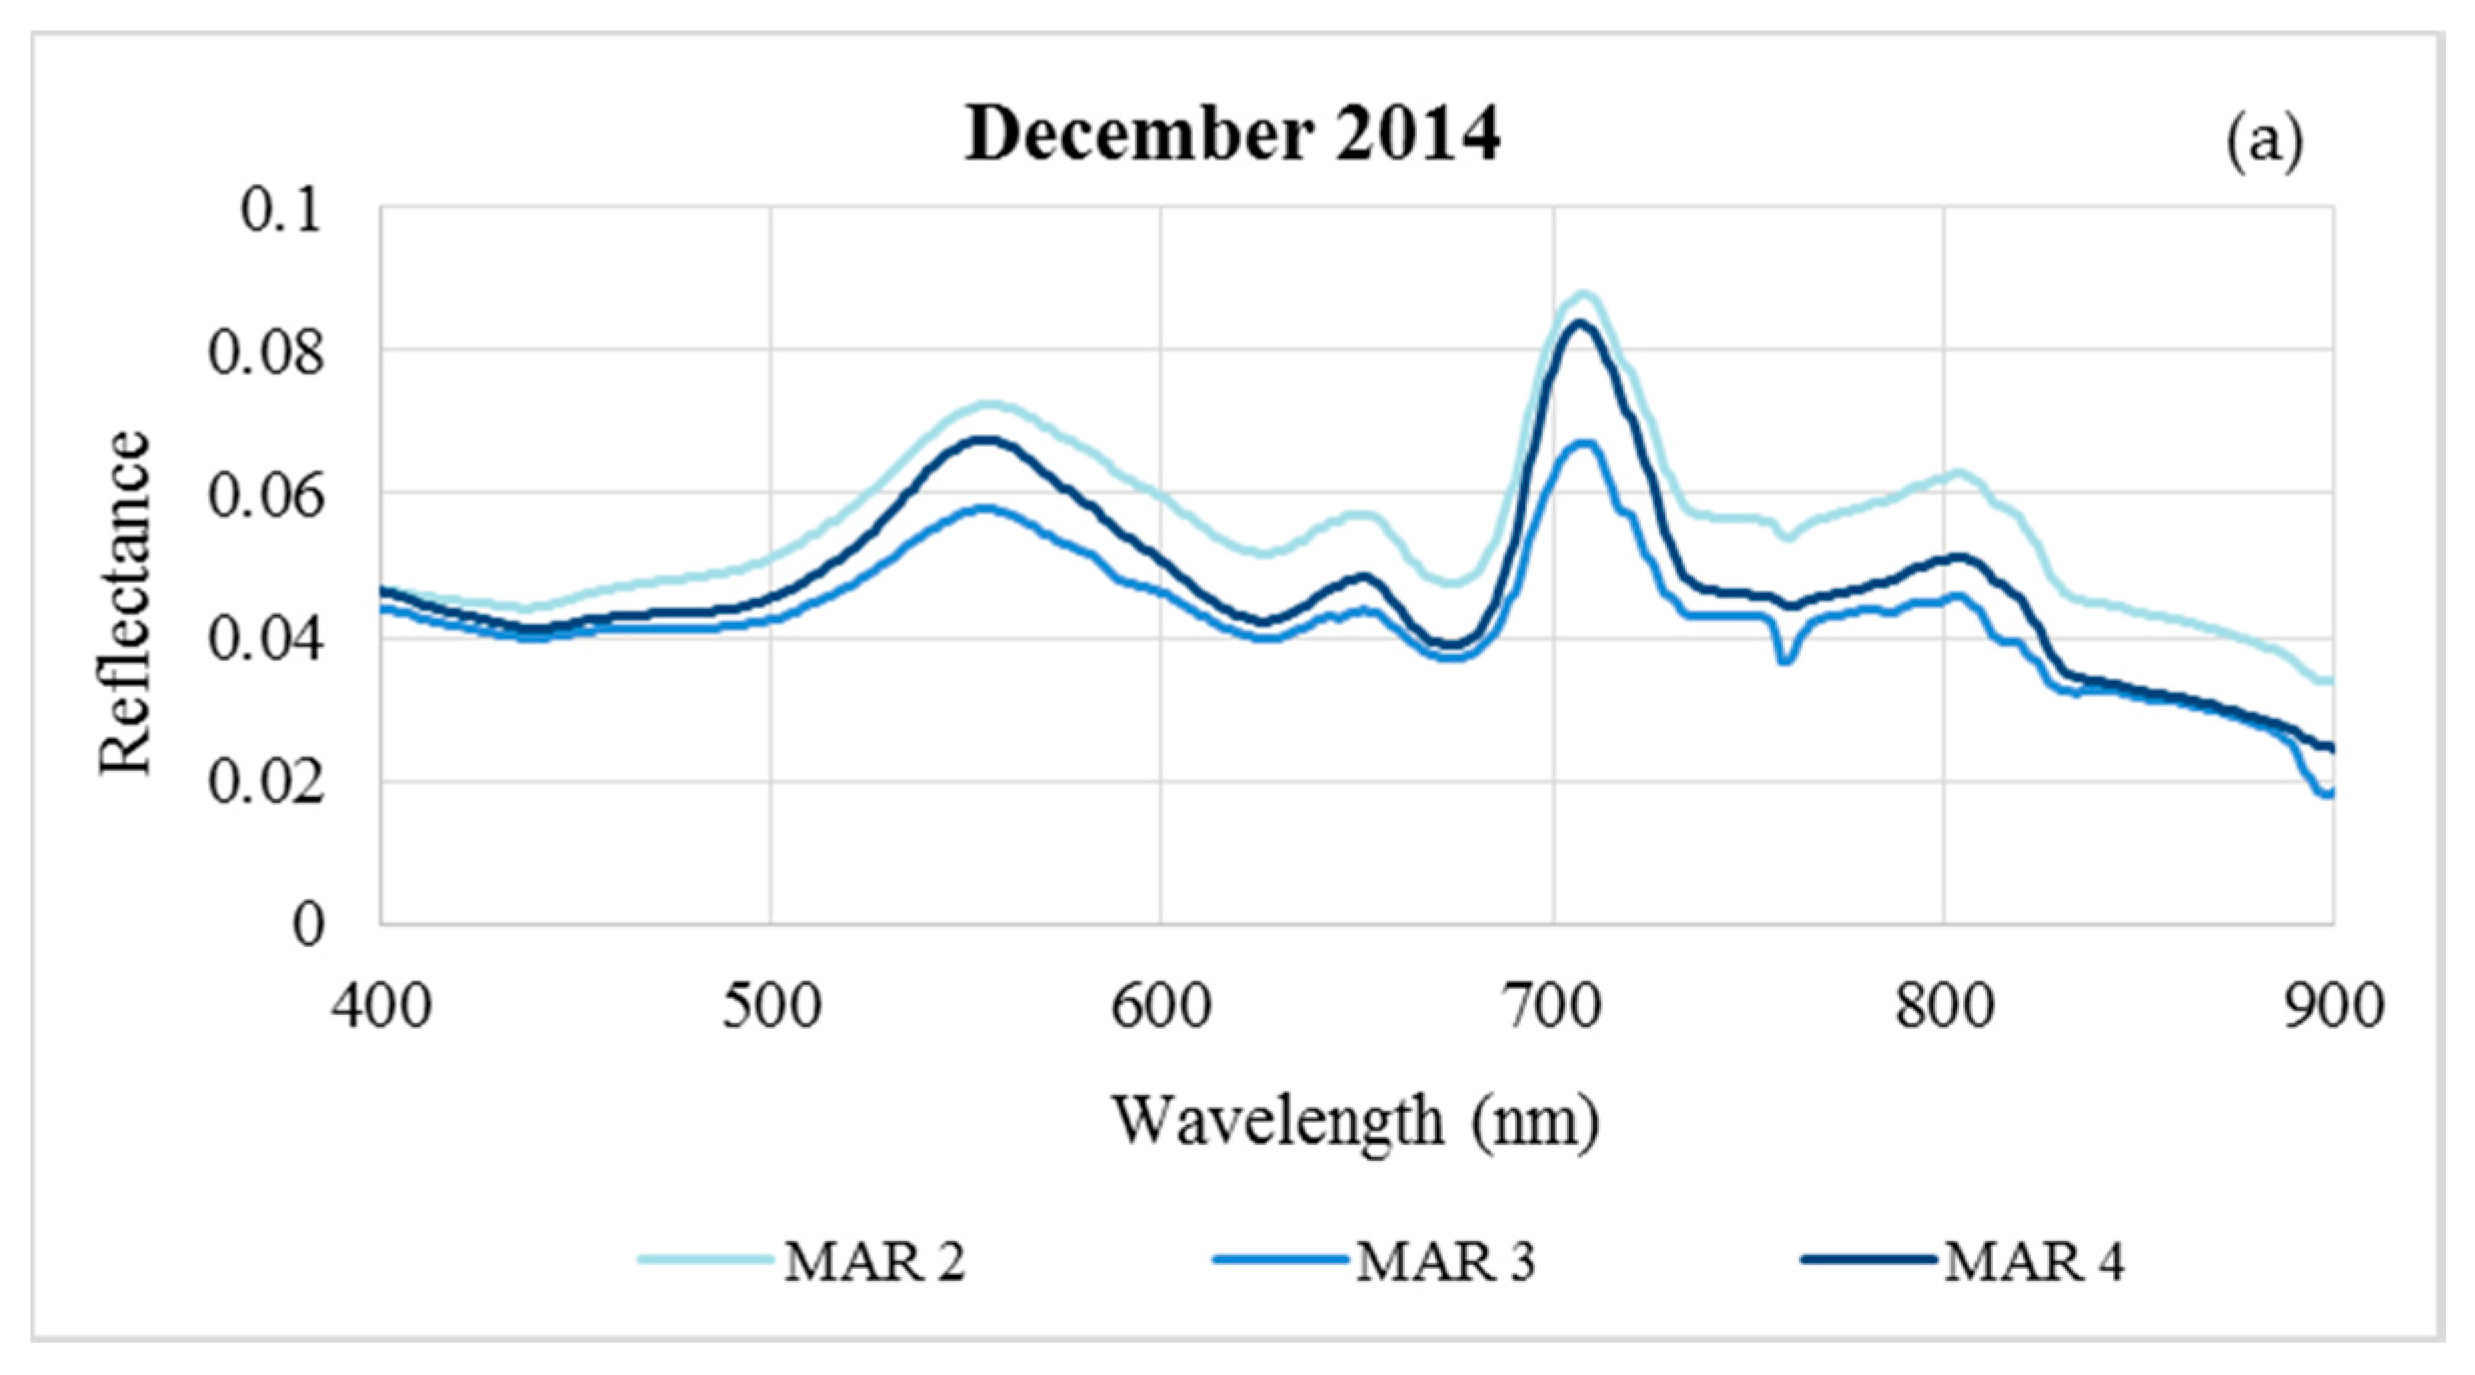
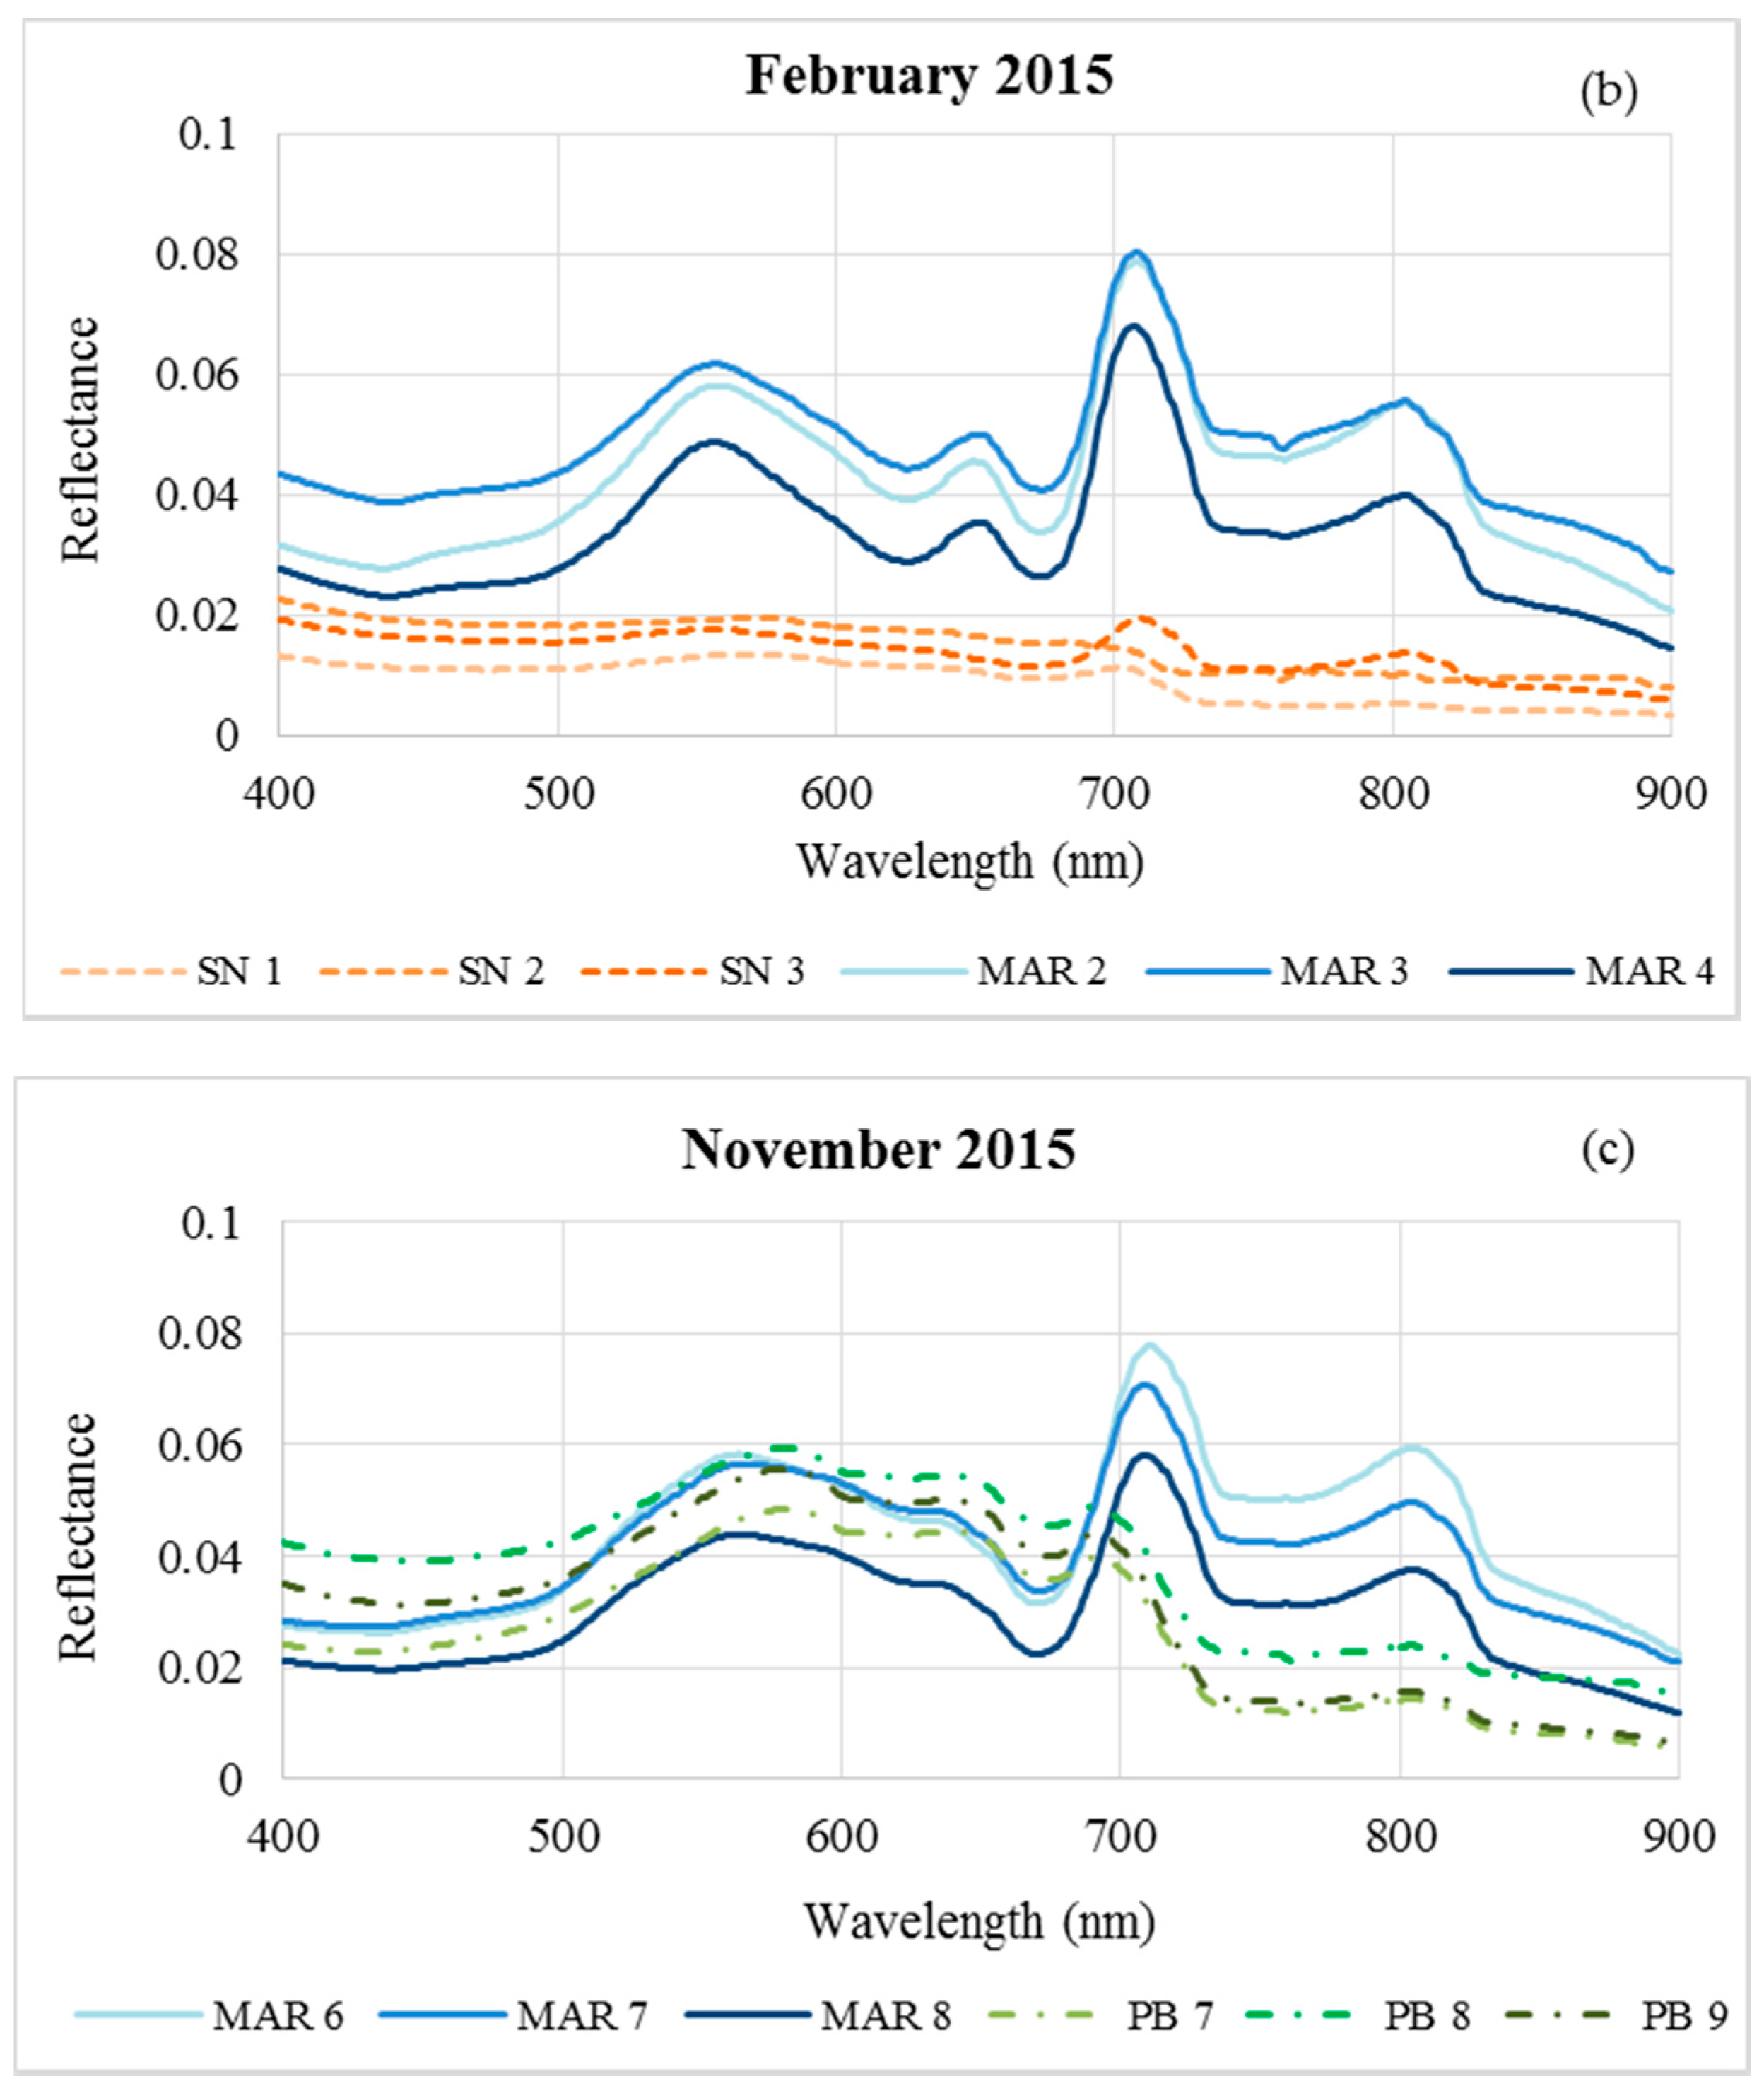
3.3. Exploratory Analysis of In Situ Reflectance Data

Radiometric in situ data are expressed as spectral reflectance (Figure 5). Each measurement was taken from an average of three readings resulting in a spectral database of 45 spectral signatures showing distinct features between MAR, PB and SN reservoirs. Across the spectrum, the reflectance from Marengo was higher than the reflectance from PB and SN reservoirs. On every measurement date of December 2014 (Figure 5a), February 2015 (Figure 5b) and November 2015 (Figure 5c), the reflectance showed a distinct reflectance peak in the green region (~570 nm), an absorption feature in the red (~675 nm) and another high reflectance peak around 710 nm. The reflectance spectra from SN in February 2015 show the lowest reflectance values and overall flatness. The reflectance spectra from PB in February 2015 show high reflectance in the visible, but more absorption in the NIR wavelength region than the reflectance of Marengo.

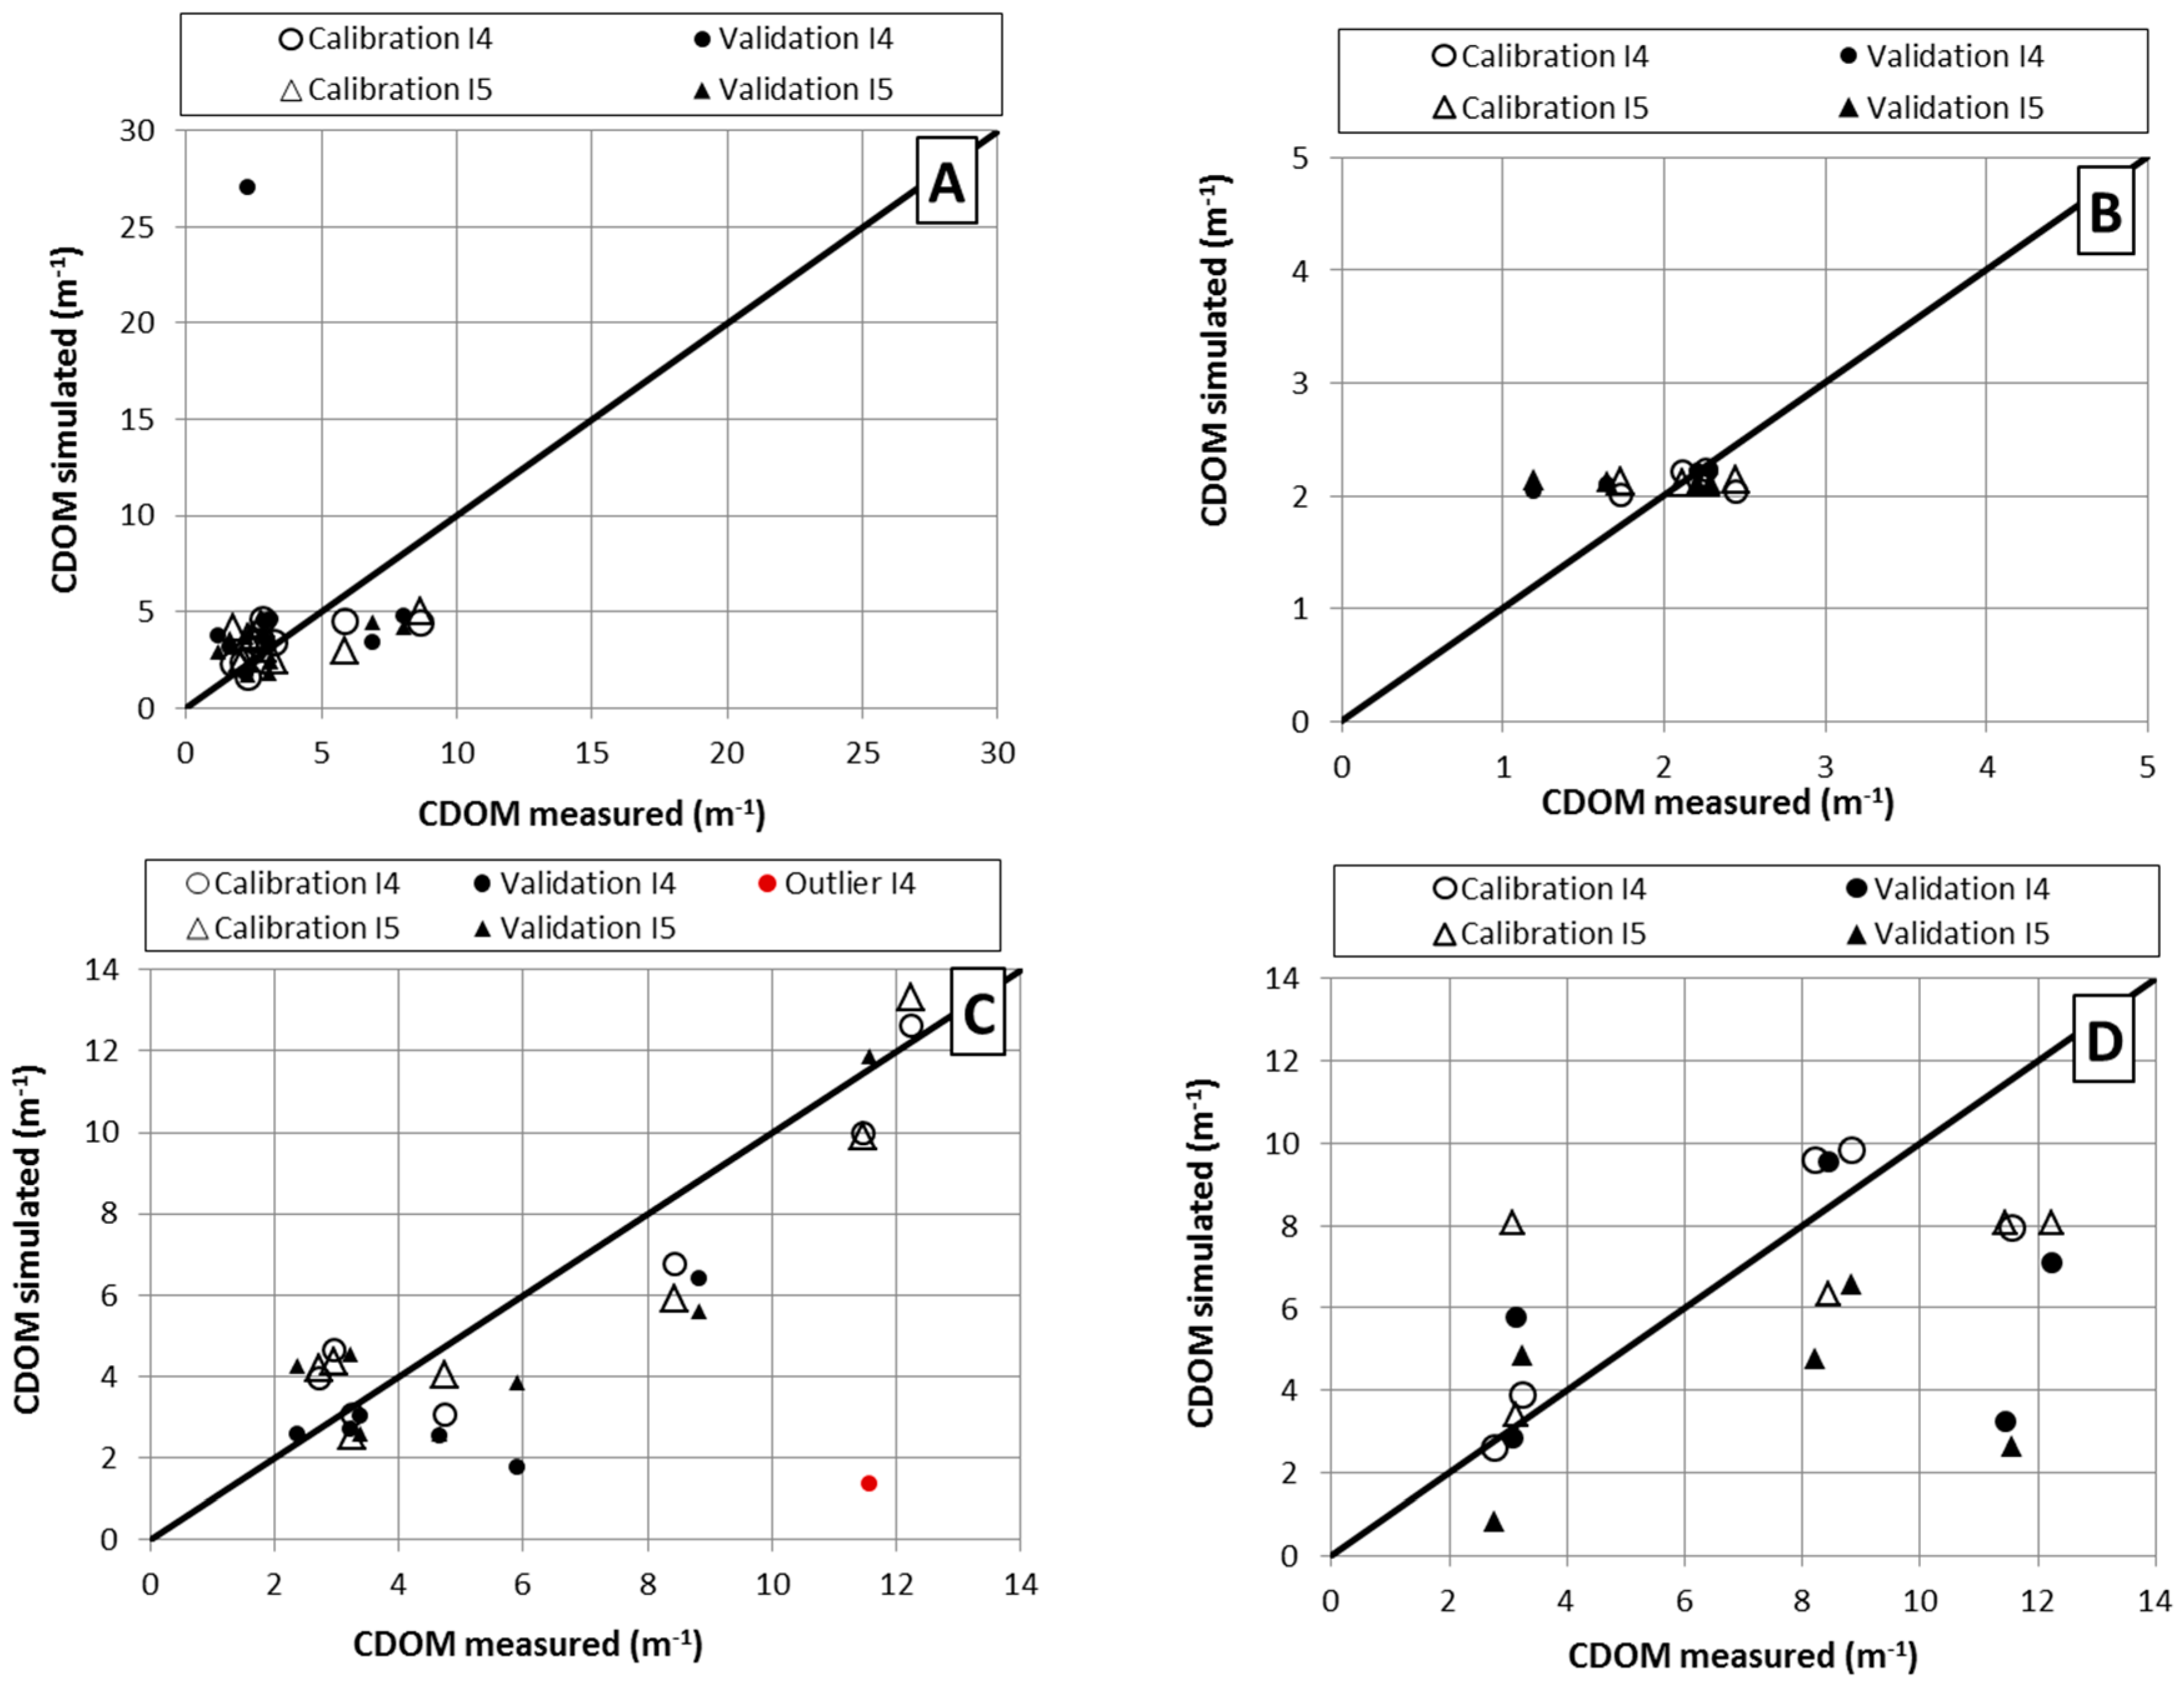
3.4. Satellite-Based Estimation of Chlorophyll-a and CDOM

The reservoirs were separated into two groups, perennial and non-perennial, which have different CDOM and chlorophyll-a regimes to evaluate the capability of L8 and RE reflectance in retrieving chlorophyll-a and CDOM. The proxy for the Chl-a algorithm [(2 × green)/(blue + red)] is based on the principle of combining maximum and minimum reflectance values, since the green wavelength range is related to a region of low absorption by chlorophyll-a, while the blue and red wavelength ranges are domains where energy absorption by chlorophyll-a is high. However, this spectral band combination (Index 1, I1) showed a low Pearson correlation (r = 0.1 for L8 and r = −0.23 for RE), whereas the blue/NIR ratio (Index 2, I2) and the NIR reflectance (Index 3, I3) had the best Pearson correlation with values equal to -0.5 and 0.84 for L8 and RE, respectively.
The blue/red ratio (Index 4, I4) applied for retrieving CDOM showed a Pearson correlation of 0.23 and −0.22 for L8 and RE, respectively. Only the green reflectance (Index 5, I5) showed an acceptable Pearson correlation for CDOM retrieval, this attribute with values of −0.47 and −0.57 for L8 and RE, respectively. These are the highest correlations found and evaluated. Table 3 presents all models tested for each group of reservoirs (perennial, non-perennials and all reservoirs).
The closest relationship between simulated and measured Chl-a concentration was found for the perennial reservoir data type that is characterized by high phytoplankton concentration and is successful using the NIR reflectance of the RE satellite (Figure 6B) with a reasonable degree of reliability (NSE = 0.66, RMR = 0.57, PBIAS = 0.24). The fit values smoothly improved when all reservoirs together were considered with a validation NSE = 0.71, RMR = 0.52 and PBIAS = 0.24. However, the NIR reflectance showed a low fit for non-perennial reservoirs characterized by low phytoplankton abundance (NSE = 0.15, RMR = 0.87, PBIAS = 0.31).
The results of models tested for retrieving CDOM are displayed in Figure 7, and a closer relationship between simulated and measured CDOM concentration was found for non-perennial reservoirs data using the green reflectance of the L8 satellite (Figure 7C) with a high degree of reliability indicated by NSE = 0.89, RMR = 0.56 and PBIAS = 0.09. However, this same band had a low fit for the perennial reservoir (NSE = 0.25, RMR = 0.81, PBIAS = 0.12) and showed reasonable values indicated in the calibration considering all reservoirs (perennial and non-perennial), but this presented a low fit for validation, demonstrating that the best performance is reservoir specific.
The coefficient evaluation statistics (NSE, RMR and PBIAS) values found for all models tested are presented in Table 4.

4. Discussion

4.1. Limnological Dynamics and Trophic Conditions

Limnological dynamics in the semiarid reservoirs are strongly influenced by seasonality and also by the prevailing hydro-climatic conditions [34,56]. Generally, it is expected that rainfall stimulates fluctuations in trophic conditions of water bodies due to an increase of sediment input from the drainage areas. This sediment can be rich in organic material and nutrients, promoting the eutrophication process in the reservoirs.
Work comprising the trophic level of Marengo reservoir between the rainy season (April 2011 and March 2012) and the dry season (October 2012 and November 2013) reported the seasonality related to the tendency of water quality deterioration during the dry season, while the TSI estimated for the wet period showed a better condition [34]. However, our investigation was carried out at the beginning of five consecutive years of drought in the State of Ceará [43], which explains the high mean TSI for Marengo in the middle of 2014 worsening during 2015, indicating hypereutrophic conditions. Overall, the reservoirs studied are characterized by high trophic levels between September 2015 and January 2016, which can be explained by the prolonged drought. Hydrological drought is indeed an important factor that controls water quality in aquatic ecosystems, mainly due to water level reduction, increase in residence time and shifts in internal processes [40,56].
The temporal variation in the trophic status of the General Sampaio reservoir (located in the center of the state of Ceará, Brazil) was also verified [32], showing lower values during the rainy season and gradually increasing values throughout the dry period in 2012. Altogether, the hydrological regime in semiarid Brazil acts on limnological dynamics in two ways: with the first rains of the wet season, a deterioration trend of water quality occurs due to the high input of organic matter and nutrients carried from the drainage areas; in a second phase, the water tends to show an improved quality resulting from the dilution of the material carried; the water quality can be upgraded when there is an overflow event in the reservoirs. Usually, there is a deterioration trend of water quality during the dry period [34], and this condition is intensified in extreme hydrological droughts [40].
The results showed intense trophic dynamics for SN and PB reservoirs in comparison to MAR reservoir. This fact can be mainly explained by the aquatic ecosystem size, since smaller lakes have more intense limnological dynamics [15]. In the case of SN reservoir, the dense occurrence of Ceratophyllum demersum can be directly linked to the low trophic status found from May 2014 to February 2015. It is an exotic submerged species that exerts strong competition with nutrients, while its distribution depends on transparency conditions of the water column [57,58].
Despite the fact that the drainage areas of MAR, PB and SN reservoirs are apparently subject to similar practices and land uses (agricultural production with livestock accessing the water bodies, precarious sewage infrastructure in the villages contributing to the supply of nutrients especially though surface runoff), these reservoirs show distinctively different limnological conditions. It shows that the limnology also depend on other factors such as residence time, size and storage capacity of the water bodies, operating rules, morphology features and internal lake processes that occur due to high water level fluctuations.
The different limnological conditions between MAR, PB and SN reservoirs can mainly be linked to characteristics of intermittence, since Marengo is perennial, already built in 1934 (and enlarged in 1956), while SN and PB were built more recently and are non-perennial, highly disturbed limnological systems. There are records of emptying during 2013 in case of PB and from October 2015 (until the end of this research) in the case of SN. Furthermore, small local communities take advantage of the water level decrease and use the (still) moist area of the reservoir floor for cultivating (floodplains, popularly called “vazantes” in the semiarid Brazil). Therefore, when these reservoirs fill up again, a distinct condition related to aquatic metabolic processes arises and leads to different physiochemical characteristics in waters. This factor may also affect the later pattern of spatial and temporal distribution of macrophytes species.

4.2. Dynamics of CDOM

Considering that an optical characterization approach using CDOM is commonly performed in temperate and boreal lakes [13,22,59], it is emphasized that there is, to our best knowledge, no reference for small surface reservoirs of in semiarid Brazil that includes different limnic ecosystems, different seasons and years. A study carried out in the hypertrophic Barra Bonita hydroelectric reservoir located in São Paulo (subtropical Brazilian region), which has a storage capacity of 2600 hm3, measured aCDOM(440) equal to 1.6 m−1 in May 2014 (end of the wet season) and around 2.8 m−1 in October 2014 (end of the dry season) [60]. In the same study area, Alcântara et al. [61] described aCDOM(440) values between 0.6 m−1 (in January 2014) and 1.7 m−1 (in September 2014) for this eutrophic system. Both works related the results to the seasonality with lower CDOM values for the wet season and higher concentration in the dry season. In comparison, we observe a high dynamic of CDOM that seems to be related to wet and dry seasonality and to the different sizes of the reservoirs: the short water retention time in the reservoirs of Madalena basin and a close hydrological connection to the drainage system, as well as high water level fluctuations influencing the thermal stratification are also important factors to explain the high CDOM dynamic and also the dynamics of the trophic level found in this study.
Theoretically, rainfall has an impact on the CDOM concentration mainly due to material and detritus transported from the drainage area to the water bodies. Taking into account that humic-rich discharges follow the hysteresis process [19], the rainfall effects in the wet and dry seasons did not seem so evident in our investigation throughout the entire study period. In the first wet season of 2014, rainfall effects were very well visible. CDOM regimes in the smaller SN and PB reservoirs were highly decreasing at the end of the wet season. The moderate wet season of 2015 seemed not to have a considerable impact on the CDOM regimes in the smaller reservoirs because no changes in CDOM related to precipitation could be observed. In contrast, the prolonged drought period may be a stronger interfering factor on the temporally-variable CDOM in reservoirs of Madalena basin. CDOM in MAR and PB reservoirs considerably increased in December 2015 and January 2016 after the end of the dry season. The availability of light in the water column regulates the photosynthetic activity, driving low phytoplankton concentrations in the case of high CDOM, as it occurs in the SN and PB reservoirs during the wet season of 2014–2015.
Optical measurements of CDOM absorbance are increasingly used to track the composition and the source of organic matter in aquatic ecosystems. No consensus exists on strictly formulated value ranges for the interpretation of CDOM slope values across specific wavelength regions and the slope ratio. Literature findings emphasize that typically lower slope values indicate high molecular weight DOM and/or increasing aromaticity as is typical for the humic-rich DOM type from terrestrial sources [26,28]. Previous studies have reported SUV values in the range of 0.02–0.03 nm−1 for pelagic ocean waters dominated by phytoplankton [62], 0.014–0.018 nm−1 for wetlands [26] and a wide range of 0.012–0.023 nm−1 for terrestrial aquatic systems [63]. The spectral slope ratio Sr is shown to be negatively correlated with DOM molecular weight and to generally increase with irradiation due to photodegradation [26,28]. Previous studies have reported Sr values with a wide range of 0.76–1.79 in wetlands [26] and 0.7–2.4 in eutrophic shallow lake waters [25]. Experiments carried out on CDOM photodegradation from algae leachates observed unusual initial SUV values > 0.055 nm−1 and very low SVIS values around 0.001 nm−1 resulting in Sr values around 50 that may not represent a true exponential fit during the first days of the leaching experiment [28]. SUV values and Sr from algae leachates returned to commonly reported values within a few days.
The CDOM type of Marengo reservoir is consistently characterized by high SUV values of 0.025 nm−1, indicating a dominance of phytoplankton-derived CDOM. Phytoplankton degradation in eutrophic systems is an important source of DOM with an autochthonous characterization, which has already been demonstrated for other eutrophic systems [25,64]. In contrast, the much lower SUV values from SN and PB reservoirs indicate a more humic-rich CDOM type. aCDOM(440) values from SN and PB reservoirs were high in 2014 with decreasing values after the wet season of 2014 accompanied by decreasing SUV that may indicate the loss of aromaticity.
The SVIS values showed a lower range than SUV, but followed in general the temporal dynamics of SUV. A close result was reached for lakes in Florida, with lower variability of SVIS in comparison to SUV [10]. Work on optical conditions of two tropical freshwater systems (located in Minas Gerais, Brazil) in 2013, both characterized by low CDOM, but with different phytoplankton regimes, measured mean values of SUV and SVIS around 0.02 nm−1 and Sr equals to 1.2 for the eutrophic water body, the Pampulha reservoir, which indicates CDOM derived from phytoplankton [64]. These findings reinforce the suggestion that S and Sr values in the lower range characterize PB and SN reservoirs, likely much more influenced by allochthonous sources due to their much smaller water volume. The CDOM source in the higher trophic Marengo reservoir tends more to in situ production of CDOM from phytoplankton. Hypertrophic systems like MAR experience massive algal blooms with several hundred µg·L−1 Chl-a. The occurrence of Cyanobacterial Harmful Algal Blooms (CyanoHAB) may lead to Microcystis-DOM, which is highly biolabile, which implies high biological alteration and turnover rates of DOM in the environment [27].
To understand the origin and the fate of DOM in the investigated, very contrasting systems of MAR, PB and SN reservoirs, further samplings and investigations are needed. It is recognized in the literature that macrophytes and periphery act on the metabolism of DOM [22,23,24,25] and are also introducing DOM in aquatic systems.

4.3. Bio-Optics and Remote Sensing Application

The spectral responses of water can present a diverse behavior and magnitude of its constituents, especially in complex waters. Brezonik et al. [10] undertook field spectrometry on a large number of lakes in Minnesota (U.S.) of different trophic levels and CDOM [10]. This work collected relevant spectral groups in terms of CDOM regime and trophic level into: (A) moderate color (from CDOM) in combination with highly eutrophic (from SD and Chl-a); (B) high color and mesotrophic to eutrophic; (C) high color, oligotrophic (dystrophic system); (D) low color, oligotrophic; and (E) low color, moderately eutrophic. Class B showed the highest variability of the reflectance spectra within one group that could not further be separated related to suspended particulate matter, which was not an input option in this study. The authors describe for Group B either nearly flat and the lowest reflectance in the case of CDOM being the dominant factor or an overall lower reflectance <600 nm compared to the other groups in the case of other water color-influencing factors, such as phytoplankton.
Researchers from the Brazilian semiarid area applied field spectroscopy in their remote sensing study of the Orós reservoir (State of Ceará, Brazil), and they verified that this is a eutrophic reservoir with a reflectance peak in the green and a second (lower) one in the NIR and the pigment absorption bands in the blue and red wavelength region [12], such as is described for Group A in [10]. Reflectance spectra from Marengo also show a distinct reflectance peak in the green region (~570 nm), an absorption feature in the blue and the red (~675 nm) and another reflectance peak in the NIR domain around 710 nm. This is a similar spectral shape for Marengo in the case of all measurements, being a behavior associated with a high concentration of photosynthetic pigments. The reflectance spectral type for Marengo can also be classified as Group A proposed by [10] as moderate CDOM in combination with highly eutrophic.
The presence of CDOM can be observed from the high absorbance of light in the shorter wavelength regions with the exponential reduction of values towards the longer wavelengths [11,61]. Because of the lowest phytoplankton concentration in PB and SN reservoirs throughout most of the observation period, we assign PB and SN to the spectral Group C, high color, oligotrophic, dystrophic system according to [10]. In the case of high CDOM and a low concentration of particles for scattering, the reflectance spectra show overall a flat reflectance. In the case of high phytoplankton concentration, phytoplankton cells and colonies highly scatter, raising the reflectance across the visible spectrum. PB shows higher phytoplankton development and changes to the spectral Group B, high color and mesotrophic to eutrophic.
The satellite data analysis showed the limitations one has to deal with when using satellite data for such complex and small inland water bodies of varying character. Differentiation of absorption from phytoplankton and non-algal organic particles versus CDOM in surfaces waters is complex and challenging, resulting from the variation of the shape and magnitude of the water surface reflectance [10,11]. The Chl-a model that best performed used the NIR reflectance from the RapidEye dataset (Figure 6B). This was clearly perceived for Marengo reservoir, due to the high Chl-a concentration. Landsat-8 imagery was applied for mapping Chl-a concentration in a hypertrophic tropical lake (Barra Bonita hydroelectric reservoir (BBHR), São Paulo State, Brazil) with satisfactory results [60]. This study found the best fit by applying an NIR-red ratio with R2 > 0.7 for hypereutrophic data. However, no index from L8 showed reasonable results for our data. The best fit obtained for CDOM simulation was based on I5 (green reflectance derived from L8 data), as shown in Figure 7C for the non-perennials reservoirs (PB and SN). This result can be explained by the fact that CDOM spectral influence is most evident in lakes with low abundance of phytoplankton corroborating to the assumptions of Brezonik et al. [6,10].
Similarly to our investigation, Alcântara et al. [61] tested the potential of the red/blue-green ratio for predicting aCDOM(440) from Landsat-8 images. They also worked in the same hypertrophic reservoir studied by [60], and the best fit was yielded through the red-blue ratio band, derived by in situ hyperspectral remote sensing reflectance (Rrs), at 650 nm (L8 Band 4) and 480 nm (L8 Band 2), i.e., [Rrs(650)/Rrs(480)]. This performance was validated by a good coefficient of determination (R2 = 0.7). However, in our investigation, the red-blue ratio band did not show a good correlation against in situ aCDOM(440). Other studies also show how satellite-derived CDOM estimation deteriorates if lakes are eutrophic with high phytoplankton [10,65].
With regard to the performance of Chl-a and CDOM algorithms, it was not possible to collect in situ data in all reservoirs on the exact same day as the satellite overpasses. Nevertheless, in the same way as discussed by Hansen et al. [66], the time interval between samplings and image acquisition does not seem to be the main factor interfering with the results. For the small reservoirs SN and PB, we experienced difficulties in extracting ‘pure water pixels’ at or close to the sampling sites that are not influenced by macrophytes. In the case of PB, we estimate that there will be always a background signal of floating and emergent macrophytes specifically in the coarser spatial resolution Landsat pixels. The time shift between image acquisition and in situ data collection may be a problem in case of heavy precipitation events flushing into reservoirs that could impact thermal stratification and by this the phytoplankton biomass and dissolved organic matter in the reservoirs, which was not perceived during our study, however.
This notwithstanding, future research is required to monitor these highly dynamic systems throughout the dry and wet seasons and throughout the years to better understand the spatiotemporal pattern of Chl-a and CDOM and also to improve remote sensing indices and understand which indices can be transferred to other water bodies for upscaling for larger area mapping. It could be advisable to undertake a pre-classification for spectral types such as presented in [10] and subsequently apply optimized indices for these different trophic levels and CDOM regimes. It is emphasized that also global CDOM algorithms may be applied if the spectral responses of the lake systems are better understood [10,14]. For mapping of Chl-a, a pre-classification distinguishing lower trophic from higher trophic systems may improve the prediction accuracies due to the distinctly different spectral signatures of the water bodies resulting from the phytoplankton with high phytoplankton leading to high green and NIR reflectance in contrast to oligotrophic systems. Additionally, a pre-classification of emergent and floating macrophytes is needed excluding non-pure water pixels.

5. Conclusions

This study aimed at analyzing the eutrophication dynamics in three small water surface reservoirs in semiarid Brazil. The study is based on an extensive in situ sampling for chlorophyll-a and CDOM data including other attributes to characterize the trophic state of the reservoirs for a period of 20 months from May 2014 to January 2016. The studied reservoirs include the perennial highly dendritic reservoir Marengo (MAR, 15 hm3) and the smaller non-perennial reservoirs Paus Branco (PB, 5 hm3) and São Nicolau (SN, 0.9 hm3) in the state of Ceará, Brazil. The large MAR is eutrophic, whereas the smaller reservoirs experienced extreme water level fluctuations (from completely full to completely empty), extensive occurrence of macrophytes and low phytoplankton concentrations. The investigated reservoirs showed higher eutrophication levels towards the end of the monitoring period, when compared with the initial situation, because the monitoring period fell into a multi-year hydrological drought (2012–2016), which contributed to worsen the water quality.
The absorption and spectral slopes of CDOM were used for the characterization of DOM in the reservoirs. CDOM Slopes (S) and Slope ratio (Sr) suggest that the perennial eutrophic MAR reservoir is mostly influenced by autochthonous CDOM, which fits with the dominance of phytoplankton with moderate CDOM in this system. Contrarily, the small and highly disturbed limnic ones (PB and SN) presented extreme water level fluctuations and occasional complete drying-up. CDOM S and Sr values in the PB and SN reservoirs indicate a dominance of allochthonous-derived CDOM. This is the first approach using absorption and slope spectra of CDOM for Brazilian semiarid reservoirs providing additional information for the traditional parameters of water quality.
In addition, in situ spectral reflectance measurements were performed and the reservoirs classified by spectral group type, according to Brezonik et al. [10]: the perennial Marengo reservoir could be assigned to the highly variable Spectral Group A (moderate CDOM in combination with highly eutrophic); whereas the non-perennial reservoirs could be assigned to Spectral Group C (high CDOM, oligotrophic-dystrophic system). The spectral group classification of PB shifted towards the end of the study period to B (high CDOM and mesotrophic to eutrophic status).
This research shows the challenges for optical remote sensing applications for different spectral types with widely-variable trophic state. The Chl-a model that performed best used the NIR band from RapidEye and was successful only for the eutrophic MAR reservoir, due to the high Chl-a concentration. The best fit for CDOM retrievals used the green band from Landsat-8 imagery, performing best for non-perennial reservoirs with high CDOM without optical interference by phytoplankton as in the perennial reservoir. Further collection of in situ data throughout the dry and wet season is required to improve the indices and to apply them to a larger number of water bodies.
The land cover and land use changes in the watershed also contributed to an increase in the eutrophication of the reservoirs, especially during the rainy season. Therefore, we strongly recommend the land use classification for linking it to trophic conditions of the studied reservoir. Considering the water scarcity of the Brazilian semiarid region, our investigation encourages an important path for water resource management, showing a meaningful potential for retrieving the quality of water bodies in areas where small and medium-sized reservoirs are the main source of water supply for the dense rural population. Due to the large number of reservoirs in the semiarid area, the governmental and state agencies prioritize monitoring only large strategic reservoirs even though not on a regular basis, whereas there is a complete absence of monitoring of water quality of small semiarid reservoirs.

Acknowledgments

This study was financially supported by German Academic Exchange Service (DAAD)—Coordination for the Improvement of Higher Education Personnel (CAPES) within the Brazil-Germany Cooperation Programme (PROBRAL—424/14) and National Council for Scientific and Technological Development (CNPq Project 455883/2014-9), jointly. The first author received a Doctorate scholarship from Foundation of Support for the Scientific and Academic Development of the State of Ceará (FUNCAP)/Coordination for the Improvement of Higher Education Personnel (CAPES). RapidEye satellite data were provided by the RapidEye Science Archive (RESA) with resources of the German Federal Ministry of Economic Affairs and Energy. Thanks to Thiago Xavier, Tatiana Pinheiro, Danielle Freire and others for support in the field and laboratory work. Thanks to Shuping Zhang for support in CDOM analysis and image pre-processing.

Author Contributions

Christine Coelho led the research and worked on field data acquisition, conducting the experiment, besides having worked on the remote sensing application and analysis, manuscript writing; Birgit Heim analyzed the remote sensing data including application and analysis, text review contributing to critical discussions; Saskia Foerster worked on research design, remote-sensing data discussion and text review; Arlena Brosinsky contributed on remote sensing application and analysis; and José Carlos de Araújo worked on research design, field data acquisition and text review.

Conflicts of Interest

The authors declare no conflict of interest.

References

  1. Peter, S.; de Araújo, J.C.; Araújo, N.; Herrmann, H.J. Flood avalanches in a semiarid basin with a dense reservoir network. J. Hydrol. 2014, 512, 408–420. [Google Scholar] [CrossRef]
  2. De Araújo, J.C. Gestão das águas de pequenos açudes na região semiárida. In Recursos Hídricos em Regiões árIdas e Semiáridas, 1st ed.; Medeiros, S.S., Gheyi, H.S., Galvão, C.O., Paz, V.P.S., Eds.; INSA: Campina Grande, Brazil, 2011; pp. 334–351. (In Portuguese) [Google Scholar]
  3. Heine, I.; Francke, T.; Rogass, C.; Medeiros, P.H.A.; Bronstert, A.; Foerster, S. Monitoring seasonal changes in the water surface areas of reservoirs using TerraSAR-X time series data in semiarid Northeastern Brazil. IEEE J. Sel. Top. Appl. Earth Obs. Remote Sens. 2014, 7, 3190–3199. [Google Scholar] [CrossRef]
  4. Toledo, C.E.; De Araújo, J.C.; Almeida, C.L. The use of remote-sensing techniques to monitor dense reservoir networks in the Brazilian semiarid region. Int. J. Remote Sens. 2014, 35, 3683–3699. [Google Scholar] [CrossRef]
  5. Zhang, S.; Foerster, S.; Medeiros, P.; de Araújo, J.C.; Motagh, M.; Waske, B. Bathymetric survey of water reservoirs in north-eastern Brazil based on TanDEM-X satellite data. Sci. Total Environ. 2016, 571, 575–593. [Google Scholar] [CrossRef] [PubMed]
  6. Brezonik, P.; Menken, K.D.; Bauer, M. Landsat-based remote sensing of lake water quality characteristics, including chlorophyll and colored dissolved organic matter (CDOM). Lake Reserv. Manag. 2009, 21, 373–382. [Google Scholar] [CrossRef]
  7. Dall’Olmo, G.; Gitelson, A.A. Effect of bio-optical parameter variability on the remote estimation of chlorophyll-a concentration in turbid productive waters: Experimental results. Appl. Opt. 2005, 44, 412–422. [Google Scholar] [CrossRef] [PubMed]
  8. Kutser, T.; Pierson, D.C.; Kallio, K.Y.; Reinart, A.; Sobek, S. Mapping lake CDOM by satellite remote sensing. Remote Sens. Environ. 2005, 94, 535–540. [Google Scholar] [CrossRef]
  9. Zhu, W.; Yu, Q.; Tian, Y.Q.; Becker, B.L.; Zheng, T.; Carrick, H.J. An assessment of remote sensing algorithms for colored dissolved organic matter in complex freshwater environments. Remote Sens. Environ. 2014, 140, 766–778. [Google Scholar] [CrossRef]
  10. Brezonik, P.L.; Olmanson, L.G.; Finlay, J.C.; Bauer, M.E. Factors affecting the measurement of CDOM by remote sensing of optically complex inland waters. Remote Sens. Environ. 2015, 157, 199–215. [Google Scholar] [CrossRef]
  11. Shao, T.; Song, K.; Du, J.; Zhao, Y.; Lui, Z.; Zhang, B. Retrieval of CDOM and DOC using in situ hyperspectral data: A case study for potable water in Northeast China. J. Indian Soc. Remote Sens. 2015, 44, 77–89. [Google Scholar] [CrossRef]
  12. Lopes, F.B.; Novo, E.M.L.M.; Barbosa, C.C.F.; Andrade, E.M.; Ferreira, R.D. Simulation of spectral bands of the MERIS sensor to estimate chlorophyll-a concentrations in a reservoir of the semi-arid region. Rev. Agro@mbiente 2016, 10, 96–106. [Google Scholar] [CrossRef]
  13. Olmanson, L.G.; Brezonik, P.L.; Finlay, J.C.; Bauer, M.E. Comparison of Landsat 8 and Landsat 7 for regional measurements of CDOM and water clarity in lakes. Remote Sens. Environ. 2016, 185, 119–128. [Google Scholar] [CrossRef]
  14. Dash, P.; Silwal, S.; Ikenga, J.O.; Pinckney, J.L.; Arslan, Z.; Lizotte, R.E. Water quality of four major lakes in Mississippi, USA: Impacts on human and aquatic ecosystem health. Water 2015, 7, 4999–5030. [Google Scholar] [CrossRef]
  15. Wetzel, R.G. Limnology—Lake and River Ecosystems, 3rd ed.; Academic Press: San Diego, CA, USA, 2001; pp. 805–823. ISBN 978-0-12-744760-5. [Google Scholar]
  16. Gholizadeh, M.H.; Melesse, A.M.; Reddi, L. A Comprehensive review on water quality parameters estimation using remote sensing techniques. Sensors 2016, 16, 1298. [Google Scholar] [CrossRef] [PubMed]
  17. Dekker, A.; Peters, S. The use of the Thematic Mapper for the analysis of eutrophic lakes: A case study in the Nederlands. Int. J. Remote Sens. 1993, 14, 799–821. [Google Scholar] [CrossRef]
  18. Tranvik, L.J. Allochthonous dissolved organic matter as an energy source for pelagic bacteria and the concept of the microbial loop. Hydrobiologia 1992, 229, 107–114. [Google Scholar] [CrossRef]
  19. Steinberg, E.W. Regulatory impacts of humic substances in lakes. In The Lakes Handbook—Limnology and Limnetic Ecology, 1st ed.; O’Sullivan, P.E., Reynolds, C.S., Eds.; Blackwell Science Ltd.: Malden, MA, USA, 2004; pp. 153–196. ISBN 0632047976. [Google Scholar]
  20. Steinberg, C.E.W.; Meinelt, T.; Timofeyev, M.A.; Bittner, M.; Menzel, R. Humic Substances (review series). Part 2: Interactions with Organisms. Environ. Sci. Pollut. Res. 2008, 15, 128–135. [Google Scholar] [CrossRef]
  21. Loiselle, S.A.; Bracchini, L.; Dattilo, A.M.; Ricci, M.; Tognazzi, A.; Cózar, A.; Rossi, C. Optical characterization of chromophoric dissolved organic matter using wavelength distribution of absorption spectral slopes. Limnol. Oceanogr. 2009, 54, 590–597. [Google Scholar] [CrossRef]
  22. Wetzel, R.G. Gradient-dominated ecosystems: Source and regulatory functions of dissolved organic matter in freshwater ecosystems. Hydrobiologia 1992, 229, 181–198. [Google Scholar] [CrossRef]
  23. Pflugmacher, S.; Spangenberg, M.; Steinberg, C.E.W. Dissolved Organic Matter (DOM) and the effects on the aquatic macrophyte Ceratophyllum demersum in relation to photosynthesis, pigment pattern and activity of detoxication enzymes. J. Appl. Bot. 1999, 73, 184–190. [Google Scholar]
  24. Farjalla, V.F.; Amado, A.M.; Suhett, A.L.; Meirelles-Pereira, F. DOC removal paradigms in highly humic aquatic ecosystems. Environ. Sci. Pollut. Res. 2009, 16, 531–553. [Google Scholar] [CrossRef] [PubMed]
  25. Zhang, Y.; van Dijk, M.A.; Lui, M.; Zhu, G.; Qin, B. The contribution of phytoplankton degradation to chromophoric dissolved organic matter (CDOM) in eutrophic shallow lakes: Field and experimental evidence. Water Res. 2009, 43, 4685–4697. [Google Scholar] [CrossRef] [PubMed]
  26. Helms, J.R.; Stubbins, A.; Ritchie, J.D.; Minor, E.C.; Kieber, D.J.; Mopper, K. Absorption spectral slopes and slope ratios as indicators of molecular weight, source and photobleaching of chromophoric dissolved organic matter. Limnol. Oceanogr. 2008, 53, 955–969. [Google Scholar] [CrossRef]
  27. Bittar, T.; Vieira, A.A.H.; Stubbins, A.; Mopper, K. Competition between photochemical and biological degradation of dissolved organic matter from the cyanobacteria Microcystis aeruginosa. Limnol. Oceanogr. 2015, 60, 1172–1194. [Google Scholar] [CrossRef]
  28. Hansen, A.M.; Kraus, T.E.C.; Pellerin, B.A.; Fleck, J.A.; Downing, B.D.; Bergamaschi, B.A. Optical properties of dissolved organic matter (DOM): Effects of biological and photolytic degradation. Limnol. Oceanogr. 2016, 61, 1015–1032. [Google Scholar] [CrossRef]
  29. Kutser, T.; Verpoorter, C.; Paavel, B.; Tranvik, L.J. Estimating lake carbon fractions from remote sensing data. Remote Sens. Environ. 2015, 157, 138–146. [Google Scholar] [CrossRef]
  30. Shi, L.; Mao, Z.; Wu, J.; Liu, M.; Zhang, Y.; Wang, Z. Variations in spectral absorption properties of phytoplankton, non-algal particles and chromophoric dissolved organic matter in Lake Qiandaohu. Water 2017, 9, 352. [Google Scholar] [CrossRef]
  31. Palmer, S.C.J.; Kutser, T.; Hunter, P.D. Remote sensing of inland waters: Challenges, progress and future directions. Remote Sens. Environ. 2015, 157, 1–8. [Google Scholar] [CrossRef]
  32. Chaves, F.I.B.; Lima, P.F.; Leitão, R.C.; Paulino, W.D.; Santaella, S.T. Influence of rainfall on the trophic status of a Brazilian semiarid reservoir. Acta Sci. 2013, 35, 505–511. [Google Scholar] [CrossRef]
  33. De Freitas Lima, P.; Sousa, M.S.R.; Porfírio, A.F.; Almeida, B.S.; Freire, R.H.F.; Santaella, S.T. Preliminary analysis on the use of Trophic State Indexes in a Brazilian semiarid reservoir. Acta Sci. 2015, 37, 309–318. [Google Scholar] [CrossRef]
  34. Wiegand, M.C.; Piedra, J.I.G.; De Araújo, J.C. Vulnerability towards eutrophication of two tropical lakes in both humid (Cuba) and semiarid (Brazil) climates. Eng. Sanit. Ambient. 2016, 21, 415–424. [Google Scholar] [CrossRef]
  35. Figueirêdo, M.C.B.; Teixeira, A.S.; Araújo, L.F.P.; Rosa, M.F.; Paulino, W.D.; Mota, S.; de Araújo, J.C. Avaliação da vulnerabilidade ambiental de reservatórios à eutrofização. Eng. Sanit. Ambient. 2007, 12, 399–409. (In Portuguese) [Google Scholar] [CrossRef]
  36. Santos, J.C.N.; Andrade, E.M.; Neto, J.R.A.; Meireles, A.C.M.; Palácio, H.A.Q. Land use and trophic state dynamics in a tropical semiarid reservoir. Rev. Ciênc. Agron. 2014, 45, 35–44. [Google Scholar] [CrossRef]
  37. Carlson, R.E. A trophic state index for lakes. Limnol. Oceanogr. 1977, 22, 361–380. [Google Scholar] [CrossRef]
  38. Toledo, A.P., Jr. Informe Preliminar Sobre os Estudos para Obtenção de um Índice para Avaliação Simplificada do Estado Trófico de Reservatórios de Regiões Quentes Tropicais; Report in Portuguese; Companhia Ambiental do Estado de São Paulo (CETESB): São Paulo, Brazil, 1990. (In Portuguese)
  39. Salas, H.J.; Martino, P. A simplified phosphorus trophic state model for warm—Water tropical lakes. Water Res. 1991, 25, 341–350. [Google Scholar] [CrossRef]
  40. Li, S.; Bush, R.T.; Mao, R.; Xiong, L.; Ye, C. Extreme drought causes distinct water acidification and eutrophication in the Lower Lakes (Lakes Alexandrina and Albert), Australia. J. Hydrol. 2017, 544, 133–146. [Google Scholar] [CrossRef]
  41. Münster, U. Studies on phosphatase activities in humic lakes. Environ. Int. 1994, 20, 49–59. [Google Scholar] [CrossRef]
  42. Carpenter, S.R.; Pace, M.L. Dystrophy and eutrophy in lake ecosystems: Implications of fluctuating inputs. Oikos 1997, 78, 3–14. [Google Scholar] [CrossRef]
  43. De Araújo, J.C.; Bronstert, A. A method to assess hydrological drought in semiarid environments and its application to the Jaguaribe River basin, Brazil. Water Int. 2015, 41, 213–230. [Google Scholar] [CrossRef]
  44. Milton, E.J. Principles of field spectroscopy. Int. J. Remote Sens. 1987, 8, 1807–1827. [Google Scholar] [CrossRef]
  45. American Public Health Association (APHA). Standard Methods for the Examination of Water and Wastewater, 21st ed.; American Public Health Association: Washington, DC, USA, 2005. [Google Scholar]
  46. Bricaud, A.; Morel, A.; Prieur, L. Absorption by dissolved organic matter of the sea (yellow substance) in the UV and visible domains. Limnol. Oceanogr. 1981, 26, 43–53. [Google Scholar] [CrossRef]
  47. Fundação Cearense de Meteorologia e Recursos Hídricos (FUNCEME). Dados de Pluviometria do Estado do Ceará. Available online: http://www.funceme.br/app/calendario/produto/municipios/media/mensal (accessed on 7 February 2017). (In Portuguese).
  48. Roy, D.P.; Wulder, M.A.; Loveland, T.R.; Woodcock, C.E.; Allen, R.G.; Anderson, M.C.; Helder, D.; Irons, J.R.; Johnson, D.M.; Kennedy, R. Landsat-8: Science and product vision for terrestrial global change research. Remote Sens. Environ. 2014, 145, 154–172. [Google Scholar] [CrossRef]
  49. RapidEye—Satellite Imagery Product Specifications, Version 6.1, April 2015. Available online: http://blackbridge.com/rapideye/upload/RE_Product_Specifications_ENG.pdf (accessed on 18 August 2015).
  50. Weichelt, H.; Rosso, P.; Marx, A.; Reigber, S.; Douglas, K.; Heynen, M. The RapidEye Red Edge Band. Available online: https://resa.blackbridge.com/files/2014-06/Red_Edge_White_Paper.pdf (accessed on 30 August 2015).
  51. USGS. Provisional Landsat 8 Surface Reflectance Data; U.S. Geological Survey: Sioux Falls, SD, USA, 2015. Available online: http://landsat.usgs.gov/about_LU_Special_Issue_3.php (accessed on 1 August 2016).
  52. Richter, R.; Schläpfer, D. Atmospheric/Topographic Correction for Satellite Imagery. ATCOR 2/3 User Guide. Available online: http://www.rese.ch/pdf/atcor3_manual.pdf (accessed on 9 January 2016).
  53. Nash, J.E.; Sutcliffe, J.V. River flow forecasting through conceptual models part I—A discussion of principles. J. Hydrol. 1970, 10, 282–290. [Google Scholar] [CrossRef]
  54. Moriasi, D.N.; Arnold, J.G.; Van Liew, M.W.; Bingner, R.L.; Harmel, R.D.; Veith, T.L. Model evaluation guidelines for systematic quantification of accuracy in watershed simulations. Am. Soc. Agric. Biol. Eng. 2007, 50, 885–900. [Google Scholar]
  55. Conselho Nacional do Meio Ambiente (CONAMA). Available online: http://www.mma.gov.br/port/conama/res/res05/res35705.pdf (accessed on 6 June 2014).
  56. Braga, G.G.; Becker, V.; Oliveira, J.N.P.; Mendonça Júnior, J.R.; Bezerra, A.F.M.; Torres, L.M.; Galvão, A.M.F.; Mattos, A. Influence of extended drought on water quality in tropical reservoirs in a semiarid region. Acta Limnol. Bras. 2015, 27, 15–23. [Google Scholar] [CrossRef]
  57. Bornette, G.; Puijaloné, S. Response of aquatic plants to abiotic factors: A review. Aquat. Sci. 2011, 73, 1–14. [Google Scholar] [CrossRef]
  58. Pełechaty, M.; Pronin, E.; Pukacz, A. Charophyte occurrence in Ceratophyllum demersum stands. Hydrobiologia 2014, 737, 111–120. [Google Scholar] [CrossRef]
  59. Reche, I.; Pace, M.L.; Cole, J.J. Relationship of trophic and chemical conditions to photobleaching of dissolved organic matter in lake ecosystems. Biogeochemistry 1999, 44, 258–289. [Google Scholar] [CrossRef]
  60. Watanabe, F.S.Y.; Alcântara, E.; Rodrigues, T.W.P.; Imai, N.N.; Barbosa, C.C.F.; Rotta, L.H.S. Estimation of Chlorophyll-a concentration and the trophic state of the Barra Bonita Hydroelectric Reservoir using OLI/Landsat-8 images. Int. J. Environ. Res. Public Health 2015, 12, 10391–10417. [Google Scholar] [CrossRef] [PubMed]
  61. Alcântara, E.; Bernardo, N.; Watanabe, F.; Rodrigues, T.; Rotta, L.; Carmo, A.; Shimabukuro, M.; Gonçalves, S.; Imai, N. Estimating the CDOM absorption coefficient in tropical inland waters using OLI/Landsat-8 images. Remote Sens. Lett. 2016, 7, 661–670. [Google Scholar] [CrossRef]
  62. Del Vecchio, R.; Blough, N. Photobleaching of chromophoric dissolved organic matter in natural waters: Kinetics and modeling. Mar. Chem. 2002, 78, 231–253. [Google Scholar] [CrossRef]
  63. Spencer, R.G.M.; Butler, K.D.; Aiken, G.R. Dissolved organic carbon and chromophoric dissolved organic matter properties of rivers in the USA. J. Geophys. Res. 2012, 117, 1–14. [Google Scholar] [CrossRef]
  64. Brandão, L.P.M.; Staehr, P.A.; Bezerra-Neto, J.F. Seasonal changes in the optical properties of two contrasting tropical freshwater systems. J. Limnol. 2016, 75, 508–551. [Google Scholar] [CrossRef]
  65. Menken, K.D.; Brezonik, P.L.; Bauer, M.E. Influence of chlorophyll and colored dissolved organic matter (CDOM) on lake reflectance spectra: Implications for measuring lake properties by remote sensing. Lake Reserv. Manag. 2006, 22, 179–190. [Google Scholar] [CrossRef]
  66. Hansen, C.H.; Burian, S.J.; Dennison, P.E.; Williams, G.P. Spatiotemporal variability of lake water quality in the context of remote Sensing models. Remote Sens. 2017, 9, 409. [Google Scholar] [CrossRef]
Figure 1. Study site and sampling spots in the reservoirs Paus Branco, São Nicolau and Marengo in the Madalena Basin, nested in the Banabuiú River Basin, Ceará, Brazil. Projection system: Universal Transverse Mercator (UTM) in meter; Datum: WGS 84 (World Geodetic System).
Water 09 00913 g001
Figure 2. (a) Absence of macrophytes in the water surface in Marengo reservoir; (b) high density of macrophytes (free and rooted species, floating, free and submersed) in Paus Branco reservoir; (c) presence of submersed macrophytes in São Nicolau reservoir (2015).
Water 09 00913 g002
Figure 3. Observed precipitation at Madalena rainfall gauge (Ceará) and mean Trophic State Index (TSI) at Marengo, São Nicolau and Paus Branco reservoirs from May 2014 to January 2016.
Water 09 00913 g003
Figure 4. (A) Mean values of specific absorption coefficient aCDOM at 440 nm; (B) spectral slope of CDOM in the ultraviolet range (275–295 nm); (C) spectral slope of CDOM in the visible range (350–500 nm) and; (D) ratio slope (SUV/SVIS) for Marengo, Paus Branco and São Nicolau reservoirs from May 2014 to January 2016.
Water 09 00913 g004
Figure 5. In situ spectral reflectance of the Marengo (MAR), Paus Branco (PB) and São Nicolau (SN) reservoirs sampled on: (a) December 2014; (b) February 2015; and (c) November 2015.
Water 09 00913 g005aWater 09 00913 g005b
Figure 6. Chlorophyll-a. (A) Perennial reservoir and Landsat-8; (B) perennial reservoir and RapidEye; (C) non-perennial reservoirs and Landsat-8; (D) non-perennial reservoirs and RapidEye.
Water 09 00913 g006
Figure 7. CDOM. (A) Perennial reservoir and Landsat-8; (B) perennial reservoir and RapidEye; (C) non-perennial reservoirs and Landsat-8; (D) non-perennial reservoirs and RapidEye.
Water 09 00913 g007
Table 1. Sampling and image acquisition dates, time interval between sample collection and image acquisition and percentage of cloud coverage per scene or tile. The absence of images is indicated by N.A. (not available). REIS, RapidEye Earth Imaging System.
FIELD SAMPLING DATESATELLITE PRODUCT
OLI/Landsat-8REIS/RapidEye
Acquisition DateTime Interval (days)Cloud Cover (%)Acquisition DateTime Interval (days)Cloud Cover (%)
31 May 20142 June 201429.89 June 20141015 (N)/20 (S)
2 July 2014N.A. N.A.
2 August 20145 August 201433.45 August 201430.3 (N)/0.9 (S)
30 August 2014N.A. N.A.
27 September 201422 September 2014512.5N.A.
31 October 2014N.A. 16 October 2014154.4 (N)/4.7 (S)
29 November 2014N.A. 7 December 201485 (N), 17 (S)
27 December 2014N.A. N.A.
3 February 201528 January 201568.8N.A.
13 March 2015N.A. N.A.
18 April 2015N.A. N.A.
23 May 2015N.A. N.A.
19 June 2015N.A. 18 June 201510 (N), 2 (S)
3 September 201524 August 20159<17 September 201542 (N)
11 November 201512 November 2015116.7N.A.
13 January 2016N.A. N.A.
Note: N corresponds to North (RapidEye Tile 2436712) and S corresponds to South (RapidEye Tile 2436812).
Table 2. Summary of attributes measured during seasonal analyses in Marengo, Paus Branco and São Nicolau reservoirs (Ceará, Brazil). T.S.S., Total Suspended Solids; aCDOM, absorption coefficient of Colored Dissolved Organic Matter.
AttributesStatisticMarengoPaus BrancoSão Nicolau
RainyDryRainyDryRainyDry
Secchi Disk (m)nn = 22n = 31n = 14n = 21n = 17n = 23
Min-Max0.1–0.30.1–0.30.3–1.50.4–1.10.4–1.50.2–1.5
Mean ± SD0.18 ± 0.060.2 ± 0.070.9 ± 0.30.7 ± 0.11.0 ± 0.40.95 ± 0.4
T.S.S. (mg·L−1)nn = 18n = 12n = 14n = 12n = 15n = 8
Min-Max28.2–90.527.8–77.82.3–129.03.6–140.4–261.2–101.3
Mean ± SD47.8 ± 12.651.4 ± 12.320.0 ± 23.37.7 ± 3.46.0 ± 6.123.7 ± 30.3
Chl-a (µg·L−1)nn = 22n = 27n = 14n = 14n = 15n = 22
Min-Max28.2–90.520.2–263.0<1–41.0<1–34.7<1–25.0<1–23.2
Mean ± SD158.2 ± 79.080.2 ± 42.18.9 ± 10.110.6 ± 10.55.7 ± 7.22.5 ± 3.8
TP (mg·m−3)nn = 22n = 31n = 12n = 27n = 18n = 23
Min-Max161.1–571.1101–113028–236.425–501218–666204–2851
Mean ± SD248.2 ± 80.2266 ± 174102.4 ± 49145 ± 97376 ± 104527 ± 234
PO43− (mg·m−3)nn = 22n = 24n = 12n = 18n = 18n = 20
Min-Max0.0–0.10.0–0.20.0–0.10.0–0.20.1–0.40.2–2.8
Mean ± SD0.0 ± 0.00.1 ± 0.10.0 ± 0.00.1 ± 0.10.2 ± 0.10.4 ± 0.2
aCDOM(440) (m−1)nn = 19n = 22n = 8n = 13n = 15n = 18
Min-Max2.1–13.00.4–8.71.1–5.12.4–7.30.9–12.23.1–9.9
Mean ± SD4.1 ± 2.23.3 ± 1.53.0 ± 0.64.1 ± 1.04.5 ± 2.96.7 ± 1.9
Table 3. Index and equations applied for estimation of Chlorophyll-a and CDOM from OLI/ Landsat-8 and REIS/RapidEye datasets for Marengo reservoir (perennial reservoir), Paus Branco and São Nicolau (non-perennial reservoirs).
Attribute: Chlorophyll-a (µg·L−1)
OLI/Landsat-8REIS/RapidEyeOLI/Landsat-8REIS/RapidEye
Index I1 = [(2 × Green)/(Blue + Red)]Index I2 = (Blue/NIR)Index I3 = NIR
PRChl = −74.33 × I1 + 170.09Chl = 96.52 × I1−1.66Chl = −90.12 × I2 + 137.12Chl = 848.9 × I3 − 6.62
NPRChl = 0.07 × I14.55Chl = 1.2 × I11.15Chl = 0.02e3.02 × I2Chl = 74.07 × I3 − 0.36
AllChl = 0.27 × I111.76Chl= 3.89 × I11.0Chl = 14.70 × I22.94Chl= 11951 × I32.46
Attribute: CDOM (m−1)
OLI/Landsat-8REIS/RapidEyeOLI/Landsat-8REIS/RapidEye
Index I4 = (Blue/Red)Index I5 = Green
PRCDOM = 8.04 × I4x2.65CDOM = 2.25 × I40.02CDOM = 89.82 × I5 − 0.54CDOM = 2.03 × I5−0.01
NPRCDOM = 11.03 × I45.07CDOM = 2.86 × I4−0.30CDOM = 0.5437 × I5−0.56CDOM = 9.12e−12 × I5
AllCDOM = 0.16e4.09 × I4CDOM = −0.06 × I4 + 0.64CDOM = 0.59 × I5−0.53CDOM = 0.80 × I5−0.24
Note: PR = Perennial Reservoir; NPR = Non-Perennial Reservoirs; All = perennial and non-perennial reservoirs.
Table 4. Pearson correlation (r) and coefficient of determination (R2) values between indexes versus the concentration of Chlorophyll-a or CDOM in situ measurements, Nash–Sutcliffe coefficient (NSE), RMSE observations’ Standard Deviation Ratio (RSR) and Percent Bias (PBIAS) used for each equation.
AttributeChlorophyll-aCDOM
L8REL8REL8REL8RE
I1I1I2I3I4I4I5I5
r, all reservoirs0.10−0.23−0.500.840.230.22−0.47−0.57
R2, PR reservoir0.120.240.130.660.500.130.150.00
R2, NPR reservoirs0.140.540.380.290.750.100.770.29
R2, all reservoirs0.280.200.130.400.690.250.480.65
NSE, PR reservoir−0.210.150.150.62−13.54−0.150,25−0.47
NSE, NPR reservoirs−0.18−0.32−0.160.150.17−0.320.89−0.79
NSE, all reservoirs−3.89−0.40−0.450.71−80.28−1.180.380.28
RMR, PR reservoir1.050.850.870.570.730.930.813.58
RMR, NPR reservoirs1.021.061.010.851.291.030.561.20
RMR, all reservoirs2.151.141.170.528.731.390.760.80
PBIAS, PR reservoir0.120.430.310.240.80−0.170.120.98
PBIAS, NPR reservoirs0.930.510.940.660.490.260.090.43
PBIAS, all reservoirs0.120.900.780.24−1.240.880.120.28

