200 kHz Sonication of Mixed-Algae Suspension from a Eutrophic Lake: The Effect on the Caution vs. Outbreak Bloom Alert Levels


1
Department of Construction Environment Engineering, University of Science and Technology (UST), Daejeon 341-13, Korea
2
Environmental and Plant Engineering Research Institute, Korea Institute of Civil Engineering and Building Technology (KICT), Gyeonggi-Do 102-23, Korea
*
Author to whom correspondence should be addressed.
Water 2017, 9(12), 915; https://doi.org/10.3390/w9120915
Submission received: 23 October 2017
/
Revised: 20 November 2017
/
Accepted: 22 November 2017
/
Published: 24 November 2017
(This article belongs to the Special Issue Eutrophication of Waterways: An Old Problem with Modern Consequences)
Abstract
:For effective ultrasonic algae removal, several studies have considered the ultrasound equipment linked factors, such as power and frequency. However, studies on the response of mixed algal cultures and associated water quality parameters to ultrasound are limited. In this lab-scale sonication, the removal of cyanobacteria at a pre-set frequency of 200 kHz on mixed algae suspensions collected from a eutrophic lake was investigated. The caution (17.5 µg/L) and outbreak (1450 µg/L) alert levels in terms of chlorophyll-a (Chl-a) concentrations of the initial samples were each sonicated for 10, 15, and 20 min, and then kept in an incubator. Fifteen minutes of sonication resulted in best removal efficiency of 0.94 and 0.77, at an ultrasonic dose of 30 kWh/m3 at the outbreak and caution level concentrations, respectively. Immediately after 15 min sonication, and after standing in the incubator for a day, chlorophyll-a removal efficiencies of 0.28 and 0.90 were achieved in the outbreak level, respectively, and the matching removal efficiencies for the caution level were 0.23 and 0.64. Even though the removal was substantial in both cases, the final 147 µg/L chlorophyll-a concentration of the outbreak, which is itself still in the outbreak level range, shows that ultrasonication is not effective to satisfactorily remove algae from a concentrated suspension. Total dissolved nitrogen and chemical oxygen demand were reduced, overall, due to sonication. However, total dissolved phosphorus of the concentrated level was increased during the treatment. Although sonication needs further replicated experimental testing in whole-lake systems, our results show that 200 kHz sonication was able to reduce chlorophyll-a concentrations in small-scale laboratory tests.
1. Introduction
Eutrophication is perhaps the greatest threat to water quality globally [1,2]. Specifically, the gradual enrichment of surface water with plant nutrients, mainly nitrogen and phosphorus, has resulted in shifts from systems dominated by rooted aquatic plants to systems that are dominated by algae suspended in the water column [3,4]. Moreover, long water residence times, due to operational procedures applied to reservoirs, encourage internal nutrient release and, thus, cause regulated river waters to suffer from eutrophication [5,6]. This has already worried ecologists in South Korea, where reservoirs and regulated rivers are the major sources of freshwater. The control of eutrophication involves nutrient source reduction measures, such as wastewater treatment, as well as interception of non-point sources, and in-water methods, such as chemical treatment, bio-manipulation, artificial circulation, aeration, and dredging [7,8,9,10,11,12]. The source reduction measures are not always feasible, and they are basically effective only after a long time [13,14]. The in-water-treatment mechanisms considered so far are either costly, they possibly damage non-target aquatic organisms, or they are applicable only to a small water body [13,15]. On the other hand, ultrasound can be a suitable method to control algae blooms, provided that the optimum operating parameters are applied to ensure an effective and energy efficient treatment [13,16]. Sonication has been the subject of research in algal bloom control because it does not use chemicals and its treatment system is unique [17,18].
As the response to sonication depends heavily on ultrasonic factors, the experimental conditions for ultrasound treatment must be carefully considered when the process is applied. The operating conditions may affect ultrasound treatment performance in a positive or adverse way [19]. Ultrasound frequencies, power intensity and duration of exposure have been considered to assess the impact of sonication on water quality [20,21,22,23]. Studies on effect of frequency have shown that sonication more effectively inhibits cyanobacteria at intermediate frequencies [18]. Moreover, lower frequencies are desirable since their power consumption is comparatively less [24]. Specifically, ultrasound of 200 kHz has been shown to inhibit cyanobacterial proliferation most effectively, because it is close to the resonance frequency of gas vesicles in the cyanobacteria [17,25,26,27]. Table 1 presents a summary of the laboratory and field scale sonication research conducted so far to control algae and to improve related water quality.
The ultrasonic power or intensity is another important factor worth mentioning. The input electric power does not clearly indicate the ultrasonic power used for sonochemistry [28]. Thus, Joyce et al. [13] and other researchers recommended the use of ultrasonic intensity (W/cm2) or ultrasonic density (W/cm3), which is transducer dependent, to make sure that the specific power settings are compatible to other ultrasonic systems. Additionally, for effective removal of algal in laboratory setup, sonication duration ranging from several seconds to several h are reported [18,29]. Therefore, the efficient exposure time of sonication to control algae is better determined using the particular ultrasonic frequencies and intensities, and environmental conditions.
On the other hand, the few applications of sonication indicate that there is yet more investigation work to be done before reliable-large-scale applications are ensured [29]. The authors of [30] reported an unsuccessful field trial of ultrasound involving a combined technique, which was tested in a lake of extremely high cyanobacteria concentration (5 × 10⁶ cells/mL). It was suggested that the unit could have been efficient had it been applied to a reservoir with low cell numbers, and thus, operated to prevent bloom formation. In agreement with this, Li et al. [31] acheived more efficient removal for low algae concentrations. The Korean alert level framework has been adapted and applied to this research to make informed decisions on the use of ultrasound in controlling eutrophication. The caution and outbreak levels of the Korea bloom alert system in terms of chlorophyll-a (Chl-a) are described to be ≥15, and ≥100 µg/L, respectively [32]. On the other hand, the investigation of the summer season distribution of the cyanobacteria species in Korean lakes has shown Microcystis to be the dominant [33]. Buoyant cyanobacteria, such as Microcystis, float on the surface of water body to receive sufficient light for photosynthesis. In this study, grab samples with concentrations in the different alert levels are collected from the surface of a eutrophic lake, and treated in the laboratory.
The aim of this lab-scale study was to investigate the impact of sonication treatment at a pre-set frequency of 200 kHz in 25 L volume of water. (1) The application of sonication based on detected chlorophyll-a concentration was assessed; (2) the efficiency of the commercial ultrasonic device in controlling algae was determined; and (3) the algae suspensions were treated by ultrasound, then the perspective of the changes to nitrogen, phosphorus, and chemical oxygen demand (COD) concentrations were also studied. The concentration and exposure duration were used to optimize the process by analyzing the changes in the water quality in terms of Chl-a. The concentration of Chl-a is generally in proportion to cell numbers, and Chl-a is one of the assessment methods which have been used to quantify the ultrasonic effects on algal control [29,34,35]. The lab-scale study was conducted to check the feasibility of a commercial ultrasound device for algal control before applied as a field test.
2. Materials and Methods
2.1. The Experimental Setup
An ultrasonic system, consisting of the generator and an oscillator (EBISTRADE, Inc., Tokyo, Japan), was used to treat 25 L mixed-algae suspension. The suspension was sampled from Shingal Reservoir, Suwon city, Korea, in the hot summer season of 2017, and treated in the lab in carboy containers (Figure 1). The ultrasonic system had a disk-shaped vibrating device of 160 mm diameter, which was operated at a fixed frequency of 200 kHz. The sonication transferred ultrasonic power density of 0.12 W/mL in the downward direction from the water surface.
The main goal of this study was to examine effect of cyanobacteria concentration on the effectiveness of sonication. Two containers were fitted with the commercial ultrasound devices and two others were run in parallel without the ultrasound devices (controls). The average of Chl-a concentrations in each group was reported. Provided that the experiment was done in duplicates and not triplicates, and that large number of analysis could not be conducted as two to three days are required for each set of analysis, statistics were not used in this study. To maintain temperature and light conditions throughout the experiment, all four carboy containers were housed in an incubator at 25 °C and 120 μmol photons/m2/s illumination in 14/10 light/dark cycle, with white fluorescent lights fitted over the top of the containers.
The ultrasonication was applied for the duration of 10, 15, and 20 min for each of the alert level concentrations, to study progressive effect. The experiment was run for a day, with sampling before sonication and after sonication at 0, 1, 2, 3, 6, 24 h, and used to determine total dissolved nitrogen (TDN), total dissolved phosphorus (TDP), COD and Chl-a concentrations. The algae suspensions were mixed using magnetic stirrers to achieve complete exposure to ultrasound, and before every sampling, the suspension water column was carefully mild-stirred, to avoid re-suspending the already-settled matter. The samples were then used to determine Chl-a, to provide a basic measure of cell damage and the change in water quality.
2.2. Analytical Methods
Chlorophyll-a was determined in the lab using the standard methods, in which the phytoplankton containing Chl-a in a measured volume of sample was concentrated by filtration through a glass-fiber filter [49]. Sample preparation and Chl-a extraction, including measurement using spectrophotometer (HACH Company, Loveland, CO, USA), involved: (1) filtration of water samples through 47 mm size glass fiber filter (GF/C) (Whatman Ltd., Maidstone, UK) and then storing the filter at 4 °C in the fridge for at least 24 h; (2) extraction of the photo-pigments from the phytoplankton by grinding the filter with a tissue grinder and steeping the filter slurry in 90% aqueous acetone solution for 14–18 h; (3) centrifuging the filter slurry for 5 min at 500 g to clarify the solution, and then transferring the supernatant to a 1 cm cuvette; (4) for the pheophytin-corrected Chl-a, the sample’s absorbance was measured at 750 and 664 nm before acidification and at 750 and 665 nm after acidification, using 0.1 N HCl; and, finally; (5) The absorbance values are entered into an established equation to determine Chl-a in µg/L, as:
TDN, TDP, COD, ammonium nitrogen (NH3–N), and reactive phosphate (PO43−–P) were all determined after filtering the water sample through the GF/C filter, and then using the DR-5000 spectrophotometer (HACH Company, Loveland, CO, USA). The persulfate digestion methods were adopted for TDN and TDP [37]. The analysis of COD was carried out by using the standard low range (3–150 mg/L) reagent solution of reactor digestion method. Ammonium nitrogen concentration was determined by the salicylate method with low range reagent solution, which is for samples containing 0.02–2.50 mg/L NH3–N. The reactive phosphate concentration was examined by the ascorbic acid method of spectrophotometer using test solutions for 0.06–5.00 mg/L PO43−. The COD and NH3–N analysis methods of DR-5000 are stablished based on the studies by Jirka and Carter [50], and Reardon et al. [51], respectively; whereas the PO43−–P method is adapted from Eaton et al. [49]. The average concentrations of TDN, TDP, COD, NH3–N, and PO43––P in the treated and control sets were reported. Settleability after sonication was also determined by volumetric test in an Imhoff cone after well mixing and standing the sample for 1 h [49]. To determine the maximum settlement, the samples were also put aside for 24 h.
3. Results and Discussions
3.1. Effect of the Sonication on Chlorophyll-a Content and Sedimentation
Following the ultrasonic treatments with 200 kHz frequency and power of 0.12 W/mL for 10, 15, and 20 min, the result showed that the immediate reduction in Chl-a was substantial, compared to the unchanged control groups. As ultrasonic cavitation was continuously applied, the removal was more for the suspension with longer exposure time. Figure 2 shows that the Chl-a removal immediately after the exposure time increased with time, and better for the outbreak concentration with initial value of 1428 μg/L, compared with the caution level with initial value of 17.5 μg/L. Twenty-eight percent removal was achieved in the outbreak case in 15 min of sonication, but for caution, an additional exposure of five min were required to attain a similar reduction.
Algae cell inactivation and the consequent settlement are principally caused by cavitation bubbles formed by ultrasonic waves. The higher percentage instant removal of the outbreak does not necessarily mean that the system was more effective for the more concentrated initial suspension. The actual algae cell composition of the suspension likely varies in both initial conditions, and ultrasound has selective inhibition actions [38]. However, the result did show that Chl-a removal during the brief exposure time was substantial in the mixed algae suspension of any level.
After the respective sonication, the suspension time step further removal of Chl-a was analyzed by allowing it to stand and stabilize for up to 24 h. After 15 min of treatment and 1 h of standing, 45 mL/L of algae was settled out of the outbreak-treated sample kept in an Imhoff cone; whereas about 50 mL/L of the untreated sample algae was floating at the surface (Figure 3). After 24 h of standing, all the algae in the control migrated to the surface, forming a thick scum of 60 mL/L, and the lower water column was completely clear to the eye. However, in the treated cone sample, 50 ml/L of sludge was formed at the bottom, with about 5 mL of the algae staying at the surface after a day of standing. Based on the concentration and exposure time, the floating and settling volume varied in the sonicated samples. A visual inspection indicated that cyanobacteria, which float by virtue of their gas vesicles, seemed to comprise the surface scum. Sedimentation after treatment shows that the main cause of algae removal was the ultrasonically-induced loss of buoyancy caused by the collapse of the gas vesicles [20,34]. The disruption of the gas vesicles has been described as the major adverse effect of ultra-sonication on cyanobacteria, thereby leading to sedimentation to the bottom of water body and the prevention of photosynthesis.
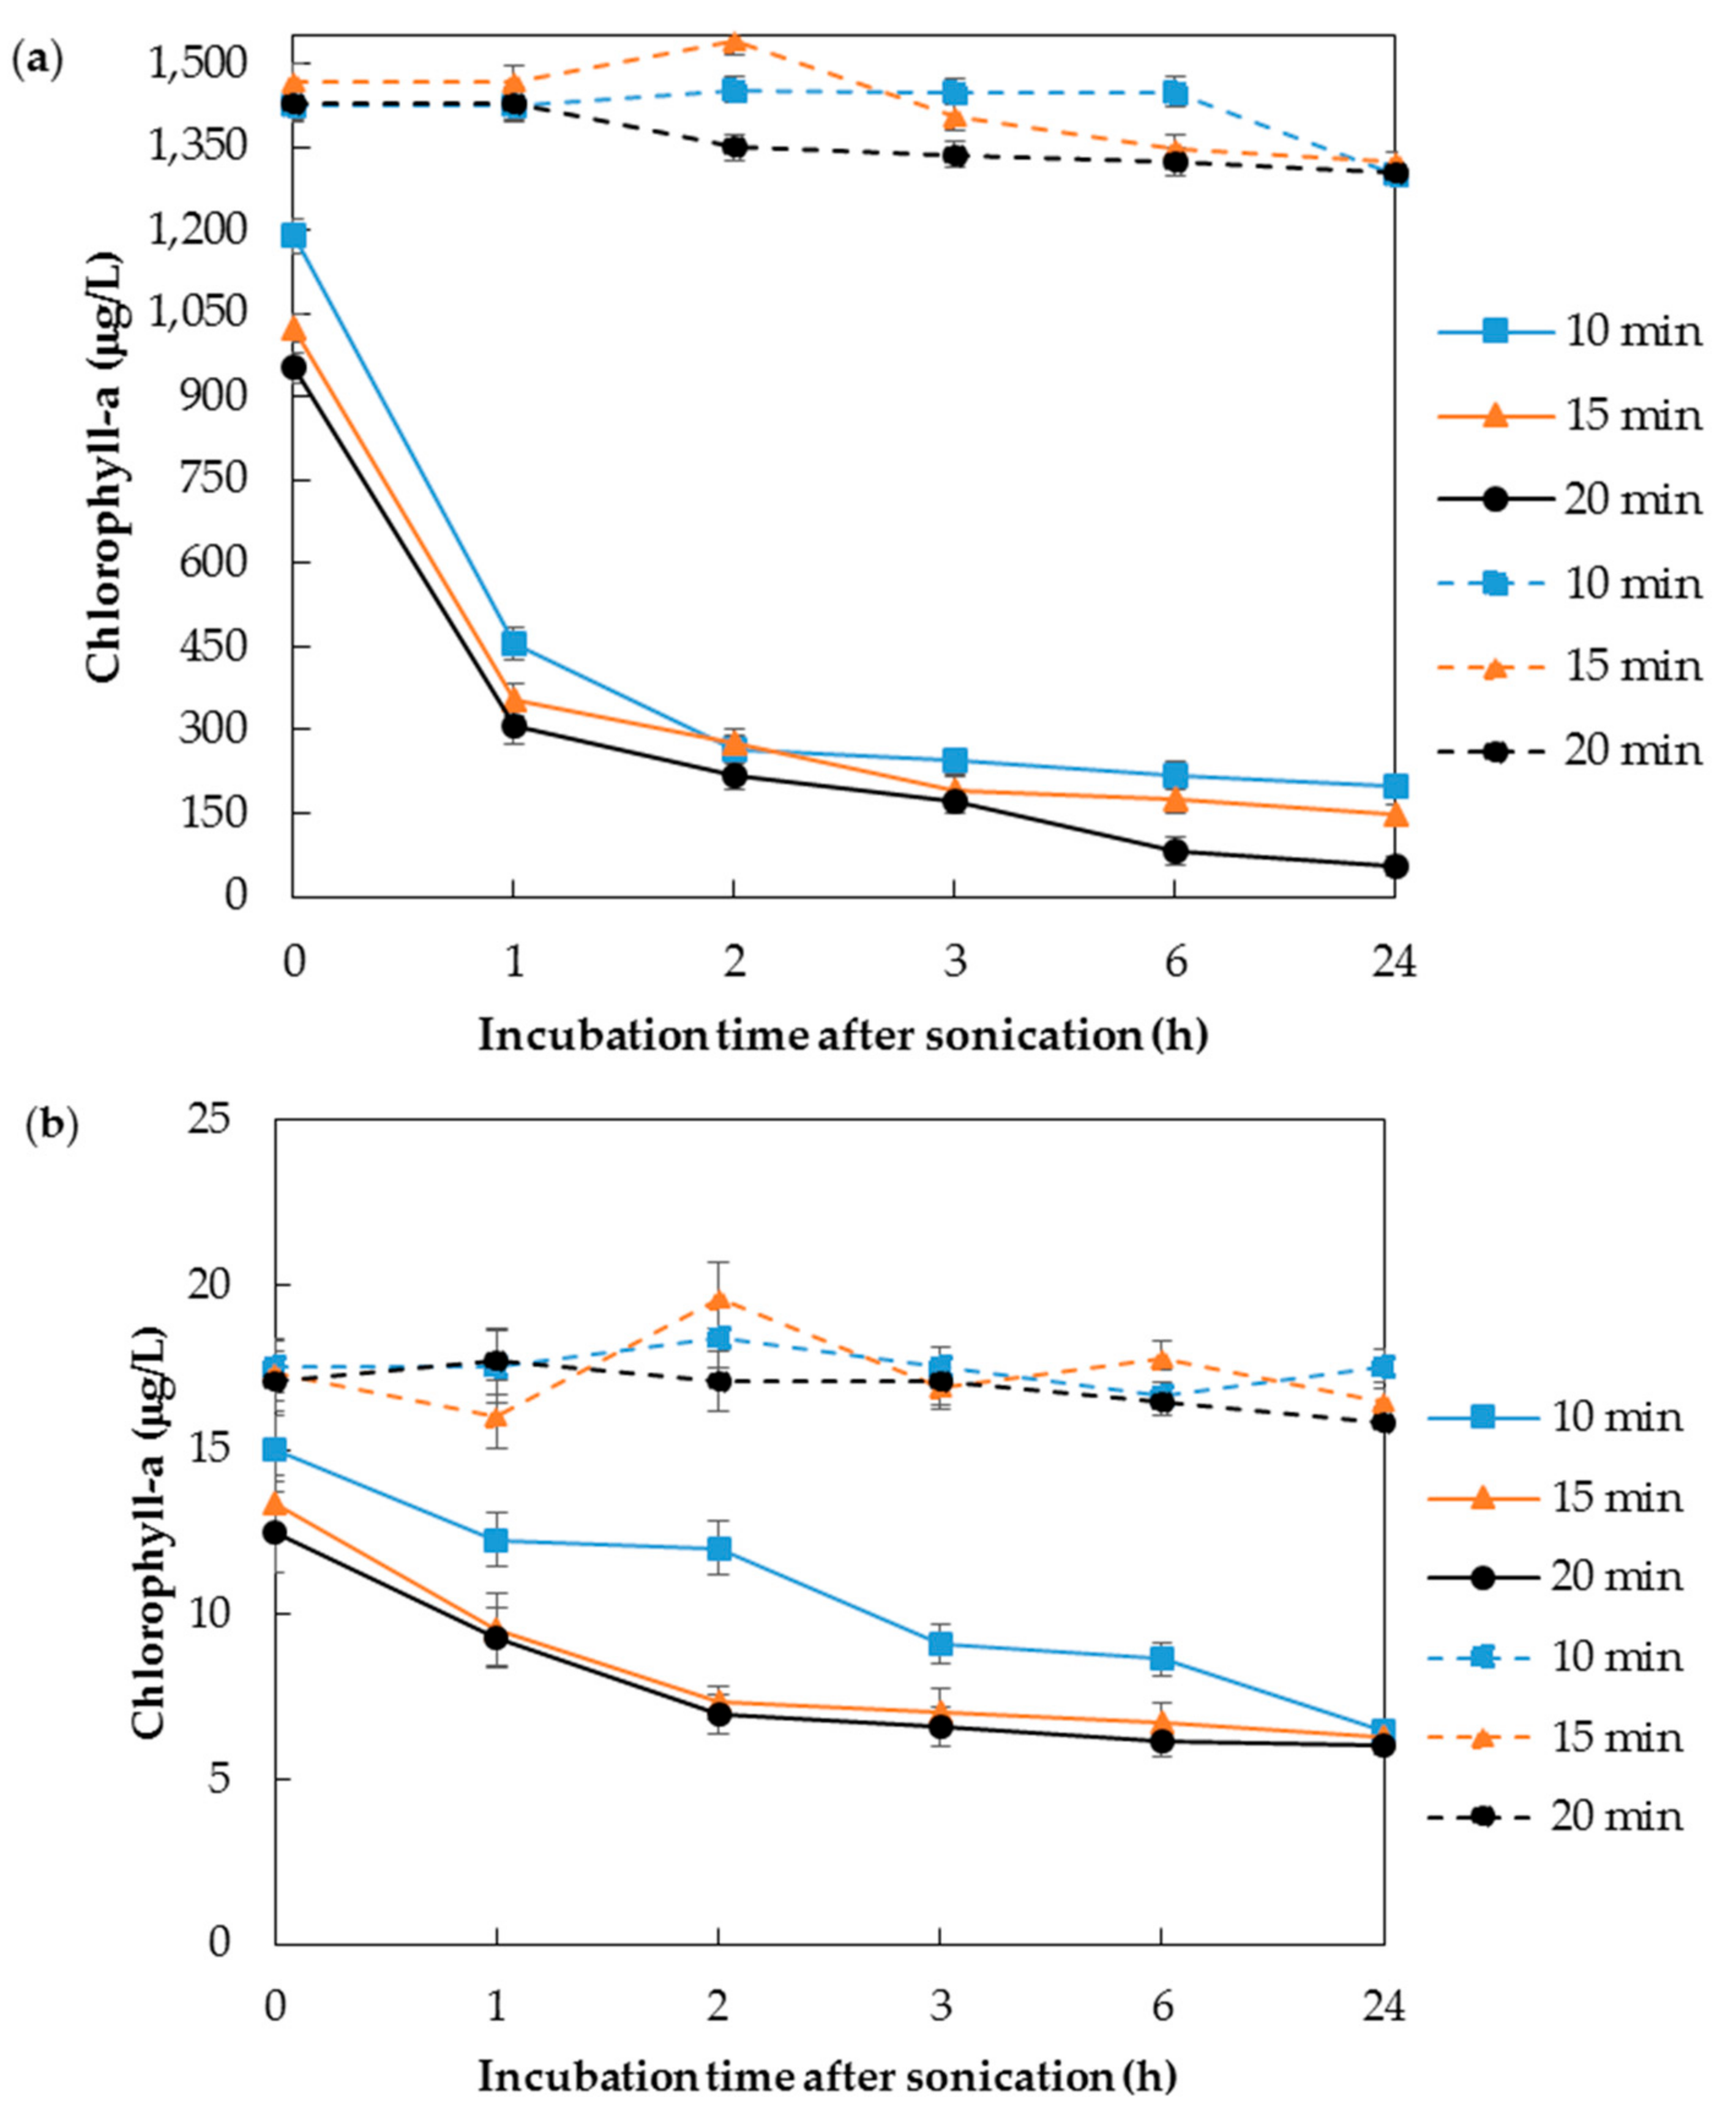
Figure 4 presents the progressive settling out of the suspension from the water column for both initial concentrations of the treated system. Chlorophyll-a concentration drastically decreased after standing for 1 h. It is also interesting to note that most of the Chl-a removal of the treatment groups was within the first 2 h. The sedimentation of the algae suspension continued, but not so considerably after 6 h of standing. After 10, 15, and 20 min of treatment of the outbreak concentration and setting aside for 24 h, the water column Chl-a reduced to 197, 147, and 54 μg/L, respectively. The corresponding values for the cation level concentration were 6.5, 6.3, and 6.0 μg/L, respectively. In the control groups, Chl-a concentrations were more or less the same at the corresponding initial values.
The result of the ultrasonic treatment shows that large parts of the algae was sedimented in the case of high initial concentration, but the amounts that remained untreated are either in the outbreak or in the warning level concentrations. A possible reason for that cyanobacteria remained floating in the outbreak concentration could be selective inhibition action of constant frequency sonication in a mixed-algae suspension [38]. On the other hand, the principal reason for the inactivation of algae by sonication is the generation and collapse of cavitation bubbles. In addition to ultrasound equipment related factors, such as frequency and power, the medium of treatment has impact on the generation of cavities in ultrasonic treatment. Related to this, Mason and Peters [52] stated that the higher natural cohesive forces acting within a liquid, such as viscosity and surface tension, the more difficult it is to attain cavitation. Thus, the relatively high algal abundance of the outbreak level could interfere with ultrasonic-induced cavitation and the treatment of entire algae cells in the suspension.
After standing for a day, in the 15 min treated sample, Chl-a removal of as high as 90% and 64% was achieved for the outbreak and the caution levels, respectively, compared to the control sample with only 10% and 5% removal. In the control, the limited overall reduction was because the algae was not subjected to ultrasonic treatment, and there had been a 74 and 2 mg/L increase, for outbreak and caution levels, respectively, and a 121 mg/L decrease in the outbreak level concentration in the period in-between incubation, possibly due to factors related to algae growth and death. The overall 145 mg/L decrease after a day (from initial value of 1469 mg/L) of the outbreak control case might also be likely due to scarcity of nutrients. The growing stage of the cyanobacteria can also be an extraneous variable, playing some role in the decrease or increase in the untreated system.
Extending the time of sonication generally increases the sono-chemical effect and, thus, both immediate and final reductions of Chl-a progressively increased with time. The result shows that greater ultrasonic exposure time enables better removal. However, it also leads to higher power consumption. Figure 4a,b also show that the changing pattern of 15 min exposure was not considerably different from that of 20 min. Furthermore, it is suggested that prolonged ultrasonic exposure duration intensifies free radical generation which likely lead to degradation of cells. Ultrasonic density (0.12 Wm/L) can be used to determine the power consumption (kWh/m3) as a function of the ultrasonic power entering the liquid system, duration of exposure and volume of the liquid treated (Table 2).
By relating algal removal to the ultrasonic dosage, the overall effect of sonication on the mixed algae suspension at a specific frequency can be quantified by [13,24]:
Efficiency determines the optimal operating conditions of the sonication treatment in terms of the economy in energy consumption, as well as algae removal effectiveness. The results in Table 2 were obtained at different ultrasonic dosages of the two alert levels considered in this study in order to estimate a value for the efficiency of the treatment. The exposure time of 10, 15, and 20 min gave the values of the power dosage shown in the table.
The most efficient value was obtained at 15 min exposure for both concentration levels. Between the concentration levels, the Chl-a reduction efficiency was better for the outbreak condition. In addition to the removal efficiency, the final concentration value should, however, be considered as a deciding factor to assess the overall effect of the treatment system. The 15 min of sonication gave the highest efficiency of 0.94 m3/kWh, and substantial immediate Chl-a removal of 28%. However, the Chl-a concentration after 24 h of standing was 147 µg/L, which is still greater than the 100 µg/L lower limit of the outbreak Chl-a level. Thus, while the efficiency is high, additional considerations, such as water circulation for further exposure or varying operating frequency to match the resonance of different species, are required to effectively remove algae from a concentrated water body. Zhang et al. [22] have stated that gas vacuoles are expected to resonate, experience acoustic cavitation, and finally implode, provided that resonance of cavitation bubbles and gas vacuoles of the algae cell are of the same order of magnitude.
3.2. The Effect of Sonication on the Mixed Algae Suspension TDN and TDP
The excessive amounts of nitrogen and phosphorus, as the major algae nutrients, are in control of the overgrowth of algae in a water body. Since the mixed algae samples in this study were collected directly from a eutrophic lake, it is reasonable to study the possible impact of sonication treatment on concentrations of nitrogen and phosphorus of the suspension. Figure 5a shows that the total dissolved nitrogen, TDN, content in the untreated groups remained almost the same; yet, the sonicated ones showed a decrease during sonication, and then remained unchanged in the incubation time. After 15 min of sonication, the water column TDN decreased by 42.6% and 14.0%, in the outbreak and caution concentrations, respectively. Thus, the suspension concentration seems to have effect on the TDN removed.
The formation of extremely high local temperature and pressure during ultrasonic cavitation is responsible for the chemical reactions taking place in the suspension. During the ultrasonic vibration, the created sono-chemical condition may result in release of some of the dissolved inorganic nitrogen (DIN), which comprises of ammonia, nitrite, and nitrate, into the atmosphere and, thus, decrease in the TDN [31]. On the other hand, there is possibility of increase in dissolved organic nitrogen in case cyanobacteria cells collapse. However, Liu et al. [53] showed that under power intensity of less than 0.5 W/mL, the possible increase in DON is mild. The decrease in TDN is, therefore, likely dominated by the decrease in DIN. As the TDN components are not naturally associated with other inorganic or organic particles, the TDN remained constant during the incubation period in all the cases considered.
On the other hand, the impact of sonication on TDP (Figure 5b) of the mixed algae suspension sample of the outbreak level treatment was quite different from that obtained for caution level. In contrast to the TDN scenario, the TDP of the outbreak treatment groups increased right after sonication and then decreased at low rate. Just after sonication, the value increased as high as 0.22 mg/L from the initial value of 0.17 mg/L. The TDP of the treated caution level concentration decreased from 0.17 to 0.13 mg/L, and it remained the same in the control (without sonication).
The increase in concentration of TDP in the sonicated outbreak concentration was likely due to ultrasonic effects on the dissolution and dissociation of loosely-adsorbed phosphate from the particles in the suspension [37]. Similar phenomenon was not observed for TDN likely because the conversion of nitrogen to volatile forms overweighed the intracellular release during sonication. On the other hand, ultrasonic releases of dissolved organic materials from raptured algae cell tentatively enhance biological phosphorous removal [54]. The release and removal of phosphorus, caused by sonication, are affected by the algae concentration in the suspension and aeration of the water. The surface scum in the concentrated solution likely limited aeration and, hence, aerobic biological removal of phosphorus. The decrease in TDP after sonication could also be due to adsorption to the settling algae and other particles from the water. Along with the TDN and TDP, ammonia nitrogen and reactive phosphate were also determined in the study (Figure S1). However, both remained nearly unchanged, or have not shown a clear pattern in all of the treated and untreated samples.
3.3. The Effect of Sonication on the Mixed Algae Suspension COD
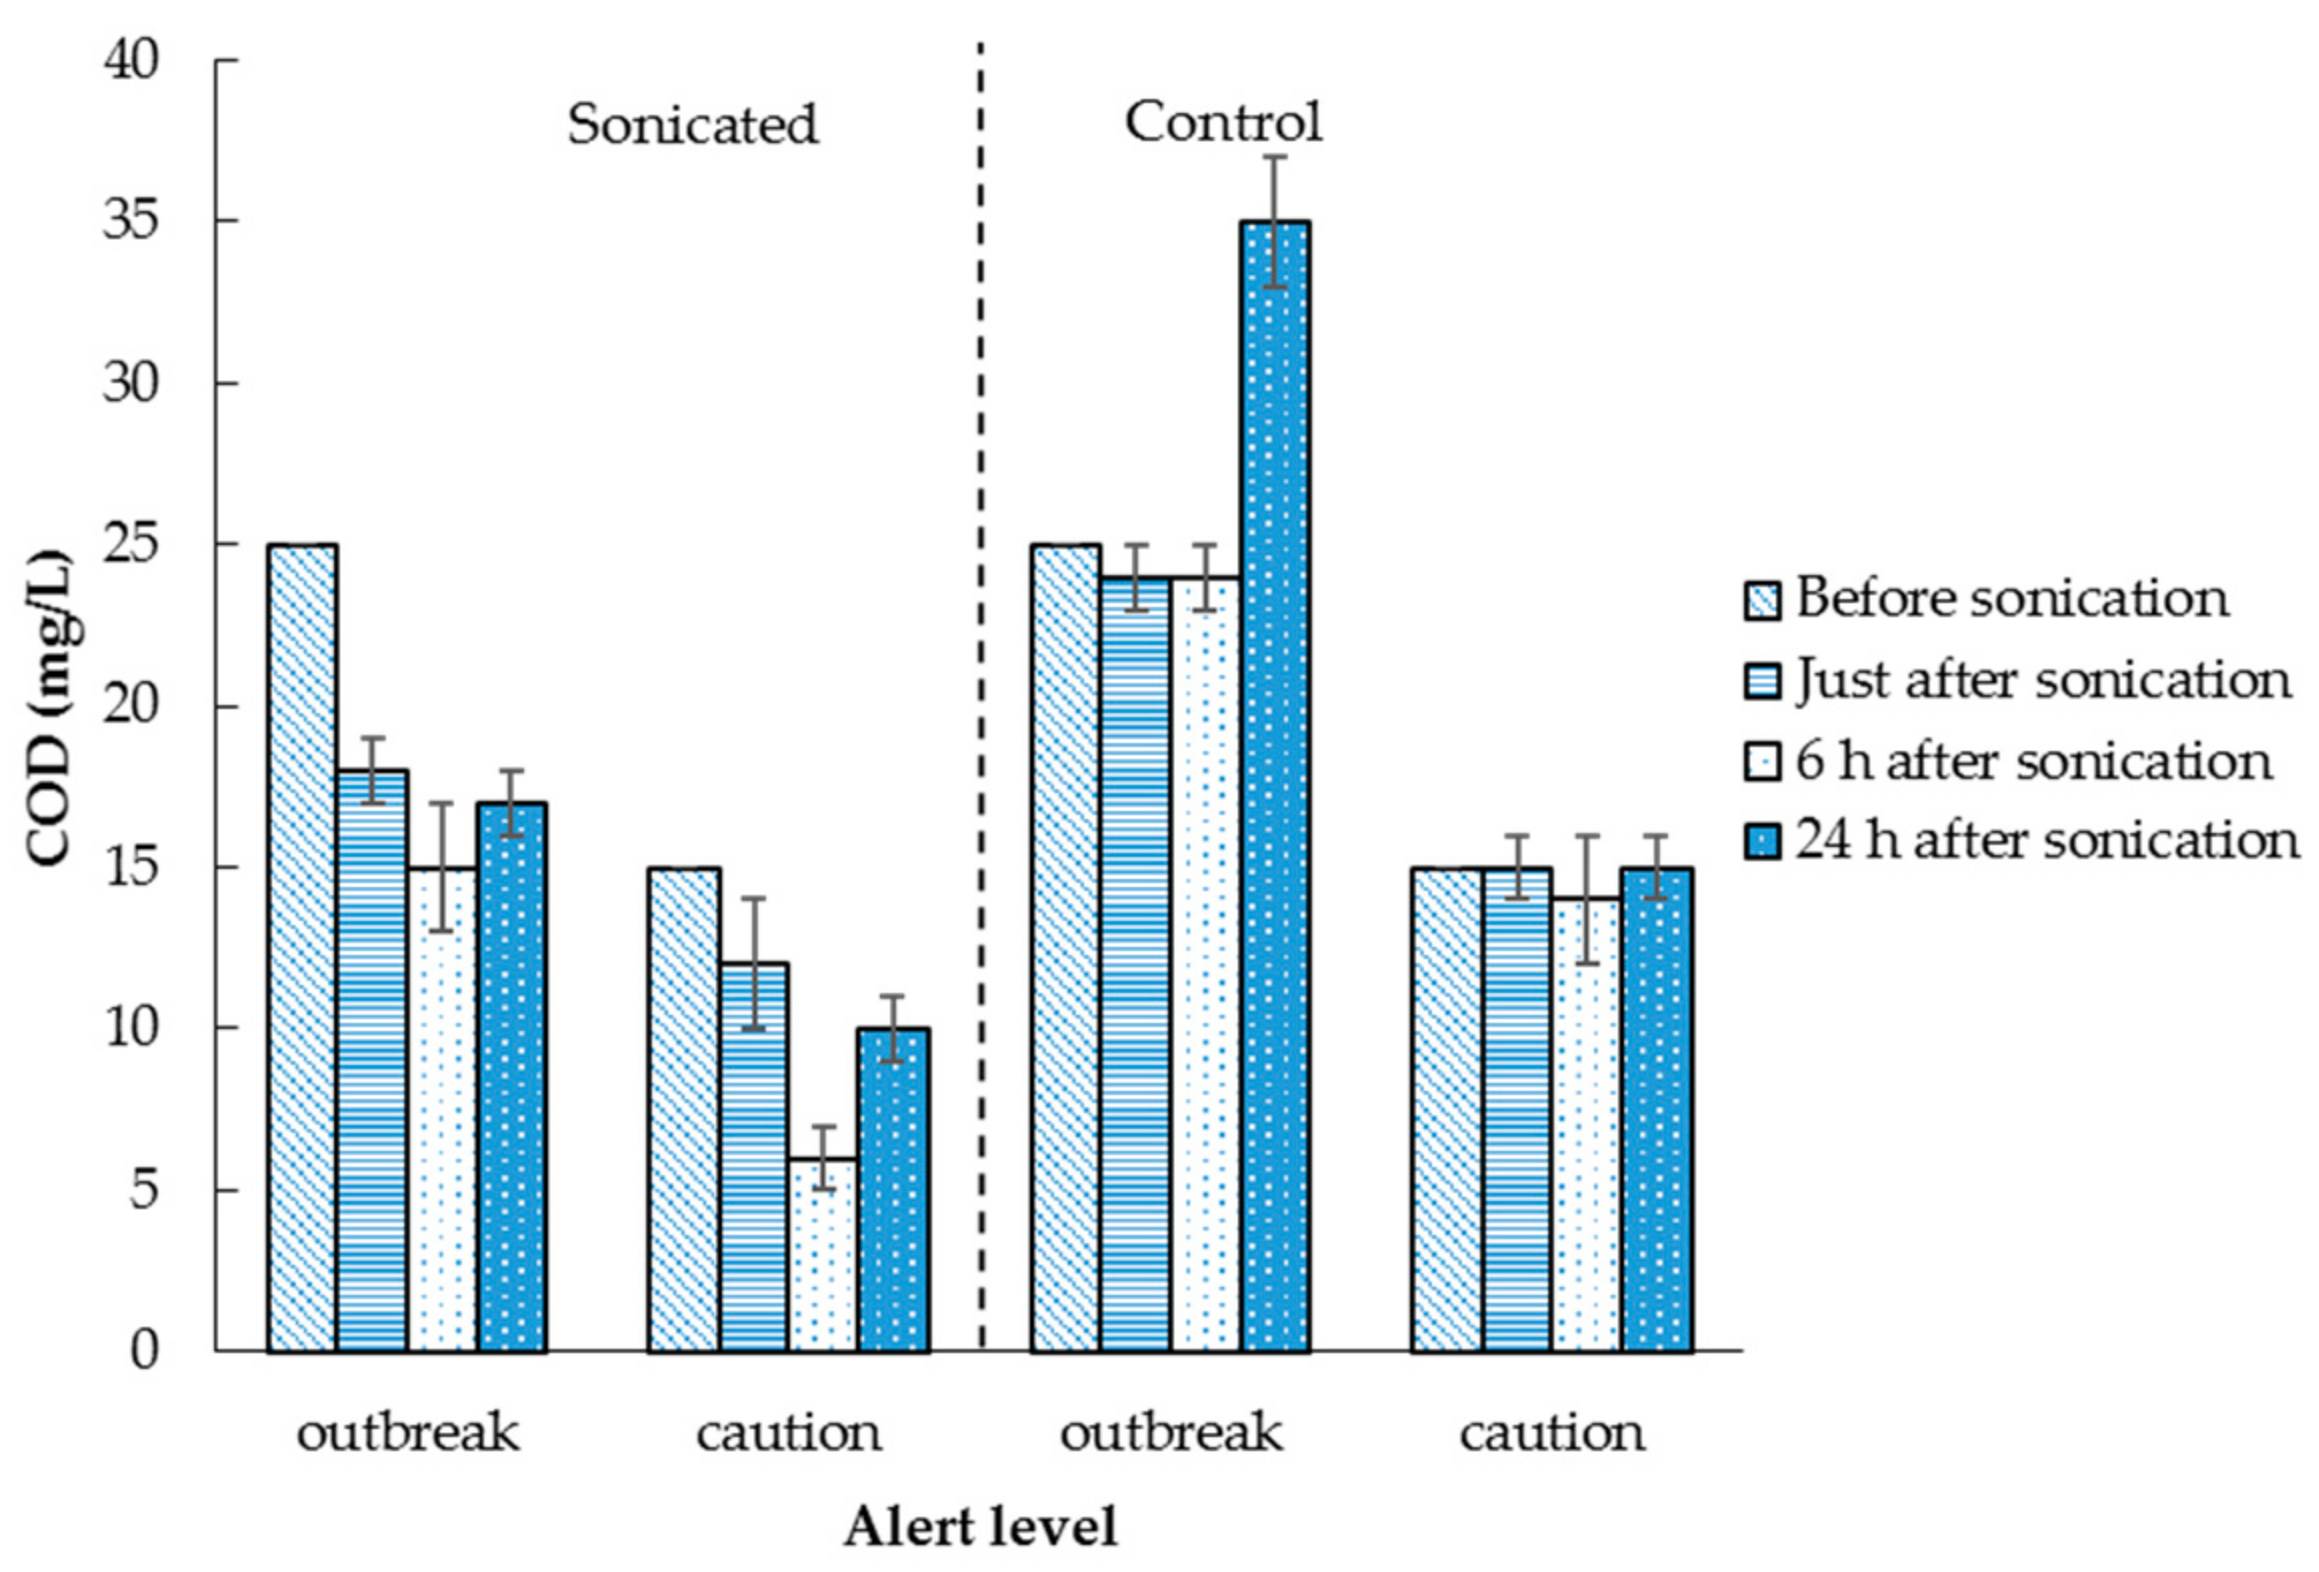
The degradability due to sonication was assessed based on the changes in the water sample COD concentration (Figure 6). Immediately after 15 min of sonication, COD values reduced from 25 to 18 mg/L for the treated outbreak, and from 15 to 12 mg/L for the corresponding caution level concentration. The reduction continued with incubation time up till 6 h; but, the concentration values increased somehow after 24 h, likely due to a shortage of oxygen. The shortage could be caused by depletion of existing air in breaking down dead cells, and used for metabolism by the active ones, and the dense scum blocking further aeration. Efficiency of total COD removal just after sonication was determined to be 20–28%, compared to the less than 5% of the control group. However, the concentration in the outbreak control, in which the surface scum was even thicker than the corresponding treated set, considerably increased after standing for 24 h.
In this study, most of the COD removal was accomplished during the initial sonication time, and removal efficiency was not increased much by time thereafter. Following the application of ultrasound to a liquid suspension, extreme temperatures and pressures are generated as a result of acoustic cavitation. The cavitation, in turn, results in the formation of intense shock wave, shear forces, and reactive free radicals, due to the violent collapse of the cavitation bubble [55]. In consequence to this active cavitation phenomena, the total solid surface in contact with the liquid increases, and the organic and toxic matter in the liquid decomposes, hence the decrease in COD.
4. Conclusions
Excessive growth of cyanobacteria generally results in reduction of water production capacity and/or an increase in treatment costs. Ultrasonication has been widely studied for controlling cyanobacteria and the ultrasonic mechanism of algal cell disruption has been well understood. However, most of the studies are limited to artificial laboratory settings, and there is a knowledge gap in applying sonication in natural water bodies. Most of the laboratory studies are conducted using one type of algae species, which is a deviation from the environment in natural water bodies. To limit the deviation, this study was conducted on the understanding of the action of ultrasound on the potential for cyanobacterial removal and control, considering bloom alert levels and mixed algae suspensions.
The changes in the Chl-a amount during the first 2 h of incubation were quite dramatic in both of the initial concentrations of the alert levels considered. The decrease in Chl-a was considered to have resulted from rapid sedimentation of the cyanobacterial cells after collapsed gas vesicles. Fifteen minutes of sonication led to the best removal efficiency. However, in the outbreak treatment case, the concentration was considerably high, even after setting the sample aside for a day, and that there were algae cells not affected by the treatment system. The results of this study also showed that ultrasound can improve some of the water quality variables along with removal of algae. The TDN was reduced during the ultrasonic exposure, and remained unchanged thereafter. However, the TDP has increased after the outbreak level treatment, probably due to the release of loosely-adsorbed phosphorus from algae cells and other particles in the water, whereas the COD was overall reduced by 40% and 60% in the caution and outbreak set of treated concentrations, respectively, in comparison with the unchanged control samples. There had been an increase of the COD values after 24 h, in the treated and concentrated control samples, likely due to a shortage of aeration.
Most of the ultrasonic-based algal removals conducted in the lab have reported effective results. In contrast, stating the attenuation of power intensity in large volumes of water, inconsistent effects in some field trials and the effect of high ultrasound intensity on non-target organisms, such as Daphnia magna, some researchers highly doubt the effectiveness of sonication in field applications, such as whole lake settings [39,56]. However, in their recent literature review, Park et al. [29] argue that ultrasonication is still an attractive technique in many aspects compared to other technologies for algal control, especially compared to the use of algaecides. The energy requirement can be managed using floating devices and the sun, and unlike chemical treatment techniques, ultrasound is a clean technology that does not produce any byproducts [14]. Several approaches are proposed to scale up sonication, such as the deployment of multiple floating ultrasonic devices to supply sufficient ultrasound intensity, restricting treatment target areas to locations close to water intake towers, as the removal of algae from a large reservoir entirely may not be realistic considering the cost, conducting several field/pilot studies considering water flow, targeted algae species and other natural water body related operation factors, and combining sonication with remote sensing technologies to measure the algal concentration and optimize the application time [29]. The successful field application by Schneider et al. [16] is encouraging to emphasize more systematic studies in the future, to achieve consistent outcomes in a large-scale application.
From this lab-scale study, it was shown that a fixed frequency sonication of a mixed algae suspension is generally effective in preventing algal bloom formation than removing an already-established bloom. In a concentrated mixed algae suspension, varying the operating frequency to address selective inhibition of a specific frequency and/or using techniques, such as circulation in conjunction with the sonication for adequate aeration and complete exposure of the cells, could allow effective removal. The ultrasonic device used in this study was applied in three sets, along with jet water flow in a field trial intended to prevent bloom formation, and it was effective in 25 m radius area, which could also mean two groups of transducers can be used in a hectare of lake surface area with maximum depth of 2 m [57]. Low power ultrasound is applied continuously at sub-cavitation levels in most field tests. Even if the lab study was conducted with an exposure time of 10–20 min, ultrasonic treatment of algae in natural water bodies may need several weeks of exposure time to reach maximum effectiveness due to flow and other influencing factors. It should also be emphasized that replicated, large-scale experiments are needed to understand the effects of ultrasound on the target and non-target organisms. If proper parameters are not applied, cavitation may result in unintended consequences, such as detrimental effects on macrophytes, zooplankton and, possibly fish. Future research needs to test the possible effects of ultrasound treatments on non-target organisms.
Supplementary Materials
The following are available online at www.mdpi.com/2073-4441/9/12/915/s1, Figure S1: Immediate and long-term effect of 15 min sonication on the (a) ammonia-nitrogen, and (b) soluble reactive phosphate (SRP) values of the outbreak and caution level concentration.
Acknowledgments
This work was supported by the Korea Institute of Civil Engineering and Building Technology, KICT, of Korean Government, number 2017-0537.
Author Contributions
Andinet Tekile and Ilho Kim conceived and designed the experiments; Andinet Tekile and Jai-Yeop Lee collected samples and performed the experiments; Andinet Tekile, Jai-Yeop Lee and Ilho Kim analyzed the data; Andinet Tekile.
Conflicts of Interest
The authors declare no conflict of interest.
References
- Palaniappan, M.; Gleick, P.H.; Allen, L.; Cohen, M.J.; Christian-Smith, J.; Smith, C. Clearing the Waters: A Focus on Water Quality Solutions; United Nations Environment Programme, Pacific Institute: Oakland, CA, USA; UNON: Nairobi, Kenya, 2010; ISBN 978-92-807-3074-6. [Google Scholar]
- Dokulil, M.T. Old wine in new skins—Eutrophication reloaded: Global perspectives of potential amplification by climate warming, altered hydrological cycle and human interference. In Eutrophication: Causes, Economic Implications and Future Challenges; Lambert, A., Roux, C., Eds.; Nova Science Publishers Inc.: New York, NY, USA, 2013; pp. 95–125. ISBN 978-1-62808-498-6. [Google Scholar]
- Beklioglu, M.; Meerfhoff, M.; Sondergaard, M.; Jeppesen, E. Eutrophication and Restoration of Shallow Lakes from a Cold Temperate to a Warm Mediterranean and a (Sub)Tropical Climate. In Eutrophication: Causes, Consequences and Control; Ansari, A.A., Gill, S.S., Lanza, G.R., Rast, W., Eds.; Springer: Dordrecht/Heidelberg, Germany; London, UK; New York, NY, USA, 2011; pp. 91–108. ISBN 978-90-481-9624-1. [Google Scholar]
- Hilton, J.; Ohare, M.; Bowes, M.J.; Jones, J.I. How green is my river? A new paradigm of eutrophication in rivers. Sci. Total Environ. 2006, 365, 66–83. [Google Scholar] [CrossRef] [PubMed]
- Webster, I.T.; Sherman, B.S.; Bormans, M.; Jones, G. Management strategies for cyanobacterial blooms in an impounded lowland river. Regul. Rivers 2000, 16, 513–525. [Google Scholar] [CrossRef]
- Yang, Q.; Xie, P.; Shen, H.; Xu, J.; Wang, P.; Zhang, B. A novel flushing strategy for diatom bloom prevention in the lower-middle Hanjiang River. Water Res. 2012, 46, 2525–2534. [Google Scholar] [CrossRef] [PubMed]
- Sharpley, A. Managing agricultural phosphorus to minimize water quality impacts. Sci. Agric. 2016, 73, 1–8. [Google Scholar] [CrossRef]
- Jancula, D.; Marsalek, B. Critical review of actually available chemical compounds for prevention and management of cyanobacterial blooms. Chemosphere 2011, 85, 1415–1422. [Google Scholar] [CrossRef] [PubMed]
- Sierp, M.T.; Qin, J.G.; Recknagel, F. Biomanipulation: A review of biological control measures in eutrophic waters and the potential for Murray cod Maccullochella peelii peelii to promote water quality in temperate Australia. Rev. Fish Biol. Fish. 2009, 19, 143–165. [Google Scholar] [CrossRef]
- Visser, P.M.; Ibelings, B.W.; Bormans, M.; Huisman, J. Artificial mixing to control cyanobacterial blooms: A review. Aquat. Ecol. 2016, 50, 423–441. [Google Scholar] [CrossRef]
- Beutel, M.W.; Horne, A.J. A Review of the effects of hypolimnetic oxygenation on lake and reservoir water quality. Lake Reserv. Manag. 1999, 15, 285–297. [Google Scholar] [CrossRef]
- Hickey, C.W.; Gibbs, M.M. Lake sediment phosphorus release management-Decision support and risk assessment framework. N. Z. J. Mar. Freshw. Res. 2009, 43, 819–856. [Google Scholar] [CrossRef]
- Joyce, E.M.; Wu, X.; Mason, T.J. Effect of ultrasonic frequency and power on algae suspensions. J. Environ. Sci. Health A 2010, 45, 863–866. [Google Scholar] [CrossRef] [PubMed]
- Tekile, A.; Kim, I.; Kim, J. Mini-review on river eutrophication and bottom improvement techniques, with special emphasis on the Nakdong River. J. Environ. Sci. 2015, 30, 113–121. [Google Scholar] [CrossRef] [PubMed]
- Purcell, D.; Parsons, S.A.; Jefferson, B. The influence of ultrasound frequency and power, on the algal species Microcystis aeruginosa, Aphanizomenon flos-aquae, Scenedesmus subspicatus and Melosira sp. Environ. Technol. 2013, 34, 2477–2490. [Google Scholar] [CrossRef] [PubMed]
- Schneider, O.D.; Weinrich, L.A.; Brezinski, S. Ultrasonic treatment of algae in a New Jersey Reservoir. J. Am. Water Works Assoc. 2015, 107, E533–E542. [Google Scholar] [CrossRef]
- Hao, H.; Wu, M.; Chen, Y.; Tang, J.; Wu, Q. Cavitation mechanism in cyanobacterial growth inhibition by ultrasonic irradiation. Colloids Surf. B 2004, 33, 151–156. [Google Scholar] [CrossRef]
- Rajasekhar, P.; Fan, L.; Nguyen, T.; Roddick, F.A. A review of the use of sonication to control cyanobacterial blooms. Water Res. 2012, 46, 4319–4329. [Google Scholar] [CrossRef] [PubMed]
- Wu, T.Y.; Guo, N.; Teh, C.Y.; Hay, J.W. Advances in Ultrasound Technology for Environmental Remediation; Springer Science and Business Media: New York, NY, USA, 2013; pp. 95–98. ISBN 978-94-007-5532-1. [Google Scholar]
- Lee, T.J.; Nakano, K.; Matsumara, M. Ultrasonic irradiation for blue-green algae bloom control. Environ. Technol. 2001, 22, 383–390. [Google Scholar] [CrossRef] [PubMed]
- Heng, L.; Nan, J.; He, W.-J.; Li, G. Algae removal by ultrasonic irradiation–coagulation. Desalination 2009, 239, 191–197. [Google Scholar] [CrossRef]
- Zhang, G.; Zhang, P.; Wang, B.; Liu, H. Ultrasonic frequency effects on the removal of Microcystis aeruginosa. Ultrason. Sonochem. 2006, 13, 446–450. [Google Scholar] [CrossRef] [PubMed]
- Wu, X.; Joyce, E.M.; Mason, T.J. Evaluation of the mechanisms of the effect of ultrasound on Microcystis aeruginosa at different ultrasonic frequencies. Water Res. 2012, 46, 2851–2858. [Google Scholar] [CrossRef] [PubMed]
- Rajasekhar, P.; Fan, L.; Nguyen, T.; Roddick, F.A. Impact of sonication at 20 kHz on Microcystis aeruginosa, Anabaena circinalis and Chlorella sp. Water Res. 2012, 46, 1473–1481. [Google Scholar] [CrossRef] [PubMed]
- Nakano, K.; Lee, T.J.; Matsumura, M. In situ algal bloom control by the integration of ultrasonic radiation and jet circulation to flushing. Environ. Sci. Technol. 2001, 35, 4941–4946. [Google Scholar] [CrossRef] [PubMed]
- Lee, T.J.; Nakano, K.; Matsumura, M. A novel strategy for cyanobacterial bloom control by ultrasonic irradiation. Water Sci. Technol. 2002, 46, 207–215. [Google Scholar] [PubMed]
- Srisuksomwong, P.; Whangchai, N.; Yagita, Y.; Okada, K.; Peerapornpisal, Y.; Nomura, N. Effects of ultrasonic irradiation on degradation of microcystin in fish ponds. Int. J. Agric. Biol. 2011, 13, 67–70. [Google Scholar]
- Koda, S.; Kimura, T.; Kondo, T.; Mitome, H. A standard method to calibrate sonochemical efficiency of an individual reaction system. Ultrason. Sonochem. 2003, 10, 149–156. [Google Scholar] [CrossRef]
- Park, J.; Church, J.; Son, Y.; Kim, K.T.; Lee, W.H. Recent advances in ultrasonic treatment: Challenges and field applications for controlling harmful algal blooms (HABs). Ultrason. Sonochem. 2017, 38, 326–334. [Google Scholar] [CrossRef] [PubMed]
- Hobson, P.; Dickson, S.; Burch, M.; Thorne, O.; Tsymbal, L.; House, J.; Brookes, J.; Chang, D.; Kao, S.; Lin, T.; et al. Alternative and Innovative Methods for Source Water Management of Algae and Cyanobacteria; Water Research Foundation: Denver, CO, USA, 2012. Available online: http://trove.nla.gov.au/version/190037736 (accessed on 15 June 2017).
- Li, J.; Long, H.; Song, C.; Wu, W.; Yeabah, T.O.; Qiu, Y. Study on the removal of algae from lake water and its attendant water quality changes using ultrasound. Desalin. Water Treat. 2014, 52, 4762–4771. [Google Scholar] [CrossRef]
- Srivastava, A.; Ahn, C.Y.; Asthana, R.K.; Lee, H.G.; Oh, H.M. Status, alert system, and prediction of cyanobacterial bloom in South Korea. BioMed Res. Int. 2015, 2015, 584696. [Google Scholar] [CrossRef] [PubMed]
- Park, H.D.; Kim, B.; Kim, E.; Okino, T. Hepatotoxic microcystins and neurotoxic anatoxin-a in cyanobacterial blooms from Korean lakes. Environ. Toxicol. Water Qual. 1998, 13, 225–234. [Google Scholar] [CrossRef]
- Rodriguez-Molares, A.; Dickson, S.; Hobson, P.; Howard, C.; Zander, A.; Burch, M. Quantification of the ultrasound induced sedimentation of Microcystis aeruginosa. Ultrason. Sonochem. 2014, 21, 1299–1304. [Google Scholar] [CrossRef] [PubMed]
- Jachlewski, S.; Botes, M.; Cloete, T.E. The effect of ultrasound at 256 KHz on Microcystis aeruginosa, with and without gas vacuoles. Water SA 2013, 39, 171–174. [Google Scholar] [CrossRef]
- Kurokawa, M.; King, P.M.; Wu, X.; Joyce, E.M.; Mason, T.J.; Yamamoto, K. Effect of sonication frequency on the disruption of algae. Ultrason. Sonochem. 2016, 31, 157–162. [Google Scholar] [CrossRef] [PubMed]
- Ahn, C.Y.; Park, M.H.; Joung, S.H.; Kim, H.S.; Jang, K.Y.; Oh, A.M. Growth inhibition of cyanobacteria by ultrasonic radiation: Laboratory and enclosure studies. Environ. Sci. Technol. 2003, 37, 3031–3037. [Google Scholar] [CrossRef] [PubMed]
- Ahn, C.Y.; Joung, S.H.; Choi, A.; Kim, H.S.; Jang, K.Y.; Oh, H.M. Selective control of cyanobacteria in eutrophic pond by a combined device of ultrasonication and water pumps. Environ. Technol. 2007, 28, 371–379. [Google Scholar] [CrossRef] [PubMed]
- Lurling, M.; Tolman, Y. Beating the blues: Is there any music in fighting cyanobacteria with ultrasound? Water Res. 2014, 66, 361–373. [Google Scholar] [CrossRef] [PubMed]
- Hao, H.; Wu, M.; Chen, Y.; Tang, J.; Wu, Q. Cyanobacterial bloom control by ultrasonic irradiation at 20 kHz and 1.7 MHz. J. Environ. Sci. Health A 2004, 39, 1435–1446. [Google Scholar] [CrossRef]
- Yamamoto, K.; King, P.M.; Wu, X.; Mason, T.J.; Joyce, E.M. Effect of ultrasonic frequency and power on the disruption of algal cells. Ultrason. Sonochem. 2015, 24, 165–171. [Google Scholar] [CrossRef] [PubMed]
- Lurling, M.; Tolman, Y. Effects of commercially available ultrasound on the zooplankton grazer daphnia and consequent water greening in laboratory experiments. Water 2014, 6, 3247–3263. [Google Scholar] [CrossRef]
- Purcell, D.; Parsons, S.A.; Jefferson, B.; Holden, S.; Campbell, A.; Wallen, A.; Chipps, M.; Holden, B.; Ellingham, A. Experiences of algal bloom control using green solutions barley straw and ultrasound, an industry perspective. Water Environ. J. 2013, 27, 148–156. [Google Scholar] [CrossRef]
- Tang, J.W.; Wu, Q.Y.; Hao, H.W.; Chen, Y.; Wu, M. Effect of 1.7 MHz ultrasound on a gas-vacuolate cyanobacterium and a gas-vacuole negative cyanobacterium. Colloids Surface B 2004, 36, 115–121. [Google Scholar] [CrossRef] [PubMed]
- Klemencic, A.K.; Griessler-Bulc, T. The efficiency of ultrasound on algal control in a closed loop water treatment system for cyprinid fish farms. Fresenius Environ. Bull. 2010, 19, 919–931. [Google Scholar]
- Zhang, G.; Zhang, P.; Liu, H.; Wang, B. Ultrasonic damages on cyanobacterial photosynthesis. Ultrason. Sonochem. 2006, 13, 501–505. [Google Scholar] [CrossRef] [PubMed]
- Zhang, G.; Zhang, P.; Fan, M. Ultrasound-enhanced coagulation for Microcystis aeruginosa removal. Ultrason. Sonochem. 2009, 16, 334–338. [Google Scholar] [CrossRef] [PubMed]
- Ma, B.; Chen, Y.; Hao, H.; Wu, M.; Wang, B.; Lv, H.; Zhang, G. Influence of ultrasonic field on microcystins produced by bloom-forming algae. Colloids Surface B 2005, 41, 197–201. [Google Scholar] [CrossRef] [PubMed]
- Eaton, A.D.; Clesceri, L.S.; Greenberg, A.E.; Franson, M.A.H. Standard Methods for the Examination of Water and Wastewater, 20th ed.; American Public Health Association (APHA): Washington, DC, USA, 1998; ISBN-13 978-0875532356. [Google Scholar]
- Jirka, A.M.; Carter, M.J. Micro semi-automated analysis of surface and wastewaters for chemical oxygen demand. Anal. Chem. 1975, 47, 1397–1402. [Google Scholar] [CrossRef] [PubMed]
- Reardon, J.; Foreman, J.A.; Searcy, R.L. New reactants for the colorimetric determination of ammonia. Clin. Chim. Acta 1966, 14, 403–405. [Google Scholar] [CrossRef]
- Mason, T.J.; Peters, D. Practical Sonochemistry: Power Ultrasound Uses and Applications, 2nd ed.; Woodhead Publishing: Philadelphia, PA, USA, 2002; pp. 5–11. ISBN 978-1-898563-83-9. [Google Scholar]
- Liu, C.; Wang, J.; Cao, Z.; Chen, W.; Bi, H. Variation of dissolved organic nitrogen concentration during the ultrasonic pretreatment to Microcystis aeruginosa. Ultrason. Sonochem. 2016, 29, 236–243. [Google Scholar] [CrossRef] [PubMed]
- Xie, B.; Wang, L.; Liu, H. Using low intensity ultrasound to improve the efficiency of biological phosphorus removal. Ultrason. Sonochem. 2008, 15, 775–781. [Google Scholar] [CrossRef] [PubMed]
- Naddeo, V.; Belgiorno, V.; Napoli, R.M.A. Behavior of natural organic matter during ultrasonic irradiation. Desalination 2007, 210, 175–182. [Google Scholar] [CrossRef]
- Lurling, M.; Waajen, G.; de Senerpont Domis, L.N. Evaluation of several end-of-pipe measures proposed to control cyanobacteria. Aquat. Ecol. 2016, 50, 499–519. [Google Scholar] [CrossRef]
- Tekile, A.; Kim, I.; Lee, J.-Y. Field trial of water flow and ultrasonic irradiation to improve the water quality of a stagnant river reach. Desalin. Water Treat. 2017, 74, 115–124. [Google Scholar] [CrossRef]
Figure 1.
Sketch of the ultrasonic probe and reaction system of the experimental setup housed in an incubator.
Figure 1.
Sketch of the ultrasonic probe and reaction system of the experimental setup housed in an incubator.

Figure 2.
Immediate effect of sonication on the mixed algae suspension for the outbreak and cation levels.
Figure 2.
Immediate effect of sonication on the mixed algae suspension for the outbreak and cation levels.

Figure 3.
Clearing of algae suspension from the water column after 15 min of exposure to sonication and standing for 1 h. The left Imhoff cone is for the control and the right one for the treated suspension.
Figure 3.
Clearing of algae suspension from the water column after 15 min of exposure to sonication and standing for 1 h. The left Imhoff cone is for the control and the right one for the treated suspension.

Figure 4.
Effect of 10, 15, and 20 min sonication on the water column of (a) outbreak alert level concentration with initial value 1414 to 1469 μg/L; (b) caution level with initial values of 17.1 to 17.5 μg/L. The solid lines, ![Water 09 00915 i001]() ,
, ![Water 09 00915 i002]() and
and ![Water 09 00915 i003]() represent 10, 15 and 20 min treated suspensions, respectively and the broken lines,
represent 10, 15 and 20 min treated suspensions, respectively and the broken lines, ![Water 09 00915 i004]() ,
, ![Water 09 00915 i005]() and
and ![Water 09 00915 i006]() represent control groups corresponding to 10, 15, and 25 min treatment, respectively.
represent control groups corresponding to 10, 15, and 25 min treatment, respectively.
 ,
,  and
and  represent 10, 15 and 20 min treated suspensions, respectively and the broken lines,
  ,
,  and
and  represent control groups corresponding to 10, 15, and 25 min treatment, respectively.
Figure 4.
Effect of 10, 15, and 20 min sonication on the water column of (a) outbreak alert level concentration with initial value 1414 to 1469 μg/L; (b) caution level with initial values of 17.1 to 17.5 μg/L. The solid lines, ![Water 09 00915 i001]() ,
, ![Water 09 00915 i002]() and
and ![Water 09 00915 i003]() represent 10, 15 and 20 min treated suspensions, respectively and the broken lines,
represent 10, 15 and 20 min treated suspensions, respectively and the broken lines, ![Water 09 00915 i004]() ,
, ![Water 09 00915 i005]() and
and ![Water 09 00915 i006]() represent control groups corresponding to 10, 15, and 25 min treatment, respectively.
represent control groups corresponding to 10, 15, and 25 min treatment, respectively.
, and represent 10, 15 and 20 min treated suspensions, respectively and the broken lines, , and represent control groups corresponding to 10, 15, and 25 min treatment, respectively.
Figure 5.
Immediate and long-term effect of 15 min sonication on the (a) total dissolved nitrogen (TDN), and (b) total dissolved phosphate (TDP) values of the outbreak and caution level concentrations.
Figure 5.
Immediate and long-term effect of 15 min sonication on the (a) total dissolved nitrogen (TDN), and (b) total dissolved phosphate (TDP) values of the outbreak and caution level concentrations.
Figure 6.
Effect of 15 min of sonication on the chemical oxygen demand (COD) values of the outbreak and caution concentrations, just after sonication and then after standing for 6 and 24 h.
Figure 6.
Effect of 15 min of sonication on the chemical oxygen demand (COD) values of the outbreak and caution concentrations, just after sonication and then after standing for 6 and 24 h.


Table 1.
Summary of laboratory and field ultrasonication studies for algae removal and control.
| Target Species | Sonication Condition (Frequency, Power) | Study Scale (Volume) | Treatment Duration | Effect | Ref. |
|---|---|---|---|---|---|
| Cyanobacteria and other algae types | 4 buoys (Not given) | Reservoir (2.9 Mm3) | 6 months | Reduced taste and odor and algae levels; 22% reduction of alum dose and 20 h longer filter run ($87,800 related operation costs saved). | [16] |
| M. aeruginosa | Jet flow, flushing, and 10 transducers (100 W, 200 kHz each) | Lake (365,000 m3) | 5 s contact time, for 2 years | Chl-a and SS decreased, from 200 to 50 µg/L and 100 to 20 g/m3, res.; however, following decrease in flushing rate, bloom reappeared (130 µg/L Chl-a). | [25,26] |
| C. gracilis, C. calcitrans, and Nannochloropsis sp. | 0.02, 0.4, 1.0, 2.2, 3.3, and 4.3 MHz, 10 W | Lab Scale (100 mL) | 0–10 min | Highest algae reduction efficiency at 2.2, 3.3, and 4.3 MHz for C. gracilis (100% at 2 min), C. calcitrans (100% at 2 min), and Nannochloropsis sp. (90% at 10 min), res. | [36] |
| Cyanobacteria and other algae types | 630 W, 22 kHz | Pond enclosures (200 L) | 40 s with 210 s gap, for 7 days | Chl-a decreased from 111.3 to 32.5 µg/L after 3 days of sonication during which that of control doubled. Sonication selectively inhibited cyanobacteria compared to other algae cells. | [37] |
| Cyanobacteria and diatoms | 2 pumps with ultrasonic apparatus (630 W, and 22 kHz) | Pond (9000 m3), control (7000 m3) | 7 weeks | Chl-a in treated pond remained low at 10 μg/L, while it increased in control (20 to 87 μg/L). It increased in the treated pond, only when the device stopped. | [38] |
| Anabaena sp., C. raciborskii, M. aeruginosa, S. obliquus, and D. magna | Mix of 20, 28, and 44 kHz, 26.4 W | Lab scale (800 mL) | 19, 10, 7, and 5 days | Chl-a of Anabaena decreased. However, no effect on C. raciborskii, M. aeruginosa, and S. obliquus growth rates. Ultrasound killed all Daphnia within 15 min. | [39] |
| Spirulina platensis | Beaker system (1.7 MHz, 14 W) and probe (20 kHz, 70 W) | Lab Scale (800 mL) | 0–9 min | The inhibition at 1.7 MHz was 50% better than that at 20 kHz. 5 min sonication at 1.7 MHz inhibited growth for 3 days. | [40] |
| Filamentous cyanobacteria (Spirulina platensis) | 200 kHz and 1.7 MHz, 40 W) and (20 kHz, 0, 20, 40, 60, and 80 W) | Lab Scale (800 mL) | 0–10 min | Inhibition most effective at 200 kHz and became saturated with the increased power. | [17] |
| Spherical shaped (C. concordia) and ovoid shaped (D. salina) | (20 kHz, 32.3 W), and (580, 864, and 1146 kHz, 3, 20, and 60 W) | Lab Scale (400 mL) | 1–30 min | Disruption efficiency of C. concordia was in the order of 20 < 580 < 864 < 1146 kHz frequency, and for D. salina was 20 < 580 ≅ 864 ≤ 1146 kHz. | [41] |
| M. aeruginosa | 20, 40, 580, 864, and 1146 kHz at 0.0178, 0.0213, 0.0018, 0.0042, and 0.0026 W/cm3, res. | Lab Scale (200 mL) | 0, 5, 10, 20, 30 min | The order of efficiency for algae reduction: 20 < 1146 < 864 < 580 kHz. Ultrasound is suitable method for algae inactivation or control under proper sonication conditions. | [13] |
| D. magna | 20, 28, 36, or 44 kHz, 0.63 W | Lab scale (100–3200 mL) | 5–30 min | Differently sized Daphnia (0.7–3.2 mm) were all killed between 5 and 30 min when exposed to 44 kHz. | [42] |
| Green algae, cyanobacteria (with D. magna) | 20, 28, 36, or 44 kHz, 0.63 W | Lab scale (85 L) | 25 days | In controls Daphnia flourished and algal biomass dropped. In the treatment, Daphnia number extremely low and phytoplankton biomass high. | [42] |
| M. aeruginosa, Peridinium sp., and B. braunii | 29, 43, 108, 200 and 1000 kHz, 3 W | Lab scale (30 mm scum) | 0–10 min | 200 kHz settled Microcystis scum successfully without cell disintegration, and recommended for reducing microcystin and musty odor substances of aquaculture ponds. | [27] |
| Microcystis aeruginosa | 20, 580, and 1146 kHz, 0.0403 W/cm3 | Lab scale (200 mL) | 0–30 min | 20 kHz ultrasound at high intensity (0.0403 W/cm3) was effective for inactivation of cyanobacterial cells. | [23] |
| Cyanobacteria, Green algae, Diatoms | 28 and 40–50 kHz, 40 W | Reservoir (0.8–1 Mm3) | 5 months | Inconsistent results with reductions across all algal groups in some cases, but no overall effect in others. | [43] |
| M. aeruginosa, A. flos-aquae, S. subspicatus, and Melosira sp. | Probe (20 kHz, 600 W) and Multi-frequency type (582, 862, and 1144 kHz, 200 W) | Lab scale (1500 mL) | 5–500 s | High removal rate of A. flos-aquae (99%) and Melosira sp. (83%). M. aeruginosa and S. subspicatus non-susceptible to ultrasound. 65% photosynthetic activity reduction of M. aeruginosa shows possibility of controlling bloom growth. | [15] |
| M. aeruginosa | Bath-type (21.5 kHz, 8.24 W) | Lab scale (600 mL) | 10 min | Slight recovery of cells after 14 days of incubation proved that ultrasound induced sedimentation is a long-term effect. | [34] |
| Vacuolated (M. aeruginosa) and vacuole negative (Synechococcus) | 1.7 MHz, 0.6 W/cm2 | Lab scale | 5 min every day, for 4 days | Cavitation effect depended on intracellular gas-vacuoles. Compared to control, 65% decrease in M. aeruginosa biomass increment, while no effect on Synechococcus culture. | [44] |
| M. aeruginosa, A. circinalis, and Chlorella sp. | Probe system (20 kHz, 0.085 W/mL) | Lab scale (200 mL) | 5, 10, 15, and 20 min | The order of growth inhibition was: A. circinalis > M. aeruginosa > Chlorella sp., demonstrating selectively removal of cyanobacteria. | [24] |
| Blue-green algae and M. aeruginosa | 20–1100 kHz, 10–30 W | Lab scale (2000 mL) | 0–6 min | At 20 kHz and 30 W, effective algae removal (96%) and significant improvement of water quality achieved in 6 min. | [31] |
| M. aeruginosa (with and without gas vacuoles) | Ultrasonic flow device (256 KHz) | Lab scale (35 L) | 9 days | Disruption of gas vacuoles (in gas-vacuole type) and destruction of cell membranes (for those without). Chl-a was lower in both cases, compared to controls. | [35] |
| More than 30 different algae species | 20–200 kHz, 12 W | Fish pond (36 m3) | June–September and October–November 2007 | Efficient removal of planktonic algae, but flushing system required to remove the sedimented algae. | [45] |
| M. aeruginosa | Probe system (25 kHz, 0.32 W/mL) | Lab scale (250 mL) | 5 min | Cell growth and extracellular microcystins release were inhibited effectively. | [46] |
| M. aeruginosa | 20, 80 150, 410, 690, 1320 kHz, 32–80 W | Lab scale (200 mL) | 0–10 min | High power and long duration increased microcystins, but frequency had little impact. | [22] |
| Blue green algae (BGA) | 28 kHz, 120 and 1200 W | Lab scale (700 mL) | 0–5 min | Sonication collapsed gas vacuoles, precipitated BGA. Microcystin concentration did not increase even at 1200 W, 28 kHz and 5 min sonication. | [20] |
| M. aeruginosa | 150 kHz, 30 W | Lab scale (1000 mL) | 0–60 s | Short sonication enhanced reduction of algae cells and Chl-a without increasing concentration of microcystins. | [47] |
| Microcystis | Beaker (150, 410, and 1.7 MHz, 30 W) and horn (20 kHz, 0–90 W) | Lab scale (400 mL) | 0–12 min | Growth of Microcystis efficiently inhibited and after 20 min of sonication at 150 kHz and 30 W, 70% microcystins removed. | [48] |
Table 2.
Sonication efficiency in Chl-a reduction right after exposure time.
| Sonication Time (min) | Ultrasonic Dose (kWh/m3) | Chl-a Reduction Efficiency (m3/kWh) | |||
|---|---|---|---|---|---|
| Outbreak | Outbreak | ||||
| Average | min., max. | Average | min., max. | ||
| 10 | 20 | 0.82 | 0.71, 0.94 | 0.71 | 0.43, 1.00 |
| 15 | 30 | 0.94 | 0.88, 1.00 | 0.77 | 0.60, 0.94 |
| 20 | 40 | 0.83 | 0.78, 0.88 | 0.70 | 0.53, 0.87 |
© 2017 by the authors. Licensee MDPI, Basel, Switzerland. This article is an open access article distributed under the terms and conditions of the Creative Commons Attribution (CC BY) license (http://creativecommons.org/licenses/by/4.0/).
Share and Cite
MDPI and ACS Style
Tekile, A.; Kim, I.; Lee, J.-Y. 200 kHz Sonication of Mixed-Algae Suspension from a Eutrophic Lake: The Effect on the Caution vs. Outbreak Bloom Alert Levels. Water 2017, 9, 915. https://doi.org/10.3390/w9120915
AMA Style
Tekile A, Kim I, Lee J-Y. 200 kHz Sonication of Mixed-Algae Suspension from a Eutrophic Lake: The Effect on the Caution vs. Outbreak Bloom Alert Levels. Water. 2017; 9(12):915. https://doi.org/10.3390/w9120915
Chicago/Turabian StyleTekile, Andinet, Ilho Kim, and Jai-Yeop Lee. 2017. "200 kHz Sonication of Mixed-Algae Suspension from a Eutrophic Lake: The Effect on the Caution vs. Outbreak Bloom Alert Levels" Water 9, no. 12: 915. https://doi.org/10.3390/w9120915
Note that from the first issue of 2016, this journal uses article numbers instead of page numbers. See further details here.