Potential Impact on Freshwater Resources from Agrofuel Feedstock Cultivation in Thailand: Implications of the Alternative Energy Development Plan 2015


1
The Joint Graduate School of Energy and Environment (JGSEE), King Mongkut’s University of Technology Thonburi (KMUTT), Bangkok 10140, Thailand
2
Center of Excellence on Energy Technology and Environment (CEE), Science and Technology Postgraduate Education and Research Development Office (PERDO), Bangkok 10140, Thailand
*
Author to whom correspondence should be addressed.
Water 2017, 9(12), 919; https://doi.org/10.3390/w9120919
Submission received: 18 October 2017
/
Revised: 22 November 2017
/
Accepted: 24 November 2017
/
Published: 26 November 2017
(This article belongs to the Special Issue Life Cycle based Assessment Tools for Water Consumption and Management)
Abstract
:The impact of water use in areas with abundant freshwater resources should not be the same as areas with limited resources. This impact is quantified as water scarcity footprint. The monthly water stress index with reference to environmental water requirement is proposed as a characterization factor. The biofuel policies of Thailand—cassava and sugarcane for bioethanol, and oil palm for biodiesel—were selected for the assessment based on land expansion and displacement scenarios. Cultivation was found to be the most water intensive phase in producing both biodiesel and bioethanol. Thus, the proposed index was applied for assessing and selecting areas having low values of the water scarcity footprint. The results showed low values for expanding oil palm plantations on abandoned land and displacing plantation areas with low yields of maize and pineapple with sugarcane and cassava. Additionally, shifting the crop calendar could be considered to reduce the stress situation such as the central region can avoid the water scarcity footprint by 38% from shifting sugarcane cultivation. Consequently mitigating this potential impact and threats to the ecosystem based on specific circumstances and context would be achieved through applying the proposed index in water resource and land suitability planning.
1. Introduction
Although adequate freshwater resources exist globally, on average, these are not distributed equally across all regions. Thus, many regions face different levels of water scarcity either due to a decline in precipitation or a rise in water demand [1,2,3,4]. The largest water user in the world is the agricultural sector [5] and for Thailand, known as an agricultural country, approximately 47% of land was utilized for agriculture as recorded in 2016 [6]. Additionally, water demand for the agricultural sector in the year 2016 accounted for 75% of total water demand of the country [7]. Accordingly, water demand for agriculture is a key influence placing pressure or stress on freshwater resources.
Alternative energies, especially biofuels for transportation, have been strongly promoted in Thailand. The Alternative Energy Development Plan (AEDP) was firstly introduced in 2003. Recently, the fourth revision of the AEDP was launched in 2015 with a target at 30% of alternative energy use in total final energy consumption by 2036 [8]. The new targets of biofuels for transportation in AEDP 2015 are 14 million liters per day (ML/day) of biodiesel and 11.3 ML/day of bioethanol [9]. The AEDP 2015 was introduced in the Thailand Integrated Energy Blueprint (TIEB) launched in the same year. The TIEB was first developed to achieve energy sustainability based on security, economy, and ecology. Accordingly, achieving the targets of biofuels in AEDP 2015 will affect both land and water requirements due to additional cassava and sugarcane cultivation for bioethanol production, and oil palm for biodiesel production. The government has promoted the agricultural economics crop zoning system based on agricultural land suitability recommended by the Ministry of Agriculture and Cooperatives (MOAC). Although the rainfall distribution and irrigation area maps are already included for defining land suitability, demands for water having a significant influence on water scarcity are not yet taken into consideration.
A concern on water scarcity has been addressed by several studies and, as a result, many approaches have been developed to deal with this issue. Availability and use of water are the concepts used in developing water-related scarcity indicators. The assessment of global water resources and water productivity with regard to the scarcity issue was first focused by the Water Footprint Network (WFN). The use of water was assessed in terms of water consumption volumes by source, and polluted volumes by volume of water needed to assimilate pollutants. Water scarcity indicators have also been developed by this network for assessing the consequence of depletion global water resources on both annual [10,11] and monthly bases [12,13,14] in global water resource models. The indicators have continuously been improved for increasing accuracy and precision, as well as reducing the variance of simulation. Thus, the impacts of climate variability [15,16,17,18] and human activities [16,17,18] on global water resources availability are taken into consideration by several studies. Accordingly, the indicators mainly focuses on a global level and provides specific information on the effect of human activities on both quantity and quality of water resources leading to the occurrence of water scarcity. To assess the potential impact of water scarcity caused by water use has also been accounted in life cycle assessment (LCA) according to ISO 14046:2014 [19]. The assessment based on ISO 14046 can be conducted either only for water scarcity or as a part of life cycle assessment including both water scarcity and water degradation. Thus, the goal and scope of the assessment play important roles in selecting modelling choices and approaches [20]. This has led to a significant progress in developing and improving water scarcity indicators for LCA [21,22].
Water stress index (WSI) of Pfister et al. [23] (known as the water scarcity indicator in LCA) is used as a characterization factor in terms of stress to relate a physical quantity of water use to the potential impact [24,25]. Hence, the severity of the potential impact can be measured through this impact-based footprint approach. The withdrawal to availability (WTA ratio) is a basis of the WSI, thus, only volumes by source of water use are accounted for evaluating water stress [26]. The WSI has been quite widely accepted in the scientific community as stated in Nilsalab et al. [27]. In the case of Thailand, the annual and monthly WSIs have been developed by Gheewala et al. [28,29,30]. Consequently, the potential impact on freshwater resources from agrofuel feedstock cultivation in the study is assessed in terms of water scarcity footprint based on the LCA approach (ISO 14046) using the WSI.
However, demands for water are not only for humans, but also the environment. A river requires a certain amount of water remaining in a water body to sustain the river system to a desired environmental condition for ecosystem and human livelihoods. This certain amount of water is defined as the environmental water requirement (EWR). Different human and environmental demands for water depend on the local context; therefore, a balance between water demands for humans and environment needs to be fairly maintained. To address these issues, the monthly WSI proposed in this study is further improved from the methodology developed earlier by Nilsalab et al., considering the case of Thailand [27]. Consequently, this modified WSI is applied as a screening criterion for assessing the water scarcity footprint when selecting an area for cultivation of agrofuel feedstocks based on considering of all demands for and availability of water. Including this proposed approach into land suitability assessments could help to relieve water scarcity. The implications on freshwater availability of the biofuel targets in AEDP 2015 are evaluated as a case study.
2. Methodology
This section is divided into two parts: a methodology adjustment and an alternative energy development plan. The first part provides a brief of the water stress index (WSI) in relation to environmental water requirement (EWR). Then, EWR, in the context of Thailand, and the method of EWR assessment is further described. Application of the proposed method for assessing the water scarcity footprint of agrofuel feedstock cultivation in Thailand is detailed in the second part.
2.1. Methodology Adjustment
2.1.1. Water Stress Index with Reference to EWR
The WSI was firstly introduced by Pfister et al. [23] and the monthly WSI proposed later by Pfister and Bayer [31]. The WTA ratio accounted in the WSI includes water withdrawn for household, industry, agriculture, and livestock, and available water in terms of surface water estimated from statistical rainfall data [23,31]. For the case of Thailand, the initial modification was done by incorporating EWR in the withdrawal term of WTA (then designated as WTAe) based on the importance of EWR prioritized and allocated by the Royal Irrigation Department (RID). The corresponding WSI was then designated as WSIe. The critical threshold of stress situation was defined at the WTAe equal to 1, corresponding to the WSIe value of 0.5 [27]. Incorporation of EWR in the withdrawal term of WTA leads to reconsidering the critical threshold and the limit of the logistic function. The stress situation occurs when total demand (including EWR) starts to exceed the availability. Thus, the critical threshold is revised as the WTAe equal to 1, corresponding to the WSIe value at 1. This point indicates the equilibrium point and the beginning of the stress situation. Before reaching the critical threshold, the total available water is sufficient to supply both the human and environmental demands; this is characterized by the WSIe values ranging from 0 to 1. The values of WTAe exceeding the critical threshold are determined based on excess demand, whether human or environmental. If total demand exceeds total availability, the stress already exists as all the available water has already been used up. As a result, the WSIe values ranging from 1 to 2 are specified to indicate an increasing severity of the stress situation. The value of 2 is equivalent to total demands for water of human and environment leading to indicate the maximum limit of the equation. Accordingly, the monthly WSIe and classification expressed in Equation (1) and Table 1 are introduced as Thailand’s monthly WSIe,THA:
where (the adjusted WTAe ratio) is obtained by multiplying the WTAe where the water withdrawal includes EWR, with the geometric standard deviation of annual rainfall.
The constant value of −3.84 (the exponent of “e”) in Equation (1) is computed based on the median of a set of variability of annual rainfall for Thailand, equal to 1.2 obtained from Gheewala et al. [28]. However, though Equation (1) is valid only for the case of Thailand, this equation and the constant value can be adjusted for other countries based on their precipitation data. The WSIe,THA is considered on a monthly basis; therefore, the annual variation of rainfall is accounted in the .
The water scarcity footprint is assessed by means of the extracted amount of freshwater from resources that contributes to depriving other users of freshwater downstream of the watershed. Thus, it is calculated by multiplying the amount of freshwater withdrawal for any products or services with the WSI values. This potential impact was firstly introduced and called as water deprivation impact potential by Ridoutt and Pfister [32]. Accordingly, the water scarcity footprint is quantified by using Equation (2). The monthly WSIe,THA is used for assessing pressure on water availability contributed by additional water requirement, and the amount of freshwater withdrawal refers to irrigation water. Based on the LCA approach, a non-conventional unit, “m3H2Oeq” is defined as the unit of the assessment [29]:
Monthly water scarcity footprint (m3H2Oeq/unit) = Monthly irrigation water for crop cultivation (m3/unit) × Monthly WSIe,THA
Accordingly, the monthly WSIe,THA is for Thailand’s 25 watersheds are calculated using Equation (1). Water withdrawals of the four significant sectors are quantified based on the national water demand standards for household, industry, agriculture, and livestock provided by RID [33]. The agricultural water in the RID’s standard is assessed based on irrigated and non-irrigated areas. In this study, the RID’s standard of EWR for 25 watersheds is considered to be recalculated as described in the following section. Water availability in terms of surface freshwater is assessed from statistical rainfall data during 2000–2011. The monthly WSI values with reference to EWR will be subsequently used for assessing the monthly water scarcity footprint.
2.1.2. Environmental Water Requirement (EWR)
The functions of EWR in the context of Thailand include maintaining aquatic ecosystems, the water level for transport, pollutant loads (dilution or push), fisheries (fish cage culture), and seawater intrusion, depending on location [33]. EWR based on the minimum flow approach may not correspond to reality due to the different uses of EWR. This leads to underestimation of water stress in some areas where the minimum flow cannot maintain the river function and ecological services. Accordingly, some areas facing this situation during the dry season may be visible in the monthly WSI.
The variable monthly flow (VMF) method proposed by Pastor et al. [34] is developed to deal with improper allocation of environmental flow during high and low flow periods. This method is verified with the three renowned hydrology-based methods including the Smakhtin, Tennant, and Tessmann methods and 11 local case studies using model simulation. Flow variations in terms of mean monthly flow (MMF) and mean annual flow (MAF) are taken into account for classifying stream flow discharge on a monthly basis. Flow variation including high flow (HF), intermediate flow (IF), and low flow (LF), is applied for the assessment of EWR. HF is defined at MMF higher or equal to 80% of MAF; then the amount of EWR is equal to 30% of MMF. 60% of MMF is estimated for the EWR in the period of LF where MMF is lower than 40% of MAF. IF is classified at MMF higher or equal to 40% MAF, and higher than 80% of MAF, then the amount of EWR is equivalent 45% of MMF.
With regard to influence of flow variation on the freshwater ecosystem, a small area available for aquatic habitat during the low flow period may lead to a higher stress on the aquatic ecosystems as compared to the high flow period. Accounting for EWR from 30% to 60% of MMF is defined as a fair condition for river ecosystem corresponding with Smakhtin et al. [35]. The VMF method indicates EWR during the low flow period at 60% of MMF which is consistent with the habitat requirements of fishes. Due to differences of water policy, ecological condition, and river functions, the thresholds of this method are allowed to be adjusted [34]. As a result, the VMF method is applied for calculating the monthly EWR for 25 watersheds of Thailand based on historical monthly rainfall data during 2000–2011.
2.2. Alternative Energy Development Plan (AEDP) 2015
To achieve the biofuel targets at 14 ML/day of biodiesel and 11.3 ML/day of bioethanol, potential feedstocks for biodiesel and bioethanol are evaluated also considering other demands, such as food, export, etc. This is to balance crop demands for food and fuel production. Accordingly, the potential of oil palm as a feedstock for biodiesel production is assessed based on the strategy of oil palm and palm oil for 12 years (2014–2026), the suitable area for oil palm plantation recommended by MOAC, and the remainder of domestic consumption. Potentials of sugarcane and cassava as feedstocks for bioethanol production are also similarly assessed. The targeted plantations of cassava and sugarcane in potential areas are supposed to be completed by 2026; therefore, production molasses from sugar factories and cassava will be stable until 2036 while an increase of domestic consumption continues at the same rate [8,9]. The results of these two assessments are presented in Tables S1 and S2 of the Supplementary Information. Thus, water scarcity footprint assessment of agrofuel feedstocks cultivation is based on the information in these tables. Target of plantation and production of oil palm (Table S1) are taken into consideration in case of biodiesel. For bioethanol from cassava and sugarcane, plantation target, crop production, and the part of these two crops for ethanol production (Table S2) are accounted for in the calculation.
2.2.1. Scenario Analysis
The results of Thailand’s monthly WSIe(VMF),THA are applied for assessing the water scarcity footprint of agrofuel feedstocks cultivation due to the biofuel targets. Achieving the plantation targets of the biofuel plans is considered in terms of expansion and displacement of land based on recommended areas for plantation by MOAC [36].
Total oil palm plantations in 2015 were reported to be approximately 0.75 million ha (4.7 million rai) distributed over 85% in the south, 6% in the east, 4% in the center, 3% in the northeast, and 2% in the north [37]. Thus, the plantation target of biodiesel in 2015 (Table S1) has been reached. To meet the remaining targets, a further increase of oil palm plantations is required from 0.05 to 0.43 million ha during 2017–2036. The area of plantations is based on land suitability for oil palm plantations recommended by MOAC, including 26 provinces (Table S3) in the south, east, and center. Based on the land suitability recommendations, abandoned lands and para rubber displacement are taken into consideration. The displacement of para rubber with oil palm has been promoted by both the Office of the Rubber Replanting Aid Fund and the Rubber Authority of Thailand [38,39]. About 1.55 million ha of total abandoned lands in the whole country were reported in 2013 with 15% in the south, 14% in the center, and 9% in the east.
In case of sugarcane, the Office of the Cane and Sugar Board reported an increase of sugarcane plantation from displacement of cassava, maize, and pineapple plantations [40]. Pineapple plantations have decreased since 2012 due to replacement by cassava and sugarcane [41]. Land expansion of oil palm (biodiesel) is considered based on expansion to abandoned lands (abandoned paddy fields and abandoned field crops), and para rubber displacement. The abandoned land is taken into account according to classification of land utilization by the Land Development Department (LDD) [42]. Expansion of sugarcane (for bioethanol) is through displacement of cassava, maize, and pineapple, whereas that of cassava is through maize and pineapple displacement. In addition, areas recommended by MOAC for oil palm, para rubber, cassava, sugarcane, maize, and pineapple are taken into account as the summarized recommended areas by province in Table S3 of the Supplementary Information [36].
To calculate the value of the water scarcity footprint for each case based on Equation (2), the amount of irrigation water is obtained from the difference between crop water requirement (CWR) and the estimated amount of rainwater that is directly available to use by the crop, known as the effective rainfall. Thus, the water scarcity footprint is assessed based on the amount of irrigation water required to satisfy the total CWR regardless of whether the crops are cultivated in the designated irrigation or non-irrigation areas. This assumption is made because additional water will be needed for crop plantations in the non-irrigation area to maintain a crop growth or to increase a crop yield.
2.2.2. Crop Water Requirement
Water in crop cultivation is considered in terms of CWR; rainfall and/or irrigation water are the major sources of water. The volume of water needed by a crop is considered as the amount of water required to meet the water loss from the crop field by soil evaporation and crop transpiration processes, termed as evapotranspiration (ETc)—this term is represented as the CWR. This study will quantify the CWR of each crop by using a basic approach: ETc = Kc × ET0 (Equation (3)). According to influences of climate conditions and crop variety on CWR, the reference crop evapotranspiration (ET0) and the crop coefficient (Kc) are developed to assess the ETc of any crop planted in any place and time.
Currently, the Kc values of major crops planted in Thailand and ET0 values by province are provided by RID and these two parameters are continuously revised and updated based on the meteorological data and agricultural policies. The latest ET0 data are computed based on statistical climatic data by province (1966–2011) using the Penman Monteith method. Thus, the monthly ET0 obtained is classified by provinces. Only the Kc values of sugarcane and maize are available at RID [43]. The Kc values of cassava and pineapple are obtained from Kwanyuen et al. [44] and Sajjapongse et al. [45]. For oil palm and rubber, the Kc values are taken from Allen et al. [46] and the Kc value at 1 for mature oil palm also corresponds to mature oil palm in Malaysia [47]. Kiadsom et al. [48] found that less water is required during the initial stages (0–3 years) of oil palm growth and this amount continuously increases when oil palm reaches the development stage. Additionally, this study showed that ET0 values estimated from climate data are mostly lower than the ET values obtained from a lysimeter experiment (percolation type). However, the ET0 based on the method of Penman Monteith provides the Kc values quite close to the results obtained from the experiment. The Kc values, as detailed in Table S4 of the Supplementary Information, applied in this study line up with several studies in Thailand and the Food and Agriculture Organization of the United Nations (FAO) reports [46,47,48,49,50].
Classification of plant growth in this study is based on four main stages, including initial, mid-, and late development according to Allen et al. [33]. The wet season, during May–October, and the dry season, during November–May, are accounted for in all regions except for the south, where wet and dry seasons start from mid-May to mid-February and mid-February to mid-May, respectively [51]. The periods just before and just after the wet season are recommended by the Department of Agricultural Extension (DOAE) for starting the planting of all crops. Cassava plantation in the dry season is possible for some soil types having a high proportion of sand [52]. In the case of sugarcane, the early wet season is recommended for cultivating in irrigation areas, and the late wet season is suggested for other areas [53]. However, sugarcane cultivation during December to April is possible for areas which are close to sources of water [54]. Cultivating maize is highly recommended in the wet season whether during late-March to early-June (the early of wet season) or from mid-July to mid-August (the late of wet season) [55]. Pineapple can be cultivated in both wet and dry seasons depending on the weather and economic conditions; however, during January to April is recommended by the Department of Agriculture (DOA) [56].
3. Results and Discussion
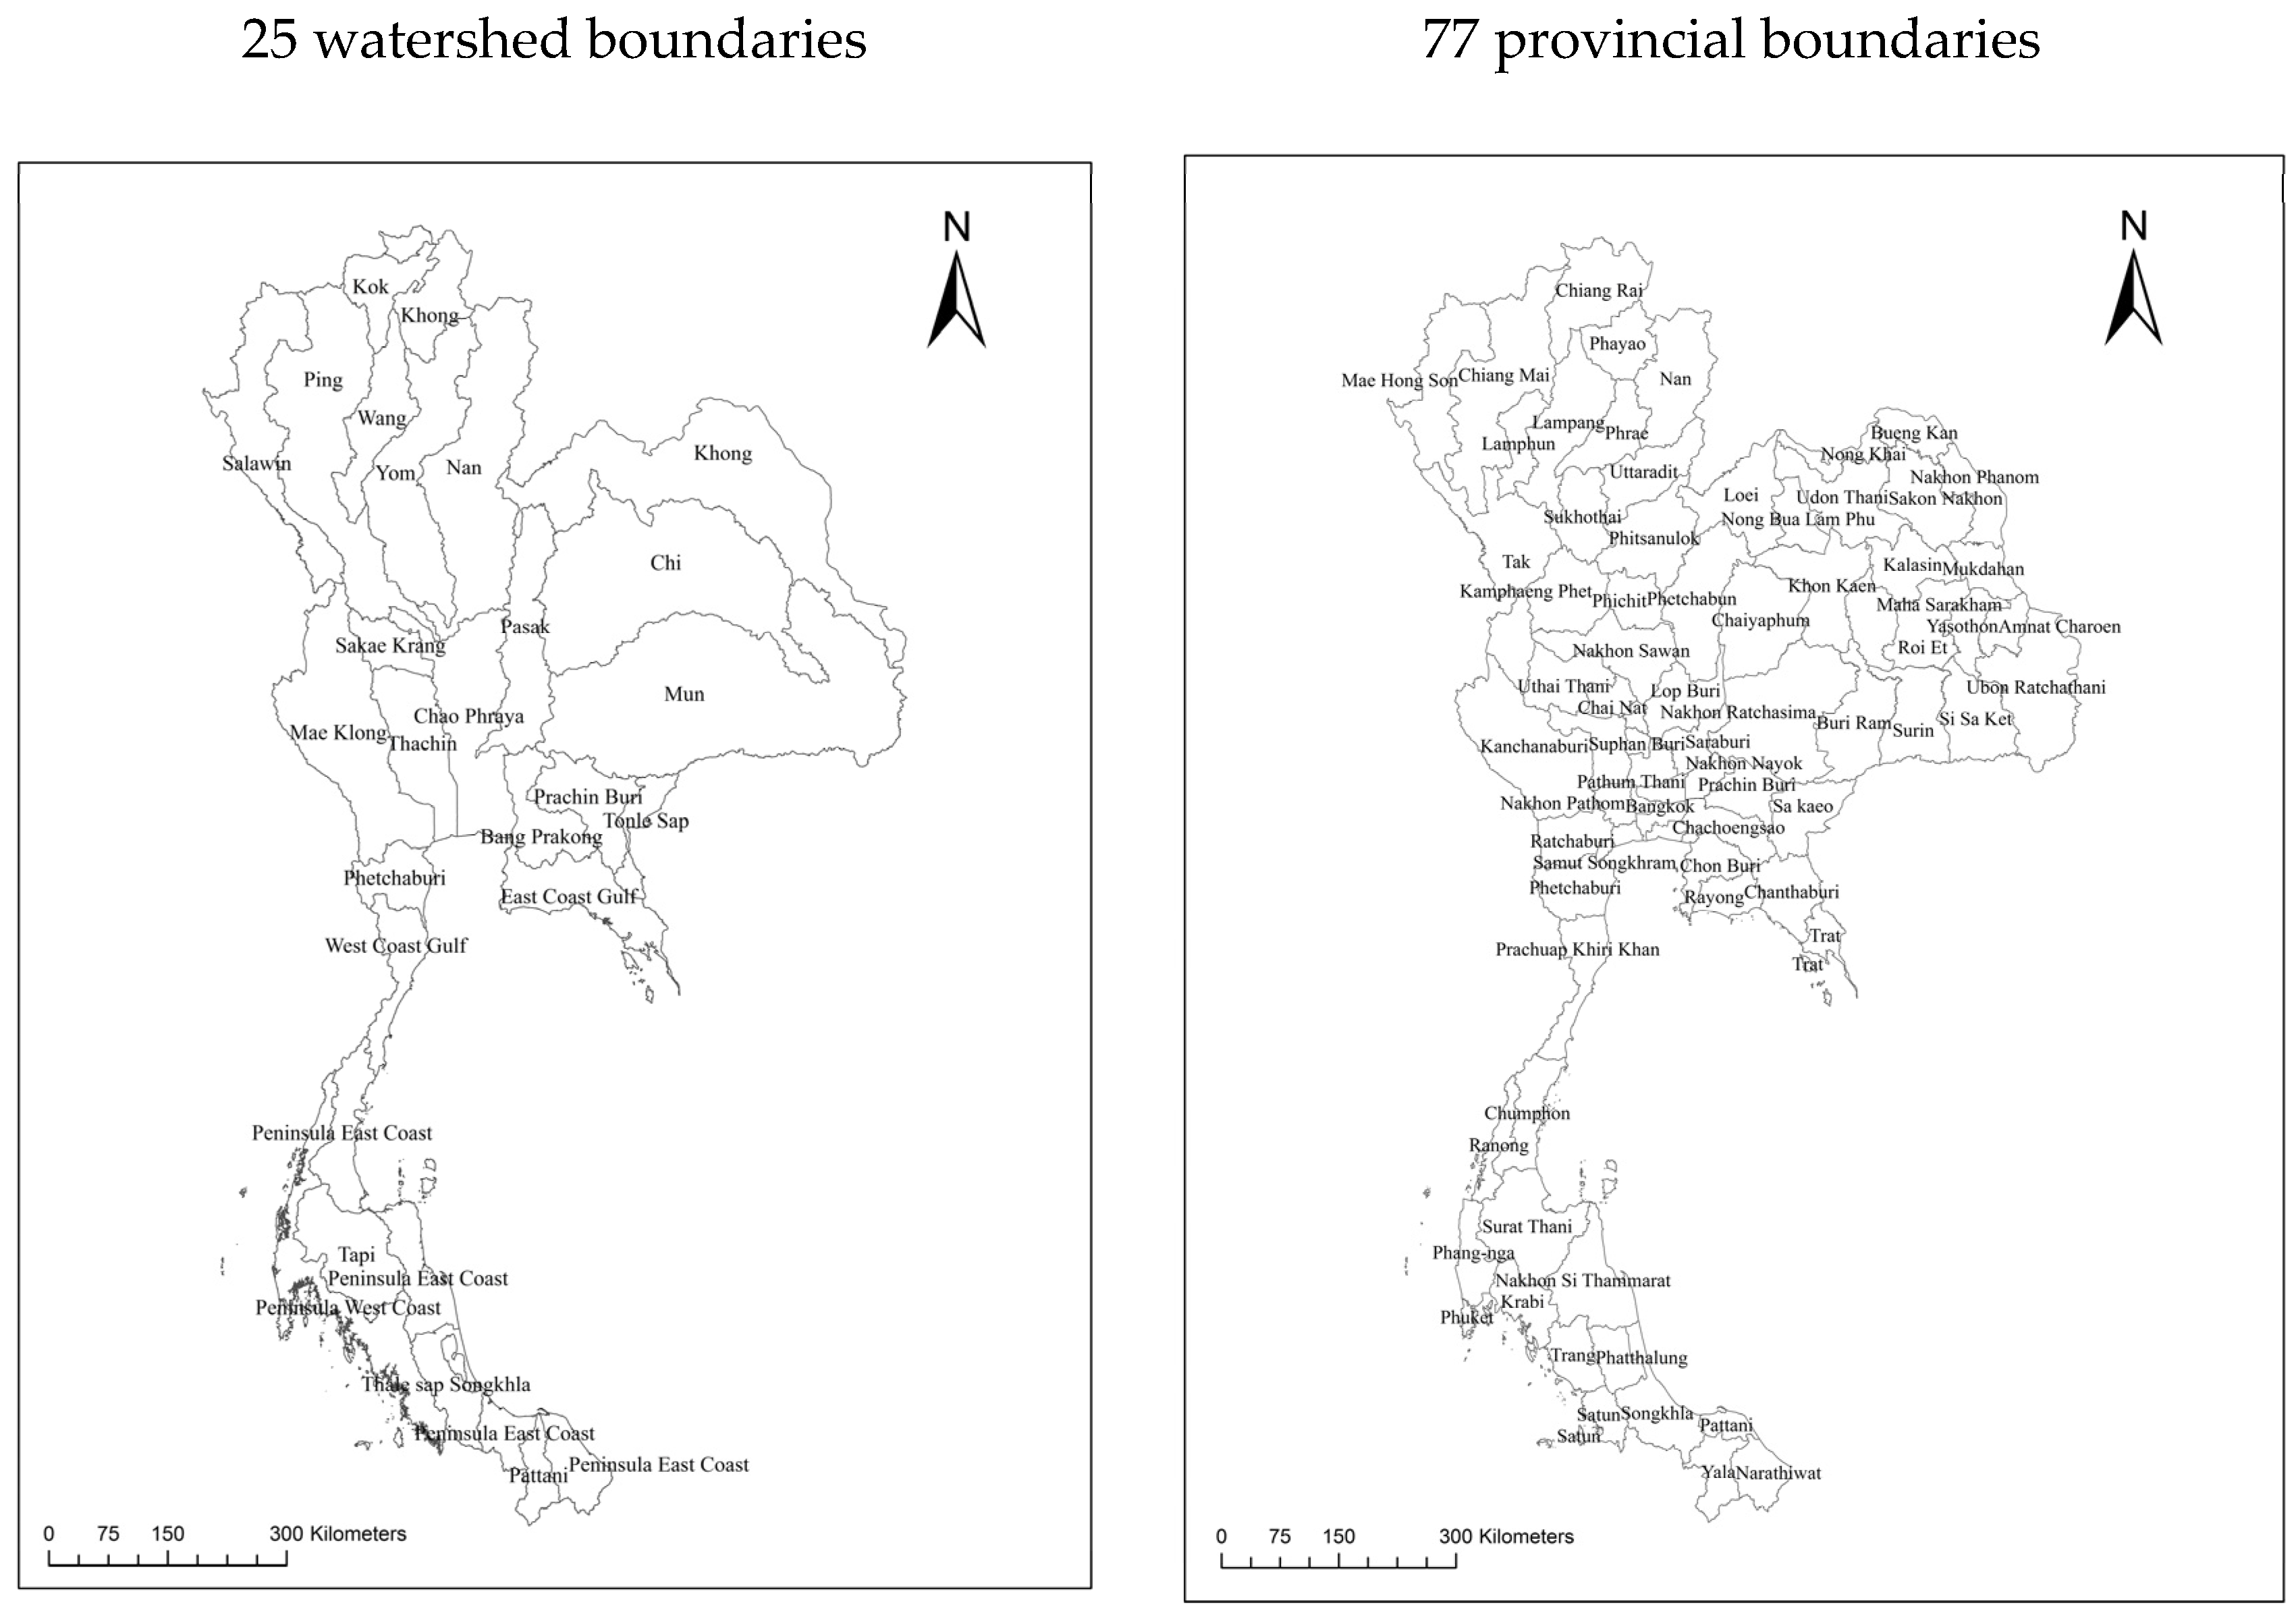
Implications on freshwater availability of the biofuel targets in the AEDP 2015 are assessed by means of the water scarcity footprint using the modified WSI. The hydrological (25 watersheds) and administrative (77 provinces) boundaries of Thailand are illustrated in Figure 1. EWR is estimated based on the VMF method and taken into account in the withdrawal part of the modified WSI. Then the monthly WSI for 25 watersheds is determined and further applied for characterizing different levels of deprivation potential.
3.1. Thailand’s Monthly WSI with Reference to EWR by the VMF Method (Monthly WSIe(VMF),THA)
The monthly results based on Equation (1) in Table 2 revealed that Chao Phraya and Thachin are the two critical watersheds having a stress situation during the dry season, especially extreme stress in January and February. In addition, a severe stress situation in January is found in the Bang Pakong watershed. In the same month, the Prachin Buri and Yom watersheds encounter stress at moderate and severe levels, respectively. Hence, January and Chao Phraya seem to be the most critical month and watershed for the stress situation. In addition, watersheds under ‘watch’ and ‘warning’ areas are visible during the dry season, including Kok, Sakae Krang, Pasak, Phetchaburi, West Coast Gulf, East Coast Gulf, and Peninsula East Coast (Table 2). Most of them are located in the central region. This is because the water demand is larger than water availability in that particular month.
The monthly WSIe results in Table 2 are calculated based on the monthly EWR. Regarding the classifications of the VMF method, all regions, except the south, showed that the high flow period (MMF ≥ 80% of MAF) occurs in May to October and the low flow period (MMF < 40% of MAF) from November to April. The period of high flow in the south is longer than the other regions, being from May to December. The study of Lim et al. [57] reported that the high flow and low flow of Ping watershed are found during the wet and dry seasons. The study by Wattayakorn [58] in the Bang Pakong watershed indicated a period of low flows from December to May and high flows from June to November. The VMF method addresses seasonal changes in rainfall in terms of monthly flow variation. As a result, the monthly results of the estimated EWR revealed that April is the critical month, which is of serious concern when ecosystems can be potentially threatened and the potential risk associated with water stress increases.
Setting EWR at the minimum flow is the simplest level to safeguard a river system, though this may not necessarily be appropriate for all situations. In the case of Thailand, the EWR serves several purposes; therefore, a comprehensive assessment of the EWR is recommended by addressing natural flow variability. Thus, the VMF method, which accounts for the variation in flow, is applied in this study. To illustrate the obtained results and make them more accessible for practice, the seasonal ranges of estimated EWR are presented in Table 3. In summary, the low flow period occurring mainly in the dry season requires attention on the water scarcity and ecosystem under threat, especially for the case of Thailand. These issues seem to be getting worse in the dry season. Thus, appropriate water allocation and management plans are essential to address water scarcity and safeguard ecosystem. The monthly WSI with reference to EWR proposed as the screening indicator will provide information about current water uses and available water for water efficiency management planning.
3.2. Applying the Monthly WSIe to Assess Implications of the Energy Plan
The 2036 biofuel targets with a concern towards the potential impact on freshwater resource and its ecosystem are considered by means of water scarcity footprint using the monthly WSIe(VMF),THA in Table 2. In the case of biodiesel, the target is met by land expansion whereas in the case of bioethanol, through land displacement. The implications on freshwater use for these are elaborated in this section.
3.2.1. Land Expansion of Oil Palm (Biodiesel)
The calculation of CWR is related to the two factors, Kc and ET0. The same Kc values for perennial crops are applied for oil palm and para rubber. Thus, the monthly ET0 value reported by province is a significant factor affecting the results of monthly CWR. The ranges of ET0 by region are 2.58–5.50 in the North, 2.96–5.45 in the northeast, 2.90–5.47 in the center, 2.84–5.00 in the east, and 2.85–4.88 in the south. The CWR of oil palm and para rubber re quantified for each of the 26 provinces.
The results of the estimated monthly CWR for oil palm and para rubber are presented in Table 4. The monthly results showed no significant difference between the dry and wet seasons. The CWR of oil palm and para rubber in the central region is higher than the other two regions. The obtained results are presented based on area of plantation instead of crop yield because the amount of water requirement is applied to determine the severity of stress situation rather than the efficiency of water use.
As oil palm and para rubber are mainly cultivated in non-irrigation areas, rainfall is the only source of water which may or may not satisfy the total amount of CWR. As additional water (irrigation) is usually not applied, the potential impact on freshwater resources does not occur.
Watering in the dry season is recommended for oil palm plantation as the studies of Hongchotitanawadi and Wongsupaluk [59] showed that yield of oil palm plantation under only rain-fed conditions are significantly less than that with irrigation. According to Hongchotitanawadi and Wongsupaluk [59], crop production throughout the year increases by approximately 6.3 tonne/ha. Installing a drip irrigation system will cost around 40,000–44,000 THB/ha (1 USD = 33.5 THB) depending on the size of plantation and water resources [60]; therefore, the payback period is around 1.5–2 years assuming an FFB price of 4000 THB/tonne. Additionally, fertilizers can be applied through this type of irrigation [60]. Thus if additional water (for irrigation) is provided, the potential impact on freshwater resources must be considered. To fulfil total CWR of oil palm, the amount of irrigation water is calculated for each province as detailed in Table 5. The monthly results in Table 5 are represented as monthly irrigation water requirements for 1 ha of oil palm cultivated in each province. Irrigation is highly required in the dry season and this requirement starts to increase since November for provinces in the east and center, but not in the south.
The monthly WSIe(VMF),THA are applied as a characterization factor for assessing the water scarcity footprint of 26 provinces based on a watershed boundary. The results obtained are presented in Table 6. The first column shows the numbers of provinces recommended for plantation, and the numbers of related watersheds are displayed in the top row.
The results revealed that the most critical watersheds are Bang Pakong and Chao Phraya due to the largest amounts of additional water requirement. Other than these two critical watersheds, two watersheds in the east (Prachin Buri and East Coast Gulf) and the south (Peninsula West Coast and Peninsula East Coast) should also be looked at carefully. Hence, expansion of oil palm plantations into the center, especially Chao Phraya and Bang Pakong watersheds, should be avoided. The expansion could be supported in the East and the south, in particular on the abandoned field crops. Expansion into forestry area is illegal in Thailand. LDD [42] reports approximately 0.23 and 0.14 million ha of total abandoned lands in the east and south. Para rubber plantations in unsuitable areas are also suggested to be displaced. These areas include Ranong, Surat Thani, Nakhon Si Thammarat, Phatthalung, Krabi, and Phangnga, which are in Peninsula West Coast, Thale sap Songkhla, Tapi, and Peninsula East Coast. The most suitable areas having low values of water scarcity footprint are suggested in Tonle Sap (east), Tapi, and Pattani (south).
As mentioned at the beginning of this part on distribution of oil palm plantation over the country, the plantations are usually being expanded in areas that have been abandoned or have other crops (mainly rice) being planted. Thus, the current economic activity in the regions (not abandoned) is agriculture. Staple crops cultivated in the south and east are quite similar due to weather conditions; therefore, oil palm, as well as para rubber, are expanded to the east. On the other hand, in the center, rice and field crops are staple due to large areas under irrigation. The key factors motivating farmers on planting decision are market opportunity and farm resources [61,62]. The farmers will accept crop replacements if income generated by the changes is higher than for the crops that are already being cultivated, and their farming resources are applicable for that change. Accordingly, the economic activity may not be affected by banning palm plantation in areas that are deemed less suitable for palm because the farmers can continue to be engaged in growing their traditional crops. In fact, the farmer’s risk can be reduced by banning palm plantation in unsuitable areas. For example, the study of Wongwai and colleague [63] on oil palm cultivation management of farmer in the upper north revealed that a higher income and misunderstanding of oil palm characteristics (drought-tolerant and easy-to-care) are important factors for making a decision. Lack of water supply during the dry season, misapplication of fertilizer (high cost and lack of scientific knowledge on fertilizers), and mismanagement of oil palm plantations may result in lower yield. Thus, the farmers could not benefit from unsuitable areas along with mismanagement of oil palm plantation, though the perceived economic benefit was the motivation for the change to oil palm.
3.2.2. Situational Scenarios of Displacement for Sugarcane and Cassava (Bioethanol)
Total plantations of sugarcane and cassava are targeted at 2.56 and 1.36 million ha in 2026. Based on crop plantation area in 2015 [37], sugarcane needs around 0.81 million ha of additional plantations while the expansion of cassava plantations is not required. Cassava plantations were reported in 2015 at 1.49 million ha which is already over the target; therefore, the production plan of cassava focuses on increasing yield. In case of sugarcane, approximately 0.29, 0.24, and 0.28 million ha of the additional plantations are targeted for 2017, 2019, and 2026, respectively, based on the roadmap of MOAC [64].
The suitable areas recommended by MOAC for sugarcane, cassava, maize, and pineapple in the north, northeast, east, and center are taken into account. The results of estimated monthly CWR for these four crops are presented in Table 7.
Sugarcane shows the highest amount of monthly CWR as it has a longer crop cycle than the other crops. The growth cycle of maize is shorter than the other crops; however, the Kc values of maize are quite similar to those of cassava and higher than pineapple. Pineapple shows the smallest values of Kc. If these four crops will be planted in the same province, the monthly CWR of pineapple is less than that of maize and cassava. Furthermore, the center is found as the critical area because of the largest amounts of CWR for all crops revealed. This is because most of areas in the central region are under irrigation as compared with the other regions; therefore, total CWR is taken into account for quantifying total water for irrigated crops.
Plantations of sugarcane, cassava, maize, and pineapple in Thailand are found in both irrigation and non-irrigation areas. Additional water supply for plantations in non-irrigation areas is recommended for increasing crop yield [45,50,65,66]. Yield of sugarcane and cassava plantations under only rain-fed conditions are significantly less than those with irrigation. Based on the past 10 years of crop production data, cassava and sugarcane yields are approximately 21 and 66 tonne/ha; these yields are under rain-fed conditions and significantly less than that with irrigation. Applying drip irrigation significantly increases the yield of cassava and sugarcane to 44–56 tonne/ha and 113–125 tonne/ha, respectively [65,66]. About 5 kg of cassava and 4 kg of molasses are required to produce 1 L of ethanol. Therefore, the water productivities of ethanol from cassava and sugarcane cultivated in non-irrigation areas are 0.61 L of cassava-based ethanol/m3 of water and 0.98 L of molasses-based ethanol/m3 of water. As mentioned above, installing the irrigation system will increase crop yield and will consequently affect the water productivity. Supposing yields of cassava and sugarcane with irrigation are 44 and 113 tonne/ha [65,66], the water productivity of ethanol from cassava and molasses would be 1.03 and 0.72 L/m3, respectively.
Sugarcane requires very high amounts of irrigation water and the lowest amount of irrigation water is required by pineapple. The irrigation water requirement for cassava and maize are not much different. The requirement of irrigation water observed at Chao Phraya, Khong, Chi, Mun, and Thachin watersheds are 0.254, 0.247, 0.199, and 0.185 million m3/ha, respectively. The irrigation water requirement is used for assessing the water scarcity footprint, which is similar to the case of biodiesel. Water scarcity footprint results of sugarcane, cassava, maize, and pineapple are presented in relation to the suitable areas for establishing plantations. Thus, administrative and watershed boundaries are associated with the results obtained. The results of each crop shown in Tables S5–S8 in the Supplementary Information are classified based on regions including north, north-east, center, and east. These tables contain the results similar to Table 6.
The central region shows very high values of water scarcity footprint for all crops, as a result the displacement should not be supported in this region, especially in Chao Phraya and Thachin, due to the constraint in freshwater availability. Yom, Khong, Mun, and Bang Pakong watersheds should also not be considered because of high values of the water scarcity footprint in these watersheds. Although the irrigation water requirement of Bang Pakong is less than Chi watershed, the results of the water scarcity footprint obtained from Bang Pakong are higher. This is because the monthly WSIe(VMF),THA results during the dry season of Bang Pakong watershed are higher than Chi watershed. Additionally, the high results obtained are mainly found in the dry season especially during January to March for sugarcane and pineapple, and during November to January for cassava. Maize is found during April to June because of its growth cycle. Therefore, shifting the crop calendar could be considered to reduce stress situation especially in January. The results of water scarcity footprint revealed that the center has the largest possibility of facing a stress situation. By shifting the crop calendar of sugarcane from October to earlier in June, this critical region can avoid the water scarcity footprint of sugarcane by 38% (66,082 m3H2Oeq). Moreover, Ang Thong, a province in the center, relying on the Chao Phaya and Thachin watersheds, and having the highest water scarcity footprint value of sugarcane, can reduce it by 32% (7940 m3H2Oeq) by shifting the crop calendar.
To move forward with the bioethanol targeted in the AEDP 2015 based on reducing water stress could be achieved by selecting areas having low values of water scarcity footprint. The suitable watersheds showing low values of water scarcity footprint are recommended at Tonle Sap (east) and Ping (north). In addition, unsuitable land and low yield could be further considered for displacing plantation areas of maize, pineapple, and cassava with sugarcane. Cassava is suggested for displacement in the east and northeast. Maize is suggested for displacement by both sugarcane and cassava in the east followed by the north and the northeast. Similarly, pineapple is proposed for displacement in the north and east. Furthermore, using irrigation to increase crop production is recommended for both sugarcane and cassava plantations.
4. Conclusions
The potential impact on freshwater resources is determined in terms of water scarcity footprint using the monthly WSI with reference to EWR. This proposed approach is established based on all demands for, and availability of, water depending on the local context. A comprehensive approach for safeguarding local water resources is enabled by explicit incorporation of EWR. For the case of Thailand, the variable monthly flow approach is more suitable than the minimum flow for estimating EWR. Water stress to downstream users, as well as threats to ecosystem could be alleviated through applying the proposed approach, to determine priority areas of action for agricultural land suitability and water resource management. The results obtained will help confirm confidence in how much freshwater can be extracted sustainably without causing water competition between human activities and the environment (ecological system).
Consequently, including the proposed approach into the land suitability assessment based on the low water scarcity footprint helps to identify appropriate areas for agrofuel feedstock cultivation. Application to AEDP 2015 revealed that expansion of oil palm plantations to abandoned land is preferable; however, the expansion to the central region should be avoided. Low productivities of maize, pineapple and cassava could be considered for displacement by sugarcane as this will lead to a low possibility of facing a stress situation. Moreover, shifting the crop calendar could be considered to reduce the stress situation, especially in January. There may also be potential for greater use of water storage to enable the irrigation of crops in months of high water stress.
Supplementary Materials
The supplementary materials are available online at www.mdpi.com/2073-4441/9/12/919/s1. Table S1: Potential of palm oil for biodiesel production (2015–2036); Table S2: Potential of cassava and sugarcane (molasses) for bioethanol production (2015–2026); Table S3. Number of recommended provinces for economic crop plantations by MOAC; Table S4. Crop coefficient (Kc); Table S5. Water scarcity footprint results of sugarcane plantation in the north, north-east, east and center (by province) based on watershed boundary; Table S6. Water scarcity footprint results of cassava plantation in the North, North-East, East and Center regions (by province) based on watershed boundary; Table S7. Water scarcity footprint results of maize plantation in the North, North-East, East and Center (by province) based on watershed boundary; Table S8. Water scarcity footprint results of pineapple plantation in in the North, North-East, East and Center (by province) based on watershed boundary.
Acknowledgments
Financial support by the Joint Graduate School of Energy and Environment (JGSEE) and the Thailand Research Fund under the Royal Golden Jubilee Ph.D. program (grant PHD/0028/2555) is gratefully acknowledged. This research has been carried out under the project “Research Network for LCA and Policy on Food, Fuel and Climate Change” supported by the National Science and Technology Development Agency, Thailand.
Author Contributions
The text of this article was written by Pariyapat Nilsalab and Shabbir H. Gheewala. Data collection was done by Pariyapat Nilsalab; data analysis and interpretation were performed by Pariyapat Nilsalab and Shabbir H. Gheewala.
Conflicts of Interest
The authors declare no conflict of interest.
References
- Iglesias, A.; Garrote, L.; Flores, F.; Moneo, M. Challenges to manage the risk of water scarcity and climate change in the Mediterranean. Water Resour. Manag. 2007, 21, 227–288. [Google Scholar] [CrossRef]
- Jiang, Y. China’s water scarcity. J. Environ. Manag. 2009, 90, 3185–3196. [Google Scholar] [CrossRef] [PubMed]
- Hedden, S.; Cilliers, J. Parched Prospects: The Emerging Water Crisis in South Africa; African Future Paper 11; Institute for Security Studies: Pretoria, South Africa, 2014. [Google Scholar]
- Food and Agriculture Organization of the United Nations (FAO). Coping with Water Scarcity: An Action Framework for Agriculture and Food Security; FAO Water Reports 38; FAO: Rome, Italy, 2012; ISBN 978-92-5-107304-9. [Google Scholar]
- UNESCO-WWAP. Managing Water under Uncertainty and Risk; Facts and Figures from the United Nations World Water Development Report 4; The United Nations World Water Assessment Programme (UNESCO-WWAP): Paris, France, 2012. [Google Scholar]
- Department of Agricultural Extension (DOAE). Land Use for Agriculture 2016. Ministry of Agriculture and Cooperatives. Available online: http://www.agriinfo.doae.go.th/year59/general/land/land59.pdf (accessed on 24 April 2017).
- Royal Irrigation Department (RID). Annual Report 2016. Ministry of Agriculture and Cooperatives. Available online: http://www.rid.go.th/2009/_data/docs/59/RID-Annual%20Report(2559)(24M).pdf (accessed on 17 September 2017).
- Department of Alternative Energy Development and Efficiency (DEDE). Alternative Energy Development Plan: AEDP2015. Ministry of Energy. Available online: http://www.dede.go.th/download/files/AEDP2015_Final_version.pdf (accessed on 14 July 2016).
- Energy Policy and Planning Office (EPPO). Thailand Integrated Energy Blueprint. EPPO Journal: Special Issue 2016. Ministry of Energy. Available online: http://www.eppo.go.th/images/Infromation_service/journalissue/ISSUE-SPECIAL2559.pdf (accessed on 14 July 2016).
- Hanasaki, N.; Kanae, S.; Oki, T.; Masuda, K.; Motoya, K.; Shirakawa, N.; Shen, Y.; Tanaka, K. An integrated model for the assessment of global water resources—Part 2: Applications and assessments. Hydrol. Earth Syst. Sci. 2008, 12, 1027–1037. [Google Scholar] [CrossRef]
- Oki, T.; Agata, Y.; Kanae, S.; Saruhashi, T.; Yang, D.; Musiake, K. Global assessment of current water resources using total runoff integrating pathways. Hydrol. Sci. J. 2001, 46, 983–995. [Google Scholar] [CrossRef]
- Hoekstra, A.Y.; Mekonnen, M.M.; Chapagain, A.K.; Mathews, R.E.; Richter, B.D. Global monthly water scarcity: Blue water footprints versus blue water availability. PLoS ONE 2012, 7, e32688. [Google Scholar] [CrossRef] [PubMed]
- Mekonnen, M.M.; Hoekstra, A.Y. Four billion people facing severe water scarcity. Sci. Adv. 2016, 2, e1500323. [Google Scholar] [CrossRef] [PubMed]
- Wada, Y.; van Beek, L.P.H.; Viviroli, D.; Dürr, H.H.; Weingartner, R.; Bierkens, M.F.P. Global monthly water stress: 2. Water demand and severity of water stress. Water Resour. Res. 2011, 47, W07518. [Google Scholar] [CrossRef]
- Oki, T.; Kanae, S. Global Hydrological Cycles and World Water Resources. Science 2006, 313, 1068–1072. [Google Scholar] [CrossRef] [PubMed]
- Vörösmarty, C.J.; Green, P.; Salisbury, J.; Lammers, R.B. Global Water Resources: Vulnerability from Climate Change and Population Growth. Science 2000, 289, 284–288. [Google Scholar] [CrossRef] [PubMed]
- Wada, Y.; van Beek, L.P.H.; Bierkens, M.F.P. Modelling global water stress of the recent past: On the relative importance of trends in water demand and climate variability. Hydrol. Earth Syst. Sci. 2011, 15, 3785–3808. [Google Scholar] [CrossRef] [Green Version]
- Wada, Y.; de Graaf, I.E.M.; van Beek, L.P.H. High-resolution modeling of human and climate impacts on global water resources. J. Adv. Model. Earth Syst. 2016, 8, 735–763. [Google Scholar] [CrossRef] [Green Version]
- International Organization for Standardization (ISO). ISO 14046:2014—Environmental Management—Water Footprint-Principles, Requirements and Guidelines; ISO: Saint-Denis, France, 2014. [Google Scholar]
- International Organization for Standardization (ISO). ISO/TR 14073:2017—Environmental Management—Water Footprint-Illustrative Examples on How to Apply ISO 14046; ISO: Saint-Denis, France, 2017. [Google Scholar]
- Yano, S.; Hanasaki, N.; Itsubo, N.; Oki, T. Water scarcity footprints by considering the differences in water sources. Sustainability 2015, 7, 9753–9772. [Google Scholar] [CrossRef]
- Boulay, A.M.; Bulle, C.; Bayart, J.B.; Deshenes, L.; Manuele, M. Regional characterization of freshwater use in LCA: Modeling direct impacts on human health. Environ. Sci. Technol. 2011, 45, 8948–8957. [Google Scholar] [CrossRef] [PubMed]
- Pfister, S.; Koehler, A.; Hellweg, S. Assessing the environmental impacts of freshwater consumption in LCA. Environ. Sci. Technol. 2009, 43, 4098–4104. [Google Scholar] [CrossRef] [PubMed]
- Boulay, A.-M.; Bare, J.; Benini, L.; Berger, M.; Klemmayer, I.; Lathuilliere, M.; Loubet, P.; Manzardo, A.; Margni, M.; Nunez, M.; et al. Building consensus on a generic water scarcity indicator for LCA-based water footprint: Preliminary results from WULCA. In Proceedings of the 9th International Conference LCA of Food, San Francisco, CA, USA, 8–10 October 2014. [Google Scholar]
- Pfister, S.; Bare, J.; Benini, L.; Berger, M.; Bulle, C.; Lathuilliere, M.; Manzardo, A.; Margni, M.; Motoshita, M.; Nunez, M.; et al. Outcome of WULCA harmonization activities: Recommended characterization factors for water footprinting. In Proceedings of the International Conference on Life Cycle Assessment as Reference Methodology for Assessing Supply Chains and Supporting Global Sustainability Challenges, LCA for “Feeding the Planet and Energy for Life”, Stresa, Italy, 6–7 October 2015. [Google Scholar]
- Pfister, S.; Boulay, A.-M.; Berger, M.; Hadjikakou, M.; Motoshita, M.; Hess, T.; Ridoutt, B.; Weinzettel, J.; Scherer, L.; Doll, P.; et al. Understanding the LCA and ISO water footprint: A response to Hoekstra (2016) “A critique on the water-scarcity weighted water footprint in LCA”. Ecol. Indic. 2017, 72, 352–359. [Google Scholar] [CrossRef]
- Nilsalab, P.; Gheewala, S.H.; Silalertruksa, T. Methodology development for including environmental water requirement in the water stress index considering the case of Thailand. J. Clean. Prod. 2017, 167, 1002–1008. [Google Scholar] [CrossRef]
- Gheewala, S.H.; Silalertusksa, T.; Nilsalab, P.; Mungkung, R.; Perret, S.R.; Chaiyawannakarn, N. Implications of the biofuels policy mandate in Thailand on water: The case of bioethanol. Bioresour. Technol. 2013, 150, 457–465. [Google Scholar] [CrossRef] [PubMed]
- Gheewala, S.H.; Silalertusksa, T.; Nilsalab, P.; Mungkung, R.; Perret, S.R.; Chaiyawannakarn, N. Water Footprint and Impact of Water Consumption for Food, Feed, Fuel Crops Production in Thailand. Water 2014, 6, 1698–1718. [Google Scholar] [CrossRef] [Green Version]
- Gheewala, S.H.; Silalertusksa, T.; Nilsalab, P.; Lecksiwilai, N.; Sawaengsak, W.; Mungkung, R.; Ganasut, J. Water stress index and its implication for agricultural land-use policy in Thailand. Int. J. Environ. Sci. Technol. 2017. [Google Scholar] [CrossRef]
- Pfister, S.; Bayer, P. Monthly water stress: Spatially and temporally explicit consumptive water footprint of global crop production. J. Clean. Prod. 2013. [Google Scholar] [CrossRef]
- Ridoutt, B.G.; Pfister, S. A revised approach to water footprinting to make transparent the impacts of consumption and production on global freshwater scarcity. Glob. Environ. Chang. 2010, 20, 113–120. [Google Scholar] [CrossRef]
- Royal Irrigation Department (RID). Work Manual No. 8/16: Assessing Water Consumption by Sectors. Ministry of Agriculture and Cooperatives. Available online: http://ridceo.rid.go.th/buriram/download/manual-08.pdf (accessed on 17 October 2012).
- Pastor, A.V.; Ludwig, F.; Biemans, H.; Hoff, H.; Kabat, P. Accounting for environmental flow requirements in global water assessment. Hydrol. Earth Syst. Sci. 2014, 18, 5041–5059. [Google Scholar] [CrossRef] [Green Version]
- Smakhtin, V.; Revenga, C.; Döll, P. Taking into Account Environmental Water Requirements in Global-Scale Water Resources Assessments; Comprehensive Assessment Research Report 2; Comprehensive Assessment Secretariat: Colombo, Sri Lanka, 2004. [Google Scholar]
- Ministry of Agriculture and Cooperatives (MOAC). Suitable Areas for Planting Rice, Cassava, Para Rubber, Oil Palm, Sugarcane, and Maize 2013. Available online: http://www.moac.go.th/download/zoning/zoning_plant01.pdf (accessed on 12 July 2013).
- Office of Agricultural Economics (OAE). Utilization of GPP Data of Crops for Agriculture: Maize, Cassava, Sugarcane, and Para Rubber in 2015. Ministry of Agriculture and Cooperatives. Available online: http://www.oae.go.th/ewt_news.php?nid=19705&filename=news (accessed on 27 July 2017).
- Rubber Intelligence Unit. ORRAF Hastens to Displace Para Rubber with Oil Palm (1 August 2014). Plastics Institute of Thailand. Available online: http://rubber.oie.go.th/Article.aspx?aid=21101 (accessed on 24 April 2017).
- Rubber Intelligence Unit. RAOT Supports Thai Government Policy (29 December 2016). Plastics Institute of Thailand. Available online: http://rubber.oie.go.th/Article.aspx?aid=47938 (accessed on 24 April 2017).
- Office of the Cane and Sugar Board (OCSB). Sugarcane Plantations (Production Year 2015/2016). Ministry of Agriculture and Cooperatives. Available online: http://www.ocsb.go.th/upload/OCSBActivity/fileupload/8071-2689.pdf (accessed on 28 April 2017).
- Department of Agricultural Extension (DOAE). Pineapple Situation in 2014. Ministry of Agriculture and Cooperatives. Available online: http://www.agriman.doae.go.th/home/picture1/picture1_1/2172_ply.pdf (accessed on 28 April 2017).
- Land Development Department (LDD). Summary of Land Utilization in Thailand (Year 2010/2013). Ministry of Agriculture and Cooperatives. Available online: http://www.ldd.go.th/web_OLP/result/luse_result53-56.htm (accessed on 21 September 2016).
- Royal Irrigation Department (RID). Crop Coefficient of 40 Varieties. Ministry of Agriculture and Cooperatives. Available online: http://water.rid.go.th/hwm/cropwater/CWRdata/Kc/kc_th.pdf (accessed on 17 October 2012).
- Kwanyuen, B.; Numkhang, P.; Phuthongsook, W.; Tonwiboonsak, S. The Study of Cassava’s Crop Coefficient (Kc). In Proceedings of the 11th Thai Society of Agricultural Engineering International Conference, Bangkok, Thailand, 5–6 May 2010. [Google Scholar]
- Sajjapongse, C.; Chuenrung, J.; Srisathit, R.; Uraiphong, B.; Pansaita, R. The Effects of Fertilization Methods and Mulching Materials on Yield of Pineapple for Fresh Consumption under Different Irrigation Treatments. Department of Agriculture. Available online: http://www.doa.go.th/research/attachment.php?aid=663 (accessed on 14 July 2016).
- Allen, R.G.; Pereira, L.S.; Raes, D.; Smith, M. Crop Evapotranspiration—Guidelines for Computing Crop Water Requirements; FAO Irrigation and Drainage Paper 56; Food and Agriculture Organization of the United Nations: Rome, Italy, 1998. [Google Scholar]
- Arshad, A.M. Crop evapotranspiration and crop water requirement of oil palm in Peninsular Malaysia. J. Biol. Agric. Healthc. 2014, 4, 23–28. [Google Scholar]
- Kiadsom, O.; Trakulapisit, S.; Putame, V.; Charoonsak, S.; Prakuhunsit, S. A Trial on Water Requirements for Oil Palm Tenera Variety (3th Year). Irrigation Water Management Division, Royal Irrigation Department, Ministry of Agriculture and Cooperatives. Available online: http://kmcenter.rid.go.th/kmc15/mainsite/images/Research/wm05.pdf (accessed on 14 July 2016).
- Seewiseng, L.; Bhaktikul, K.; Aroonlertaree, C.; Suaedee, W. The water footprint of oil palm crop in Phetchaburi province. Int. J. Renew. Energy 2012, 7, 49–54. [Google Scholar]
- Paisancharoen, K.; Sansayawichai, T.; Luanmanee, S.; Thippayarugs, S.; Chusorn, K.; Chuenrung, J.; Pakdeethai, C. Water requirement and Kc values of Khon Kaen 3 sugarcane variety. Khon Kaen Agric. J. 2012, 40, 103–114. [Google Scholar]
- Department of Agricultural Extension (DOAE). Manual for Data Collection and Report of Crop Production at Sub-District Level. Ministry of Agriculture and Cooperatives. Available online: http://production.doae.go.th/download/manual_stat_production_2011.doc (accessed on 15 September 2016).
- Department of Agricultural Extension (DOAE). Cassava Production 2013. Ministry of Agriculture and Cooperatives. Available online: http://esc.agritech.doae.go.th/ebooks/download-pdf/munsumphalung1.pdf (accessed on 15 September 2016).
- Department of Agricultural Extension (DOAE). Sugarcane Cultivation 2009. Ministry of Agriculture and Cooperatives. Available online: http://esc.agritech.doae.go.th/ebooks/download-pdf/Sugar%20cane.pdf (accessed on 15 September 2016).
- Tinnangwattana, T.; Tinnangwattana, T. Sugarcane Plantation. Office of the Cane and Sugar Board, Ministry of Industry. Available online: http://oldweb.ocsb.go.th/udon/All%20text/1.Article/01-Article%20Index.htm (accessed on 15 September 2016).
- Department of Agricultural Extension (DOAE). Maize. Ministry of Agriculture and Cooperatives. Available online: http://esc.agritech.doae.go.th/ebooks/download-pdf/corn.pdf (accessed on 15 September 2016).
- Department of Agriculture (DOA). Manual of Horticultural Plants Propagation. Ministry of Agriculture and Cooperatives. Available online: http://www.doa.go.th/hort/download/propagatehortplant.pdf (accessed on 15 September 2016).
- Lim, H.S.; Boochabun, K.; Ziegler, A.D. Modifiers and amplifiers of high and low flows on the Ping River in Northern Thailand (1921–2009): The roles of climatic events and anthropogenic activity. Water Resour. Manag. 2012, 26, 4203–4224. [Google Scholar] [CrossRef]
- Wattayakorn, G. Bangpakong River Estuary, 2006, LOICZ-Biogeochemical Modelling Node. Available online: http://nest.su.se/mnode/Asia/Thailand/Bangpakong/bpbud.htm (accessed on 14 July 2016).
- Hongchotitanawadi, T.; Wongsupaluk, N. Effect of Irrigation More Suitable for the Growth and Productivity of Oil Palm Varieties Suratthanee 2 at Irrigation Water Management Research Station 8 Nakhonsithammarat Province (February 2016). Irrigation Water Management Division, Royal Irrigation Department. Available online: http://water.rid.go.th/hwm/cropwater/iwmd/omdirrw/paper/paper003.pdf (accessed on 14 July 2016).
- Sadaothong, A. Investment and strategy for watering system in oil palm plantation. Energy Crop. 2013, 59, 16–20. [Google Scholar]
- Chainuvati, C.; Athipanan, W. Crop diversification in Thailand. In Crop Diversification in the Asia-Pacific Region; RAP Publicationline: 2000/14; Food and Agriculture Organization of the United Nations, Regional Office for Asia and the Pacific: Bangkok, Thailand, 2001. [Google Scholar]
- Satsue, P.; Phitthayaphinant, P. Farmer’s decision on Paddy field under oil palm planation in Krasaesin District, Songkhla province. SKRU Acad. J. 2015, 8, 81–96. [Google Scholar]
- Wongwai, W.; Yotharath, S.; Jaithoeng, A.; Phanchaisri, K.; Bumpenyoo, W.; Keawsrida, W.; Choengaksorn, C.; Chaimongkol, N. Study on Oil Palm Cultivation Management of Farmer in the Upper North. Department of Agriculture, Ministry of Agriculture and Cooperatives. Available online: http://www.doa.go.th/research/attachment.php?aid=2509 (accessed on 5 October 2017).
- Thaiyotin, P. Development of a Balance Sheet for Agricultural Products by Office of Agricultural Economics (OAE): Sugarcane. Available online: http://www.oae.go.th/ewt_news.php?nid=19705&filename=news (accessed on 27 July 2017).
- Wonprasaid, S.; Girdthai, T. Soil and Water Management for Ratoon Yield Improvement of Sugarcane in the Northeast. Available online: http://sutir.sut.ac.th:8080/sutir/bitstream/123456789/5869/2/Fulltext.pdf (accessed on 27 July 2017).
- Kamlueprook, K. Cassava, Drip Irrigation, Reduction of Cost, and Increase of Productivity. Available online: http://phakhao.loei.doae.go.th/site/?p=3581 (accessed on 27 July 2017).
Figure 1.
Hydrological and administrative boundaries of Thailand.


Table 1.
Classifications of WSI with reference to EWR as a part of the water withdrawal (WSIe).
| WTAe | WSIe | Definition |
|---|---|---|
| 0 < WTAe ≤ 0.4 | 0 < WSIe ≤ 0.12 | No stress |
| 0.4 < WTAe ≤ 0.7 | 0.12 < WSIe ≤ 0.40 | Watch |
| 0.7 < WTAe ≤ 1 | 0.40 < WSIe ≤ 1 | Warning |
| 1 < WTAe ≤ 1.4 | 1 < WSIe ≤ 1.72 | Stress |
| 1.4 < WTAe ≤ 1.6 | 1.72 < WSIe ≤ 1.88 | Severe |
| 1.6 < WTAe ≤ 2 | 1.88 < WSIe ≤ 2 | Extreme |
Table 2.
Thailand’s monthly water stress index with respect to environmental water requirement of the variable monthly flow (monthly WSIe(VMF),THA).
Table 2.
Thailand’s monthly water stress index with respect to environmental water requirement of the variable monthly flow (monthly WSIe(VMF),THA).
| Watershed | January | February | March | April | May | June | July | August | September | October | November | December |
|---|---|---|---|---|---|---|---|---|---|---|---|---|
| Salawin | 0.31 | 0.40 | 0.27 | 0.25 | 0.07 | 0.08 | 0.08 | 0.08 | 0.08 | 0.08 | 0.25 | 0.28 |
| Kok | 0.55 | 0.48 | 0.47 | 0.26 | 0.08 | 0.12 | 0.11 | 0.11 | 0.11 | 0.09 | 0.24 | 0.28 |
| Ping | 0.07 | 0.06 | 0.11 | 0.14 | 0.07 | 0.08 | 0.09 | 0.09 | 0.09 | 0.07 | 0.11 | 0.07 |
| Wang | 0.30 | 0.28 | 0.28 | 0.28 | 0.08 | 0.10 | 0.11 | 0.10 | 0.10 | 0.09 | 0.25 | 0.23 |
| Yom | 1.53 | 1.63 | 1.02 | 0.33 | 0.09 | 0.19 | 0.23 | 0.19 | 0.17 | 0.11 | 0.32 | 0.40 |
| Nan | 0.14 | 0.15 | 0.26 | 0.19 | 0.07 | 0.12 | 0.14 | 0.13 | 0.13 | 0.08 | 0.10 | 0.08 |
| Khong | 0.36 | 0.46 | 0.40 | 0.36 | 0.10 | 0.18 | 0.17 | 0.15 | 0.17 | 0.12 | 0.28 | 0.27 |
| Chi | 0.28 | 0.29 | 0.27 | 0.28 | 0.09 | 0.23 | 0.29 | 0.22 | 0.23 | 0.10 | 0.16 | 0.12 |
| Mun | 0.34 | 0.44 | 0.29 | 0.32 | 0.09 | 0.30 | 0.29 | 0.28 | 0.25 | 0.10 | 0.18 | 0.17 |
| Chao Phraya | 2.00 | 1.99 | 1.76 | 0.55 | 0.13 | 0.40 | 0.73 | 0.67 | 0.29 | 0.15 | 0.85 | 1.64 |
| Sakae Krang | 0.78 | 0.46 | 0.55 | 0.42 | 0.12 | 0.21 | 0.36 | 0.51 | 0.32 | 0.14 | 0.40 | 0.35 |
| Pasak | 0.97 | 0.67 | 0.45 | 0.32 | 0.10 | 0.15 | 0.24 | 0.21 | 0.20 | 0.14 | 0.30 | 0.32 |
| Thachin | 2.00 | 1.83 | 1.42 | 0.41 | 0.11 | 0.34 | 0.54 | 0.60 | 0.28 | 0.12 | 0.43 | 1.01 |
| Mae Klong | 0.04 | 0.06 | 0.09 | 0.10 | 0.06 | 0.07 | 0.08 | 0.08 | 0.08 | 0.06 | 0.05 | 0.04 |
| Petchaburi | 0.47 | 0.97 | 0.41 | 0.21 | 0.08 | 0.11 | 0.14 | 0.15 | 0.11 | 0.08 | 0.18 | 0.18 |
| West Coast Gulf | 0.56 | 0.58 | 0.69 | 0.40 | 0.13 | 0.19 | 0.22 | 0.19 | 0.12 | 0.12 | 0.25 | 0.40 |
| Prachin Buri | 1.03 | 0.60 | 0.43 | 0.32 | 0.09 | 0.14 | 0.14 | 0.14 | 0.12 | 0.10 | 0.28 | 0.44 |
| Bang Pakong | 1.83 | 1.15 | 0.76 | 0.47 | 0.14 | 0.26 | 0.39 | 0.48 | 0.22 | 0.17 | 0.78 | 1.37 |
| Thole Sap | 0.24 | 0.33 | 0.36 | 0.36 | 0.09 | 0.12 | 0.12 | 0.13 | 0.12 | 0.11 | 0.28 | 0.21 |
| East Coast Gulf | 0.30 | 0.57 | 0.55 | 0.51 | 0.10 | 0.10 | 0.09 | 0.10 | 0.10 | 0.11 | 0.38 | 0.33 |
| Peninsula East Coast | 0.50 | 0.51 | 0.46 | 0.75 | 0.16 | 0.21 | 0.18 | 0.23 | 0.18 | 0.12 | 0.10 | 0.10 |
| Tapi | 0.13 | 0.08 | 0.18 | 0.21 | 0.10 | 0.10 | 0.11 | 0.13 | 0.11 | 0.09 | 0.08 | 0.07 |
| Thale sap Songkhla | 0.35 | 0.39 | 0.34 | 0.59 | 0.16 | 0.16 | 0.13 | 0.20 | 0.15 | 0.11 | 0.09 | 0.09 |
| Pattani | 0.19 | 0.13 | 0.23 | 0.25 | 0.09 | 0.09 | 0.09 | 0.09 | 0.08 | 0.08 | 0.08 | 0.08 |
| Peninsula West Coast | 0.33 | 0.37 | 0.26 | 0.54 | 0.13 | 0.12 | 0.13 | 0.13 | 0.11 | 0.10 | 0.09 | 0.09 |
Table 3.
Environmental water requirement (million m3/month) based on the variable monthly flow method.
Table 3.
Environmental water requirement (million m3/month) based on the variable monthly flow method.
| Watershed | Wet (May–October) | Dry (November–April) | ||
|---|---|---|---|---|
| Min | Max | Min | Max | |
| Salawin | 817 | 1339 | 80 | 671 |
| Kok | 243 | 659 | 80 | 348 |
| Ping | 1375 | 2731 | 143 | 1408 |
| Wang | 342 | 797 | 73 | 517 |
| Yom | 957 | 2035 | 171 | 1268 |
| Nan | 1110 | 2930 | 292 | 1722 |
| Khong | 1807 | 5581 | 398 | 3065 |
| Chi | 1627 | 3911 | 259 | 2799 |
| Mun | 2807 | 5707 | 344 | 4149 |
| Chao Phraya | 905 | 1661 | 223 | 1026 |
| Sakae Krang | 193 | 304 | 74 | 265 |
| Pasak | 525 | 1118 | 179 | 851 |
| Thachin | 485 | 794 | 152 | 576 |
| Mae Klong | 1503 | 2001 | 169 | 1507 |
| Petchaburi | 147 | 504 | 39 | 189 |
| West Coast Gulf | 195 | 477 | 47 | 279 |
| Prachin Buri | 509 | 974 | 53 | 695 |
| Bang Pakong | 358 | 649 | 86 | 755 |
| Thole Sap | 259 | 420 | 30 | 301 |
| East Coast Gulf | 1086 | 2004 | 184 | 1110 |
| Peninsula East Coast | 1205 | 2169 | 695 | 3127 |
| Tapi | 621 | 1062 | 259 | 1406 |
| Thale sap Songkhla | 319 | 528 | 150 | 790 |
| Pattani | 164 | 334 | 115 | 488 |
| Peninsula West Coast | 1710 | 2175 | 314 | 1536 |
Table 4.
Estimated monthly crop water requirement (m3/ha) of oil palm and para rubber cultivated in the three suitable regions.
Table 4.
Estimated monthly crop water requirement (m3/ha) of oil palm and para rubber cultivated in the three suitable regions.
| Crop | Region | January | February | March | April | May | June | July | August | September | October | November | December |
|---|---|---|---|---|---|---|---|---|---|---|---|---|---|
| Oil palm | S | 1156 | 1177 | 1331 | 1266 | 1154 | 1083 | 1093 | 1121 | 1039 | 1014 | 950 | 1028 |
| E | 1186 | 1119 | 1344 | 1351 | 1213 | 1090 | 1096 | 1033 | 978 | 1055 | 1131 | 1186 | |
| C | 1136 | 1173 | 1471 | 1464 | 1342 | 1208 | 1176 | 1110 | 1057 | 1059 | 1116 | 1131 | |
| Para rubber | S | 1154 | 1175 | 1328 | 1264 | 1153 | 1081 | 1092 | 1119 | 1037 | 1013 | 949 | 1026 |
| E | 1184 | 1117 | 1342 | 1348 | 1211 | 1088 | 1094 | 1032 | 976 | 1053 | 1129 | 1184 | |
| C | 1134 | 1171 | 1469 | 1461 | 1340 | 1206 | 1174 | 1108 | 1055 | 1058 | 1114 | 1129 |
Remark: S, E, and C mean south, east, and center.
Table 5.
Estimated monthly irrigation water requirement (m3/ha) for oil palm in the south, east, and center.
Table 5.
Estimated monthly irrigation water requirement (m3/ha) for oil palm in the south, east, and center.
| Region | Province | January | February | March | April | May | June | July | August | September | October | November | December |
|---|---|---|---|---|---|---|---|---|---|---|---|---|---|
| South | Chumphon | 706 | 636 | 415 | 517 | - | 154 | - | - | - | - | - | - |
| Ranong | 1061 | 1042 | 573 | 451 | - | - | - | - | - | - | 271 | 476 | |
| Surat Thani | 580 | 900 | 255 | 672 | 45 | 154 | 83 | 280 | - | - | - | - | |
| Nakhon Si Thammarat | - | 620 | - | 487 | - | 42 | 144 | - | - | - | - | - | |
| Phatthalung | 110 | 685 | 192 | 424 | 397 | 363 | 489 | 496 | 258 | - | - | - | |
| Phuket | 990 | 1121 | 389 | 345 | - | - | - | - | - | - | - | 454 | |
| Krabi | 957 | 1185 | 354 | 328 | - | - | - | - | - | - | - | 384 | |
| Trang | 924 | 1213 | 638 | 475 | - | - | - | - | - | - | - | 528 | |
| Songkhla | 809 | 995 | 478 | 404 | - | - | - | - | - | - | - | 72 | |
| Satun | 736 | 1002 | 544 | 468 | 128 | 162 | 280 | 353 | - | - | - | - | |
| Pattani | 818 | 707 | - | - | - | - | - | - | - | - | - | 42 | |
| Yala | 201 | 767 | 391 | 610 | - | 125 | - | - | - | - | - | - | |
| Narathiwat | - | 716 | 5 | 830 | 80 | 104 | 149 | 124 | - | - | - | - | |
| East | Phangnga | 962 | 893 | 111 | 178 | - | - | - | - | - | - | - | 542 |
| Chachoengsao | 1182 | 787 | 521 | 250 | - | 7.9 | - | - | - | 65 | 756 | 1077 | |
| Prachin Buri | 1032 | 927 | 886 | 589 | - | - | - | - | - | 14 | 954 | 1229 | |
| Sa Kaeo | 1205 | 921 | 1109 | 655 | 84 | 50 | - | - | - | - | 932 | 1139 | |
| Chon Buri | 1104 | 1043 | 989 | 842 | 349 | 257 | 388 | 356 | - | - | 962 | 1205 | |
| Rayong | 928 | 652 | 746 | 556 | - | - | - | 153 | - | - | 870 | 986 | |
| Chanthaburi | 933 | 701 | 556 | 181 | - | - | - | - | - | - | 773 | 1066 | |
| Trat | 897 | 289 | 249 | - | - | - | - | - | - | - | 657 | 818 | |
| Center | Pathum Thani | 1086 | 768 | 768 | 765 | - | 82 | - | - | - | - | 801 | 963 |
| Phetchaburi | 663 | 1173 | 1078 | 1094 | 488 | 349 | 361 | 368 | - | - | 732 | 922 | |
| Prachuap Khiri Khan | 1046 | 1195 | 903 | 958 | 258 | 446 | 367 | 358 | 184 | - | 610 | 1035 | |
| Nakhon Nayok | 546 | - | 174 | 240 | 110 | - | 262 | 334 | - | 495 | 1106 | 938 | |
| Saraburi | 659 | 379 | 835 | 768 | 413 | 75 | 486 | 593 | 412 | 546 | 1043 | 780 |
Table 6.
Water scarcity footprint of oil palm plantation in in the south, east, and center (by province) based on watershed boundary.
Table 6.
Water scarcity footprint of oil palm plantation in in the south, east, and center (by province) based on watershed boundary.
| South | Range of Monthly Irrigation Water Requirement (m3/ha) | Water Scarcity Footprint with Regard to Plantation Area by Provinces (m3H2Oeq/ha) | |||||||||
| Watersheds | |||||||||||
| Province | Peninsula East Coast | Pattani | Tapi | West Coast Gulf | Thale sap Songkhla | Peninsula West Coast | |||||
| Chumphon | 153.6–705.6 | 1285.0 | - | - | 1288.1 | - | 870.1 | ||||
| Ranong | 270.9–1060.7 | 1733.6 | - | 477.4 | - | - | 1191.3 | ||||
| Suratthani | 44.8–900.1 | 1486.5 | - | 401.5 | - | - | 1018.3 | ||||
| Phang Nga | 41.6–620.2 | - | - | 293.9 | - | - | 817.9 | ||||
| Phuket | 110.2–684.9 | - | - | - | - | - | 1064.7 | ||||
| Krabi | 345.5–1120.9 | - | - | 381.3 | - | - | 1052.5 | ||||
| Trang | 327.7–1184.6 | 1779.2 | - | 472.4 | - | 1339.5 | 1217.6 | ||||
| Nakhon Si Thammarat | 475.1–1212.7 | 718.0 | - | 171.9 | - | 554.8 | 512.2 | ||||
| Phatthalung | 72.3–995.1 | 1197.8 | - | - | - | 948.5 | 815.2 | ||||
| Songkhla | 127.7–1001.7 | 1438.6 | 497.3 | - | - | 1077.4 | 979.4 | ||||
| Satun | 41.8–817.5 | - | - | - | - | 1264.0 | 1119.2 | ||||
| Pattani | 125.1–766.7 | 771.1 | 248.9 | - | - | - | - | ||||
| Yala | 4.6–830.1 | 1154.7 | 391.4 | - | - | - | - | ||||
| Narathiwat | 110.7–962.0 | 1081.7 | 344.0 | - | - | - | - | ||||
| East | Range of Monthly Irrigation Water Requirement (m3/ha) | Water Scarcity Footprint with Regard to Plantation Area by Provinces (m3H2Oeq/ha) | |||||||||
| Watersheds | |||||||||||
| Province | East Coast Gulf | Bang Pakong | Chao Phraya | Prachin Buri | Tonle Sap | Mun | |||||
| Chachoengsao | 7.9–1181.6 | 1881.5 | 5652.1 | 7409.5 | 2692.4 | - | - | ||||
| Prachin Buri | 14.0–1229.1 | - | 6326.6 | - | 3002.4 | - | 1594.3 | ||||
| Sa Kaeo | 50.0–1204.6 | 2589.9 | 6714.2 | - | 3260.7 | 1742.7 | - | ||||
| Chonburi | 256.6–1205.5 | 2813.1 | 7192.8 | - | - | - | - | ||||
| Rayong | 152.8–986.3 | 2029.2 | - | - | - | - | - | ||||
| Chanthaburi | 180.5–1065.9 | 1735.5 | 5078.6 | - | 2369.6 | 1162.7 | - | ||||
| Trat | 249.0–897.2 | 1099.9 | - | - | - | 758.8 | - | ||||
| Center | Range of Monthly Irrigation Water Requirement (m3/ha) | Water Scarcity Footprint with Regard to Plantation Area by Provinces (m3H2Oeq/ha) | |||||||||
| Watersheds | |||||||||||
| Province | Peninsula East Coast | Bang Pakong | Chao Phraya | West Coast Gulf | Mun | Mae Klong | Pasak | Phetcha buri | Prachin Buri | ||
| Pathum Thani | 81.8–1086.4 | - | 5770.8 | 7770.7 | - | - | - | - | - | - | |
| Saraburi | 75.4–1042.8 | - | 5244.5 | 7167.2 | - | - | - | 2529.7 | - | - | |
| Phetchaburi | 348.5–1172.6 | - | - | - | 3065.3 | - | 495.3 | - | 2609.7 | - | |
| Prachuap Khiri Khan | 183.6–1194.7 | 2740.4 | - | - | 3142.8 | - | - | - | 2719.8 | - | |
| Nakhon Nayok | 109.8–1105.9 | - | 3748.1 | 4514.3 | - | 904.2 | - | 1530.9 | - | 1585.6 | |
Table 7.
Estimated monthly crop water requirement (m3/ha) of sugarcane, cassava, maize, and pineapple cultivated in four suitable regions.
Table 7.
Estimated monthly crop water requirement (m3/ha) of sugarcane, cassava, maize, and pineapple cultivated in four suitable regions.
| Crop | Region | January | February | March | April | May | June | July | August | September | October | November | December |
|---|---|---|---|---|---|---|---|---|---|---|---|---|---|
| Sugarcane | N | 1068 | 1614 | 2267 | 1969 | 1621 | 1057 | 687 | 524 | 0 | 0 | 644 | 793 |
| NE | 1495 | 2017 | 1862 | 1866 | 1237 | 802 | 606 | 0 | 0 | 731 | 1008 | 1188 | |
| E | 1310 | 1689 | 2118 | 1760 | 1470 | 1023 | 698 | 525 | 0 | 0 | 742 | 1030 | |
| C | 1257 | 1790 | 2389 | 1949 | 1647 | 1153 | 760 | 577 | 0 | 0 | 737 | 979 | |
| Cassava | N | 274 | 313 | 465 | 519 | 675 | 818 | 1079 | 1177 | 1026 | 844 | 594 | 387 |
| NE | 310 | 339 | 477 | 512 | 687 | 888 | 1193 | 1267 | 1108 | 917 | 680 | 456 | |
| E | 335 | 328 | 435 | 464 | 613 | 792 | 1096 | 1180 | 998 | 842 | 684 | 503 | |
| C | 322 | 347 | 490 | 514 | 686 | 892 | 1194 | 1296 | 1081 | 878 | 680 | 478 | |
| Maize | N | 0 | 0 | 0 | 1275 | 2063 | 1594 | 552 | 0 | 0 | 0 | 0 | 0 |
| NE | 0 | 0 | 0 | 1256 | 2099 | 1729 | 610 | 0 | 0 | 0 | 0 | 0 | |
| E | 0 | 0 | 0 | 1139 | 1871 | 1543 | 561 | 0 | 0 | 0 | 0 | 0 | |
| C | 0 | 0 | 0 | 1261 | 2097 | 1739 | 611 | 0 | 0 | 0 | 0 | 0 | |
| Pineapple | N | 488 | 540 | 727 | 763 | 675 | 568 | 545 | 521 | 305 | 321 | 297 | 277 |
| NE | 554 | 584 | 746 | 752 | 687 | 616 | 602 | 561 | 329 | 348 | 340 | 326 | |
| E | 599 | 565 | 679 | 682 | 613 | 550 | 554 | 522 | 296 | 320 | 343 | 359 | |
| C | 575 | 599 | 766 | 755 | 686 | 620 | 603 | 573 | 321 | 333 | 340 | 342 |
Remark: N, NE, E, and C mean north, north east, east, and center.
© 2017 by the authors. Licensee MDPI, Basel, Switzerland. This article is an open access article distributed under the terms and conditions of the Creative Commons Attribution (CC BY) license (http://creativecommons.org/licenses/by/4.0/).
Share and Cite
MDPI and ACS Style
Nilsalab, P.; Gheewala, S.H. Potential Impact on Freshwater Resources from Agrofuel Feedstock Cultivation in Thailand: Implications of the Alternative Energy Development Plan 2015. Water 2017, 9, 919. https://doi.org/10.3390/w9120919
AMA Style
Nilsalab P, Gheewala SH. Potential Impact on Freshwater Resources from Agrofuel Feedstock Cultivation in Thailand: Implications of the Alternative Energy Development Plan 2015. Water. 2017; 9(12):919. https://doi.org/10.3390/w9120919
Chicago/Turabian StyleNilsalab, Pariyapat, and Shabbir H. Gheewala. 2017. "Potential Impact on Freshwater Resources from Agrofuel Feedstock Cultivation in Thailand: Implications of the Alternative Energy Development Plan 2015" Water 9, no. 12: 919. https://doi.org/10.3390/w9120919
Note that from the first issue of 2016, this journal uses article numbers instead of page numbers. See further details here.