Precipitation Trends over Slovakia in the Period 1981–2013
by
 , , ,
, , ,
Martina Zeleňáková
1,* ,
,
Jaroslav Vido
2,
Maria Manuela Portela
3,
Pavol Purcz
4,
Peter Blištán
5 ,
,
Helena Hlavatá
6 and
Petr Hluštík
7 1
Department of Environmental Engineering, Faculty of Civil Engineering, Technical University of Košice, Košice 042 00, Slovakia
2
Department of Natural Environment, Faculty of Forestry, Technical University in Zvolen, Zvolen 960 53, Slovakia
3
Department of Civil Engineering, Technical University of Lisbon, Lisbon 1049-001, Portugal
4
Department of Applied Mathematics, Faculty of Civil Engineering, Technical University of Košice, Košice 042 00, Slovakia
5
Institute of Geodesy, Cartography and Geographical Information Systems, Faculty of Mining, Ecology, Process Control and Geotechnologies, Technical University of Košice, Košice 042 00, Slovakia
6
Branch office Košice, Slovakian Hydrometeorological Institute, Košice 042 00, Slovakia, [email protected]
7
Institute of Municipal Water Management, Faculty of Civil Engineering, University of Technology in Brno, AdMaS centre, Brno 601 09, Czech Republic
*
Author to whom correspondence should be addressed.
Water 2017, 9(12), 922; https://doi.org/10.3390/w9120922
Submission received: 22 October 2017
/
Revised: 17 November 2017
/
Accepted: 20 November 2017
/
Published: 27 November 2017
Abstract
:The objective of this paper was to analyze the temporal and spatial trends in annual and seasonal precipitation in Slovakia utilizing 487 gauging station data collected statewide in the period from 1981 to 2013. The nonparametric Mann–Kendall (MK) statistical test, which has been widely used to assess the significance of trends in hydrological time series, was applied to detect the significant trends. The Theil–Sen (TS) approach was applied to quantify the trend magnitude, and the Sequential Mann–Kendall (SQMK) test was used to detect abrupt temporal trend shifts. In general, precipitation data in the study area have not changed during the last 33 years, and there are no big gaps. However, predominantly increasing trends in precipitation time series were found at most of the gauging stations in Slovakia. The results corroborate previous climatic studies in the area of central Europe. In Slovakia, there is evidence of different rain distribution from the monthly point of view. Decreasing trends were detected in December in the northern part of Slovakia, while the central and southern parts revealed increasing trends. Most of the stations showed increasing summer precipitation trends, especially in July. It is expected that the findings of this comprehensive study of precipitation trends over Slovakia will produce more insights for the understanding of the regional hydrological behavior in Slovakia over the last several decades.
1. Introduction
Climate variability, precipitation extremes, trends in precipitation and in other hydrological variables, as well as their prediction have been the focus of researchers worldwide over the past decade. Observations show that changes are occurring in the amounts, intensity, and frequency of precipitation [1]. Changes in climate in recent years have led to an increased temporal variability of the hydrological cycle (precipitation, streamflow, evaporation) on global, regional, and local scales, creating uncertainty in predicting future climate conditions and related impacts. Mainly, agricultural or forestry activities are scheduled according to rainfall seasonality [2]. However, not only agriculture or forestry but also water management activities such as water supply, urban drainage, or hydraulic structure management and operation are programmed according to the precipitation distribution in time and space. The detection of trends in precipitation time series is crucial for planning and designing regional water resources management [3].
Precipitation is one of the most important meteorological variables to consider in order to understand the impact of climate change on water resources availability. It is a major driving force in hydrological modelling for quantifying water availability within river basins, and changes in its trend at catchment scale need to be addressed. Observed precipitation from gauging stations is considered to be most accurate in climate and hydrological studies because of its measurement at ground level [4,5,6,7,8].
From the global point of view, overall increasing trends of precipitation were recorded in the previous decades. These changes were generally induced by the rising global temperature. However, these changes in the precipitation regime have very different manifestations on a regional or local scale [9,10,11]. For instance, projected trends toward drier conditions are anticipated in sub-Saharan Africa, despite the global increasing precipitation trends. In Europe, there is also evidence of different precipitation trends [12,13]. Therefore, it is necessary to study precipitation regimes on a regional scale.
The total precipitation has increased across the eastern United States over the last decades [14]. Karl and Knight [15] reported a 10% increase in annual precipitation across the United States between 1910 and 1996. Keim and Fischer [16] found mostly increasing precipitation trends in the United States over time. Furthermore, the annual mean precipitation is projected to increase over most of North America by 2030 [17]. Ongoing efforts to model and predict changes in extreme weather events in the eastern US have indicated that the southeast region should receive up to about 110 mm year–1 more of the total extreme precipitation by the end of the 2050s [18]. Boyles and Raman [19] predicted precipitation and temperature trends in North Carolina on seasonal and annual time scales during the period 1949–1998. They found that the precipitation trend significantly increased in the last ten years of the study period. They also found that precipitation increased over the past 50 years during the fall and winter seasons, but decreased during the summer. In their study for North Carolina over the period 1950–2009, Sayemuzzaman and Jha [20] presented an increasing trend for winter and a decreasing trend for fall precipitation. A mixed (increasing–decreasing) trend was detected in annual, spring, and summer precipitation time series. They also stated the magnitude of trends. They identified a significant shift during the 1960s–1970s in most parts of the state using the Sequential Mann–Kendall (SQMK) test for trend shift analysis.
Endo et al. [21] investigated trends in extreme precipitation using almost the entire network of stations in Southeast Asia. They were able to provide a clearer picture of trends across the neighboring countries in the region. Villafuerte II et al. [22] aimed to investigate trends and variability of rainfall extremes in the Philippines. Specifically, they examined long-term trends in the seasonally-computed extreme precipitation index and trends in a century-long temporal perspective. They utilized long-term atmospheric reanalysis to suggest possible causes of the obtained trends and they investigated how El Niño and the Southern Oscillation (ENSO) affected the interannual variability of the extreme precipitation index.
In India, studies by several authors show that during the last century no significant trend in rainfall was observed on an all-India basis, with decreasing–increasing trends in rainfall on a regional basis. Trend analysis of rainfall data series in India for 1871–2008 did not show any clear trend for the region as a whole, although there were seasonal trends for some seasons and for some hydrometeorological subdivisions [7,8,23].
Zeleňáková et al. [24] investigated trends in precipitation at gauging stations in Libya. Their results confirmed the conclusions of the Intergovernmental Panel on Climate Change [25] that rainfall is significantly increasing in northern Europe but decreasing in the Mediterranean area. Chingombe et al. [26] applied a trend detection framework to the Upper Mazowe catchments (Zimbabwe). The similarities in trends and patterns in hydrological variables and in meteorological variables in the catchment imply that the trends in hydrological variables are related to the meteorological variables. The results indicate that the temporal patterns in the variables have not been uniform and that hydrological variables may accentuate trends and patterns existing in the meteorological variables, which act as inputs to the hydrological cycle. In recent years, a number of studies were published focusing on the evolution of precipitation, drought conditions, and moisture availability in the Mediterranean area during the 20th century [27,28,29]. Sousa et al. [29] used average monthly precipitation figures to analyze the spatial and temporal evolution of drought conditions in the Mediterranean area during the 20th century. Monthly, seasonal, and annual trends in precipitation were computed for the period 1901–2000 and for the first and second halves of this period. The statistical significance of trends was obtained using a modified version of the Mann–Kendall test which accounts for serial autocorrelation. The results showed a clear trend towards drier conditions during the 20th century in most western and central Mediterranean regions.
Tomozeiu et al. [30] examined the spatial and temporal variability of summer precipitation during the period 1922–1995 at 40 gauging stations in the Emilia-Romagna region in northern Italy. They found an increasing trend with a significant upward shift around 1962. Buffoni et al. [31] identified a significant decreasing trend in annual precipitation series in central southern Italy. Arnone et al. [32] analyzed rainfall in Sicily. Their results for daily rainfall showed that heavy—torrential precipitation events tended to be more frequent on a regional scale, while light rainfall events exhibited a negative trend at some sites. Values of total annual precipitation events confirmed a significant negative trend, mainly due to the reduction of precipitation during the winter season. Cannarozzo et al. [33] employed a nonparametric statistical method (Mann–Kendall) to verify the existence of trends in annual, seasonal, and monthly rainfall data during the period 1921–2000 and the distribution of rainfall during the year across nearly 250 rain gauge stations in Sicily. Their results showed the existence of a generalized negative trend for the entire region.
Karpouzos et al. [3] investigated the temporal variability of precipitation in order to contribute to a better interpretation of the hydrological status of the study area located in the Prieria region of northern Greece. An overall downward trend, although not statistically significant, was derived for the stations located at lower altitudes.
Hydroclimatic time series in Slovakia were investigated in various studies, focusing mainly on precipitation. Lapin et al. [34] analyzed seasonal changes in monthly precipitation for future time horizons on the basis of downscaled outputs from General Circulation Models (GCM) scenarios. In Slovakia, seasonality analysis was applied mainly in connection with the regionalization of floods [35]. Gaál [36] also analyzed the maximum n-day precipitation totals in Slovakia and applied seasonality indices of mean monthly and extreme precipitation regionalization over Slovakia.
Kriegerová and Kohnová [37] analyzed the seasonality of rainfall and snowmelt-induced floods in 142 small and midsize catchments in Slovakia and found that convective storms were the main causal factor of the annual peak discharges. A noticeable decrease in springtime precipitation was observed. Statistical analyses of rainfall distribution and precipitation seasonality in Slovakia were carried out by [38,39,40,41]. Kohnová et al. [38] and Szolgay et al. [39] mapped annual maximum daily precipitations at 23 climate stations from 1961 to 2000 in the upper Hron in central Slovakia. Gaál et al. [40] compared different approaches to regional frequency analysis with the main focus on the implementation of the region-of-influence technique for the modelling of probabilities of heavy precipitation amounts in the area of the Western Carpathians, utilizing 56 stations. Zeleňáková et al. [41] studied the seasonal distribution of trends over all Slovakia. These studies were mostly focused on particular river catchments or regions within Slovakia or used different approaches. Therefore, we decided to investigate, from the monthly, seasonal, and annual points of view, the spatial rainfall characteristics and the precipitation trends during the period 1981–2013 utilizing data from 487 gauging stations within the Slovak Republic. Our paper brings the most spatially detailed overview of the precipitation regime and trends over Slovakia.
2. Materials and Methods
2.1. Study Area and Data
In terms of global climate classification, the territory of Slovakia lies in the northern temperate climatic zone with regular alternation of four seasons and variable weather, with a relatively even distribution of rainfall throughout the year. The locations of the gauge stations in Slovakia are shown in Figure 1.
According to the Slovak Hydrometeorological Institute (SHMI), average annual rainfalls of less than 600 mm may occur in Slovakia. In general, the rainfall increases with altitude. The rainiest month is usually June or July, and the least rainfall occurs from January to March. The highest daily rainfall was 231.9 mm measured in 1957. In summer, heavy rains occur relatively frequently over the whole country: almost every year, somewhere in Slovakia the daily rainfall exceeds 100 mm. In winter, much of the rain falls in the form of snow, particularly in the middle and the high mountain ranges. The average duration of snow cover is less than 40 days in southern Slovakia, and 80 to 120 days in the mountains [42].
From the 634 rain gauging stations operated by SHMI, 487 without daily gaps or with a negligible number of daily gaps over the period of 33 years from 1981 to 2013 were used in the trend analysis. All the datasets were standardly homogenized and checked for errors by the SHMI. Data collection methods and data processing were based on WMO (World Meteorological Organization) standards. The length of the data set satisfies the minimum required when searching for evidence of climate change in hydroclimatic time series, as proposed by Burn and Elnur [43]. The missing data in the remaining rain gauges were filled in on the basis of the linear regression analysis in monthly datasets from nearby rain gauges where the correlation coefficient was higher than 0.7 [44]. Precipitation trend analysis was done based on monthly data.
2.2. Statistical Analysis
For detecting trends and shifts in trends in hydrometeorological variables, various statistical methods have been developed and used over the years [45,46,47,48,49,50]. Of the two methods most commonly used, the parametric and nonparametric methods, the latter has been favored over the former [49]. Among the nonparametric methods, the Mann–Kendall (MK) statistical test [51,52] has been frequently used to quantify the significance of trends in time series [1,23,45,46,47,48,49,50,53,54,55,56,57,58,59,60]. It is also widely used in environmental science because it is simple, robust, and can cope with missing values and values below a detection limit.
A serious problem in detecting and evaluating trends in hydrological data is the effect of serial dependence [61,62,63,64,65,66,67]. If an autocorrelation exists in a time series, the MK test tends to reject the null hypothesis of no trend more often than the specified level of significance [68]. Methods that consider autocorrelation in trend detection were reviewed by Khaliq et al. [65]. In this paper, we used a trend-free pre-whitening method before applying the MK test to detect significant trends.
The Mann–Kendall test follows statistics based on the standard normal distribution (Z), using Equation (1):
in which
where n is the number of data points and m is the number of tied groups (a set of gi of sample data having the same value).
According to this test, the null hypothesis H0 states that the depersonalized data (x1, …, xn) consist of a sample of n independent and identically distributed random variables. The alternative hypothesis H1 of a two-sided test is that the distributions of xk and xj are not identical for all k, j ≤ n with k ≠ j.
The null hypothesis H0 (no trend) is accepted if Z < Zα/2 and rejected (hypothesis H1) if Z > Zα/2, where α is the significance level and Zα/2 the standard normal distribution for α/2. The applications carried out considered α = 0.05 and, accordingly, Zα/2 = 1.645.
Positive values of Z indicate increasing trends, while negative values of Z show decreasing trends.
The MK test does not provide an estimate of the magnitude of the trends themselves. For this purpose, another nonparametric method referred to as the Theil–Sen (TS) approach is very popular among researchers to quantify the slope of the trend (magnitude). TS was originally described by Theil [69] and Sen [70]. This approach provides a more robust slope estimate than the least squares method because it is insensitive to outliers or extreme values and competes well against simple least squares even for normally distributed data in a time series [71,72].
A long-term trend analysis can reveal the beginning of a trend year, trend changes over time, and abrupt trend changes in a time series. Sen’s method assumes a linear trend in the time series, and has been widely used for determining trend magnitudes in hydrometeorological time series. In this method, the slopes (β) of all data pairs are first calculated by
for i = 1, 2, ..., N, where xj and xk are data values at times j and k (j > k) respectively, and N is the number of all pairs xj and xk.
A positive value of β indicates an upward (increasing) trend and a negative value indicates a downward (decreasing) trend in the time series.
Both the MK and the TS tests require time series to be serially independent, which can be accomplished using the pre-whitening technique [67]. The trend-free pre-whitening (TFPW) procedure [73] was applied to detect a significant trend in a serially correlated time series, although it shows very high Type I error rates with increasing autocorrelation [74]. The original sample data Xt were unitized by dividing each of their values by the sample mean E(Xt) prior to conducting the trend analysis. The trend is assumed to be linear, and the sample data are detrended by:
The lag-k serial correlation coefficient (rk) of the detrended series Yt was computed according to Salas et al. [75]:
where rk is the lag-k serial correlation coefficient of the sample data Xt, and E(Xt) is the mean of the sample data.
If r1 is not significantly different from zero, the sample data are considered to be serially independent and the MK test is directly applied to the original sample data, as it was in our case.
An extension of the MK method, called the Sequential Mann–Kendall (SQMK) test, is widely used to detect the time (year) when a trend shows a shift (change in regime trend turning point) [1,20,47,49,56,58,60]. SQMK consists of sequential forward (u(ti)) and backward (u’(ti)) analyses of the MK test. If the two time series cross each other, the year of crossing indicates the year of trend change [47]. If, after crossing, the two series diverge from each other for a long period of time, the year when the divergence began indicates an abrupt trend change [58]. In a time series, for each element yi, the number ni of elements yj preceding it (i > j) is calculated such that yi > yj.
The test statistic t is then given by
and is distributed very nearly as a Gaussian normal distribution with an expected value of
and a variance of
A trend can be seen for high values of u(t), where,
While the forward sequential statistic u(ti) is estimated using the original time series, values of the backward sequential statistic u’(ti) are estimated in the same manner but starting from the end of the series. The intersection of the u(ti) and u’(ti) curves denotes approximately the beginning of the trend. This is called the sequential version of the Mann–Kendall test. If a Mann–Kendall statistic of a time series is higher than 1.96, there is a 95% significant increase in that particular time series. If the result is just the reverse, i.e., lower than −1.96, there is a 95% significantly decreasing trend in the series. Moreover, results between 0.5 and 1.96 indicate increasing trends, those between −0.5 and −1.96 indicate decreasing trends, and those between 0.5 and −0.5 indicate no trend.
The Mann–Kendall statistics can be plotted on a map in order to show the spatial distribution of both the significant and the nonsignificant precipitation trends. In the application carried out, the kriging technique was used to prepare a spatial precipitation data map over Slovakia from the point precipitation measuring stations within the Arc-GIS (Geographic Information System) framework. The spatial distributions of trends in the maps were generated using kriging, an interpolation technique in which the surrounding measured values are weighted to derive a predicted value for an unmeasured location. Weights were based on the distance between the measured points, the prediction locations, and the overall spatial arrangement among the measured points. Kriging showed the best performance among the univariate methods [76,77].
3. Results
3.1. Temporal and Spatial Precipitation Distribution over Slovakia in the Period 1981–2013
In order to describe changes in the precipitation trends over a studied region, it is necessary to depict annual, seasonal, and monthly precipitation distributions from both temporal and spatial perspectives.
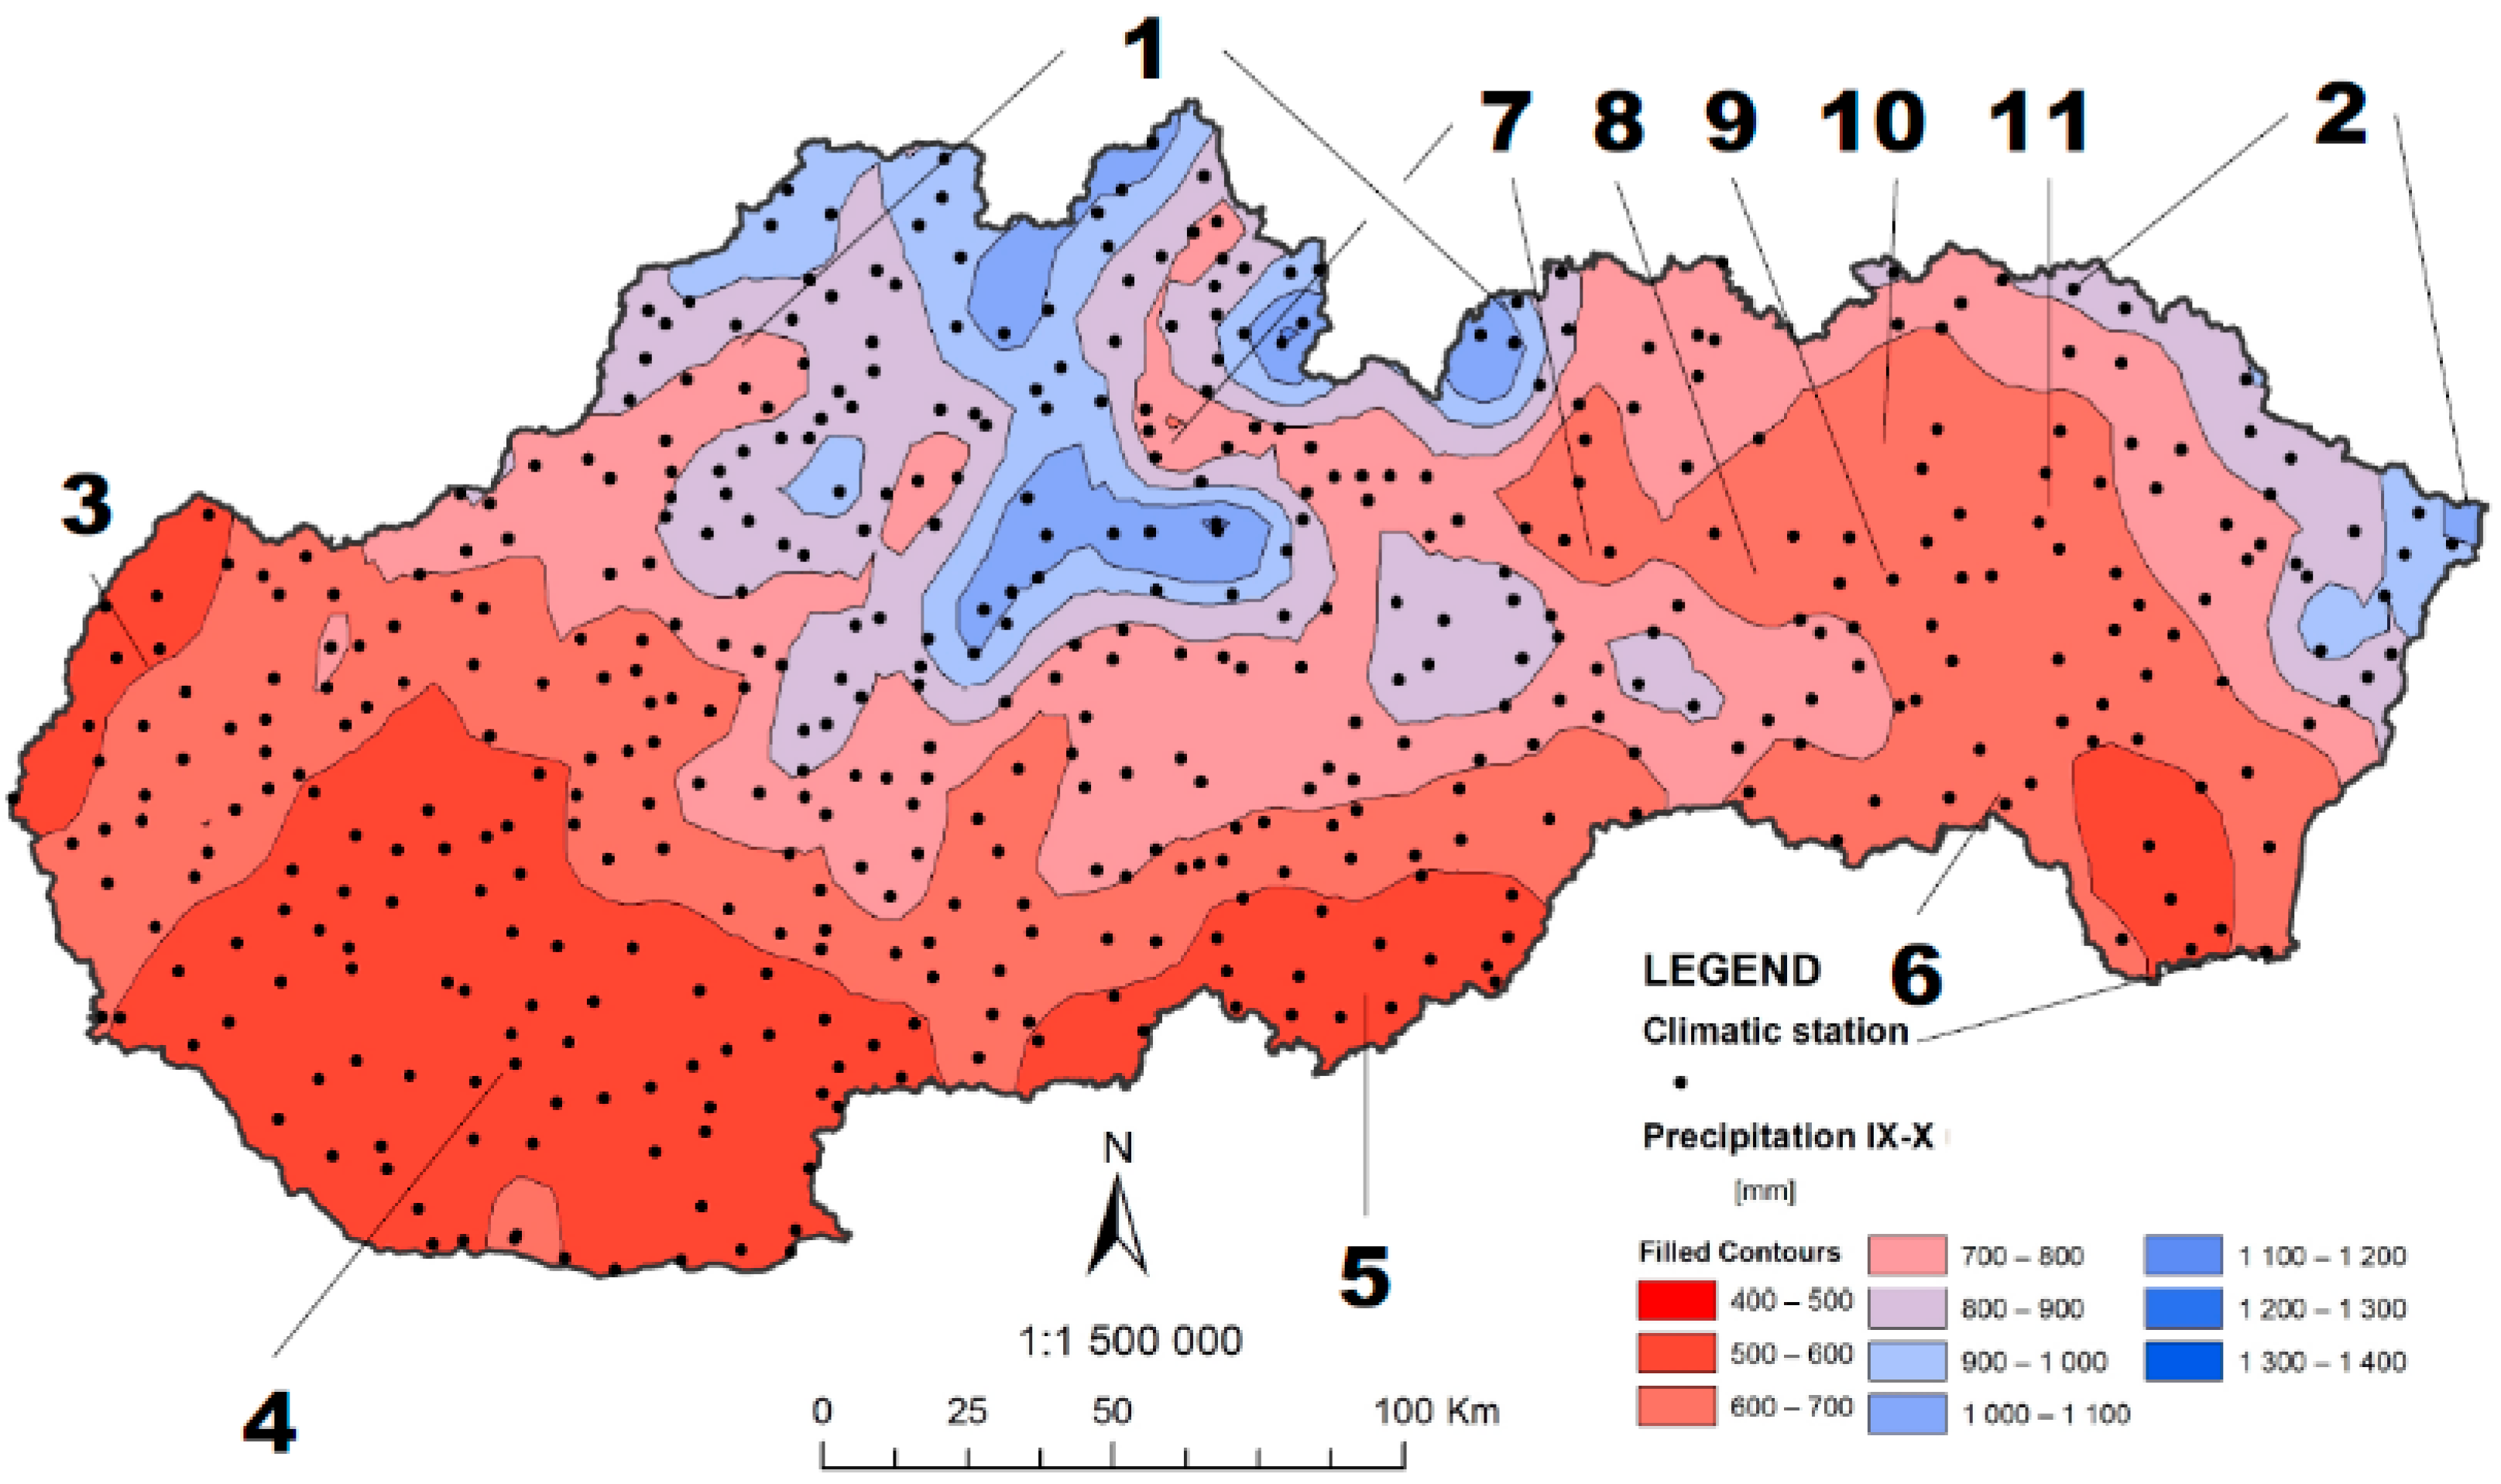
The annual mean precipitation amount in Slovakia during the period 1981–2013 was 720.2 mm. From the temporal point of view, the highest mean monthly precipitation amounts were recorded in June (87.6 mm), followed by July (86.2 mm) and May (78.9 mm). On the other hand, the lowest precipitation amounts were in February and January, with 39.8 mm and 44.1 mm, respectively. More precisely, this annual distribution actually had two maxima: one in June, as described above, and a secondary one in November with an average of 54.8 mm of precipitation (Figure 2). The absolute highest precipitation total on an annual scale was in 2010 when 2075 mm were recorded at the Jasná meteorological station in the Nízke Tatry Mountains (unit 7 in Figure 3). In contrast, the lowest amount was recorded in 2011 at the Malé Kosihy meteorological station located in the Podunajská nížina (Danube) lowlands (unit 4 in Figure 3).
Descriptions of seasonal, monthly, and annual precipitation totals are presented in Table 1.
Annual precipitation totals are spatially depicted in Figure 3.
The highest totals were recorded in the mountainous areas located in north and northwestern Slovakia (Western Carpathian Mountains) and in northeastern Slovakia (Eastern Carpathian Mountains). On the other hand, the driest areas were located in the lowland (nížina) areas extending from the west to the southeast of the country: Borská nížina, Podunajská nížina, Juhoslovenská nížina, and Východoslovenská nížina. These lowlands form parts of the Pannonian Basin (Carpathian Basin) geomorphological unit at its northernmost borders. However, low precipitation totals were also recorded on the leeward of the Western Carpathian Mountains: Podtatranská kotlina Basin, Hornádska kotlina Basin, Šarišská vrchovina Highlands, Čergov Mountains, and Ondavská vrchovina Highlands.
The spatial precipitation distribution on a monthly scale is depicted in Figure 4.
The highest rain amounts were recorded from May to July, especially in the mountainous regions of the Western and Eastern Carpathians. In contrast to this, the rain shadow of the Western Carpathians was evident in the area of the Podtatranská kotlina Basin as well as in the Hornádska kotlina Basin, especially in July. In addition, these areas, as well as the Šarišská vrchovina Highlands, Čergov Mountains, and Ondavská vrchovina Highlands were the driest parts of the country in the period from December to February, drier than the southern parts of the country that are generally the driest areas during the whole year. This region was very dry also in October.
As suggested above, areas with generally low precipitation amounts in all months are lowlands elongated from the southwest to the southeast of the country. Although these areas are the most important agricultural regions of the country, very low precipitation amounts were recorded here even in the rainiest season from April to July. The driest month in this area was January.
3.2. Annual, Seasonal, and Monthly Precipitation Trends
In general terms, the study of the 33 years of records in 487 Slovakian rain gauges revealed an increase in the summer precipitation and, conversely, a decrease in the autumn precipitation. Table 2 summarizes the results from the trend analysis based on the Mann–Kendall nonparametric statistical test for a critical probability level of 5% coupled with the Theil–Sen approach applied to the previous data set.
The table shows that for the annual precipitation (based on annual precipitation totals), 157 of the rain gauges (32%) revealed significant trends. Of those stations, 155 showed an increasing trend and only two (located in the north of Slovakia) showed a decreasing trend. The magnitude of those trends varied between −0.61 mm/year at the Oravská Polhora station (situated in northern Slovakia) and 0.92 mm/year at the Vyšná Boca station (situated in the middle of the country), where the highest positive trend in precipitation was detected. Although the general precipitation trend showed a significant increase, the annual trends presented a very slight increase. This situation is depicted in Figure 5. It is evident that the overall increasing trends from the annual point of view are very low.
Winter and spring precipitation showed more increasing (in 68 + 20 rain gauges) than decreasing (in 3 + 1 rain gauges) trends, although the percentage of significant trends was 15% in winter and only 4% in spring. The MK test found significant trends in 25% of the stations in summer, all of them indicating increasing precipitation. In autumn, only one rain gauge denoted a significant trend, also in the same sense (Table 2).
The Mann–Kendall trend test was also applied to detect temporal and spatial trends in the seasonal and monthly precipitation time series. Figure 6 presents the spatial distribution of monthly precipitation trends in Slovakia between 1981 and 2013, using the Theil–Sen Estimator value for each of the 487 gauge stations. It is evident that, from the monthly point of view, strong changes in precipitation distribution were recorded in the investigated period 1981–2013.
Regarding the monthly precipitation data, the analysis showed that the highest percentage of significant increasing trends occurred in July: 245 rain gauges (i.e., 50% of the 487 analyzed) showed significant positive trends. Also in summer, namely in June, 10% of rain gauge stations denoted significant increasing trends. This also happened for the winter season, where 22% and 7% of the rain gauges denoted significant increasing trends in January and December, respectively. However, in December increasing trends occurred mainly in the south and southeast of Slovakia, while 3% of significant decreasing trends were revealed in December mainly in the north of Slovakia. This is very interesting, considering the presence of winter precipitation in the form of snow especially in the mountainous areas of central and northern Slovakia. Therefore, decreasing precipitation trends in December in mountainous areas could imply a potential problem in the spring hydrological situation because the replenishment of ground water is dependent on snow cover. There was a high number of increasing trends in precipitation in January and February, as well as in June and mostly July. Although the percentage of significant trends in January was the second highest (22%) after July (50%), it is evident that the trend slope is relatively low (Figure 6). Arid trends were recorded in April, May, August, and, partially in the northern parts of Slovakia, during December, as mentioned above. The pronounced spatial variability of precipitation indicates prolonged drought episodes in the critical spring season (agricultural drought), and, on the other hand, frequent flood events occurrence in mountainous areas mainly in the summer season.
3.3. Abrupt Shifts in Precipitation
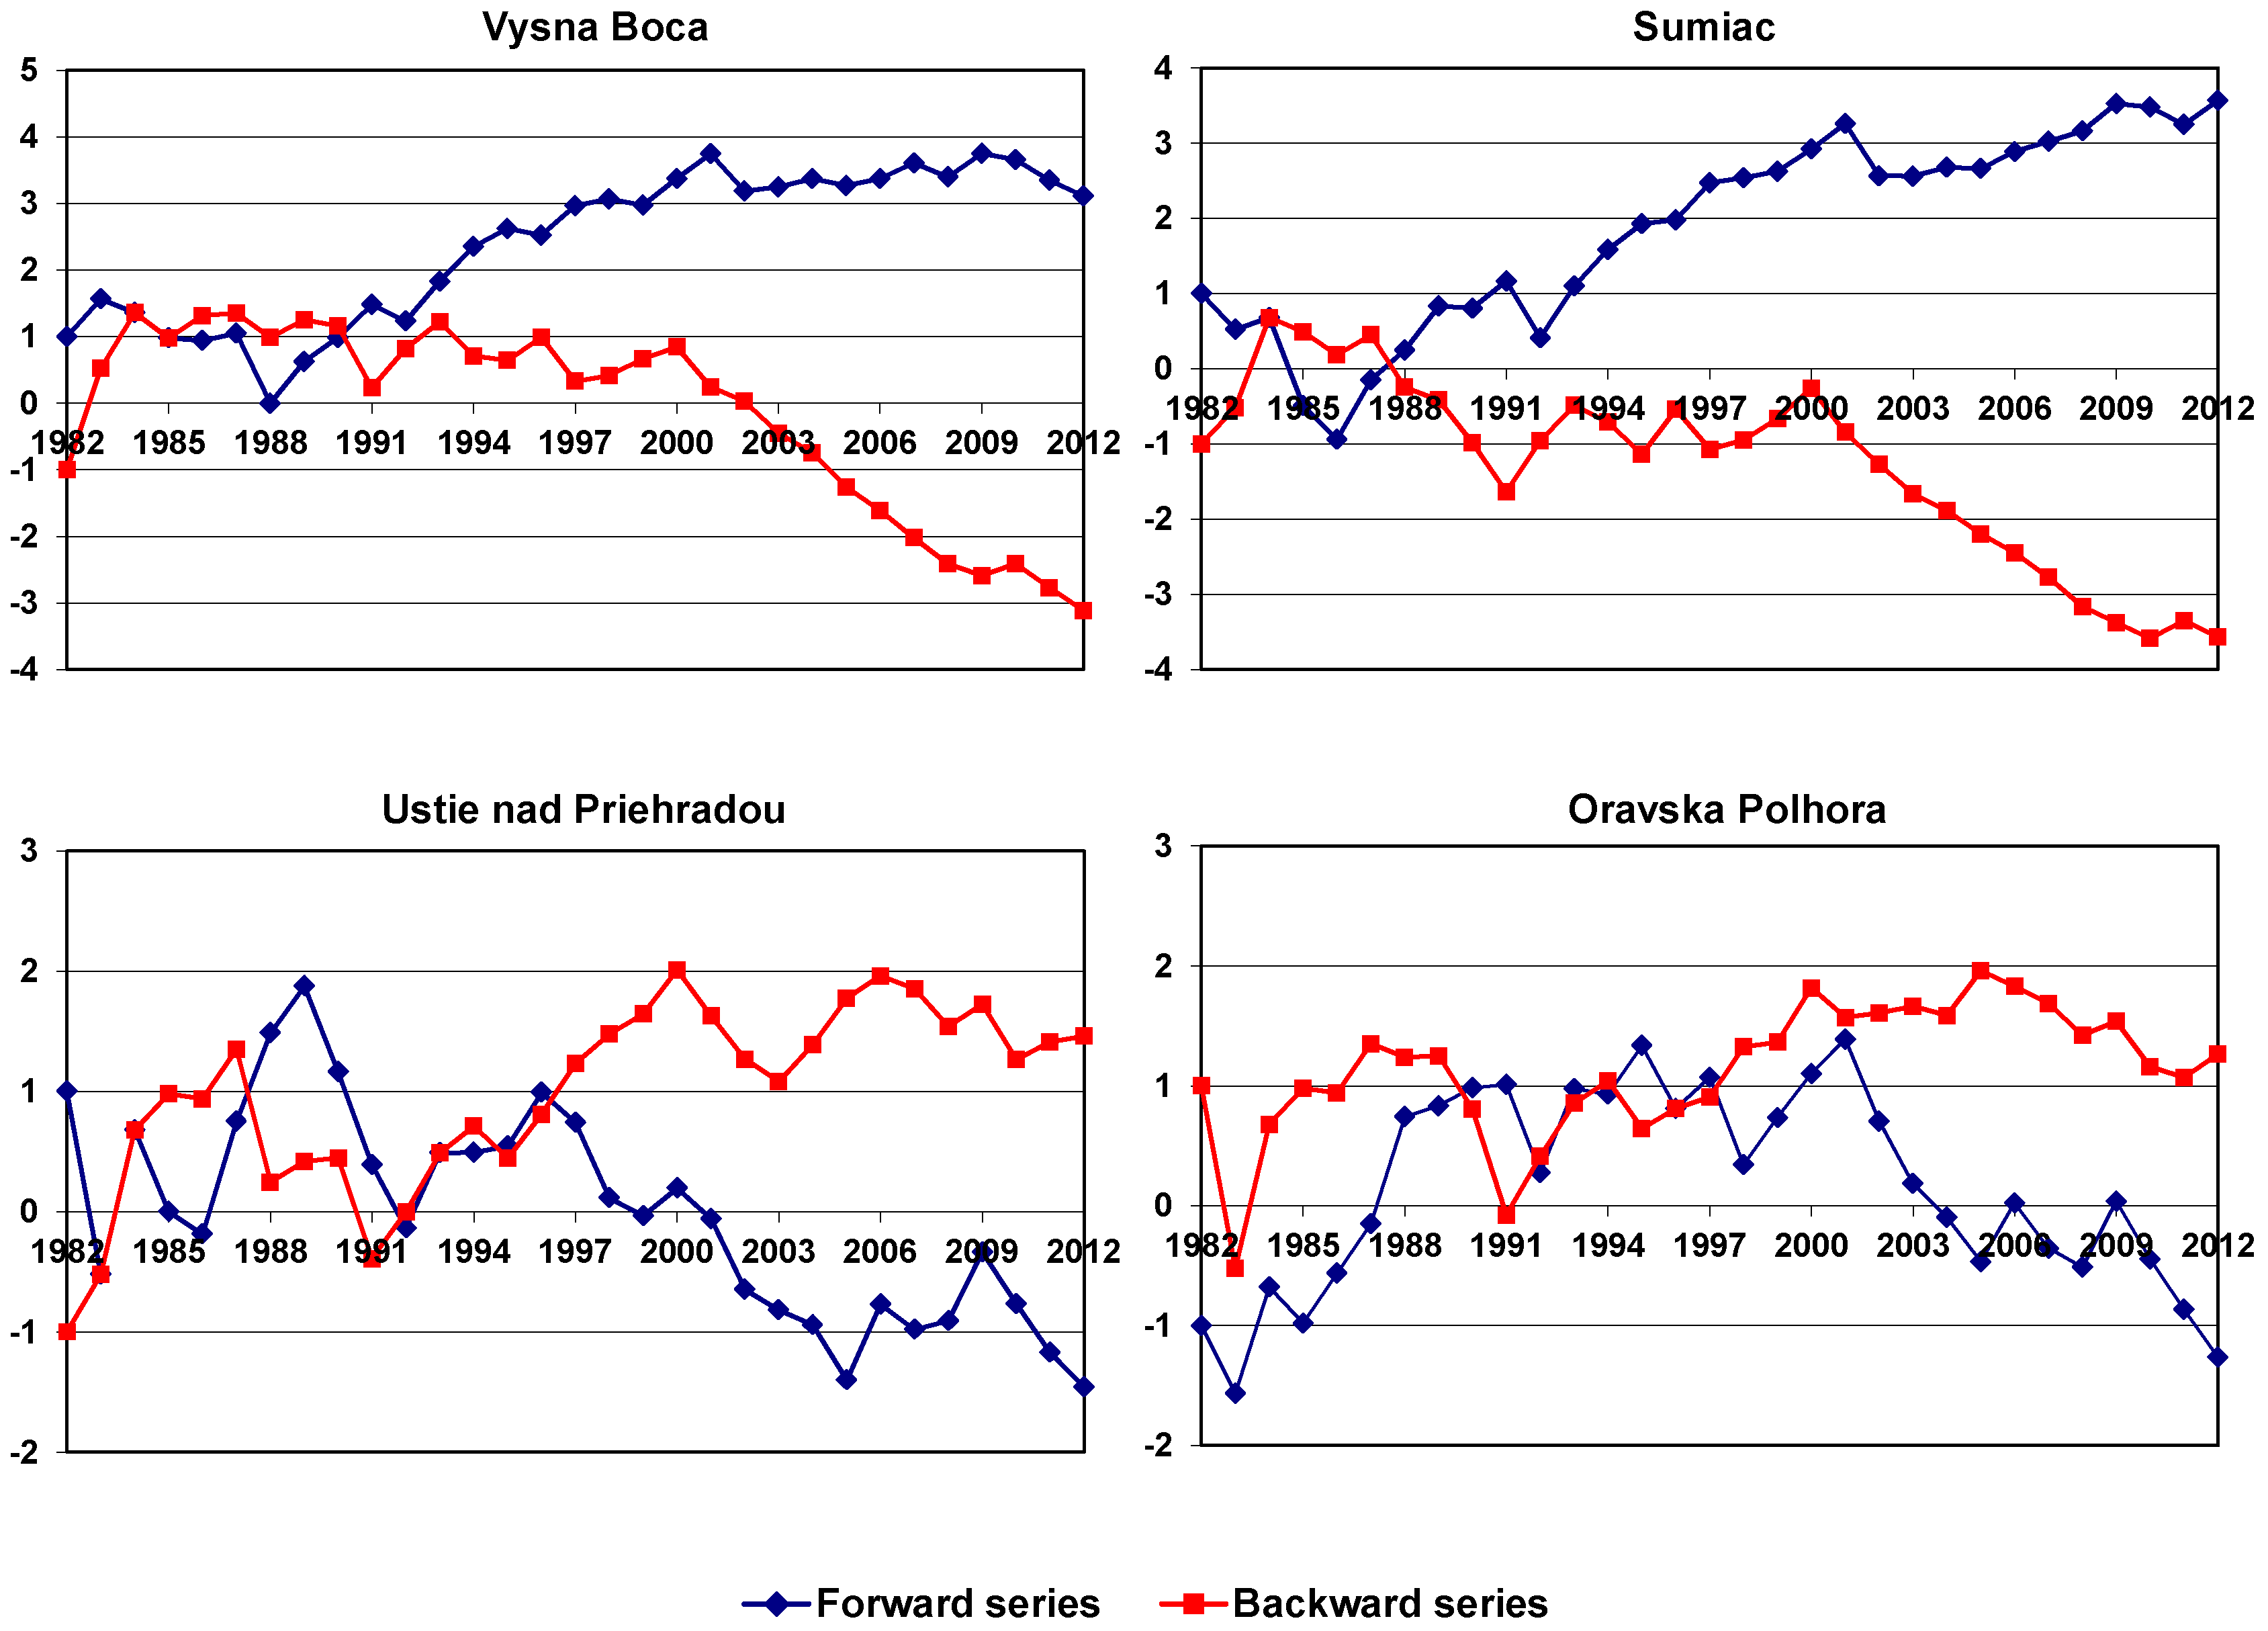
The SQMK test was used to detect abrupt temporal shifts in precipitation. The results obtained are presented in Figure 7 and are based on the four rain gauges with the highest value of magnitude (β) of significant increasing (Vyšná Boca and Šumiac) and decreasing trends (Ústie nad Priehradou and Oravská Polhora) in the annual precipitation.
Figure 7 shows that the SQMK test clearly identified the year when the abrupt shift in annual precipitation occurred. As mentioned, the shift year is given by the intersection of the forward series curve, u(t), and the backward series curve, u’(t). The years when the abrupt changes took place were 1990 and 1988 (increasing trends) for Vyšná Boca and Šumiac rain gauges, and 1996 and 1997 (both decreasing trends) for Ústie nad Priehradou and Oravská Polhora rain gauges.
4. Discussion
The mean annual precipitation distribution in Slovakia, with a maximum value recorded in June and a minimum value recorded in February, coincides with the findings of other researchers studying precipitation distribution over central and eastern Europe [78,79]. From the spatial point of view, the maximum annual precipitation amounts were recorded in the mountainous areas, and the minimum amounts in the southeastern and southwestern lowlands of Slovakia (Figure 3). Additional low rainfall areas were identified on the leeward of the Tatra Mountains, as confirmed by the findings of Vido et al. [80]. However, on the monthly scale the situation is different (Figure 4) because of the prevailing zonal circulation in the area [81,82]. Therefore, although the generally driest months were in the winter season, the northwestern mountains (indicated by the number 1 in Figure 3) were relatively well supplied with precipitation compared to the rest of this area. This is because of the influence of the North Atlantic Oscillation (NAO) on the winter precipitation regime [83,84]. In this case, the worst situation was recorded in interior lowlands located in the lee of these mountains. On the other hand, during the warm period (from April to September) convection precipitation [85] seems to play the main role. Our opinion is based on the spatial distribution of the highest precipitation amounts falling mainly in the mountainous and highland areas of Slovakia. However, also the lowland parts (in western and southeastern Slovakia) were relatively well supplied with rain compared to the winter months. In this case, the reason could also be some influence of the European monsoon [86]. The role of the European monsoon as a driver of the precipitation regime in late spring and early summer was historically discussed by Konček [87]. On the basis of these observations, we argue that there is an evident role of the atmospheric circulation in driving precipitation distribution over the studied region.
This argument is very interesting with regard to the discussion of the second part of our results about the precipitation trends.
From the annual point of view, a rising precipitation trend over the whole of Slovakia was recorded. Although this trend was confirmed as significant by the Mann–Kendall trend test, it was nonetheless slight (Figure 5). However, detailed analysis of monthly trends produced more pronounced results. The most significant signs of a changing precipitation pattern were evident in December (north part of Slovakia), April, May, and August with a shift toward drier conditions, and in July, June, and January with a shift toward wetter conditions. From the precipitation driver point of view, there is a question about the changing influence of the atmospheric circulation, especially in December, because, as mentioned above, the prevailing western and northwestern circulation patterns drive the precipitation regime in the northern and northwestern (mostly mountainous) parts of the country. In this case, there is an interesting coincidence with the findings of Hanna et al. [83] and Labudová et al. [84]. These researchers pointed to the significant changes in the NAO in the winter season, which seem to be the reason for the significant decrease in precipitation amounts in December that was found in our analyses. However, the findings of Hanna et al. [83] imply almost no change in NAO patterns in the transitional seasons (spring and autumn). This is very interesting because our findings indicate a decreasing trend in precipitation in the spring season, especially in April and May. Interestingly, the changes in the so-called “European Monsoon” (late spring and early summer rainfall) and its influence on early summer circumglobal teleconnections could potentially be the reason for this situation. The European monsoon and its influence on rainfall patterns in southern and central Europe was confirmed by Radinović and Ćurić [86] and by Lin and Lu [88], and was historically described by Konček [87]. However, this is a very complex issue beyond the scope of this paper, and therefore we would like to leave this question open for further investigation. On the other hand, the positive precipitation trends in June and July imply a significant influence of higher atmospheric moisture linked with increasing air temperature [89,90] in the summer season, with consequences in the higher frequency of convective thunderstorms and torrential rains [91,92].
The last part of our study, dealing with abrupt shifts in precipitation, could be interpreted as a result of the cyclical, multidecadal change in the precipitation regime, which was previously demonstrated by Halmova et al. [93], Niedźwiedź [94], and, historically, by Konček et al. [87]. A cyclical change in the precipitation regime (with a period of around 30 years) was also confirmed by the evidence of a change in the flow regime along the River Danube [95,96]. Our results show that an abrupt shift in the precipitation regime occurred between the years 1988 and 1997. Interestingly, the findings of Halmova et al. [93], Niedźwiedź [94], and Fendeková et al. [96] imply that the inflexion point (abrupt change) in the precipitation and in the flow regime (toward a “wet period”) in central Europe also dates to the early 1990s. We can state that our findings correspond with the results of these researchers [93,94,96] and confirm the cyclical change in the precipitation pattern. Although the abrupt shifts in the precipitation regime found in our study are dated between the years 1988 and 1997, our results suggest two different trends: the stations at Ústie nad Priehradou (598 m a.s.l. (above sea level)) and Oravská Polhora (794 m a.s.l.), in the very north of Slovakia, show a decreasing trend, whereas the stations at Vyšná Boca (930 m a.s.l.) and Šumiac (870 m a.s.l.), in central Slovakia, show an increasing trend. Geomorphological or other site-specific reasons could also play a potential role. For this reason, our explanation of these contradictive trends is based on the monthly precipitation trends depicted in Figure 4. A detailed observation of this figure reveals that the northern part of Slovakia (location of the stations with significant decreasing trends) was affected by negative (decreasing) trends in the two months when the most extreme precipitation changes occurred (December and July). Although in July almost all the stations recorded significant increasing trends, this area recorded a decreasing trend. In December too, this part of Slovakia was affected by a decreasing trend. We argue that these specific months produced the decreasing trends at the stations in the north of Slovakia. In contrast, the stations at Vyšná Boca and Šumiac (central Slovakia) recorded increasing trends in the same two months, with the consequence of an overall increasing annual trend. In any case, all the analyzed stations recorded abrupt shifts in the precipitation regime around the early 1990s, which is in accord with the described findings of the above-mentioned researchers.
5. Conclusions
In the present study, the precipitation regime over the Slovak Republic during the period 1981–2013 was investigated. The study was carried out utilizing data from 487 rain gauging stations operated by the Slovak Hydrometeorological Institute. The results showed that the mean annual precipitation regime had two maxima, in June (87.6 mm) and in November (54.8 mm). The lowest precipitation amount was recorded in February (39.8 mm). The mean annual precipitation amount in the studied area was 720.2 mm. From the spatial point of view, the highest precipitation occured in the mountainous areas located in northern and northwestern Slovakia (Western Carpathian Mountains) and in northeastern Slovakia (Eastern Carpathian Mountains). On the other hand, the driest areas were located in the lowlands extending from the west to the southeast of the country, as well as in the lee of the Tatra Mountains. Our investigation using trend analysis showed that, annually, there was a significant, although only slightly increasing precipitation trend in the period 1981–2013. However, from the monthly point of view, there is evidence of a very different rain distribution over the studied area. In December, we observed both decreasing and increasing trends in north and northwestern, and in central and southern parts of Slovakia, respectively. This seems to coincide with alternations and changes in the NAO circulation pattern in the winter season. On the other hand, almost all the stations showed strongly increasing summer precipitation trends, especially in July. The reason for this could very likely be the increasing temperature due to climate change, with higher atmospheric moisture levels as a consequence. This could result in higher frequency of torrential rains and severe convective thunderstorm situations, with potential damage to the landscape and socioeconomic structures.
An interesting result was obtained from applying the Sequential Mann–Kendall test. This method was used to identify abrupt shifts in the precipitation regime during the studied period. The test was applied to the data from four selected stations, and the results showed that the abrupt shifts occurred between the years 1988 and 1997. This is interesting because, when comparing our results with those of researchers dealing with cyclical changes (of around 30 years) in the precipitation regime, the turning point in the multidecadal precipitation cycle was found in the early 1990s also in other studies. Judging from the results obtained by the researchers mentioned above, we conclude that the last decade of the 20th and the first twenty years of the 21st century have been the “wet period” of the cycle. Therefore, assuming the thirty-year cycle is almost over, we now face a prolonged dry period in our region.
The presented study includes a comprehensive trend analysis of precipitation in Slovakia that was not presented in the previous regional studies [34,35,36,37,38,39,40,41]. It presents the distribution of precipitation trends from spatial and temporal (monthly, seasonal, and annual) points of view. It includes datasets from 487 rain gauge stations over the whole Slovakia. The results are presented also in graphical form and are discussed in detail. This paper provides the most spatially detailed overview of precipitation trends distribution over Slovakia.
Acknowledgments
This work was supported by the Slovak Research and Development Agency bilateral project between Slovakia and Portugal SK-PT-2015-0007 and by the Scientific and Educational Grant Agency of Ministry of Education of the Slovak Republic under project VEGA 1/0609/14, and by grants from the Slovak research and Development Agency APVV-15-0497 as well as from the Cultural and Educational Grant Agency of the Ministry of Education, Science, Research, and Sport of the Slovak Republic 017TU Z-4/2016. The research report was drawn up in the framework of project No. LO1408 “AdMaS UP—Advanced Building Materials, Structures, and Technologies” supported by the Ministry of Education, Youth, and Sports in the framework of the purpose-oriented support of the “National Sustainability Programme I”.
Author Contributions
All authors equally contributed to the preparation of this scientific paper.
Conflicts of Interest
The authors declare no conflict of interest.
References
- Jones, J.R.; Schwartz, J.S.; Ellis, K.N.; Hathaway, J.M.; Jawdy, C.M. Temporal variability of precipitation in the Upper Tennessee Valley. J. Hydrol. Reg. Stud. 2015, 3, 125–138. [Google Scholar] [CrossRef]
- Villafuerte, M.Q., II; Matsumoto, J.; Akasaka, I.; Takahashi, H.G.; Kubota, H.; Cinco, T.A. Long-term trends and variability of rainfall extremes in the Philippines. Atmos. Res. 2014, 137, 1–13. [Google Scholar] [CrossRef]
- Karpouzos, D.K.; Kavalieratou, S.; Babajimopoulos, C. Trend analysis of precipitation data in Pieria region (Greece). Eur. Water 2010, 30, 31–40. [Google Scholar]
- Marszelewski, W.; Pius, B. The impact of changes in air temperature upon the thermal regime of the river Vistula in Toruń (Poland) over the years 1961–2012. In Proceedings of the 2nd International Conference Water Resources and Wetlands, Tulcea, Romania, 11–13 September 2014; Gâştescu, P., Marszelewski, W., Bretcan, P., Eds.; Romanian Limnogeographical Association: Dambovita, Romania, 2014; pp. 231–236. [Google Scholar]
- Wójcik, K.M.; Turczyński, M.; Sposób, J. Natural and anthropogenic changes of standing water bodies in West Polesie (east Poland). In Proceedings of the 2nd International Conference Water Resources and Wetlands, Tulcea, Romania, 11–13 September 2014; Gâştescu, P., Marszelewski, W., Bretcan, P., Eds.; Romanian Limnogeographical Association: Dambovita, Romania, 2014; pp. 36–43. [Google Scholar]
- Marszelewski, W.; Pius, B. Long-term changes in temperature of river waters in the transitional zone of the temperate climate: A case study of Polish rivers. Hydrol. Sci. J. 2016, 61, 1430–1442. [Google Scholar] [CrossRef]
- Poornima, U.; Jothiprakash, V. Extraction of Trend of Rainfall Using Singular Spectrum Analysis. J. Hydrol. Eng. 2015, 20, 05015007. [Google Scholar]
- Jothiprakash, V.; Fathima, T.A. Chaotic Analysis of Daily Rainfall Series in Koyna Reservoir Catchment Area. Stoch. Environ. Res. Risk A 2013, 27, 1371–1381. [Google Scholar] [CrossRef]
- Zeleňáková, M.; Purcz, P.; Blišťan, P.; Alkhalaf, I.; Hlavatá, H.; Portela, M.M.; Silva, A.T. Precipitation trends detection as a tool for integrated water resources management in Slovakia. Desalin. Water Treat. 2017, 1–8. [Google Scholar] [CrossRef]
- Maraun, D.; Wetterhall, F.; Ireson, A.M.; Chandler, R.E.; Kendon, E.J.; Widmann, M.; Brienen, S.; Rust, H.W.; Sauret, T.; Themeβl, M.; et al. Precipitation downscaling under climate change: Recent developments to bridge the gap between dynamical models and the end user. Rev. Geophys. 2010, 48, RG3003. [Google Scholar] [CrossRef]
- Trenberth, K. Changes in precipitation with climate change. Clim. Res. 2011, 47, 123–138. [Google Scholar] [CrossRef]
- Gizaw, M.S.; Gan, T.Y. Impact of climate change and El Niño episodes on droughts in sub-Saharan Africa. Clim. Dynam. 2017, 49, 665–682. [Google Scholar] [CrossRef]
- Lupikasza, E. Spatial and temporal variability of extreme precipitation in Poland in the period 1951–2006. Int. J. Climatol. 2010, 30, 991–1007. [Google Scholar] [CrossRef]
- Small, D.; Islam, S.; Vogel, R.M. Trends in precipitation and streamflow in the eastern US: Paradox or perception? Geophys. Res. Lett. 2006, 33. [Google Scholar] [CrossRef]
- Karl, T.R.; Knight, R.W. Secular trends of precipitation amount, frequency, and intensity in the United States. Bull. Am. Meteorol. Soc. 1998, 79, 231–241. [Google Scholar] [CrossRef]
- Keim, B.D.; Fischer, M.R. Are there spurious precipitation trends in the United States Climate Division database? Geophys. Res. Lett. 2005, 32. [Google Scholar] [CrossRef]
- Solomon, S.; Qin, D.; Manning, M.; Marquis, M.; Averyt, K.; Tignor, M.; Miller, H.; Chen, Z. Climate Change 2007: The Physical Science Basis; Working Group I, Fourth Assessment Report of the Intergovernmental Panel on Climate Change (IPCC); Cambridge University Press: London, UK, 2008. [Google Scholar]
- Gao, Y.; Fu, J.; Drake, J.; Liu, Y.; Lamarque, J. Projected changes of extreme weather events in the eastern United States based on a high resolution climate modeling system. Environ. Res. Lett. 2012, 7, 1–12. [Google Scholar] [CrossRef]
- Boyles, P.R.; Raman, S. Analysis of climate trends in North Carolina (1949–1998). Environ. Int. 2003, 29, 263–275. [Google Scholar] [CrossRef]
- Sayemuzzaman, M.; Jha, M.K. Seasonal and annual precipitation time series trend analysis in North Carolina, United States. Atmos. Res. 2014, 137, 183–194. [Google Scholar] [CrossRef]
- Endo, N.; Matsumoto, J.; Lwin, T. Trends in precipitation extremes over Southeast Asia. SOLA 2009, 5, 168–171. [Google Scholar] [CrossRef]
- Mall, R.K.; Singh, R.; Gupta, A.; Srinivasan, G.; Rathore, L.S. Impact of climate change on indian agriculture: A review. Clim. Chang. 2006, 78, 445–478. [Google Scholar] [CrossRef]
- Jain, S.K.; Kumar, V.; Sahariad, M. Analysis of rainfall and temperature trends in northeast India. Int. J. Climatol. 2013, 33, 968–978. [Google Scholar] [CrossRef]
- Zeleňáková, M.; Purcz, P.; Gargar, I.A.K. Evaluation of hydrological series in Libya. In Proceedings of the SGEM 2013: 13th International Multidisciplinary Scientific Geoconference: Water Resources, Forest, Marine and Ocean Ecosystems, Albena, Bulgaria, 16–22 June 2013; STEF92 Technology Ltd.: Albena, Bulgaria, 2013; pp. 125–132. [Google Scholar]
- IPCC (Intergovernmental Panel for Climatic Change). Working Group II: Impacts, Adaptation and Vulnerability. Extreme High Temperature and Precipitation Events. 2012. Available online: http://www.ipcc.ch/ipccreports/tar/wg2/index.php?idp=625 (accessed on 15 May 2015).
- Chingombe, W.; Gutierrez, J.E.; Pedzisai, E.; Siziba, E. A study of hydrological trends and variability of Upper Mazowe catchment Zimbabwe. 2005. Available online: http://www.jsd-africa.com/Jsda/Spring2005/ArticlePDF/Arc_study%20of%20hydrological%20trends%20and%20variability%20of%20upper%20Mazowe%20Catchment_Zimbabwe.pdf (accessed on 11 November 2016).
- Pauling, A.; Paeth, H. On the variability of return periods of European winter precipitation extremes over the last five centuries. Clim. Past Discuss. 2006, 2, 157–189. [Google Scholar] [CrossRef]
- Lopez-Moreno, J.; Vicente-Serrano, S.; Gimeno, L.; Nieto, R. Stability of the seasonal distribution of precipitation in the Mediterranean region: Observations since 1950 and projections for the 21st century. Geophys. Res. Lett. 2009, 36, 10703. [Google Scholar] [CrossRef]
- Sousa, P.M.; Trigo, R.M.; Aizpurua, P.; Nieto, R.; Gimeno, L.; Garcia-Herrera, R. Trends and extremes of drought indices throughout the 20th century in the Mediterranean. Nat. Hazards Earth Syst. Sci. 2011, 11, 33–51. [Google Scholar] [CrossRef] [Green Version]
- Tomozeiu, R.; Busuioc, A.; Marletto, V.; Zinoni, F.; Cacciamani, C. Detection of changes in the summer precipitation time series of the region Emilia-Romagna, Italy. Theor. Appl. Climatol. 2000, 67, 193–200. [Google Scholar] [CrossRef]
- Buffoni, L.; Maugeri, M.; Nanni, T. Precipitation in Italy from 1833 to 1996. Theor. Appl. Climatol. 1999, 63, 33–40. [Google Scholar] [CrossRef]
- Arnone, E.; Pumo, D.; Viola, F.; Noto, L.V.; La Loggia, G. Rainfall statistics changes in Sicily. Hydrol. Earth Syst. Sci. 2013, 17, 2449–2458. [Google Scholar] [CrossRef] [Green Version]
- Cannarozzo, M.; Noto, L.V.; Viola, F. Spatial distribution of rainfall trends in Sicily (1921–2000). Phys. Chem. Earth 2006, 31, 1201–1211. [Google Scholar] [CrossRef]
- Lapin, M.; Damborská, I.; Melo, M. Downscaling of GCM outputs for precipitation time series in Slovakia. Met. J. 2001, 4, 29–40. [Google Scholar]
- Parajka, J.; Kohnová, S.; Merz, R.; Szolgay, J.; Hlavčová, K.; Blöschl, G. Comparative analysis of the seasonality of hydrological characteristics in Slovakia and Austria. Hydrol. Sci. J. 2009, 54, 456–473. [Google Scholar] [CrossRef]
- Gaál, L. Introduction of Lapin’s indices into the cluster analysis of maximum k-day precipitation totals in Slovakia. Met. J. 2005, 8, 85–94. [Google Scholar]
- Kriegerová, I.; Kohnová, S. Seasonality analysis of flood occurrence in mid-sized catchments in Slovakia. J. Hydrol. Hydromech. 2005, 53, 154–163. [Google Scholar]
- Kohnová, S.; Lapin, M.; Szolgay, J.; Gaál, L. Methodology for the selection of 10-day maximum precipitation totals and their statistical analysis in the upper Hron region. Contrib. Geophys. Geod. 2005, 35, 281–298. [Google Scholar]
- Szolgay, J.; Parajka, J.; Kohnová, S.; Hlavčová, K. Comparison of mapping approaches of design annual maximum daily precipitation. Atmos. Res. 2009, 92, 289–307. [Google Scholar] [CrossRef]
- Gaál, L.; Kyselý, J.; Szolgay, J. Region-of-influence approach to a frequency analysis of heavy precipitation in Slovakia. Hydrol. Earth Syst. Sci. 2008, 12, 825–839. [Google Scholar] [CrossRef]
- Zeleňáková, M.; Portela, M.M.; Purcz, P.; Blišťan, P.; Silva, A.T.; Hlavatá, H.; Santos, J.F. Seasonal and spatial investigation of trends in precipitation in Slovakia. Eur. Water 2015, 52, 35–42. [Google Scholar]
- Climate Atlas of Slovakia; Slovak Hydrometeorologic Institute: Banská Bystrica, Slovakia, 2015; 228p.
- Burn, D.H.; Hag Elnur, M.A. Detection of hydrologic trends and variability. J. Hydrol. 2002, 255, 107–122. [Google Scholar] [CrossRef]
- Portela, M.M.; Zeleňáková, M.; Santos, J.F.; Purcz, P.; Silva, A.T.; Hlavatá, H. Drought analysis in Slovakia: Regionalization, frequency analysis and precipitation thresholds. In Proceedings of the 8th International Conference on River Basin Management, La Coruna, Spain, 18–20 May 2015; Brebbia, C.A., Ed.; Wessex Institute: Ashurst, UK, 2015; pp. 3–14. [Google Scholar]
- Jha, M.K.; Singh, A.K. Trend analysis of extreme runoff events in major river basins of Peninsular Malaysia. Int. J. Water 2013, 7, 142–158. [Google Scholar] [CrossRef]
- Martinez, J.C.; Maleski, J.J.; Miller, F.M. Trends in precipitation and temperature in Florida, USA. J. Hydrol. 2012, 452–453, 259–281. [Google Scholar] [CrossRef]
- Modarres, R.; Silva, V.P.R. Rainfall trends in arid and semi-arid regions of Iran. J. Arid Environ. 2007, 70, 344–355. [Google Scholar] [CrossRef]
- Modarres, R.; Sarhadi, A. Rainfall trends analysis of Iran in the last half of the twentieth century. J. Geophys. Res. 2009, 114. [Google Scholar] [CrossRef]
- Sonali, P.; Nagesh, K.D. Review of trend detection methods and their application to detect temperature changes in India. J. Hydrol. 2013, 476, 212–227. [Google Scholar] [CrossRef]
- Tabari, H.; Talaee, P.H. Temporal variability of precipitation over Iran: 1966–2005. J. Hydrol. 2011, 396, 313–320. [Google Scholar] [CrossRef]
- Mann, H.B. Non-parametric tests against trend. Econometrica 1945, 13, 245–259. [Google Scholar] [CrossRef]
- Kendall, M.G. Rank Correlation Measures; Charles Griffin: London, UK, 1975. [Google Scholar]
- Gocic, M.; Trajkovic, S. Analysis of changes in meteorological variables using Mann-Kendall and Sen’s slope estimator statistical tests in Serbia. Glob. Planet Chang. 2013, 100, 172–182. [Google Scholar] [CrossRef]
- Hasanean, H.; Almazroui, M. Rainfall: Features and Variations over Saudi Arabia, a Review. Climate 2015, 3, 578–626. [Google Scholar] [CrossRef]
- Lettenmaier, D.P.; Wood, E.F.; Wallis, J.R. Hydro-climato-logical trends in the continental United States, 1948–88. J. Clim. 1994, 7, 586–607. [Google Scholar] [CrossRef]
- Partal, T.; Kahya, E. Trend analysis in Turkish precipitation data. Hydrol. Process. 2006, 20, 2011–2026. [Google Scholar] [CrossRef]
- Yue, S.; Hashino, M. Temperature trends in Japan: 1900–1990. Theor. Appl. Climatol. 2003, 75, 15–27. [Google Scholar]
- Some’e, B.S.; Ezani, A.; Tabari, H. Spatiotemporal trends and change point of precipitation in Iran. Atmos. Res. 2012, 113, 1–12. [Google Scholar]
- Yan, T.; Shen, Z.; Bai, J. Spatial and Temporal Changes in Temperature, Precipitation, and Streamflow in the Miyun Reservoir Basin of China. Water 2017, 9, 78. [Google Scholar] [CrossRef]
- Liu, Q.; Yang, Z.; Cui, B. Spatial and temporal variability of annual precipitation during 1961–2006 in Yellow River Basin, China. J. Hydrol. 2008, 361, 330–338. [Google Scholar] [CrossRef]
- Abdul Aziz, O.I.; Burn, D.H. Trends and variability in the hydrological regime of the Mackenzie River Basin. J. Hydrol. 2006, 319, 282–294. [Google Scholar] [CrossRef]
- Bayazit, M.; Önöz, B. To prewhiten or not to prewhiten in trend analysis? Hydrol. Sci. J. 2007, 52, 611–624. [Google Scholar] [CrossRef]
- Cunderlik, J.M.; Burn, D.H. Local and regional trends in monthly maximum flows in Southern British Columbia. Can. Water Resour. J. 2002, 27, 191–212. [Google Scholar] [CrossRef]
- Haktanir, T.; Citakoglu, H. Closure to “Trend, Independence, Stationarity, and Homogeneity Tests on Maximum Rainfall Series of Standard Durations Recorded in Turkey”. J. Hydrol. Eng. 2015, 20, 07015017. [Google Scholar] [CrossRef]
- Khaliq, M.N.; Ouarda, T.B.M.J.; Gachon, P.; Sushama, L.; St-Hilaire, A. Identification of hydrological trends in the presence of serial and cross correlations: A review of selected methods and their application to annual flow regimes of Canadian rivers. J. Hydrol. 2009, 368, 117–130. [Google Scholar] [CrossRef]
- Önöz, B.; Bayazit, M. The power of statistical tests for trend detection. Turkish J. Eng. Environ. Sci. 2003, 27, 247–251. [Google Scholar]
- Yue, S.; Wang, C.Y. Applicability of prewhitening to eliminate the influence of serial correlation on the Mann–Kendall test. Water Resour. Res. 2002, 38, 41–47. [Google Scholar] [CrossRef]
- Von Storch, H. Misuses of statistical analysis in climate research. In Analysis of Climate Variability Applications of Statistical Techniques; von Storch, H., Navarra, A., Eds.; Springer-Verlag: Berlin/Heidelberg, Germany, 1995; pp. 11–26. [Google Scholar]
- Sen, P.K. Estimates of the regression coefficient based on Kendall’s tau. J. Am. Stat. Assoc. 1968, 63, 1379–1389. [Google Scholar] [CrossRef]
- Theil, H. A rank-invariant method of linear and polynomial regression analysis, I, II, III. In Proceedings of Koninalijke Nederlandse Akademie van Weinenschatpen A; North-Holland Pub. Co.: Amsterdam, The Netherlands, 1950; Volume 53, pp. 1397–1412. [Google Scholar]
- Hirsch, R.M.; Slack, J.R.; Smith, R.A. Techniques of trend analysis for monthly water quality data. Water Resour. Res. 1982, 18, 107–121. [Google Scholar] [CrossRef]
- Jianqing, F.; Qiwei, Y. Nonlinear Time Series: Nonparametric and Parametric Methods, 1st ed.; Springer Series in Statistics; Springer: New York, NY, USA, 2003. [Google Scholar]
- Yue, S.; Pilon, P.; Phinney, B.; Cavadias, G. The influence of autocorrelation on the ability to detect trend in hydrological series. Hydrol. Process. 2002, 16, 1807–1829. [Google Scholar] [CrossRef]
- Bürger, G. On trend detection. Hydrol. Process. 2017, 31, 4039–4042. [Google Scholar] [CrossRef]
- Salas, J.D.; Delleur, J.W.; Yevjevich, V.; Lane, W.L. Applied Modelling of Hydrologic Time Series; Water Resources Publications: Littleton, CO, USA, 1980. [Google Scholar]
- Di Piazza, A.; Lo Conti, F.; Noto, L.V.; Viola, F.; La Loggia, G. Comparative analysis of different techniques for spatial interpolation of rainfall data to create a serially complete monthly time series of precipitation for Sicily, Italy. Int. J. Appl. Earth Obs. Geoinf. 2011, 13, 396–408. [Google Scholar] [CrossRef]
- Di Piazza, A.; Lo Conti, F.; Viola, F.; Eccel, E.; Noto, L.V. Comparative Analysis of Spatial Interpolation Methods in the Mediterranean Area: Application to Temperature in Sicily. Water 2015, 7, 1866–1888. [Google Scholar] [CrossRef] [Green Version]
- Trnka, M.; Balek, J.; Zahradníček, P.; Eitzinger, J.; Formayer, H.; Turňa, M.; Brázdil, R. Drought trends over part of Central Europe between 1961 and 2014. Clim. Res. 2016, 70, 143–160. [Google Scholar] [CrossRef]
- Brázdil, R.; Chromá, K.; Dobrovolný, P.; Tolasz, R. Climate fluctuations in the Czech Republic during the period 1961–2005. Int. J. Climatol. 2009, 29, 223–242. [Google Scholar] [CrossRef]
- Vido, J.; Tadesse, T.; Šustek, Z.; Kandrík, R.; Hanzelová, M.; Škvarenina, J.; Hayes, M. Drought occurrence in central european mountainous region (Tatra National Park, Slovakia) within the period 1961–2010. Adv. Meteorol. 2015, 2015. [Google Scholar] [CrossRef]
- Niedźwiedź, T.; Twardosz, R.; Walanus, A. Long-term variability of precipitation series in east central Europe in relation to circulation patterns. Theor. Appl. Climatol. 2009, 98, 337–350. [Google Scholar] [CrossRef]
- Lapin, M.; Faško, P. Precipitation and changes of the atmospheric circulation in the period 1874–1993 in Slovakia. Meteorologické Zprávy 1996, 49, 1–11. [Google Scholar]
- Hanna, E.; Cropper, T.E.; Jones, P.D.; Scaife, A.A.; Allan, R. Recent seasonal asymmetric changes in the NAO (a marked summer decline and increased winter variability) and associated changes in the AO and Greenland Blocking Index. Int. J. Climatol. 2015, 35, 2540–2554. [Google Scholar] [CrossRef]
- Labudová, L.; Šťastný, P.; Trizna, M. The north atlantic oscillation and winter precipitation totals in Slovakia. Morav. Geogr. Rep. 2013, 21, 38–49. [Google Scholar]
- Labudová, L.; Faško, P.; Ivaňáková, G. Changes in climate and changing climate regions in Slovakia. Morav. Geogr. Rep. 2015, 23, 71–82. [Google Scholar] [CrossRef]
- Radinović, D.; Ćurić, M. Some evidence on European monsoon existence. Theor. Appl. Climatol. 2012, 110, 11–15. [Google Scholar] [CrossRef]
- Konček, M. Klima Tatier (Climate of Tatry Mountains); Vyd. Slovenskej Akad. Vied: Bratislava, Slovakia, 1974. (In Slovak) [Google Scholar]
- Lin, Z.; Lu, R. Impact of summer rainfall over southern-central Europe on circumglobal teleconnection. Atmos. Sci. Lett. 2016, 17, 258–262. [Google Scholar] [CrossRef]
- Lapin, M.; Gera, M.; HrvoĽ, J.; Melo, M.; Tomlain, J. Possible impacts of climate change on hydrologic cycle in Slovakia and results of observations in 1951–2007. Biologia 2009, 64, 454–459. [Google Scholar] [CrossRef]
- Škvarenina, J.; Krizova, E.; Tomlain, J.N. Impact of the climate change on the water balance of altitudinal vegetation stages in Slovakia. Ekol. Bratisl. 2004, 23, 13–29. [Google Scholar]
- Müller, M.; Kašpar, M.; Matschullat, J. Heavy rains and extreme rainfall-runoff events in Central Europe from 1951 to 2002. Nat. Hazard. Earth Syst. 2009, 9, 441–450. [Google Scholar] [CrossRef]
- Faško, P.; Lapin, M.; Šťastný, P.; Vivoda, J. Maximum daily sums of precipitation in Slovakia in the second half of the 20th century. Prace Geogr. Zesz. 2000, 108, 131–138. [Google Scholar]
- Halmova, D.; Pekarova, P.; Olbrimek, J.; Miklanek, P.; Pekar, J. Precipitation regime and temporal changes in the Central Danubian lowland region. Adv. Meteorol. 2015, 2015, 1–12. [Google Scholar] [CrossRef]
- Niedźwiedź, T. Changes of atmospheric circulation (using the P, S, C, M indices) in the winter season and their influence on air temperature in Cracow. Early Meteorological Instrumental Records in Europe—Methods and Results. Zeszity Naukowe UJ Prace Geogr. 1993, 95, 107–113. [Google Scholar]
- Pekárová, P.; Pramuk, B.; Halmová, D.; Miklánek, P.; Prohaska, S.; Pekár, J. Identification of long-term high-flow regime changes in selected stations along the Danube River. J. Hydrol. Hydromech. 2016, 64, 393–403. [Google Scholar] [CrossRef]
- Fendeková, M.; Pekárová, P.; Fendek, M.; Pekár, J.; Škoda, P. Global drivers effect in multi-annual variability of runoff. J. Hydrol. Hydromech. 2014, 62, 169–176. [Google Scholar] [CrossRef]
Figure 1.
Study area and location of the 487 rain gauges in Slovakia.
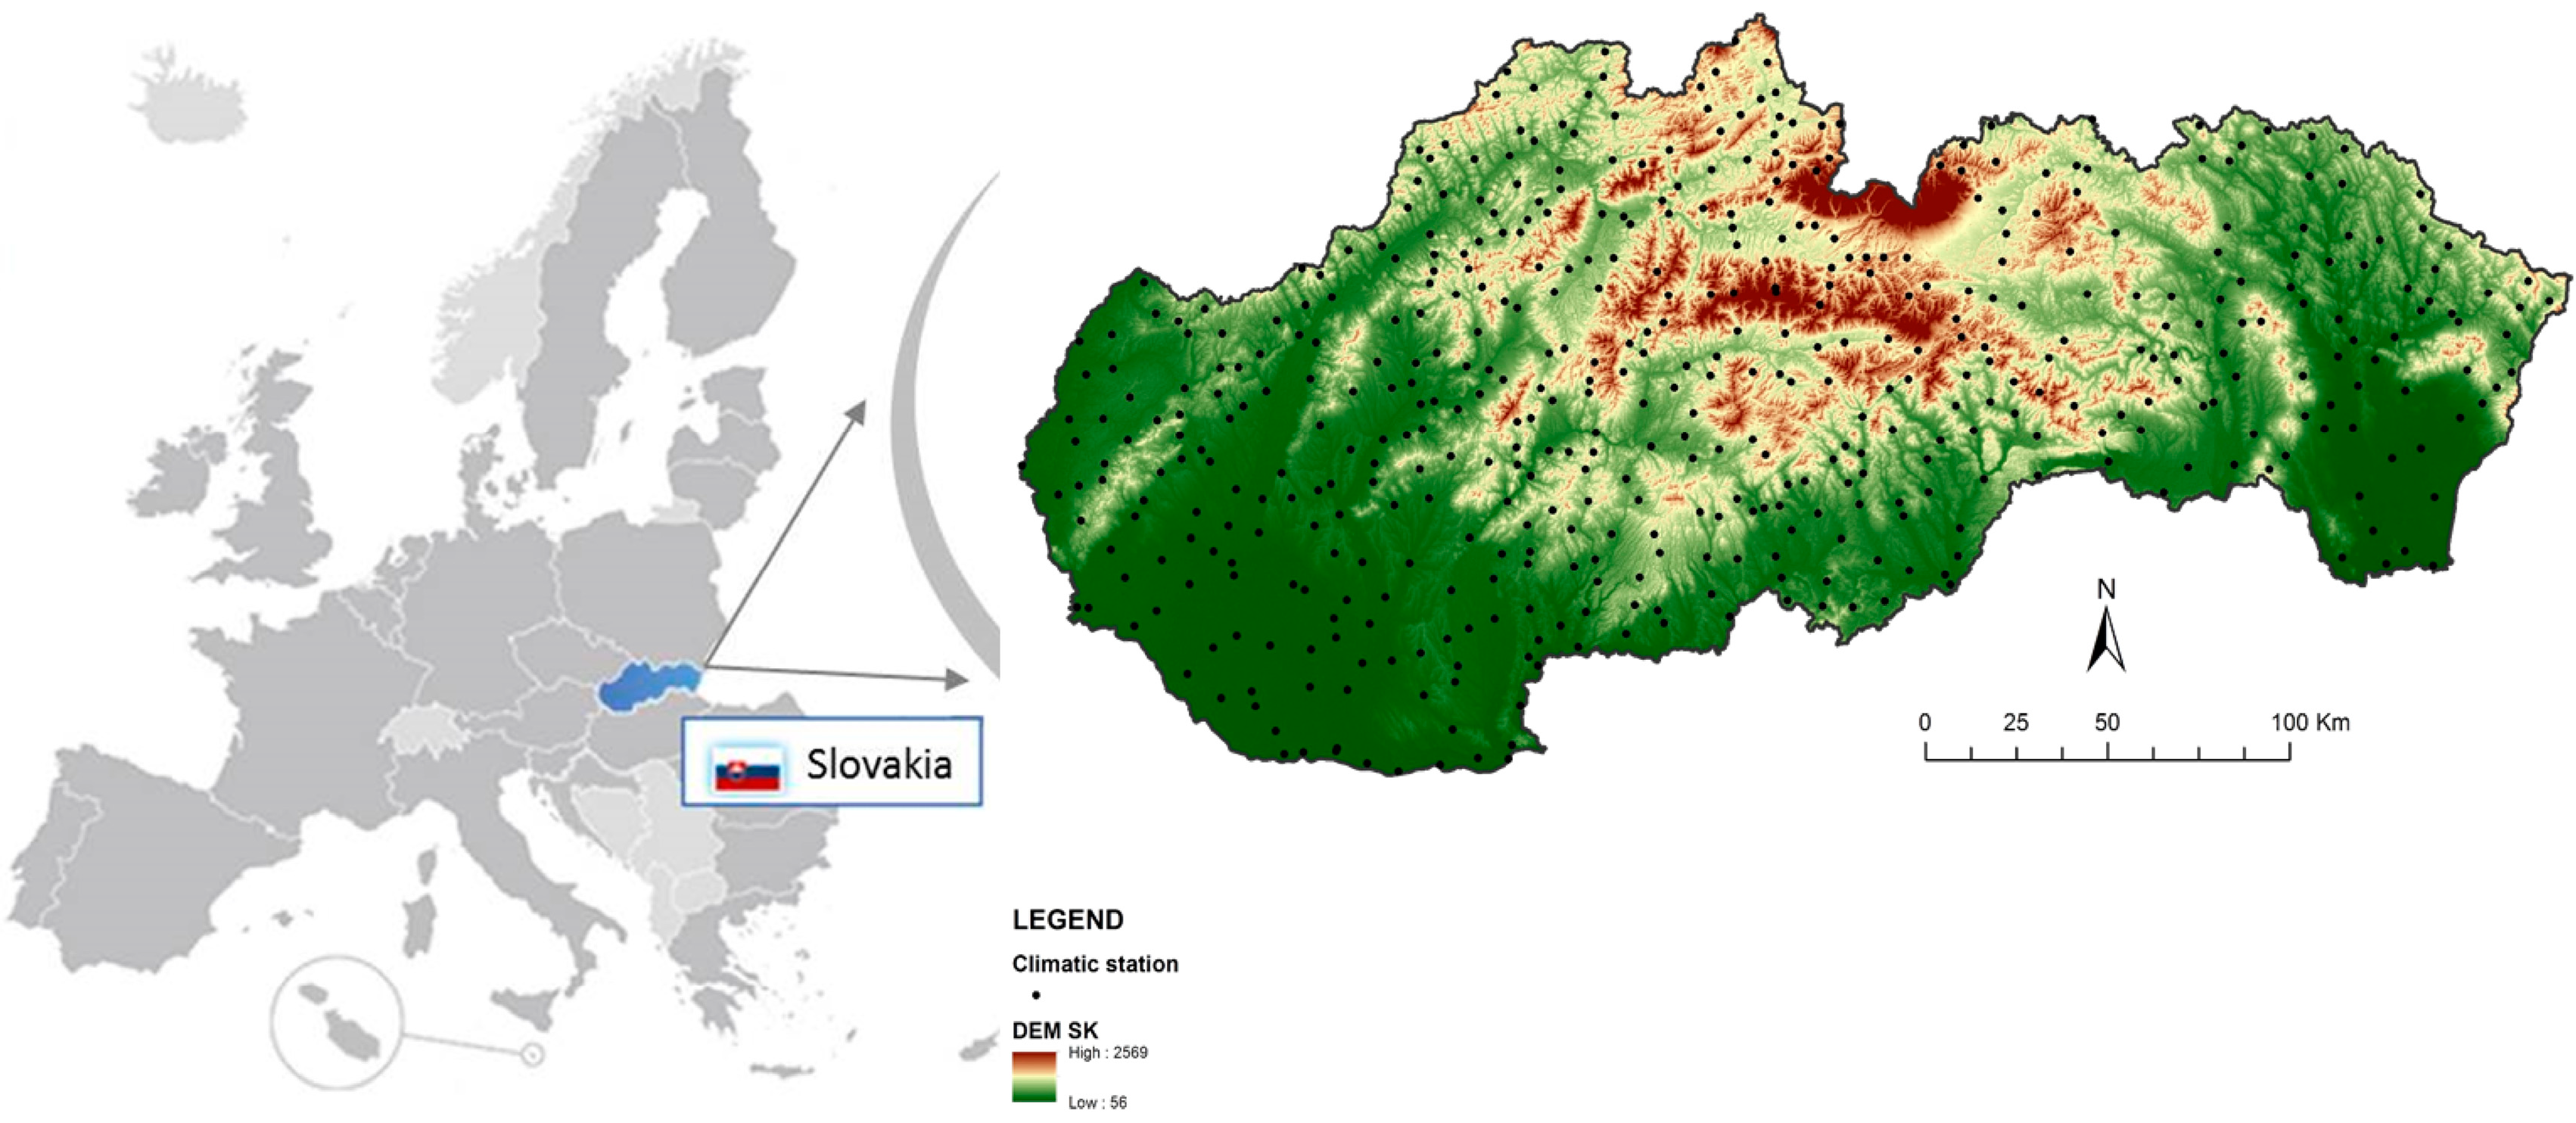
Figure 2.
Mean monthly precipitation totals over Slovakia within the period 1981–2013. The wave is depicted by a sixth order polynomial trend.
Figure 2.
Mean monthly precipitation totals over Slovakia within the period 1981–2013. The wave is depicted by a sixth order polynomial trend.

Figure 3.
Annual precipitation distribution over Slovakia in the period 1981–2013. The numbers in the figure represent geomorphological units: (1) Western Carpathian Mountains; (2) Eastern Carpathian Mountains; (3) Borská nížina Lowlands; (4) Podunajská nížina Lowlands; (5) Juhoslovenská nížina Lowlands; (6) Východoslovenská nížina Lowlands; (7) Podtatranská kotlina Basin; (8) Hornádska kotlina Basin; (9) Šarišská vrchovina Highlands; (10) Čergov Mountains; (11) Ondavská vrchovina Highlands.

Figure 4.
Monthly precipitation distribution over Slovakia in the period 1981–2013.
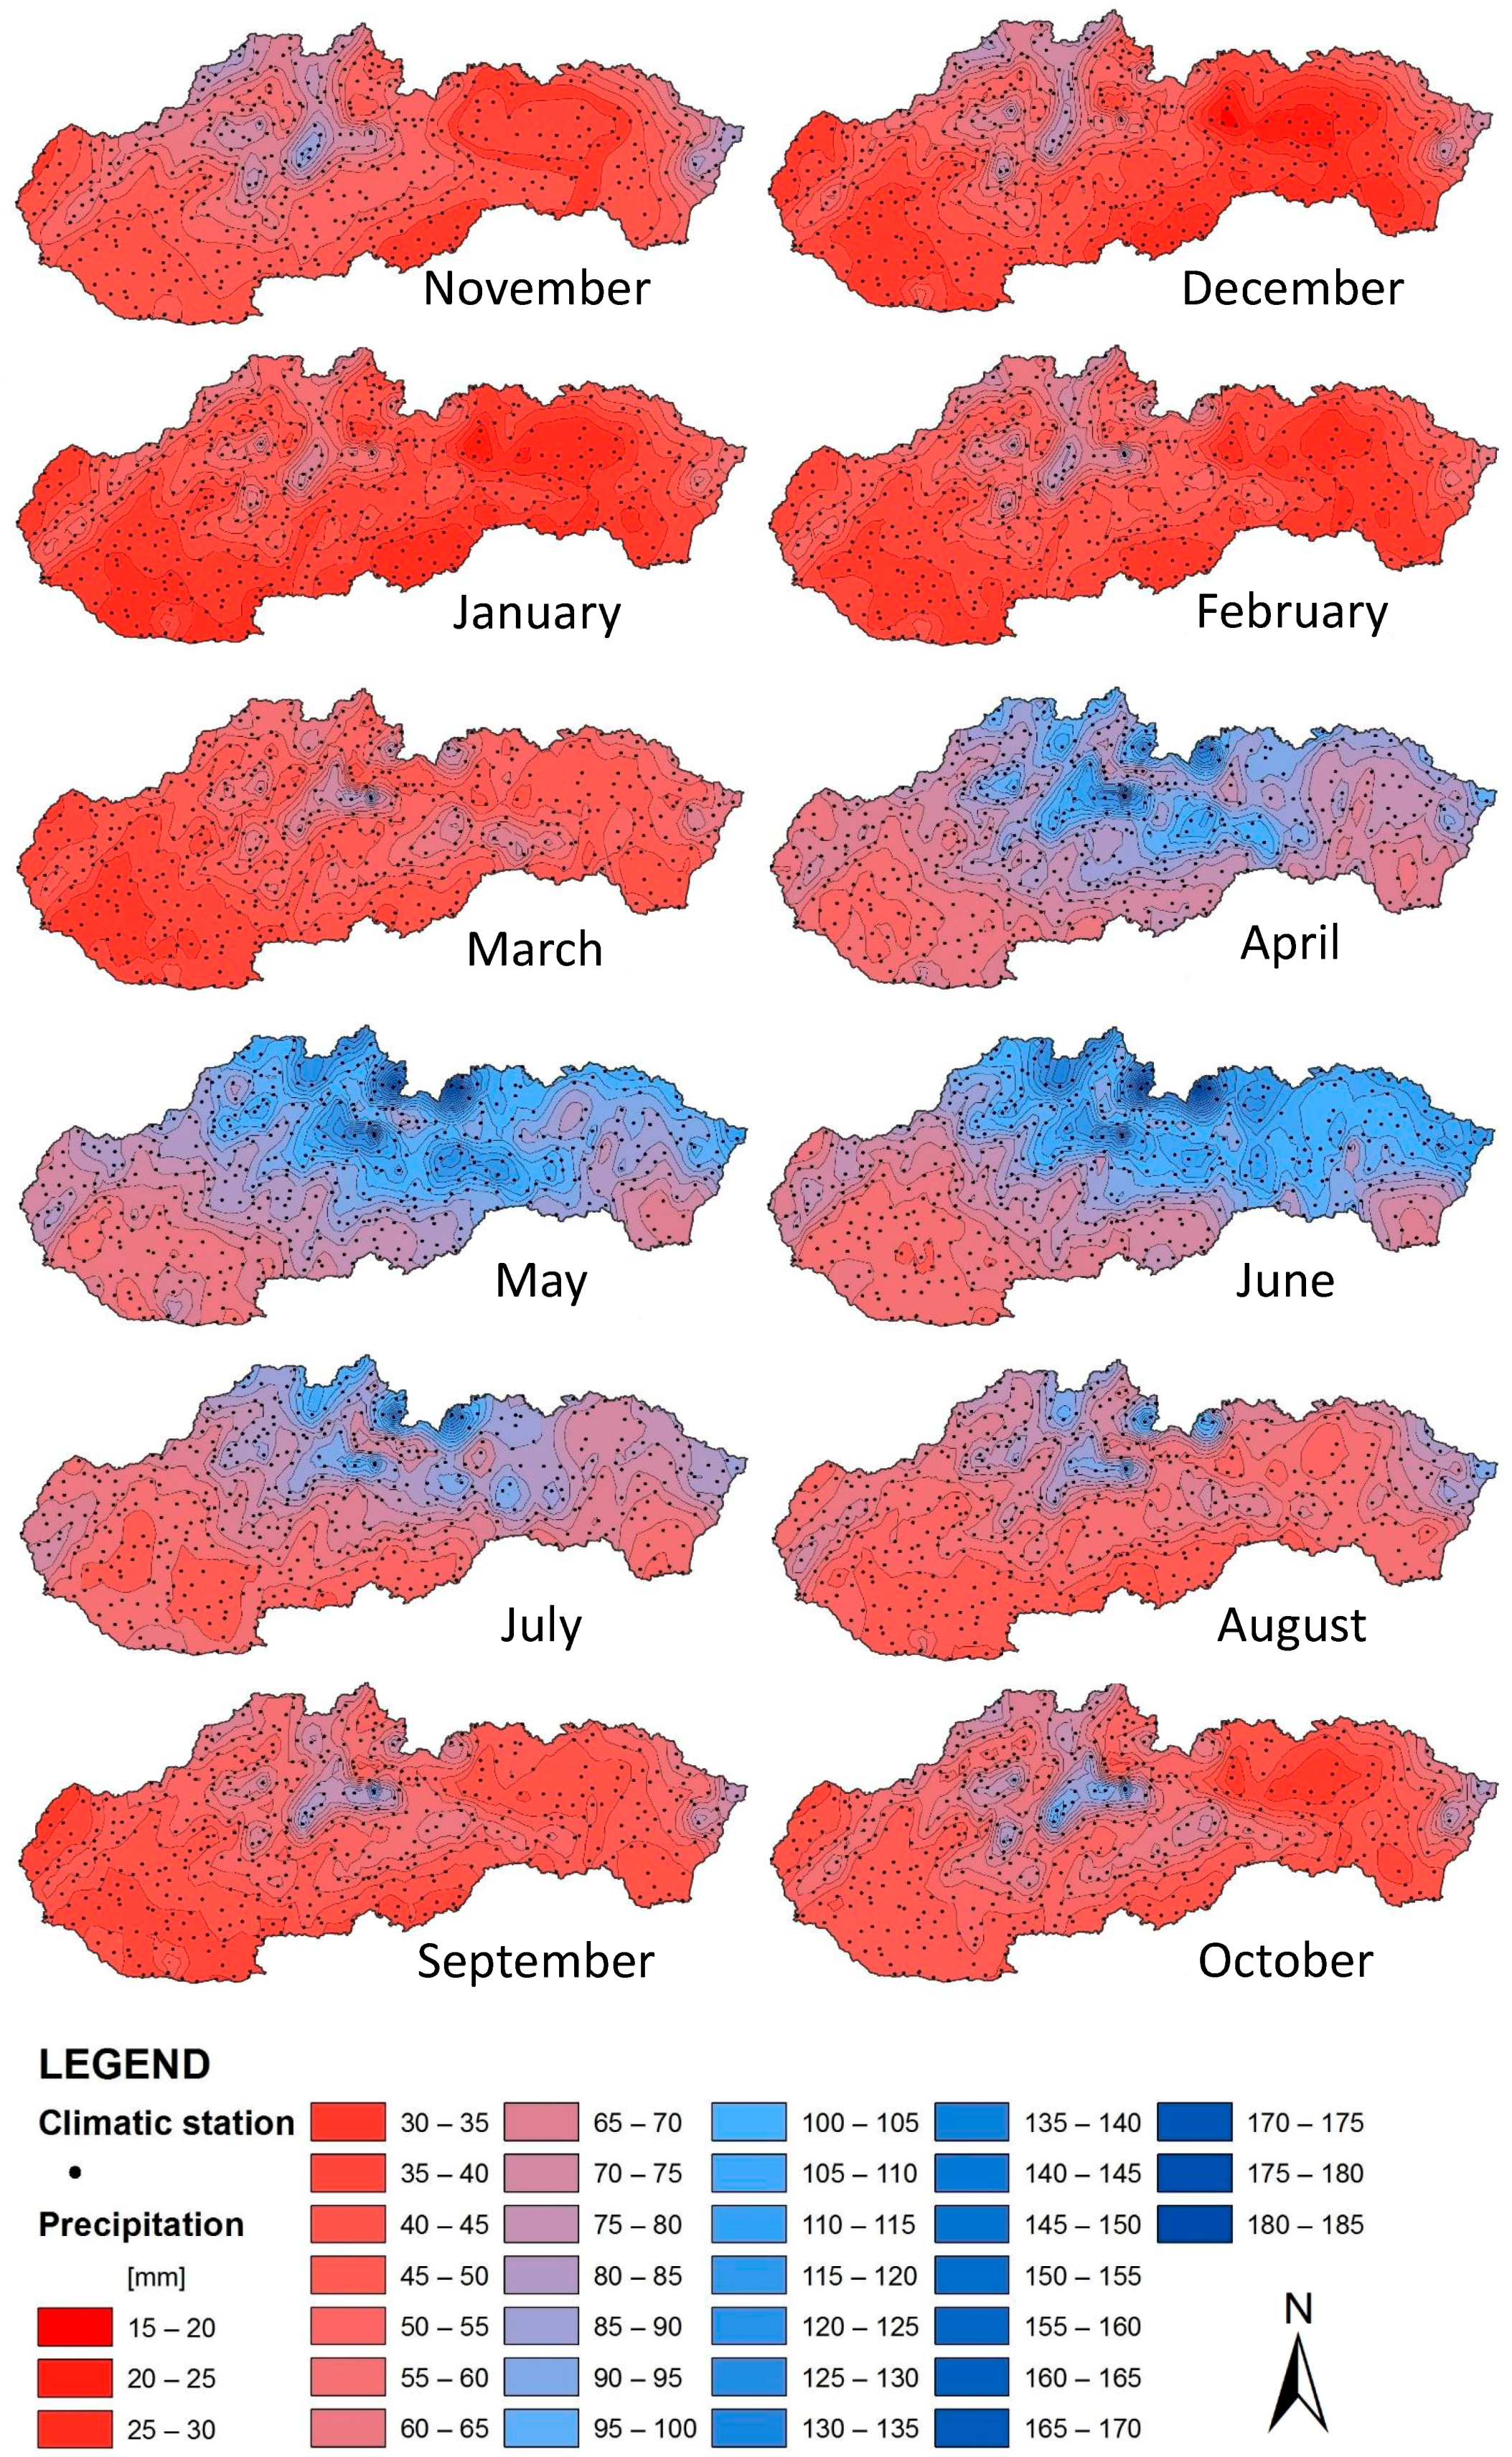
Figure 5.
Spatial distribution of annual, statistically significant precipitation trends (mm/year) in Slovakia during 1981–2013.
Figure 5.
Spatial distribution of annual, statistically significant precipitation trends (mm/year) in Slovakia during 1981–2013.
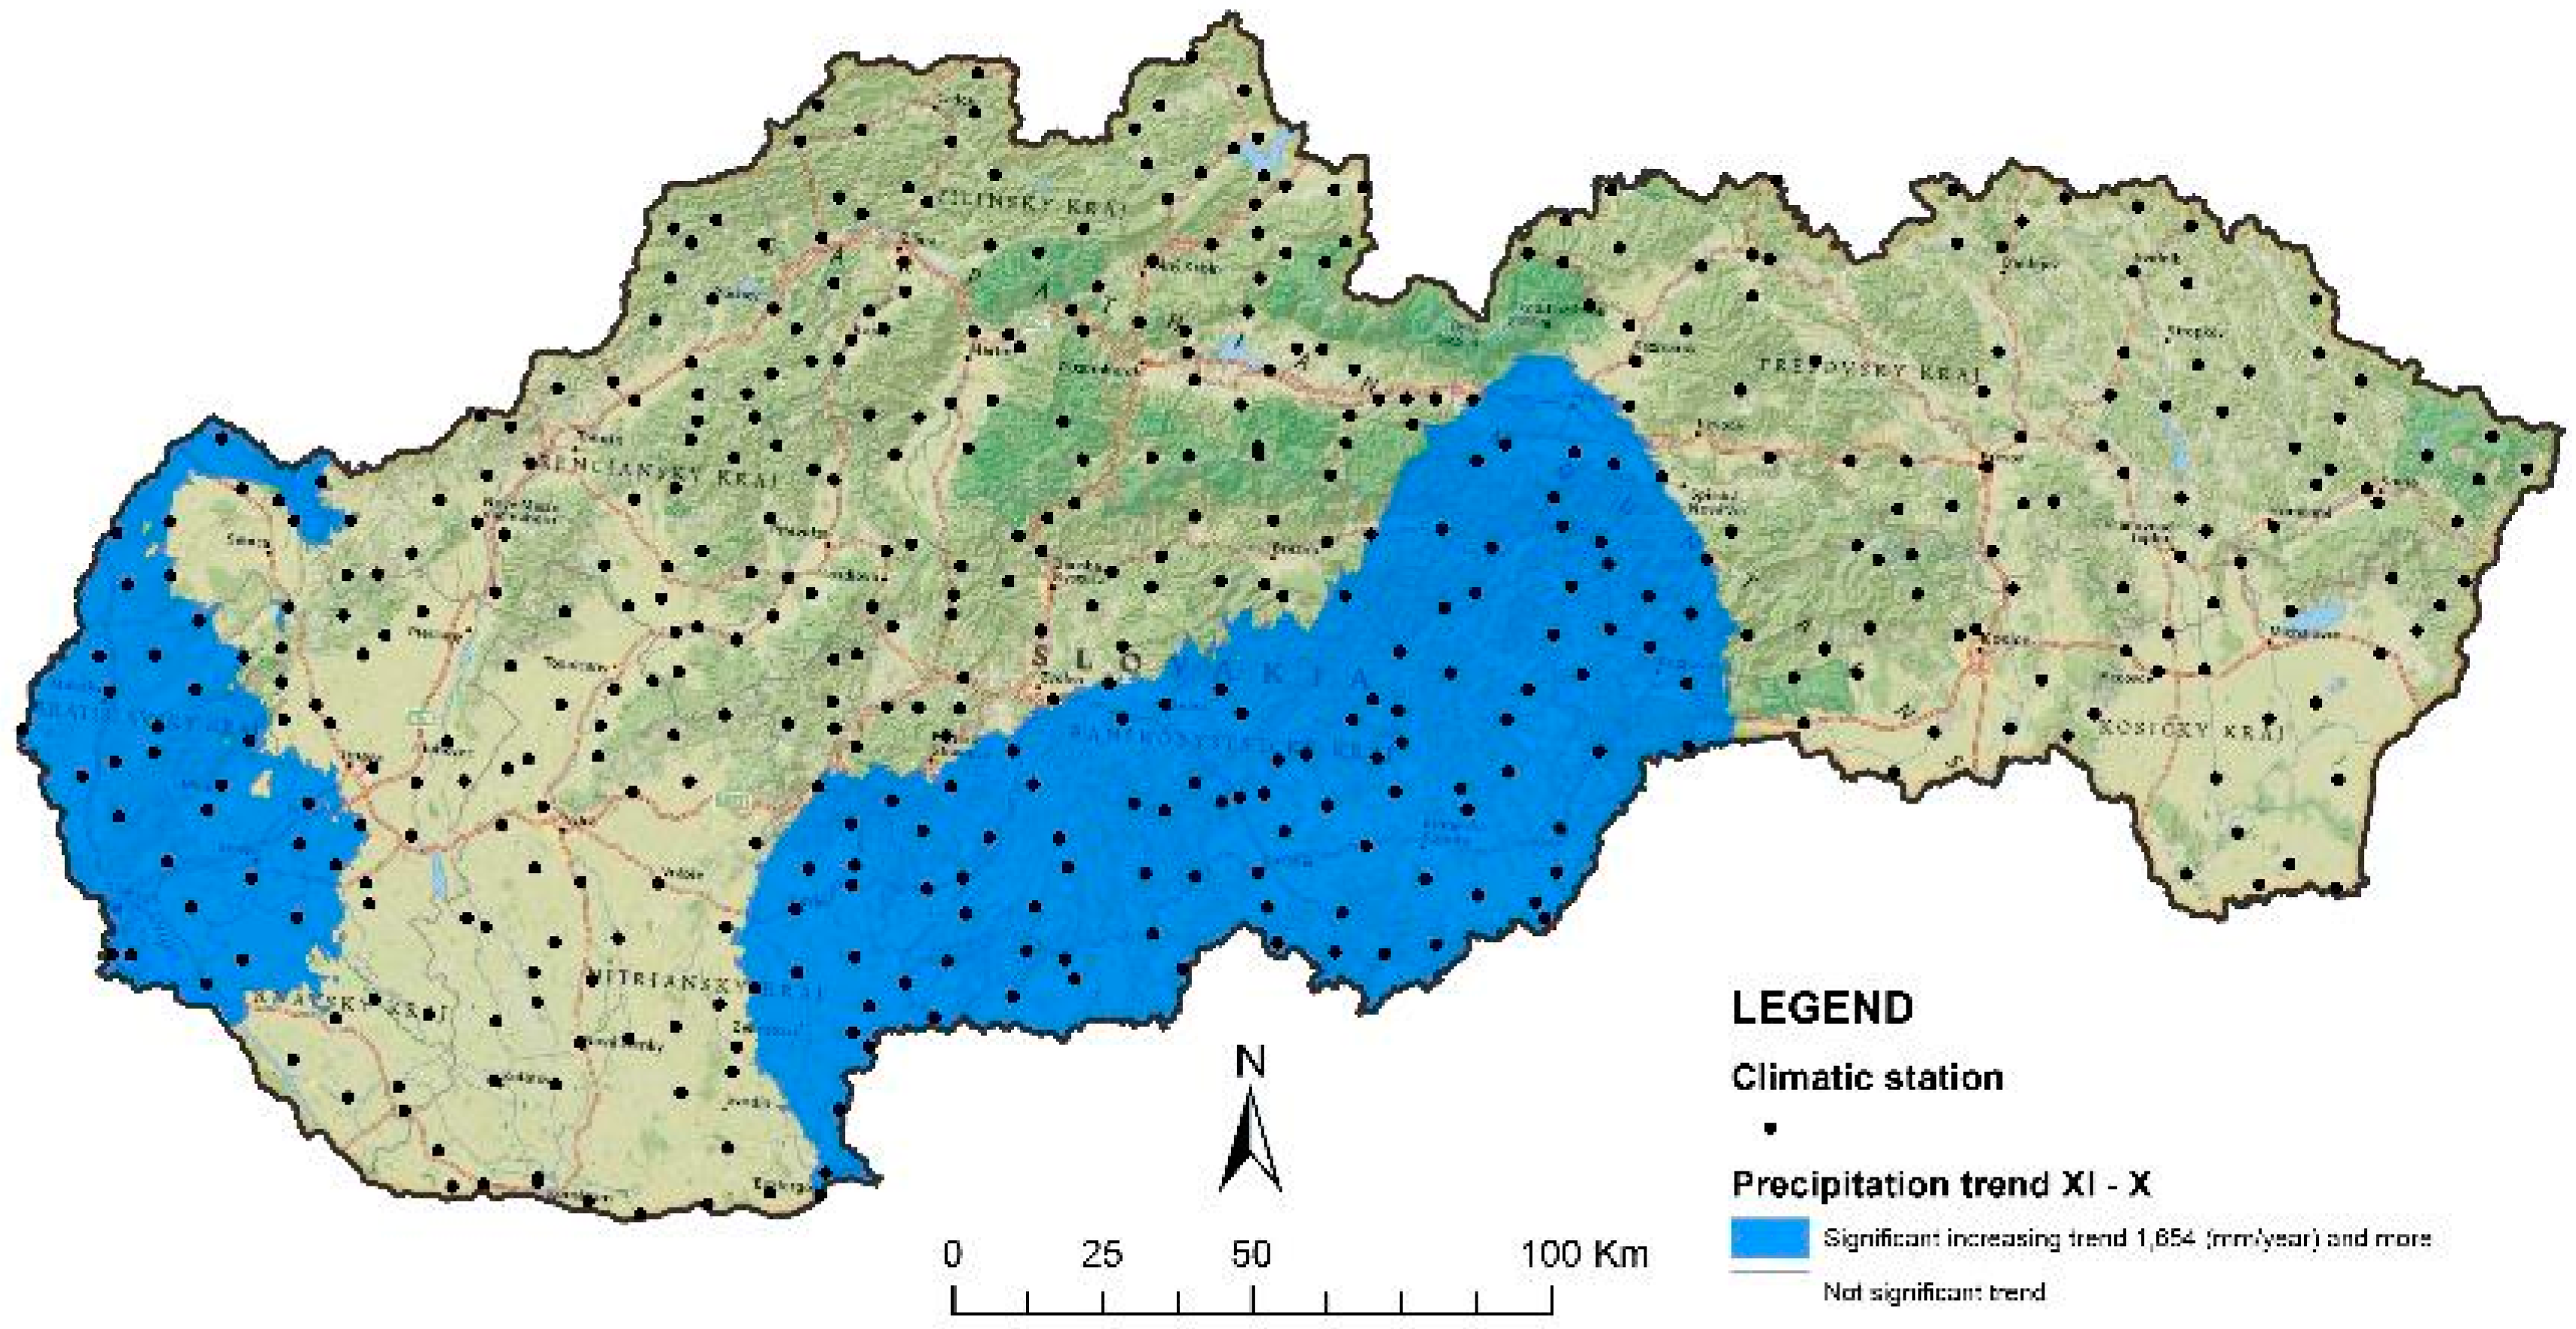
Figure 6.
Spatial distribution of monthly precipitation trends (mm/year) in Slovakia during 1981–2013. The maps show gauges with both significant and nonsignificant trends, in order to visualize the heterogeneous spatial precipitation distribution over the region.
Figure 6.
Spatial distribution of monthly precipitation trends (mm/year) in Slovakia during 1981–2013. The maps show gauges with both significant and nonsignificant trends, in order to visualize the heterogeneous spatial precipitation distribution over the region.

Figure 7.
Rain gauges of Vyšná Boca, Šumiac, Ústie nad Priehradou, and Oravská Polhora. Forward and backward series of the Sequential Mann–Kendall (SQMK) test on the annual precipitation data series.
Figure 7.
Rain gauges of Vyšná Boca, Šumiac, Ústie nad Priehradou, and Oravská Polhora. Forward and backward series of the Sequential Mann–Kendall (SQMK) test on the annual precipitation data series.

Table 1.
Descriptive statistics of annual, seasonal, and monthly precipitation (mm) in the 487 rain gauges monitored in the study during the period 1981–2013. Values were computed from all the evaluated stations.
Table 1.
Descriptive statistics of annual, seasonal, and monthly precipitation (mm) in the 487 rain gauges monitored in the study during the period 1981–2013. Values were computed from all the evaluated stations.
| Precipitation | Mean | Median | 95 Percentile | 5 Percentile |
|---|---|---|---|---|
| Annual | 720.2 | 692.7 | 1074.7 | 504.4 |
| Winter | 142.4 | 138.2 | 259.5 | 101.5 |
| Spring | 125.6 | 123.6 | 231.9 | 97.7 |
| Summer | 238.2 | 233.6 | 416.9 | 176.0 |
| Autumn | 173.0 | 168.5 | 319.7 | 138.4 |
| November | 54.8 | 48.7 | 116.8 | 37.0 |
| December | 52.1 | 46.0 | 117.2 | 35.2 |
| January | 44.1 | 39.6 | 99.4 | 26.9 |
| February | 39.8 | 37.1 | 86.0 | 27.4 |
| March | 44.6 | 37.4 | 103.4 | 30.8 |
| April | 48.8 | 43.6 | 105.9 | 34.6 |
| May | 78.9 | 70.0 | 163.8 | 56.7 |
| June | 87.6 | 82.8 | 159.9 | 60.4 |
| July | 86.2 | 76.8 | 189.6 | 56.8 |
| August | 70.7 | 62.3 | 156.9 | 53.3 |
| September | 62.0 | 52.2 | 145.9 | 45.0 |
| October | 50.7 | 41.9 | 120.0 | 37.3 |
Table 2.
Summary statistics of the precipitation trends in the annual, seasonal, and monthly data series for 487 stations in Slovakia during the period 1981–2013.
Table 2.
Summary statistics of the precipitation trends in the annual, seasonal, and monthly data series for 487 stations in Slovakia during the period 1981–2013.
| Precipitation | Number of Significant Decreasing Trends | Number of Significant Increasing Trends | % of Significant Trends | Number of Stations with No Trends |
|---|---|---|---|---|
| Annual | 2 | 155 | 32 | 330 |
| Winter | 3 | 68 | 15 | 416 |
| Spring | 1 | 20 | 4 | 466 |
| Summer | 0 | 123 | 25 | 364 |
| Autumn | 0 | 1 | 0 | 486 |
| November | 0 | 1 | 0 | 486 |
| December | 15 | 36 | 10 | 436 |
| January | 0 | 105 | 22 | 382 |
| February | 0 | 26 | 5 | 461 |
| March | 0 | 13 | 3 | 474 |
| April | 3 | 0 | 1 | 484 |
| May | 2 | 0 | 0 | 485 |
| June | 1 | 48 | 10 | 438 |
| July | 0 | 245 | 50 | 242 |
| August | 3 | 1 | 1 | 483 |
| September | 0 | 0 | 0 | 487 |
| October | 0 | 2 | 0 | 485 |
© 2017 by the authors. Licensee MDPI, Basel, Switzerland. This article is an open access article distributed under the terms and conditions of the Creative Commons Attribution (CC BY) license (http://creativecommons.org/licenses/by/4.0/).
Share and Cite
MDPI and ACS Style
Zeleňáková, M.; Vido, J.; Portela, M.M.; Purcz, P.; Blištán, P.; Hlavatá, H.; Hluštík, P. Precipitation Trends over Slovakia in the Period 1981–2013. Water 2017, 9, 922. https://doi.org/10.3390/w9120922
AMA Style
Zeleňáková M, Vido J, Portela MM, Purcz P, Blištán P, Hlavatá H, Hluštík P. Precipitation Trends over Slovakia in the Period 1981–2013. Water. 2017; 9(12):922. https://doi.org/10.3390/w9120922
Chicago/Turabian StyleZeleňáková, Martina, Jaroslav Vido, Maria Manuela Portela, Pavol Purcz, Peter Blištán, Helena Hlavatá, and Petr Hluštík. 2017. "Precipitation Trends over Slovakia in the Period 1981–2013" Water 9, no. 12: 922. https://doi.org/10.3390/w9120922
Note that from the first issue of 2016, this journal uses article numbers instead of page numbers. See further details here.