A Regional Water Optimal Allocation Model Based on the Cobb-Douglas Production Function under Multiple Uncertainties


Centre for Agricultural Water Research in China, China Agricultural University, Beijing 10083, China
*
Author to whom correspondence should be addressed.
Water 2017, 9(12), 923; https://doi.org/10.3390/w9120923
Submission received: 17 October 2017
/
Revised: 20 November 2017
/
Accepted: 22 November 2017
/
Published: 8 December 2017
(This article belongs to the Collection Water Policy Collection)
Abstract
:To optimize the water distribution of three industries based on the water demand prediction under multiple uncertainties, a fuzzy credibility-constrained interval two-stage stochastic programming (FCITSP) model base on the Cobb-Douglas production (CD) function was developed. The CD-FCITSP model integrated fuzzy credibility-constrained programming (FCP), an interval two-stage stochastic programming (ITSP) method and CD function. The developed model could deal with uncertainties with interval, random, and fuzzy features, reflect tradeoffs between different water use sectors, and provide water managers in arid regions with sustainable and reasonable water-allocation schemes under different credibility scenarios of local policies. Moreover, the relationships between economic benefits and water consumption were taken into consideration via the Cobb-Douglas production function. The developed model was applied to support the optimal allocation of limited water resources in Minqin County, northwest China. The obtained solution demonstrated that the developed method could help local water managers to effectively allocate limited water under multiple uncertainties and different credibility scenarios. In addition, water use efficiency could be promoted and the emissions of major pollutants could be reduced. The developed method could be extended to water management practices in other arid regions.
1. Introduction
Climate change, population growth, and rapid socio-economic development jointly deepen the conflicts between increasing water demand and decreasing water availability, which may be one of the main challenges that we have to face around the world in the coming years. Water scarcity has become the bottleneck of sustainable development in some water-stressed areas [1]. Thus, efficient water allocation schemes should be used to guarantee water use security, reduce the cost, and improve the water use efficiency. However, a water planning system includes many complex factors, such as fluctuations in water demand, unpredictable local policies and changeable market environments, which bring great challenges for water managers in making appropriate decisions [2]. Therefore, more useful tools were put forward to help water managers solve such complex practical problems.
In the process of water resource planning, water demand forecast plays a significant role and is often regarded as the basis for water allocation. In recent decades, many researchers have tried to propose various types of methods to obtain more precise water demand prediction results. These methods can be roughly divided into two classes, including models driven by historical data [3,4,5,6,7] and those based on water-use sector analysis [8,9,10,11]. Some researchers noticed that the forecasting accuracy was not only related to the availability of historical data, but also relevant to local development plans. Therefore, economic models were gradually introduced to water demand prediction to measure the policy influences [12,13,14]. Among these methods, Zhang et al. (2013) [15] firstly adopted the Cobb-Doulas (CD) production function to establish a regional water demand prediction model by viewing water demand as the output of production. This study simply used the form of CD function without any practical meaning, missing the connections between water demand and local development plans. Future investments and benefit demands can play key roles in forecasting water demand through the CD function, although little research handled that. In addition, although water demand prediction was used as the foundation of water allocation in many studies, it was rarely coupled with local development plans before. Thus, the CD function could be used to simulate the relationship between water consumption and total production output, and forecast the future water demand under local development policies. The prediction results could be used in the optimization model to obtain optimal water distribution schemes.
Optimization models were widely used to help water managers obtain efficient allocation schemes. Given that water managers had to face complex uncertainties in practical problems, much research has been focused on the development of optimization models dealing with multiple uncertainties over the past decades [16,17,18,19,20,21]. The randomness of available water amount and the imprecision of socio-economic data usually confused water managers before the interval two-stage stochastic programming (ITSP) had been developed. ITSP is an effective model for handling uncertainties expressed as imprecise parameters with known upper and lower bounds as well as random variables with known probability distributions [22]. Moreover, uncertainties in many practical allocation problems were expressed as fuzzy sets, which called for effective methods to facilitate communicating fuzzy uncertainties into the optimization process. Due to the effectiveness in addressing uncertainties expressed as fuzzy sets, fuzzy programing was integrated into the ITSP by many researchers [23,24,25]. As one of the typical fuzzy programming model, fuzzy credibility-constrained programming (FCP) could effectively deal with allocation problems with fuzziness in constraints [26,27,28]. The fuzzy credibility-constrained interval two-stage stochastic programming model (FCITSP) integrated ITSP and FCP. However, the fuzziness in local policies, such as environmental policies, was neglected in planning processes. Therefore, multiple uncertainties in water resources planning, such as fuzziness in local policies, imprecision in economic features and randomness of available water level, could be fully considered in FCITSP model for optimizing water distribution based on the prediction results from CD function.
In general, to our best knowledge, there was no research found in integrating the CD function and FCITSP to optimally allocate regional water resources. Therefore, to address the uncertainties and other problems in reality, the objective of this study is to develop a fuzzy credibility-constrained interval two-stage stochastic programming model based on the Cobb-Douglas production function (CD-FCITSP) for forecasting water demand and supporting water resources management under multiple uncertainties. CD-FCITSP will not only deal with uncertainties with interval, random, and fuzzy features, but also reflect the tradeoffs between different water use sectors and provide sustainable and reasonable water-allocation schemes under different credibility scenarios of local policies in arid regions. Besides, a water resources allocation problem from a real case will be studied to illustrate the applicability of the proposed model.
2. Methodology
The framework of the CD-FCITSP method is shown in Figure 1. This model includes water demand forecasting and water-allocation optimization among three industries. The future water targets are obtained through CD function simulation, which can well reflect the relationship between water consumption and economic benefits. In optimization parts, interval programming (IP), two-stage stochastic programming (TSP), and fuzzy credibility-constrained programming (FCP) are incorporated into a general optimization framework to solve specific problems. For example, TSP is an effective method for problems where policy scenarios analysis is needed and the related uncertainty is random [29]. IP can handle the uncertainty presented as interval values, and FCP model can tackle uncertainties presented as fuzzy sets. The detailed formulation of the CD-FCITSP model is introduced as follows:
2.1. Cobb-Douglas Production Function (CD Function) for Water Demand Prediction
American economist Paul Douglas found that the ratio between national income created by capital and national income created by labor remained constant for a long period of time based on historical statistics from 1899 to 1922 in the United States [30]. To solve this problem, Douglas consulted the mathematician Charles Cobb and finally found that the relationship between output and wage labor, fixed assets can be described as follows [31]:
where Y represents the national income; A indicates the technical level; K denotes capital investments; L is the number of labor input. α is the contribution ratio of capital to national income; and 1 − α represents the contribution ratio of labor to national income.
The production function has been used for many years to demonstrate the distribution of Western economics. However, the assumed technical level constant and the condition [α + (1 − α) = 1] limited CD function in practical applications. In 1942, Jan Tinbergen, the winner of the first Nobel Prize in economics, made a significant improvement to the Cobb-Douglas production function. He transformed A into the form of dynamic variables A(t) [32] and the form of function was rewritten as:
where α is Capital elasticity, indicating an average increase of α% in output when the capital increases by 1%; β denotes labor elasticity, indicating an average increase of β% in output when the labor force is increased by 1%.
With the development of economy and society, water resources has gradually become a kind of scarce resources and the value of water resources has been highlighted and no longer provided with free of charge. As an important resource for the sustainable development of the national economy, water resources are an indispensable factor in the production. Because water shortage and low water price limit the sustainable utilization of water resources, it is necessary to analyze the relationship between economic benefit and water consumption through a feasible method. Therefore, water resources have been considered as a kind of input factor into the CD function to calculate the water production benefits by replacing L with W, which denotes the number of water resources input [33]. The new form of water production function, which could describe the relationships between water consumption and benefits, has been established as follows:
where W means the number of water resources input; β denotes water elasticity, indicating an average increase β% in output when the water input is increased by 1%. To calculate the A(t), α and β, the Equation (3) should be taken the logarithm and can be rewritten as:
After the data fixed-asset investment (K), water consumption (W) and benefits of every industry (Y) in period t are put into Equation (4), A(t), α and β of each industry can be obtained by multiple linear regression. Besides, future water demand can be made via Equation (3) when the future benefits requirements and expected fixed-asset investment of each industry are known. The water demand prediction formula can be obtained as follows:
2.2. Fuzzy Credibility-Constrained Interval Two-Stage Stochastic Programming (FCITSP) for Regional Water Allocation
Fuzzy credibility-constrained programming (FCP) have been proved to be a useful tool to tackle parameters of the constraints presented as fuzzy sets and can provide water managers abundant allocation schemes under different credibility levels [4,26,27]. A typical FCP model is shown as follows:
subject to:
where xi represents the decision variables; ci denotes the coefficients; and are fuzzy coefficients of constraints; denotes the credibility level; and i denotes the number of decision variables.
From the existing research [34], if and are triangular fuzzy numbers as , , in Equation (7) can be transferred as follows:
As the meaningful credibility level in reality, should be greater than 0.5. Thus, the following relationship can be obtained by Equation (9):
In spite that FCP model did well in handling the uncertainties express as fuzzy sets, multiple uncertainties such as imprecise numbers and random events should be fully considered in planning water schemes. Hence, the integrated model including FCP and ITSP was taken into account to solve the water allocation problems under multiple uncertainties. After the development of TSP by Huang and Loucks (2000) [16] for handling the uncertainties expressed as random variables, interval parameters were introduced into the stochastic programming framework to tackle the ambiguous intervals existing in practical problems. Thus, the fuzzy credibility-constrained interval two-stage stochastic programming (FCITSP) model integrating ITSP and FCP with a minimized cost objective can be formulated as follows:
subject to:
- (1)
- available water constraint
- (2)
- regional allowable chemical oxygen demand emission constraint
- (3)
- minimum water demand constraint
- (4)
- Non-negative constraint
The meaning of the parameters and variables in the model above is shown in Table 1.
To solve this model, the method for solving FCP model and the two-step interactive algorithm for solving ITSP model are jointly used in this study. Form Equation (10), the Equation (13) can be rewritten as follows:
with the credibility level being changed from 0.5 to 1, different regional allowable chemical oxygen demand emission levels have been provided to the ITSP model. Since the objective is to minimize the total cost, the sub-model corresponding to should be solved first and the first stage variable should be transferred into through the typical two-step interactive algorithm. Then, the FCITSP model can be solved through decomposing it into two sub-models. The first model corresponding to the lower bound of the objective function can be formulated as follows:
Subject to:
where and are the decision variables; and , , and are the solutions of the sub-model above. The optimal solutions for the first-stage variables can be obtained as .
The second model corresponding to the upper bound value of the objective function is written as follows:
Subject to:
where is the decision variable. and are the solutions of the sub-model above. Thus, optimal solutions of the FCITSP model can be obtained as:
Thus, the optimized water-allocation schemes would be
where denotes the optimal water allocation.
3. Application
3.1. Study Area
The study area is Minqin County (102°52′–103°30′ E, 38°22′–39°6′ N) (Figure 2), which lies in the arid regions of northwestern China in Gansu Province and surrounded by the Badain Jaran and Tengger Desserts in the west, north and east [35,36]. Minqin County is located in the lower reaches of the Shiyang River Basin, with an area of 41,400 km2 and a population of 273,600 by the end of 2015. Minqin County presents a typical region with arid continental inland climate, characterized by low and irregular rainfall, high evaporation and eminent drought periods [8]. The dominant industry in Minqin is agriculture, which accounts for 70–80% of the total water consumption in region.
Due to economic development and population growth in the upper and middle reaches of Shiyang River basin, the available water to Minqin County has decreased sharply in recent years, which led to serious water shortages and environmental deteriorations. Moreover, the rapid development of secondary and tertiary industries caused intense water contradictions among the three industries. To alleviate the water shortage contradiction among the industries, water demand prediction and water allocation are both significant and effective for sustainable water use and ecological restoration. Optimizing water allocation plans among the three industries under different flow levels based on the water demand forecasting and local ecological policies can certainly help local water managers to plan water allocation schemes. Thus, the CD-FCITSP model was considered suitable for Minqin, and the results of this study are expected to contribute to making appropriate water allocation decisions.
3.2. Data Collection
Total benefits, water consumption, and fixed-asset investment of the three industries during 2006–2015 were collected from Statistical Yearbook of Minqin County (2006–2015). These data were used to forecast the water demand of every industry. Available water amount, water price, extra water price, the target water allocation amount, allowable regional total COD emission and others were obtained from The Shiyang River Basin Key Governance Projects (2007), field research and statistics (Table 2 and Table 3).
4. Results and Discussion
4.1. Results of Water Demand Prediction
The CD water production function was used to predict the future water demand based on simulating the relationships between water consumption and total benefits. To assess the accuracy of simulation, deterministic coefficient (R2) and the qualified rate (QR), were used in this study. R2 can measure the degree of agreement between the predicted and actual data sets and QR can check the magnitude of average accuracy among all the predictions [8]. The indicators could be calculated as follows:
where , , and represent the t-th of the predicted values, actual values, and mean value of all the actual data, respectively; I and J denote the number of qualified and the total forecasts.
As the results of simulation, related parameters obtained by CD function are listed in Table 4 and simulation results are shown in Figure 3. The values of two indicators R2 and QR in Table 4 demonstrated that, the precision grade of the simulation results is higher than the first grade standard for runoff forecasting accuracy and is thus relatively reliable [37]. This proved that the CD function could well simulate the relationship between water consumption and total benefits. A(t), α and β represent the technique level, asset investment, and water input contribution to total benefits, respectively. Positive exponent parameter values suggest the corresponding input elements have positive effects on the increase of benefits. Furthermore, the values of α and β can reflect the sensitivity degree of the input-element value to total economic benefits as the larger the value of these parameters, the higher the return on the corresponding investment element. The opposite results can be obtained when the exponent parameter is negative. According to the results calculated by CD function in this study (Table 4), technique factor A(t) was found to be one of the most significant factors for increasing industry benefits in Minqin during the past ten years, especially for PI. The value of A(t) is related to the development level of technical standards in the local industries, which differs greatly in developed and developing countries. Moreover, asset investment played a pivotal role in increasing total benefits for SI and TI. Due to currency devaluation and the rapid development of technique in the past ten years, higher economic benefits were obtained with less water consumption in PI and TI.
According to the local economic growth planning, the total benefits of the three industries in 2016 should increase by 5% to 10% compared to those in 2015, and the fixed-asset investment of the three industries were 7.82, 120.89, and 57.00 × 10⁸ CNY, respectively. All the data were embedded within the prepared CD function to reach the minimum water demand values of sector n () in 2016. Therefore, the of the three industries were obtained as [22278.97, 23183.90], [926.94, 683.25], and [863.22, 1270.19] × 104 m3, respectively, which would be inputs for the optimization model.
4.2. Water Resources Optimal Allocation Results
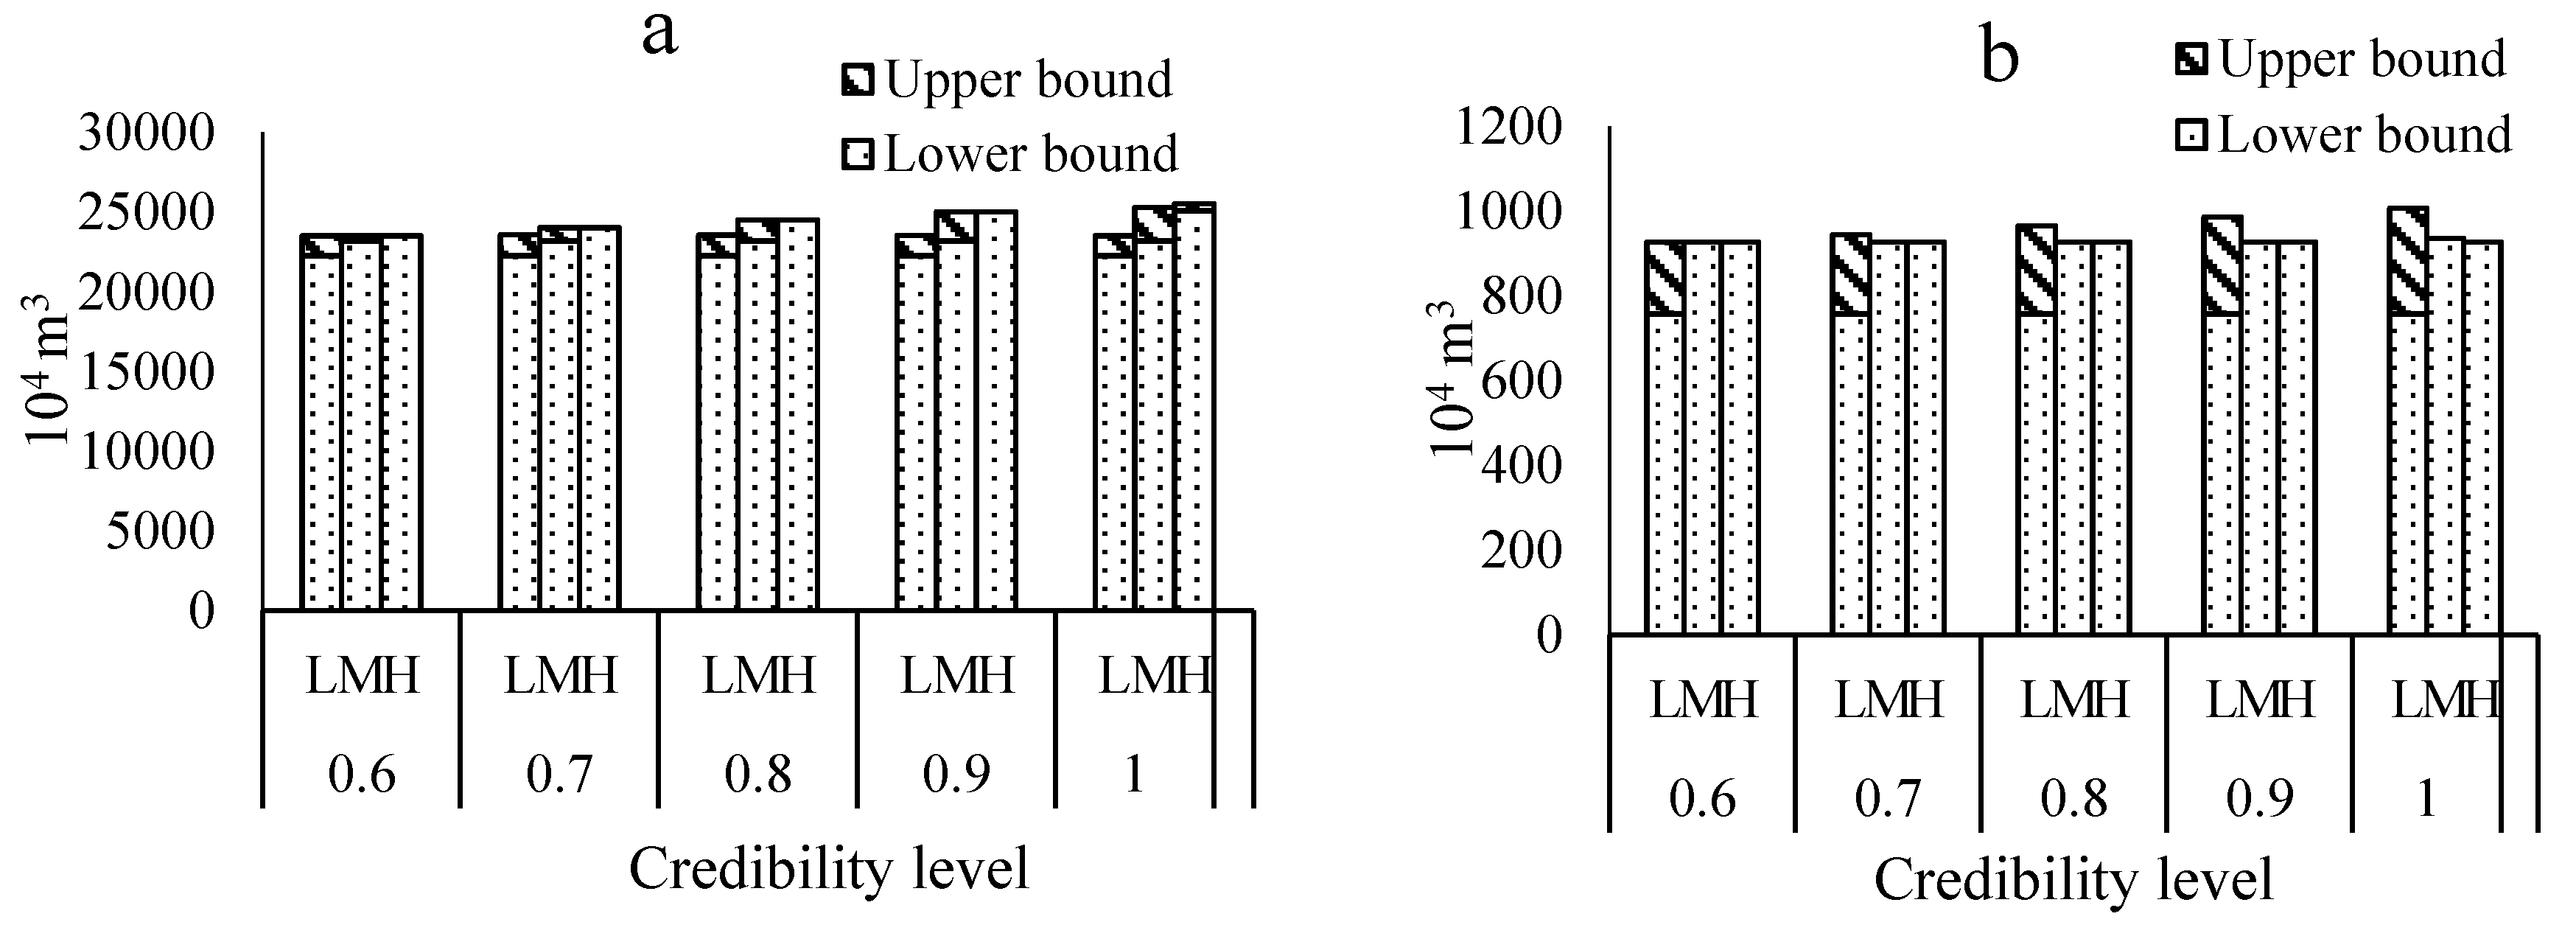
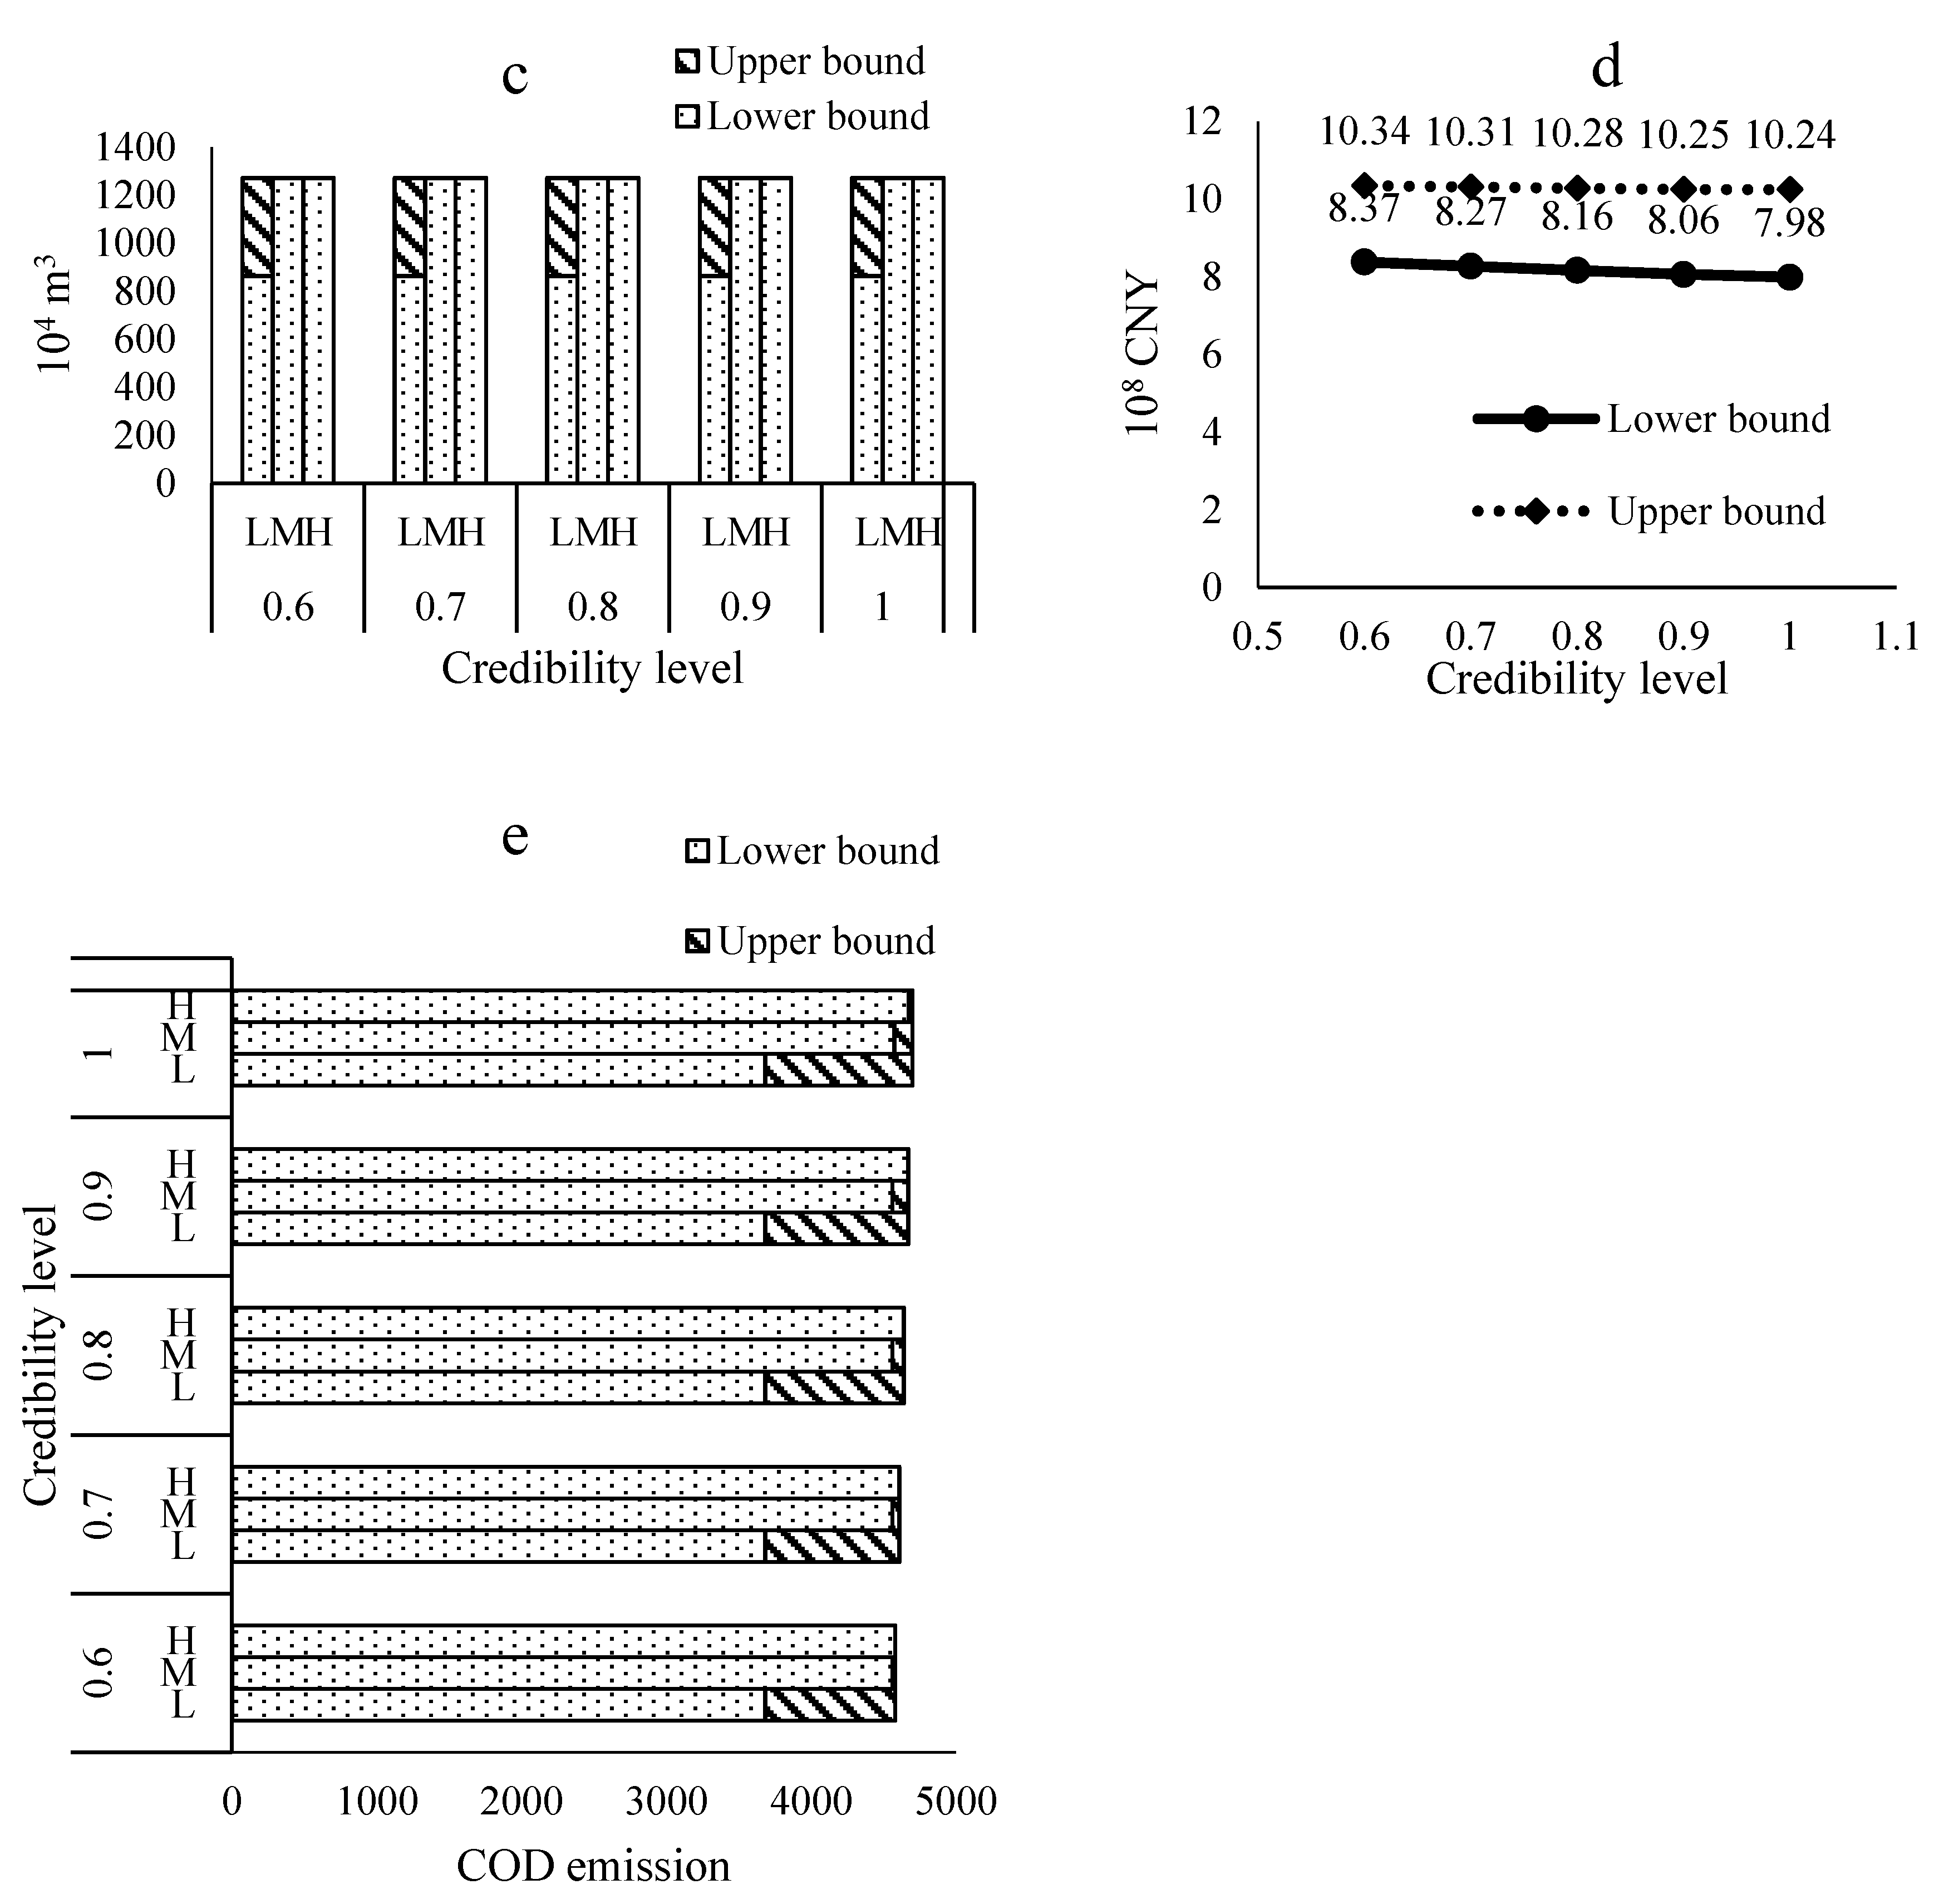
In the light of environmental planning in Minqin, the allowable regional total COD emission in 2016 was [4550, 4700, 5100] × 103 kg. All the parameters were input to the FCITSP model. The optimization results under different credibility levels are shown in Figure 4. It can be found in Figure 4e that, when the credibility level is closer to 1, more water would be allocated due to higher tolerance limits for total COD discharge. When the credibility level increases, the upper bound for the SI sector would increase under low flow level. This indicates that the water target of SI would be preferentially satisfied when there is plenty room for COD emission. It is noteworthy that PI is the most sensitive sector to the changes in available water amount, which means that water distribution to PI should be first reduced firstly when the water shortage occurs. As shown in Figure 4d, the total cost would rise with the reduction of credibility level due to the more rigorous requirements of COD discharges.
To demonstrate the practicality of the developed model, the allocation scheme in 2016 was used to compare with the obtained optimization results. Since the total water consumption of the three industries in 2016 was close to the medium level we divided, we compared the key parameters under these two conditions in Table 5. As shown in Table 5, optimization results would have better performance than the actual allocation scheme in 2016. The main difference made by the optimization results would be the allocation of more water to SI and TI, which indicates that the water consumption of PI should be reduced in the future. Furthermore, the comparisons in Table 4 demonstrates that the CD-FCITSP model could make contributions to improving the water-use efficiency with low costs under environmental restrictions, manifesting that the CD-FCITSP model results would be helpful for local water managers to plan water-allocation policies in the future.
4.3. Discussions
This study developed a system for optimizing water allocation among three industries, which included the CD water production function model for water-demand simulation and the FCITSP model for optimizing water resources allocation under uncertainty. The developed model attempted to generate more reasonable water allocation schemes with a more comprehensive understanding of the complexities in water resources planning. Multiple uncertainties in water planning, such as fuzziness in local policies, imprecision in economic features and randomness of available water level, could be fully considered in FCITSP model for optimizing water allocation plans based on the prediction results from CD function. As an environmental constraint, the allowable amount of regional total COD discharges would play an important role in the developed model, which is good for the sustainable development of the region as this is a key factor considered by water managers in the planning of water schemes.
Results indicate that the developed model was an effective method to optimize local water distribution. Therefore, the developed model can be used with other meaningful constraints to help improve water-use efficiency in arid regions similar to Minqin County and obtain suitable water allocation schemes. Besides, the prediction model and optimization model can contribute to other allocation problems as well. Nevertheless, the developed model has limitations in dealing with multiple objectives. More details on water supply, transformation, and allocation processes should also be further considered. More comparisons between CD-FCITSP and other models should be made. These should be taken into account in the future.
5. Conclusions
In this study, a fuzzy credibility-constrained interval two-stage stochastic programming based on CD production function (CD-FCITSP) was developed for supporting the regional water allocation among three industries. The CD-FCITSP has advantages in: (1) using CD function to forecast the water demand through establishing close connections between the regional future plans and industrial water demands; (2) integrating simulation and optimization into a framework to obtain reasonable water allocation schemes; (3) effectively reflecting multiple uncertainties such as random events, fuzzy sets, and imprecise numbers; (4) and offering a number of planning schemes under pollutant discharge constraints to support local sustainable development.
The CD-FCITSP model has been successfully applied to the planning of regional water resources allocation in Minqin County, China. By solving the developed model, optimal water allocation strategies under different creditable levels were determined. Comparisons of the key parameters between the 2016 practices and the optimal results under similar water availability levels showed the effectiveness of the model. The proposed framework can be applied to analyze the future variability in water availability and demand, improve water-use efficiency and support water planning in other arid regions. Moreover, the prediction model and the optimization model can be separately used in resources allocation and management. However, some limitations still exist in the developed model. For example, multiple objectives, more details, and more comparisons could be taken into account in further research.
Acknowledgments
This research was financially supported by the National Key R&D Program of China (No. 2017YFC0403201), National Natural Science Foundation of China (No. 51621061) and the National High Technology Research and Development Program of China (863 Program) (No. 2013AA102904). The authors are grateful to the editor and the anonymous reviewers for their insightful comments and suggestions.
Author Contributions
Fan Zhang and Ping Guo conceived the idea, managed the research work, and revised the manuscript. Qian Tan assisted in writing and revising the manuscript. Chenglong Zhang ran the model. Shanshan Guo conducted data collection and analysis. All authors read and approved the final manuscript.
Conflicts of Interest
The authors declare no conflict of interest.
References
- Zhao, J.; Li, M.; Guo, P.; Zhang, C.; Tan, Q. Agricultural water productivity oriented water resources allocation based on the coordination of multiple factors. Water 2017, 9, 490. [Google Scholar] [CrossRef]
- Ji, L.; Sun, P.; Ma, Q.; Jiang, N.; Huang, G.; Xie, Y. Inexact Two-Stage stochastic programming for water resources allocation under considering demand uncertainties and response—A case study of Tianjin, China. Water 2017, 9, 414. [Google Scholar] [CrossRef]
- Xiang, H.X.; Xiao, F.X.; Lei, X. Study on improved PCA-SVM model for water demand prediction. Adv. Mater. Res. 2012, 591–593, 1320–1324. [Google Scholar]
- Zeng, X.T.; Li, Y.P.; Huang, W.; Chen, X.; Bao, A.M. Two-stage credibility-constrained programming with Hurwicz criterion (TCP-CH) for planning water resources management. Eng. Appl. Artif. Intell. 2014, 35, 164–175. [Google Scholar] [CrossRef]
- Jain, A.; Varshney, A.K.; Joshi, U.C. Short-Term water demand forecast modelling at IIT kanpur using artificial neural networks. Water Resour. Manag. 2001, 15, 299–321. [Google Scholar] [CrossRef]
- House-Peters, L.A.; Chang, H. Urban water demand modeling: Review of concepts, methods, and organizing principles. Water Resour. Res. 2011, 47, 1837–1840. [Google Scholar] [CrossRef]
- Haque, M.M.; Rahman, A.; Hagare, D.; Kibria, G. Principal component regression analysis in water demand forecasting: An application to the Blue Mountains, NSW, Australia. Vet. Pathol. 2016, 45, 842–848. [Google Scholar]
- Gui, Z.; Li, M.; Guo, P. Simulation-Based inexact fuzzy Semi-Infinite programming method for agricultural cultivated area planning in the shiyang river basin. J. Irrig. Drain. Eng. 2016, 143. [Google Scholar] [CrossRef]
- Choudhury, B.U.; Sood, A.; Ray, S.S.; Sharma, P.K.; Panigrahy, S. Agricultural area diversification and crop water demand analysis: A remote sensing and GIS approach. J. Indian Soc. Remote 2013, 41, 71–82. [Google Scholar] [CrossRef]
- Ahmed, A.A.; Fogg, G.E.; Gameh, M.A. Water use at Luxor, Egypt: Consumption analysis and future demand forecasting. Environ. Earth Sci. 2014, 72, 1–13. [Google Scholar] [CrossRef]
- Zhu, L.Y.; Lei, X.Y.; Wen, J. Forecast analysis of Aksu city’s water demand based on quantitative quota method. J. Water Resour. Water Eng. 2012, 23, 16–18. (In Chinese) [Google Scholar]
- Zhang, Z.G.; Shao, Y.S.; Xu, Z.X. Prediction of urban water demand based on Engel Index and Hoffmann Coefficient. Shuili Xuebao 2010, 41, 1304–1309. (In Chinese) [Google Scholar]
- Jia, S.; Long, Q.; Wang, R.Y.; Yan, J.; Kang, D. On the inapplicability of the Cobb-Douglas production function for estimating the benefit of water use and the value of water resources. Water Resour. Manag. 2016, 30, 3645–3650. [Google Scholar] [CrossRef]
- Zhang, D.; Guo, P. Integrated agriculture water management optimization model for water saving potential analysis. Agric. Water Manag. 2016, 170, 5–19. [Google Scholar] [CrossRef]
- Zhang, Q.; Diao, Y.; Dong, J. Regional water demand prediction and analysis based on Cobb-Douglas model. Water Resour. Manag. 2013, 27, 3103–3113. [Google Scholar] [CrossRef]
- Huang, G.H.; Loucks, D.P. An inexact two-stage stochastic programming model for water resources management under uncertainty. Civ. Eng. Environ. Syst. 2000, 17, 95–118. [Google Scholar] [CrossRef]
- Li, Y.P.; Huang, G.H.; Nie, S.L.; Nie, X.H.; Maqsood, I. An interval-parameter two-stage stochastic integer programming model for environmental systems planning under uncertainty. Eng. Optim. 2006, 38, 461–483. [Google Scholar] [CrossRef]
- Guo, P.; Huang, G.H.; He, L.; Zhu, H. Interval-parameter two-stage stochastic semi-infinite programming: Application to water resources management under uncertainty. Water Resour. Manag. 2009, 23, 1001–1023. [Google Scholar] [CrossRef]
- Ren, C.F.; Li, R.H.; Zhang, L.D.; Guo, P. Multiobjective stochastic fractional goal programming model for water resources optimal allocation among industries. J. Water Resour. Plan. Manag. 2016, 142. [Google Scholar] [CrossRef]
- Zhang, F.; Guo, P.; Li, M. Planting structure optimization of main crops in the middle reaches of Heihe River basin based on dual interval two stage stochastic programming. J. China Agric. Univ. 2016, 21, 109–116. (In Chinese) [Google Scholar]
- Tan, Q.; Huang, G.H.; Cai, Y.P. Radial interval chance-constrained programming for agricultural non-point source water pollution control under uncertainty. Agric. Water Manag. 2011, 98, 1595–1606. [Google Scholar] [CrossRef]
- Wang, Y.Y.; Huang, G.H.; Wang, S.; Li, W. A stochastic programming with imprecise probabilities model for planning water resources systems under multiple uncertainties. Stoch. Environ. Res. Risk Assess. 2016, 30, 2169–2178. [Google Scholar] [CrossRef]
- Zeng, X.; Kang, S.; Li, F.; Zhang, L.; Guo, P. Fuzzy multi-objective linear programming applying to crop area planning. Agric. Water Manag. 2010, 98, 134–142. [Google Scholar] [CrossRef]
- Zhang, Y.; Hang, G. Fuzzy robust credibility-constrained programming for environmental management and planning. J. Air Waste Manag. 2010, 60, 711–721. [Google Scholar] [CrossRef]
- Li, X.M.; Lu, H.W.; Li, J.; Du, P.; Xu, M.; He, L. A modified fuzzy credibility constrained programming approach for agricultural water resources management—A case study in Urumqi, China. Agric. Water Manag. 2015, 156, 79–89. [Google Scholar] [CrossRef]
- Zhang, C.; Guo, P. A generalized fuzzy credibility-constrained linear fractional programming approach for optimal irrigation water allocation under uncertainty. J. Hydrol. 2017, 553, 735–749. [Google Scholar] [CrossRef]
- Lu, H.; Du, P.; Chen, Y.; He, L. A credibility-based chance-constrained optimization model for integrated agricultural and water resources management: A case study in South Central China. J. Hydrol. 2016, 537, 408–418. [Google Scholar] [CrossRef]
- Tan, Q.; Huang, G.H.; Cai, Y.P. Multi-Source multi-sector sustainable water supply under multiple uncertainties: An inexact Fuzzy-Stochastic quadratic programming approach. Water Resour. Manag. 2013, 27, 451–473. [Google Scholar] [CrossRef]
- Zhang, C.; Guo, P. An inexact CVaR two-stage mixed-integer linear programming approach for agricultural water management under uncertainty considering ecological water requirement. Ecol. Indic. 2017. [Google Scholar] [CrossRef]
- Cobb, C.W.; Douglas, P.H. A theory of production. Am. Econ. Rev. 1928, 18, 139–165. [Google Scholar]
- Aghion, P.; Howitt, P. A model of growth through creative destruction. Econometrica 1992, 60, 323–351. [Google Scholar] [CrossRef]
- Tinbergen, J. Professor douglas’ production function. Revue de Linstitut International de Statistique 1942, 10, 37–48. [Google Scholar] [CrossRef]
- Xie, S.L.; Zhong-Yi, K.E.; Ding, X.T. Prediction of water shortage quantity of china based on Cobb-Douglas production function. Water Sav. Irrig. 2014. [Google Scholar]
- Li, X.; He, L.; Lu, H. Research on plan model of water resources of uncertainty agriculture based on fuzzy and credibility constrained. J. Water Resour. Water Eng. 2014, 108–114. (In Chinese) [Google Scholar]
- Tan, Q.; Zhang, S.; Li, R. Optimal use of agricultural water and land resources through reconfiguring crop planting structure under socioeconomic and ecological objectives. Water 2017, 9, 488. [Google Scholar] [CrossRef]
- Ren, C.; Guo, P.; Yang, G.; Li, R.; Liu, L. Spatial and temporal analyses of water resources use efficiency based on data envelope analysis and malmquist index: Case study in Gansu province, China. J. Water Resour. Plan. Manag. 2016, 142, 4016066. [Google Scholar] [CrossRef]
- AQSIQ (General Administration of Quality Supervision, Inspection and Quarantine of the People’s Republic of China); SAC (Standardization Administration of the People’s Republic of China). Standard for Hydrological Information and Hydrological Forecasting; AQSIQ and SAC: Beijing, China, 2009. GB/T 22482-2008. (In Chinese) [Google Scholar]
Figure 1.
Framework of the CD-FCITSP model.
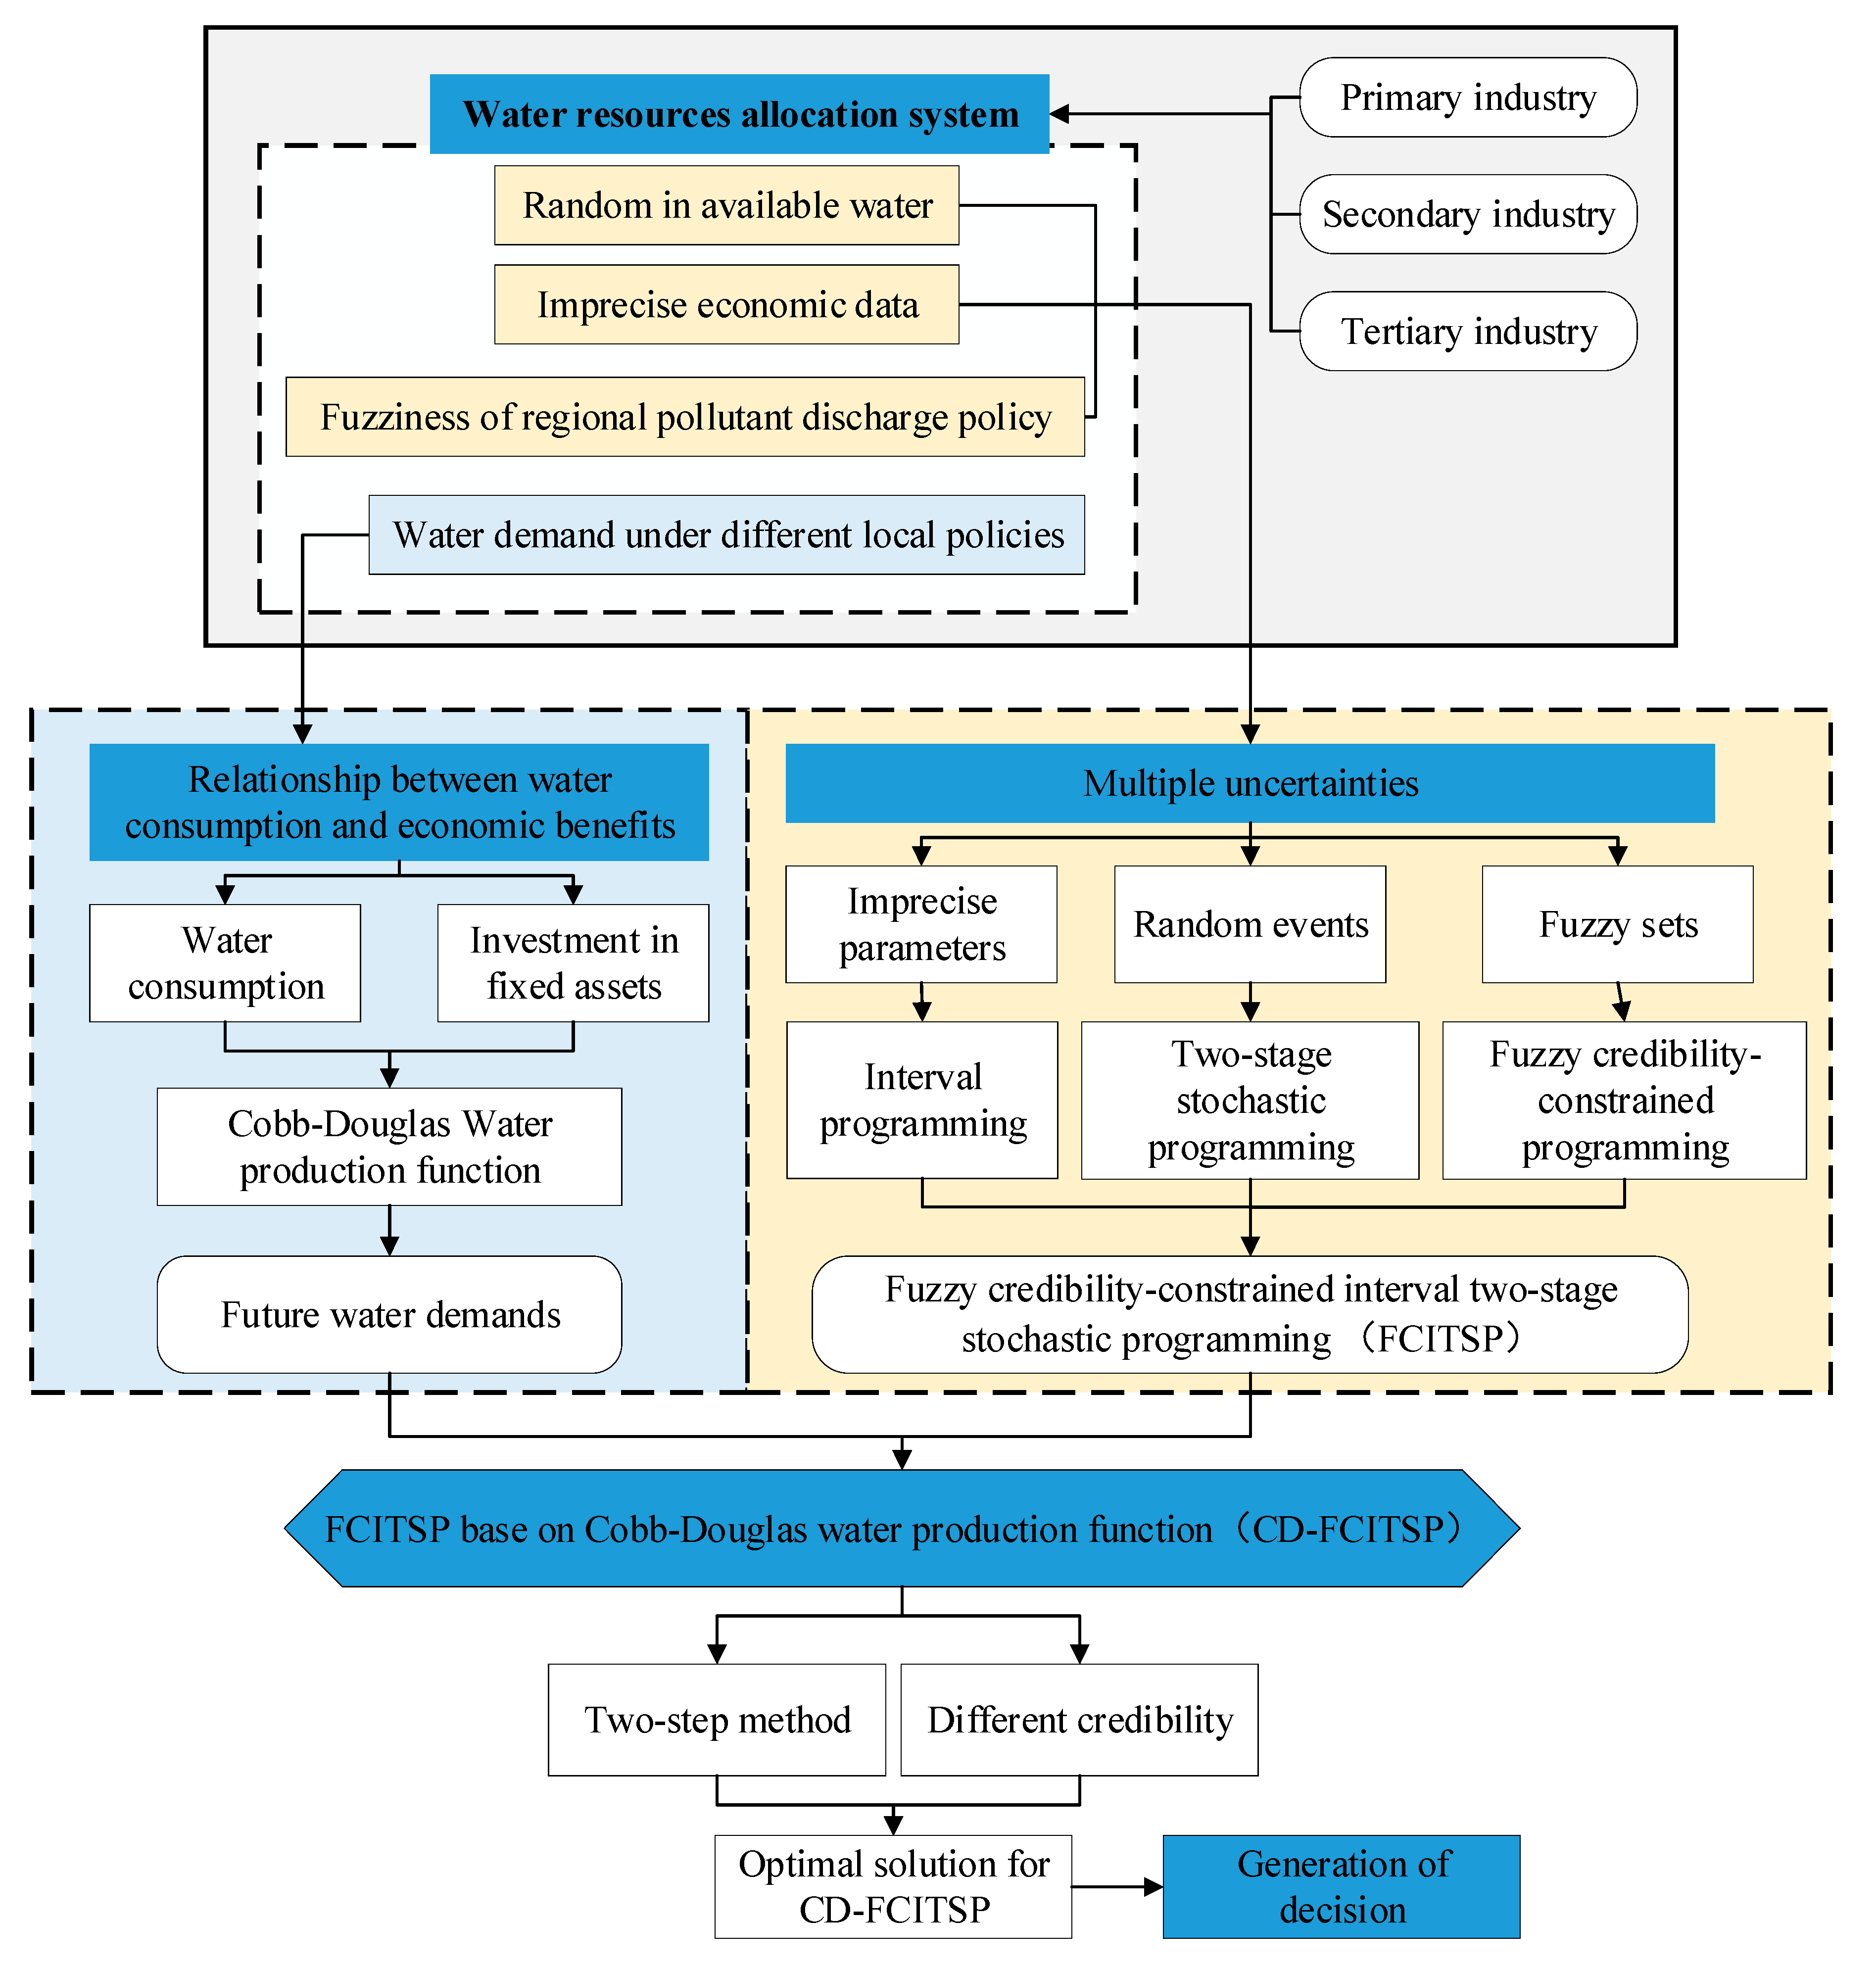
Figure 2.
Study area.
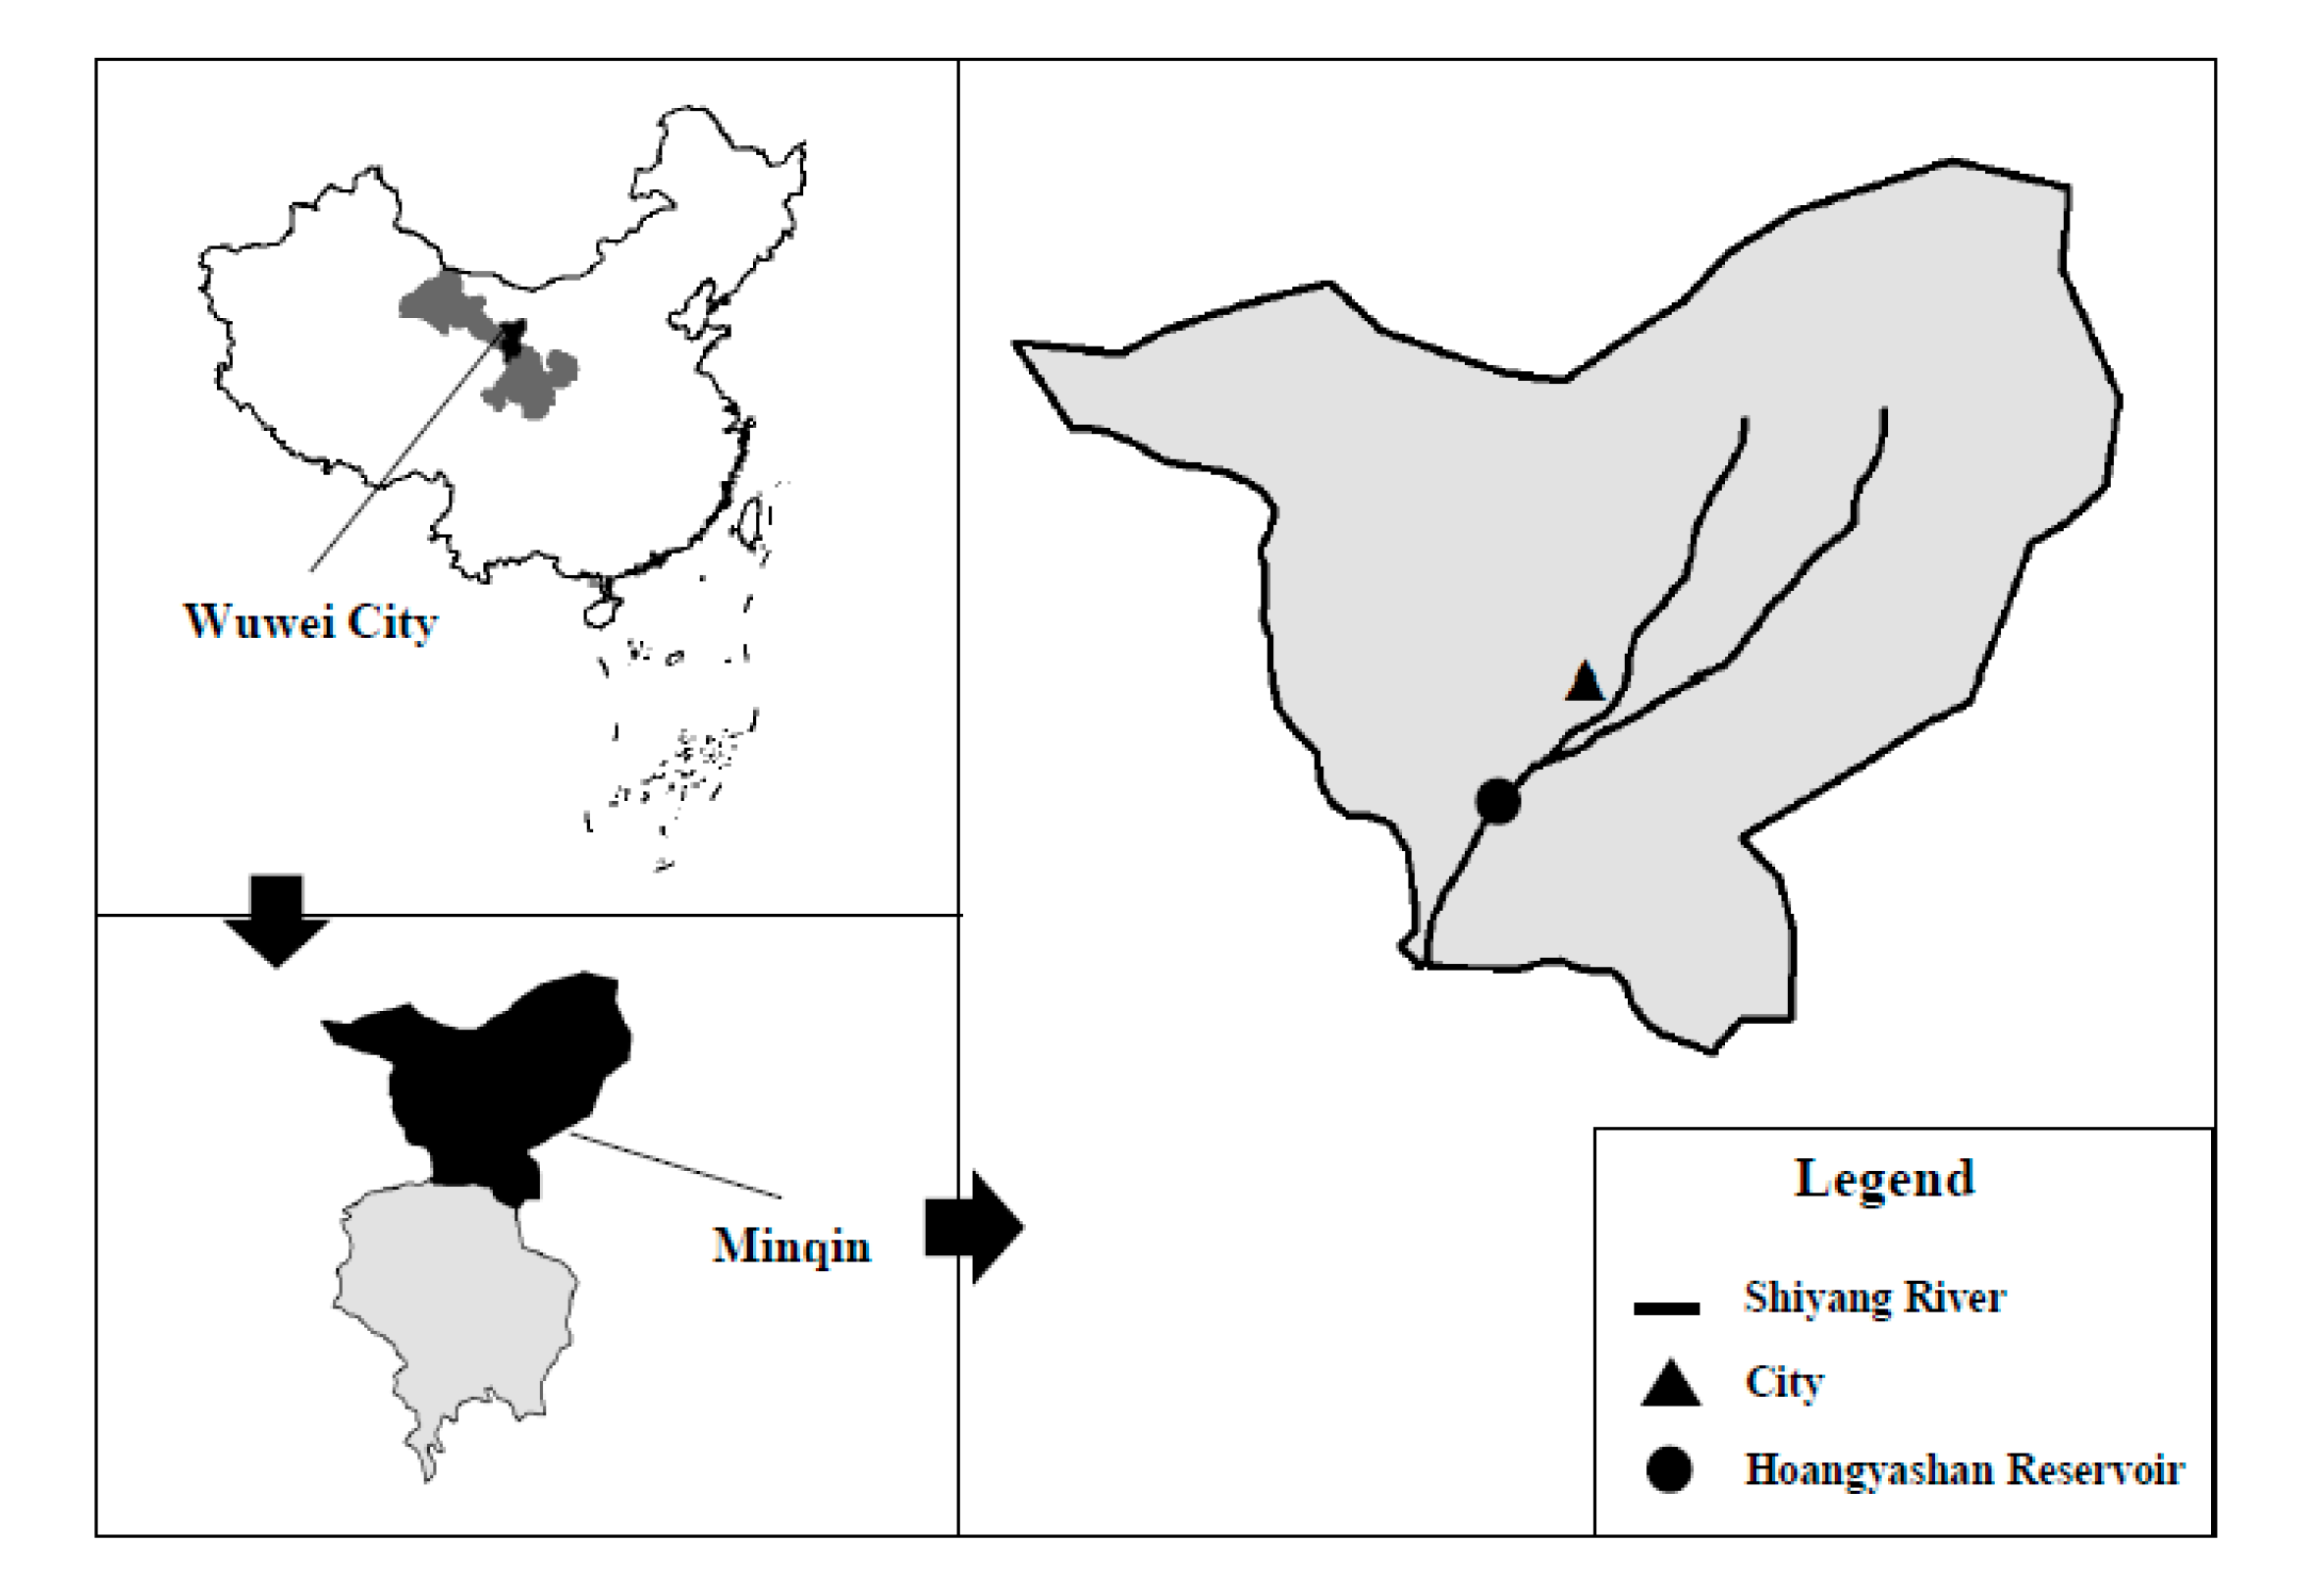
Figure 3.
Comparison between simulation results and actual values of PI (a), SI (b), and TI (c).

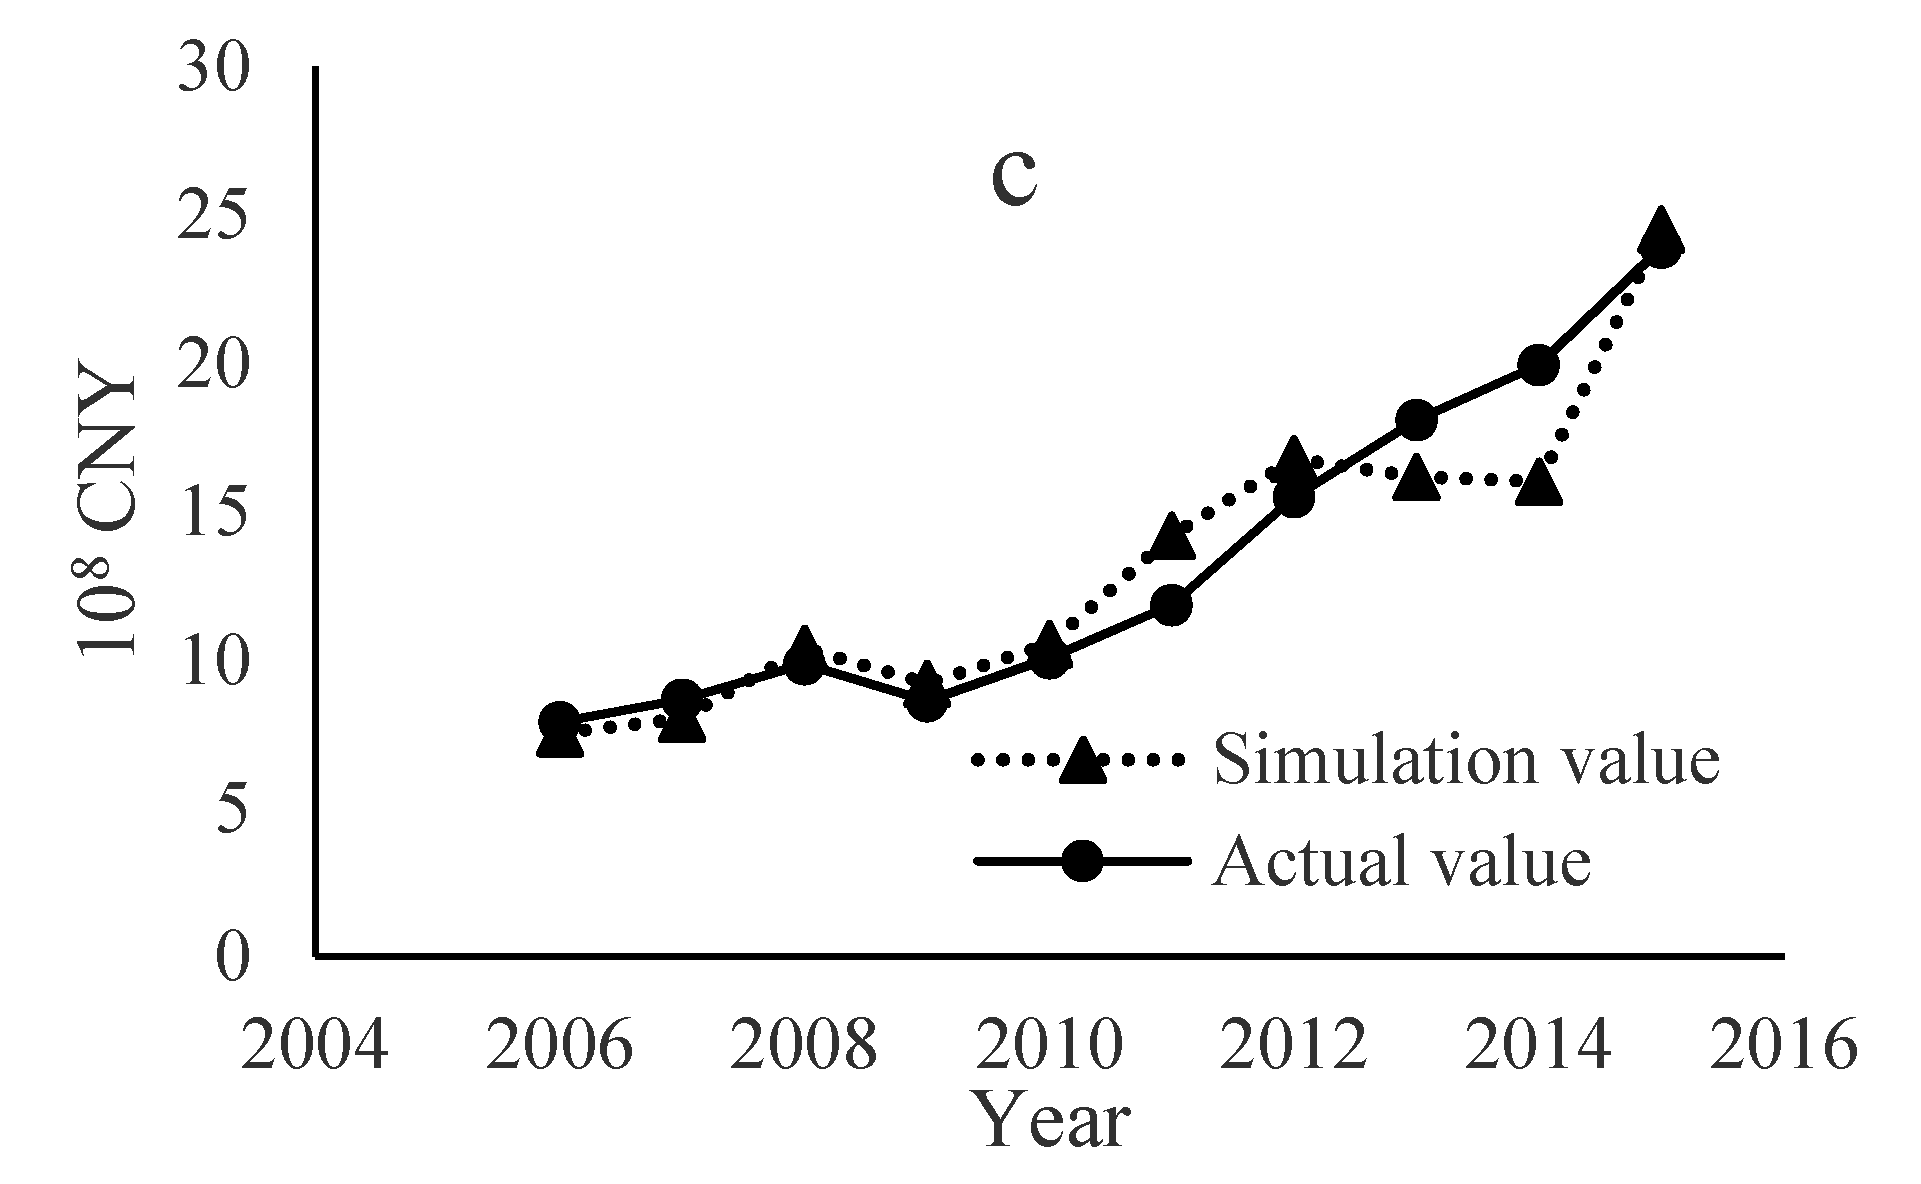
Figure 4.
Water distribution optimization results of PI (a), SI (b), TI (c), the total cost (d) and total COD emission (e) respectively under different credibility.
Figure 4.
Water distribution optimization results of PI (a), SI (b), TI (c), the total cost (d) and total COD emission (e) respectively under different credibility.

Table 1.
Parameters.
| Parameters and Variables | Meanings and Descriptions |
|---|---|
| an interval with lower and upper bounds, “+” and “−” are the upper and lower bounds of the corresponding parameters, respectively. | |
| total cost (CNY). | |
| n | index of water sectors, n = 1,2,3, where n = 1 represents the primary industry (PI), n = 2 denotes the secondary industry (SI), n = 3 delegates the tertiary industry (TI). |
| m | different flow levels of available water, m = 1, 2, 3, where m = 1 denotes low flow level, m = 2 represents medium flow level, m = 3 means high flow level. |
| water use cost in sector i per m3 (CNY/m3). | |
| first-stage decision variable, which denotes the allocation target for water that is promised to sector n (m3). | |
| additional cost to sector n per m3 of water not delivered (CNY/m3). | |
| second-stage decision variable, which is the shortage of water to sector n when the flow is with probability (m3). | |
| allowable regional total chemical oxygen demand (COD) emission , which is a triangular fuzzy number. | |
| primary pollutant content per unit wastewater discharge of sector n. | |
| sewage discharge coefficient (SDC) of sector n. | |
| minimum water demand of sector n (m3), which can be simulated by CD function. | |
| credibility level (greater than 0.5). | |
| zn | coefficients between 0 and 1 transferred from the first stage decision variables. |
| optimal water allocation results of every industry. |
Table 2.
Water distribution target, water price data and others associated.
| Industry Type | SDC | COD Concentration (g/m3) | Water Distribution Target (104 m3) | Water Use Price (CNY/m3) | Excess Water Price (CNY/m3) |
|---|---|---|---|---|---|
| PI (n = 1) | 0.1 | 60 | [26,890, 29,900] | [2.5, 3.0] | [2.6, 3.1] |
| SI (n = 2) | 0.5 | 100 | [1066, 1380] | [3.2, 4.5] | [3.9, 4.8] |
| TI (n = 3) | 0.7 | 230 | [1290, 2139] | [2.9, 3.8] | [3.1, 4.2] |
Table 3.
Available water under different flow levels.
| Flow Level | Available Water (108 m3) | Probability |
|---|---|---|
| Low flow level (L) (m = 1) | [2.39, 2.58] | 20% |
| Medium flow level (M) (m = 2) | [2.54, 2.75] | 60% |
| High flow level (H) (m = 3) | [2.73, 2.92] | 20% |
Table 4.
Parameters obtained by CD function.
| Item | ln A(t) | α | β | R2 | QR |
|---|---|---|---|---|---|
| PI | 15.20954 | −0.122110 | −1.16840 | 0.92 | 90% |
| SI | 0.273011 | 0.389791 | 0.15251 | 0.95 | 100% |
| TI | 2.398414 | 0.416841 | −0.12044 | 0.90 | 100% |
Table 5.
The key parameters comparison between the water allocation scheme in 2016 and optimization results.
Table 5.
The key parameters comparison between the water allocation scheme in 2016 and optimization results.
| Item | 2016 | Optimization Results | |
|---|---|---|---|
| Water allocation schemes (104 m3) | PI | 24,890.00 | [23,202.87, 24,522.02] |
| SI | 658.00 | 926.94 | |
| TI | 1103.00 | 1270.19 | |
| Total water consumption (104 m3) | 26,651.00 | [25,400.00, 26,719.15] | |
| Total benefit (108 CNY) | 71.36 | [72.56, 74.11] | |
| Total cost (108 CNY) | [6.75, 8.18] | [6.47, 8.26] | |
| Benefit per unit water (CNY/m3) | 26.78 | [27.16, 29.18] | |
© 2017 by the authors. Licensee MDPI, Basel, Switzerland. This article is an open access article distributed under the terms and conditions of the Creative Commons Attribution (CC BY) license (http://creativecommons.org/licenses/by/4.0/).
Share and Cite
MDPI and ACS Style
Zhang, F.; Tan, Q.; Zhang, C.; Guo, S.; Guo, P. A Regional Water Optimal Allocation Model Based on the Cobb-Douglas Production Function under Multiple Uncertainties. Water 2017, 9, 923. https://doi.org/10.3390/w9120923
AMA Style
Zhang F, Tan Q, Zhang C, Guo S, Guo P. A Regional Water Optimal Allocation Model Based on the Cobb-Douglas Production Function under Multiple Uncertainties. Water. 2017; 9(12):923. https://doi.org/10.3390/w9120923
Chicago/Turabian StyleZhang, Fan, Qian Tan, Chenglong Zhang, Shanshan Guo, and Ping Guo. 2017. "A Regional Water Optimal Allocation Model Based on the Cobb-Douglas Production Function under Multiple Uncertainties" Water 9, no. 12: 923. https://doi.org/10.3390/w9120923
Note that from the first issue of 2016, this journal uses article numbers instead of page numbers. See further details here.