Ecological Effects of Grazing in the Northern Tianshan Mountains


1
State Key Laboratory of Desert and Oasis Ecology, Xinjiang Institute of Ecology and Geography, Chinese Academy of Sciences, Urumqi 830011, Xinjiang, China
2
University of Chinese Academy of Sciences, Beijing 100049, China
3
School of Geographic Science and Tourism, Xinjiang Normal University, Urumqi 830054, Xinjiang, China
*
Author to whom correspondence should be addressed.
Water 2017, 9(12), 932; https://doi.org/10.3390/w9120932
Submission received: 17 September 2017
/
Revised: 17 November 2017
/
Accepted: 25 November 2017
/
Published: 29 November 2017
Abstract
:Identifying the effects of grazing is critical for the conservation, protection and sustainable use of arid grassland ecosystems. However, research regarding the ecological effects of grazing along mountainous elevation gradients is limited in arid areas, particularly at the regional scale. Using the Biome-BGC grazing model, we explored the effects of grazing on grassland net primary productivity (NPP), evapotranspiration (ET) and water use efficiency (WUE) from 1979 to 2012 along an elevation gradient in the northern Tianshan Mountains. The NPP, ET and WUE values were generally lower under the grazing scenario than under the ungrazed scenario; the differences between the grazing and ungrazed scenarios showed increasing trends over time; and distinct spatial heterogeneity in these differences was observed. Distinct decreases in NPP and WUE under the grazing scenario mainly occurred in regions with high livestock consumption. The decrease in ET was greater in mountainous areas with high grazing intensity due to decreased transpiration and increased surface runoff. This study contributes to a better understanding of the ecological effects of grazing along an elevation gradient in the northern Tianshan Mountains and provides data to support the scientific management of grassland ecosystems.
1. Introduction
Grassland ecosystems serve important economic and ecological functions, such as material production, climate regulation, soil and water conservation, sand stabilization, soil improvement and biodiversity preservation [1,2,3]. However, grassland ecosystems are easily susceptible to disturbances and highly vulnerable to climate change and human activities, particularly in arid areas [4,5,6,7]. Due to a lack of water resources and complex human activities, ecological processes in arid grasslands may be different from those in humid areas [8]. Therefore, grassland ecosystems in arid areas have become the focus of numerous studies.
The northern Tianshan Mountains are located in an arid region of central Asia with widely distributed and diverse grassland ecosystems. Grazing is one of the main local human activities. In recent decades, grazing intensity has increased significantly [9]. Overgrazing, which distinctly decreases grassland productivity, has become a widespread activity that has led to severe degradation of grassland ecosystems [10,11,12]. To a certain extent, grassland degradation reflects a lack of understanding of grassland ecosystem services, positioning and potential economic and ecological values. Therefore, research on grazing effects is critical to the healthy development of the economy and environment.
Since the response mechanism of a grassland ecosystem to grazing is very complex and many factors are involved, it is difficult to comprehensively understand the effects of grazing on the grassland ecosystem. In practice, we can choose some key factors to conduct in-depth research. Net primary productivity (NPP), a key element in the carbon cycle, not only reflects the productive capacity of the plant community but also is the main factor that determines whether an ecosystem is a carbon source or sink [13,14]. Evapotranspiration (ET), an important part of the water cycle in an ecosystem, is the only component that links the heat balance and water balance via interactions between the land surface and the atmosphere [15,16]. Water use efficiency (WUE), an important variable linking the vegetation-based carbon cycle and water cycle in an ecosystem, defines how efficiently plants use water to produce biomass [17,18]. The NPP, ET and WUE are three key parameters that reflect the responses of plant communities to climate change and human activities. Therefore, the studies regarding NPP, ET and WUE are common in various ecosystems [19,20,21], and some studies of these parameters in grasslands have been conducted on the northern slopes of the Tianshan Mountains based on different concepts and methods [22,23]. However, research into the effects of grazing on grassland NPP, ET and WUE have been limited due to the complexity and diversity of the interactions between plants and herbivores as well as the relatively regressive socioeconomic development in the region. For example, studies of the spatio-temporal patterns of the grazing effects on grassland NPP, ET and WUE were not conducted in the northern Tianshan Mountains.
Grazing may affect NPP, ET and WUE by removing vegetation and adding feces to the soil. Grazing has traditionally been viewed as detrimental to plant growth [24,25], but some studies have shown that overcompensation effects (NPP increase) occurred in moderately grazed systems by changing root/shoot allocation [26,27]. Additionally, previous studies have shown that the effects of grazing on ET vary under different environmental conditions [8,28,29,30,31], but most grazing has typically been shown to decrease ET. Based on the above information, we expect to observe the following in the northern Tianshan Mountains: (1) grazing may generally decrease NPP, but it may increase NPP in some moderately grazed grassland systems; and (2) grazing may generally decrease ET, but WUE does not necessarily follow the trends of NPP and ET under grazing scenarios because it is determined by both NPP and ET. Additionally, WUE may decrease in an overgrazing scenario due to a distinct decrease in grassland productivity. In addition, due to distinct differences in climate, grassland type, grazing intensity and grazing system along an elevation gradient in the northern Tianshan Mountains, distinct spatial heterogeneity may exist in the effects of grazing on grassland NPP, ET and WUE. Understanding spatio-temporal patterns of grazing effects on NPP, ET and WUE is helpful to make reasonable land management decisions about grazing in accordance with the characteristics of different grassland ecosystems.
Research methods regarding grassland NPP, ET and WUE include site observations, remote sensing and model simulations [16,23,32,33,34]. It is difficult to obtain an overall understanding of grassland NPP, ET and WUE through site-based research over large areas, particularly those with complex surfaces. Remote sensing and modelling are two effective approaches to studying large areas [35,36], but estimates based on remote sensing only represent real scenarios. Consequently, the response of grassland ecosystems to grazing cannot be effectively reflected [37]. Models are considered useful tools for estimating the fluxes and storage of water and carbon [38]. Numerous models have been developed, among which the Biome-BGC grazing model is a process-based ecosystem model that estimates the fluxes and storage of water and carbon in terrestrial ecosystems [22,39]. Moreover, the effects of grazing are effectively considered in the model.
In this study, using the Biome-BGC grazing model and selecting the northern Tianshan Mountains as a study area, we address the effects of grazing on grassland NPP, ET and WUE at a regional scale from 1979 to 2012. The objectives of this study were to (1) investigate the interannual variations in NPP, ET and WUE under the grazing scenario by comparing with those under the ungrazed scenario from 1979 to 2012; and (2) explore spatial heterogeneity in the effects of grazing on grassland NPP, ET and WUE along the altitudinal gradient.
2. Study Materials and Methods
2.1. Study Area
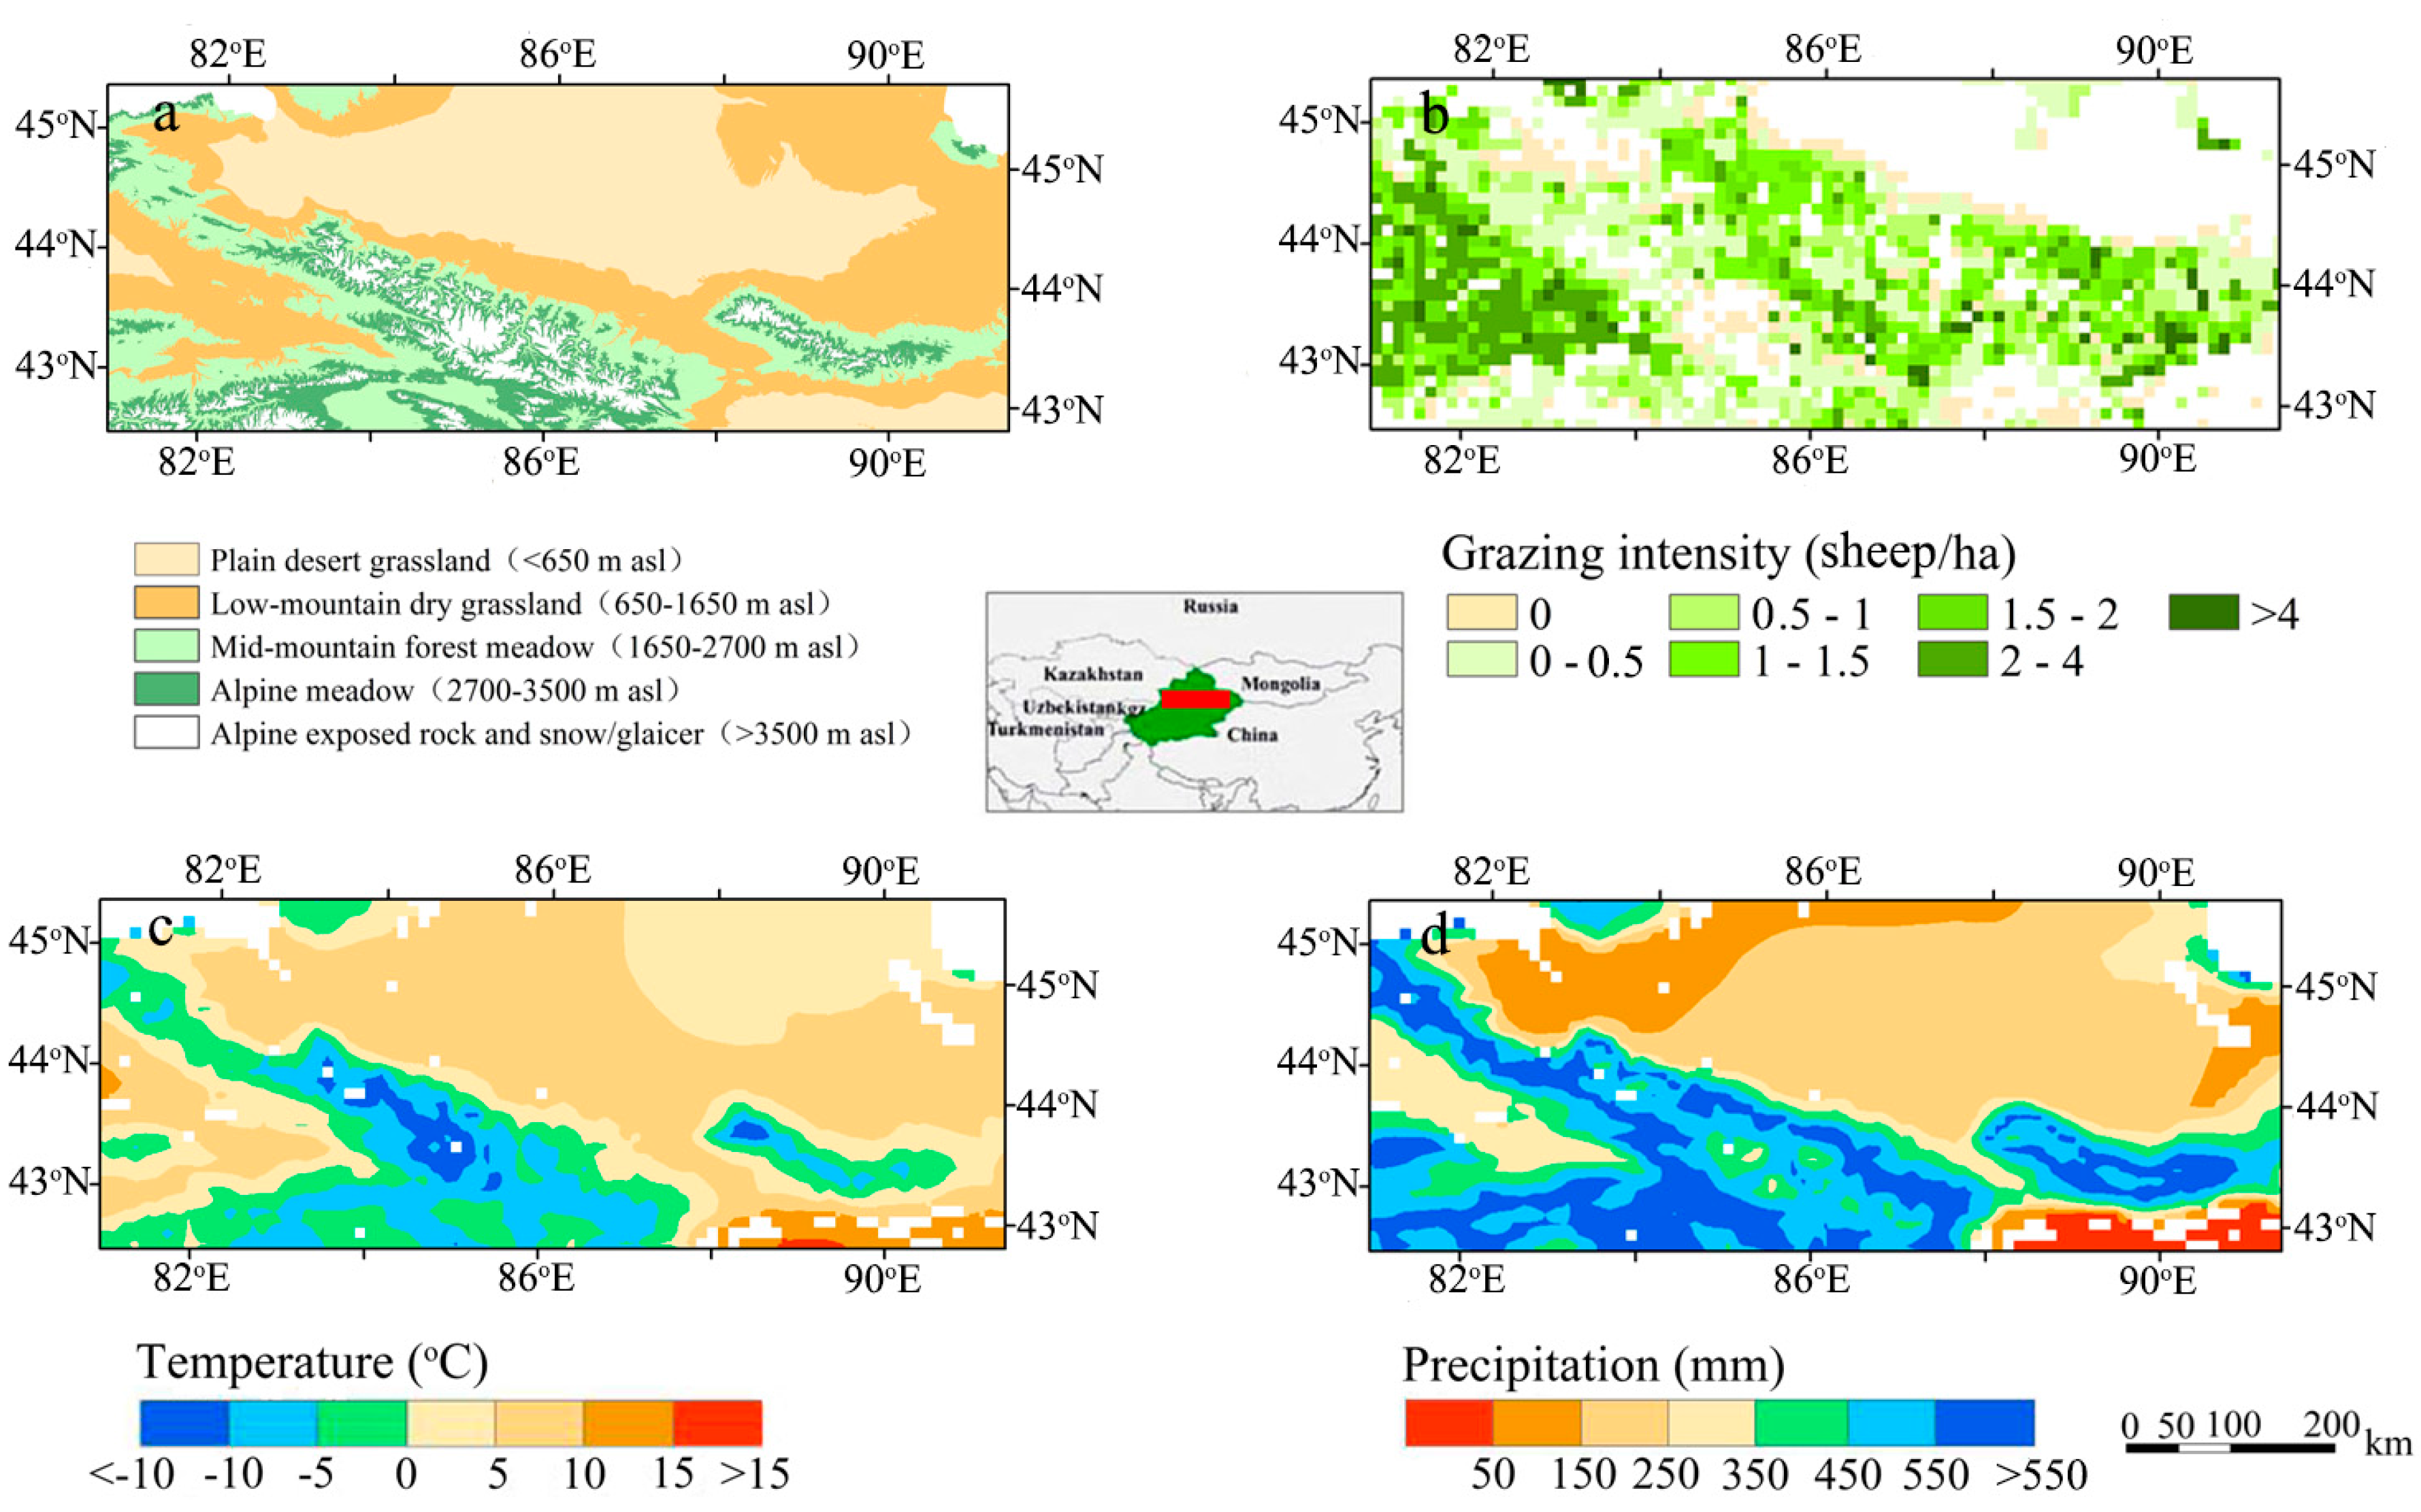
The northern Tianshan Mountains, which are located in an arid region in central Asia, are an important part of the Silk Road (Figure 1), and grassland ecosystems are widely distributed in the area. Animal husbandry is the pillar industry for local economic development. Because temperature and precipitation change distinctly along the elevation gradient in the northern Tianshan Mountains (Figure 1c,d), four grassland types occur: alpine meadow (AM; 2700–3500 m a.s.l.), mid-mountain forest meadow (MMFM; 1650–2700 m a.s.l.), low-mountain dry grassland (LMDG; 650–1650 m a.s.l.) and plain desert grassland (PDG; lower than 650 m a.s.l.) (Figure 1a) [8]. Grass growth in PDG and LMDG is mainly affected by water stress, while heat is the key limiting factor for grass in MMFM and AM. In addition, a relatively stable grazing system (grazing time is relatively stable in each pasture) is used in the region, including spring/autumn pastures (grazing time: end of March to middle of June/end of August to end of November), summer pastures (grazing time: middle of June to end of August), winter pastures (grazing time: end of November to end of March) and annual pastures (grazing time: all year round) [8]. Spring/autumn pastures are mainly in LMDG, summer pastures are mainly in AM and MMFM, winter pastures are mainly in PDG and low-lying areas of the mountains and annual pastures are mainly in PDG near settlements.
Since 1979, precipitation and temperature have displayed increased fluctuations, and grazing intensity has increased significantly [9]. Grassland degradation has become widespread due to overgrazing (Figure 1b), and grassland ecosystems have undergone substantial change due to the combined effects of climate change and human activities [8,22,40].
2.2. Methods
To simulate the effects of grazing on the grassland carbon and water cycles, the Biome-BGC grazing model was developed by integrating a defoliation formulation into the Biome-BGC, which is an ecosystem process model that estimates the fluxes and storage of water and carbon with a daily time step [8,39]. The defoliation formulation was founded by Seligman et al. [41], and it suitably describes the primary grazing process in arid and semi-arid grasslands [41].
Under the grazing scenario, NPP was defined as the sum of the increases in vegetation carbon (C’veg) (total of the surface and subsurface components), litter carbon (Clitter) and the defoliation rate (Dr) caused by grazing. The formulas are expressed as follows [8]:
The defoliation formulation is as follows [41]:
where Dr (gC/(ha d)) is the defoliation rate that represents carbon consumed by animals; Ge is the grazing efficiency of the livestock (ha/d per sheep unit); Sr is the grazing intensity (head per ha); Cleaf is the C in the leaf biomass (gC/m2); (Cleaf)U is the residual aboveground Cleaf that is unavailable to livestock (gC/m2); and Dx is the consumption rate of the livestock based on satiation (gC/(d head)).
To account for the positive effects of excreta on vegetation, Dr was divided into five components: livestock respiration, which accounts for 50% of Dr; the fraction of methane released by livestock, which accounts for 3% of Dr; the fraction lost as feces to the soil, which accounts for 30% of Dr; the fraction lost as urine to the soil; and Cmeat, which is the fraction of C used for meat production. A detailed description of the five components of Dr was provided by Luo et al. [8].
In the model, the Penman–Monteith equation [39,42] was used to calculate the actual ET [43] as shown in Equation (3):
where ET is the actual evapotranspiration (mm/d); Δ is the slope of the vapor pressure versus temperature curve (kPa/°C); Rn is the net radiation (MJ/(m2 d)); G is the soil heat flux (MJ/(m2 d)); ρ is the air density (kg/m3); Cp is the specific heat of the air (MJ/(kg °C)); es is the saturation vapor pressure (kPa); ea is the actual vapor pressure (kPa); γ is the psychrometric constant (kPa/°C); rs is the bulk surface resistance (s/m); and ra is the aerodynamic resistance (s/m). In the Penman–Monteith equation, energy is allocated to the canopy and the soil surface. Canopy energy is divided into two components. One component represents the evaporation of canopy-intercepted water, and the other component represents the transpiration of water from leaves. These processes depend on the aerodynamic conductance at the leaf blade scale, while transpiration is related to stomatal conductance [39].
In this study, grassland WUE is defined as the ratio of NPP to ET [22]:
where WUE is the water use efficiency (gC/kg H2O).
To estimate the effects of grazing on NPP, ET and WUE, the model was executed with two scenarios, nongrazing (Dr = 0) and grazing, and a comparative analysis was conducted between the two scenarios in the northern Tianshan Mountain grasslands.
In this study, using ARCGIS software, we compiled statistics on grassland NPP, ET and WUE under grazing and ungrazed scenarios according to different grassland types to analyze the grazing effects on grassland NPP, ET and WUE from 1979 to 2012 in the northern Tianshan Mountains.
Grazers included sheep, cattle, goat, horse, camel and yak in the northern Tianshan Mountains. All grazer values were calculated in sheep units according to the “animal unit equivalent standard” provided by the Ministry of Agriculture of the People’s Republic of China (http://www.chinaforage.com/standard/zaixuliang.htm). A sheep unit is a female sheep that eats 1.8 kg of hay with a moisture of 14% per day. By this standard, one cattle equals 6.0 sheep, one goat equals 0.9 sheep, one horse equals 6.0 sheep, one camel equals 8.0 sheep, and one yak equals 4.5 sheep. Because all grazer values were calculated in sheep units in accordance with different grass intake values between different grazers, the species effects are assumed to be negligible. To ensure the accurate estimation of grazing intensity, we undertook field investigations by visiting some herdsmen in the northern Tianshan Mountains. Grasslands in the northern Tianshan Mountains are public spaces open to everybody, so no special permission was required for access.
2.3. Data
The data used in this study include meteorological data, soil and elevation data, ecophysiological parameters, grazing data, and NPP and ET validation data (Table 1), among which meteorological data, soil and elevation data, ecophysiological parameters and grazing data are the model input data.
2.3.1. Meteorological Data
Meteorological data are the most significant drivers of the Biome-BGC grazing model. The meteorological data used in this study included daily maximum and minimum air temperatures, daily average air temperature, humidity, incident solar radiation, precipitation and day length. Meteorological data at the regional scale were derived from the China Meteorological Forcing Data set, which provided netcdf data (http://dam.itpcas.ac.cn/chs/rs/?q=data). We used the R program to convert the netcdf data to ASCII text, which drives the Biome-BGC grazing model. These data sets can be used for hydrological modeling, land surface modeling, land data assimilation and other terrestrial modeling. The meteorological data used for model validation were obtained through actual observations.
2.3.2. Ecophysiological Parameters
In this study, the default in the model (C3 grass) was used, and some key parameters, including yearday to start new growth, yearday to end litterfall, new fine root C, new leaf C and average specific leaf area of the canopy, were corrected according to previous observational studies (Table 2).
2.3.3. Soil and Elevation Data
Soil data, including sand/silt/clay percentages and the effective soil depth, were derived from the Harmonized World Soil Database (HWSD) based on a recent 1:1,000,000 scale soil map of China (http://westdc.westgis.ac.cn/data/611f7d50-b419-4d14-b4dd-4a944b141175), which was derived from the second national land survey. Elevation data were derived from the WorldClim database (http://www.worldclim.org/), and the soil and elevation data at model validation points were obtained through field investigations.
2.3.4. Grazing Data
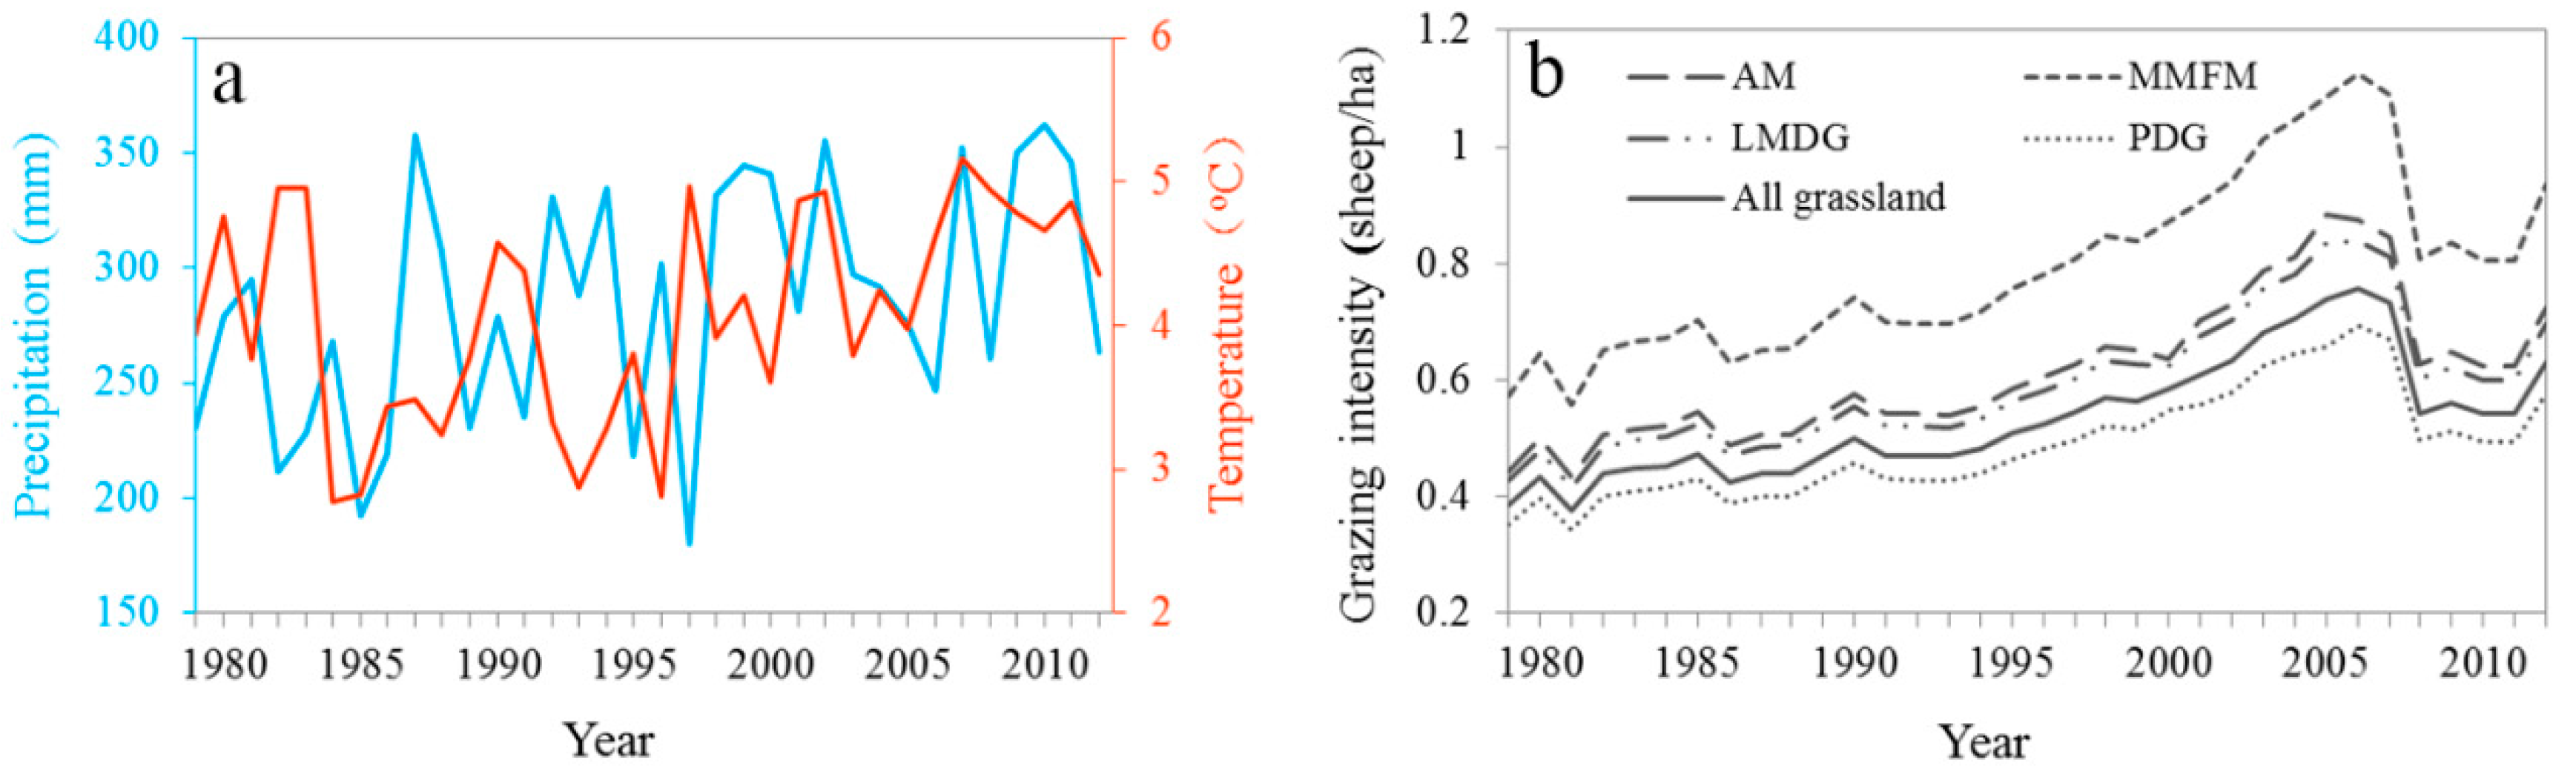
Figure 2b shows the interannual variations in grazing intensity in the different grassland types in the northern Tianshan Mountains. Regional-scale grazing data were extracted from the Global Livestock Information System (GLIS), which generates the data via interpolation based on sampling points of global livestock numbers and environmental data obtained from the Food and Agriculture Organization (FAO) of the United Nations (http://www.fao.org/AG/againfo/resources/en/glw/GLW_dens.html). We corrected the grazing data from the GLIS according to previous statistics from the statistical yearbook [9] and field survey, which ensured that the data closely approximated the true values. Site-scale grazing data were obtained by visiting herdsmen.
2.3.5. ET and NPP Validation Data
Validation data were collected from actual observations in the northern Tianshan Mountains and previous publications. Daily ET values, which were observed using a Bowen ratio system produced in Taiwan, were obtained in an LMDG in Yongfeng Township, Urumqi County (43°33′0.4′′ N, 87°11′32.8′′ E; elevation 1648 m). Daily ET data from October 2012 to September 2013, which were observed using a microlysimeter, were acquired in an AM in Aksu (41°42′ N, 80°10′ E; elevation 3550 m). Daily ET values, which were observed using a Bowen ratio system produced in England, were retrieved from the literature for a PDG in Qitai County (44°11′ N, 89°26′ E; elevation 617 m) from 22 July to 2 September, 2010 [46]. Annual NPP data were obtained from previous publications [14] and actual investigations.
3. Results
3.1. Model Validation
The Biome-BGC grazing model has been successfully used to estimate the aboveground net primary productivity (ANPP) at different sites on the northern slopes of the Tianshan Mountains [8], but NPP and ET values simulated for the northern Tianshan Mountain grasslands remain to be validated. In our study, simulated NPP values were compared with field data from a previous study [47], and the model accurately estimated NPP (Figure 3a) (R2 = 0.90, RMSE = 24.89). Model validation with respect to ET was conducted in an LMDG in Urumqi County (Figure 3b) (R2 = 0.76, RMSE = 0.67), an AM in Aksu (Figure 3c) (R2 = 0.66, RMSE = 0.76) and a PDG in Qitai County (Figure 3d) (R2 = 0.66, RMSE = 0.30). Comparisons between simulated and observed values showed that the Biome-BGC grazing model accurately estimated ET.
3.2. Spatial Variations in NPP, ET and WUE in Ungrazed Grasslands
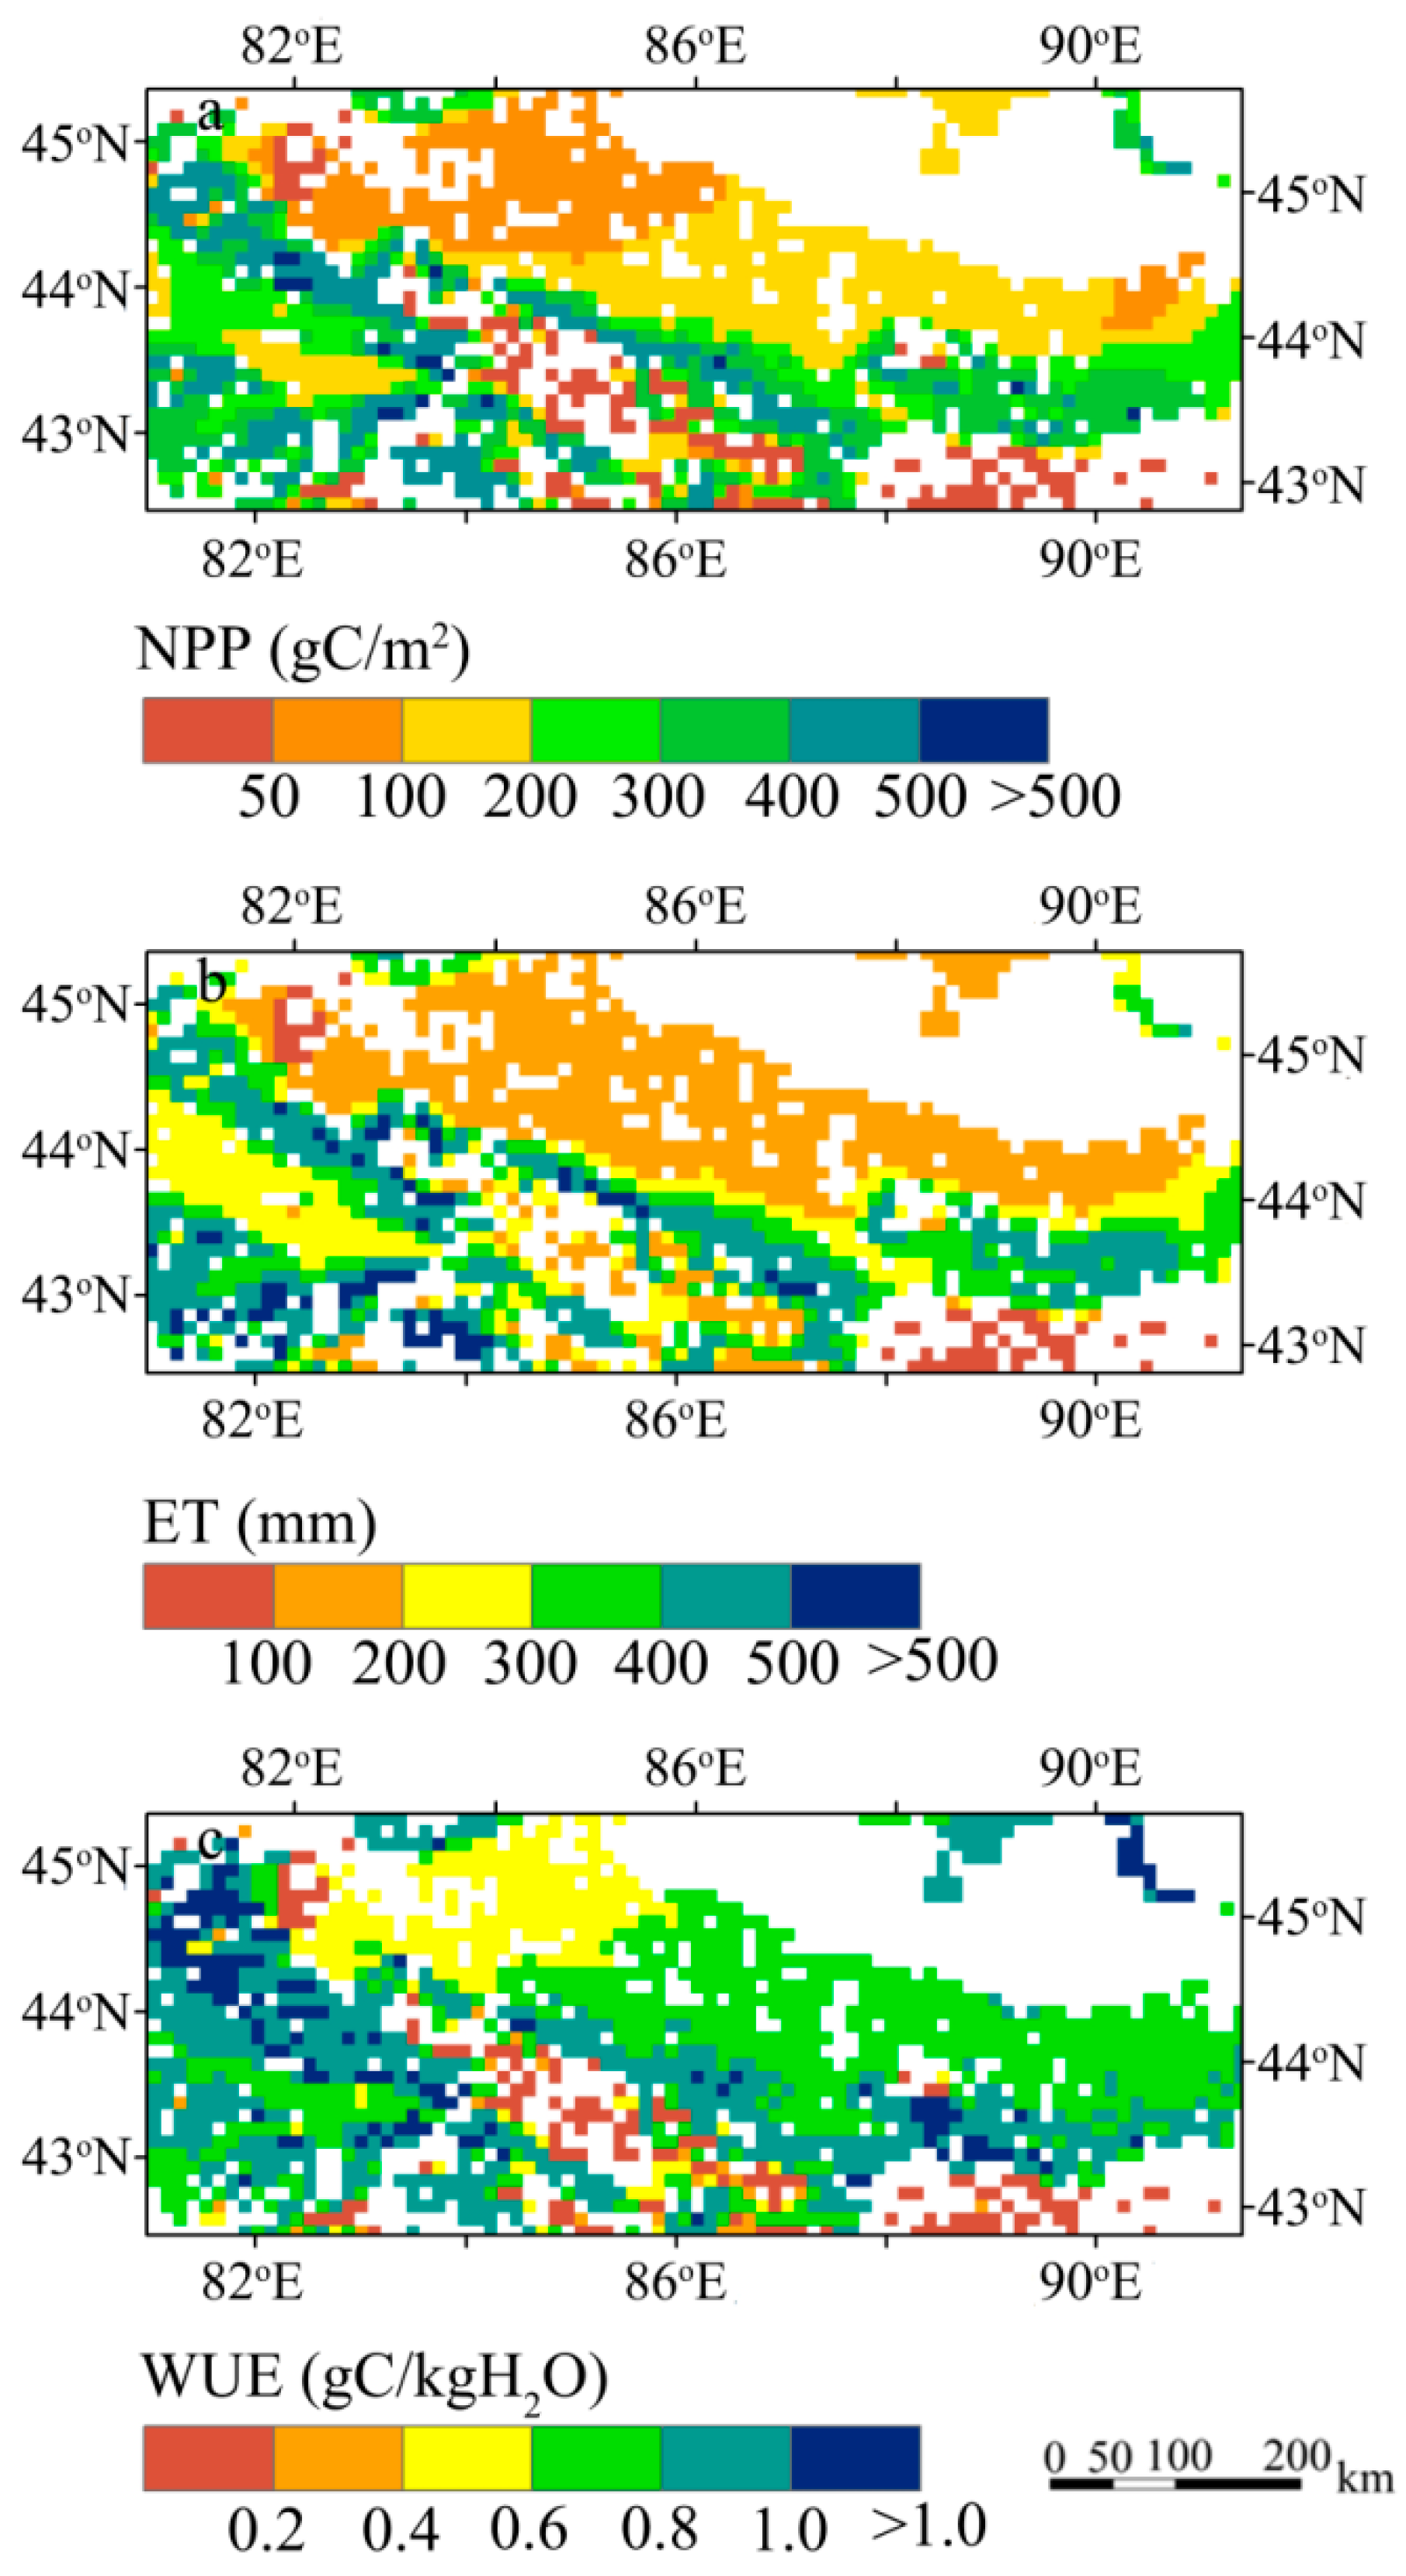
As shown in Figure 4, the spatial variations in average annual NPP, average annual ET and average annual WUE were distinct under an ungrazed scenario over the northern Tianshan Mountain grasslands from 1979 to 2012. Regional simulation estimated that area-average annual NPP was 197.12 ± 31.31 gC/m2 over the northern Tianshan Mountain grasslands. The regions with high annual NPP were mainly distributed in the middle Tianshan Mountains and in part of the high Tianshan Mountains, and the regions with low NPP were mainly distributed in desert plains and part of the high Tianshan Mountains. Among grassland types, the average annual NPP values were ranked from high to low as follows: MMFM (318.59 ± 47.67 gC/m2), AM (232.76 ± 25.78 gC/m2), LMDG (230.68 ± 59.95 gC/m2), and PDG (99.18 ± 32.89 gC/m2). The area-average annual ET was calculated to be 276.04 ± 39.61 mm, and the spatial variation in average annual ET displayed a pattern similar to that of the average annual NPP. Among grassland types, the average annual ET values were ranked from high to low as follows: MMFM (431.81 ± 51.21 mm), AM (342.19 ± 32.93 mm), LMDG (276.89 ± 53.93 mm), and PDG (168.81 ± 32.72 mm). The area-average annual WUE was calculated to be 0.7141 ± 0.0489 gC/kg H2O, but the pattern of average annual WUE differed from those of the NPP and ET. High WUE values mainly occurred in the middle and low Tianshan Mountains, and low values were mainly distributed in the desert plains and the high Tianshan Mountains. Among grassland types, the average annual WUE values were ranked from high to low as follows: LMDG (0.8331 ± 0.0485 gC/kg H2O), MMFM (0.7378 ± 0.0462 gC/kg H2O), AM (0.6802 ± 0.0709 gC/kg H2O), and PDG (0.5875 ± 0.0496 gC/kg H2O) (Table 3).
3.3. Differences between Grazed and Ungrazed Grasslands
3.3.1. Temporal Variations in Grassland NPP, ET and WUE
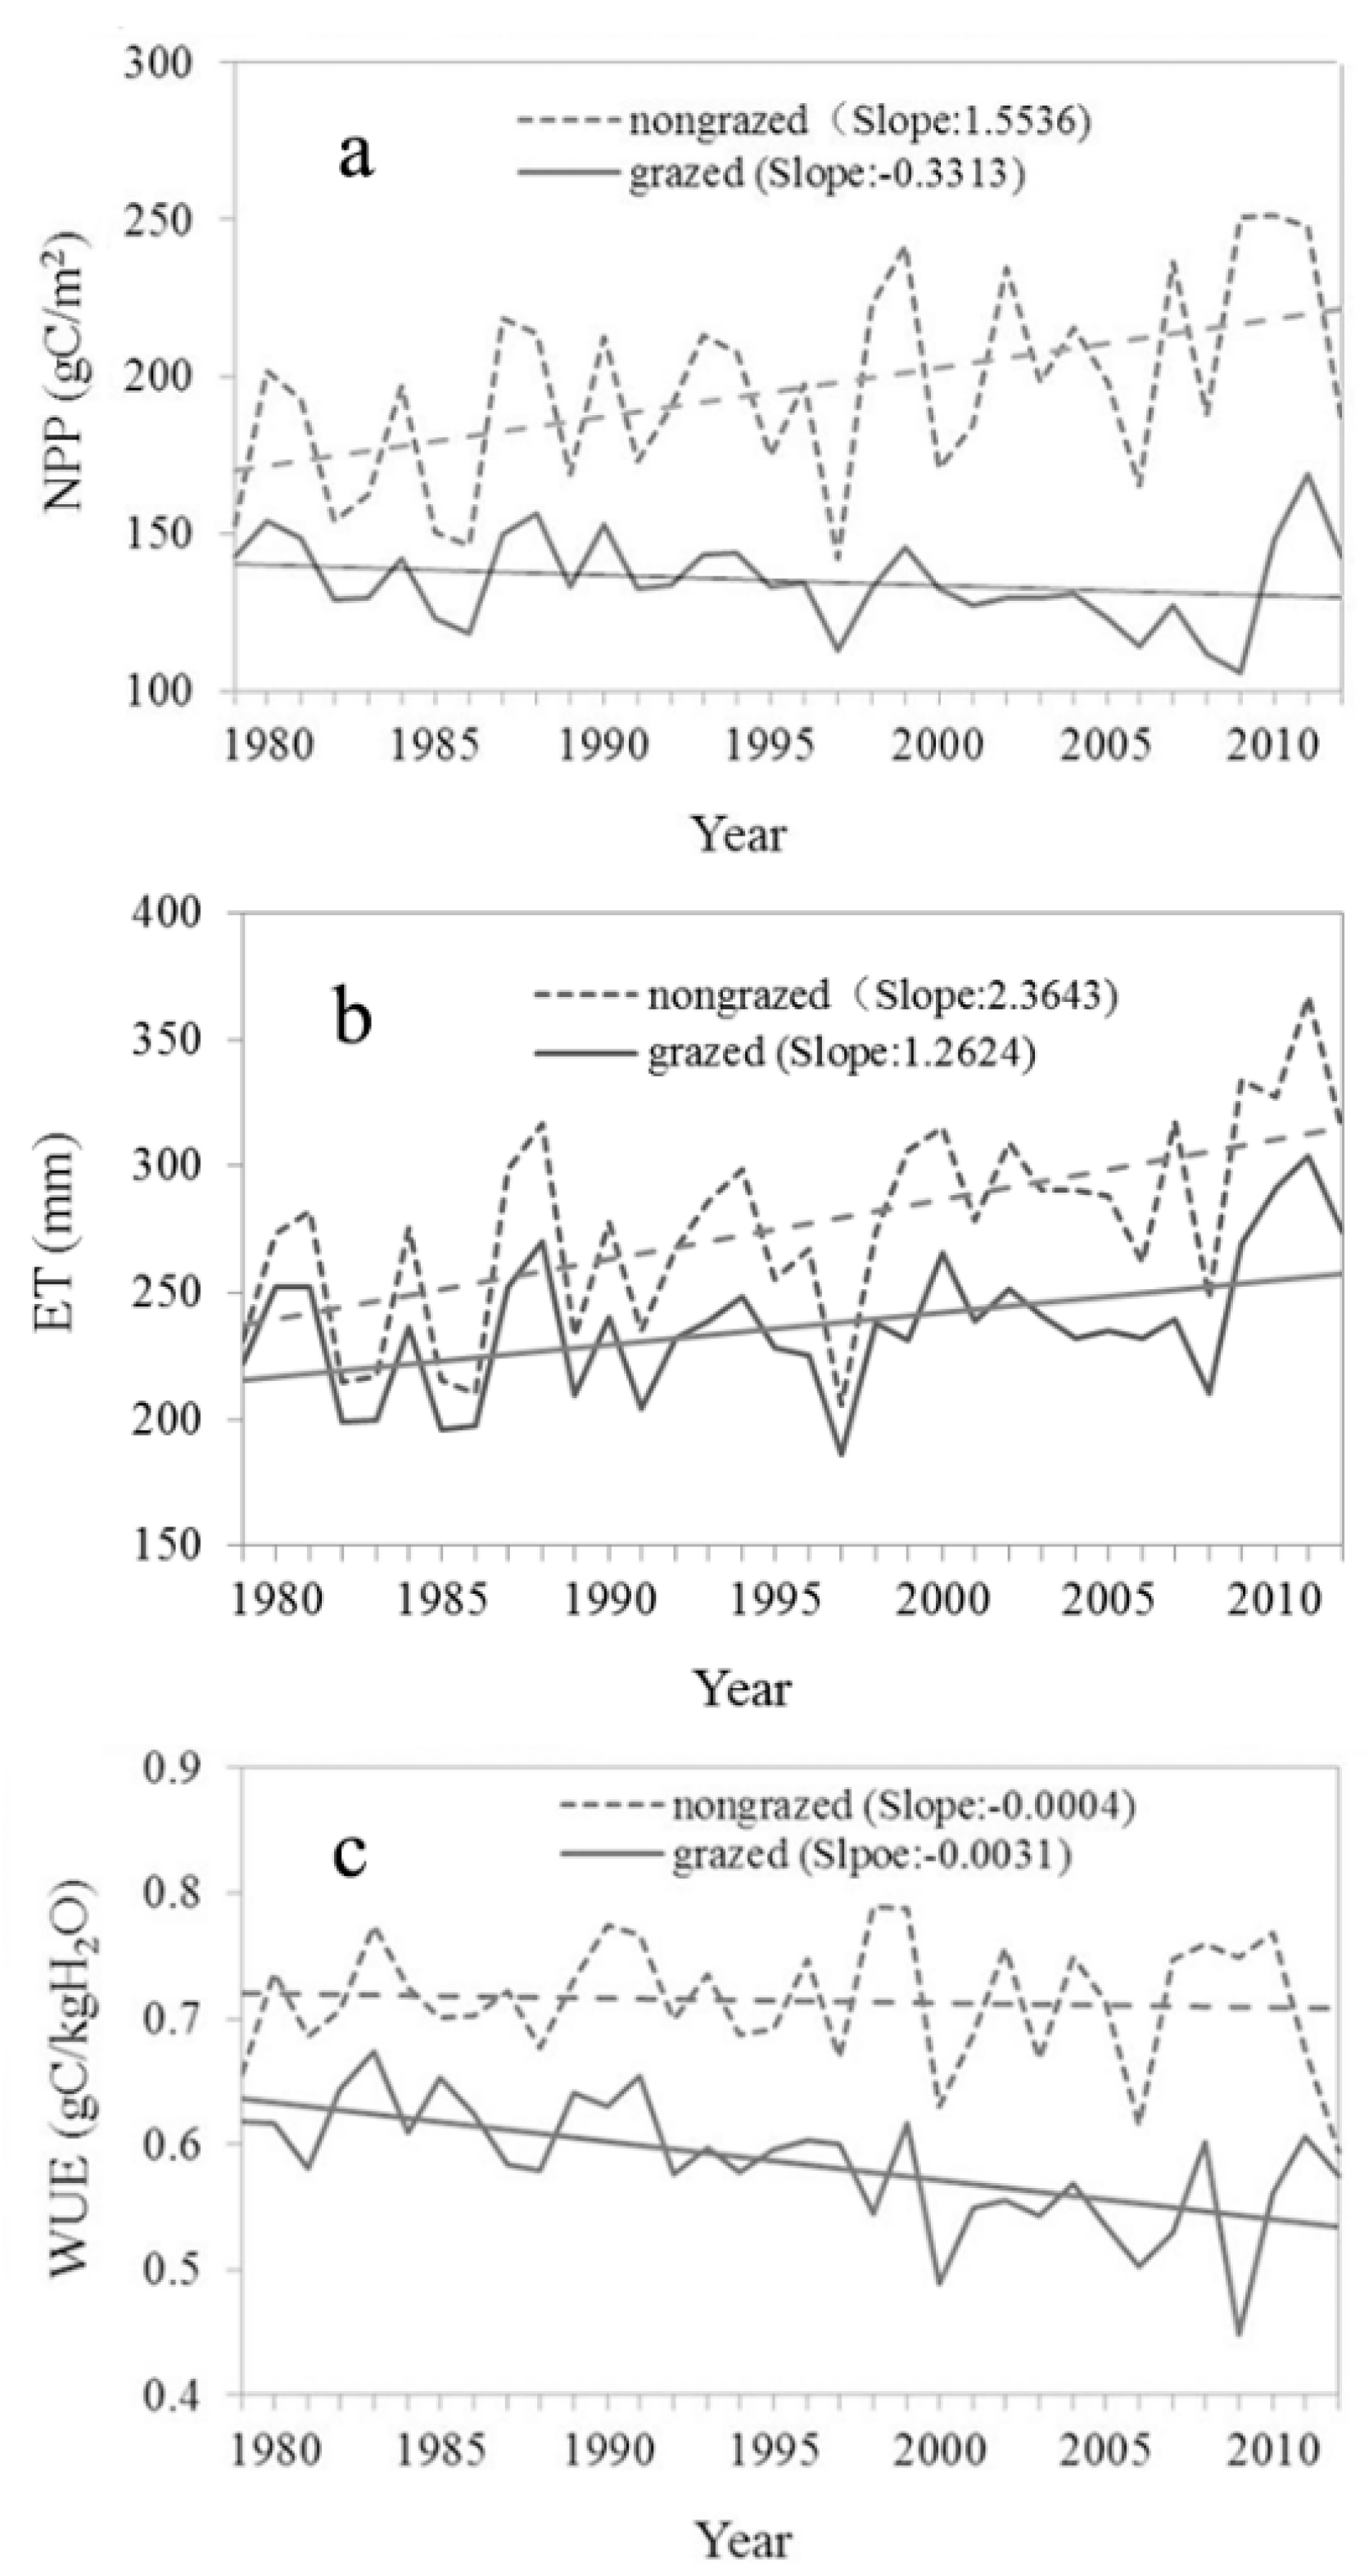
Figure 5 shows the time series of NPP, ET and WUE from the grazing and ungrazed scenarios. The interannual fluctuation in annual NPP under the grazing scenario was similar to that under the ungrazed scenario from 1979 to 2012, but annual NPP was lower under the grazing scenario than under the ungrazed scenario. In addition, annual NPP under the ungrazed scenario exhibited obviously increasing fluctuations. In contrast, decreasing fluctuations were observed under the grazing scenario (Figure 5a). The interannual variation in annual ET under the grazing scenario was similar to that under the ungrazed scenario from 1979 to 2012, and the ET was lower overall under the grazing scenario than under the ungrazed scenario. In addition, annual ET under the ungrazed scenario exhibited an obviously increasing trend, and the increase was slower under the grazing scenario (Figure 5b). The interannual variation in annual WUE under the grazing scenario was lower than that under the ungrazed scenario from 1979 to 2012. The annual WUE in the northern Tianshan Mountain grasslands under the grazing scenario exhibited a fluctuating decline, whereas no significant fluctuating decline was observed under the ungrazed scenario (Figure 5c).
3.3.2. Spatial Patterns of Differences in NPP, ET and WUE under Grazing and Ungrazed Scenarios
Dr, which is affected by grazing intensity and the grazing system, reflects the amount of NPP consumed by livestock. High Dr values were mainly distributed in the middle and lower Tianshan Mountains as well as portions of the high Tianshan Mountains, and low Dr values were mainly distributed in the desert plains and parts of the higher Tianshan Mountains (Figure 6a). The map of the differences in NPP, ET and WUE illustrates that NPP, ET and WUE decreased in most regions under the grazing scenario. Distinct decreases in NPP were mainly observed in areas with high Dr values, and increases in NPP were mainly distributed in mesic grasslands with low Dr values (Figure 6b). The regions where ET decreased distinctly under the grazing scenario were mainly distributed in the middle and high Tianshan Mountains. Increases in ET were mainly observed in the low-lying regions of the mountains (Figure 6c), while distinct decreases in WUE were mainly observed in the northern Ili Basin and parts of the mountains. Increases in WUE were mainly distributed in areas where less grass was consumed by livestock (Figure 6d).
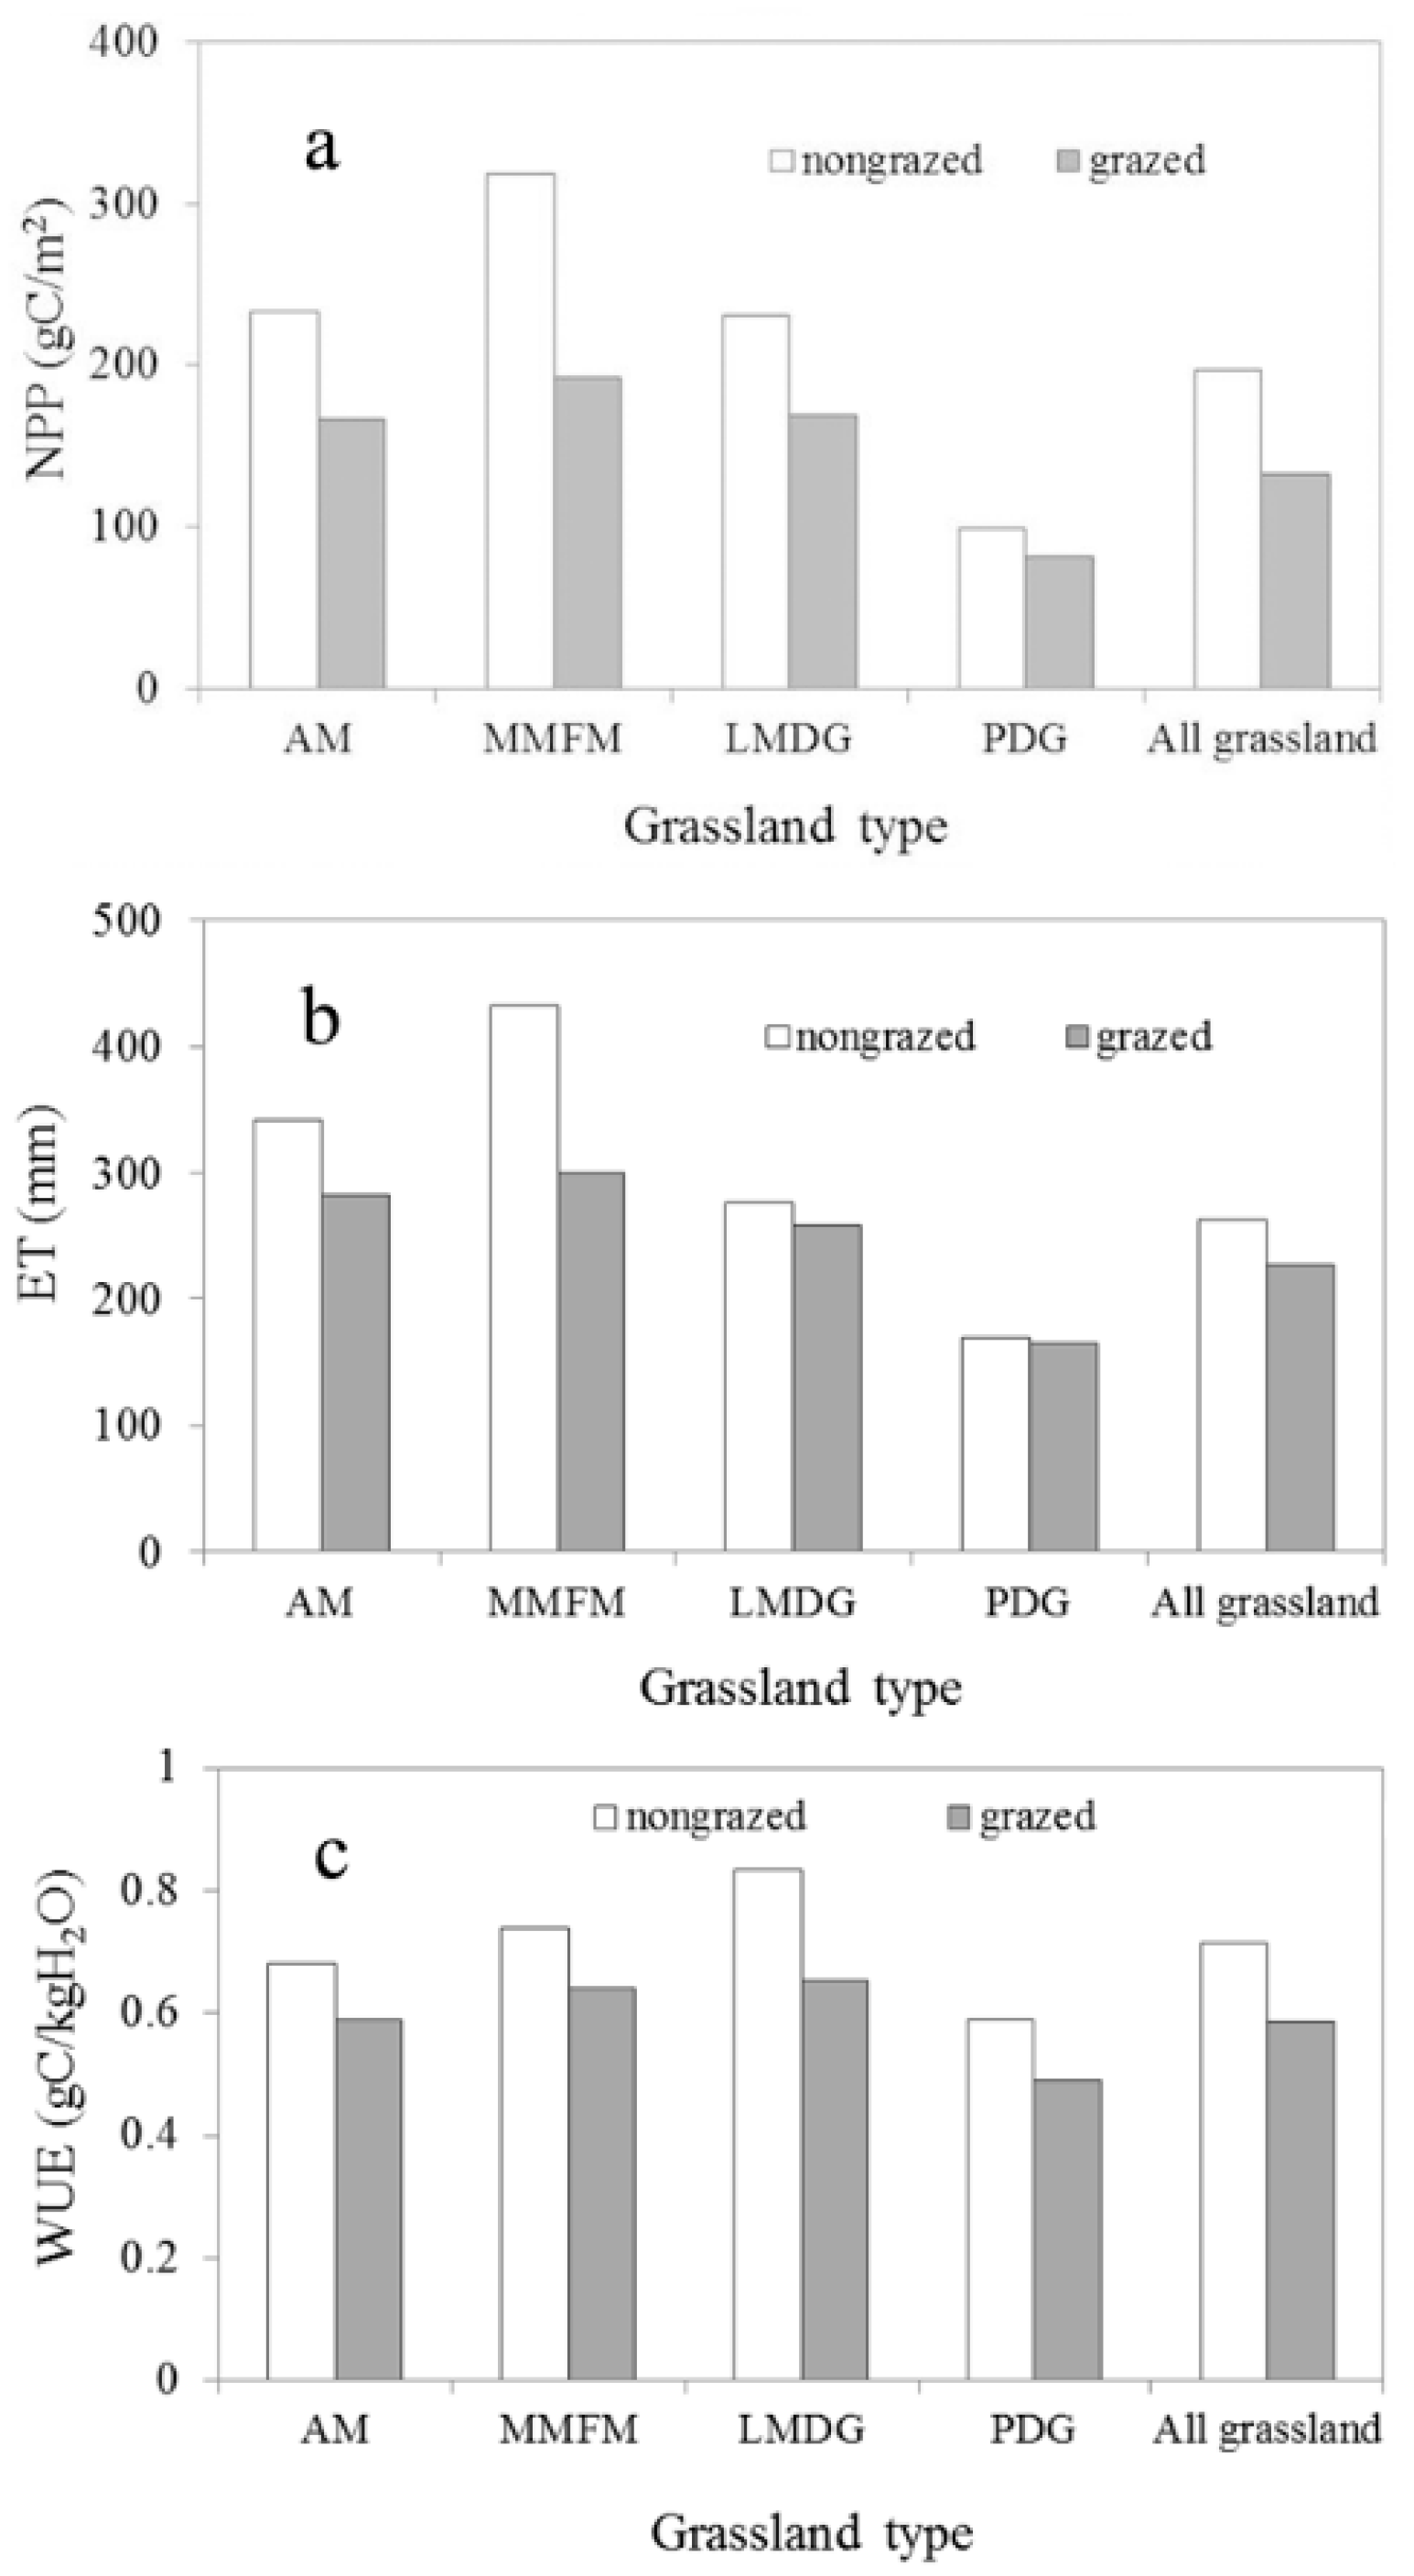
In the northern Tianshan Mountains, the average annual NPP under the grazing scenario decreased by 64.08 ± 28.81 gC/m2 compared with that under the ungrazed scenario from 1979 to 2012, and the average annual NPP decreases in different grassland types were ranked from high to low values as follows: MMFM (126.74 ± 48.99 gC/m2), AM (65.92 ± 27.09 gC/m2), LMDG (61.76 ± 50.16 gC/m2) and PDG (17.91 ± 26.64 gC/m2) (Figure 7a). In the northern Tianshan Mountain grasslands, the average annual ET under the grazing scenario decreased by 34.98 ± 17.04 mm compared with that under the ungrazed scenario from 1979 to 2012. Additionally, the average annual decreases in ET in the different grassland types were ranked from high to low values as follows: MMFM (131.89 ± 36.82 mm), AM (59.38 ± 22.05 mm), LMDG (18.41 ± 37.38 mm) and PDG (3.35 ± 15.33 mm). The average annual ET decreased more significantly in mountainous grasslands compared to PDG (Figure 7b). In the northern Tianshan Mountain grasslands, the average annual WUE under the grazing scenario decreased by 0.1292 ± 0.0589 gC/kg H2O compared with that under the ungrazed scenario from 1979 to 2012, and in the different grassland types, the decreases were ranked from high to low values as follows: LMDG (0.1796 ± 0.0903 gC/kg H2O), MMFM (0.0981 ± 0.0695 gC/kg H2O), PDG (0.0963 ± 0.0541 gC/kg H2O) and AM (0.0903 ± 0.0470 gC/kg H2O) (Figure 7c).
The percentages of the average annual Dr that accounted for the average annual NPPgrazed reflect the degree of NPP consumed by livestock. The change in the percentages of average annual Dr that accounted for the average annual NPPgrazed was similar to the variation in Dr between different grassland types. The highest values were observed in MMFM, and the lowest were observed in PDG. Additionally, the values observed in LMDG were slightly higher than those in AM. In general, the percentages of average annual Dr that accounted for the average annual NPPgrazed were higher in mountainous grasslands than in PDG (Table 4).
4. Discussion
In this study, we validated the reliability of the Biome-BGC grazing model in simulating NPP and ET by comparing field data from a previous study [47] and actual observations in the northern Tianshan Mountain grasslands; this approach ensured the validity of the model simulation results with respect to NPP and ET in this region.
Despite all this validation, the water and carbon cycles are complex systems involving many components that are not fully considered in the model. Uncertainty in the model results, and in those of any ecosystem model, is inevitable. The effects of trampling were not effectively considered in the model. Trampling can change the soil density and lead to other changes [48,49,50]. In addition, simulations were conducted for single-species systems; mixed-species systems cannot be effectively considered in the model. Therefore, we hope to develop an improved Biome-BGC grazing model in the future that accounts for trampling and mixed species.
4.1. Effects of Grazing on Grassland NPP, ET and WUE
Here, we showed that the grasslands in the northern Tianshan Mountains were a carbon sink under the ungrazed scenario over time, yet when grasslands were grazed, this same region became a carbon source during the same time period due to the significant negative effects on NPP caused by grazing. The NPP decreased in most regions, which indicated that overgrazing was widespread in the northern Tianshan Mountain grasslands, but the magnitude of this decrease varied based on grassland type due to different climate factors and grazing management along the elevation gradient. In rare cases, NPP increased, such as in the low-Dr regions in mesic grasslands, which indicated that overcompensation effects may have occurred when the grazing intensity was moderate [26,51]. The finding of overcompensation effects in our study was supported by previous studies in some European grasslands [26].
Our study showed that ET values under the grazing scenario were generally lower than those under the ungrazed scenario. Differences between the grazing and ungrazed scenarios displayed increasing trends due to increased grazing intensity in the past (Figure 2b). In most plains regions, decreases in ET may be caused by decreased transpiration because grass was consumed by livestock, which resulted in a reduction of the total leaf blade area [52]. Distinct decreases in ET under the grazing scenario occurred mainly in mountain areas with high grazing intensity. Overgrazing ultimately led to vegetation destruction, which not only decreased transpiration but also facilitated the generation of surface runoff; consequently, ET decreased distinctly.
In most regions, a decrease in WUE occurred under the grazing scenario. Additionally, ET decreased under the grazing scenario, which reduced the associated water loss and lowered the water stress. However, the interactions between grazing and grassland were very complex and involved many factors. In most regions, grazing caused considerable damage to the grass. In particular, grazing destroyed photosynthetic organs, such as leaves [10,28], which prohibited grass growth, so WUE decreased in most regions. Distinct decreases in WUE under the grazing scenario were mainly distributed in regions with high Dr values, and overgrazing severely inhibited grass growth. Conversely, increases in WUE under the grazing scenario were mainly distributed in regions with low Dr values, and moderate grazing, which can support the proper grass-livestock balance, may promote grass growth [51,53,54].
4.2. Comparison to Previous Studies
There is substantial debate over whether grazing can increase plant growth in moderately grazed systems [22,46,55]. In the North American Great Plains, grazing reduced NPP [24], but in some European grasslands, the NPP increased in moderately grazed systems [26]. The different results likely stemmed from difference in climate. It appears that compensatory growth occurs in these grazing systems, perhaps pointing to warm and mesic grasslands. In the northern Tianshan Mountains, Luo, Han, Zhou, Li, Chen, Li, Hu and Li [8] based on site simulations, found that moderate grazing can promote ANPP under water stress and decrease ANPP without water stress, and based on site research, Luo, Han, Zhou, Li, Chen, Li, Hu and Li [8] also found that grazing decreased ET, particularly in the middle and lower areas of the northern Tianshan Mountains. However, in our study at the regional scale, we found that overcompensation mainly occurred in some of the areas with low Dr values in mesic grasslands, and we also found that grazing distinctly decreased ET in high mountainous areas or, in rare cases, increased ET. The difference between the two studies are due to two major factors. First, grazing may change the pattern of biomass allocation between aboveground and belowground components [56,57], so an increase or decrease in ANPP does not necessarily correspond to an increase or decrease in NPP. Second, because observation sites were sparse and the surface was complex, the study by Luo, Han, Zhou, Li, Chen, Li, Hu and Li [8] did not provide an overall understanding of grazing effects on grassland NPP and ET in the northern Tianshan Mountains. Using remote sensing and modelling, studies of grassland NPP and ET were performed over large areas in the past, but they lacked the details required to provide an adequate understanding of these factors. Chen, Li, Li, Li and Abdulla [23] estimated grassland ET in Xinjiang using remote sensing, and Yang, et al. [58] estimated grassland NPP in Xinjiang using the CASA model. However, grazing effects were not considered in those studies. Han, Luo, Li and Xu [14] conducted research on carbon emissions in Xinjiang grasslands using the Biome-BGC grazing model. However, the grazing intensity used as an input was significantly lower than the actual grazing intensity, which led to inaccurate results. In our study, the grazing intensity was adjusted according to previous statistics from the statistical yearbook [9] and field survey to ensure that the value was close to the true value. In addition, all grazer values in our study were calculated in sheep units according to the “animal unit equivalent standard” provided by the Ministry of Agriculture of the People’s Republic of China (http://www.chinaforage.com/standard/zaixuliang.htm), which ensured that different grazing animals were comprehensively and effectively considered in the study. In previous studies in the northern Tianshan Mountains, the effects of grazing on grassland ET and WUE were not considered at the regional scale, but in the current study, the effects of grazing on grassland NPP, ET and WUE were simulated and systematically analyzed regionally along an elevation gradient using the Biome-BGC grazing model.
5. Conclusions
In general, the NPP, ET and WUE values under the grazing scenario were lower than those under the ungrazed scenario. The NPP showed an increasing trend under the ungrazed scenario. In contrast, the NPP showed a decreasing trend under the grazing scenario. Grazing changed the carbon sink in the northern Tianshan Mountains to a carbon source between 1979 and 2012. The ET exhibited increasing trends under both grazing and ungrazed scenarios, but the ET increase under the grazing scenario was slower than that under the ungrazed scenario. The WUE showed decreasing trends under both grazing and ungrazed scenarios, but the WUE decrease under the grazing scenario was more distinct, which may suggest that water stress decreased under the grazing scenario.
There was distinct spatial heterogeneity in the differences in NPP, ET and WUE under the grazing and ungrazed scenarios along an elevation gradient in the northern Tianshan Mountains. Distinct decreases in NPP and WUE under the grazing scenario were mainly distributed in regions with high Dr values, indicating that overgrazing severely inhibited grass growth, but in a rare case, NPP and WUE increased in parts of the low-Dr regions, indicating that moderate grazing may promote plant growth. In most plain regions, decreases in ET may have been caused by decreased transpiration. The decrease in ET was more distinct in mountainous areas with high grazing intensity due to decreased transpiration and increased surface runoff. This study contributes to a better understanding of grazing effects on grassland NPP, ET and WUE along an elevation gradient in the northern Tianshan Mountains and provides data to support the scientific management of grassland ecosystems.
Acknowledgments
This work was financially supported by the international Partnership Program of the Chinese Academy of Science (Grant No. 131965KYSB20160004) and the National Natural Science Foundation of China (Grant No. 41271126, 41461023).
Author Contributions
Geping Luo and Xiaotao Huang designed this study. Xiaotao Huang, Xinxin Wang and Huili He collected the data. Xiaotao Huang processed the data. Xiaotao Huang wrote the manuscript. Xiaotao Huang, Geping Luo and Tureniguli Amuti revised the manuscript.
Conflicts of Interest
The authors declare no conflicts of interest.
References
- Abdalla, K.; Chivenge, P.; Everson, C.; Mathieu, O.; Thevenot, M.; Chaplot, V. Long-term annual burning of grassland increases CO2 emissions from soils. Geoderma 2016, 282, 80–86. [Google Scholar] [CrossRef]
- Trepekli, A.; Loupa, G.; Rapsomanikis, S. Seasonal evapotranspiration, energy fluxes and turbulence variance characteristics of a Mediterranean coastal grassland. Agric. For. Meteorol. 2016, 226, 13–27. [Google Scholar] [CrossRef]
- Liu, X.Y.; Long, R.J.; Shang, Z. Evaluation method of ecological services function and their value for grassland ecosystems. Acta Pratacult. Sin. 2011, 20, 167–174. [Google Scholar]
- Eichelmann, E.; Wagner-Riddle, C.; Warland, J.; Deen, B.; Voroney, P. Evapotranspiration, water use efficiency, and energy partitioning of a mature switchgrass stand. Agric. For. Meteorol. 2016, 217, 108–119. [Google Scholar] [CrossRef]
- Li, S.-G.; Asanuma, J.; Kotani, A.; Davaa, G.; Oyunbaatar, D. Evapotranspiration from a Mongolian steppe under grazing and its environmental constraints. J. Hydrol. 2007, 333, 133–143. [Google Scholar] [CrossRef]
- Davis, S.C.; Burkle, L.A.; Cross, W.F.; Cutting, K.A. The effects of timing of grazing on plant and arthropod communities in high-elevation grasslands. PLoS ONE 2014, 9, e110460. [Google Scholar] [CrossRef] [PubMed]
- Yan, L.; Zhou, G.S.; Zhang, F. Effects of different grazing intensities on grassland production in China: A meta-analysis. PLoS ONE 2013, 8, e81466. [Google Scholar] [CrossRef] [PubMed]
- Luo, G.P.; Han, Q.F.; Zhou, D.C.; Li, L.; Chen, X.; Li, Y.; Hu, Y.K.; Li, B.L. Moderate grazing can promote aboveground primary production of grassland under water stress. Ecol. Complex. 2012, 11, 126–136. [Google Scholar] [CrossRef]
- Jin, J.X. Xinjiang Yearbook, 1st ed.; China Statistics Press: Beijing, China, 2012.
- Zhao, W.Y.; Li, J.L.; Qi, J.G. Changes in vegetation diversity and structure in response to heavy grazing pressure in the northern Tianshan Mountains, China. J. Arid Environ. 2007, 68, 465–479. [Google Scholar] [CrossRef]
- Liu, H.; Zang, R.G.; Chen, H.Y.H. Effects of grazing on photosynthetic features and soil respiration of rangelands in the Tianshan Mountains of northwest China. Sci. Rep. 2016, 6, 30087. [Google Scholar] [CrossRef] [PubMed]
- Gu, A.X.; Fan, Y.M.; Wu, H.Q.; Zhu, J.Z.; Jin, G.L.; Reziw, A. Relationship between the number of three main microorganisms and the soil environment of degraded grassland on the north slope of the Tianshan Mountains. Acta Pratacult. Sin. 2010, 19, 116–123. [Google Scholar]
- He, G.X.; Li, K.H.; Liu, X.J.; Gong, Y.M.; Hu, Y.K. Fluxes of methane, carbon dioxide and nitrous oxide in an alpine wetland and an alpine grassland of the Tianshan Mountains, China. J. Arid Land 2014, 6, 717–724. [Google Scholar] [CrossRef]
- Han, Q.F.; Luo, G.P.; Li, C.F.; Xu, W.Q. Modeling the grazing effect on dry grassland carbon cycling with biome-bgc model. Ecol. Complex. 2014, 17, 149–157. [Google Scholar] [CrossRef]
- Liu, W.B.; Wang, L.; Zhou, J.; Li, Y.Z.; Sun, F.B.; Fu, G.B.; Li, X.P.; Sang, Y.F. A worldwide evaluation of basin-scale evapotranspiration estimates against the water balance method. J. Hydrol. 2016, 538, 82–95. [Google Scholar] [CrossRef]
- Wang, K.C.; Dickinson, R.E. A review of global terrestrial evapotranspiration: Observation, modeling, climatology, and climatic variability. Rev. Geophys. 2012, 50, RG2005. [Google Scholar] [CrossRef]
- Niu, S.L.; Xing, X.R.; Zhang, Z.; Xia, J.Y.; Zhou, X.H.; Song, B.; Li, L.H.; Wan, S.Q. Water-use efficiency in response to climate change: From leaf to ecosystem in a temperate steppe. Glob. Chang. Biol. 2011, 17, 1073–1082. [Google Scholar] [CrossRef]
- Zhang, T.; Peng, J.; Liang, W.; Yang, Y.T.; Liu, Y.X. Spatial-temporal patterns of water use efficiency and climate controls in China’s Loess Plateau during 2000–2010. Sci. Total Environ. 2016, 565, 105–122. [Google Scholar] [CrossRef] [PubMed]
- Gaigalis, V.; Skema, R. A review on solid biofuel usage in Lithuania after the decommission of ignalina NPP and compliance with the EU policy. Renew. Sustain. Energy Rev. 2016, 54, 974–988. [Google Scholar] [CrossRef]
- Kool, D.; Agam, N.; Lazarovitch, N.; Heitman, J.L.; Sauer, T.J.; Ben-Gal, A. A review of approaches for evapotranspiration partitioning. Agric. For. Meteorol. 2014, 184, 56–70. [Google Scholar] [CrossRef]
- Medrano, H.; Tomas, M.; Martorell, S.; Escalona, J.M.; Pou, A.; Fuentes, S.; Flexas, J.; Bota, J. Improving water use efficiency of vineyards in semi-arid regions. A review. Agron. Sustain. Dev. 2015, 35, 499–517. [Google Scholar] [CrossRef]
- Han, Q.F.; Luo, G.P.; Li, C.F.; Ye, H.; Chen, Y.L. Modeling grassland net primary productivity and water-use efficiency along an elevational gradient of the northern Tianshan Mountains. J. Arid Land 2013, 5, 354–365. [Google Scholar] [CrossRef]
- Chen, X.; Li, B.L.; Li, Q.; Li, J.L.; Abdulla, S. Spatio-temporal pattern and changes of evapotranspiration in arid central Asia and Xinjiang of China. J. Arid Land 2012, 4, 105–112. [Google Scholar] [CrossRef]
- Derner, J.D.; Boutton, T.W.; Briske, D.D. Grazing and ecosystem carbon storage in the north American great Plains. Plant Soil 2006, 280, 77–90. [Google Scholar] [CrossRef]
- Mikola, J.; Setala, H.; Virkajarvi, P.; Saarijarvi, K.; Ilmarinen, K.; Voigt, W.; Vestberg, M. Defoliation and patchy nutrient return drive grazing effects on plant and soil properties in a dairy cow pasture. Ecol. Monogr. 2009, 79, 221–244. [Google Scholar] [CrossRef]
- Milchunas, D.G.; Lauenroth, W.K. Quantitative effects of grazing on vegetation and soils over a global range of environments. Ecol. Monogr. 1993, 63, 327–366. [Google Scholar] [CrossRef]
- Schuman, G.E.; Reeder, J.D.; Manley, J.T.; Hart, R.H.; Manley, W.A. Impact of grazing management on the carbon and nitrogen balance of a mixed-grass rangeland. Ecol. Appl. 1999, 9, 65–71. [Google Scholar] [CrossRef]
- Eldridge, D.J.; Poore, A.G.B.; Ruiz-Colmenero, M.; Letnic, M.; Soliveres, S. Ecosystem structure, function, and composition in rangelands are negatively affected by livestock grazing. Ecol. Appl. 2016, 26, 1273–1283. [Google Scholar] [CrossRef] [PubMed] [Green Version]
- Kimuyu, D.M.; Sensenig, R.L.; Riginos, C.; Veblen, K.E.; Young, T.P. Native and domestic browsers and grazers reduce fuels, fire temperatures, and acacia ant mortality in an African savanna. Ecol. Appl. 2014, 24, 741–749. [Google Scholar] [CrossRef] [PubMed]
- Bresloff, C.J.; Nguyen, U.; Glenn, E.P.; Waugh, J.; Nagler, P.L. Effects of grazing on leaf area index, fractional cover and evapotranspiration by a desert phreatophyte community at a former uranium mill site on the Colorado Plateau. J. Environ. Manag. 2013, 114, 92–104. [Google Scholar] [CrossRef] [PubMed]
- Miao, H.; Chen, S.; Chen, J.; Zhang, W.; Zhang, P.; Wei, L.; Han, X.; Lin, G. Cultivation and grazing altered evapotranspiration and dynamics in Inner Mongolia steppes. Agric. For. Meteorol. 2009, 149, 1810–1819. [Google Scholar] [CrossRef]
- Wu, H.L. Evapotranspiration estimation of platycladus orientalis in northern China based on various models. J. For. Res.-Jpn. 2016, 27, 871–878. [Google Scholar] [CrossRef]
- Baldocchi, D.D. Assessing the eddy covariance technique for evaluating carbon dioxide exchange rates of ecosystems: Past, present and future. Glob. Chang. Biol. 2003, 9, 479–492. [Google Scholar] [CrossRef]
- Gurney, K.R.; Law, R.M.; Denning, A.S.; Rayner, P.J.; Baker, D.; Bousquet, P.; Bruhwiler, L.; Chen, Y.H.; Ciais, P.; Fan, S.; et al. Towards robust regional estimates of CO2 sources and sinks using atmospheric transport models. Nature 2002, 415, 626–630. [Google Scholar] [CrossRef] [PubMed]
- Dorigo, W.A.; Zurita-Milla, R.; de Wit, A.J.W.; Brazile, J.; Singh, R.; Schaepman, M.E. A review on reflective remote sensing and data assimilation techniques for enhanced agroecosystem modeling. Int. J. Appl. Earth Obs. Geoinf. 2007, 9, 165–193. [Google Scholar] [CrossRef]
- Zhang, Y.L.; Song, C.H.; Sun, G.; Band, L.E.; McNulty, S.; Noormets, A.; Zhang, Q.F.; Zhang, Z.Q. Development of a coupled carbon and water model for estimating global gross primary productivity and evapotranspiration based on eddy flux and remote sensing data. Agric. For. Meteorol. 2016, 223, 116–131. [Google Scholar] [CrossRef]
- Li, Z.; Yang, D.W.; Hong, Y. Multi-scale evaluation of high-resolution multi-sensor blended global precipitation products over the Yangtze River. J. Hydrol. 2013, 500, 157–169. [Google Scholar] [CrossRef]
- Laniak, G.F.; Olchin, G.; Goodall, J.; Voinov, A.; Hill, M.; Glynn, P.; Whelan, G.; Geller, G.; Quinn, N.; Blind, M.; et al. Integrated environmental modeling: A vision and roadmap for the future. Environ. Model. Softw. 2013, 39, 3–23. [Google Scholar] [CrossRef] [Green Version]
- Wang, Q.X.; Masataka, W.; Zhu, O.Y. Simulation of water and carbon fluxes using BIOME-BGC model over crops in China. Agric. For. Meteorol. 2005, 131, 209–224. [Google Scholar] [CrossRef]
- Xu, L.; Guo, P.; Liu, L.; Wang, L. Analysis of the spatiotemporal features of land use and land degradation in the northern Piedmont area of the Tianshan Mountains. Res. Soil Water Conserv. 2014, 21, 316–321. [Google Scholar]
- Seligman, N.G.; Cavagnaro, J.B.; Horno, M.E. Simulation of defoliation effects on primary production of a warm-season, semiarid perennial-species grassland. Ecol. Model. 1992, 60, 45–61. [Google Scholar] [CrossRef]
- Zhao, L.W.; Zhao, W.Z. Evapotranspiration of an oasis-desert transition zone in the middle stream of Heihe River, northwest China. J. Arid Land 2014, 6, 529–539. [Google Scholar] [CrossRef]
- Running, S.W.; Coughlan, J.C. A general-model of forest ecosystem processes for regional applications. 1. Hydrologic balance, canopy gas-exchange and primary production processes. Ecol. Model. 1988, 42, 125–154. [Google Scholar] [CrossRef]
- Hijmans, R.J.; Cameron, S.E.; Parra, J.L.; Jones, P.G.; Jarvis, A. Very high resolution interpolated climate surfaces for global land areas. Int. J. Climatol. 2005, 25, 1965–1978. [Google Scholar] [CrossRef]
- Raj, R.; Hamm, N.A.S.; van der Tol, C.; Stein, A. Variance-based sensitivity analysis of BIOME-BGC for gross and net primary production. Ecol. Model. 2014, 292, 26–36. [Google Scholar] [CrossRef]
- Yan, R.; Xiong, H.; Zhang, F. The evapotranspiration and energy budget of an Achnatherum splendens grassland in the oasis-desert ecotone in Xinjiang, China, during summer and autumn. J. Desert Res. 2013, 33, 133–140. [Google Scholar]
- Han, Q.; Luo, G.; Li, C.; Shakir, A.; Wu, M.; Saidov, A. Simulated grazing effects on carbon emission in central Asia. Agric. For. Meteorol. 2016, 216, 203–214. [Google Scholar] [CrossRef]
- Neff, J.C.; Reynolds, R.L.; Belnap, J.; Lamothe, P. Multi-decadal impacts of grazing on soil physical and biogeochemical properties in southeast Utah. Ecol. Appl. 2005, 15, 87–95. [Google Scholar] [CrossRef]
- Bell, L.W.; Kirkegaard, J.A.; Swan, A.; Hunt, J.R.; Huth, N.I.; Fettell, N.A. Impacts of soil damage by grazing livestock on crop productivity. Soil Tillage Res. 2011, 113, 19–29. [Google Scholar] [CrossRef]
- Teague, W.R.; Dowhower, S.L.; Baker, S.A.; Haile, N.; DeLaune, P.B.; Conover, D.M. Grazing management impacts on vegetation, soil biota and soil chemical, physical and hydrological properties in tall grass prairie. Agric. Ecosyst. Environ. 2011, 141, 310–322. [Google Scholar] [CrossRef]
- Agrawal, A.A. Overcompensation of plants in response to herbivory and the by-product benefits of mutualism. Trends Plant Sci. 2000, 5, 309–313. [Google Scholar] [CrossRef]
- Bremer, D.J.; Auen, L.M.; Ham, J.M.; Owensby, C.E. Evapotranspiration in a prairie ecosystem: Effects of grazing by cattle. Agron. J. 2001, 93, 338–348. [Google Scholar] [CrossRef]
- Olejniczak, P. Overcompensation in response to simulated herbivory in the perennial herb sedum maximum. Plant Ecol. 2011, 212, 1927–1935. [Google Scholar] [CrossRef]
- Paige, K.N. Overcompensation in response to mammalian herbivory: From mutualistic to antagonistic interactions. Ecology 1992, 73, 2076–2085. [Google Scholar] [CrossRef]
- Guo, S.; Yang, G.; Li, Q.; Zhao, C. Observation and estimation of the evapotranspiration of alpine meadow in the upper reaches of the Aksu River, Xinjiang. J. Glaciol. Geocryol. 2015, 37, 241–248. [Google Scholar]
- Leriche, H.; LeRoux, X.; Gignoux, J.; Tuzet, A.; Fritz, H.; Abbadie, L.; Loreau, M. Which functional processes control the short-term effect of grazing on net primary production in grasslands? Oecologia 2001, 129, 114–124. [Google Scholar] [CrossRef] [PubMed]
- Holland, E.A.; Parton, W.J.; Detling, J.K.; Coppock, D.L. Physiological-responses of plant-populations to herbivory and their consequences for ecosystem nutrient flow. Am. Nat. 1992, 140, 685–706. [Google Scholar] [CrossRef] [PubMed]
- Yang, D.F.; Gang, C.C.; MU, S.J.; Zhang, C.B.; Zhou, W.; Li, J.L. Analysis of the spatio-temporal variation in net primary productivity of grassland during the past 10 years in Xinjiang. Acta Pratacult. Sin. 2014, 23, 33–50. [Google Scholar]
Figure 1.
Distributions of grassland types (a), average annual grazing intensity (b), average annual temperature (c) and average annual precipitation (d) in the northern Tianshan Mountains from 1979 to 2012.
Figure 1.
Distributions of grassland types (a), average annual grazing intensity (b), average annual temperature (c) and average annual precipitation (d) in the northern Tianshan Mountains from 1979 to 2012.

Figure 2.
Interannual variations in temperature and precipitation (a) and grazing intensity across different grassland types (b) in the northern Tianshan Mountains from 1979 to 2012. (Notes: AM, alpine meadow; MMFM, mid-mountain forest meadow; LMDG, low-mountain dry grassland; PDG, plain desert grassland).

Figure 3.
Comparison of annual NPP based on simulated and observed field data in the northern Tianshan Mountain grasslands (a), and comparisons between simulated and observed daily ET in a low-mountain dry grassland in Urumqi County (b), an alpine meadow in Aksu (c) and a plain desert grassland in Qitai County (d). (Notes: NPP, net primary productivity; ET, evapotranspiration).
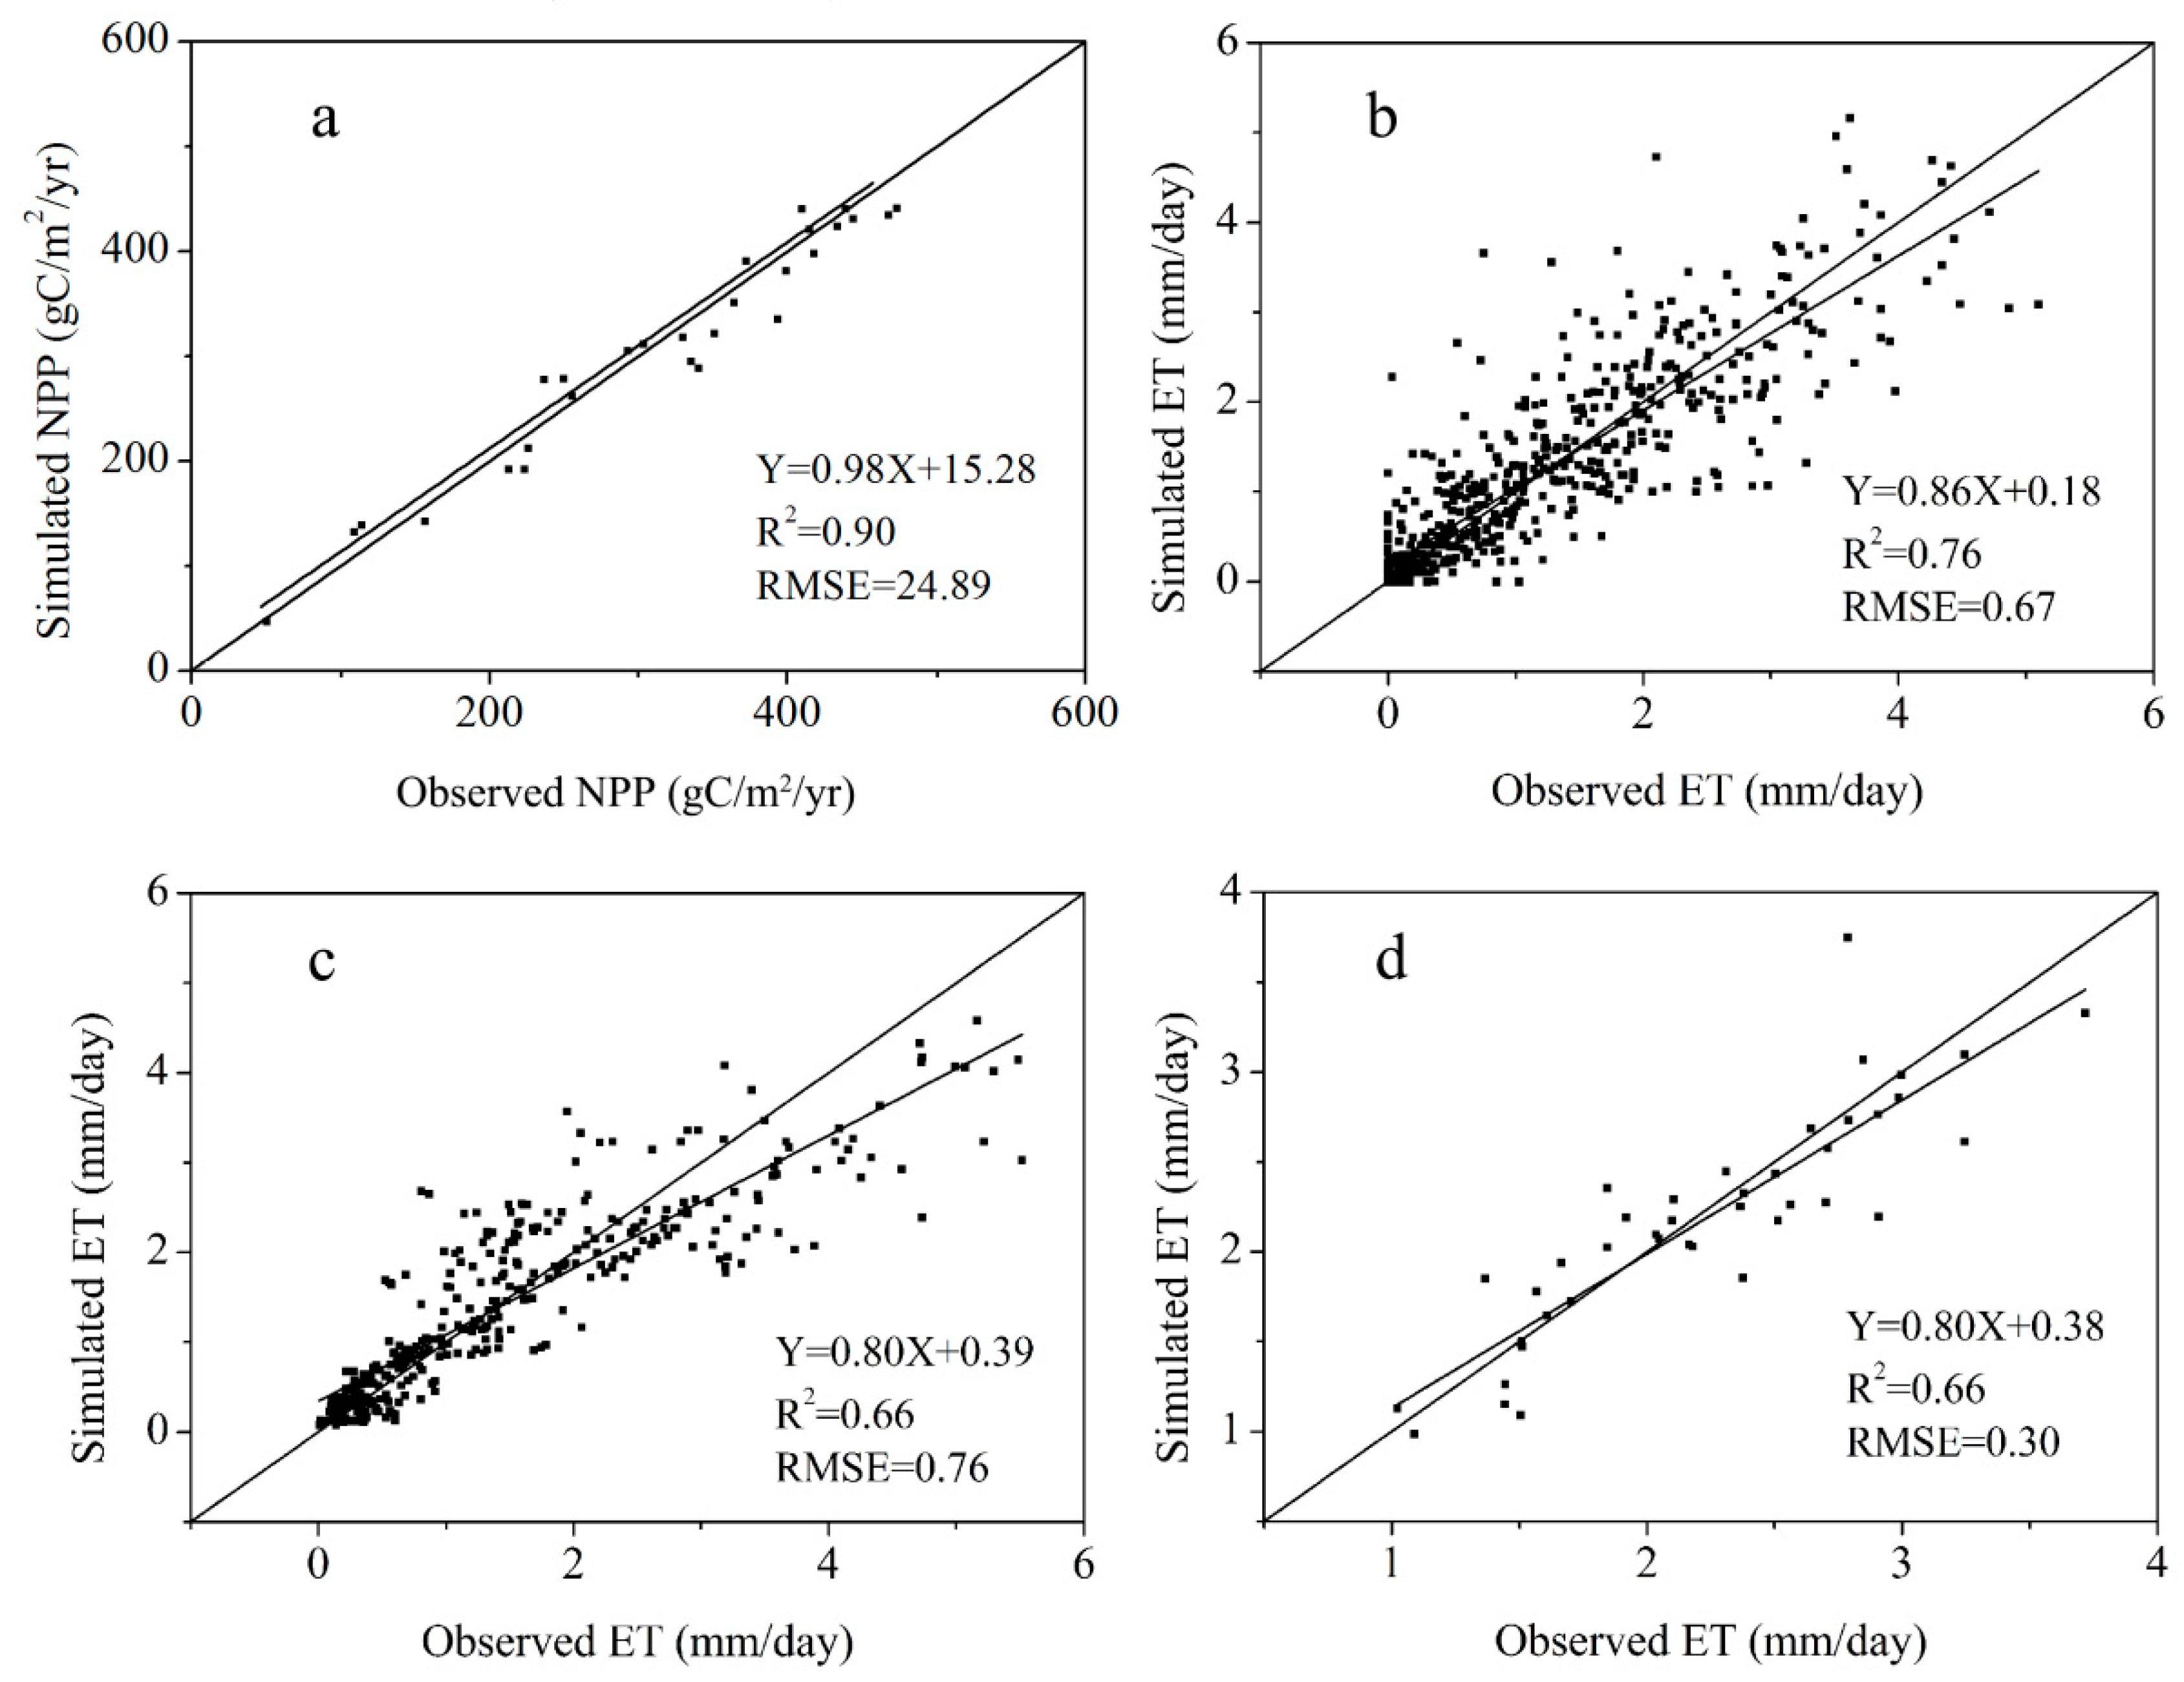
Figure 4.
Spatial variations in the average annual NPP (a), average annual ET (b) and average annual WUE (c) under the ungrazed scenario from 1979 to 2012 in the northern Tianshan Mountain grasslands.
Figure 4.
Spatial variations in the average annual NPP (a), average annual ET (b) and average annual WUE (c) under the ungrazed scenario from 1979 to 2012 in the northern Tianshan Mountain grasslands.

Figure 5.
Interannual variations in the annual NPP (a), annual ET (b) and annual WUE (c) under the grazing and ungrazed scenarios in the northern Tianshan Mountain grasslands from 1979 to 2012.
Figure 5.
Interannual variations in the annual NPP (a), annual ET (b) and annual WUE (c) under the grazing and ungrazed scenarios in the northern Tianshan Mountain grasslands from 1979 to 2012.

Figure 6.
Spatial distributions of differences in average annual Dr (a), average annual NPP (b), average annual ET (c) and average annual WUE (d) between grazing and ungrazed scenarios from 1979 to 2012 in the northern Tianshan Mountain grasslands. (Notes: NPP difference = NPPgrazed − NPPungrazed; ET difference = ETgrazed − ETungrazed; WUE difference = WUEgrazed − WUEungrazed).
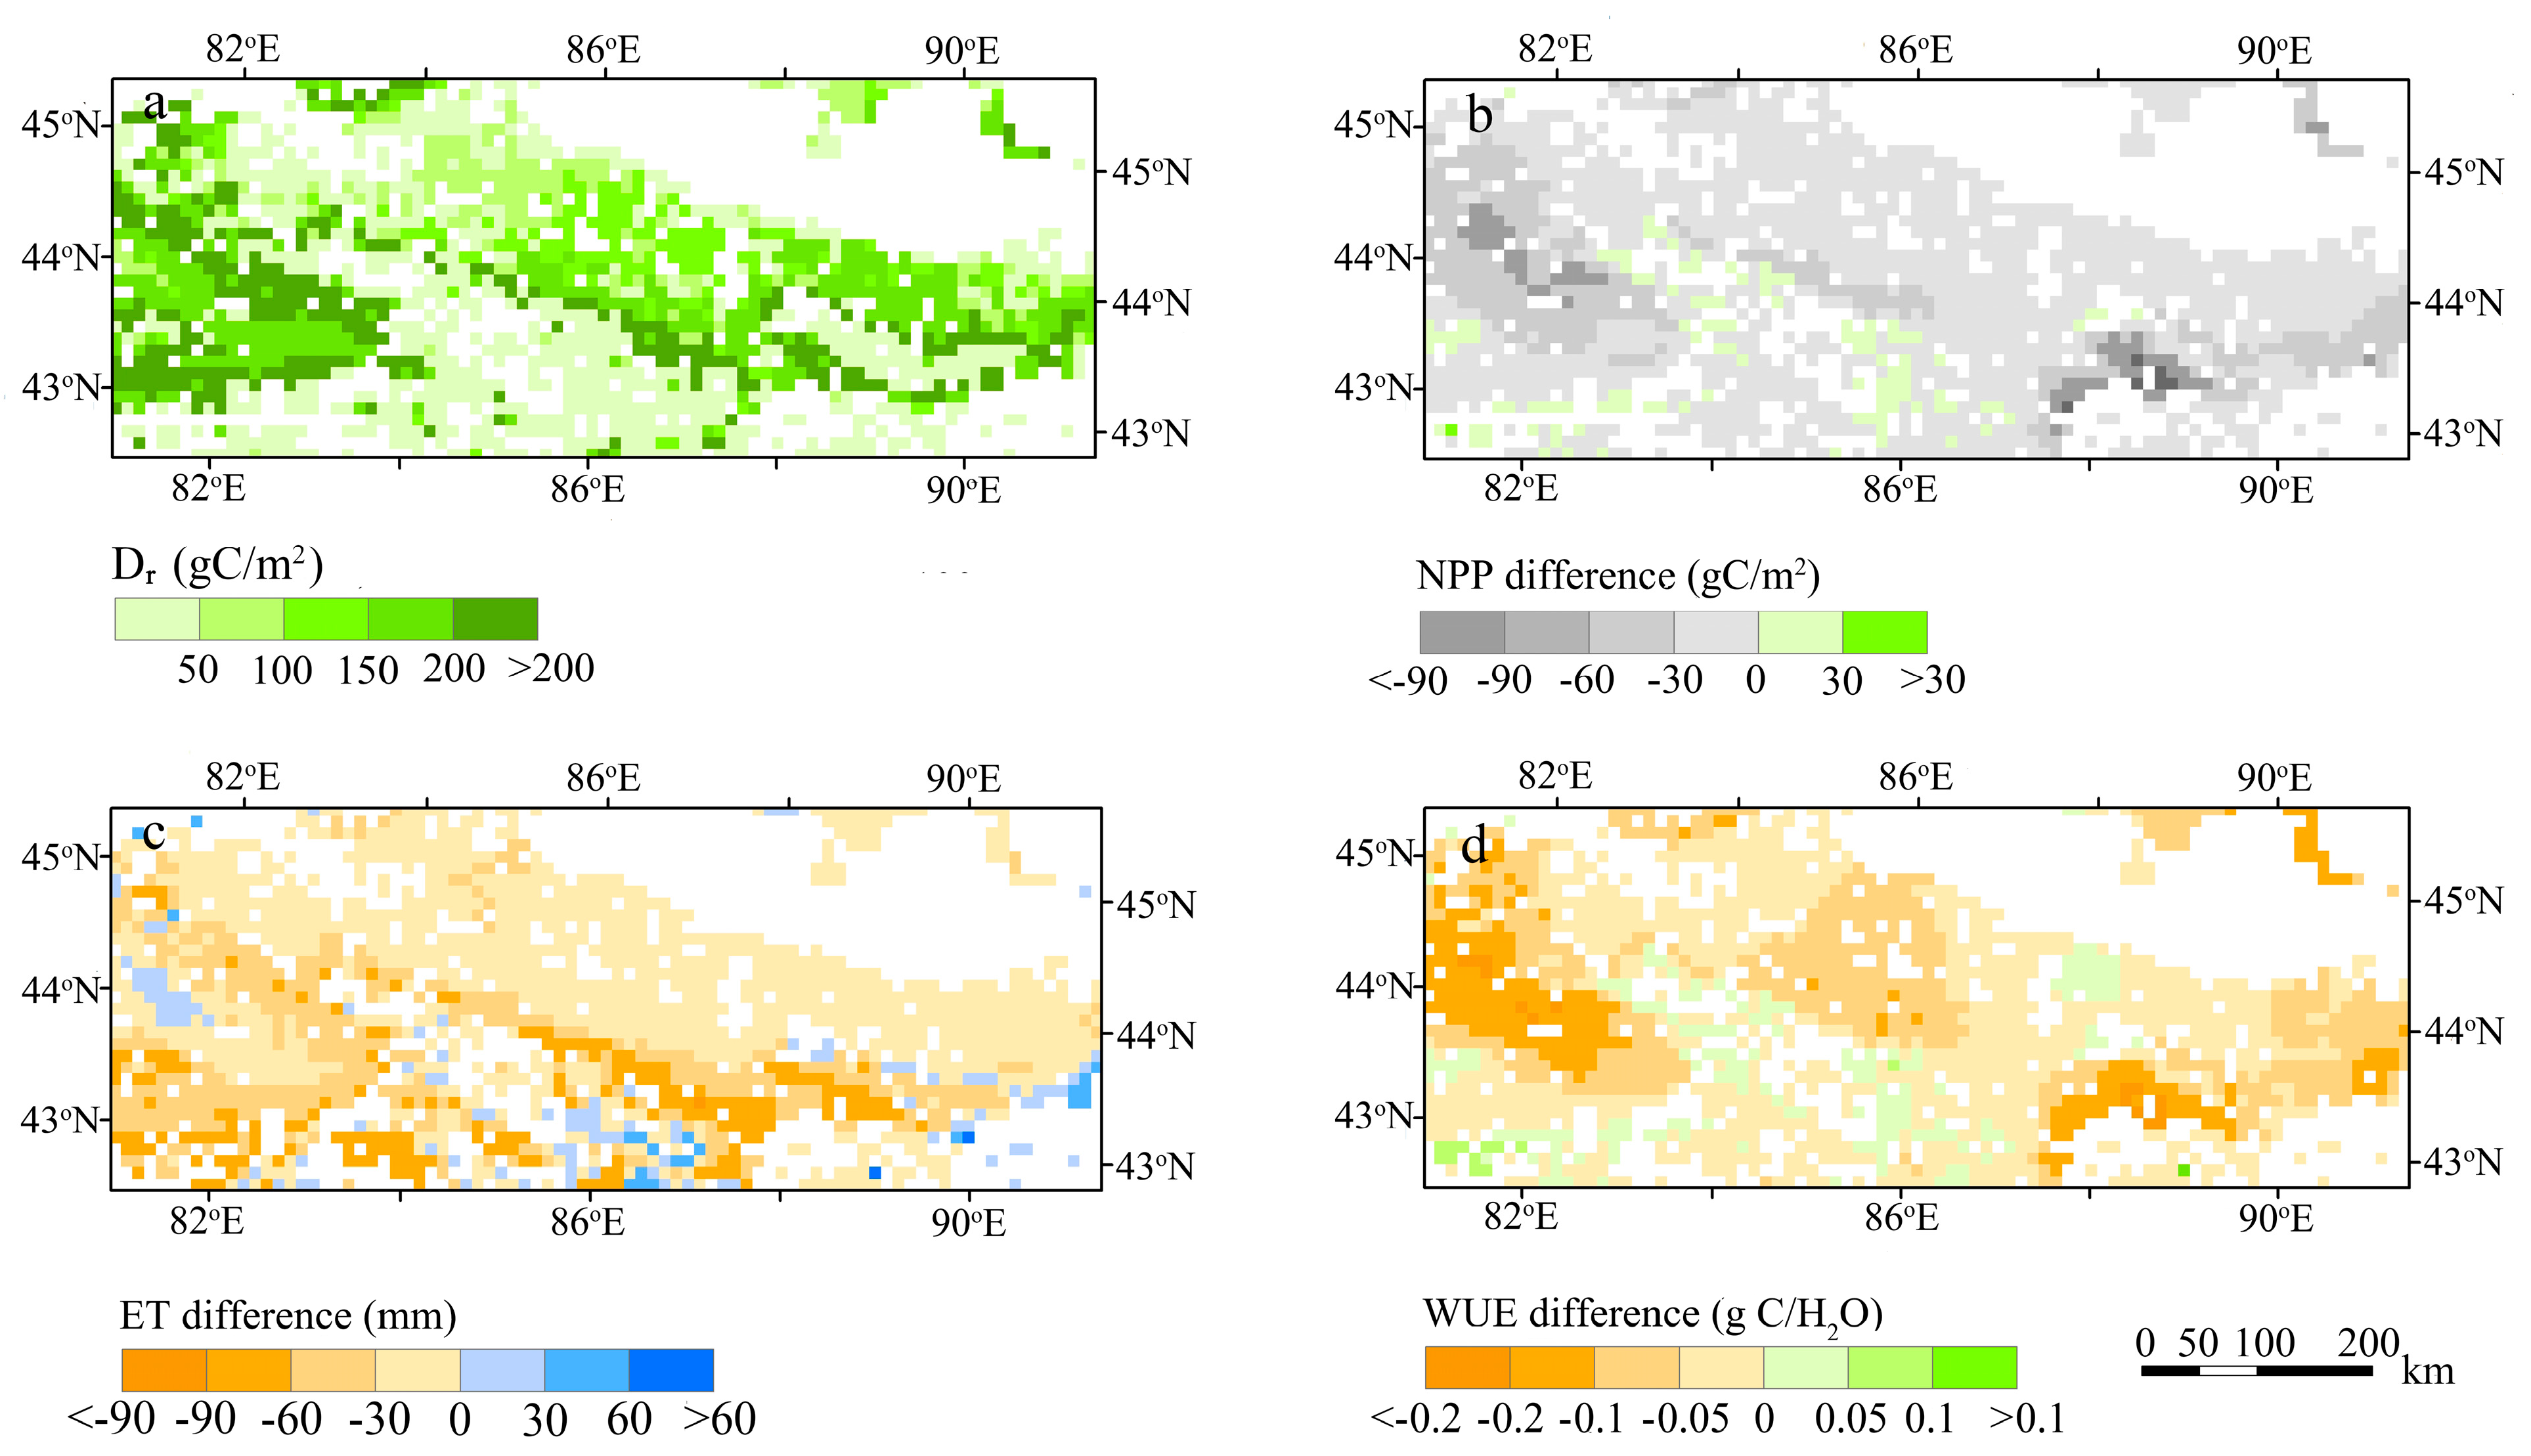
Figure 7.
Average annual simulated estimates of NPP (a), ET (b) and WUE (c) under grazing and ungrazed scenarios in different grassland types in the northern Tianshan Mountain grasslands from 1979 to 2012.
Figure 7.
Average annual simulated estimates of NPP (a), ET (b) and WUE (c) under grazing and ungrazed scenarios in different grassland types in the northern Tianshan Mountain grasslands from 1979 to 2012.


Table 1.
Data sources.
| Location | Grassland Type | Validation Data (ET and NPP) | Meteorological Data | GRAZING Data | Soil Texture (Sand/Silt/Clay Percentages) | Elevation Data |
|---|---|---|---|---|---|---|
| Urumqi | LMDG | Daily ET (July 2012–December 2015) | Actual observations | Visiting herdsmen | Field investigations and laboratory analysis | Field investigations |
| Qitai | PDG | Daily ET (July 22–September 2, 2010) [40] | Actual observations | Visiting herdsmen | Field investigations and laboratory analysis | Field investigations |
| Aksu | AM | Daily ET (October 2012–September 2013) | Actual observations | Visiting herdsmen | Field investigations and laboratory analysis | Field investigations |
| Annual NPP obtained from a previous publication [14] and actual observations | Actual observations | Visiting herdsmen | Field investigations and laboratory analysis | Field investigations | ||
| Northern Tianshan Mountain grasslands | China Meteorological Forcing Data set (http://dam.itpcas.ac.c-n/chs/rs/?q=data) | GLIS (http://www.fao.org/A-G/againfo/resources/en/-glw/GLW_dens.html) (corrected based on statistical data from Xinjiang Yearbook [9] and field investigation by visiting some herdsmen) | HWSD (http://westdc.we-stgis.ac.cn/data/611f7d5-0-b419-4d14-b4dd-4a94-4b141175) | WorldClim (http://www.wo-rldclim.org/) [44] |
Abbreviations: LMDG, low-mountain dry grassland; PDG, plain desert grassland; AM, alpine meadow; ET, evapotranspiration; NPP, net primary productivity; GLIS, Global Livestock Information System; HWSD, Harmonized World Soil Database.
| Parameters | PDG | LMDG | MMFM | AM |
|---|---|---|---|---|
| Yearday to start new growth | 80 ** | 85 ** | 100 ** | 112 ** |
| Yearday to end litterfall | 310 ** | 317 ** | 300 ** | 270 ** |
| Transfer growth period as a fraction of the growing season | 0.35 | 0.35 | 0.35 | 0.35 |
| Litterfall as a fraction of the growing season | 0.35 | 0.35 | 0.35 | 0.35 |
| Annual leaf and fine root turnover fraction | 1 | 1 | 1 | 1 |
| Annual whole-plant mortality fraction | 0.1 | 0.1 | 0.1 | 0.1 |
| New fine root C: new leaf C | 4 ** | 3 ** | 2 ** | 2.5 ** |
| C:N of leaves (kg C/kg N) | 23.57 | 23.57 | 23.57 | 23.57 |
| C:N of leaf litter after retranslocation proportion is accounted for (kg C/kg N) | 41.44 | 41.44 | 41.44 | 41.44 |
| C:N of fine roots (kg C/kg N) | 46.36 | 46.36 | 46.36 | 46.36 |
| Leaf litter labile proportion | 0.39 | 0.39 | 0.39 | 0.39 |
| Leaf litter cellulose proportion | 0.44 | 0.44 | 0.44 | 0.44 |
| Leaf litter lignin proportion | 0.17 | 0.17 | 0.17 | 0.17 |
| Fine root labile proportion | 0.30 | 0.30 | 0.30 | 0.30 |
| Fine root cellulose proportion | 0.45 | 0.45 | 0.45 | 0.45 |
| Fine root lignin proportion | 0.25 | 0.25 | 0.25 | 0.25 |
| Canopy water interception coefficient (1/LAI/d) | 0.021 | 0.021 | 0.021 | 0.021 |
| Canopy light extinction coefficient | 0.6 | 0.6 | 0.6 | 0.6 |
| All-sided to projected leaf area ratio | 2 | 2 | 2 | 2 |
| Average specific leaf area of the canopy (projected on an area basis) (m2/kg C) | 12.5 ** | 12 ** | 30 ** | 25** |
| Ratio of shaded specific leaf area: sunlit specific leaf area | 2 | 2 | 2 | 2 |
| Fraction of leaf N in RuBisCO | 0.15 | 0.15 | 0.15 | 0.15 |
| Maximum stomatal conductance (projected on an area basis) (m/s) | 0.006 | 0.006 | 0.006 | 0.006 |
| Cuticular conductance (projected on an area basis) (m/s) | 0.00006 | 0.00006 | 0.00006 | 0.00006 |
| Boundary layer conductance (projected on an area basis) (m/s) | 0.04 | 0.04 | 0.04 | 0.04 |
| Leaf water potential: start of conductance reduction (MPa) | −0.73 | −0.73 | −0.73 | −0.73 |
| Leaf water potential: completion of conductance reduction (MPa) | −2.7 | −2.7 | −2.7 | −2.7 |
| Vapor pressure deficit: start of conductance reduction (Pa) | 1250 | 1250 | 1250 | 1250 |
| Vapor pressure deficit: completion of conductance reduction (Pa) | 5725 | 5725 | 5725 | 5725 |
Note: ** Parameters were corrected according to previous observational studies. Abbreviations: AM, alpine meadow; MMFM, mid-mountain forest meadow; LMDG, low-mountain dry grassland; PDG, plain desert grassland.
Table 3.
The average annual estimates of NPP, ET and WUE under the ungrazed scenario for different grasslands from 1979 to 2012 in the northern Tianshan Mountains.
Table 3.
The average annual estimates of NPP, ET and WUE under the ungrazed scenario for different grasslands from 1979 to 2012 in the northern Tianshan Mountains.
| Variable | AM | MMFM | LMDG | PDG | All Grasslands |
|---|---|---|---|---|---|
| NPP (gC/m2) | 232.76 ± 25.78 | 318.59 ± 47.67 | 230.68 ± 59.95 | 99.18 ± 32.89 | 197.12 ± 31.31 |
| ET (mm) | 342.19 ± 32.93 | 431.81 ± 51.21 | 276.89 ± 53.93 | 168.81 ± 32.72 | 276.04 ± 39.61 |
| WUE (gC/kg H2O) | 0.6802 ± 0.0709 | 0.7378 ± 0.0462 | 0.8331 ± 0.0485 | 0.5875 ± 0.0496 | 0.7141 ± 0.0489 |
Abbreviations: NPP, net primary productivity; ET, evapotranspiration; WUE: water use efficiency; AM, alpine meadow; MMFM, mid-mountain forest meadow; LMDG, low-mountain dry grassland; PDG, plain desert grassland.
Table 4.
Dr for different grasslands from 1979 to 2012.
| Grassland Type | Average Annual Dr (gC/m2/yr) | Percentages of Dr That Accounted for NPPgrazed (%) |
|---|---|---|
| AM | 41.74 ± 23.93 | 25.02 |
| MMFM | 59.00 ± 33.82 | 30.75 |
| LMDG | 42.80 ± 24.54 | 25.34 |
| PDG | 15.97 ± 9.16 | 19.65 |
| All grasslands | 33.66 ± 19.30 | 25.30 |
Notes: Dr indicates the carbon consumed by animals; NPPgrazed indicates NPP under the grazing scenario.
© 2017 by the authors. Licensee MDPI, Basel, Switzerland. This article is an open access article distributed under the terms and conditions of the Creative Commons Attribution (CC BY) license (http://creativecommons.org/licenses/by/4.0/).
Share and Cite
MDPI and ACS Style
Huang, X.; Luo, G.; He, H.; Wang, X.; Amuti, T. Ecological Effects of Grazing in the Northern Tianshan Mountains. Water 2017, 9, 932. https://doi.org/10.3390/w9120932
AMA Style
Huang X, Luo G, He H, Wang X, Amuti T. Ecological Effects of Grazing in the Northern Tianshan Mountains. Water. 2017; 9(12):932. https://doi.org/10.3390/w9120932
Chicago/Turabian StyleHuang, Xiaotao, Geping Luo, Huili He, Xinxin Wang, and Tureniguli Amuti. 2017. "Ecological Effects of Grazing in the Northern Tianshan Mountains" Water 9, no. 12: 932. https://doi.org/10.3390/w9120932
Note that from the first issue of 2016, this journal uses article numbers instead of page numbers. See further details here.