Changes in Extreme Precipitation: A Case Study in the Middle and Lower Reaches of the Yangtze River in China


School of Geography, Geomatics and Planning, Jiangsu Normal University, No.101 Shanghai Road, Tongshan New District, Xuzhou 221116, China
*
Author to whom correspondence should be addressed.
Water 2017, 9(12), 943; https://doi.org/10.3390/w9120943
Submission received: 20 September 2017
/
Revised: 29 November 2017
/
Accepted: 30 November 2017
/
Published: 4 December 2017
(This article belongs to the Special Issue Impact of Climate on Hydrological Extremes)
Abstract
:Monitoring extreme climate events is of great importance, mainly due to increasingly severe impacts of extreme climate on nature and humanity. However, the characteristics of extreme climate events, especially extreme precipitation, frequently show complex variations in the context of climate change. Taking the middle and lower reaches of the Yangtze River (MLR-YR) in China as a case study, extreme daily precipitation during 1961–2012 was analyzed from the aspects of frequency and intensity. The changes in extreme daily precipitation in the MLR-YR were further attributed to several factors, including large-scale circulation, hydrologic engineering and local topography. Our analyses indicate that both frequency and intensity of the extreme daily precipitation in the MLR-YR showed overall increasing trends from 1961 to 2012. The increase could be associated with weakened East Asian summer monsoon in past decades. In addition, inverse trends could also be found locally between the frequency and the intensity. For instance, extreme precipitation intensity revealed an enhanced trend in the western part of the middle reach of the Yangtze River, while extreme precipitation frequency showed decreasing trends in this region. These phenomena could be associated with the effects of some local factors (e.g., lake regulation, hydropower engineering, topography). Our study highlights the important role of local factors on extreme precipitation changes.
1. Introduction
The global surface temperature has increased rapidly, at a rate of 0.74 ± 0.18 °C from 1906 to 2005 [1]. Moreover, this warming trend is projected to rise in future decades, and will likely be accompanied by more extreme weather (or climate) events (e.g., extreme precipitation and drought) [2,3,4]. An extreme weather (or climate) event refers to the occurrence of a meteorological variable above (or below) a given threshold near the upper (or lower) ends of a sequence of observed values [5]. In comparison with the changes in average climate condition, extreme weather (or climate) events exert more serious effects on humans due to probable flooding, agricultural crop damage and even loss of life [6,7,8]. Consequently, one of the urgent tasks in the study of global changes is to better understand the behavior of various extreme events, such as extreme precipitation [9,10,11,12].
The changes in extreme precipitation events have attracted increasing attention in recent decades [13,14]. For instance, Kunkel and Frankson [15] analyzed the trends in extreme precipitation events at the global scale. They pointed out that recent regional studies of extreme precipitation events do not cover a sufficiently large area to make any general statements outside the mid and high latitudes of the Northern Hemisphere. Singh et al. [16] quantified the transient changes in seasonal extreme precipitation events at the daily scale over the continental United States. They found fewer but heavier precipitation events in most of the study area. Rajczak et al. [17] found an increase in mean amounts and wet-day frequency in northern Europe, but a decrease in southern Europe in the 21st century. Ghosh et al. [18] argued that there is a lack of uniform trends but increasing spatial variability of rainfall extremes in India. Wu et al. [19] performed an evaluation and projection of summer extreme precipitation over East Asia. Extreme precipitation events showed high complexity in different places from regional to global scales.
The Yangtze River, being the longest river in China and the third longest river in the world, is also a storm-flood river with frequent occurrence of floods. For instance, disastrous floods in 1954, 1998 and 2010 occurred in the Yangtze River basin with large losses in terms of the economy and human life [20,21]. Particularly, the middle and lower reaches of the Yangtze River (MLR-YR) cover many of the economically developed areas in China. Thus, it is crucial to understand the variations of extreme precipitation events in the MLR-YR to mitigate the losses induced by flooding disasters. Su et al. [22] analyzed extreme precipitation events in the Yangtze River Basin using a rotated empirical orthogonal function. They showed an increase in extreme precipitation events from 1960 to 2004. Chen et al. [23] analyzed the spatial-temporal patterns of precipitation extremes during 1960–2009 using the L-moments method together with some statistical tests. They pointed out that it shows a high risk of floods in the MLR-YR. Guo et al. [24] analyzed the regional characteristics of several extreme precipitation indices during the period of 1961–2010 in the Yangtze River basin by using the non-parametric M-K trend test. However, they argued that there is no general significant increasing or decreasing trend in the Yangtze River basin from analysis of extreme precipitation indices. Past studies show that extreme precipitation events are still uncertain in the MLR-YR according to both observed records and model simulations. Furthermore, trend detection is frequently performed under the assumption of a monotonic trend. However, climatic variables may not conform to this assumption [25]. It is necessary to project, compare and attribute the temporal-spatial variations of extreme precipitation events in the MLR-YR.
This paper conducted a simultaneous analysis of gradual and abrupt changes of the extreme daily precipitation in the MLR-YR in China from 1961 to 2012. We considered two measures of extreme daily precipitation events from the aspects of frequency (the number of extreme daily precipitation events) and intensity (average precipitation of extreme daily precipitation events) [26,27], respectively. The changes in the frequency and the intensity were analyzed using Poisson regression, linear regression and Pettitt’s test. Temporal-spatial changes of the extreme daily precipitation were further attributed to several factors from aspects of East Asian summer monsoon, hydrologic engineering, topography, and so on.
2. Study Area and Data Preprocessing
2.1. Study Area
The Yangtze River, also called “Changjiang”, is prone to flash-floods as well as having an uneven distribution of precipitation and frequent floods. As one of the most developed regions in China, the middle and lower reaches of the Yangtze River (MLR-YR) were selected as the study area for the analysis (Figure 1). The MLR-YR lies between 102°~122° E and 24°~34° N, with a total area of 1,157,057 km2. The region belongs to a typical subtropical monsoon climate, with an average annual temperature of 14~18°C, and average annual precipitation of 1000~1500 mm. Due to the East Asian subtropical monsoon, high temperature and abundant precipitation are concentrated in the summer.
Since the economic reforms in the mid-1980s, China has witnessed unprecedented urbanization and economic growth. The MLR-YR, which covers five urban agglomerations (i.e., the Yangtze River Delta urban agglomeration, the middle reach of the Yangtze River urban agglomeration, the Chengdu-Chongqing urban agglomeration, the middle Guizhou urban agglomeration and the middle Yunnan urban agglomeration), has become one of the most developed regions across the country. In particular, numerous big- and medium-sized cities, including Shanghai, Chongqing, Nanjing, Hangzhou, Hefei, Nanchang, Wuhan, Chengdu in the MLR-YR, comprise one of the most important economic zones: the Yangtze River Economic Belt.
A total of 97 stations with almost even-distribution in the MLR-YR were selected to detect temporal-spatial changes of extreme daily precipitation. Among these stations, 27 of them are located in the lower reach of the Yangtze River, and the rest of them in the middle reach of the Yangtze River (Figure 1).
2.2. Data and Preprocessing
The observed daily precipitation data, which cover the period of 1961–2012, were obtained for the MLR-YR from the Chinese Meteorological Data Service Center (CMDC), China Meteorological Administration (CMA). The quality control of the data was conducted by CMDC through manual inspection of the time consistency and extremum validation [28]. To assure the continuity and consistency, we further validated these data by screening and eliminating the suspicious and missing records. We limited our analyses to the stations with records of at least 50 years. Consequently, a total of 97 stations, which are nearly evenly distributed in the MLR-YR, were selected and processed to elucidate changes in extreme daily precipitation (Figure 1). In addition, East Asian summer monsoon index (EASMI) data were obtained from the College of Global Change and Earth System Science (GCESS) [29]. The EASMI was averaged from June to August to reflect the effects of the monsoon season in the MLR-YR.
3. Methods
3.1. Peaks-Over-Threshold Approach with Poisson Arrival Rate to Examine the Occurrence of Extreme Daily Precipitation Events
3.1.1. Peaks-Over-Threshold Approach
The Peaks-Over-Threshold (POT) approach, which is described by the generalized Pareto distribution (GPD), is widely used to estimate extreme values, including extreme precipitation, extreme temperature and wind velocity [30,31,32]. The POT approach utilizes threshold excesses above a given threshold to determine whether an extreme precipitation event occurs [33,34]. In general, if the threshold is too low, it is likely to violate the asymptotic basis of the GPD. However, if the threshold is too high, few excesses will be generated with which the GPD can be estimated [35]. The threshold in the POT is therefore critical because it determines the occurrence of extreme daily precipitation events, and further controls the sample size of the events.
The GPD, which was introduced by Pickands [36], has been widely used in dealing with extreme events [31,37]. For a random variable (), the cumulative probability function of the GPD is given by:
where is the location parameter, frequently equaling the threshold of extreme precipitation events at a given period [38]; and denote scale and shape parameters, respectively.
In this paper, different thresholds were examined by assuming a generalized Pareto distribution with the Poisson arrival rate of the corresponding extreme daily precipitation events [37,39]. That is, daily precipitation at different percentiles (i.e., the 90th, 95th and 99th) was tested for the generalized Pareto distribution by using the Chi-square test. The dispersion coefficient was then analyzed to examine whether the number of extreme daily precipitation events follows a Poisson distribution.
3.1.2. Poisson Distribution Validation
Because of the discrete nature of the number of extreme daily precipitation events, a Poisson distribution provides the appropriate statistical framework to simulate the number of extreme precipitation days [35,40]. A regular Poisson distribution of a random variable can be characterized as an equality of its variance and mean. To evaluate whether the numbers of extreme daily precipitation events in the MLR-YR follow a Poisson distribution, the dispersion coefficient () was calculated to check the differences between the variance and the mean of the number of extreme daily precipitation events. Assuming that the number of extreme daily precipitation event () in the year follow a conditional Poisson distribution with the rate of occurrence , the dispersion coefficient () is defined as the ratio between the variance and the mean of the occurrence rate of the extreme event () [41].
Therefore, a regular Poisson distribution is characterized by equidispersion (i.e., equality of variance and mean, = 1). More frequently, overdispersion occurs in the observed count data when the variance is larger than the mean ( > 1). Inversely, so-called underdispersion occurs when < 1. Both overdispersion and underdispersion may violate the assumptions of independence and stationarity underlying the Poisson processes [42,43]. The dispersion coefficient (Equation (2)) was calculated to examine whether the extreme daily precipitation events follow a Poisson process.
After determining the threshold, occurrence of extreme daily precipitation events per year was then counted for each station separately [22,44]. The intensity and frequency of extreme daily precipitation events were then analyzed using a simple index of extreme precipitation frequency for a year (, days) and a simple index of extreme daily precipitation intensity for a year (, mm/day) according to the selected thresholds.
3.2. The to Analyze Extreme Precipitation Frequency and Its Trends
When performing an analysis of extreme precipitation frequency, a simple index of extreme precipitation frequency for a year (), which is defined as the number of extreme daily precipitation events in a given period (i.e., one year), was calculated based on the selected threshold. Let be independent random observations of a random variable, such as daily precipitation observation in a given period (e.g., one year). The was then calculated as:
where is a conditional function that takes the value 1 if daily precipitation observation on the day in the year exceeds the extreme precipitation threshold . Otherwise, takes zero, indicating the non-occurrence of an extreme daily precipitation event in the period.
To analyze trends in the extreme precipitation frequency, a count regression model was employed due to the condition that the response is a count (a positive integer) [41]. Given the discrete characteristics of the extreme daily precipitation events in a specific period, we assumed a Poisson distribution of extreme precipitation occurrences. Moreover, the dispersion coefficient was calculated to examine the reliability of the Poisson distribution on extreme daily precipitation events. Furthermore, a Poisson regression model could be employed to detect trends in the occurrence of extreme daily precipitation events [42,45,46]. That is, the number of extreme daily precipitation events in the year (, equals at a given year ) has a conditional Poisson distribution with the rate of occurrence (). It is expressed as:
The rate of occurrence is potentially a non-negative random variable. To assess the temporal trends in extreme daily precipitation, the rate of occurrence in the given year was fitted as a linear function of (by means of a logarithmic link function) as:
where and are the regression coefficients. If the estimated coefficient in the time (, year) is larger (or smaller) than zero at the 5% significance level from the Wald-test (p < 0.05), then there is statistical evidence to support the presence of increased (or decreased) trends in the occurrence of extreme daily precipitation events [42,46].
3.3. The to Analyze Extreme Precipitation Intensity and Trend Analysis
When performing an intensity analysis of extreme daily precipitation, a simple daily precipitation intensity index was frequently employed by stations [26,27]. In this paper, we first calculated the annual cumulative precipitation of rainy days at a given year when daily precipitation amounts exceeded a specific extreme precipitation threshold. To analyze changes in extreme precipitation intensity, a simple index of extreme daily precipitation intensity for a year (, mm/day) was then calculated as the ratio between the cumulative precipitation (, mm) and the number of extreme daily precipitation events in one year (, days):
where (mm) is the precipitation amount on the day in the year , is the threshold to identify the extreme daily precipitation event, is the number of extreme daily precipitation events that occurred in the year .
In order to detect and attribute the trend of extreme daily precipitation intensity, two experiments were performed by assuming gradual and abrupt changes of precipitation records. Firstly, monotonic trend in the intensity of extreme daily precipitation was tested in the MLR-YR over the past decades [42,47]. When examining the temporal dynamics of extreme precipitation intensity (), a linear regression model was employed to assess whether any statistically significant strengthening or decreasing trends exist. We assumed that the depends linearly on the time :
where and are regression coefficients. If is different from zero at the 5% significance level from t-test (p < 0.05), then statistical evidence is found in favor of the presence of trends in the intensity of extreme daily precipitation.
In the other experiment, change-point detection analyses were conducted to detect the abrupt changes of extreme daily precipitation. When performing change-point detection analyses, Pettitt’s test was conducted to examine a shift in the central tendency of extreme daily precipitation [48]. That is, a statistic was employed to test whether two samples of extreme precipitation events (e.g., , , … and , …) come from the same population.
where
The change-point of the series is located at , which is defined as:
Details of the Pettitt’s test can be found in the studies by Pettitt [48]. By using Pettitt’s test, extreme daily precipitation was analyzed to examine whether a change-point exists over the period 1961–2012.
After conducting the change-point detection, change rate was also analyzed to further examine the changes before and after mutation of extreme daily precipitation events. The change rate of the intensity of extreme daily precipitation () was calculated as:
where and represent the average intensity of extreme daily precipitation before and after the change point, respectively.
In this study, the Poisson regression, linear regression and Pettitt’s test were performed in the R software [49].
3.4. Attribution of Changes in Extreme Daily Precipitation Events
To attribute changes in extreme daily precipitation events in past decades in the MLR-YR, we analyzed the relationships among extreme precipitation variation, East Asian summer monsoon and some local factors (e.g., hydrologic engineering, topography). The spatial interpolation technique was also applied on the and the to reveal regional patterns of extreme daily precipitation. The regional averages and were further calculated by taking the MLR-YR as a whole to reflect changes in extreme daily precipitation. The East Asian summer monsoon index (EASMI), which was developed by Li and Zeng [29], was employed as an indicator of the variations of East Asian summer monsoon. The EASMI is defined as an area-averaged seasonally dynamical normalized seasonality at 850 hPa within the East Asian monsoon domain (10°~40° N, 110°~140° E) [29]. This index was widely employed to measure the East Asian summer monsoon in past studies [50,51]. Correlation analyses were further performed among , and the EASMI in the MLR-YR over the period 1961–2012.
In addition, empirical relationships were found between the construction of large dams and extreme precipitation events [52]. For instance, a past study found that the three Gorges Dam played crucial roles in flood control, irrigation and river flow [53], and even affected regional precipitation [54]. Thus, we attributed the changes in extreme daily precipitation in the MLR-YR to some local factors, such as the effects of hydrologic engineering and topography.
4. Results
4.1. Long-Time Average Annual Precipitation in the MLR-YR from 1961 to 2012
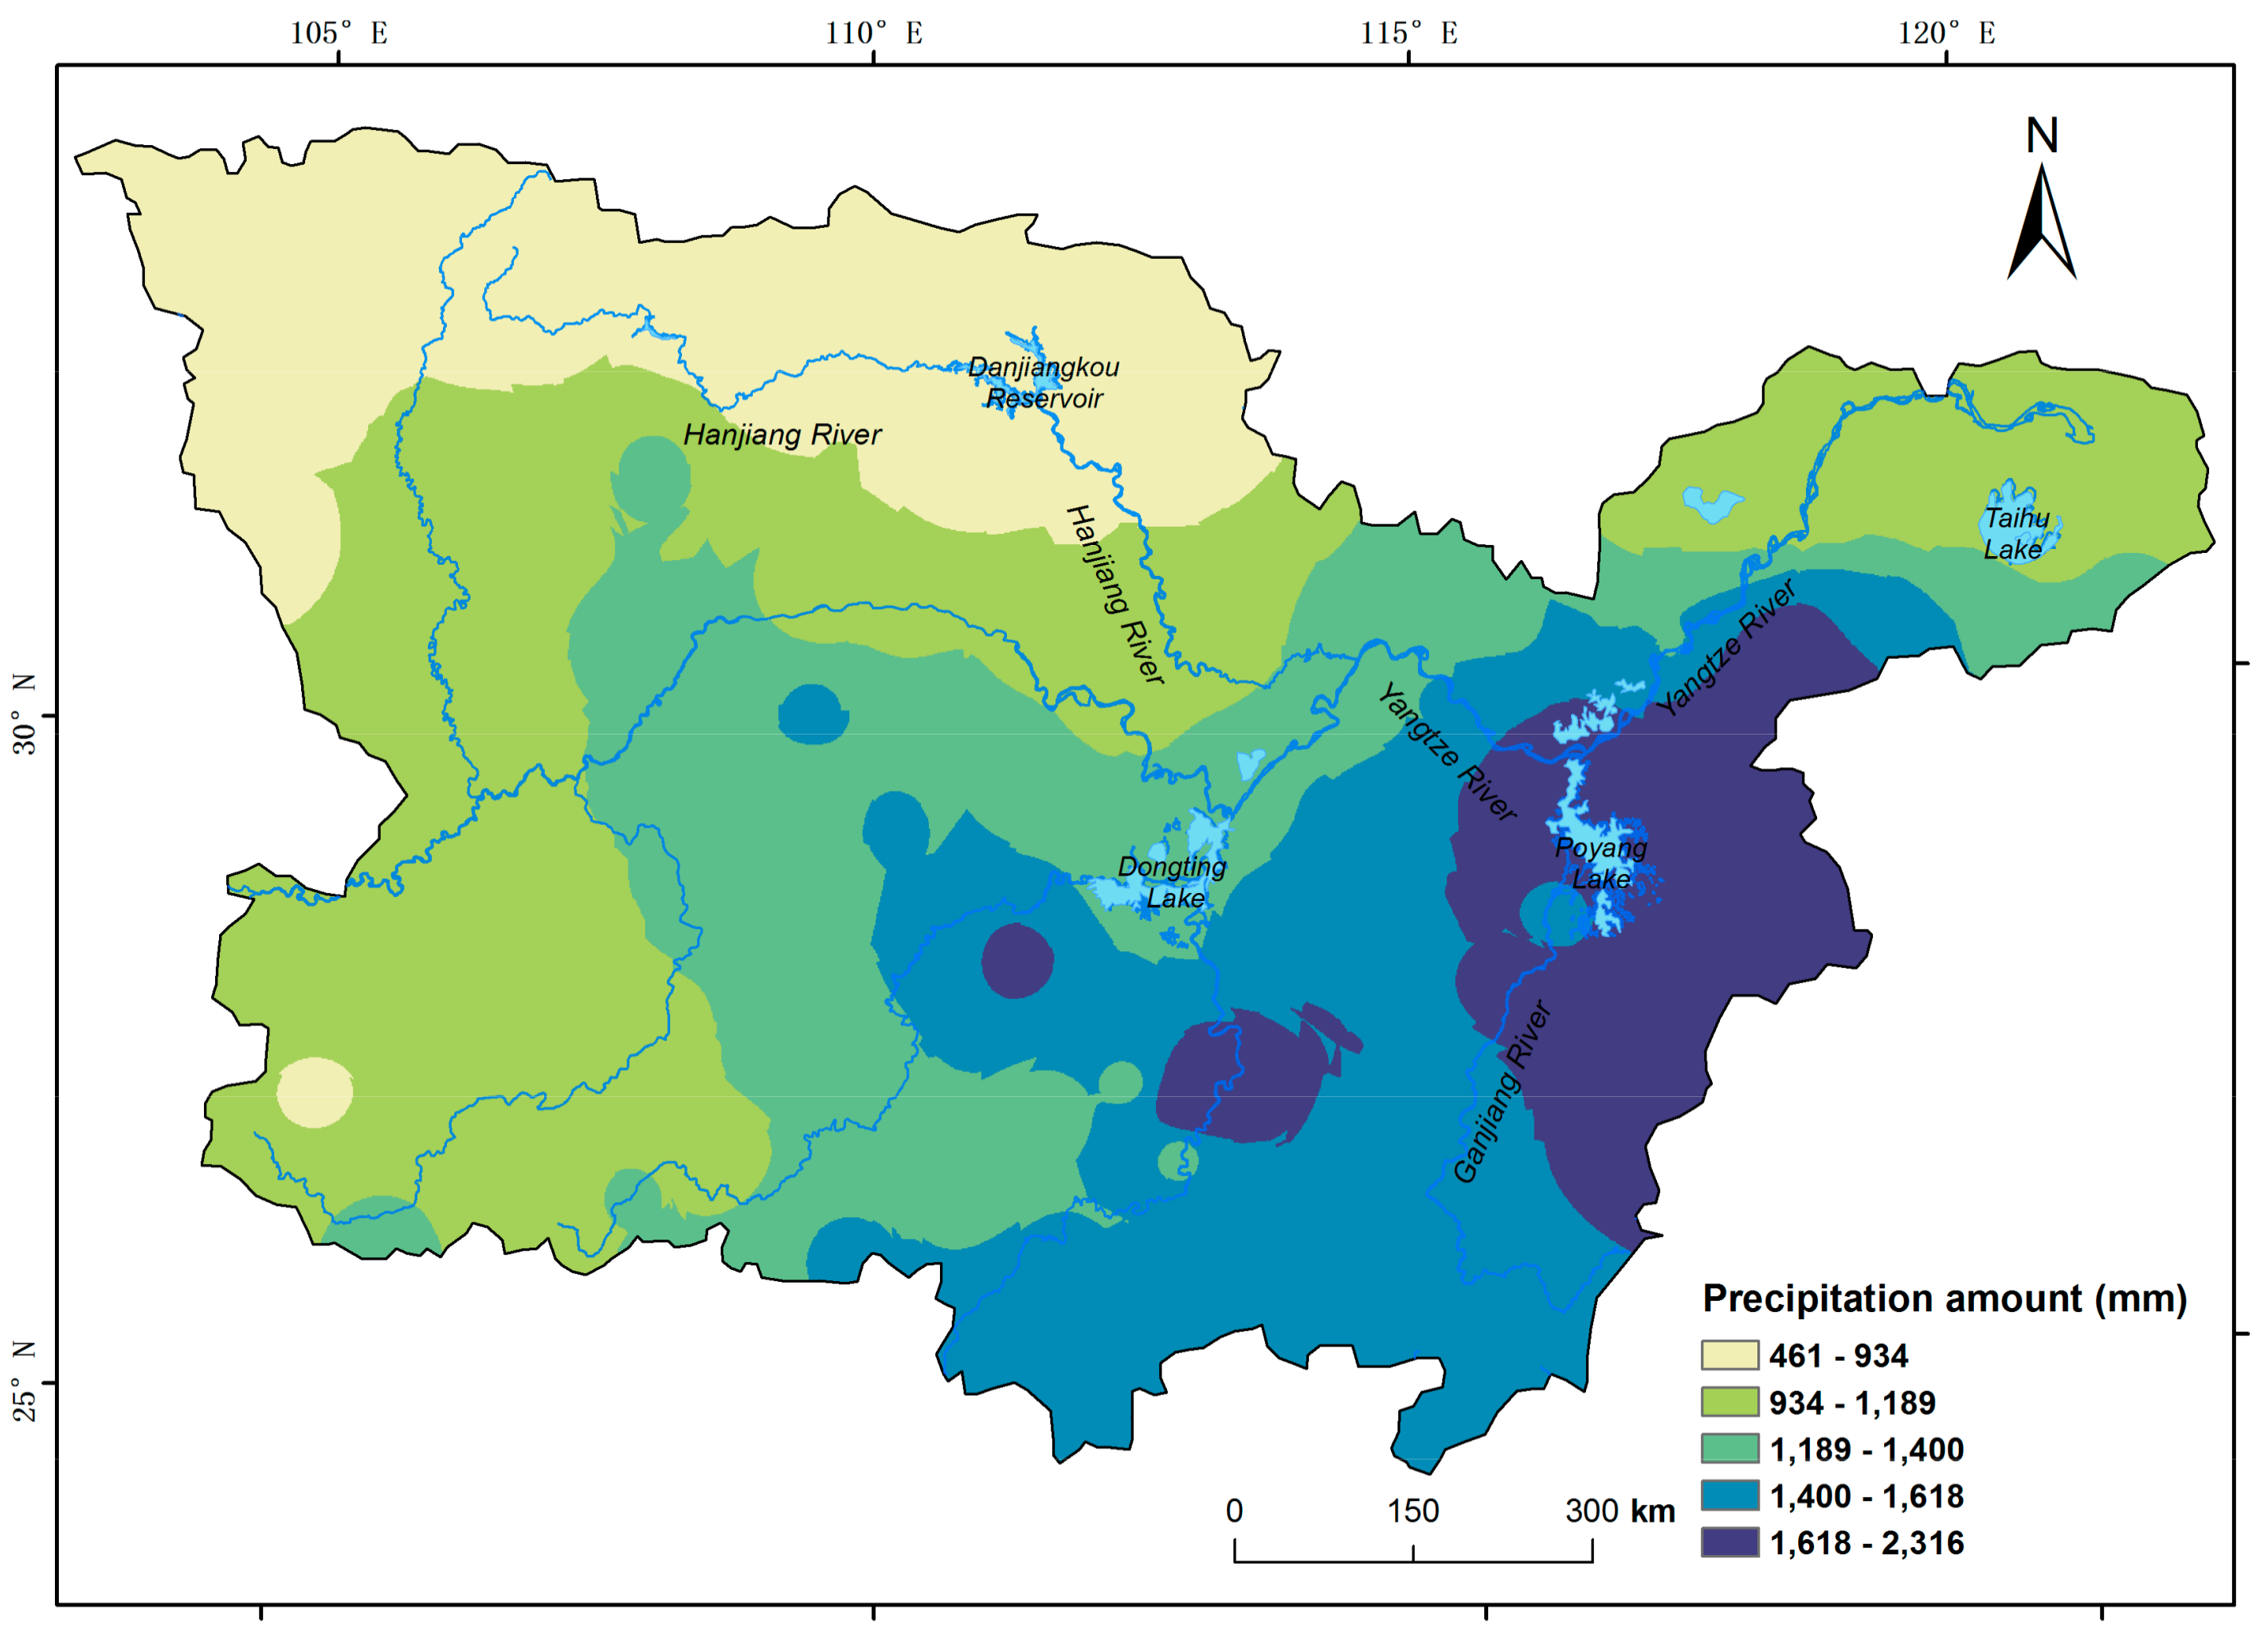
As shown in Figure 2, multi-year average precipitation shows large spatial heterogeneity in the MLR-YR from 1961 to 2012. The average annual precipitation varied by stations, from 466 mm at the Wudu station in Gansu Province to 2316 mm at the Huangshan station in Anhui Province. A decreasing gradient of precipitation could be found from southeastern to northwestern regions of the MLR-YR. This phenomenon could be associated with the northwestward attenuation of monsoon flows in China, accompanied by decreasing atmospheric moisture transferred by the East Asia Summer monsoon from southeastern coast to northwestern inland of China (Figure 1) [55].
4.2. Threshold Selection of Extreme Daily Precipitation in the MLR-YR
Different thresholds (i.e., the 90th, 95th and 99th percentiles) of daily precipitation were first examined using the chi-square test to check whether the threshold excesses of daily precipitation in the MLR-YR come from the generalized Pareto distribution. According to the chi-square test for the precipitation amount above different thresholds, we cannot reject the hypothesis that the threshold excesses of extreme daily precipitation come from the generalized Pareto distribution in 96 of all the 97 meteorological stations in the MLR-YR.
The frequency of extreme daily precipitation events at different thresholds (i.e., the 90th, 95th and 99th percentiles) was then analyzed to examine whether they follow a Poisson distribution. Table 1 shows the thresholds that were calculated from different percentiles, the number of average annual occurrences, as well as dispersion coefficients in this region. The threshold of daily precipitation at the 95th percentile on rainy days is 36.43 6.10 mm/day over the MLR-YR in past decades, with an occurrence rate of 5.96 1.01 days per year (Table 1). In addition, the average dispersion coefficient shows a near-equidispersion (0.91 0.19). To retain enough data records and satisfy the Poisson distribution, the 95th percentile of the precipitation amount in the rainy days is proved to be more suitable for selection as the optimal threshold for most stations in this study area.
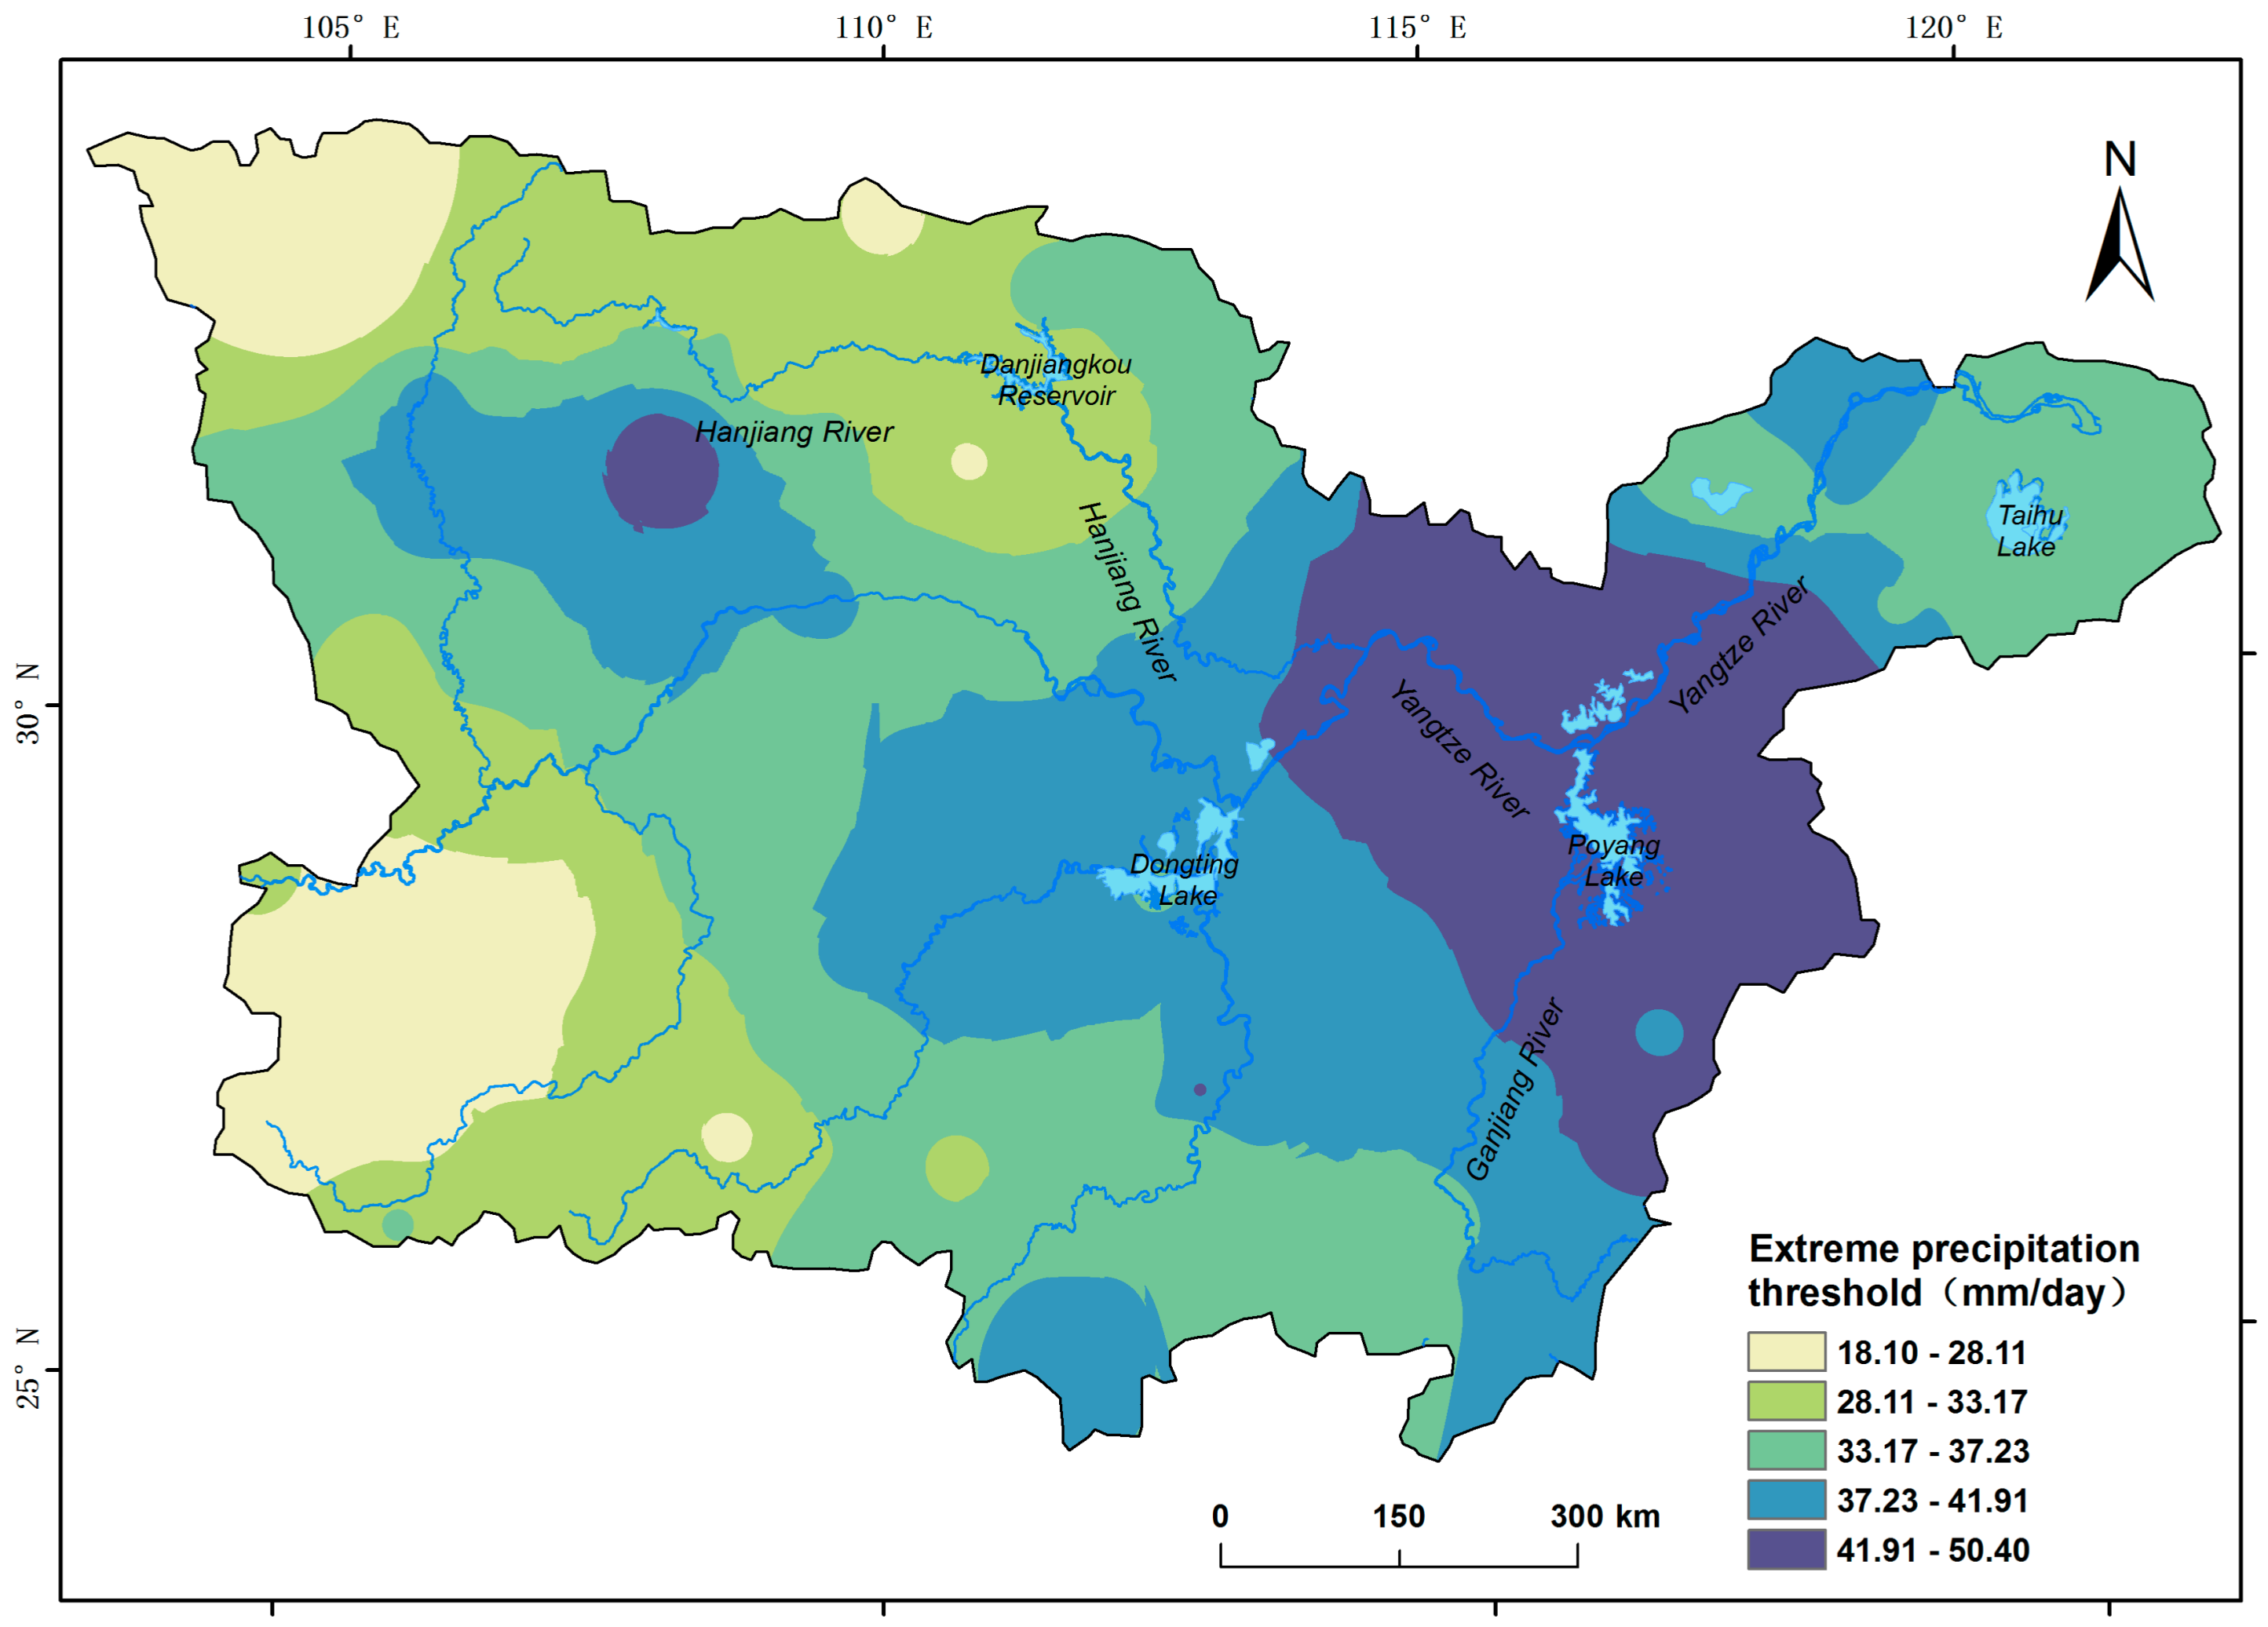
Furthermore, the threshold of the daily precipitation amount at the 95th percentile showed large heterogeneity in the MLR-YR (Figure 3). The precipitation amount reached up to 50 mm/day at the Huangshan station in Anhui Province in the southeastern region of the lower reaches of the Yangtze River. However, it was only 18 mm/day at the Wudu station in Gansu Province in the middle reach of the Yangtze River. In addition, the threshold of the precipitation amount shows an overall decreasing trend from the southeastern to the northwestern region of the MLR-YR. This threshold pattern of extreme daily precipitation is in agreement with the spatial distribution of average annual precipitation in this region (Figure 2).
4.3. Average Intensity of Extreme Daily Precipitation
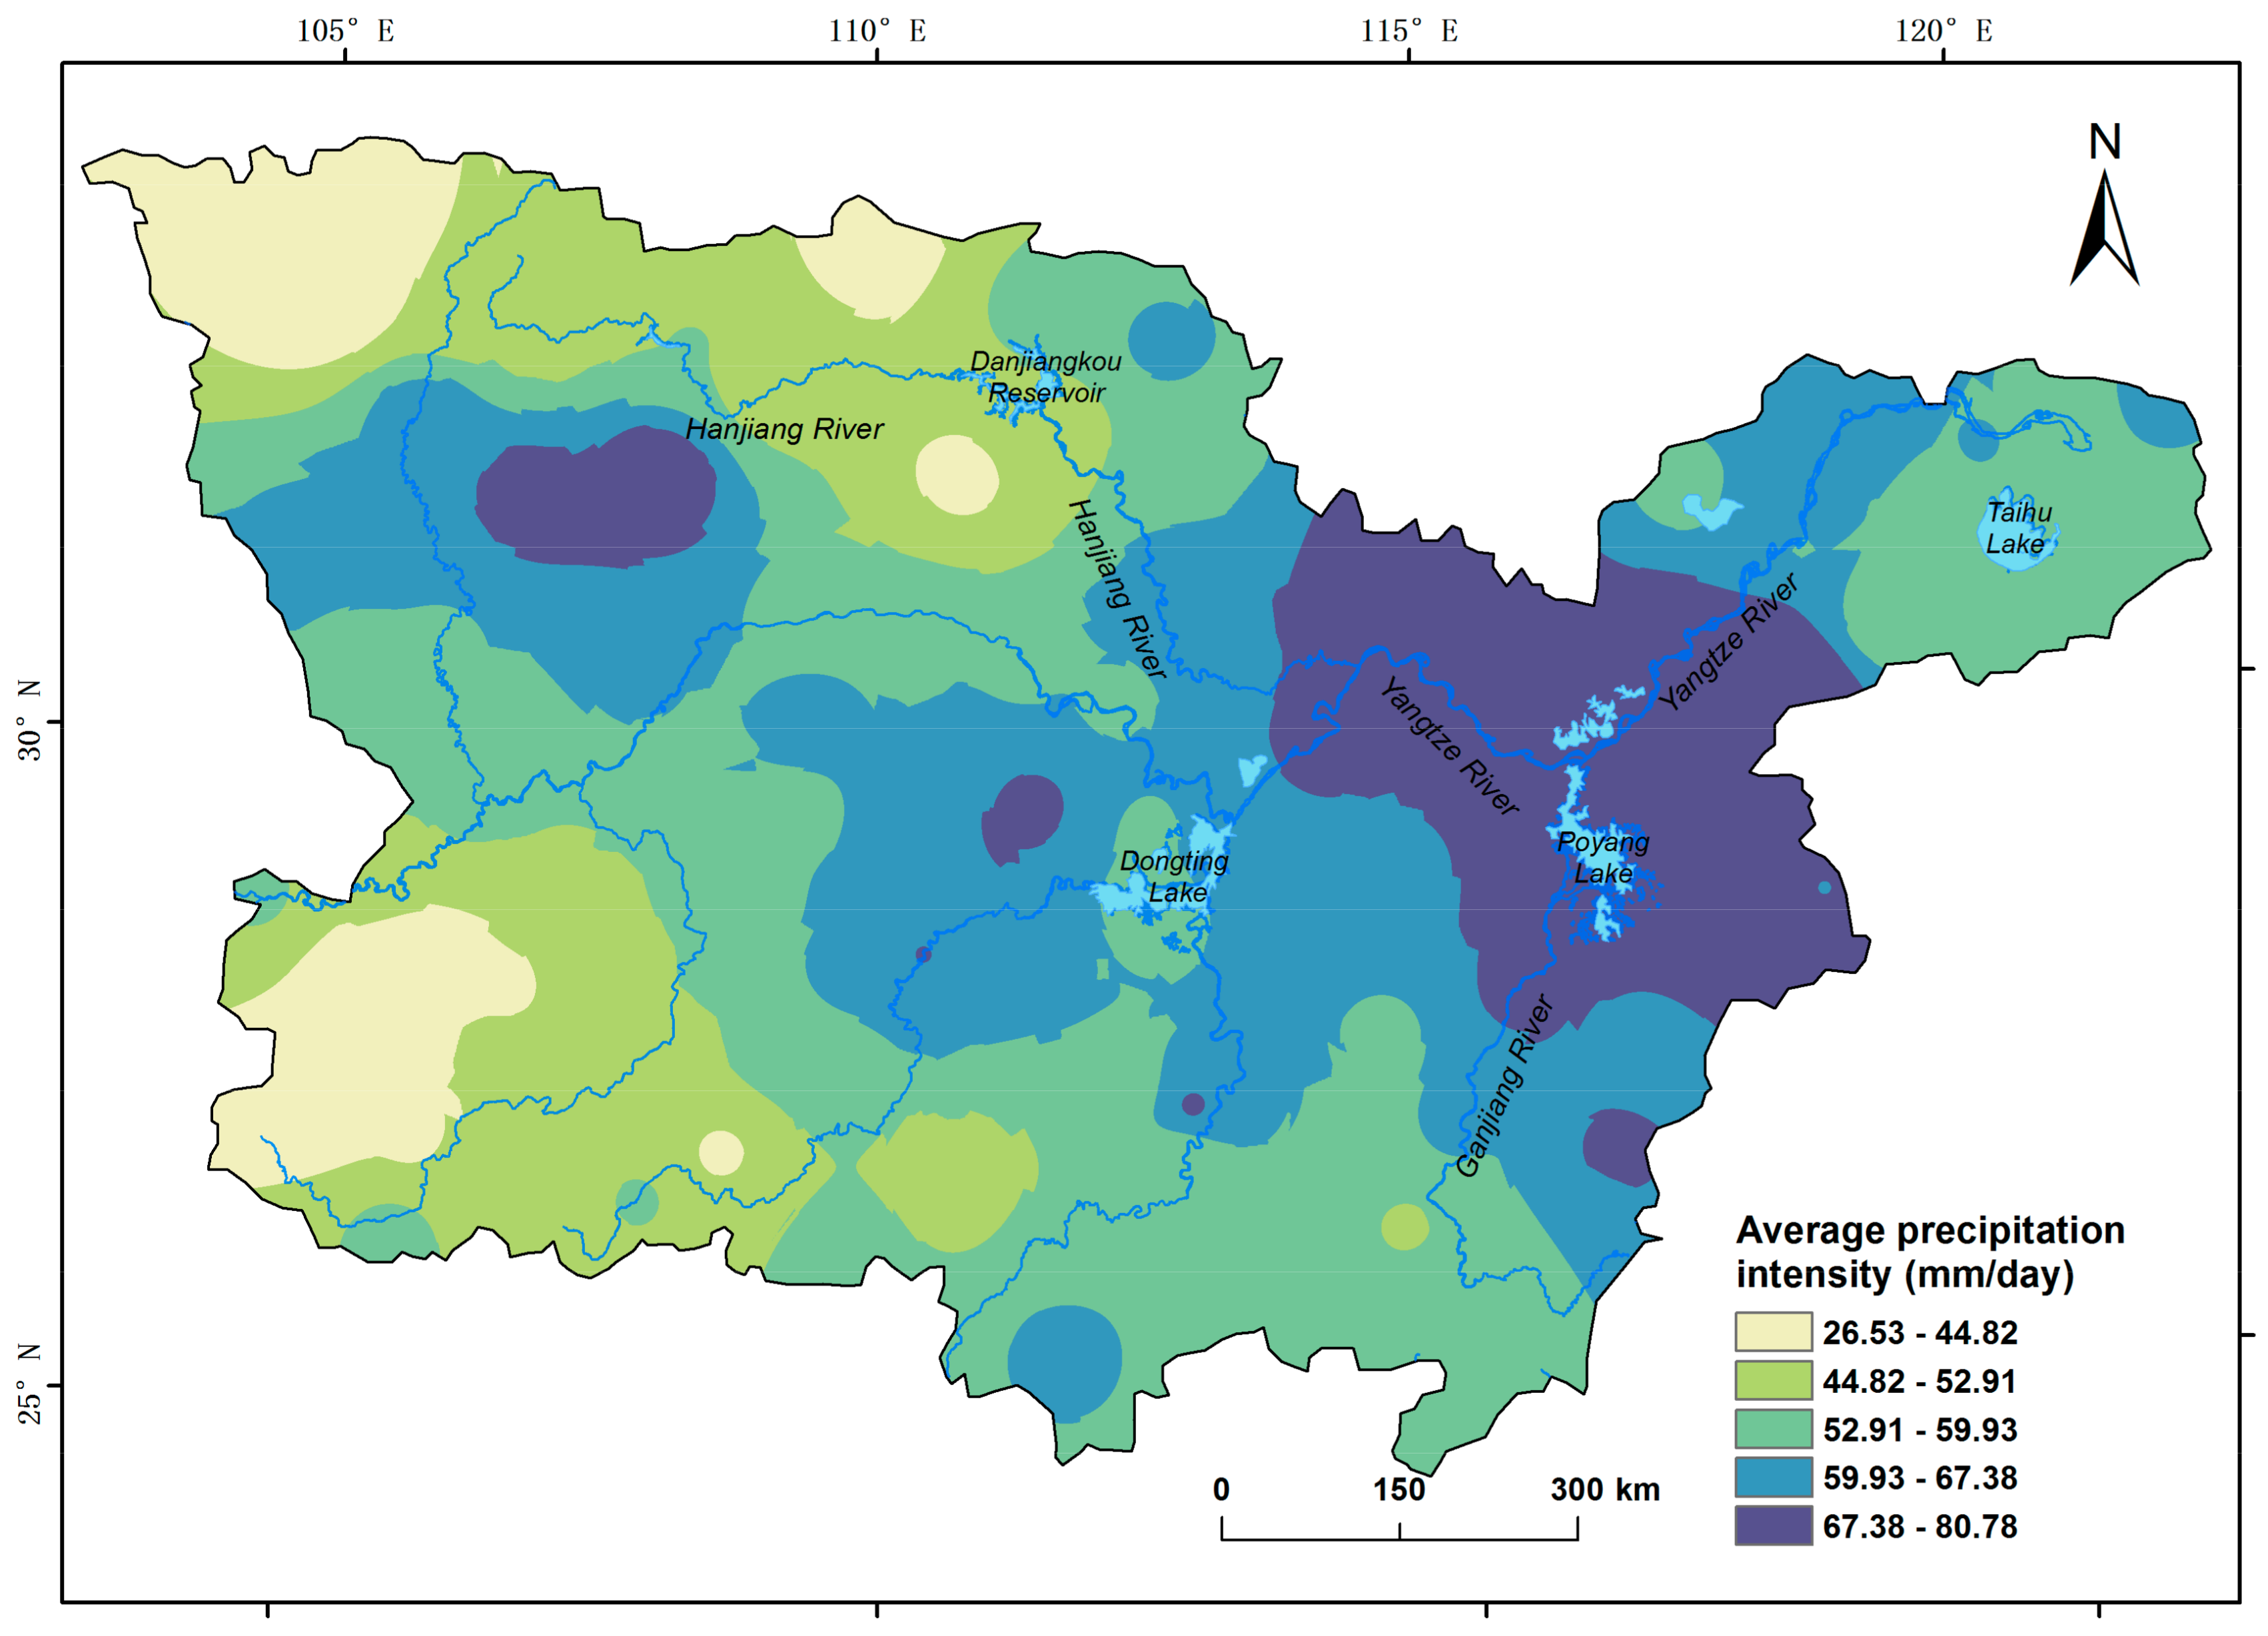
By using the as an indicator, we derived the average intensity of extreme daily precipitation in the MLR-YR over the period 1961–2012. Taking this region as a whole, the average intensity of extreme daily precipitation is 58 9 mm/day over the past 52 years. Spatially, the average intensity of daily extreme precipitation varied between 26 mm/day and 80 mm/day (Figure 4). The highest intensity of extreme daily precipitation was distributed in the eastern parts of the study area, including the area around Poyang Lake, southern Anhui Province and eastern Hubei Province. Despite the low precipitation in the northeastern Sichuan Province, the average intensity in this region was very high: about 75 mm/day. In addition, the average intensity of extreme daily precipitation was relatively low in the southwestern and northwestern region of the MLR-YR. These phenomena were in agreement with the spatial pattern of decreasing atmospheric moisture, which was transferred by the East Asia Summer monsoon [55].
4.4. Trends in Extreme Daily Precipitation in the MLR-YR from 1961–2012
4.4.1. Frequency of Extreme Daily Precipitation Events
The frequency of extreme daily precipitation events shows statistically significant trends in most of the stations in the MLR-YR from 1961 to 2012. Spatially, a total of 63 stations revealed significant increasing trends (Wald-test, p < 0.05) in the occurrence of extreme daily precipitation events, with an average increase of 0.002 0.003 day per year during 1961–2012. A decreasing gradient could also be found from northeastern to the southwestern parts of the MLR-YR (Figure 5). In detail, increasing trends mainly occurred in the northeastern part of the region (except Liyang and Changzhou stations in Jiangsu Province; Ganzhou and Xiushui stations in Jiangxi Province; Zaoyang station, Wufeng and Yingshan stations in Hubei Province). On the contrary, a decreasing trend is found in most of the southwestern regions in the MLR-YR (except Bijie, Guiyang, Sinan and Tongdao stations in Guizhou Province, and Meitan station in Hunan Province).
4.4.2. Intensity of Extreme Daily Precipitation
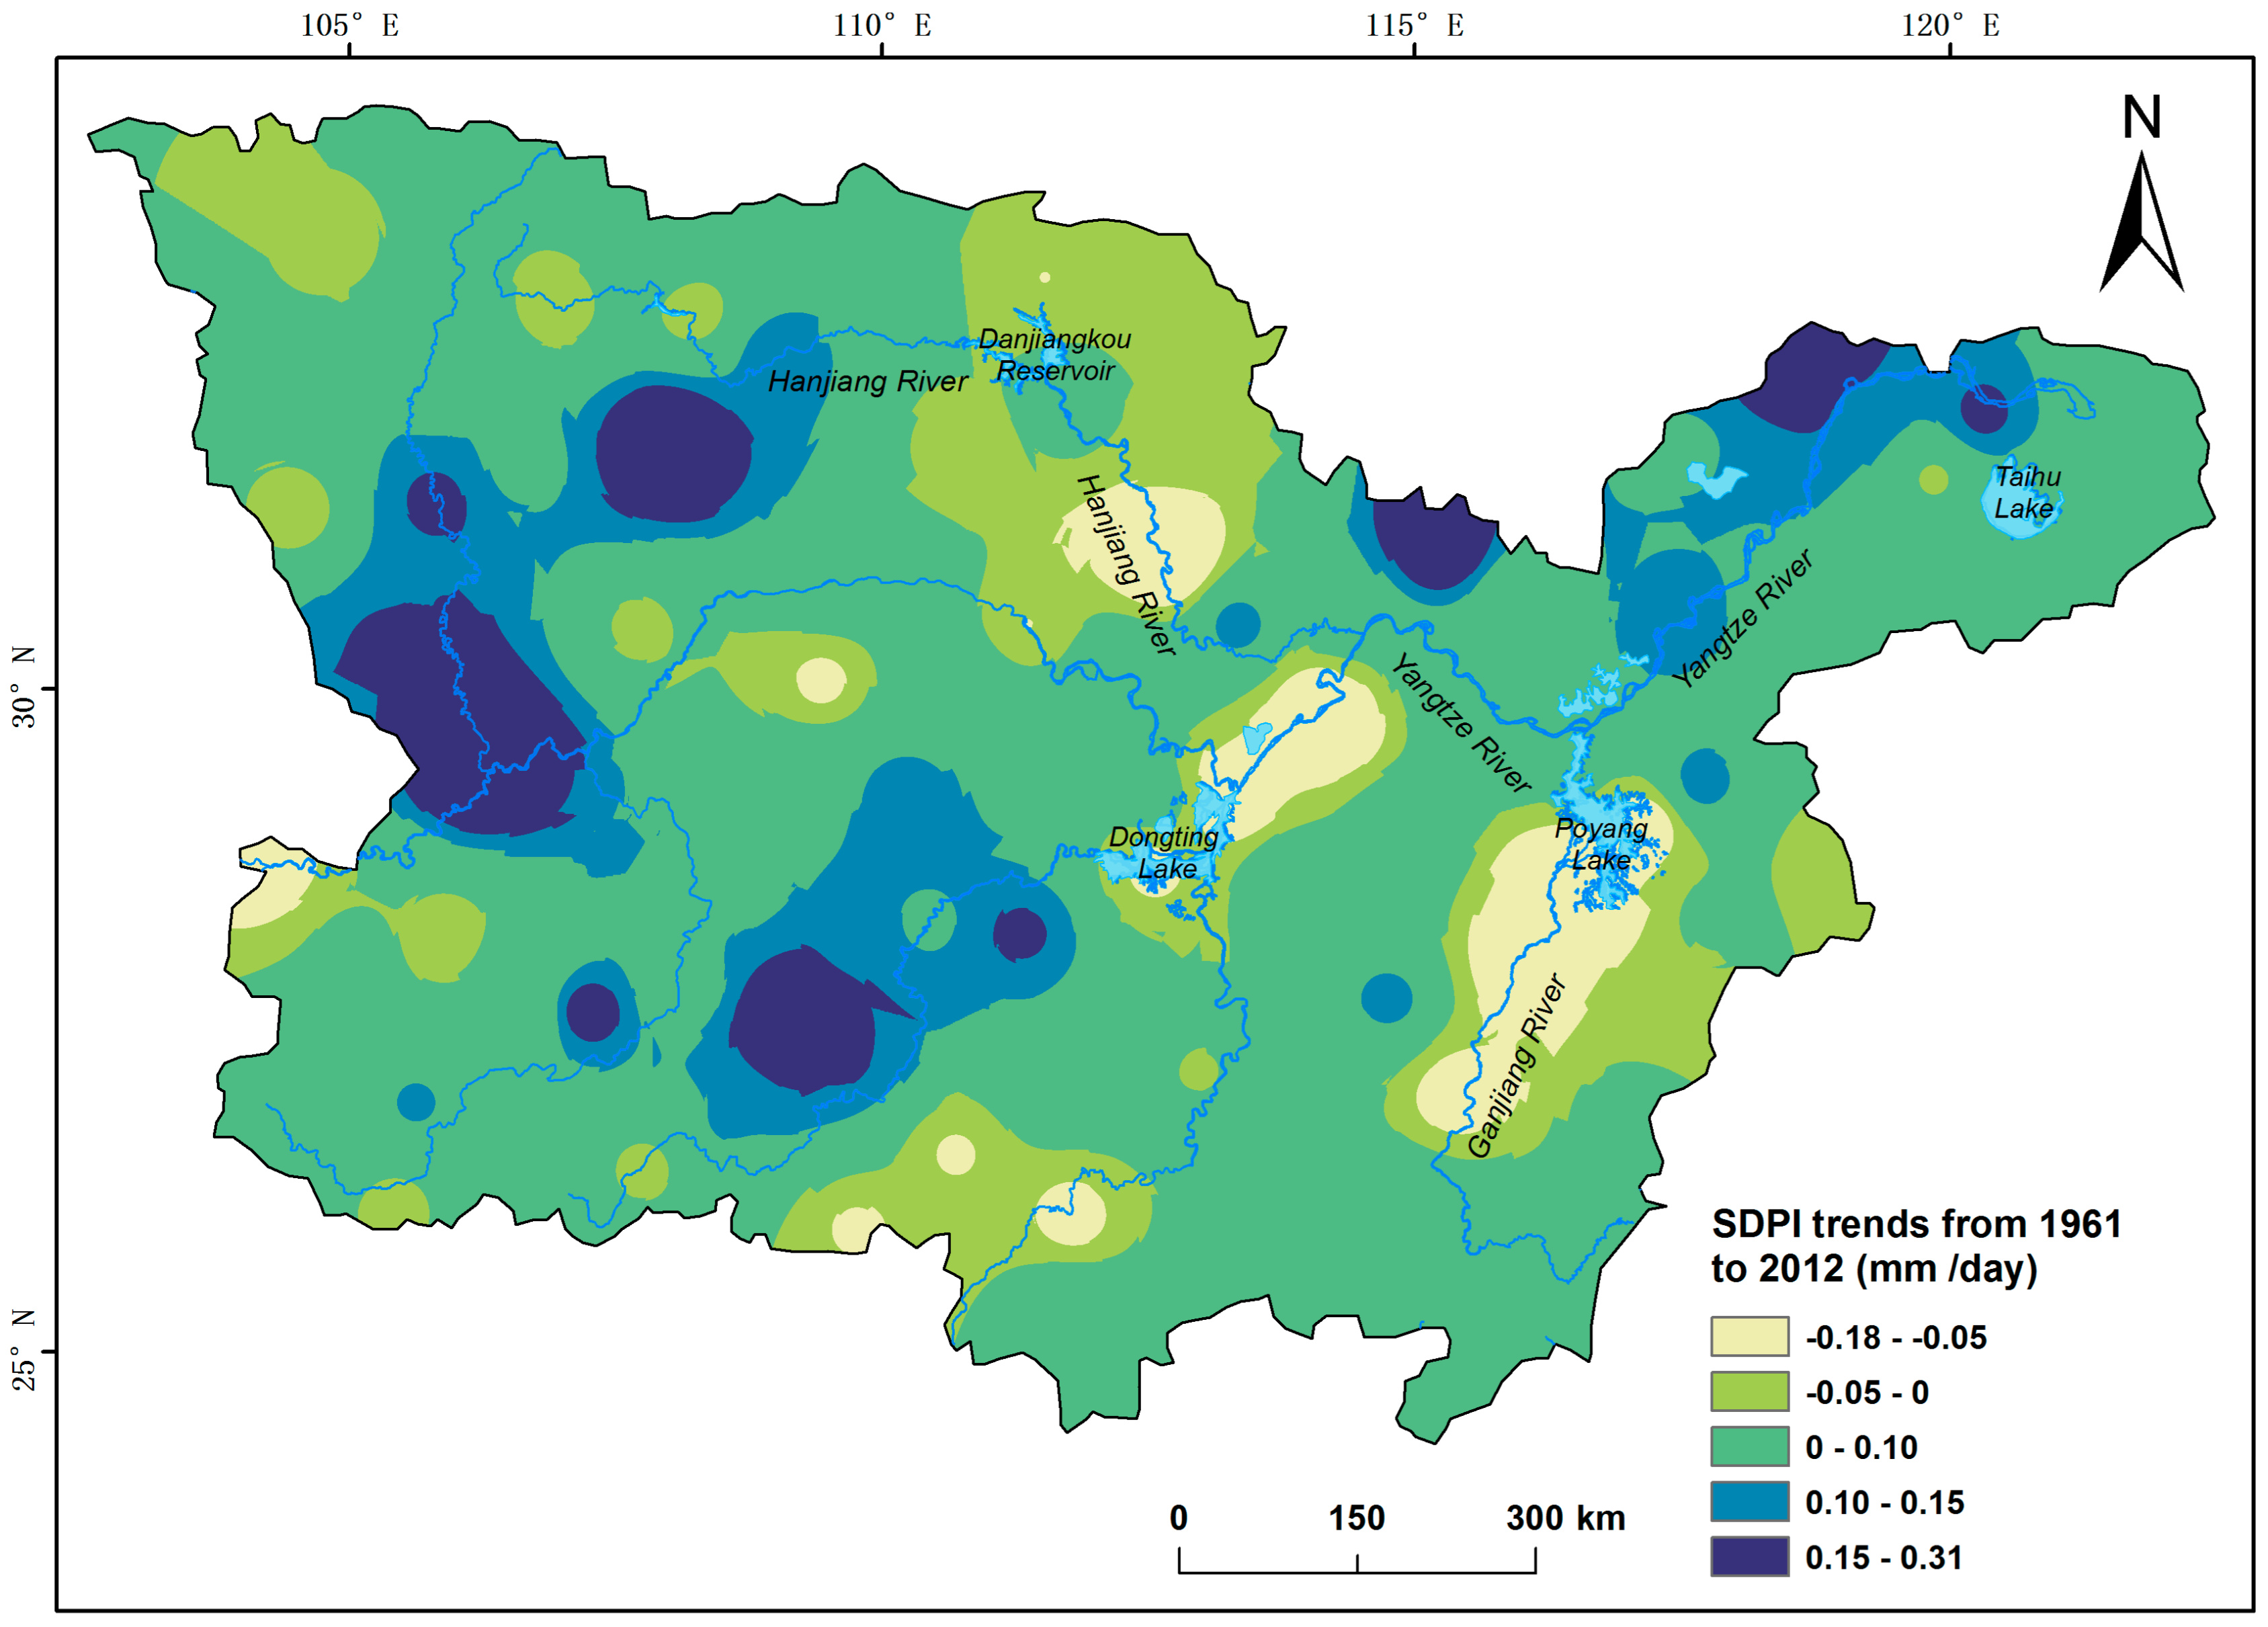
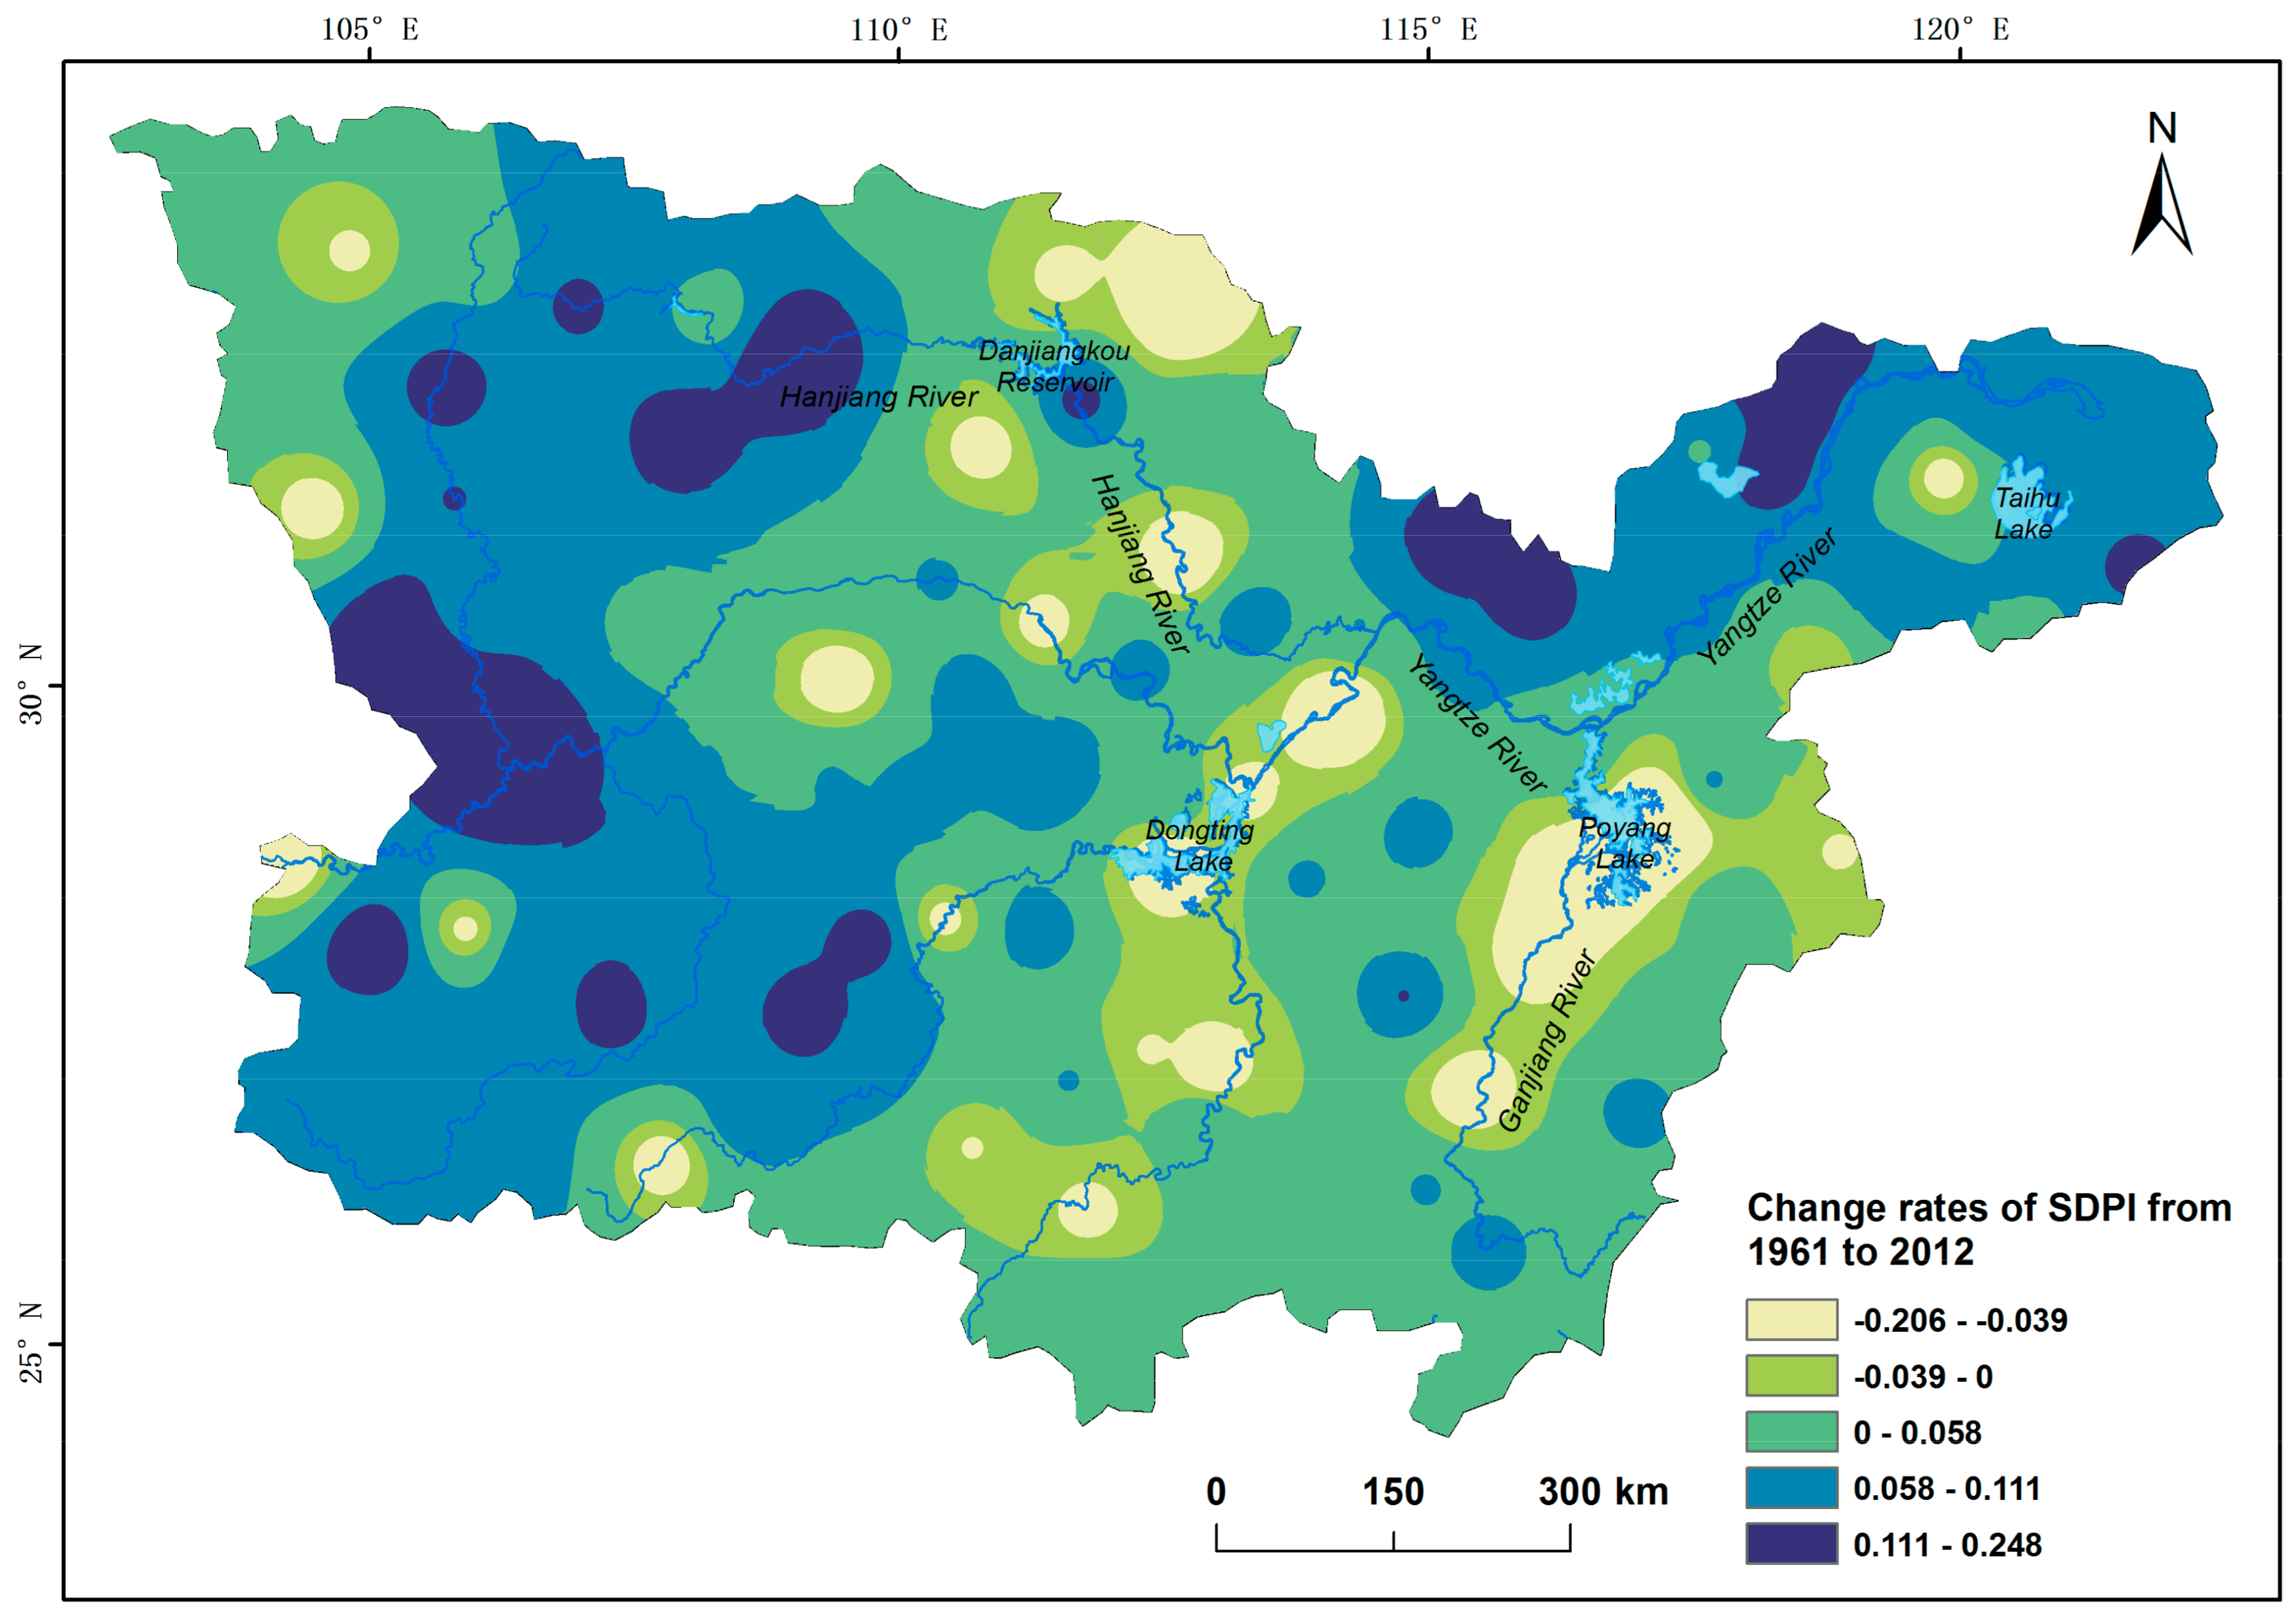
As for the intensity of extreme daily precipitation, an overall enhanced trend of 0.05 0.07 mm/day (t-test, p = 0.014) is also shown from 1961 to 2012 in the MLR-YR. Furthermore, a total of 67 stations show spatially increasing trends from 1961 to 2012 in the MLR-YR, albeit not statistically significant. These results indicate the overall strengthened intensity in the MLR-YR over the past decades. Spatially, the intensity of extreme daily precipitation shows large differences among stations. As shown in Figure 6, a high value of the positive trend (approximately 0.31 mm/day) appeared at the Shapingba station in Chongqing City and the Wanyuan station in Sichuan Province, even though the annual precipitation was relatively low in these regions (Figure 2). This increase could also be found at the Tongren station and the Zhijiang station. This phenomenon could be associated with the large-scale circulation around the Tibetan Plateau and local topography [56,57].
On the contrary, the lowest value of negative trends in the MLR-YR (approximately −0.18 mm/day) appeared at the Zhongxiang and the Jiayu stations in Hubei Province. The stations with weakened precipitation intensity are mainly distributed around the Poyang-Ganjiang and Dongting-Changjiang regions. Besides these two areas, a weakened intensity of the extreme daily precipitation could also be found in the northern Hubei Province (e.g., Zhongxiang, Yichang, Fangxian and Zaoyang stations in Hubei Province; Nanyang and Xixia stations in Henan Province) (Figure 6). Figure 7 shows the changing rate of extreme daily precipitation intensity before and after the mutation of extreme daily precipitation events over the period of 1961–2012 in the MLR-YR. We found that the pattern is in agreement with the analysis on the gradual trends (Figure 6).
As shown in Figure 5, Figure 6 and Figure 7, trends in extreme daily precipitation show weakened intensity, but increased occurrence in the northeastern MLR-YR in past decades. This is especially the case in the regions around the Danjiangkou-Hanjiang, the Poyang-Ganjiang and the Dongting-Changjiang area. The phenomena were reversed in the southwestern parts of the MLR-YR. For instance, extreme precipitation frequency showed an increase of 0.26 day and 0.16 day per year at the Tongren station in Guizhou Province and the Zhijiang station in Hunan Province, respectively. However, the extreme precipitation intensity revealed a decreasing trend in the two stations. In addition, we found that the frequency of extreme daily precipitation events in the northeastern Sichuan Province is weakened, while the intensity of precipitation becomes enhanced in this region.
5. Discussions
5.1. Impacts of East Asian Summer Monsoon on Extreme Daily Precipitation Events
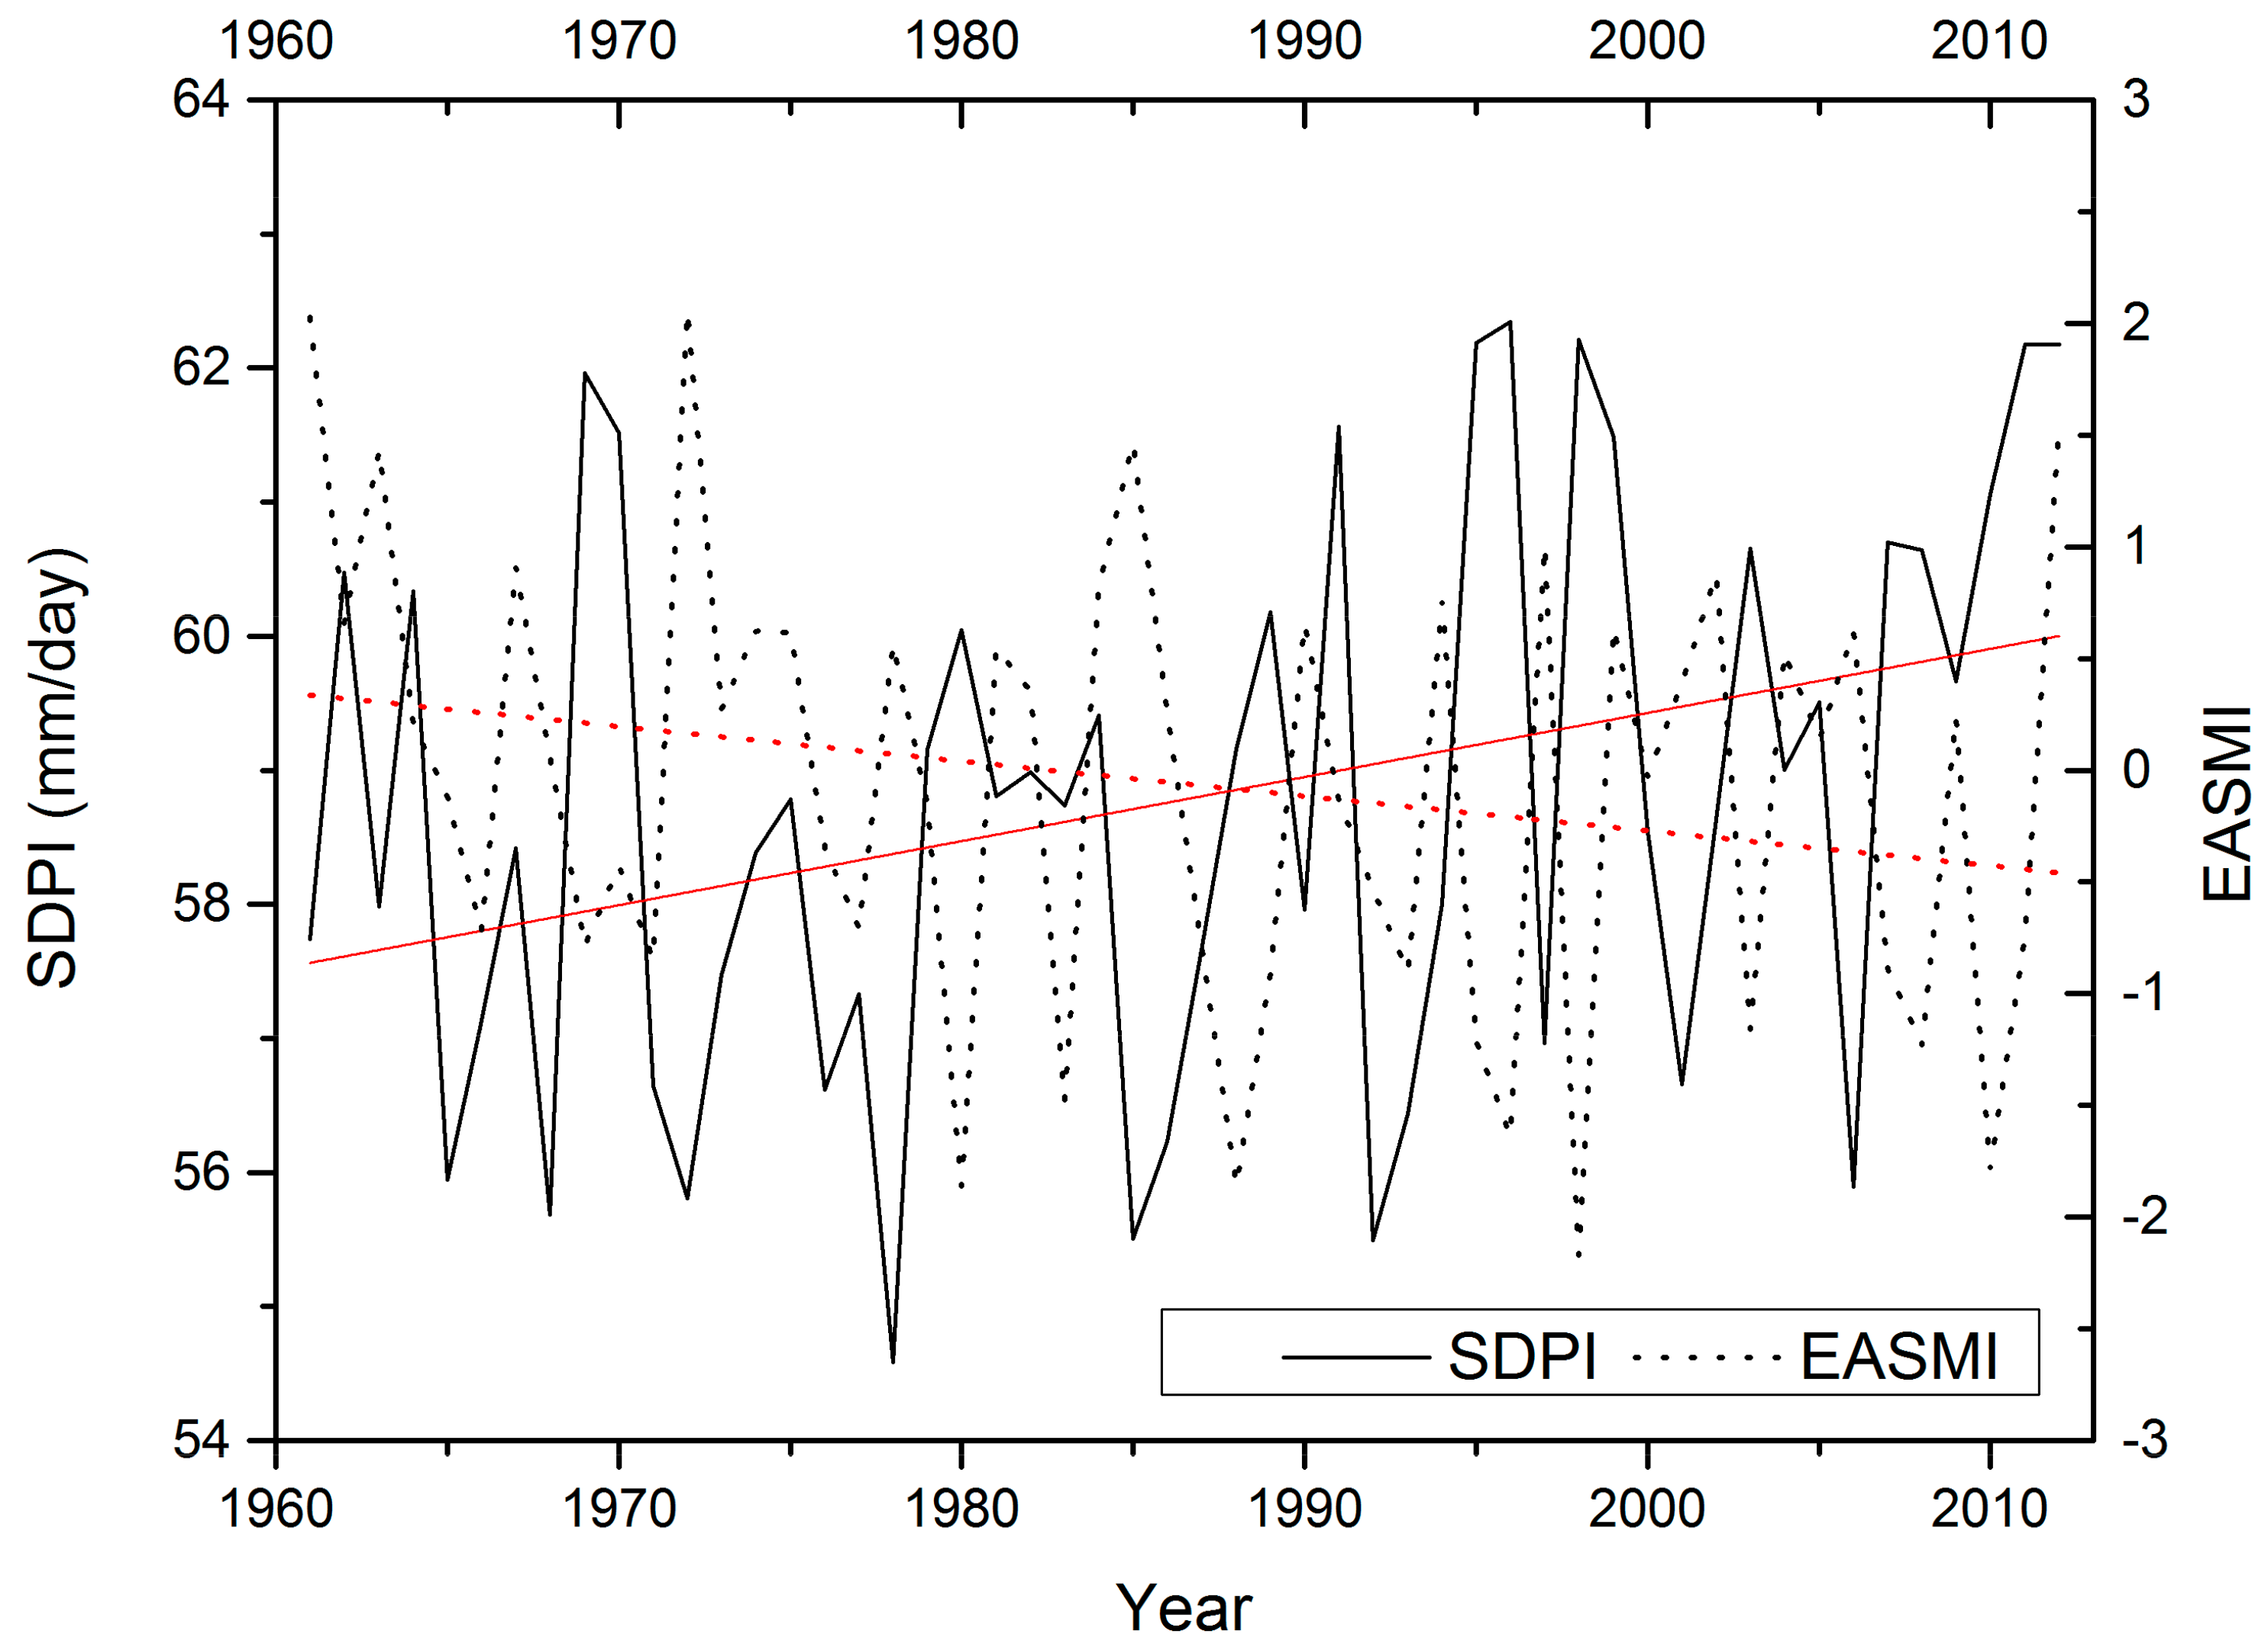
The East Asian summer monsoon is an important circulation system that affects the change in the summer precipitation in the MLR-YR [58]. Thus, the relationship between extreme daily precipitation events and the East Asian summer monsoon index was examined to explore probable causes of the extreme precipitation variations in the MLR-YR during 1961–2012. In terms of the extreme precipitation intensity, the correlation coefficient between and the EASMI is −0.389 and the P value calculated by the t-test is 0.004 (Figure 8). For the extreme precipitation frequency, a significant negative correlation (r = −0.292; n = 52; p = 0.036) is also found between the number of extreme daily precipitation events and the EASMI over the period 1961–2012 in the MLR-YR (Figure 9). The intensity and frequency of extreme daily precipitation events showed an overall enhancement in past decades (Fgures 8 and 9), while the East Asian summer monsoon experienced obvious weakening in past decades [58] (Figure 8 and Figure 9).
In addition, according to the Pettitt’s test, the East Asian summer monsoon experienced a mutation in 1986, which was close to that of the extreme daily precipitation events in 1988 in the whole region. These results indicate the probable effects of the variations in large-scale circulation on extreme daily precipitation events.
5.2. Relationships between Extreme Daily Precipitation and Several Local Factors
Further analyses have also been conducted to understand the local anomaly of extreme daily precipitation around the Dongting-Changjiang, the Poyang-Ganjiang and the middle and lower reach of the Hanjiang area (Figure 2, Figure 10, Figure 11 and Figure 12). Time series of extreme daily precipitation records from 1961 to 2012 were analyzed by using Zhongxiang, Yueyang and Nanchang as typical stations with anomalous extreme daily precipitation (Figure 10, Figure 11 and Figure 12).
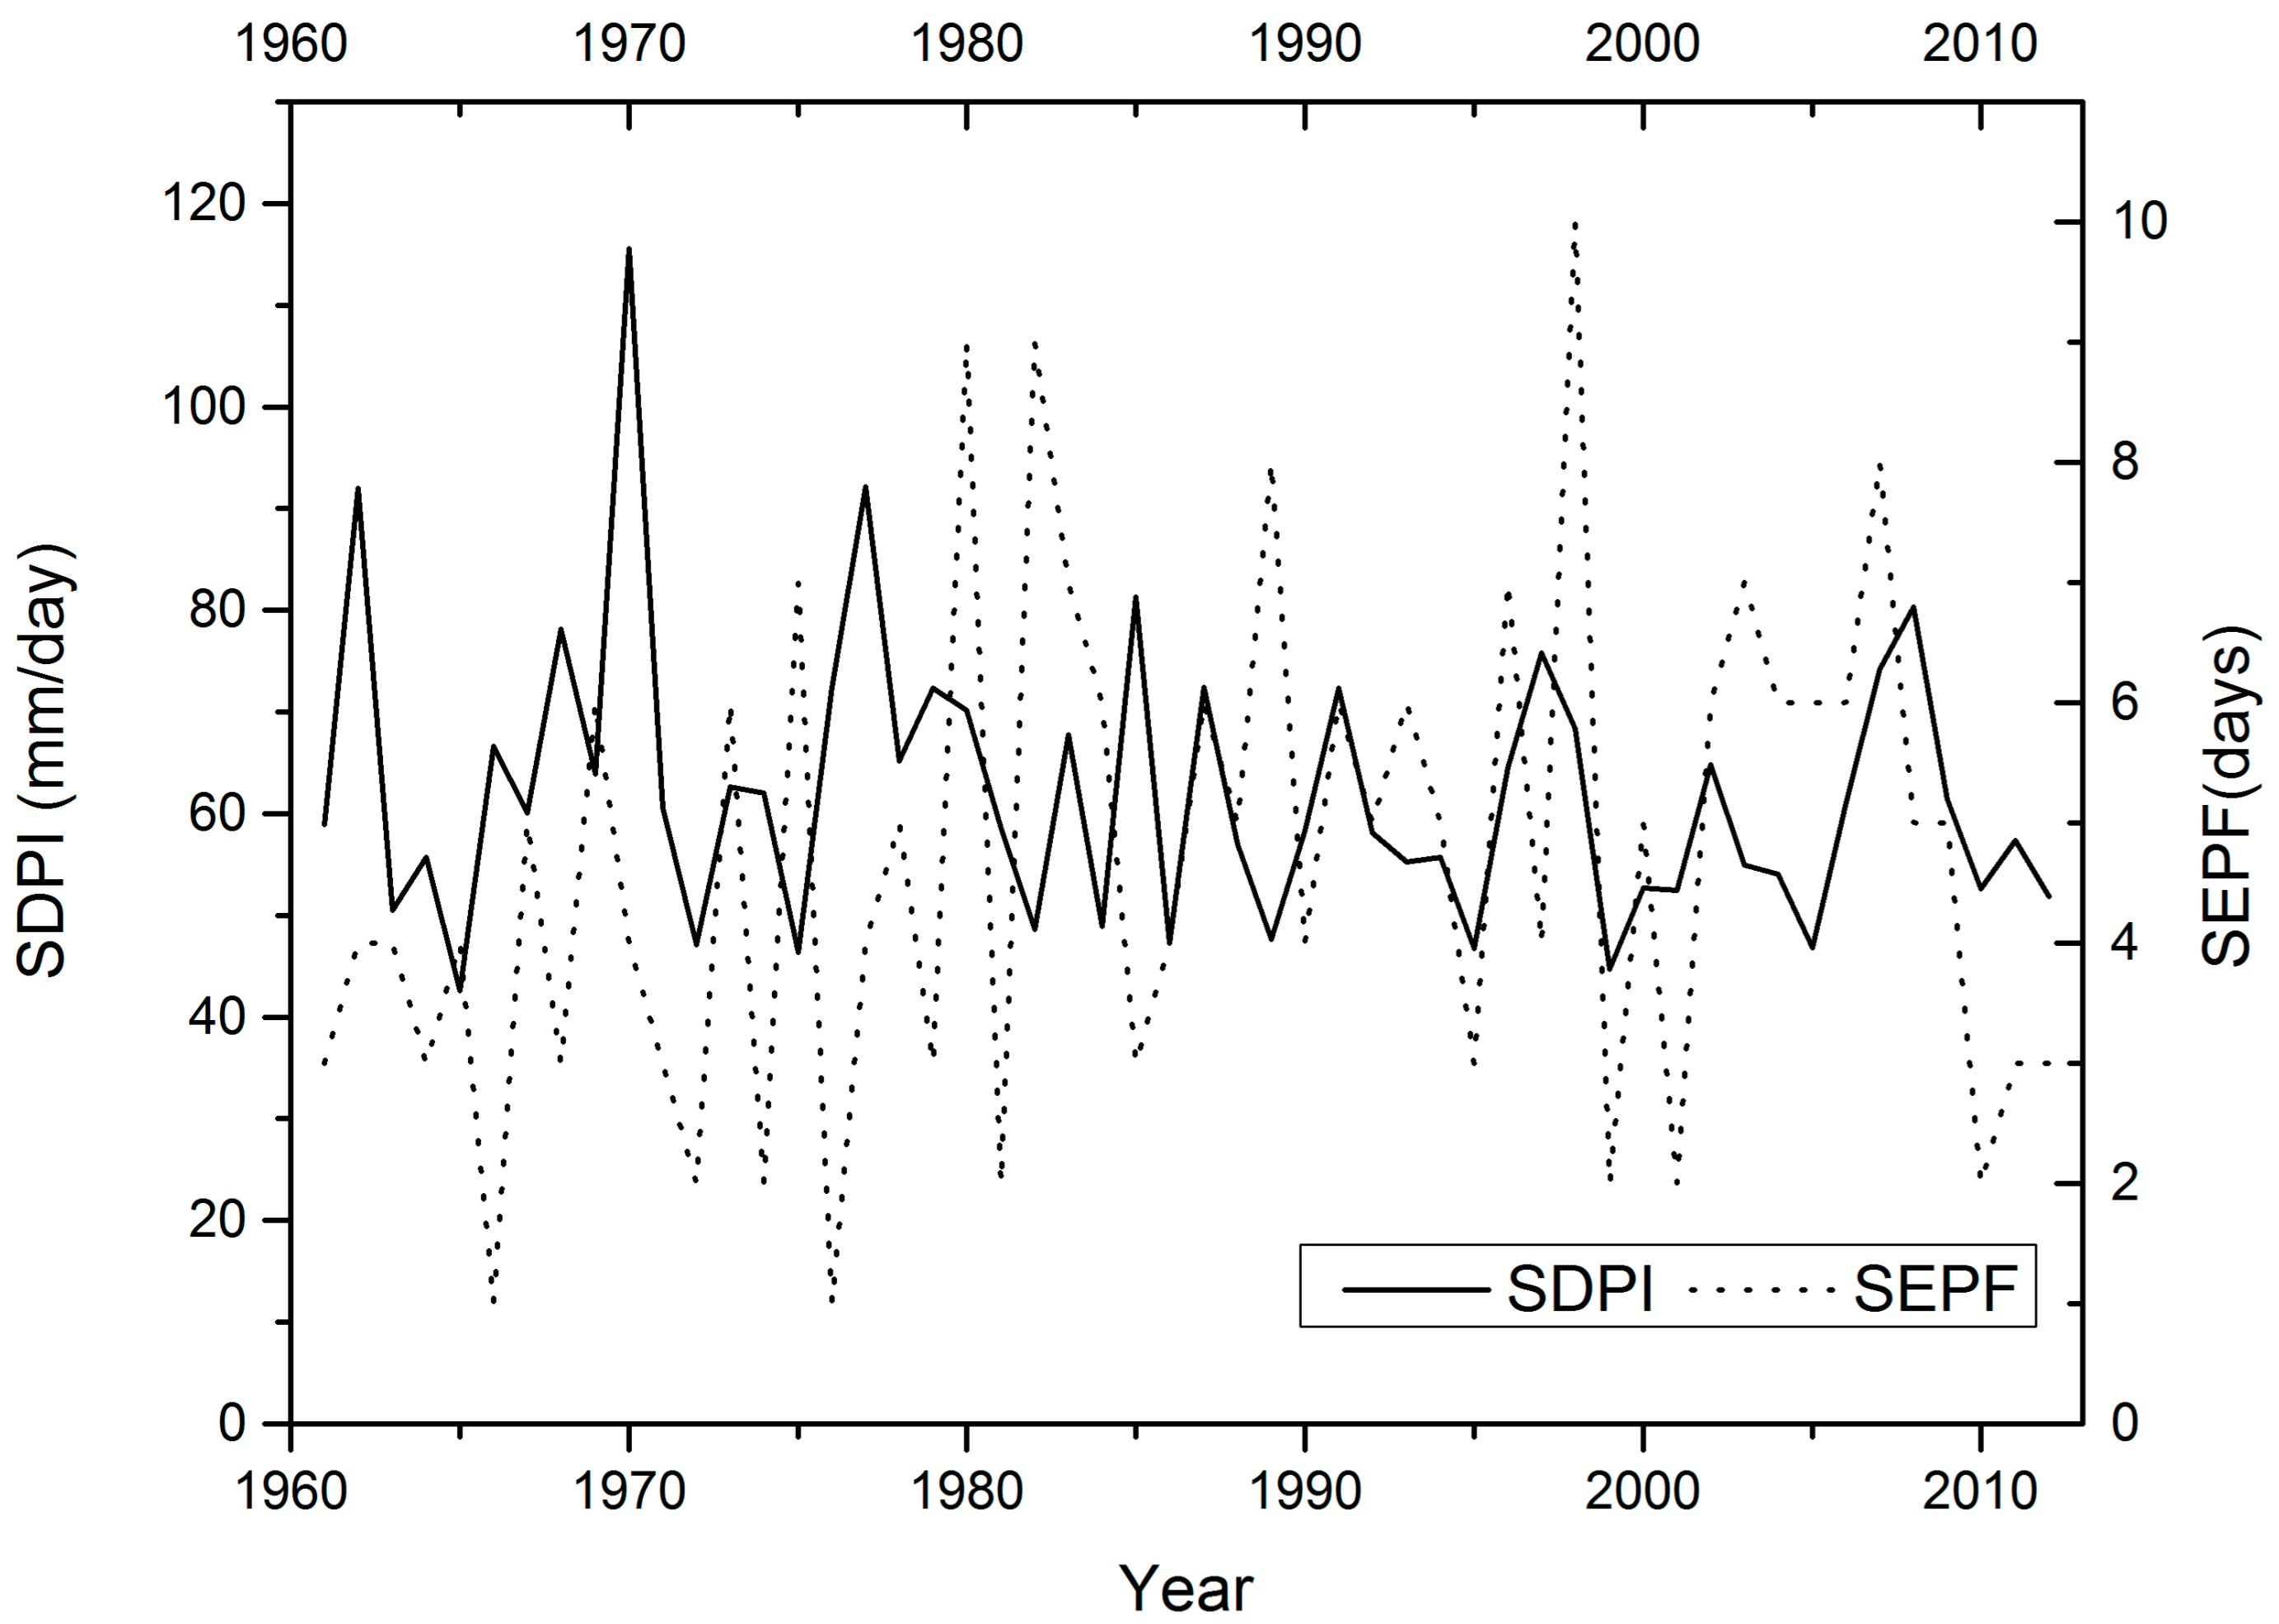
As shown in Figure 10, extreme precipitation intensity at the Zhongxiang station has revealed smaller fluctuation since 1979. The changed from 62.1 13.7 mm/day during 1961–2012 to 59.9 10.2 mm/day during 1979–2012, indicating a more even distribution of extreme precipitation intensity. The phenomena could be associated with the hydrological change in this area due to the regulation of Danjiangkou reservoir. Construction of the Danjiangkou reservoir started in 1958, and finished in 1973. It may exert large influences on the flow regime in the middle and lower reaches of the Hanjiang River [59]. Particularly, according to our change-point detection, the at the Zhongxiang station showed a mutation in 1980, indicating the probable impacts of hydropower engineering.
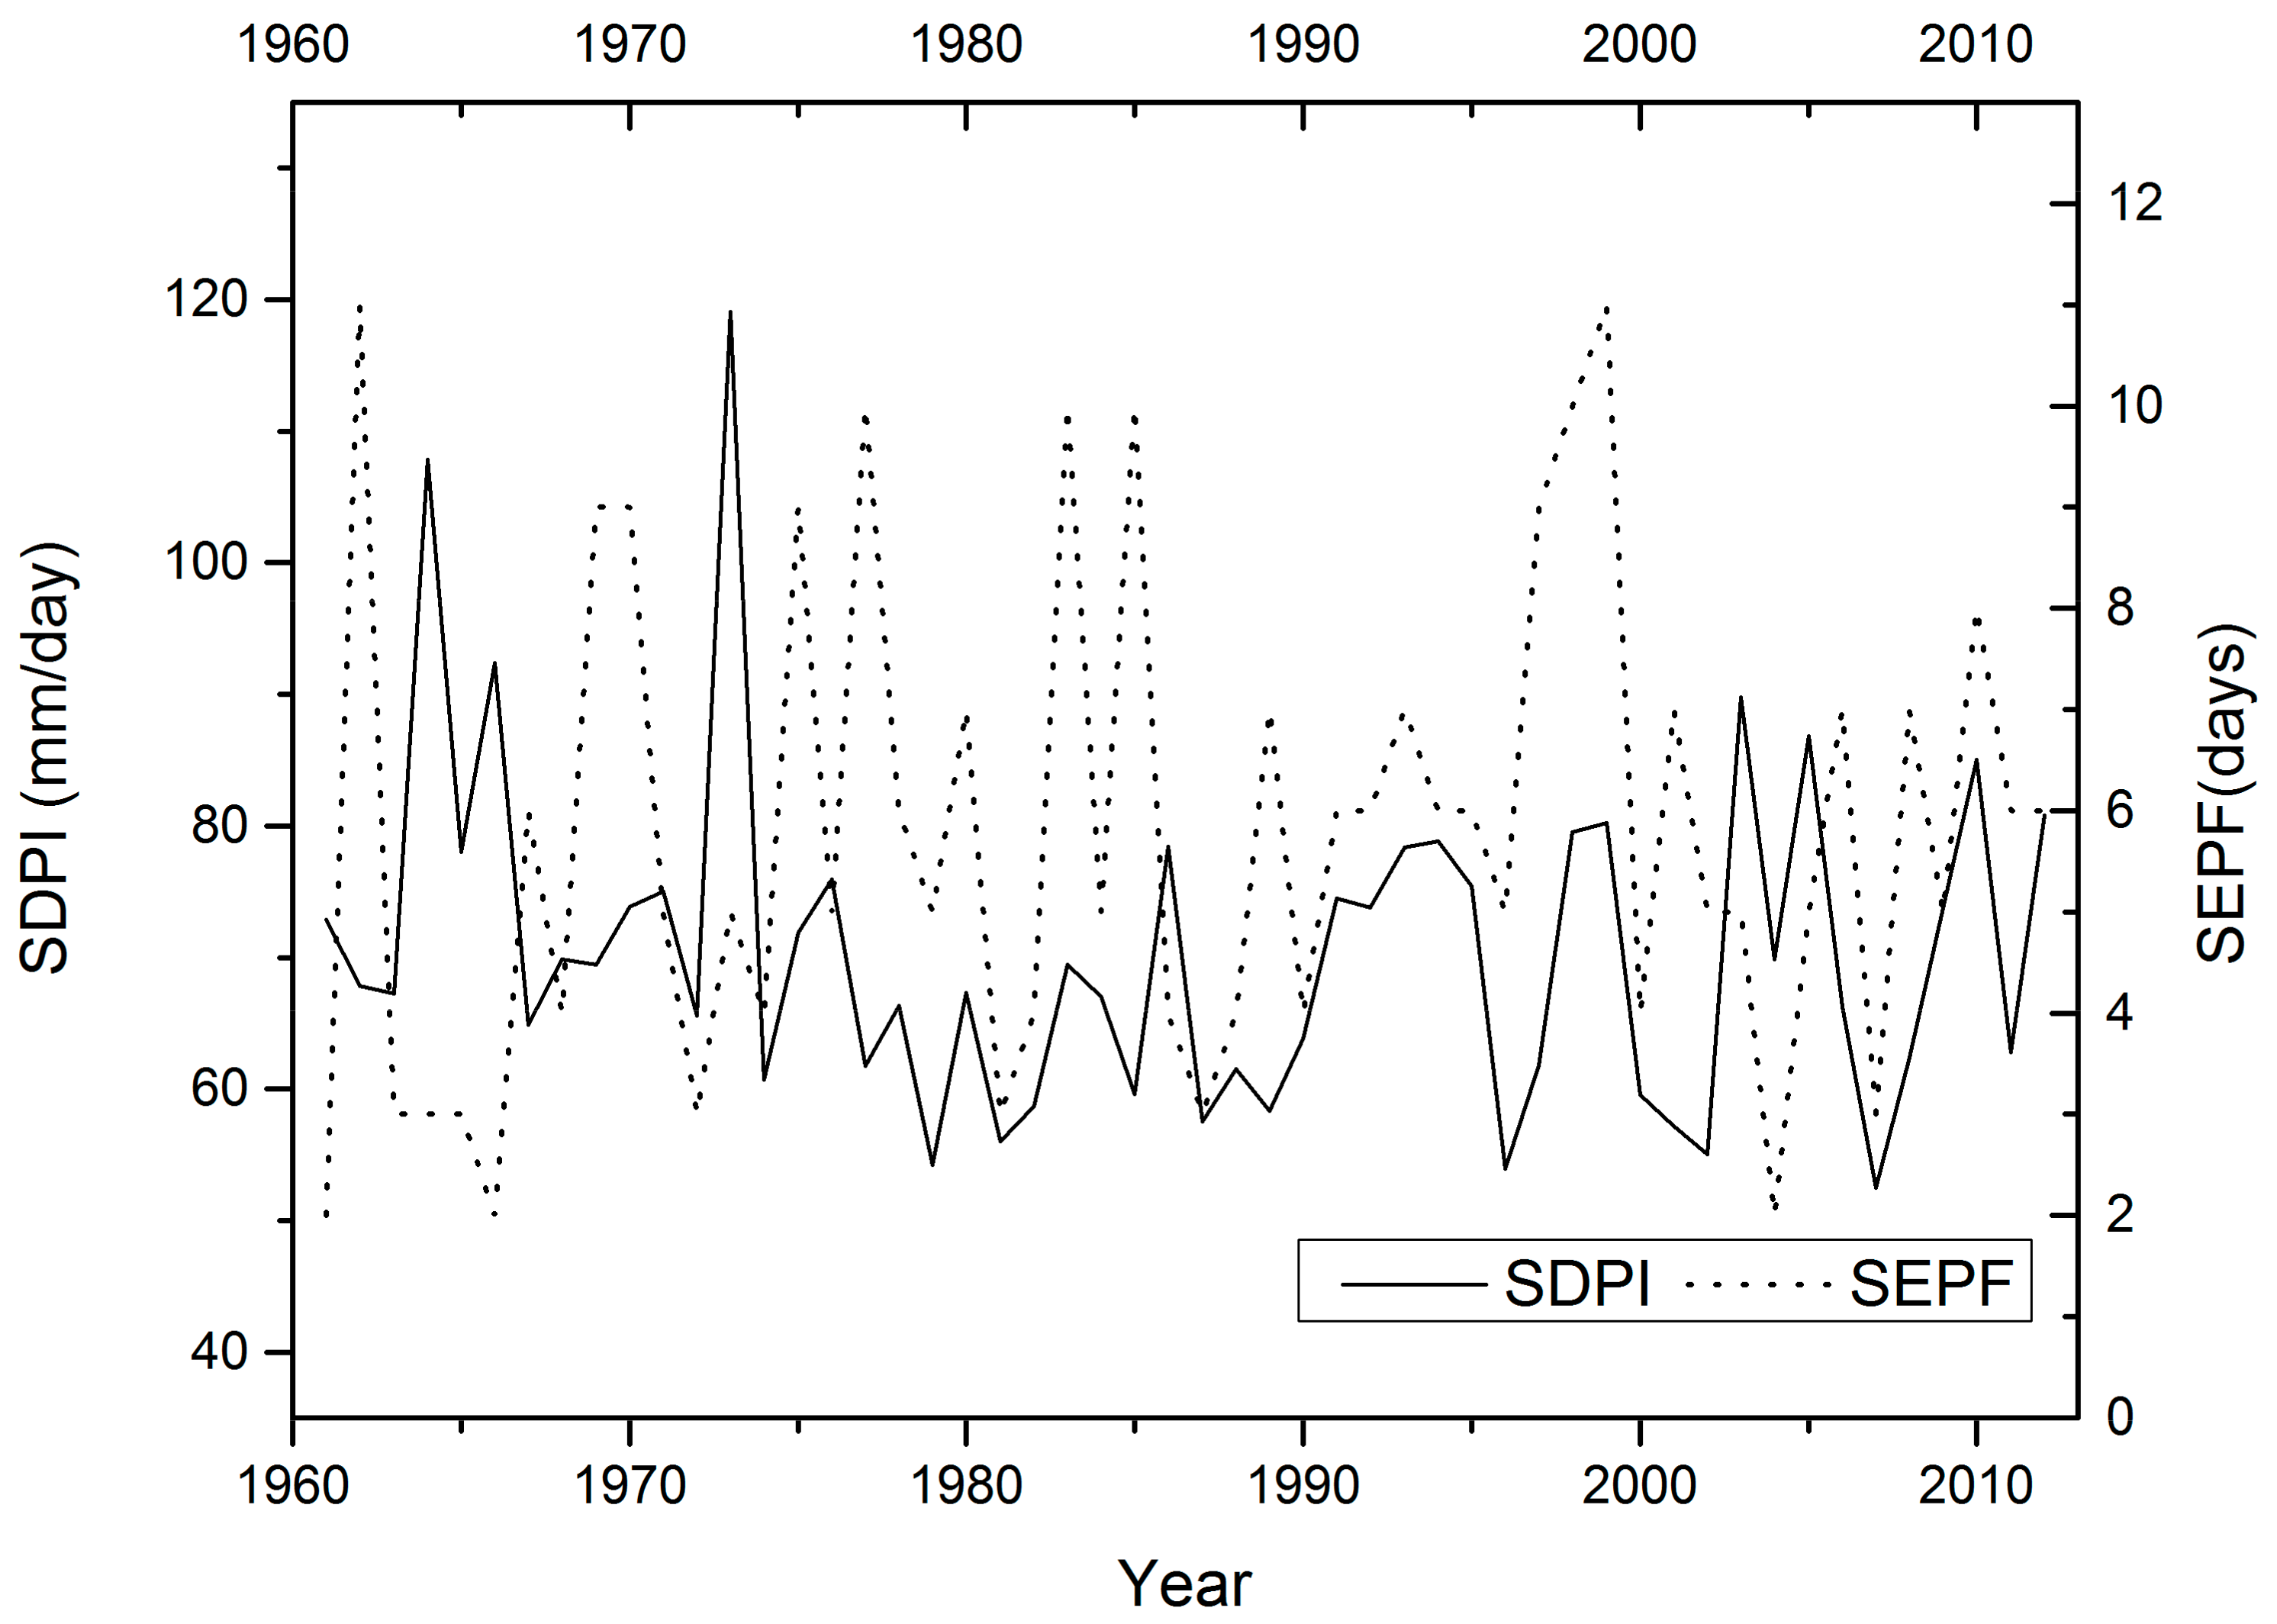
In addition, the at the Yueyang station in the middle reach of the Yangtze River also became more even, varying from 65.28 13.94 mm/day during 1961–1999 to 59.52 6.8 mm/day during 2000–2012 (Figure 11). However, the extreme precipitation frequency of the Yueyang station showed an increasing trend in past decades (Figure 5 and Figure 11). The phenomena could be associated with the impacts of lake regulation [60], as well as hydrologic engineering (i.e., three Gorges Dam) in the upper reach of the Yangtze River (Figure 2). Particularly, the three Gorges Dam in China, the world’s biggest hydroelectric construction, was built along the middle reach of the Yangtze River from 1994. The river closure during the three Gorges Project was completed in 1997. The impoundment reached 175 m in the Three Gorges reservoir area in 2010. In addition, according to the Pettitt’s test, extreme precipitation intensity shows a mutation at the Yueyang station in 1999. Past studies also found that the three Gorges Dam exerted large climatic effects on the regional scale (~100 km) rather than on the local scale (~10 km) [54]. This result indicates the probable effects of the three Gorges Dam on extreme precipitation. In comparison with the Yueyang station, the at the Nanchang station in the lower reach of the Yangtze River revealed fluctuations before and after the construction of the three Gorges Dam (Figure 12). The fluctuations could be associated with being relatively far away from the three Gorges Dam.
In addition, as mentioned in Section 4.4.2, extreme precipitation intensity showed opposite trends at the stations of Tongren, Shapingba, Zhijiang and several others in the northeastern Sichuan Province (Figure 5). The heterogeneity is in agreement with the variations of nocturnal precipitation in the northeastern Sichuan Province [57]. This phenomenon could be associated with large-scale circulation and local topography in the eastern Tibetan Plateau according to the simulation of the Weather Research and Forecasting Model (WRF) [61,62].
6. Conclusions
In this paper, a simultaneous analysis of gradual and abrupt changes of extreme daily precipitation was conducted from 1961 to 2012 by using the MLR-YR in China as an instanace. The extreme daily precipitation events were first identified according to the POT approach by assuming a generalized Pareto distribution with a Poisson arrival rate. On this basis, the intensity and frequency of extreme daily precipitation were then calculated across the MLR-YR. Changes in extreme daily precipitation were further analyzed using regression analysis and the change-point detection.
Taking the MLR-YR as a whole, we found an overall increasing trend from both aspects of frequency and intensity under global climate change, albeit not significant in the case of extreme precipitation intensity. The result indicates overall increasing extreme daily precipitation in the MLR-YR. However, an inverse relationship between the intensity and the frequency of extreme daily precipitation events could also be found locally, including in most parts of the western MLR-YR, around the Poyang-Ganjiang and Dongting-Changjiang area. The results indicate an overall enhanced risk of extreme daily precipitation events in the MLR-YR, but there is a lack of a uniform trend in in different aspects, such as frequency and intensity. The changes in extreme daily precipitation could be attributed to the changes in large-scale circulation such as the East Asian summer monsoon, and some local factors (e.g., lake regulation, hydrologic engineering and topography).
In addition, changes in extreme precipitation over time can occur due to both climate change and natural climate variability [63]. In future studies, causes of extreme daily precipitation will be analyzed in depth by considering the teleconnection with El Niño-Southern Oscillation, local topography, and so on.
Acknowledgments
The authors would like to thank the two anonymous reviewers for their insightful and constructive comments. This study was supported by the National Natural Science Foundation of China (Grant No. 41401438), the Project Funded by the Priority Academic Program Development of Jiangsu Higher Education Institutions, and the Postgraduate Research & Practice Innovation Program of Jiangsu Province (Grant No. KYCX17_1566).
Author Contributions
Fengsong Pei designed the research; Changjiang Wu performed experiments and computational analysis; Kun Wang and Yi Zhou assisted with the experiments; Aixue Qu and Yan Xia contributed to the interpretation and the preparation of the manuscript, and all authors contributed to the final draft of the manuscript.
Conflicts of Interest
The authors declare no conflicts of interest.
References
- Solomon, S.; Qin, D.; Manning, M.; Chen, Z.; Marquis, M.; Averyt, K.B.; Tignor, M.; Miller, H.L. Contribution of Working Group I to the Fourth Assessment Report. In Climate Change 2007: The Physical Science Basis; Cambridge University Press: Cambridge, UK; New York, NY, USA, 2007. [Google Scholar]
- Houghton, J.T.; Ding, Y.; Griggs, D.J.; Noguer, M.; van der Linden, P.J.; Dal, X.; Maskell, K.; Jonhson, C.A. Climate Change 2001: The Scientific Basis. Contribution of Working Group I to the Third Assessment Report of the International Panel on Climate Change; Cambridge University Press: Cambridge, UK; New York, NY, USA, 2001. [Google Scholar]
- Intergovernmental Panel on Climate Change (IPCC). Climate change 2007: Synthesis report. In Contribution of Working Groups I, II and III to the Fourth Assessment Report of the Intergovernmental Panel on Climate Change; Bernstein, L., Reisinger, A., Riahi, K., Bosch, P., Eds.; IPCC: Geneva, Switzerland, 2007; p. 53. [Google Scholar]
- Cai, W.; Borlace, S.; Lengaigne, M.; van Rensch, P.; Collins, M.; Vecchi, G.; Timmermann, A.; Santoso, A.; McPhaden, M.J.; Wu, L.; et al. Increasing frequency of extreme El Nino events due to greenhouse warming. Nat. Clim. Chang. 2014, 4, 111–116. [Google Scholar] [CrossRef] [Green Version]
- Intergovernmental Panel on Climate Change (IPCC). Managing the Risks of Extreme Events and Disasters to Advance Climate Change Adaptation: Special Report of the Intergovernmental Panel on Climate Change; Cambridge University Press: Cambridge, UK; New York, NY, USA, 2012. [Google Scholar]
- Heisler White, J.L.; Blair, J.M.; Kelly, E.F.; Harmoney, K.; Knapp, A.K. Contingent productivity responses to more extreme rainfall regimes across a grassland biome. Glob. Chang. Biol. 2009, 15, 2894–2904. [Google Scholar] [CrossRef]
- Taylor, R.G.; Todd, M.C.; Kongola, L.; Maurice, L.; Nahozya, E.; Sanga, H.; MacDonald, A.M. Evidence of the dependence of groundwater resources on extreme rainfall in East Africa. Nat. Clim. Chang. 2013, 3, 374–378. [Google Scholar] [CrossRef] [Green Version]
- Pei, F.; Wu, C.; Liu, X.; Li, X.; Yang, K.; Zhou, Y.; Wang, K.; Xu, L.; Xia, G. Monitoring the vegetation activity in China using vegetation health indices. Agr. For. Meteorol. 2018, 248, 215–227. [Google Scholar] [CrossRef]
- O’Gorman, P.A.; Schneider, T. The physical basis for increases in precipitation extremes in simulations of 21st-century climate change. Proc. Natl. Acad. Sci. USA 2009, 106, 14773–14777. [Google Scholar] [CrossRef] [PubMed]
- Scoccimarro, E.; Gualdi, S.; Bellucci, A.; Zampieri, M.; Navarra, A. Heavy precipitation events in a warmer climate: Results from CMIP5 models. J. Clim. 2013, 26, 7902–7911. [Google Scholar] [CrossRef]
- Moore, T.R.; Matthews, H.D.; Simmons, C.; Leduc, M. Quantifying changes in extreme weather events in response to warmer global temperature. Atmos. Ocean 2015, 53, 1–14. [Google Scholar] [CrossRef]
- Sarhadi, A.; Soulis, E.D. Time-varying extreme rainfall intensity-duration-frequency curves in a changing climate. Geophys. Res. Lett. 2017, 5, 2454–2463. [Google Scholar] [CrossRef]
- Alexander, L.V.; Zhang, X.; Peterson, T.C.; Caesar, J.; Gleason, B.; Klein Tank, A.M.G.; Haylock, M.; Collins, D.; Trewin, B.; Rahimzadeh, F.; et al. Global observed changes in daily climate extremes of temperature and precipitation. J. Geophys. Res. Atmos. 2006, 111, D05109. [Google Scholar] [CrossRef]
- Orlowsky, B.; Seneviratne, S.I. Global changes in extreme events: Regional and seasonal dimension. Clim. Chang. 2012, 110, 669–696. [Google Scholar] [CrossRef]
- Kunkel, K.E.; Frankson, R.M. Global land surface extremes of precipitation: Data limitations and trends. J. Extrem. Events 2015, 2, 1550004. [Google Scholar] [CrossRef]
- Singh, D.; Tsiang, M.; Rajaratnam, B.; Diffenbaugh, N.S. Precipitation extremes over the continental United States in a transient, high-resolution, ensemble climate model experiment. J. Geophys. Res. 2013, 118, 7063–7086. [Google Scholar] [CrossRef]
- Rajczak, J.; Schaer, C.; Pall, P. Projections of extreme precipitation events in regional climate; simulations for Europe and the Alpine Region. J. Geophys. Res. 2013, 118, 3610–3626. [Google Scholar] [CrossRef]
- Ghosh, S.; Das, D.; Kao, S.; Ganguly, A.R. Lack of uniform trends but increasing spatial variability in observed Indian rainfall extremes. Nat. Clim. Chang. 2012, 2, 86–91. [Google Scholar] [CrossRef]
- Wu, F.T.; Wang, S.Y.; Fu, C.B.; Qian, Y.; Gao, Y.; Lee, D.K.; Cha, D.H.; Tang, J.P.; Hong, S. Evaluation and projection of summer extreme precipitation over East Asia in the Regional Model Inter-comparison Project. Clim. Res. 2016, 69, 45–48. [Google Scholar] [CrossRef]
- Zong, Y.; Chen, X. The 1998 flood on the Yangtze, China. Nat. Hazards 2000, 22, 165–184. [Google Scholar] [CrossRef]
- Shen, H.; Kuang, Y.; Li, Z.I. Genesis of 2010 storm-flood in Yangtze River Basin and its comparison with 1998 flood. Yangtze River 2011, 42, 11–14. (In Chinese) [Google Scholar]
- Su, B.; Gemmer, M.; Jiang, T. Spatial and temporal variation of extreme precipitation over the Yangtze River Basin. Q. Int. 2008, 186, 22–31. [Google Scholar] [CrossRef]
- Chen, Y.D.; Zhang, Q.; Xiao, M.; Singh, V.P.; Leung, Y.; Jiang, L. Precipitation extremes in the Yangtze River Basin, China: Regional frequency and spatial–temporal patterns. Theor. Appl. Climatol. 2014, 116, 447–461. [Google Scholar] [CrossRef]
- Guo, J.; Guo, S.; Li, Y.; Chen, H.; Li, T. Spatial and temporal variation of extreme precipitation indices in the Yangtze River basin, China. Stoch. Environ. Res. Risk Assess. 2013, 27, 459–475. [Google Scholar] [CrossRef]
- Ehsanzadeh, E.; Ouarda, T.B.M.J.; Saley, H.M. A simultaneous analysis of gradual and abrupt changes in Canadian low streamflows. Hydrol. Process. 2015, 25, 727–739. [Google Scholar] [CrossRef]
- Karl, T.R.; Nicholls, N.; Ghazi, A. CLIVAR/GCOS/WMO workshop on indices and indicators for climate extremes: Workshop summary. Clim. Chang. 1999, 42, 3–7. [Google Scholar] [CrossRef]
- Peterson, T.; Folland, C.; Gruza, G.; Hogg, W.; Mokssit, A.; Plummer, N. Report on the Activities of the Working Group on Climate Change Detection and Related Rapporteurs; World Meteorological Organization: Geneva, Switzerland, 2001; p. 143. [Google Scholar]
- China Meteorological Administration (CMA). Surface Meteorological Observation Standards; China Meteorological Press: Beijing, China, 1979; pp. 167–192. (In Chinese) [Google Scholar]
- Li, J.; Zeng, Q. A unified monsoon index. Geophys. Res. Lett. 2002, 29, 111–115. [Google Scholar] [CrossRef]
- Pandey, M.D.; Van Gelder, P.; Vrijling, J.K. Bootstrap simulations for evaluating the uncertainty associated with peaks-over-threshold estimates of extreme wind velocity. Environmetrics 2003, 14, 27–43. [Google Scholar] [CrossRef]
- Acero, F.J.; García, J.A.; Gallego, M.C. Peaks-over-threshold study of trends in extreme rainfall over the Iberian Peninsula. J. Clim. 2011, 24, 1089–1105. [Google Scholar] [CrossRef]
- Thiombiano, A.N.; Adlouni, S.E.; St-Hilaire, A.; Ouarda, T.B.M.J.; El-Jabi, N. Nonstationary frequency analysis of extreme daily precipitation amounts in Southeastern Canada using a peaks-over-threshold approach. Theor. Appl. Climatol. 2016, 129, 1–14. [Google Scholar] [CrossRef]
- Lang, M.; Ouarda, T.; Bobée, B. Towards operational guidelines for over-threshold modeling. J. Hydrol. 1999, 225, 103–117. [Google Scholar] [CrossRef]
- Pandey, M.D.; Van Gelder, P.; Vrijling, J.K. The estimation of extreme percentiles of wind velocity using L-moments in the peaks-over-threshold approach. Struct. Saf. 2001, 23, 179–192. [Google Scholar] [CrossRef]
- Coles, S.; Bawa, J.; Trenner, L.; Dorazio, P. An Introduction to Statistical Modeling of Extreme Values; Springer: London, UK, 2001. [Google Scholar]
- Pickands, J., III. Statistical inference using extreme order statistics. Ann. Stat. 1975, 3, 119–131. [Google Scholar]
- Wang, Q.J. The POT model described by the generalized Pareto distribution with Poisson arrival rate. J. Hydrol. 1991, 129, 263–280. [Google Scholar] [CrossRef]
- Donegan, S.P.; Tucker, J.C.; Rollett, A.D.; Barmak, K.; Groeber, M. Extreme value analysis of tail departure from log-normality in experimental and simulated grain size distributions. Acta Mater. 2013, 61, 5595. [Google Scholar] [CrossRef]
- Cunnane, C. A particular comparison of annual maxima and partial duration series methods of flood frequency prediction. J. Hydrol. 1973, 18, 257–271. [Google Scholar] [CrossRef]
- Cameron, A.C.; Trivedi, P.K. Regression-based tests for overdispersion in the Poisson model. J. Econ. 1990, 46, 347–364. [Google Scholar] [CrossRef]
- Faraway, J.J. Extending the Linear Model with R: Generalized Linear, Mixed Effects and Nonparametric Regression Models; CRC Press: Boca Raton, FL, USA, 2005. [Google Scholar]
- Villarini, G.; Smith, J.A.; Baeck, M.L.; Vitolo, R.; Stephenson, D.B.; Krajewski, W.F. On the frequency of extreme rainfall for the Midwest of the United States. J. Hydrol. 2011, 400, 103–120. [Google Scholar] [CrossRef]
- Beguería, S.; Angulo-Martínez, M.; Vicente-Serrano, S.M.; El Kenawy, A.M.; López-Moreno, J.I. Assessing trends in extreme precipitation events intensity and magnitude using non-stationary peaks-over-threshold analysis: A case study in northeast Spain from 1930 to 2006. Int. J. Clim. 2011, 31, 2102–2114. [Google Scholar] [CrossRef] [Green Version]
- Zhai, P.; Zhang, X.; Wan, H.; Pan, X. Trends in total precipitation and frequency of daily precipitation extremes over China. J. Clim. 2005, 18, 1096–1108. [Google Scholar] [CrossRef]
- Kim, J.; Jain, S. Precipitation trends over the Korean peninsula: Typhoon-induced changes and a typology for characterizing climate-related risk. Environ. Res. Lett. 2011, 6, 034033. [Google Scholar] [CrossRef]
- Villarini, G.; Smith, J.A.; Vecchi, G.A. Changing frequency of extreme rainfall over the central United States. J. Clim. 2013, 26, 351–357. [Google Scholar] [CrossRef]
- Dickey, D.A.; Brillinger, D.R. Time series: Data analysis and theory. Signal Process. Mag. IEEE 1982, 77, 214. [Google Scholar] [CrossRef]
- Pettitt, A.N. A Non-parametric approach to the change-point problem. J. R. Stat. Soc. 1979, 28, 126–135. [Google Scholar] [CrossRef]
- R Core Team. R: A Language and Environment for Statistical Computing; R Foundation for Statistical Computing: Vienna, Austria, 2016; Available online: https://www.R-project.org/ (accessed on 2 December 2017).
- Wang, B.; Wu, Z.; Li, J.; Liu, J.; Chang, C.P.; Ding, Y.; Wu, G. How to measure the strength of the East Asian summer monsoon. J. Clim. 2008, 21, 4449–4463. [Google Scholar] [CrossRef]
- Li, J.P.; Wu, Z.W.; Jiang, Z.H.; He, J.H. Can global warming strengthen the East Asian summer monsoon? J. Clim. 2010, 23, 6696–6705. [Google Scholar] [CrossRef]
- Hossain, F. Empirical relationship between large dams and the alteration in extreme precipitation. Nat. Hazards Rev. 2010, 11, 97–101. [Google Scholar] [CrossRef]
- Li, K.; Zhu, C.; Huang, L. Problems caused by the Three Gorges Dam construction in the Yangtze River basin: A review. Environ. Rev. 2013, 21, 127–135. [Google Scholar] [CrossRef]
- Wu, L.; Zhang, Q.; Jiang, Z. Three Gorges Dam affects regional precipitation. Geophys. Res. Lett. 2006, 331, 338–345. [Google Scholar] [CrossRef]
- Wu, W.; Liu, T. Possible role of the “Holocene Event 3” on the collapse of Neolithic Cultures around the Central Plain of China. Quat. Int. 2004, 117, 153–166. [Google Scholar]
- Shi, X.; Wang, Y.; Xu, X. Effect of mesoscale topography over the Tibetan Plateau on summer precipitation in China: A regional model study. Geophys. Res. Lett. 2008, 35, 19707. [Google Scholar] [CrossRef]
- Hu, D.; Li, Y. Spatial and temporal variations of nocturnal precipitation in Sichuan over the Eastern Tibetan Plateau. Chin. J. Atmos. Sci. 2015, 39, 161–179. [Google Scholar]
- Ding, Y.; Wang, Z.; Sun, Y. Inter-decadal variation of the summer precipitation in East China and its association with decreasing Asian summer monsoon. Part I: Observed evidences. Int. J. Climatol. 2008, 28, 1139–1161. [Google Scholar] [CrossRef]
- Lu, G.; Liu, Y.; Zou, X.; Zou, Z.; Cai, T. Impact of Danjiangkou reservoir on flow regime in the middle and lower reaches of the Hanjiang River. Resour. Environ. Yangtze Basin 2009, 18, 959–963. [Google Scholar]
- Zinke, P.; Bogen, J. Effect of water level regulation on gradients and levee deposits in the Lake Øyeren delta, Norway. Hydrol. Res. 2013, 44, 523–537. [Google Scholar] [CrossRef]
- Jin, X.; Wu, T.; Li, L. The quasi-stationary feature of nocturnal precipitation in the Sichuan Basin and the role of the Tibetan Plateau. Clim. Dynam. 2012, 41, 977–994. [Google Scholar] [CrossRef]
- Xue, Y.; Bai, A.; Li, D. Analysis and numerical simulation of diurnal variation of precipitation in Sichuan Basin. Adv. Earth Sci. 2012, 27, 885–894. [Google Scholar]
- Yilmaz, A.G.; Hossain, I.; Perera, B.J.C. Effect of climate change and variability on extreme rainfall intensity-frequency-duration relationships: A case study of Melbourne. Hydrol. Earth Syst. Sci. Discuss. 2014, 11, 4065–4076. [Google Scholar] [CrossRef]
Figure 1.
Location of the middle and lower reaches of the Yangtze River (MLR-YR).
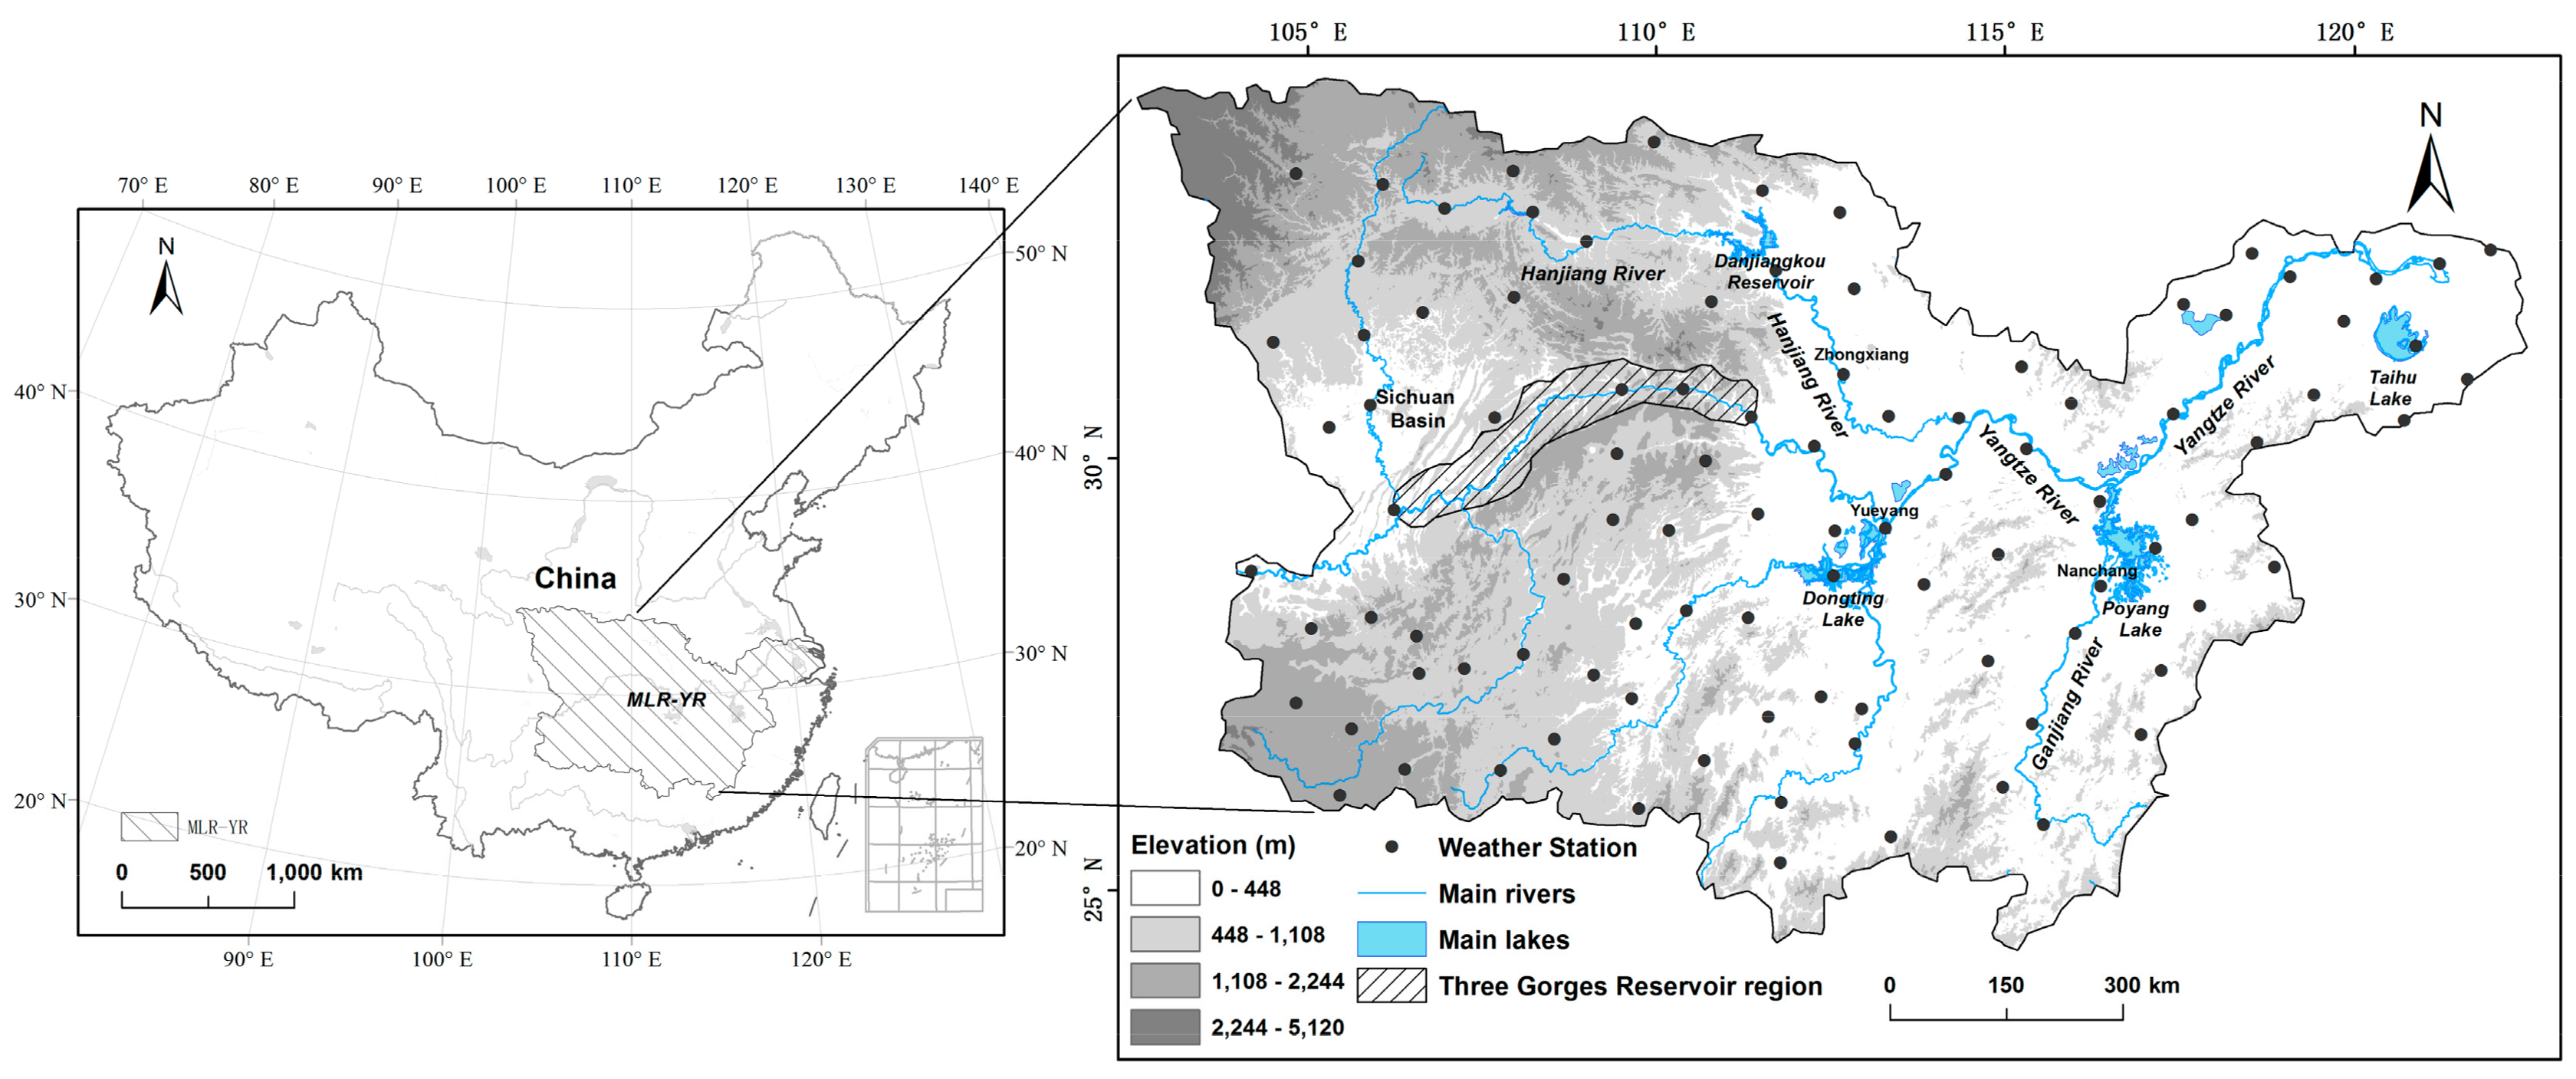
Figure 2.
Average annual precipitation in the MLR-YR over the period 1961–2012.

Figure 3.
Precipitation amount at the 95th percentile over the period of 1961–2012 in the MLY-YR.

Figure 4.
Average intensity of extreme daily precipitation over the period of 1961–2012 in the MLY-YR.
Figure 4.
Average intensity of extreme daily precipitation over the period of 1961–2012 in the MLY-YR.

Figure 5.
Trends in extreme precipitation frequency over the period of 1961–2012.
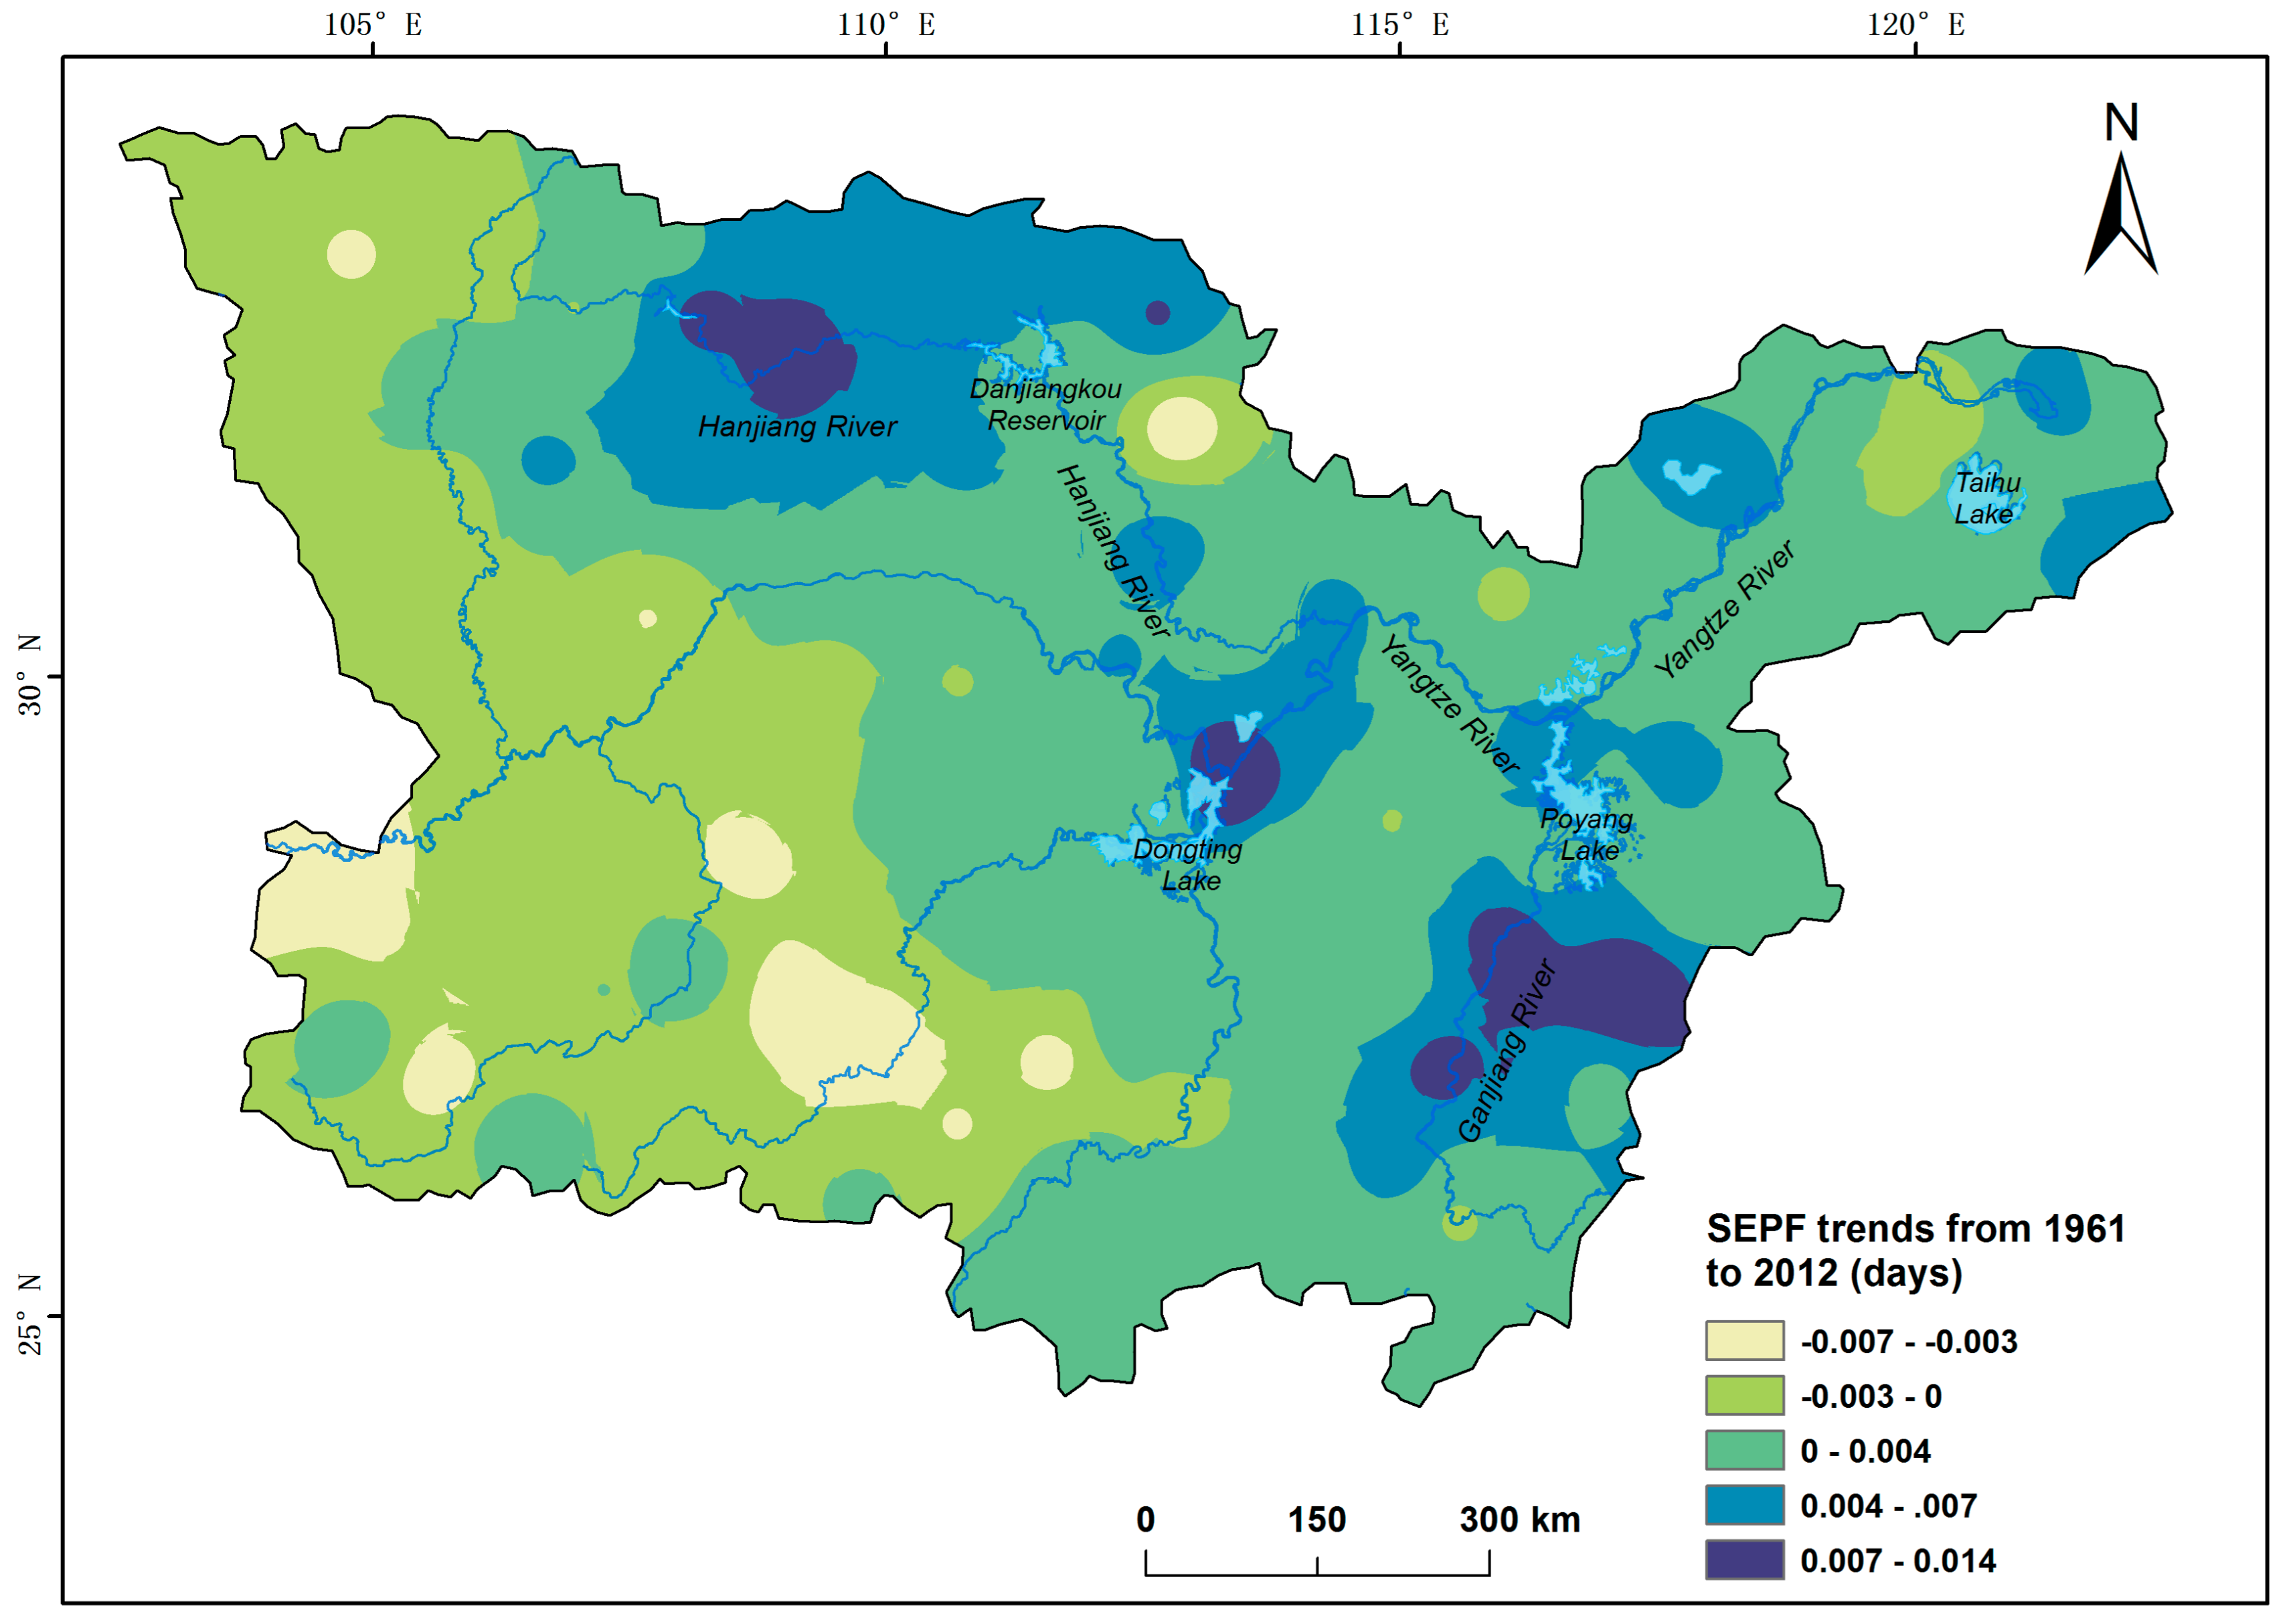
Figure 6.
Trends in extreme precipitation intensity over the period of 1961–2012.

Figure 7.
Change rates of the in the MLR-YR from 1961 to 2012.

Figure 8.
Interannual variations of and EASMI in the MLR-YR from 1961 to 2012

Figure 9.
Interannual variations of and EASMI in the MLR-YR from 1961 to 2012
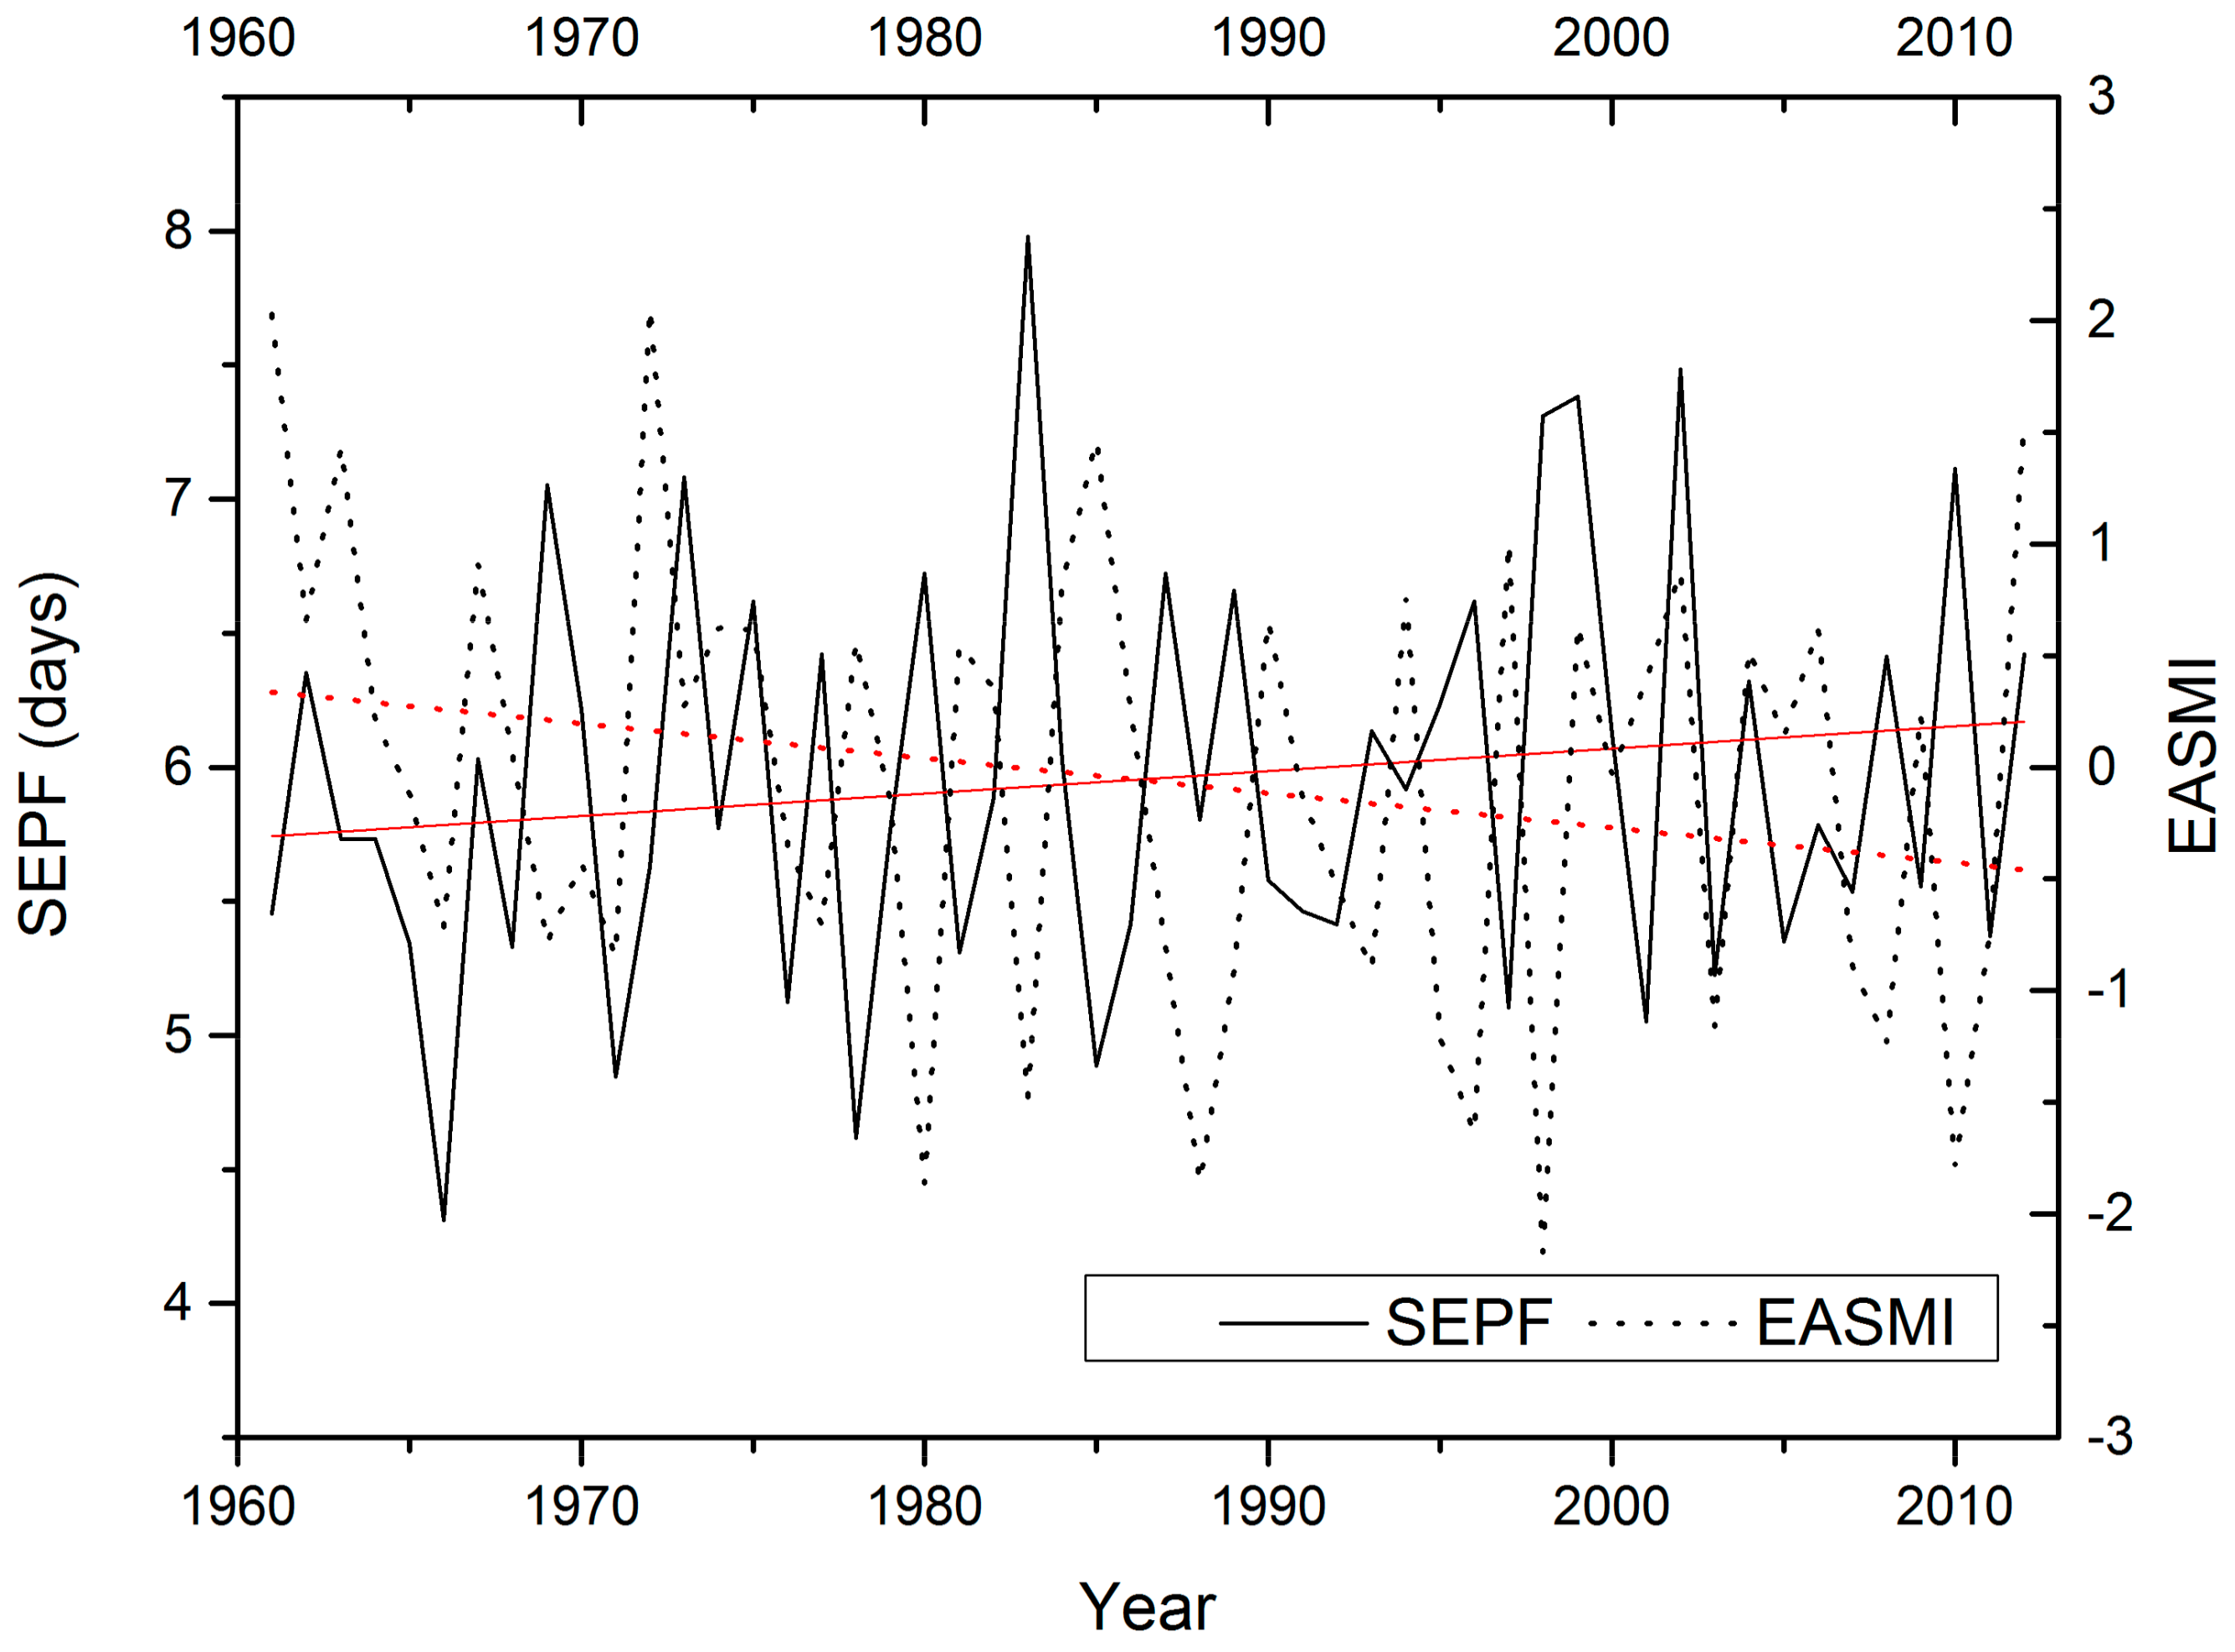
Figure 10.
Interannual variations of and at the Zhongxiang station in the low reach of Hanjiang River from 1961 to 2012.
Figure 10.
Interannual variations of and at the Zhongxiang station in the low reach of Hanjiang River from 1961 to 2012.

Figure 11.
Interannual variations of and at the Yueyang station in Poyang-Changjiang area from 1961 to 2012.
Figure 11.
Interannual variations of and at the Yueyang station in Poyang-Changjiang area from 1961 to 2012.
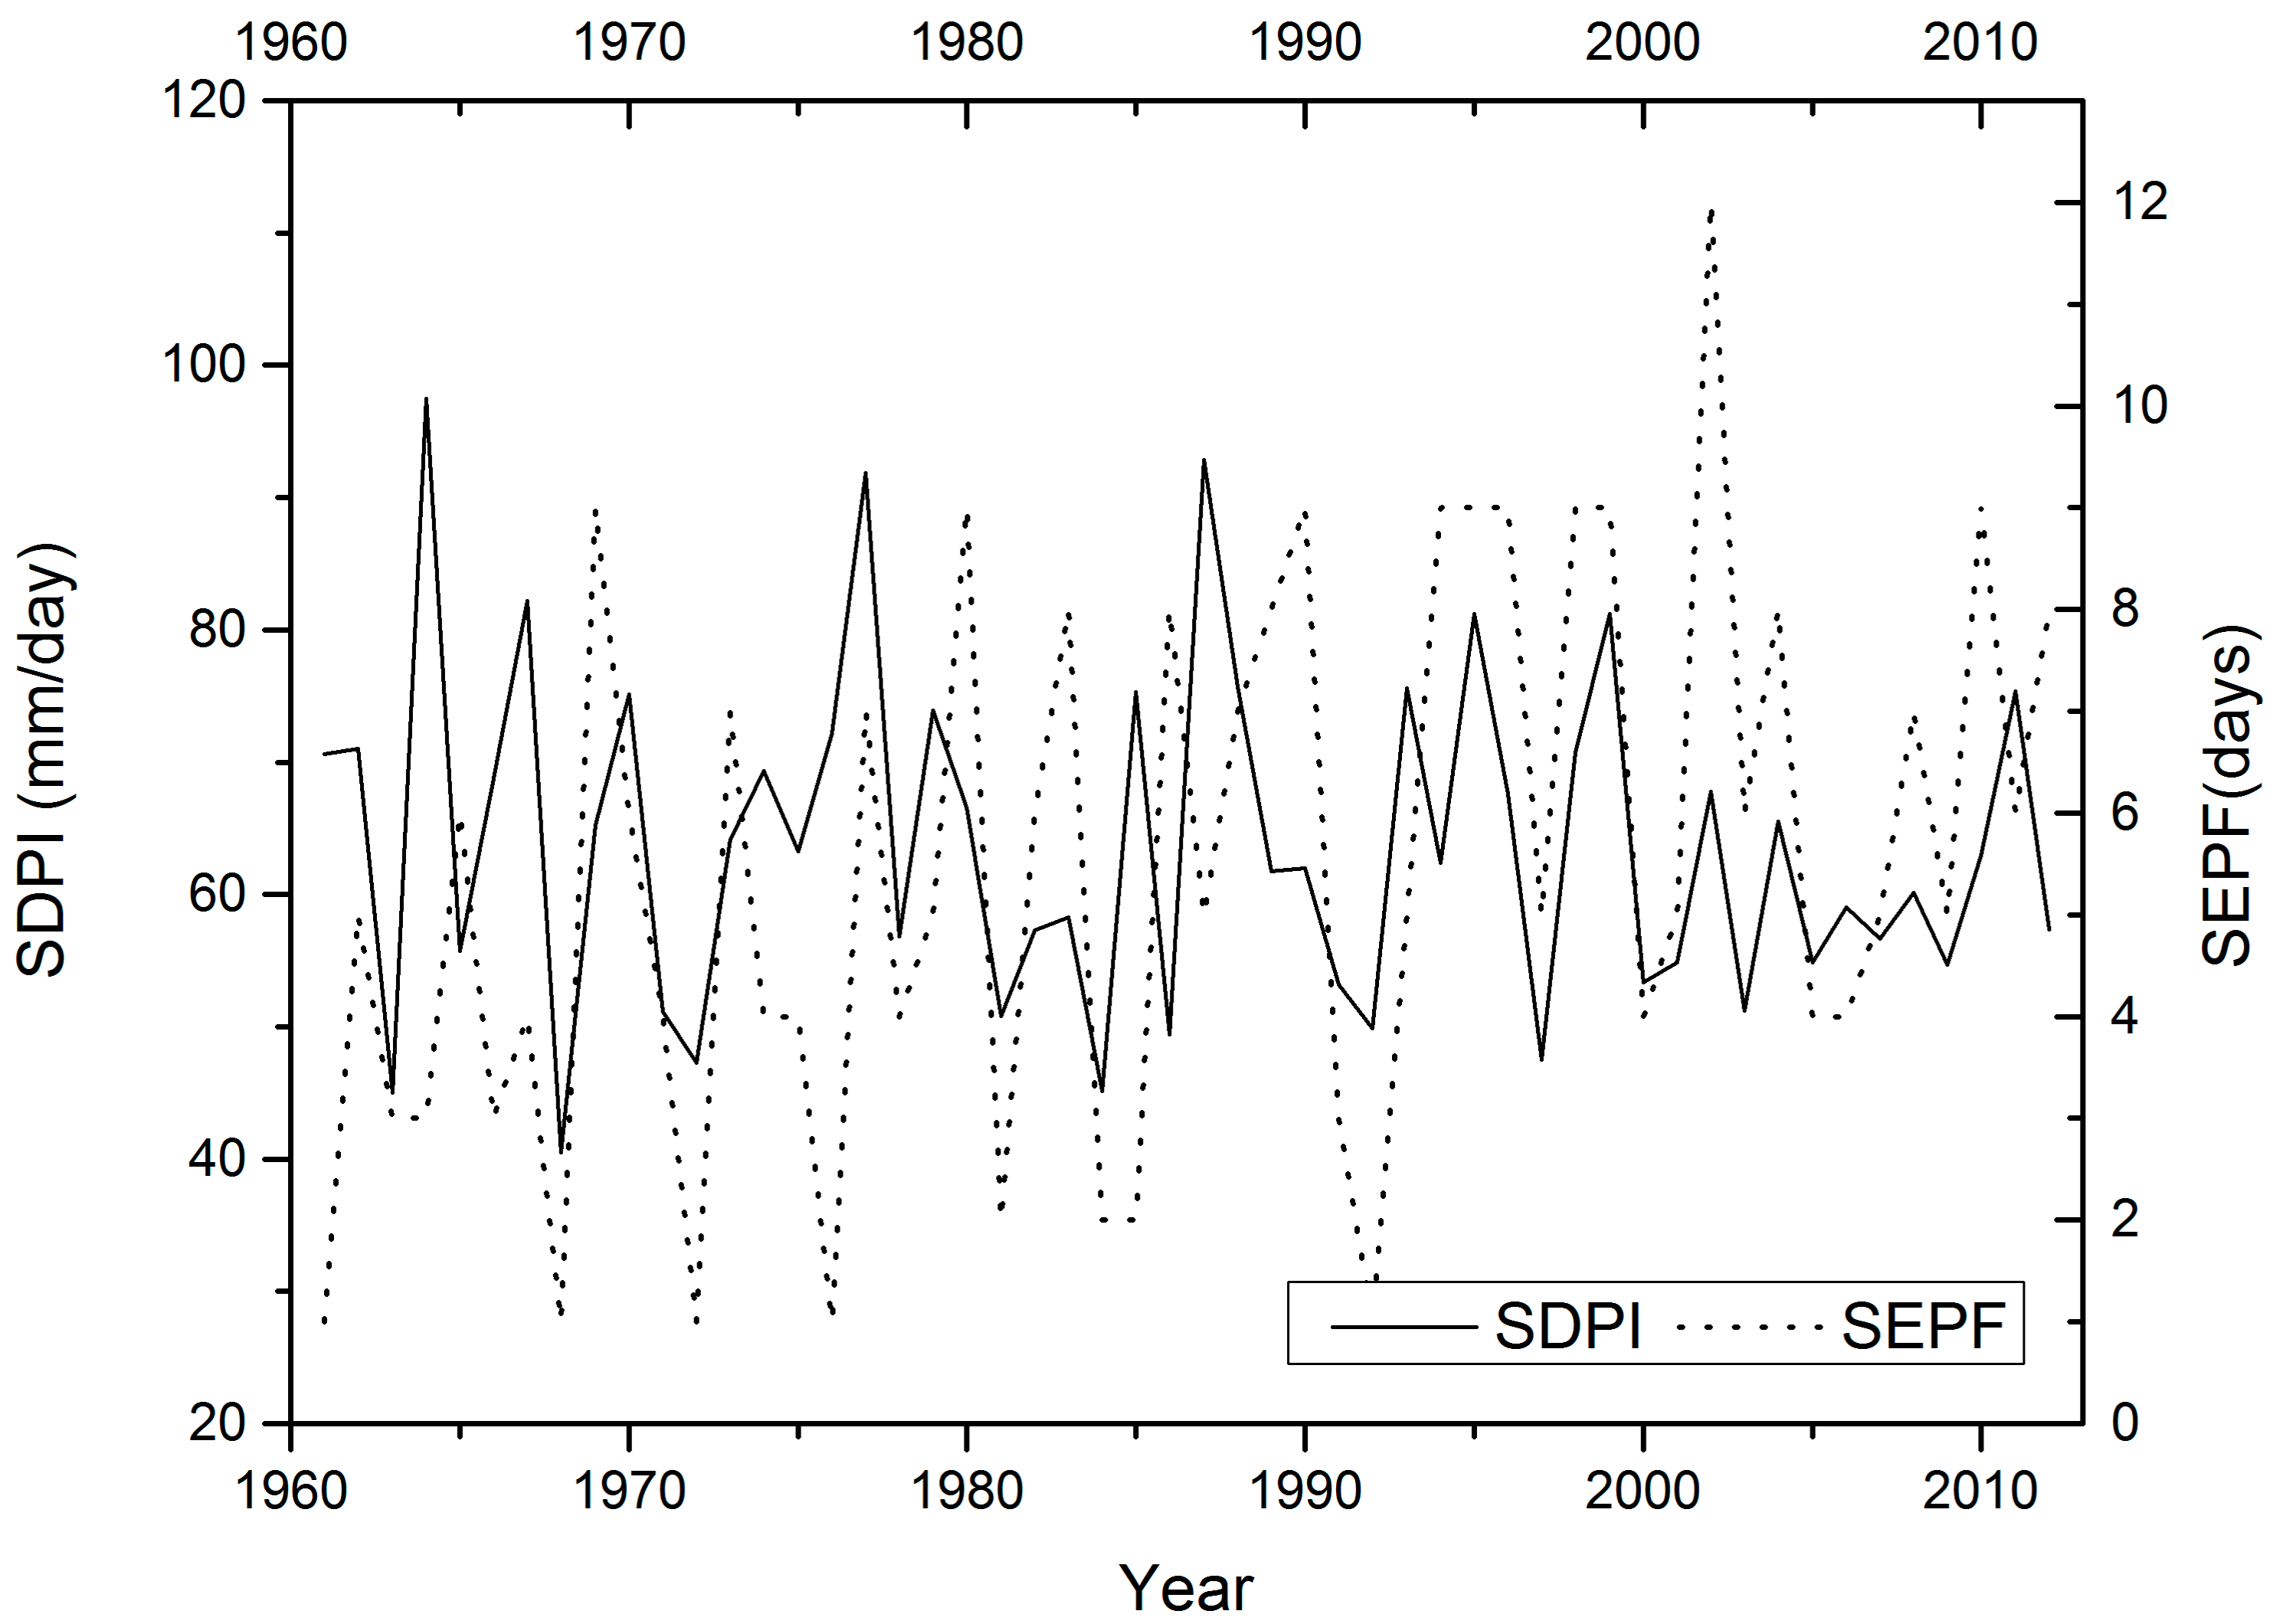
Figure 12.
Interannual variations of and at the Nanchang station in Dongting-Changjiang area from 1961 to 2012.
Figure 12.
Interannual variations of and at the Nanchang station in Dongting-Changjiang area from 1961 to 2012.


Table 1.
Precipitation features at different percentiles in the MLR-YR from 1961 to 2012.
| Precipitation Features | 90th | 95th | 99th |
|---|---|---|---|
| Threshold (mm/day) | 23.97 4.41 | 36.43 6.10 | 72.14 12.22 |
| Occurrence rate (days) | 11.05 1.76 | 5.96 1.01 | 1.31 0.22 |
| Dispersion coefficients | 0.78 0.18 | 0.91 0.19 | 0.96 0.18 |
© 2017 by the authors. Licensee MDPI, Basel, Switzerland. This article is an open access article distributed under the terms and conditions of the Creative Commons Attribution (CC BY) license (http://creativecommons.org/licenses/by/4.0/).
Share and Cite
MDPI and ACS Style
Pei, F.; Wu, C.; Qu, A.; Xia, Y.; Wang, K.; Zhou, Y. Changes in Extreme Precipitation: A Case Study in the Middle and Lower Reaches of the Yangtze River in China. Water 2017, 9, 943. https://doi.org/10.3390/w9120943
AMA Style
Pei F, Wu C, Qu A, Xia Y, Wang K, Zhou Y. Changes in Extreme Precipitation: A Case Study in the Middle and Lower Reaches of the Yangtze River in China. Water. 2017; 9(12):943. https://doi.org/10.3390/w9120943
Chicago/Turabian StylePei, Fengsong, Changjiang Wu, Aixue Qu, Yan Xia, Kun Wang, and Yi Zhou. 2017. "Changes in Extreme Precipitation: A Case Study in the Middle and Lower Reaches of the Yangtze River in China" Water 9, no. 12: 943. https://doi.org/10.3390/w9120943
Note that from the first issue of 2016, this journal uses article numbers instead of page numbers. See further details here.