Article

Influence of Extreme Strength in Water Quality of the Jucazinho Reservoir, Northeastern Brazil, PE

by
Rafael Roney Camara De Melo
1,*,
Ioná Maria Beltrão Rameh Barbosa
2,
Aida Araújo Ferreira
2,
Alessandra Lee Barbosa Firmo
2,
Simone Rosa Da Silva
3,
José Almir Cirilo
4 and
Ronaldo Ribeiro Barbosa De Aquino
5
1
Federal Institute of Pernambuco—Campus Pesqueira, Pesqueira 55200-000, Brazil
2
Federal Institute of Pernambuco—Campus Recife, Recife 50740-540, Brazil
3
Polytechnic School of Pernambuco, University of Pernambuco, Recife 50720-00, Brazil
4
Agreste Academic Campus, Federal University of Pernambuco, Caruaru 55002-970, Brazil
5
Department of Electrical Engineering, Federal University of Pernambuco, Recife 50740-530, Brazil
*
Author to whom correspondence should be addressed.
Water 2017, 9(12), 955; https://doi.org/10.3390/w9120955
Submission received: 28 August 2017 / Revised: 22 November 2017 / Accepted: 27 November 2017 / Published: 7 December 2017

Abstract

:
The Jucazinho reservoir was built in the State of Pernambuco, Northeastern Brazil, to water supply in a great part of the population that live in the semi-arid of Pernambuco. This reservoir controls the high part of Capibaribe river basin, area affected several actions that can compromise the reservoir water quality such as disposal of domestic sewage, industrial wastewater and agriculture with use of fertilizers. This study aimed to identify the factors that lead to water quality of the Jucazinho reservoir using a database containing information of nine years of reservoir water quality monitoring in line with a multivariate statistical technique known as Principal Component Analysis (PCA). To use this technique, it was selected two components which determine the quality of the reservoir water. The first principal component, ranging from an annual basis, explained the relationship between the development of cyanobacteria, the concentration of dissolved solids and electrical conductivity, comparing it with the variation in the dam volume, total phosphorus levels and turbidity. The second principal component, ranging from a mensal basis, explained the photosynthetic activity performed by cyanobacteria confronting with the variation in the dam volume. It observed the relationship between water quality parameters with rainfall, featuring an annual and seasonal pattern that can be used as reference to behaviour studies of this reservoir.

1. Introduction

The Jucazinho reservoir, located in the Capibaribe River Basin in the state of Pernambuco, presents deteriorated water quality as a result of nutrient insertion due to the use and occupation of the contributing hydrographic basin. This reservoir is responsible for the water supply of approximately 800 thousand inhabitants in the Agreste region of Pernambuco [1].
The deterioration of water quality over the years and the consequent investments for the improvement of treatment systems to make it drinkable preoccupy water resource managers and technicians of COMPESA—the Sanitation Company of Pernambuco State—responsible for water supply and sanitation services to the majority of the population of Pernambuco.
Due to the Jucazinho reservoir’s economic and social importance for the region, the quality of its water must be frequently monitored, noting its seasonal variation and investigating the possible causes of the changes that occur. The reservoirs of the Brazilian semi-arid region present seasonal variations, in which, generally, there is a greater concentration of nutrients impacting the trophic state, during the periods of drought [2,3,4,5]. In the semi-arid region of Brazil, reservoir levels and their variations impact the quality of the stored water, that is, in a period of little rainfall, there is a reduction in the level of the reservoir, and there are thus consequent changes in water quality [3].
The excessive concentration of nutrients in many lakes and reservoirs is pointed out as anthropogenic [6,7,8,9]. This subject has been extensively discussed by public authorities, considering that low water quality implies a greater expenditure of time and financial resources to make the water suitable [10]. In addition, there is a risk of a presence of toxins and their impacts on drinkable water when the eutrophication process and high concentration of algae occurs [11].
Water quality is measured by parameters related to the physical, chemical, and biological characteristics of the water [12]. Such parameters are obtained through the collection of water samples from the reservoir for subsequent physical, chemical, and biological analyses.
A continuous collection of data that portray water quality, meteorological records, and conditions of use and occupation of the soil in the basin leads to a set of information that are often not trivial and that can be used to carry out analyses on water quality. For a large data set that involves many variables, the solution for a better understanding of the relationships among variables is not simple, so there is a need to apply a statistical technique of size reduction, that is, this technique replaces the set of existing variables by another, smaller, set that is a combination of the original variables. These applied statistical techniques shows the most important relationships among the variables and provide results that allow for a temporal analysis of the behavior of the data in study area [13,14]. Factorial analysis (FA), cluster analysis, and principal component analysis (PCA) are some of the statistical analyses applied to size reduction [15,16].
With the evolution of computers and software, there is a growing application of multivariate statistics, leading to many studies with applications in the area of water resources. Several authors have used techniques of multivariate statistical analysis to explain the variables that govern the water quality of various sources, mainly for the verification of the spatial and temporal behavior of these variables, since the amount of data involved in the study sometimes hinders the interpretation of results [17,18].
The present study had as an objective the verification of the behavior of water quality of the Jucazinho reservoir during a period of extreme drought. For this, one of the above-mentioned multivariate statistical techniques was used, the PCA.

2. Materials and Methods

This section presents information about the study area, where the water samples were collected to determine the physical, chemical, and biological parameters. The method by which the data of the water level of the dam was collected, the treatment of the data, and the statistical analysis is also described.

2.1. Spring Studied and Its Area of Hydric Contribution

The Jucazinho reservoir (location shows in Figure 1) was built in 1998 by the National Department of Works against Droughts (DNOCS), aiming, among other objectives, to ensure the water supply of the region and increase flood control along the Capibaribe river downstream from the dam until Recife, the capital of Pernambuco [19].
This reservoir has a flow contribution area greater than half of the drainage area of the Capibaribe basin, responsible for the water supply of about 800 thousand inhabitants in the Agreste of Pernambuco. It is located between the municipalities of Surubim and Cumaru and has an accumulation capacity of 327 million cubic meters. The flood control system is also integrated by three other reservoirs: Carpina, Goitá, and Tapacurá. Together, the reservoirs protect 3 million people against floods [20].
The part of the river basin controlled by the Jucazinho reservoir is fully situated within the semi-arid region of Northeastern Brazil. While there were seasons with high rainfall during the first decade of this century, this region suffered the worst drought of the last 60 years from 2011 to 2016. This drought was characterized by irregular and low rainfall concentrated within a short period of each year. This phenomenon, associated with high evaporation rates (2500–3000 mm per year), is causing collapse in almost all reservoirs, including Jucazinho.
Figure 2 shows the variation in the accumulated volume in Jucazinho (2005–2013). Since then, the volume reduction trend continued until the collapse in 2016 [19].
Upstream of this reservoir, the Capibaribe river stretch is the destination of both domestic sewage from urban areas of the cities Santa Cruz do Capibaribe and Toritama, and industrial effluent of jeans laundries in the latter municipality [21].

2.2. Acquisition of Data

Currently, the Water and Climate Agency of Pernambuco (APAC) and the State Environment Agency (CPRH) work in the fulfillment of the task of monitoring the water quality of state water bodies, with a view to the same attribution to both agencies.
The systematic monitoring of the rivers and reservoirs has been performed more frequently since 2005, when there was a resizing of the mesh of the sampling stations. Specifically for this year, monitoring was performed monthly. Currently, most of the water bodies, where, basically, surface water samples are collected, are monitored quarterly.
In this study, a series of data collected from January 2005 to August 2013, ceded by the APAC/CPRH, was analyzed. The variables studied were temperature (T), electrical conductivity (EC), hydrogen potential (pH), dissolved oxygen (DO), biochemical demand for oxygen (BDO), total phosphorus (P), turbidity (TUR), total solids (TS), cyanobacteria (CB), and the volume of the dam % (VD). These variables were selected because they are part of the main parameters monitored by CPRH.
It is worth mentioning that the series of data for the volume of the dam was obtained in the historical database of DNOCS. Specifically for these data, filling omissions and gaps in the information was necessary, which was carried out by linear interpolation, because the decrease of the level of the reservoir presents linear behavior.

2.3. Statistical Analyses

The statistical analysis used aimed to reduce the size of 10 water quality parameters in some components to facilitate interpretation of the original data. The multivariate statistical technique of PCA was applied from the data available. The database consisted of 10 variables and 45 cases, totalizing a record set of 450 data points. In matrix form, the original data were expressed by X = (xi,j), where i = 1…n samplings (450), and j = 1…p variables (10). In the PCA technique, the first step is to transform the array of original data into a correlation matrix [R] (p × p), for p equal to 10 water quality parameters analyzed in this study.
The data were then subjected to a statistical standardization procedure, wherein the original value is subtracted from the mean and divided by the standard deviation. The standardization is a statistical procedure with the original data to facilitate the comparison between the variables of different magnitudes, since all values of the mean and standard deviation after standardization present 0 and 1, respectively. These data were standardized in an electronic spreadsheet using Equation (1). Yij, Xij, S( X ¯ j), and X ¯ j represent, respectively, the standardized value of the variable, the value of the original variable, the standard deviation, and the mean of the record set.
Y ij = X ij X ¯ j S ( X ¯ j ) a = 1 .
The overall consistency of the data was measured by the Kayser–Mayer–Olkim method (KMO) [16]. The KMO method uses a criterion to identify whether a factorial analysis model that is being used is properly adjusted to data, testing the overall consistency of the data. This procedure checks whether the inverse correlation matrix is next to the diagonal matrix, consisting of comparing the values of the coefficients of linear correlation observed with the values of the partial coefficients of correlation. The number of components removed was defined, considering only components with an eigenvalue exceeding 1 [14].

3. Results and Discussion

3.1. Descriptive Statistics of the Original Variables and Correlations between Variables

Table 1 presents the descriptive statistics of the variables originals (non-standard). For each variable, the mean, standard deviation, variance, and coefficient of variation are presented.
The coefficient of variation is a measure of dispersion useful for the comparison of different distributions. The standard deviation is also a measure of dispersion, but it is relative to the mean. As two distributions may have different means, the deviation of these two distributions are not comparable. The solution is to use the coefficient of variation, which is equal to the standard deviation divided by the mean [15].
Analyzing the variation coefficients of the variables presented in Table 1, it is verified that the variable cyanobacteria (CB) presented a high degree of dispersion, with coefficient of variation equal to 3.62, whereas the variables turbidity (TUR) and biochemical demand for oxygen (BDO) showed values that were lower, yet still significant, 0.80 and 0.62 respectively. The other variables showed low dispersion with coefficients of variation below 0.50.
Table 2 shows the correlation matrix that was prepared to check the parameters of the greatest correlation and help with the interpretation of data.
Higher values were observed for correlations between dissolved oxygen (DO) and hydrogen potential (pH) (R = 0.700), indicating the elevation of pH and DO in function of algal photosynthetic activity (production of oxygen), promoted by the contribution of nutrients [18,22], and between total solids (TS) and electrical conductivity (EC) (R = 0.839), indicating that the greater part of total solids is in a dissolved state.
There is a proportional relation between the content of salts dissolved and the electric conductivity and that the content of salts can be estimated by measuring the conductivity of the water [4]. In water sources in the state of Ceará, in Northeast Brazil, they observed a strong correlation of electrical conductivity with sodium, magnesium, calcium, hardness and chloride, that is, dissolved solids [23]. Further strengthening the strong correlation between electrical conductivity and dissolved solids, the authors of [24] found a correlation exceeding 0.9 for the electrical conductivity and the chlorates. The justification of this result consisted in the increase of chlorides as a function of the high rate of evaporation during the dry season in the semi-arid region of Ceará-Brazil.

3.2. Principal Component Analysis

The application of the technique of PCA resulted in the extraction of several components, whose first four explained approximately 77% of the total variance (Table 3). It was verified that the first (PC1), second (PC2), third (PC3), and fourth (PC4) components explained, respectively, 34%, 22%, 11%, and 10% of the total variance.
After that, only PC1 and PC2 were selected, because the two together add up to more than 55% of the variance studied, explaining the greater part of existing correlations in the data set. According to [25], coefficients of correlation greater than 0.5 express a strong relationship between the variables of water quality.
Table 4 shows the weights of the variables that most contributed to these principal components. The parameters that most contributed positively to PC1 were phosphorus and turbidity, while the parameters electrical conductivity, total solids, and cyanobacteria contributed negatively to it.
The parameters that most contributed positively to PC2 were pH and OD, while the parameter associated with the volume of water accumulated contributed negatively to it.
With the graph of projections for the weights of the variables plotted on the PC1 × PC2 plane (Figure 3), it is suggested that PC1 explains the increase in the concentration of dissolved solids and cyanobacterial proliferation as a function of the drought period (absence of rainfall), and, as a consequence of the lack of rainfall, turbidity and the levels of total phosphorus in the spring were reduced.
Turbidity results from the presence of colloidal particles in suspension, divided organic matter, plankton, and other microscopic organisms [26]. Turbidity can also be related to the inflow of effluents [27], and these are rich in phosphorus [6,28]. Thus, these two variables are associated with, and contribute positively to, this component, while the total dissolved solids, electrical conductivity, and cyanobacteria contribute negatively.
On the other hand, the authors of [24] stated that the total dissolved salts in the waters may be from both natural sources (mineralization and marine aerosols) and anthropic sources (domestic sewage). Some researchers studying water bodies of the state of Ceará made conclusions about the origin of the salts in some of these streams. The authors of [23], studying the waters of the Acaraú river basin, verified that the common origin of these minerals was the weathering of rocks and subsequent runoff from drained areas. Studies in the Jaibaras River, also in Ceará, correlated the salts with domestic sewage and spa waste [29]. Studies about the Trussu river basin, identified the washing of clothes and domestic sewage as being the source of chloride and sodium [30].
The water contribution area of the Jucazinho reservoir have a predominance of soil types Planosol, Solonetz, and Bruno but not Calcic or Regosol [20], which may be contributing to the salinization of water [31]. It is important to emphasize that the salts used by laundries/dyers in Toritama for fixing colors onto fabric confer a high salinity of the effluent. These wastes, when discarded without being properly treated, may be another source of salts to the river and consequently to the reservoir [1].
PC2 indicates the intensification of the process of photosynthesis performed by cyanobacteria, which can be justified by the contributions of the weights of pH, DO (positively), and the percentage of the volume of the dam (negatively).
According to [32], the northeastern region of Brazil presents more propitious conditions for cyanobacterial blooms, because the climate is always hot, reservoirs with low levels, caused by recurrent periods of drought, and a lack of sanitation services, among other factors that favor the excessive increase of biomass in these bodies. According to [33], the maximum rate of growth of the cyanobacteria is present at temperatures above 25 °C and the range of optimal growth happens at a pH level from 7.5 to 10, inhibited below 5. The authors of [34] affirm that the aquatic communities can interfere with the values of pH, mainly through the metabolism of CO2. During the process of photosynthesis, in which there is consumption of this gas by phytoplankton, an increase in the pH values of the medium occurs. Thus, PC2 shows the relationship between photosynthetic activity and the production of oxygen, when the accumulated volume remains at lower levels.
Reseachers performed a statistical evaluation in rivers in the state of Minas Gerais through PCA in the period from 2007 to 2011 [35]. The results showed a positive correlation of density of cyanobacteria with pH, chlorophylla, temperature, and nitrate, and an inverse relationship with turbidity, color, and solids in suspension. The researcher highlights that high loads of nitrate and phosphorus, alkaline pH values, high water temperatures, and prevalence of long periods of drought is the necessary combination for the increase in densities of cyanobacteria.
In statistical study performed in the Teles Pires and Cristalino rivers in the Alto Tapajós basin, located in the state of Mato Grosso, observed, both for the DO and for the pH, during the study period, a negative correlation with the rainfall [36].
Figure 3 displays the graph of weights for the first two principal components. Geometrically, the weights correspond to the cosines of the angles that the principal components make with the original variables. The weights of the original variables in linear combination define each principal component. The relation between the variables can be observed in the graph of the weights. Based on these relations, it is possible initially to infer a physical interpretation for the principal components. Still in the same figure, it is interesting to note the provision of variables along PC1, which shapes 33.52% of the variance of the data matrix. The volume of the dam (VD) has the opposite sign of cyanobacteria (CB), electrical conductivity (EC), and total solids (TS).
Figure 4 shows the score graph with the objective of analyzing the seasonal behavior of the data series. It was possible to group together the years 2005, 2006, 2007, 2012, and 2013 (Group 1) with more positive contributions to the explanation of PC1, while the years 2008, 2009, 2010, and 2011 (Group 2) formed a group that contributed negatively to it.
The scores of the PCA, presented in Figure 4, revealed differences resulting from the seasonal influence and annual accumulated volume, which in turn is directly related to rainfall in the water contribution area of the reservoir.
With the aid of the score graph (Figure 4), it is possible to verify the tendency of grouping for the explanation of PC2. The graph shows that most of the white circles and triangles, which represent the first semester of each year studied, are located above the zero value on the x-axis, so the data for the first semester contributed positively to PC2. Adversely, the black triangles and circles, which represent the second semester of each year studied, are located below the zero value on the x-axis, so it is possible to conclude that the data of second semesters contributed negatively.
In fact, the largest pluviometric indexes in the portion of the Capibaribe river basin controlled by the Jucazinho dam occur in the months of February to June. The lowest values of the monthly average rainfall occur in the period from August to January and are less than 40 mm [19].
The observed trend suggests that the intensification of the drought period associated with an increase of the dissolved solids concentration exhibits behavior that changes annually, and is explained by PC1. The intensification of the process of photosynthesis is performed by cyanobacteria, ranging within six months, and is explained by PC2.

4. Conclusions

The Jucazinho reservoir located in the semi-arid region of Northeastern Brazil suffers from recurrent water level reductions, which are aggravated for years when drought is severe. The studies contemplated data of nine years, and, after the application of statistical techniques and subsequent interpretation of the results. The main conclusions are summarized in the following points.
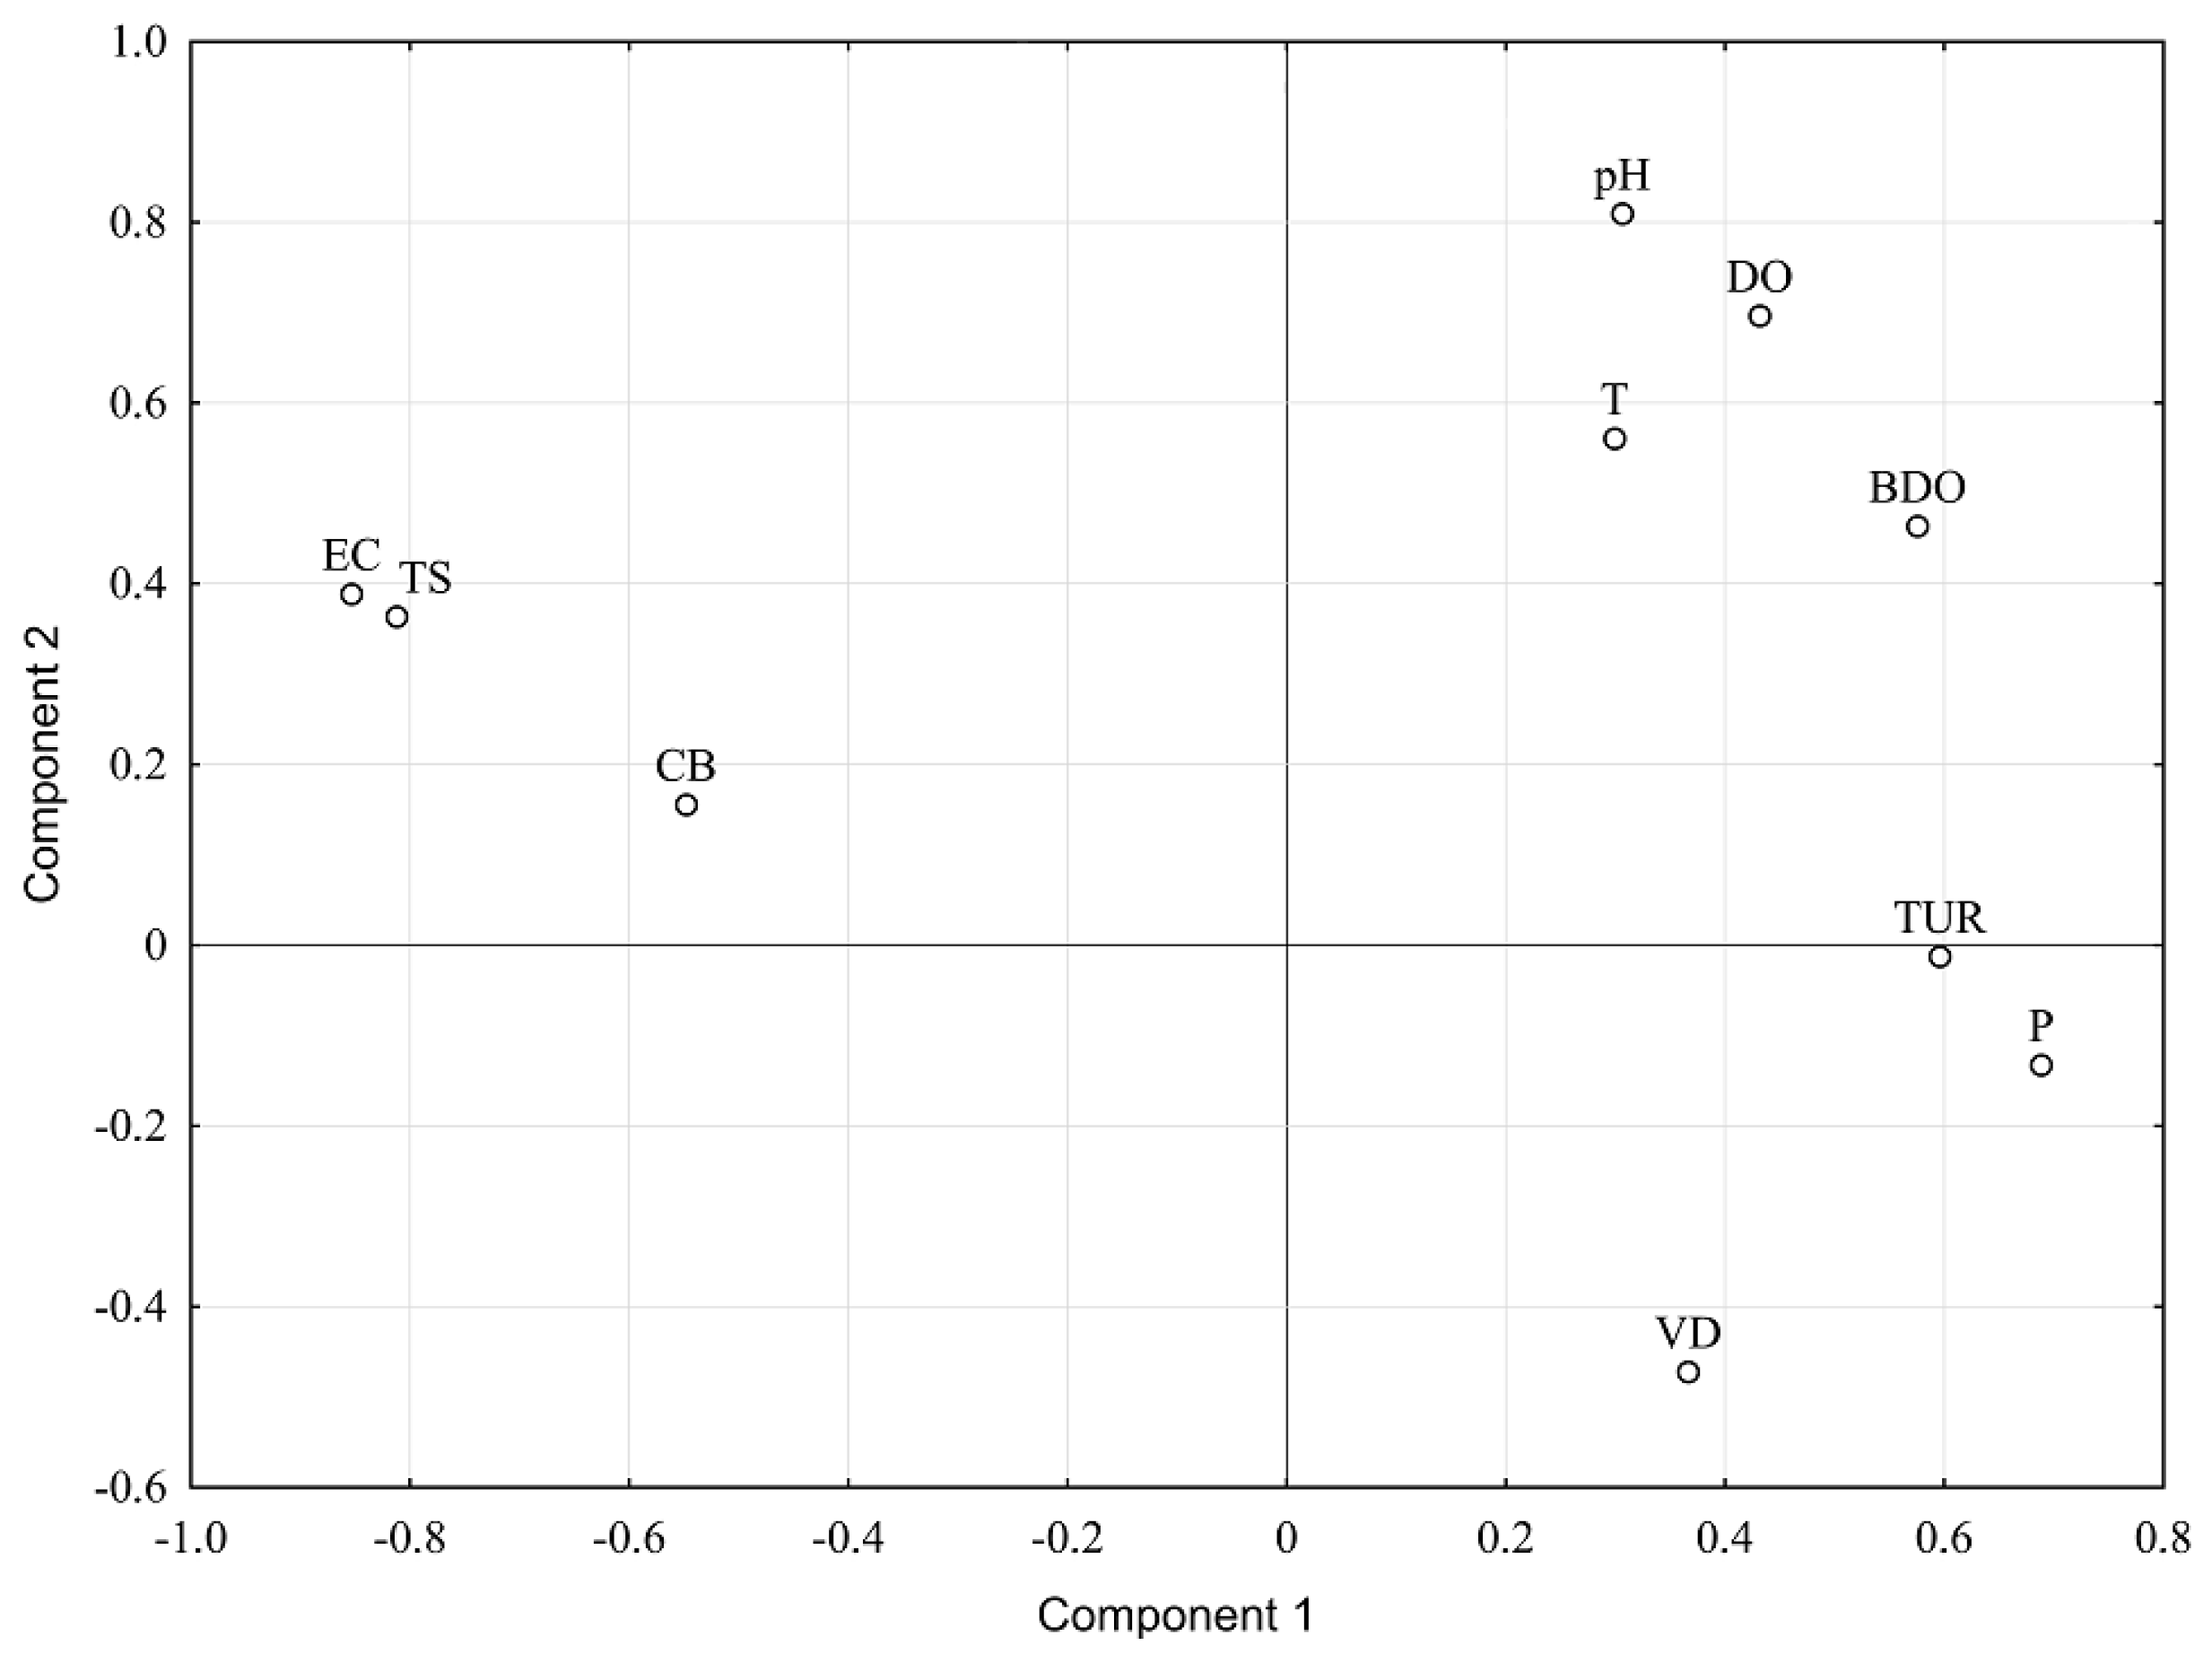
  • The employment of PCA promoted a reduction of 10 parameters of surface water quality in two components, which together explain 55% of total variance, illuminating the main problems that interfere in the temporal variation in water quality.
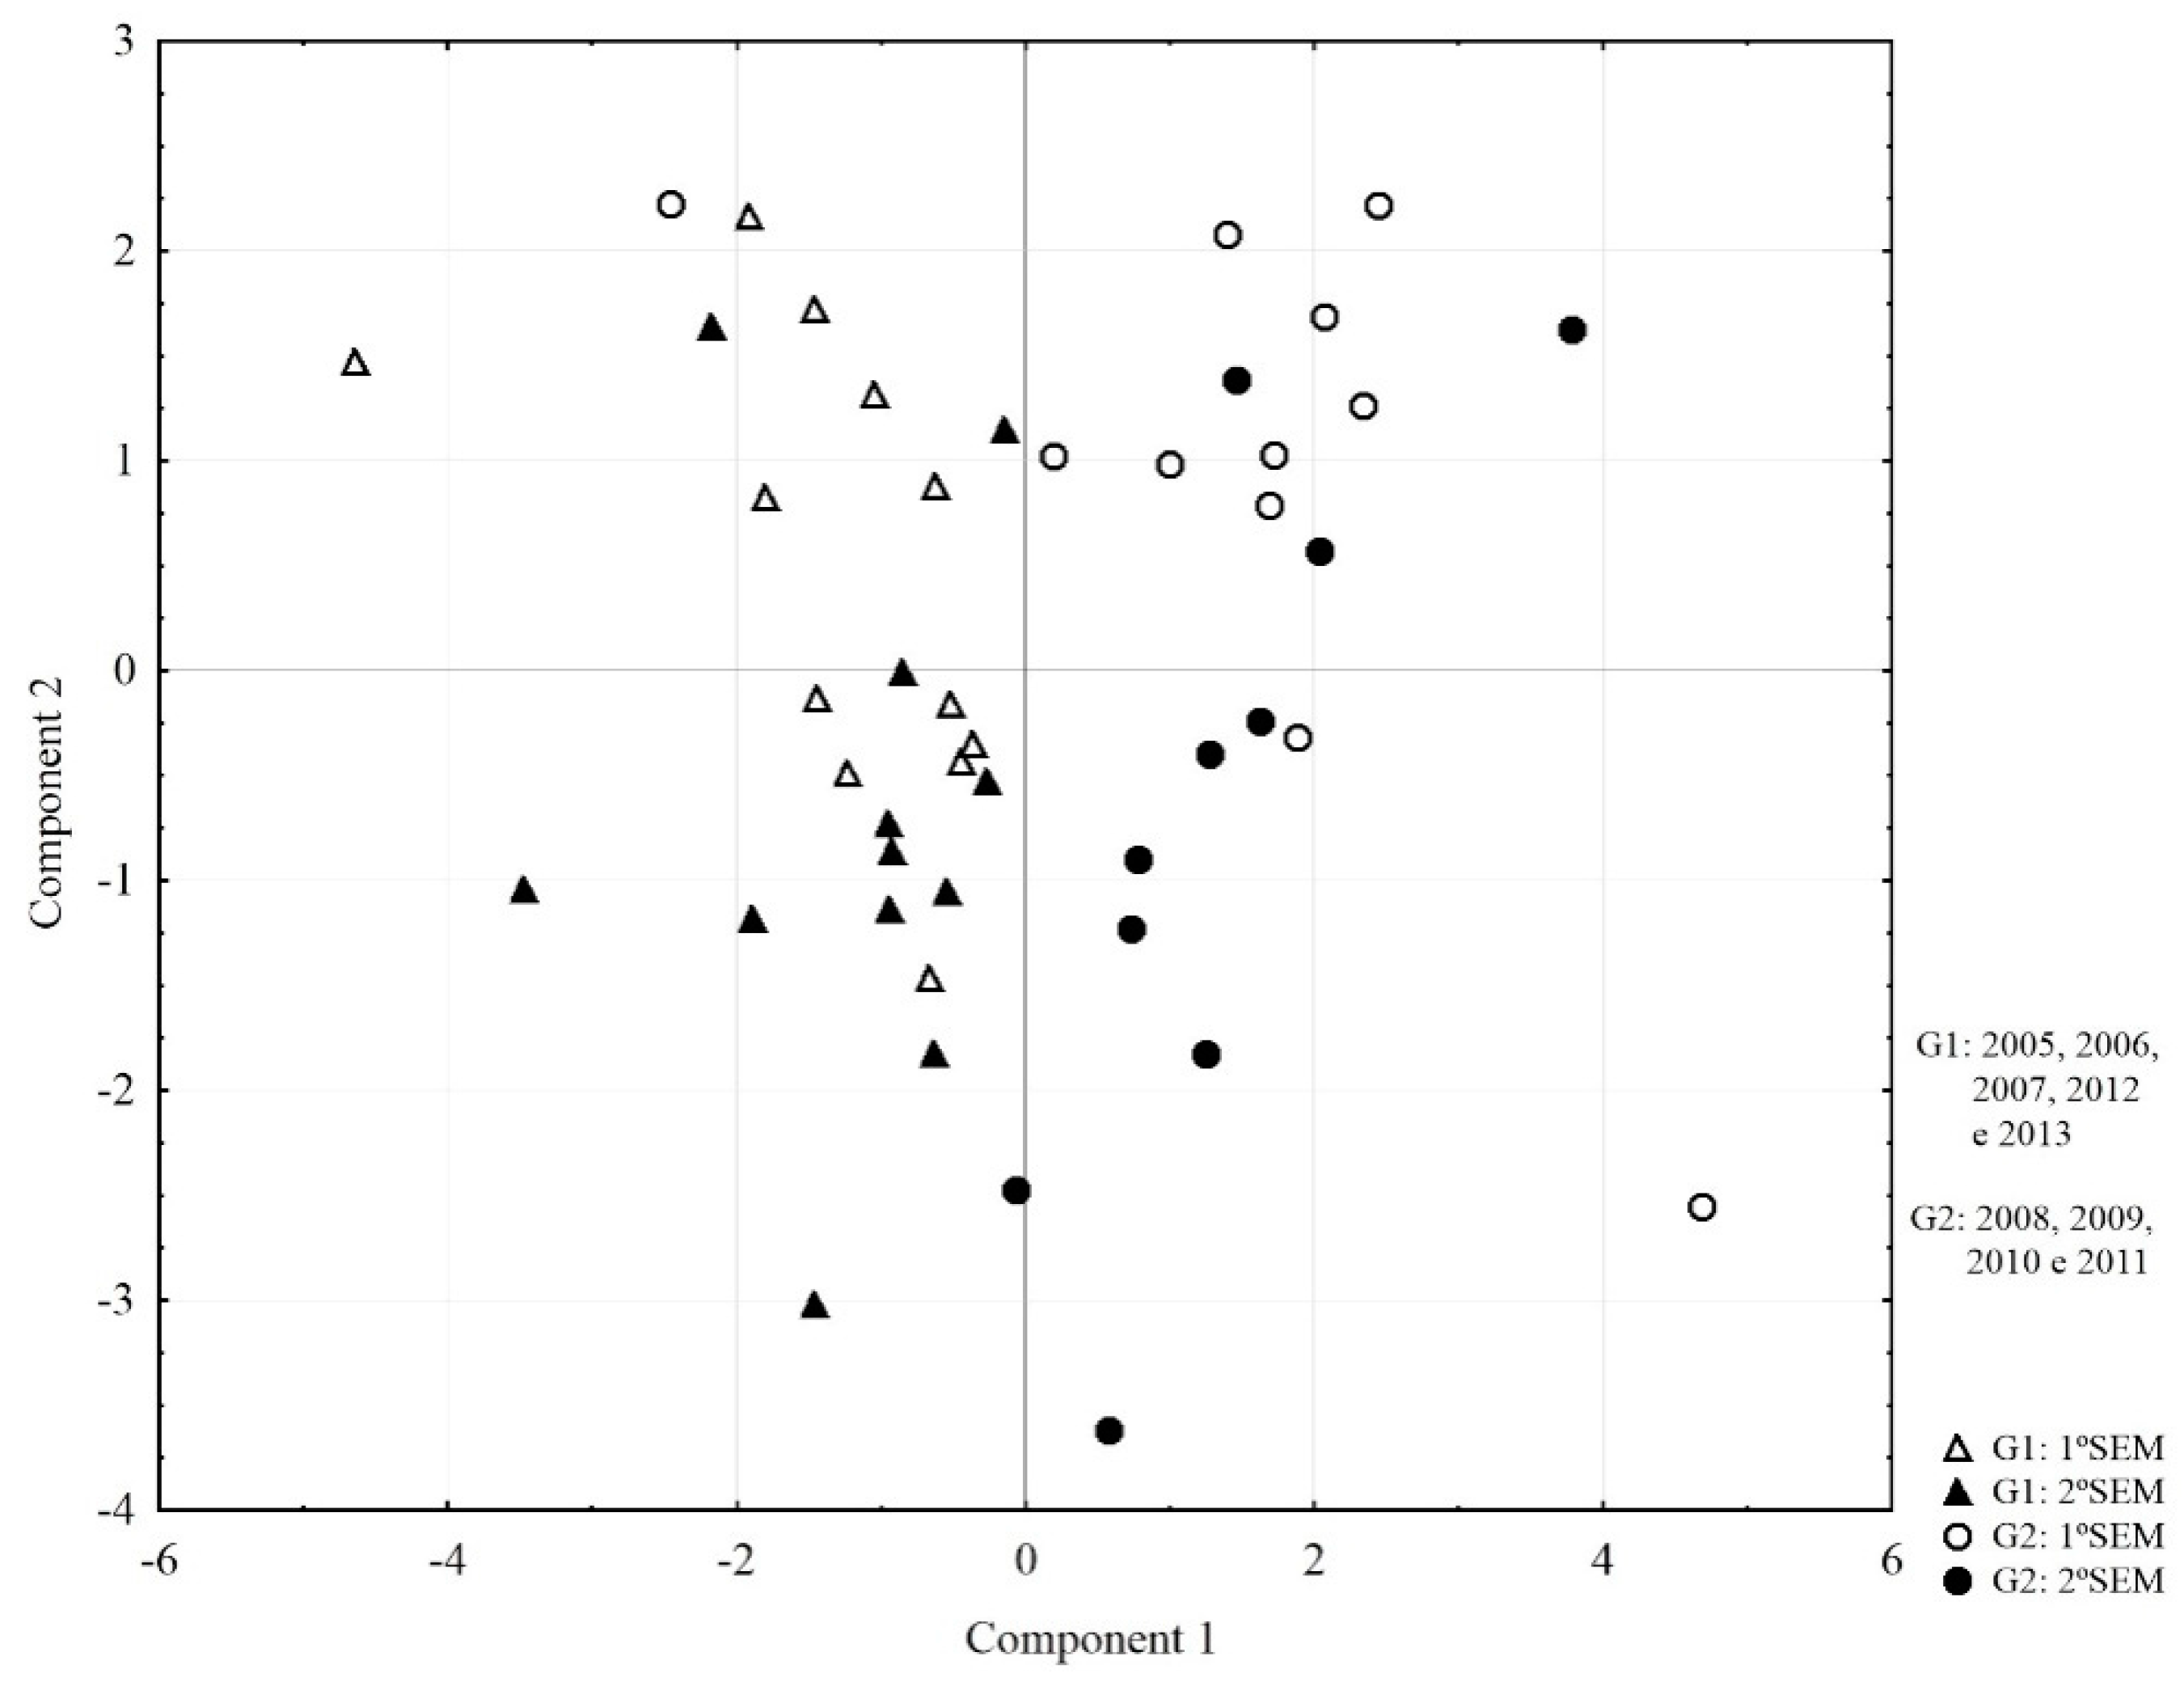
  • The results of PCA showed a tendency toward formation over years, and even over months, of similar water quality parameters, conditioned by rainfall, indicating, in general, the temporal variations of the parameters analyzed. The temporal pattern obtained by the analysis shows that two factors are responsible for the variation in water quality during periods of drought, one observed over many years and other observed every six months.
  • Wet years increase the inflow to the reservoir, so more domestic and industrial sewage is contributed, which in turn increases the turbidity and the content of phosphorus in the spring. On the other hand, years with little or no precipitation provide low inflow to the reservoir. In these conditions, there is an increase in total solids (dissolved salts) and, consequently, in electrical conductivity in view of the increase of the evaporation of the repressed water volume. An increase photosynthetic activity can also be seen, as is evidenced by the increase in the oxygen content in the water and in pH.
  • The research shows the importance of water quality monitoring, where adequate statistical treatment can provide subsidies for better monitoring to preserve water quality for public water supply. In extreme dry periods, the identification of annual and semi-annual variation behavior can assist managers in making decisions regarding reservoir operation, monitoring the most important parameters and actions that minimize the impact of this extreme drought.
  • The results of the study were relevant in the conduction of new methodologies for monitoring and management of the reservoir, since the applied statistical treatment shed light on the most recurrent problems of extreme drought, and these findings can be extended to other reservoirs located in the semi-arid of Northeastern Brazil.

Author Contributions

Rafael Roney Camara de Melo and Iona Maria Beltrão Rameh Barbosa conceived the idea of the paper, planned the statistical methodology and wrote the paper. Aida Araújo Ferreira, Alessandra Lee Barbosa Firmo, Simone Rosa da Silva, José Almir Cirilo and Ronaldo Ribeiro Barbosa de Aquino contributed writing and reviewing of papper.

Conflicts of Interest

The authors declare no conflict of interest.

References

  1. Barbosa, I.M.B.R.; Cirilo, J.A. Evolução do estado trófico do reservatório Jucazinho, Pernambuco. In Simpósio de Recursos Hidrícos do Nordeste, 1st ed.; [CD-ROM]; 11. 2012, Anais; ABRH: João Pessoa, Brazil, 2012. [Google Scholar]
  2. Bezerra, L.A.V.; Paulino, W.D.; Garcez, D.S.; Becker, H.; Sanchez-Botero, J.I. Limnological characteristics of a reservoir in semiarid Northeastern Brazil subjective to intensive tilapia farming (Orechromisniloticus Linnaeus, 1758). Acta Limnol. Bras. 2014, 26, 47–59. [Google Scholar] [CrossRef]
  3. Gunkel, G.; Lima, D.; Selge, F.; Sobral, M.; Calado, S. Aquatic ecosstem services of reservoirs in semi-arid áreas: Sustainability and reservoir management. River Basin Manag. 2015, 197, 187–200. [Google Scholar]
  4. Santos, A.C. Noções de Hidroquímica. In Hidrologia: Conceitos e Aplicações; Cprm/Labhid-Ufpe: Fortaleza, Brazil, 1997. [Google Scholar]
  5. Silva, A.P.C.; Costa, I.A.S. Biomonitoring ecological status of two reservoirs of the Brazilian semi-arid using phytoplankton assemblages (Q index). Acta Limnol. Bras. 2015, 27, 1–14. [Google Scholar] [CrossRef]
  6. Chapra, S.C. Surface Water-Quality Modeling; Waveland Press, Inc.: Long Grove, IL, USA, 2008; p. 844. [Google Scholar]
  7. Esteves, F.A. Fundamentos da Limnologia, 2nd ed.; Interciência: Rio de Janeiro, Brazil, 2011; 602p. [Google Scholar]
  8. Friese, K.; Schmidt, G.; Lena, J.C.; Nalini, H.A., Jr.; Zachmann, D.W. Anthropogenic influence on the degradation of na urban lake—The Pampulha reservoir in Belo Horizonte, Minas Gerais, Brazil. Limnologica 2010, 40, 114–125. [Google Scholar] [CrossRef]
  9. Reartes, S.B.R.; Estrada, V.; Bazan, R.; Larossa, N.; Cossavella, A.; Lopez, A.; Busso, F.; Diaz, M.S. Evaluation of ecological effects of anthropogenic nutrient loading scenarios in Los Molinos reservoir through a mathematical model. Ecol. Model. 2016, 320, 393–406. [Google Scholar] [CrossRef]
  10. Mcdonald, R.I.; Weber, K.F.; Padowski, J.; Boucher, T.; Shemie, D. Estimating watershed degradation over the last centur and its impacto n water-treatment costs for the world’s large cities. Proc. Natl. Acad. Sci. USA 2016, 113, 9117–9122. [Google Scholar] [CrossRef] [PubMed]
  11. Chow, C.W.K.; Drikas, M.; House, J.; Burch, M.D.; Velzeboer, R.M.A. The impact of conventional water treatment process on cells of the cyanobacteriumMicrocystisaeruginosa. Water Res. 1999, 33, 3253–3262. [Google Scholar] [CrossRef]
  12. Sawyer, C.N.; Maccarty, P.L.; Parkin, G.F. Chemistry for Environmental Engineering; McGraw-Hill Higher Education: New York, NY, USA, 2003; 752p. [Google Scholar]
  13. Bernardi, J.V.E.; Lacerda, L.D.; Dórea, J.G.; Landim, P.M.B.; Gomes, J.P.O.; Almeida, R.; Manzatto, A.G.; Bastos, W.R. Aplicação da análise das componentes principais na ordenação dos parâmetros físico-químicos no alto Rio Madeira e afluentes, Amazônia Ocidental. Geochim. Bras. 2009, 23, 1–158. [Google Scholar]
  14. Norusis, M.J. SPSS Base System User’s Guide; SPSS Inc.: Chicago, IL, USA, 1990; 520p. [Google Scholar]
  15. Hair, J.F., Jr.; Anderson, R.E.; Tatham, R.L. Análise Multivariada de Dados, 5th ed.; Bookman: Porto Alegre, Brazil, 2005. [Google Scholar]
  16. Parinet, B.; Lhote, A.; Legube, B. Principal componentanalysis: An appropriate tool for water quality evaluation andmanagement—Application a tropical lake system. Ecol. Model. 2004, 178, 295–311. [Google Scholar] [CrossRef]
  17. Liao, S.W.; Gau, H.S.; Lai, W.L.; Chen, J.J.; Lee, C.G. Identification of pollution of Tapeng Lagoon from neighbouring rivers using multivariate statistical method. J. Environ. Manag. 2008, 88, 286–292. [Google Scholar] [CrossRef] [PubMed]
  18. Singh, K.P.; Malik, A.; Mohan, D.; Sinha, S. Multivariate statistical techniques for the evaluation of spatial and temporal variations in water quality of Gomti River (India)—A case study. Water Res. 2004, 38, 3980–3992. [Google Scholar] [CrossRef] [PubMed]
  19. Departamento Nacional de Obras Contra as Secas-DNOCS, Ministério da Integração Nacional. Hidrologia do Reservatório de Jucazinho; Águasolos: Recife, Brazil, 1995; p. 59. [Google Scholar]
  20. Secretaria de Recursos Hídricos e Energéticos. ProjetecBRLi. Plano Hidroambiental da Bacia Hidrográfica do Rio do Capibaribe; TOMO I (vol 1, 2 e 3) e TOMO IV; SRHE: Recife, Brazil, 2010. [Google Scholar]
  21. Barbosa, I.B.R.; Cirilo, J.A. Contribuição média de fósforo em reservatório de abastecimento de água—Parte 1. Engenharia Sanitária e Ambiental 2015, 20, 39–46. [Google Scholar] [CrossRef]
  22. Frieder, C.A.; Nam, S.H.; Martz, T.R.; Levin, L.A. High temporal and spatial variability of dissolved oxygen and pH inanearshore California kelp forest. Biogeosciences 2012, 9, 3917–3930. [Google Scholar] [CrossRef]
  23. Andrade, E.M.D.; Araújo, L.D.F.; Rosa, M.F.; Disney, W.; Alves, A.B. Surface water quality indicators in low acaraú basin, Ceará, Brazil, using multivariable analysis. Engenharia Agrícola 2007, 27, 683–690. [Google Scholar] [CrossRef]
  24. Palácio, H.A.; Araújo Neto, J.R.; Meireles, A.; Andrade, E.M.; Santos, J.C.; Chaves, L.C. Similaridade e fatores determinantes na salinidade das águas superficiais do Ceará, por técnicas multivariadas. Revista Brasileira de Engenharia Agrícola e Ambiental 2011, 15, 395–402. [Google Scholar] [CrossRef]
  25. Helena, B.; Pardo, R.; Vega, M.; Barrado, E.; Fernandez, J.M.; Fernandez, L. Temporal evolution of groundwater composition in an alluvial aquifer (Pisuergariver, Spain) by principal component analysis. Water Res. 2000, 34, 807–816. [Google Scholar] [CrossRef]
  26. Ministério da Saúde. Dispõe Sobre os Procedimentos de Controle e de Vigilância da Qualidade da Água Para Consumo Humano e Seu Padrão de Potabilidade; Portaria No. 2914; Ministério da Saúde: Brasília, Brazil, 2011. Available online: http://bvsms.saude.gov.br/bvs/saudelegis/gm/2011/prt2914_12_12_2011.html (accessed on 12 July 2017).
  27. Luíz, Â.M.E.; Pinto, M.L.C.; Scheffer, E.W. Parâmetros de cor e turbidez como indicadores de impactos resultantes do uso do solo, na bacia hidrográfica do rio Taquaral, São Mateus do Sul-PR. Revista o Espaço Geográfico em Análise 2012, 290–310. [Google Scholar] [CrossRef]
  28. Zhang, X.; Wang, Q.; Liu, Y.; Wu, J.; Yu, M. Application of multivariate statistical techniques in the assessment of water quality in the Southwest New Territories and Kowloon, Hong Kong. Environ. Monit. Assess. 2010, 137, 17–27. [Google Scholar] [CrossRef] [PubMed]
  29. Girão, E.G.; De Andrade, E.M.; de Freitas Rosa, M.; Pereira de Araújo, L.D.F.; Maia Meireles, A.C. Seleção dos indicadores da qualidade de água no Rio Jaibaras pelo emprego da análise da componente principal. Revista Ciência Agronômica 2007, 38, 17–24. [Google Scholar]
  30. Palácio, H.A.Q. Índice de Qualidade das Águas na Parte Baixa da Bacia Hidrográfica do Rio Trussu, Ceará. Master’s Thesis, Universidade Federal do Ceará, Ceará, Brazil, 2004; 96p. [Google Scholar]
  31. Ministério de Minas e Energia. Diagnóstico do Município de Santa Cruz do Capibaribe; Ministério de Minas e Energia: Recife, Brazil, 2005. Available online: http://rigeo.cprm.gov.br/xmlui/bitstream/handle/doc/16692/Rel_Santa%20Cruz%20do%20Capibaribe.pdf?sequence=1 (accessed on 12 July 2017).
  32. Aragão, N.K.C.V. Taxonomia, Distribuição e Quantificação de Populações de Cianobactérias em Reservatórios do Estado de Pernambuco (Nordeste do Brasil). Master’s Thesis, Departamento deBiologia, Universidade Federal Rural de Pernambuco, Recife, Brazil, 2011; 157p. [Google Scholar]
  33. Fernandes, V.O.; Cavati, B.; de Oliveira, L.B.; de Souza, B.D.Â. Ecologia de cianobactérias: Fatores promotores e conseqüências das florações. Oecol. Bras. 2009, 13, 247–258. [Google Scholar] [CrossRef]
  34. Santos, J.C.N.; Andrade, E.M.; Araujo Neto, J.R.; Meireles, A.C.M.; Palacio, H.A.Q. Land use and trophic state dynamics in a tropical semi-arid reservoir. Revista Ciência Agronômica 2014, 45, 35–44. [Google Scholar] [CrossRef]
  35. Ferraz, H.D.A. Associação da Ocorrência de Cianobactérias às Variações de Parâmetros de Qualidade da Água em Quatro Bacias Hidrográficas de Minas Gerais. Ph.D. Thesis, Mestrado em Saneamento, Meio Ambiente e Recursos Hídricos, Universidade Federal de Minas Gerais-Escola de Engenharia, Minas Gerais, Brazil, 2012. [Google Scholar]
  36. Umetsu, C.A.; Umetsu, R.K.; Munhoz, K.C.A.; Dalmagro, H.J.; Krusche, A.V. Aspectos físico-químicos de dois rios da bacia do Alto Tapajós—Teles Pires e Cristalino—MT, durante período de estiagem e cheia. Revista de Ciências Agro-Ambientais 2007, 5, 59–70. [Google Scholar]
Figure 1. Location of the Capibaribe river basin and the area of water contribution of the Jucazinho reservoir.
Water 09 00955 g001
Figure 2. The variation in accumulated volume in Jucazinho in the period from 2005 to 2011. Source: [8].
Water 09 00955 g002
Figure 3. Weights of principal components plotted on the PC1 × PC2 plane.
Water 09 00955 g003
Figure 4. Scores of components plotted on the PC1 × PC2 plane.
Water 09 00955 g004
Table 1. Descriptive statistical values of the variables.
VariableMeanStandard DeviationVarianceCoefficient of Variation
CB (cell mL−1)3.81 × 1071.38 × 1071.90 × 1073.62
TUR (UNT)5.454.3619.010.80
BDO (mg L−1)3.262.034.110.62
P (mg L−1)0.250.090.010.38
DO (mg L−1)6.852.054.210.30
TS (mg L−1)1084.16172.8029,859.410.16
VD (%)88.1313.52182.740.15
EC (dSm−1)1.6800.2320.0540.14
pH8.370.620.380.07
T (°C)27.661.231.520.04
Table 2. Correlation matrix of the variables.
TpHECDOBDOPTURTSCBVD
T1.000
pH0.3621.000
EC−0.0780.0551.000
DO0.3830.700−0.1551.000
BDO0.2790.500−0.2620.4271.000
P−0.0380.081−0.5370.0990.4491.000
TUR0.3090.088−0.5100.1560.0990.3951.000
TS−0.1140.0240.839−0.082−0.293−0.455−0.4351.000
CB0.000−0.0360.421−0.141−0.195−0.375−0.2200.3901.000
VD−0.137−0.107−0.5370.009−0.0110.097−0.061−0.483−0.1051.000
Note: Temperature (T) in °C hydrogen potential (pH), electrical conductivity (EC) in dS m−1, dissolved oxygen (DO) in mg·L−1, Biochemical Demand for Oxygen (BDO) in mg·L−1, total phosphorus (P) in mg·L−1, turbidity (TUR) in UNT, total solids (TS) in mg·L−1, cyanobacteria (CB) in cel·mL−1, and volume of the dam (VD) in %.
Table 3. Eigenvalues and explained variance of the variables.
ComponentsEigenvaluesExplained Variance (%)Accumulated EingenvaluesAccumulated Explained Variance (%)
PC13.3533.523.3533.52
PC22.2222.185.5755.70
PC31.1211.236.6966.93
PC41.0210.227.7277.15
PC50.737.328.4584.47
PC60.595.889.0490.35
PC70.343.389.3793.73
PC80.292.869.6696.59
PC90.232.269.8998.86
PC100.111.1410.00100.00
Table 4. Weights of the variables for PC1 and PC2.
ComponentsPC 1PC 2
T0.2990.561
pH0.3060.81
EC−0.8530.389
DO0.4320.696
BDO0.5760.464
P0.688−0.133
TUR0.596−0.012
TS−0.8120.364
CB−0.5480.155
VD0.366−0.472

