Contrasting Two Dimensions of Disaster-Induced Water-Shortage Experiences: Water Availability and Access


1
Faculty of Environmental Engineering, The University of Kitakyushu, 1-1 Hibikino, Wakamatsu-ku, Kitakyushu, Fukuoka 808-0135, Japan
2
Research Institute for Humanity and Nature, 457-4 Kamigamo-motoyama, Kita-ku, Kyoto 603-8047, Japan
*
Author to whom correspondence should be addressed.
Water 2017, 9(12), 982; https://doi.org/10.3390/w9120982
Submission received: 29 October 2017
/
Revised: 5 December 2017
/
Accepted: 12 December 2017
/
Published: 16 December 2017
Abstract
:The value of a good is contingent on an individual’s experience that reveals the nature of the good. This study investigates the effects of a water shortage due to the Great East Japan Earthquake and Tsunami Disaster in 2011 on the voluntary management of community wells in the water-rich town of Otsuchi, Japan. A questionnaire survey based on a choice experiment (CE) framework was conducted in 2015 in which a total of 127 residents participated. The responses were then analyzed using two types of logit models that consider preference heterogeneity across survey participants. The results revealed that the severity and duration of the water shortage had opposing effects on people’s attitudes toward the wells. More specifically, increasingly severe water shortages due to the unavailability of water rendered people less supportive of the wells, whereas water shortages of a longer duration caused by limited access to water resources made people more supportive.
1. Introduction
Centralized water supply systems are considered vulnerable to natural and man-made hazards [1]. Decentralized water sources such as community wells can help with water supply during the downtime of centralized water systems. For instance, natural springs and wells were important alternative water sources during many occasions in the aftermath of the Great East Japan Earthquake and Tsunami in 2011. Maintaining decentralized water systems warrants participation by local individuals and communities. To improve water security through the installation of decentralized water systems, policymakers need information on people’s preferences regarding decentralized water systems and their willingness to manage such facilities. In developed countries, however, the literature on people’s preferences for decentralized water systems is limited [2,3]. In addition, the existing literature features water-scarce areas or reclaimed and rainwater as main water resources [2,3]. By contrast, this study investigates people’s preferences regarding community wells and willingness to manage them as an alternative water source in the water-rich town of Otsuchi, Japan. Otsuchi’s residents experienced a severe, albeit temporary, water shortage owing to the breakdown of the town’s centralized water system as a result of the Great East Japan Earthquake.
This study highlights the importance of considering water-shortage experiences from two viewpoints—availability of water and access to water—in order to understand the impact of these experiences on the creation of needs for community wells as alternative water sources. Both criteria are used to identify the status of water security at a collective level. UN-Water [4] defines water security as the “capacity of a population to safeguard sustainable access to adequate quantities of acceptable quality water for sustaining livelihoods, human well-being, and socio-economic development, for ensuring protection against water-borne pollution and water-related disasters, and for preserving ecosystems in a climate of peace and political stability.” Availability is the amount of overall water supply to an area relative to its demand. Access refers to equality in water distribution among individuals. The availability of sufficient water in an area does not guarantee water access by each individual, as has been shown in Nepal [5]. UN-Water [6] summarizes statistics for the availability of surface water and access to clean water. The water poverty index considers availability of water and access to water [7], which thus far, have been used as criteria in discussions on water security as a collective status of an area. Studies have considered individual experience, knowledge, and assessment of severity in the context of draughts as drivers of water conservation [8,9]; however, inequality of water access in the case of a drought is yet to be explicitly addressed. Jorgensen et al. [10], for instance, included fairness in decision-making processes, water restrictions, and tariffs as a potential driver of water-saving behavior, although these factors do not play a significant role in their integrated model of water consumption. The present analysis shows that distinguishing water-shortage experiences by the dimensions of availability of and access to water is beneficial to understanding the impacts of water shortage on people’s perception of countermeasures.
Otsuchi, the study site, has rich surface and groundwater resources and has not reported droughts as a factor threatening water use [11], except on the rare occasion of a large-scale disaster. Otsuchi suffered severe damage when it was struck by the 2011 tsunami [12]. Figure 1 depicts the location of Otsuchi, Japan. Of Otsuchi’s population of 15,000 at the time of the earthquake, 1285 were pronounced dead or missing. The tsunami critically damaged 4375 coastal houses, and the central area of Otsuchi almost vanished. Socioeconomic living conditions after the tsunami were harsh for many of the survivors, who were evacuated to temporary shelters for months. The town’s network of tap water was destroyed and it took nearly two months to re-establish the water supply to the shelters and houses that remained. Furthermore, the road damage around Otsuchi made it increasingly difficult to receive external logistical support for the 3–4 days following the tsunami. During this time, the residents had to find and share drinking water and food. Thus, this study focuses on natural water sources, including groundwater and upstream surface water, which were critical to the human security of Otsuchi’s communities during the post-tsunami period.
Otsuchi is currently undergoing reconstruction. Prior to the tsunami, the central area of the coastal town, Machikata, had numerous flowing wells. Flowing wells do not need to be pumped to provide water; instead, naturally pressurized groundwater spouts from the wells. Most of the flowing wells in Machikata were privately owned and used by households. To prevent future tsunami hazards, the current reconstruction in Machikata will raise the ground level by an average of 2.2 m [13], which unfortunately will render flowing wells extinct. One alternative is to build a community flowing well whose lower ground level is maintained. Policymakers have been seeking information on people’s needs for community flowing wells and the levels of contribution people could provide toward maintaining them. Given the difficulty of acquiring adequate human resources in an aging society, local participation is an important factor in sustaining the wells [14]. Thus, the present situation in Otsuchi provides a unique opportunity to investigate the need for new alternative sources of water in a water-rich area.
This study aims to answer three research questions: Is there a need for alternative community wells in the water-rich town of Otsuchi, Japan? What are the drivers strengthening the need for wells? Are the local people willing to participate in the maintenance of the wells? In addition to other possible drivers, this study explicitly considers two dimensions of a water-shortage experience.
2. Materials and Methods
2.1. Analytical Framework and Indices of Water Shortage
Research on factors affecting people’s perception and behavior regarding water management employ two frameworks. One group uses psychological models that often adopt a multi-level structure to consider both the direct and indirect factors influencing perception and behavior [9,10]. The other group implements environmental economics approaches and focuses on factors directly affecting choice situations regarding water-management policies. Among these methods, a choice experiment (CE) can explicitly consider various attributes of water-management policies, including hypothetical ones, and characteristics of an individual who makes necessary choices. This study employs a CE approach because it focuses on the direct impact of water-shortage experiences on the choice of different configurations of community-well management schemes that were yet to be realized. Within the water-management literature, CE has often been applied to the evaluation of improvements in the water quality of rivers and lakes because such investigations require the comparisons of various water-quality situations, including those hypothetically defined [15,16]. Hensher et al. [17] conducted a CE in Canberra, Australia, and analyzed households’ responses to avoid water restrictions caused by a drought. CE has also been used in disaster-recovery studies [18]. This study demonstrates a new example of CE application to the examination of alternative water resources following a large-scale disaster.
Two indicators were designed to measure the levels of unavailability and inaccessibility of water during the five weeks after the tsunami: water usage forgone, and duration of water shortage. Water usage forgone is measured as the maximum number of activities including cooking, laundry, and bathing that the respondent had to give up during the five weeks. As will be shown later, the highest number of forgone activities was reported for the first week after the tsunami, when the number of evacuees peaked at more than 7400 [19]. On 11 March 2011, the tap-water network ceased to operate because of the power outage and damage to water-supply facilities caused by the tsunami. According to the report by one of the largest evacuation shelters in Otsuchi, an organized supply of emergency water was initiated on 16 March 2011 [20]. Thus, it is highly likely that the respondents were unable to perform a large number of water-consuming activities during the first week because of the overall unavailability of water in their area. The duration of the water shortage is measured as the number of weeks during which the respondents were unable to use water for cooking, laundry or bathing. A longer duration of water shortage for a household is assumed to be a problem of individual accessibility to the water system. For example, given that temporary bathing facilities were made available in the area within two weeks after the tsunami [21], insufficient water to bathe even five weeks later was likely due to the transportation problem and not a water shortage.
2.2. Survey
A mall-intercept survey was conducted at the Mast Shopping Center, Otsuchi, during 17–19 August 2015. The survey was administered under the difficult conditions of the aftermath of the large disaster. Given the temporary relocation of numerous tsunami-affected households, random sampling of citizens from the town’s official resident list was not possible. Following a comparison of the mall-intercept and area-sampling methods, the former was employed. This was done particularly because of the town hall officials’ request to avoid additional disturbances to the survivors through house visits. The shopping center hosts the largest supermarket in the town and various other shops. It serves as the hub of the local bus network to enable residents who do not have a car to come here for everyday shopping. Thus, this is an appropriate place to conduct a survey of a cross-section of the regional population. The number of questions asked per person was limited in order to maximize the number of passers by surveyed at the shopping center. Prior to conducting the main survey, seven local residents with different occupations were consulted about the questionnaire content to clarify questions and eliminate expressions that could distress the disaster survivors. The question regarding income was excluded during this process.
Flyers were distributed to customers at the main entrance of the shopping center, who were then asked to participate in the survey, which targeted people of high-school age or older. A total of 127 respondents participated in the survey. According to the shopping-mall manager, approximately 2500 customers, including children, visit the shopping center every day on average.
The questionnaire comprised four sections. The first section consisted of questions on water use before the 2011 tsunami and in the following five weeks. The second section asked questions about respondents’ knowledge and ideas about the diversification of water resources in Otsuchi. The third section listed four CE questions on voluntary participation in the management of a shared well. The fourth section focused on personal demographic attributes.
2.3. Choice Experiment
The CE in this study presented respondents with a hypothetical scenario of setting up a shared well. The CE section of the questionnaire specified that the shared well used either groundwater or upstream water so that all Otsuchi residents—including those living in an area without easy access to groundwater—could answer the questions. Three attributes of the well were considered: distance from respondents’ household to the well, annual fee per household for well maintenance, and frequency of each household’s rotation in well cleaning. Each attribute was further divided into levels: 10 m, 50 m, and 100 m for distance; no fee, 100 yen, 500 yen and 1000 yen for annual maintenance fee per household; and no obligation, monthly, and weekly for cleaning rotation. Each question presented three alternatives of the shared well: two were management alternatives and the remaining stated “There is no need for a well.” The clarity of the meaning and visual arrangement of these attributes and levels were verified by the seven Otsuchi residents in the pre-survey. Figure 2 depicts the four sets of sample questions used in the questionnaire, which were translated to English for the purpose of this study.
Management alternatives comprise a combination of the aforementioned attribute levels. These combinations were produced by “the orthogonal optimal in the difference fractional factorial design” using the Ngene software package (ChoiceMetrics, Sydney, Australia). This design prevents attributes common across alternatives from assuming the same level during the experiment while maintaining orthogonality among the main effects [22]. The design produced 36 questions. Next, questions in which a management alternative showed a shorter distance, cheaper cost, and less frequent cleaning duty than the other management alternative were eliminated. These are considered less effective questions because there are presumably no trade-offs across the attributes among such management alternatives. Subsequently, the number of questions was reduced to 28. Asking a single respondent all 28 questions could cause fatigue and inaccuracy; therefore, we divided the questions into seven groups. Each respondent was randomly presented with one of the seven groups of questions. This approach of dividing a large number of CE question into several groups (blocks) is in line with the recommendation by the literature [23]. Figure 2 presents one of the grouped question sets.
We used two statistical models to analyze the results of the choice experiment. Given the small sample size, we first used a simple model, which does not need complex estimation procedures, to examine the outline of our research questions. Here, water-shortage experience in terms of availability and accessibility issues were considered. For this purpose, we used the alternative-specific conditional logit model. Then, we used a more flexible, but calculation-heavy mixed logit model that considered the panel structure of the dataset and unknown heterogeneity of the preferences.
Equation (1) defines the utility that respondent i (i = 1, …, I) would obtain by choosing management alternative j (j = 1, 2) at question repetition t (t = 1, …, 4).
The utility of choosing the third alternative, “No need for a well” (Ui3t), is set as the baseline for the utility comparison of the alternatives and thus, Ui3t does not include variables other than the error term:
x1ijt and x2ijt denote the annual maintenance fee per household and distance from the respondent’s household to the well. Since the cleaning rotation attribute has categorical levels, two dummy variables were used to describe the utility difference in relation to the “no obligation” level: x3ijt equals 1 if the alternative requires weekly participation in the well cleaning, and 0 otherwise, and x4ijt equals 1 if the alternative requires monthly participation in cleaning work, and 0 otherwise. The coefficients of the model are described by β1i through β5i. In particular, β5i denotes the utility of the state with a neighborhood shared well that requires no maintenance fees or clearing work relative to the state of having no well at all. Error term εijt is independently and identically distributed according to the Gumbel distribution.
For the simple model, all the coefficients are assumed to be same across individuals. Thus, the coefficients become β1 to β5 and take fixed values. To consider the impact of water shortage experience on the preference for the shared well, β5 is decomposed as indicated by Equation (3). Here, z2i denotes the amount of water usage forgone and z3i denotes the duration of water shortage for individual i. δ1 to δ3 are the coefficients. This model was estimated using a maximum likelihood method with an asclogit command in the Stata 13 software.
For the mixed logit model, to accommodate the unknown heterogeneity of preferences among respondents, β1i is assumed to be log normal distributed in the population, while β2i to β5i has a multivariate normal distribution. These distributions were assumed to be independent of each other. This model was estimated using a simulated maximum likelihood method [24] with a mixlogit command in the Stata 13 software.
2.4. Regression Analysis of Individual-Level Coefficients
To identify factors of heterogeneity across respondents’ preferences for a shared well and willingness to participate in its maintenance, individual-level coefficients from the mixed logit model were estimated and then, regressed to a variety of explanatory variables. Linear combinations of the explanatory variables were considered. Several studies in the literature have applied the two-stage procedure to identify factors of preference heterogeneity using a mixed logit model and linear regression [25]. Table 1 lists the explanatory variables considered as potential factors affecting the management of a shared well. These variables are grouped according to water-shortage indices, water-use experience before and after the 2011 tsunami, perception of natural water, and personal demographic attributes. Since respondents who experienced water shortage both in terms of water usage forgone and duration might have differing views on shared wells from those of other respondents, the cross-product of the two indices was considered a variable. There is a correlation of ρ = 0.62 between water usage forgone and duration of water shortage. However, it is not considered that this degree of correlation causes multicollinearity in the estimation models. The variables of water-use experience distinguish two levels of life-sustaining water use: “drinking and cooking” and others. Machikata in Otsuchi enjoyed easy access to groundwater before the 2011 tsunami; therefore, whether respondents were residents of Machikata before the tsunami is considered a personal demographic attribute. “Voluntary activity” denotes the number of community activities (e.g., neighborhood association, parent–teacher association, and volunteer fire department) in which the respondent participated regularly.
3. Results
3.1. Summary Statistics
Of the 127 respondents, 40.2% were male (Table 2). The average age of the sample was 58.6 years (Table 3). This average reflected that a majority of the respondents were elderly and 60.8% were 60 years or older. This share of elderly respondents was likely to be larger than the total population share of the town; this is because the town’s estimated share of individuals aged 65 years and above among those of high-school age and over was 37.6% in 2015 ([26], p. 3). Of the respondents, 77.9% lived in Otsuchi when the 2011 tsunami disaster occurred (Table 2). At the time, the remaining respondents lived in nearby communities in Kamaishi and other locations. Among the pre-tsunami residents of Otsuchi, 31.6% were from Machikata, where many households used groundwater in addition to tap water. This share is marginally larger than the 24.6% reported in the 2010 census ([26], p. 17).
3.2. Water Usage before and after Tsunami
Figure 3 illustrates Otsuchi residents’ sources of water before the tsunami. A total of 95 respondents fell within this category. The most common water source was tap water: approximately 80% of the respondents used it for drinking, cooking, laundry, and bathing. As for groundwater, 28.4% used it more often for drinking and cooking than laundry or bathing. Upstream water was used by a small fraction of people. A total of 33.7% respondents used groundwater or upstream water (hereinafter natural water) for drinking. This fraction increases to 42.1% if all purposes are considered. In Machikata, where groundwater was easily accessible, 46.7% used natural water for these purposes.
Figure 4 depicts the water resources used by Otsuchi residents in the sample during the first week after the tsunami on 11 March 2011. Water resources are identified on the basis of the respondents’ knowledge. Therefore, it is possible that “water at shelter” referred to water taken by someone else from a nearby spring to the shelter. The tap-water system resumed normal operation by the end of May 2011. Until then, people relied on natural and emergency water. For drinking water, 23.2% used groundwater and 27.4% used upstream water; this behavior sharply contrasted with pre-tsunami behavior, in which a small fraction of the respondents used upstream water. A total of 47.4% of Otsuchi residents used natural water for drinking during the week after the tsunami and this percentage increases to 57.9% if purposes other than drinking are considered. Another important source of post-tsunami water was emergency water supplied by the Japan Self-Defense Forces and other organizations. Such emergency water was used mainly for drinking and cooking. Water sources categorized as “Others” in Figure 4 include water that remains in the tap-water network and rain water. During the first week, 17.9%, 29.5%, and 35.8% of residents were unable to use water to prepare food, wash their clothes, and bathe, respectively.
Figure 5 presents water resources used by the same Otsuchi residents between the second and fifth weeks after the tsunami. Emergency water played a major role in drinking and cooking. Many answers categorized as “Others” in Figure 5 are tap water in the areas where the tap-water system has been partially recovered. Emergency and tap water replaced natural water resources for drinking and cooking. Natural water continued to serve as an important post-tsunami resource for laundry and bathing.
As for water use forgone, 23.2%, 13.7% and 12.6% of respondents answered that they had forgone one, two, and three activities, respectively. The forgoing of three activities occurred only during the first week after the tsunami, except for two respondents. Because the supply of life-sustaining goods from outside of Otsuchi was insufficient during the first week after the tsunami, this result supports the assumption that water use forgone is an indicator of the severity of water shortage in the respondents’ area of residence. The remaining 50.5% did not forgo any water usage.
In terms of duration of water shortage, 31.6% experienced shortage during the first week after the tsunami and 14.7% continuously experienced it during the five weeks. Over time and with the establishment of emergency water-supply services, respondents’ water shortages became a problem of individual access to these services, rather than an overall water shortage in the area.
3.3. Needs for Community Wells and Willingness to Participate in Maintenance
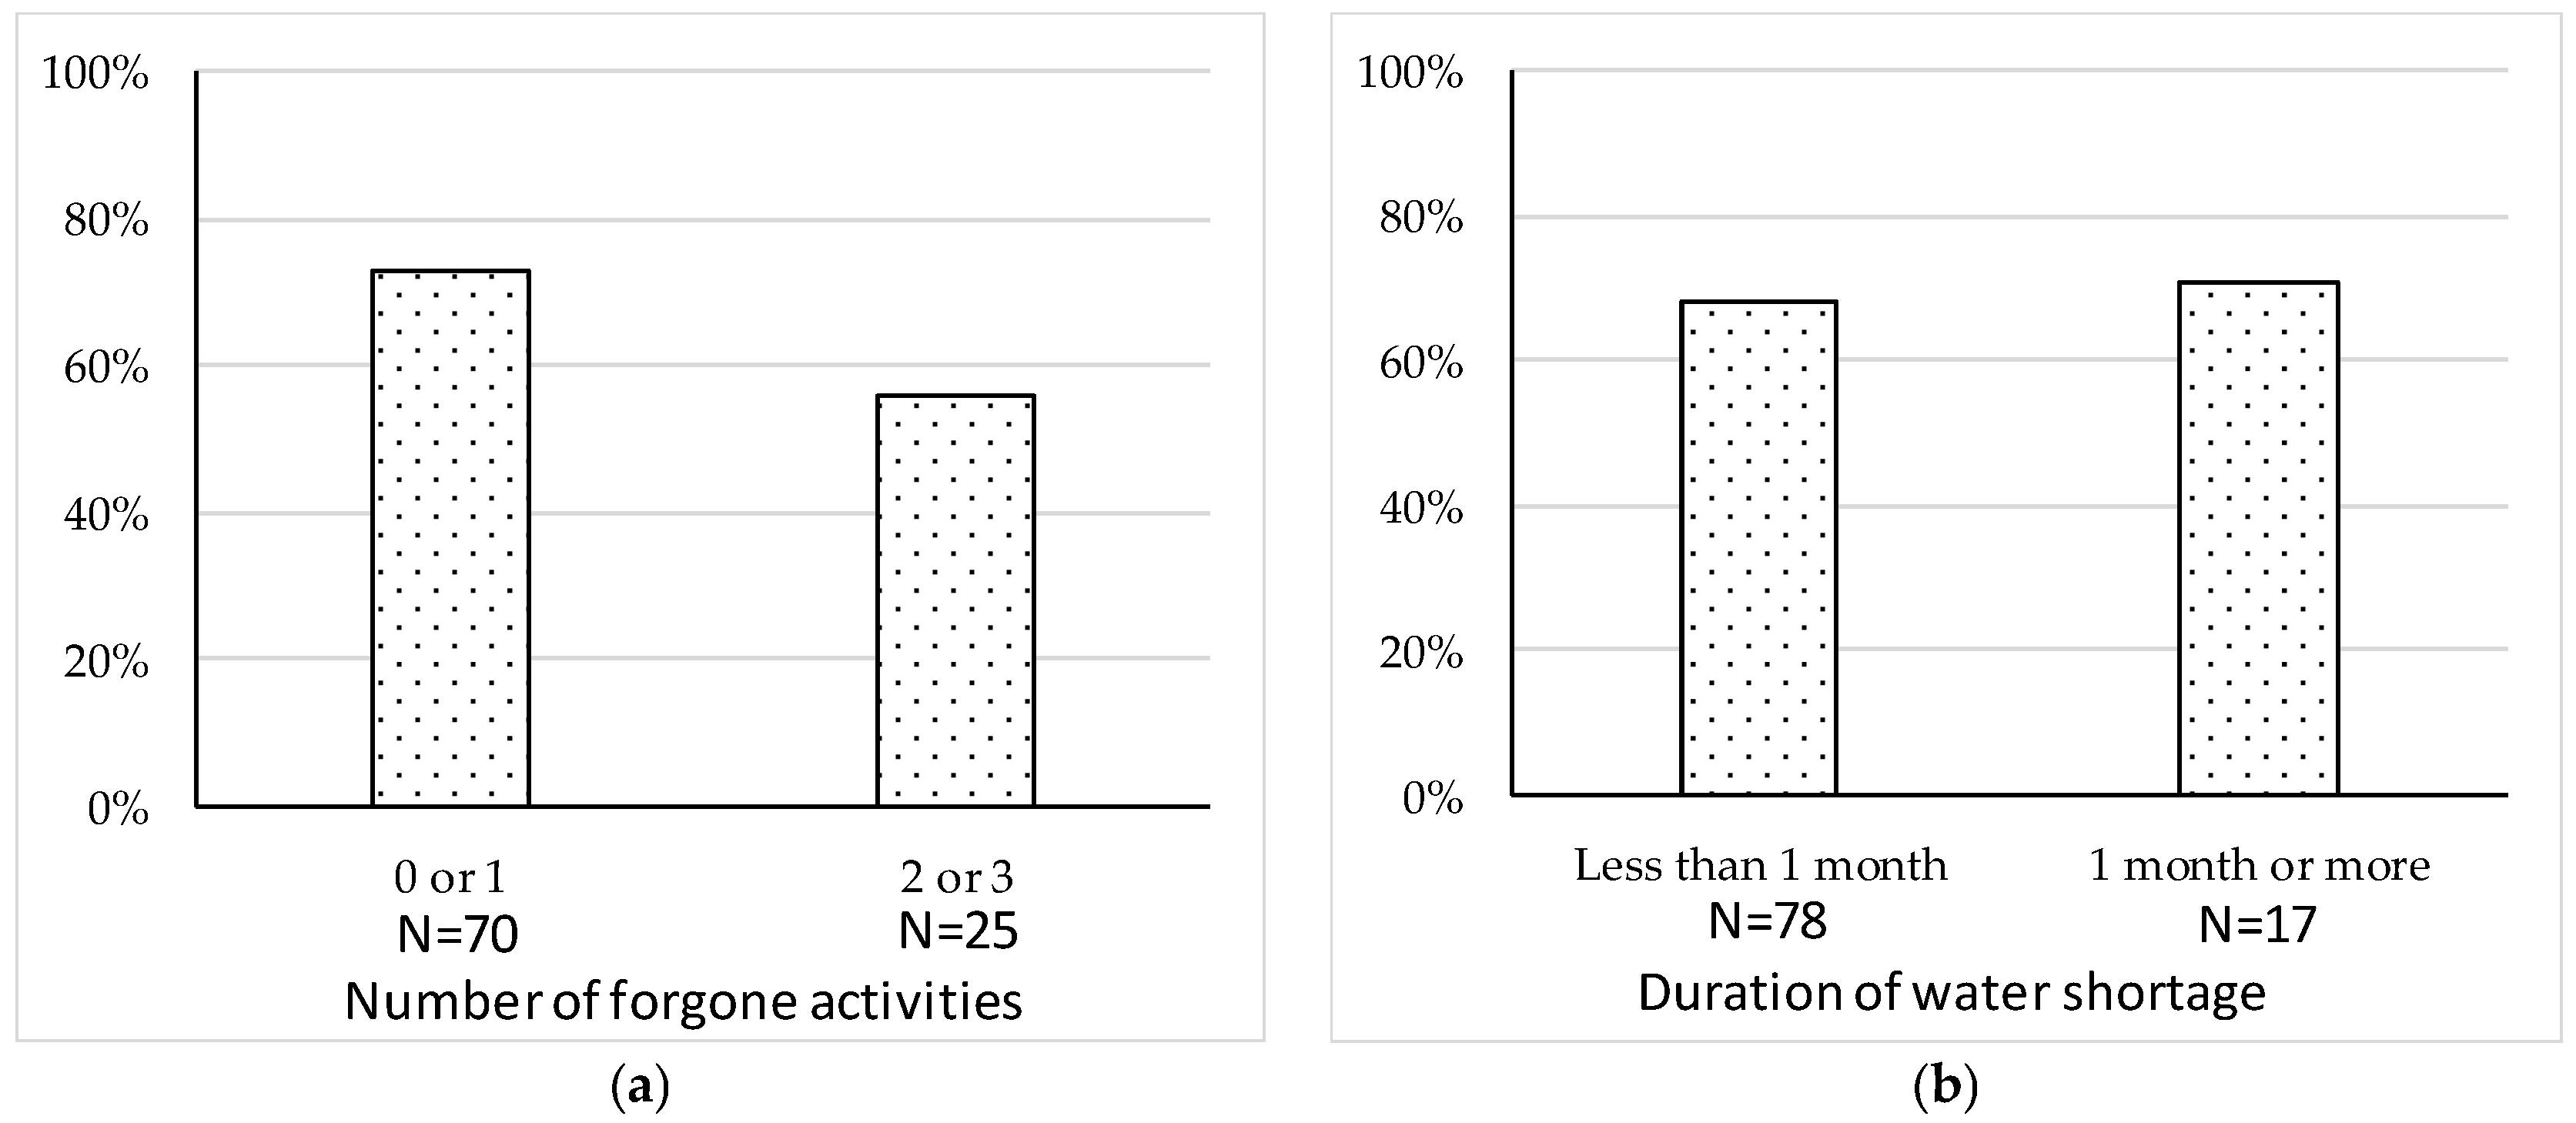
Figure 6 shows the percentage of the Otsuchi residents who admitted that natural water was an adequate emergency water supply. Panel (a) shows a decreasing tendency as the number of forgone water-use activities increases. Panel (b) shows an increasing tendency as the duration of water shortage gets longer. Although these relationships shown in panels (a) and (b) are statistically insignificant at the 5% level in Chi-square tests of independence, we will later show that these two dimensions of water-shortage experience have opposite impacts to the need for shared wells.
Table 4 presents the results from the simple model estimation. Model 1 indicates the results that did not consider respondents’ attributes at all. The positive sign of “well” at the 5% statistical significance level indicates that, on average, respondents preferred to have the shared well, provided the well was maintenance-free in terms of fees or cleaning duties. However, note that the actual number of supporters for the well depends on the maintenance fees and cleaning rotations. The negative sign of “annual maintenance fee”, “cleaning weekly”, and “clearing monthly” indicates that payment and cleaning rotations for maintaining the well were not preferred. Model 2 considered two dimensions of water-shortage experience. The negative sign of “well × water usage forgone” indicates that experiencing a water-availability problem weakens support for the shared well. The positive sign of “well × duration of water shortage” indicates that experiencing a water-access problem strengthens support for the well.
We then demonstrate the results of the mixed logit model. A comparison of the models in Table 4 and Table 5 indicates that the AIC value is the smallest for the mixed logit model and this model explains the data better than others. The first section in Table 5 presents the mean of coefficients estimated by the mixed logit model. Among the five variables considered in the CE, four variables, except “distance”, became statistically significant at the 5% level. The negative sign of “annual maintenance fee” shows that the respondents wanted to avoid higher maintenance fees. The negative sign for “weekly cleaning” and “monthly cleaning” denotes that a shared well with cleaning duty was less preferred than that without the duty. The relative size of the coefficient between the weekly and monthly cleaning rotations suggests the latter were preferred. The positive sign for “well” indicates that, on average, the respondents preferred a shared well in their neighborhood, provided the well was maintenance-free in terms of fees or cleaning duties. These results answer the first research question; that is, depending on the configurations of maintenance duty, a significant number of residents support community-shared wells in the water-rich town of Otsuchi. These results are compatible with those of the simple model, and they are robust for the model’s specifications.
The second section of Table 5 lists the estimates of standard deviations for the random parameters. The statistical significance of these standard deviations indicates heterogeneity among the respondents. There is heterogeneity in the coefficient for “annual maintenance fee”, although the standard error in Table 4 for this variable is statistically insignificant. This variable was assumed to be a log-normal distributed and, thus, the model was reparameterized and the natural logarithm of the variable was used during the maximum likelihood estimation. The standard deviation of this reparameterized variable, which is normally distributed, was statistically significant at the 1% level.
To answer the second research question, the model in Table 5 was further elaborated and individual-level coefficients were estimated for each respondent. These coefficients were regressed to the explanatory variables listed in Table 1. Table 6 and Table 7 summarize the linear regression models whose variables were selected using the backward selection method that accepted variables at the 10% statistical significance level. Hereafter, we interpret the variables that are statistically significant at the 5% level among those listed in Table 6 and Table 7. The second column of Table 6 presents the factors affecting respondents’ preferences for shared wells. Although the r-squared value was not high, this model passed the F-test and, thus, the interpretation of the coefficients provides at least a preliminary answer to the research question. It is noteworthy that the two dimensions of water-shortage experience have opposing effects on the preferences for a shared well. Experiencing a higher number of instances in which water usage was forgone, or a more severe water availability problem, reduced the need for a well. On the other hand, a longer period of water shortage, or a more critical problem of water access, strengthened this need. These results are compatible with those obtained from the simple model in Table 4. Respondents who suffered both types of water shortage might have answered differently than others. However, this was not the case, because the cross-product variable of the “water use forgone” and “duration of water shortage” did not become statistically significant. Therefore, distinguishing these two dimensions of water-shortage experience is important for understanding the impact of water shortages on future preferences for alternative water resources.
There are other factors that influenced preferences for shared wells. Among the water-use experience variables, use of natural water for laundry and other purposes during the month following the tsunami weakened the need for a shared well. A reason for this response was not identified through the survey. However, it can be assumed that respondents who continued to use well, natural spring, and upstream water even in the cold weather during the month after the tsunami under conditions of limited electricity and fuel supply might consider it difficult to use natural water for prolonged periods. Among personal attributes, age was negatively correlated with the level of preferences for wells.
Next, the results in Table 7 answer the third research question, that is, local people’s willingness to participate in maintaining shared wells. Among the water-shortage indices, “duration of water shortage” affected the cost coefficient. Since the cost coefficient is negative by definition, the positive sign of the coefficient for water-shortage duration suggests that prolonged water shortage eliminated reservations regarding payments for shared wells. Thus, a long water shortage, or experience of a water-access problem, increased not only the need for a shared well but also the willingness to financially support the well. However, “duration of water shortage” did not affect willingness to clean the wells and “water usage forgone” did not impact financial support or cleaning support.
The experience of using natural water for laundry and bathing during the second–fifth week after the tsunami rendered respondents less cooperative toward monthly cleaning duties. This result may be in line with the low support for shared wells among respondents with the same experience given the water-use difficulties in cold weather. The experience of using natural water before the tsunami made respondents more willing to participate in cleaning duty, which appears to be an effect of habit formation [27]. Respondents living with children were more likely to contribute toward the well financially, but less willing to participate in weekly cleaning activities. This can be attributed to income differences among generations and flexibility of time allocation. Experience of voluntary activity negatively affected willingness to participate in weekly cleaning rotation, which is possibly because of the difficulty in finding healthy volunteers in an aged society [14] and allocation of excessive duty to those who can work as volunteers.
4. Discussion
This study investigated the preference for decentralized water systems as an alternative water resource to a centralized water system in the water-rich town of Otsuchi, Japan. With considerable damage caused by the 2011 tsunami, Otsuchi is undergoing a process of reconstruction and policymakers require this information to determine whether community-shared wells should be included in the town’s reconstruction plan. The present survey revealed that, despite Otsuchi’s rich water resources and the small possibility of water shortages in its centralized water system, except during large disasters such as the 2011 tsunami disaster, average respondents preferred shared wells. The percentage of supporters depends on the cost and cleaning rotation for managing the well. Increasing these duties reduce supporters. For example, a simulation using the result of Model 1 in Table 4 indicates that 62% of the respondents support the well if an annual payment of 1000 yen is required. This percentage reduces to 51% if a monthly cleaning rotation is added to this payment. This information may be used for judging the sustainability of the shared wells in this town.
There is heterogeneity in the attitudes toward shared wells among the respondents. To this effect, this study highlighted the importance of measuring water-shortage experiences during the aftermath of the 2011 tsunami using two dimensions: number of water-use activities forgone and duration of water shortage. The former experience can be attributed to the limited availability of water at the collective level, and the latter is due to limited water access at the individual level. The number of activities forgone due to the water shortage is negatively correlated with the preference for a shared well. Thus, the experience of water unavailability relative to demand discourages residents from setting up and sustaining a shared well. The duration of the water shortage is positively correlated with the preference for a shared well. A prolonged water shortage despite sufficient water availability in the area is a problem of individual access. Respondents who have faced this distributional problem encourage shared wells as an alternative water resource. Thus, distinguishing water-access problems from those of water availability is important for understanding our respondents’ attitudes toward shared wells. This can be considered a new finding in the literature given that both indices have been used in water assessments conducted at a collective level. Besides, this is also a new finding in the context of individual analyses because the literature that considers individual responses to a water shortage does not clearly distinguish between the two dimensions of water-shortage experiences. This study demonstrated that availability and access are key concepts in understanding dynamic changes in people’s perceptions of life-sustaining goods and in determining their participation to manage these goods.
Among other variables, higher age and natural water use for laundry and bathing during the second–fifth week after the tsunami weakened the need for shared wells. Conversely, younger generations expressed greater interest in shared wells. This is a notable fact for policymakers playing key roles in reconstructing the town for the next generation. The negative attitude toward shared wells among the respondents can be ascribed to the difficulty of using natural water in the cold weather following the tsunami; however, this study’s survey provided no direct information identifying the reasons underpinning the negative attitude. If this claim holds true, it is important to conduct further research with a broad perspective, including heating fuels and other relevant elements facilitating the use of natural water during disasters.
The maintenance of a decentralized water system needs citizens’ participation. Thus, this study investigated water-shortage experiences and other personal attributes affecting their participation in shared well management. The preliminary results revealed that prolonged water shortages increased the need for shared wells and weakened the barriers to payment. Among other personal attributes, living with children under the age of 13 years, daily experience of volunteer activities, and natural water use before the tsunami disaster affected respondents’ intentions to pay for or participate in cleaning duties to maintain the shared wells.
Given the socioeconomic condition following the 2011 disaster, the survey data used in this study are subject to certain limitations. Despite the efforts to enhance data quality, the mall-intercept method possibly caused a bias in the sample’s representativeness. A comparison with the town’s statistics showed that the sample represented a higher number of elderly persons than the younger generation. In addition, the sample size was not large and this hindered the identification of all factors affecting our respondents’ attitudes toward the shared wells. Finally, the results from the linear regression analysis of individual coefficients are preliminary, given the low goodness-of-fit measures. This study did not figure out why water-availability and water-access problems caused different responses. In future research with a large dataset, the use of the multilevel-level structural equation model would be beneficial for understanding the psychological reasons for this difference.
5. Conclusions and Recommendations
Through our case study on water-shortage experiences in the tsunami-damaged, water-rich town of Otsuchi, we found that many of our survey respondents preferred the installation of alternative decentralized water resources, or community-shared wells. The percentage of these supporters changed in accordance with the payment and cleaning duties for maintaining the well. We identified the types of water-shortage experiences and personal attributes that affected the preference for shared wells. Among all these, a water-shortage experience due to limited water access was a strong driver strengthening the preference for shared wells, whilst a water-shortage experience due to overall water unavailability had a negative impact on the preference. Some personal attributes that generated supportive attitudes toward voluntary contributions to maintain the well were identified.
As a policy implication in a broader context, our research demonstrated the importance of considering water-access inequality during disasters. This includes the need for actions related to the monitoring of water-access inequality and taking countermeasures against it for the security of every member of the local communities. Countermeasures may include providing means of transportation to gain access to water resources during disasters besides a decentralized water supply, indicated in our case study. The accessibility issue is not only relevant to our survey site of water-rich Otsuchi, but also to other sites. In particular, careful consideration before an actual disaster would be necessary for areas with water scarcity.
Acknowledgments
The authors appreciate Hisami Honda of the Research Institute for Humanity and Nature, Takahiro Sawadate of Hokkaido University, and Tomohiko Kawamura of the University of Tokyo for their support in completing the survey. Otsuchi Town Office provided important comments to help the authors carry out the survey plan, and the management office of the Mast Shopping Centre provided their space for our survey. This work is supported by the project, entitled “Human-Environmental Security in Asia-Pacific Ring of Fire: Water–Energy–Food Nexus”, the Research Institute for Humanity and Nature (RIHN), Kyoto, Japan.
Author Contributions
Takaaki Kato and Aiko Endo conceived and designed the research and questionnaire, and conducted the field survey. Takaaki Kato performed the statistical analysis of the data and wrote the paper with contributions from Aiko Endo.
Conflicts of Interest
The authors declare no conflict of interest.
References
- Turner, J.P.; Qiao, J.; Lawley, M.; Richard, J.-P.; Abraham, D.M. Mitigating shortage and distribution costs in damaged water networks. Socio-Econ. Plan. Sci. 2012, 46, 315–326. [Google Scholar] [CrossRef]
- Mankad, A.; Tapsuwan, S. Review of socio-economic drivers of community acceptance and adoption of decentralized water systems. J. Environ. Manag. 2011, 92, 380–391. [Google Scholar] [CrossRef] [PubMed]
- Hurlimann, A. Household use of and satisfaction with alternative water sources in Victoria Australia. J. Environ. Manag. 2011, 92, 2691–2697. [Google Scholar] [CrossRef] [PubMed]
- UN-Water. Water Security and the Global Water Agenda: A UN-Water Analytical Brief; Institute for Water, Environment and Health, United Nations University: Hamilton, ON, Canada, 2013. [Google Scholar]
- Biggs, E.M.; Duncan, J.M.A.; Atkinson, P.M.; Dash, J. Plenty of water, not enough strategy: How inadequate accessibility, poor governance and a volatile government can tip the balance against ensuring water security: The case of Nepal. Environ. Sci. Policy 2013, 33, 388–394. [Google Scholar] [CrossRef]
- UN-Water. World Water Day 2013: Facts and Figures, UN-Water Website. Available online: http://www.unwater.org/water-cooperation-2013/water-cooperation/facts-and-figures/en/ (accessed on 8 October 2017).
- Komnenic, V.; Ahlers, R.; van der Zaag, P. Assessing the usefulness of the water poverty index by applying it to a special case: Can one be water poor with high levels of access? Phys. Chem. Earth 2009, 34, 219–224. [Google Scholar] [CrossRef]
- Salvaggio, M.; Futrell, R.; Batson, C.D.; Brents, B.G. Water scarcity in the desert metropolis: How environmental values, knowledge and concern affect Las Vegas residents’ support for water conservation policy. J. Environ. Plan. Manag. 2014, 57, 588–611. [Google Scholar] [CrossRef]
- Kang, J.; Grable, K.; Hustvedt, G.; Ahn, M. Sustainable water consumption: The perspective of Hispanic consumers. J. Environ. Psychol. 2017, 50, 94–103. [Google Scholar] [CrossRef]
- Jorgensen, B.; Graymore, M.; O’Toole, K. Household water use behavior: An integrated model. J. Environ. Manag. 2009, 91, 227–236. [Google Scholar] [CrossRef] [PubMed]
- Iwate Prefectural Government. Otsuci-gawa Suikei Kasen Seibi Kihon Houshin (Masterplan of Otsuchi River Basin Management); Iwate Prefectural Government: Morioka, Japan, 2015. (In Japanese)
- Otsuchi Town Office. Higashi-Nihon Daishinsai Otsuchi Cho Hisai Gaiyou (Summary of East Japan Great Earthquake Damages in Otsuchi Town); Otsuchi Town Office: Otsuchi, Japan, 2015. (In Japanese) [Google Scholar]
- Otsuchi Town Office. Dai Gokai Machikata Chiiki Fukkou Machizukuri Kondankai (The 5th Town Meeting for Reconstruction of Machikata Area); Otsuchi Town Office: Otsuchi, Japan, 2015. (In Japanese) [Google Scholar]
- Ministry of Land, Infrastructure, Transport and Tourism (MLIT). Syoukibo Koureika suru Syuraku no Syourai wo Kangaeru Hint-syu (Good Practices for Sustaining Small, Aged Communities); MLIT: Tokyo, Japan, 2012. (In Japanese)
- Viscusi, W.K.; Huber, J.; Bell, J. The economic value of water quality. Environ. Resour. Econ. 2008, 41, 169–187. [Google Scholar] [CrossRef]
- Hampson, D.I.; Ferrini, S.; Rigby, D.; Bateman, I.J. River water quality: Who cares, how much and why? Water 2017, 9. [Google Scholar] [CrossRef]
- Hensher, D.; Shore, N.; Train, K. Water supply security and willingness to pay to avoid drought water restrictions. Econ. Rec. 2006, 82, 56–66. [Google Scholar] [CrossRef]
- Tait, P.; Vallance, S.; Rutherford, P. Expanding the conversational terrain: Using a choice experiment to assess community preferences for post-disaster redevelopment options. Land Use Policy 2016, 55, 275–284. [Google Scholar] [CrossRef]
- Otsuchi Town Office. Otsuchi Cho Higashi-Nihon Daishinsai Kensyo Hokokusho (Investigation Report of the Otsuchi Town’s Responses in the Great East Japan Earthquake Disaster); Otsuchi Town Office: Otsuchi, Japan, 2014. (In Japanese) [Google Scholar]
- Otsuchi High School. Daikaisyo: 2011.3.11 Higashi-Nihon Daishinsai to Hinanjyo Unei (Tsunami: Great East Japan Earthquake Disaster and Managing an Evacuation Shelter); Otsuchi High School: Otsuchi, Japan, 2012. (In Japanese) [Google Scholar]
- Hokkaido Shimbun. Iyashi no yu: Chitose no rikuji ga furo setsuei: Iwate, Otsuchi (Relaxing bath: A group of Japan Ground Self Defense Forces sent from Chitose established a public bathhouse in Otsuchi, Iwate); Hokkaido Shimbun: Sapporo, Japan, 2011. (In Japanese) [Google Scholar]
- ChoiceMetrics. Ngene 1.1.1 User Manual and Reference Guide; ChoiceMetrics: Sydney, Australia, 2012. [Google Scholar]
- Bateman, I.J.; Carson, R.T.; Day, B.; Hanemann, W.M.; Hanley, N.; Hett, T.; Jones-Lee, M.; Loomes, G.; Mourato, S.; Özdemiroglu, E.; et al. Economic Valuation with Stated Preference Techniques: A Manual; Edward Elgar: Cheltenham, UK, 2002; pp. 248–276. ISBN 1-84376-852-6. [Google Scholar]
- Train, K.E. Discrete Choice Methods with Simulation; Cambridge University Press: Cambridge, UK, 2009. [Google Scholar]
- Klaiman, K.; Ortega, D.L.; Garnahe, C. Consumer preferences and demand for packaging material and recyclability. Resour. Conserv. Recyc. 2016, 115, 1–8. [Google Scholar] [CrossRef]
- Otsuchi Town Office. Otsuchi-Cho Jinko Vision [Otsuchi Town Population Projection]; Otsuchi Town Office: Otsuchi, Japan, 2016. (In Japanese) [Google Scholar]
- Klöckner, C.A. A comprehensive model of the psychology of environmental behavior: A meta-analysis. Glob. Environ. Chang. 2013, 23, 1028–1038. [Google Scholar] [CrossRef] [Green Version]
Figure 1.
Map of Otsuchi Town. The Otsuchi community map was compiled from the Otsuchi Reconstruction Plan (2013).
Figure 1.
Map of Otsuchi Town. The Otsuchi community map was compiled from the Otsuchi Reconstruction Plan (2013).
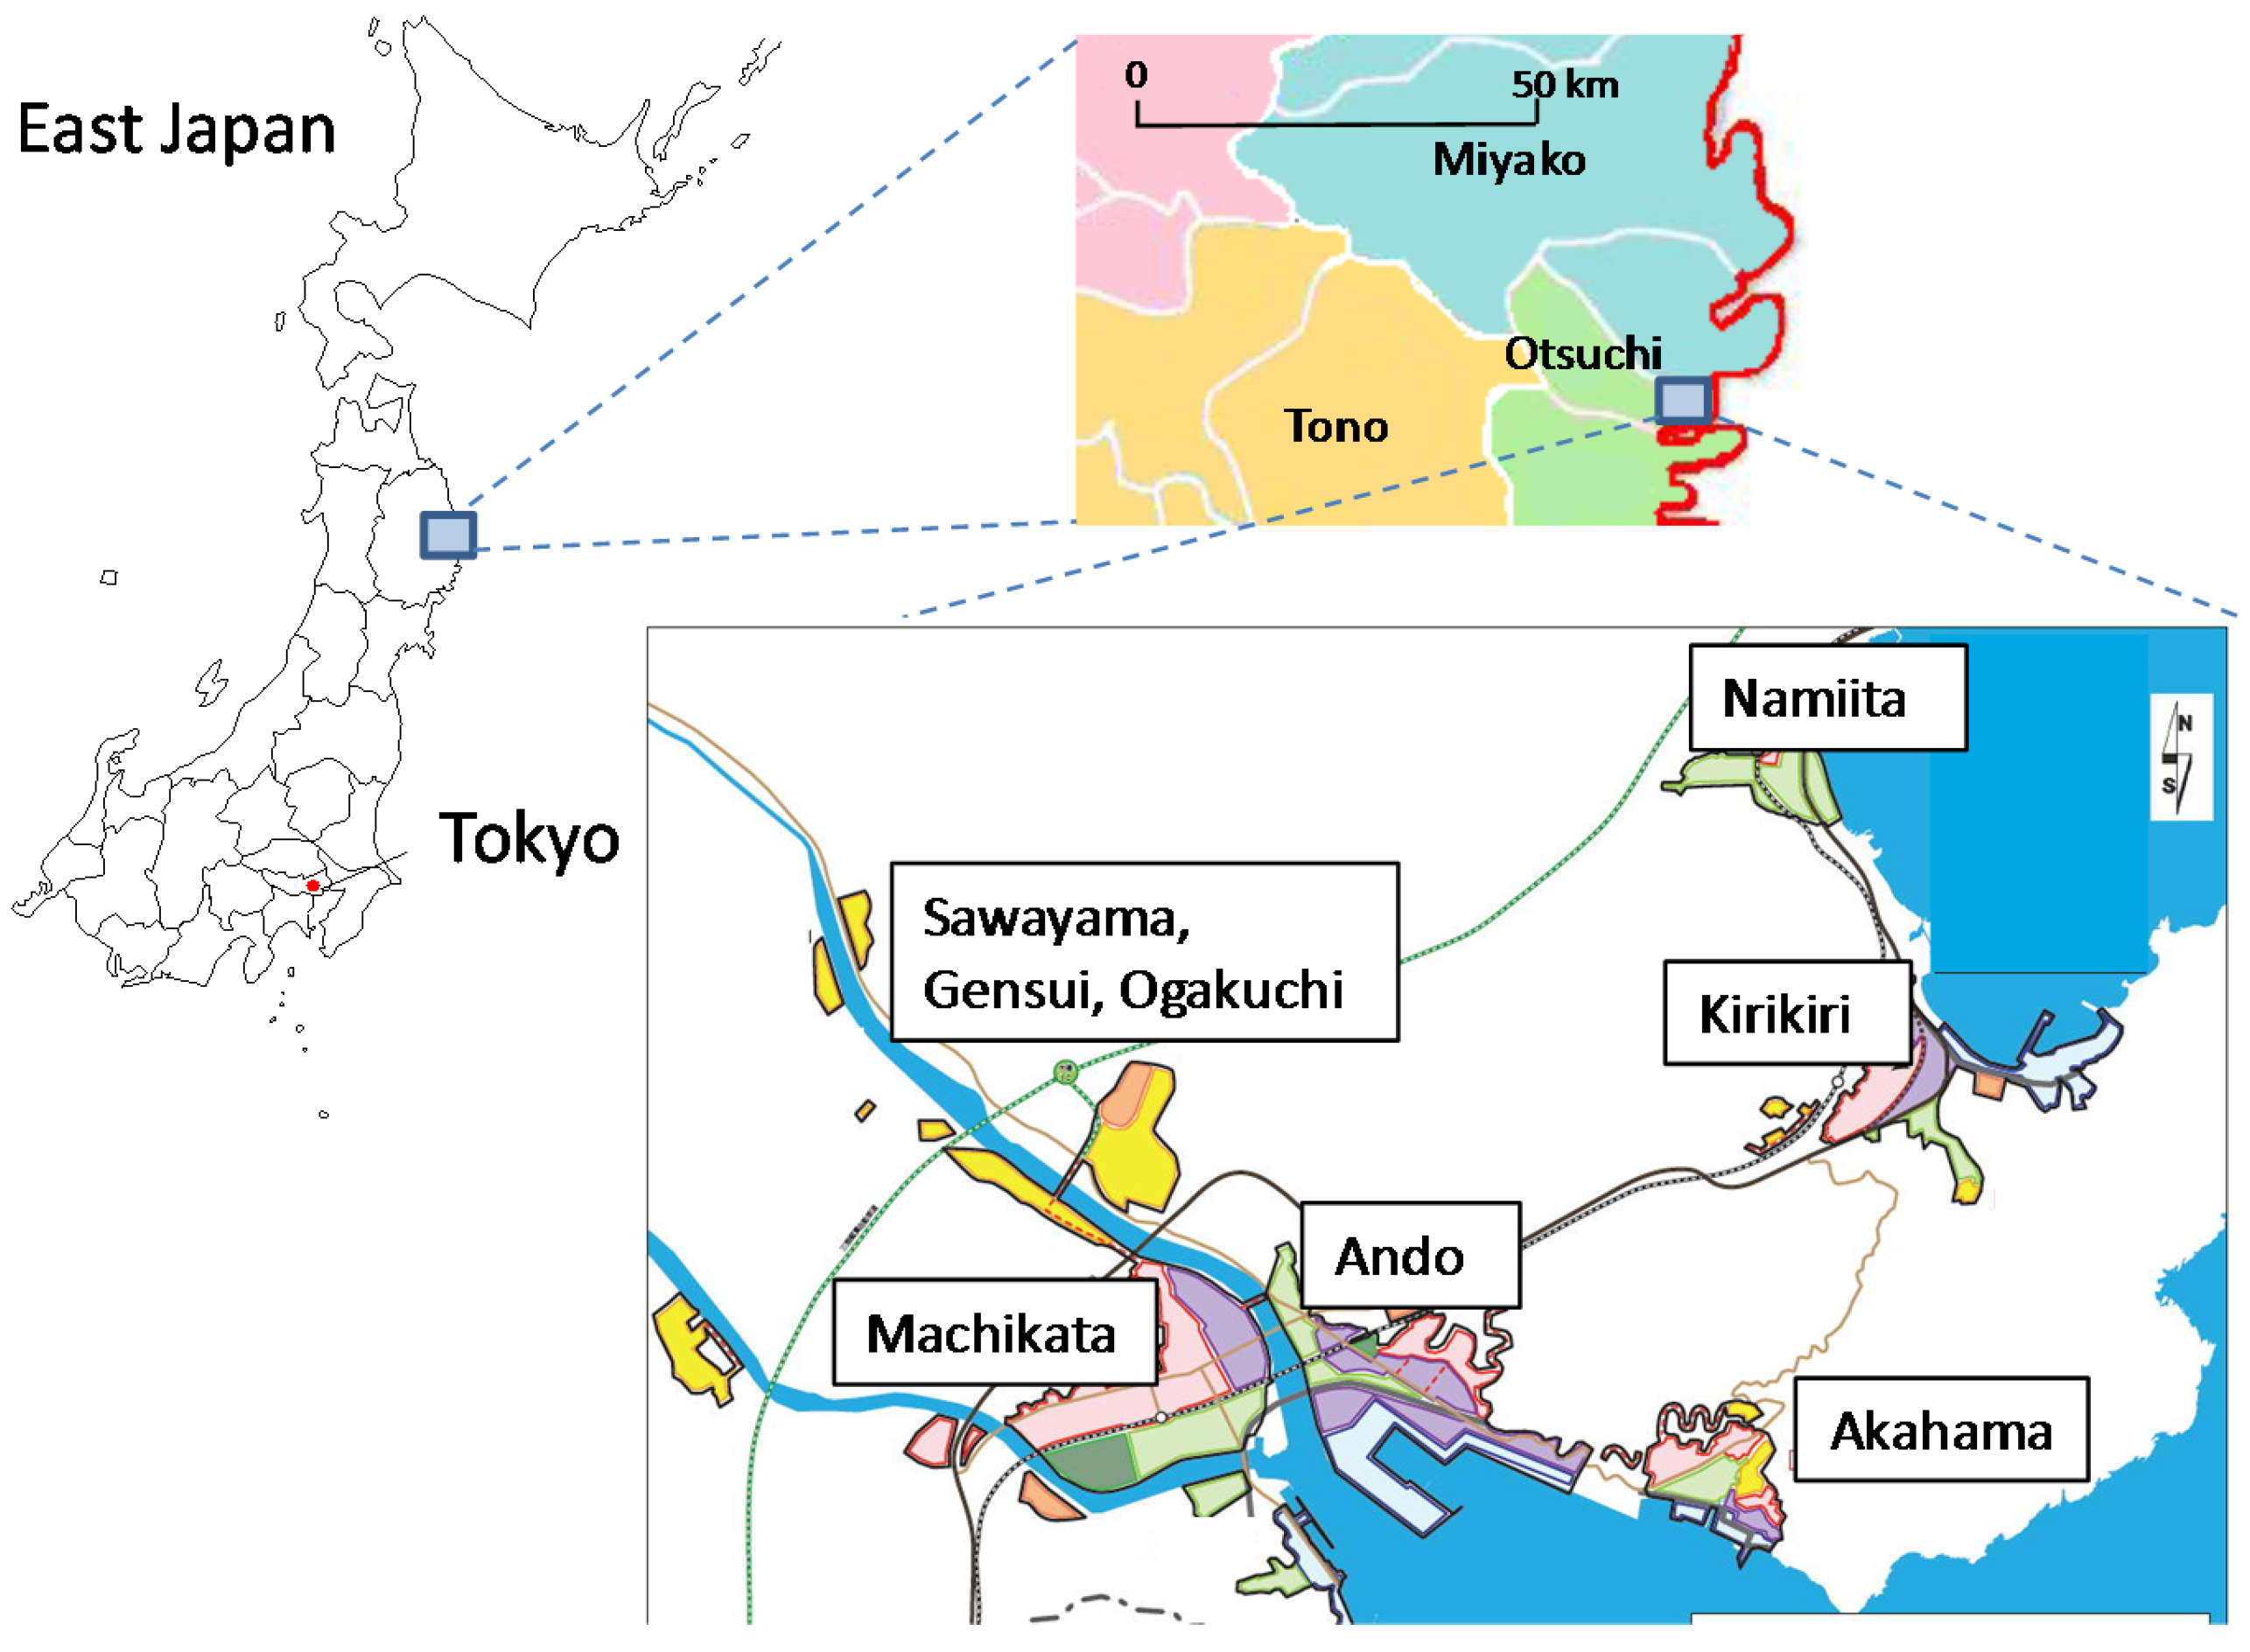
Figure 2.
Example of choice question.
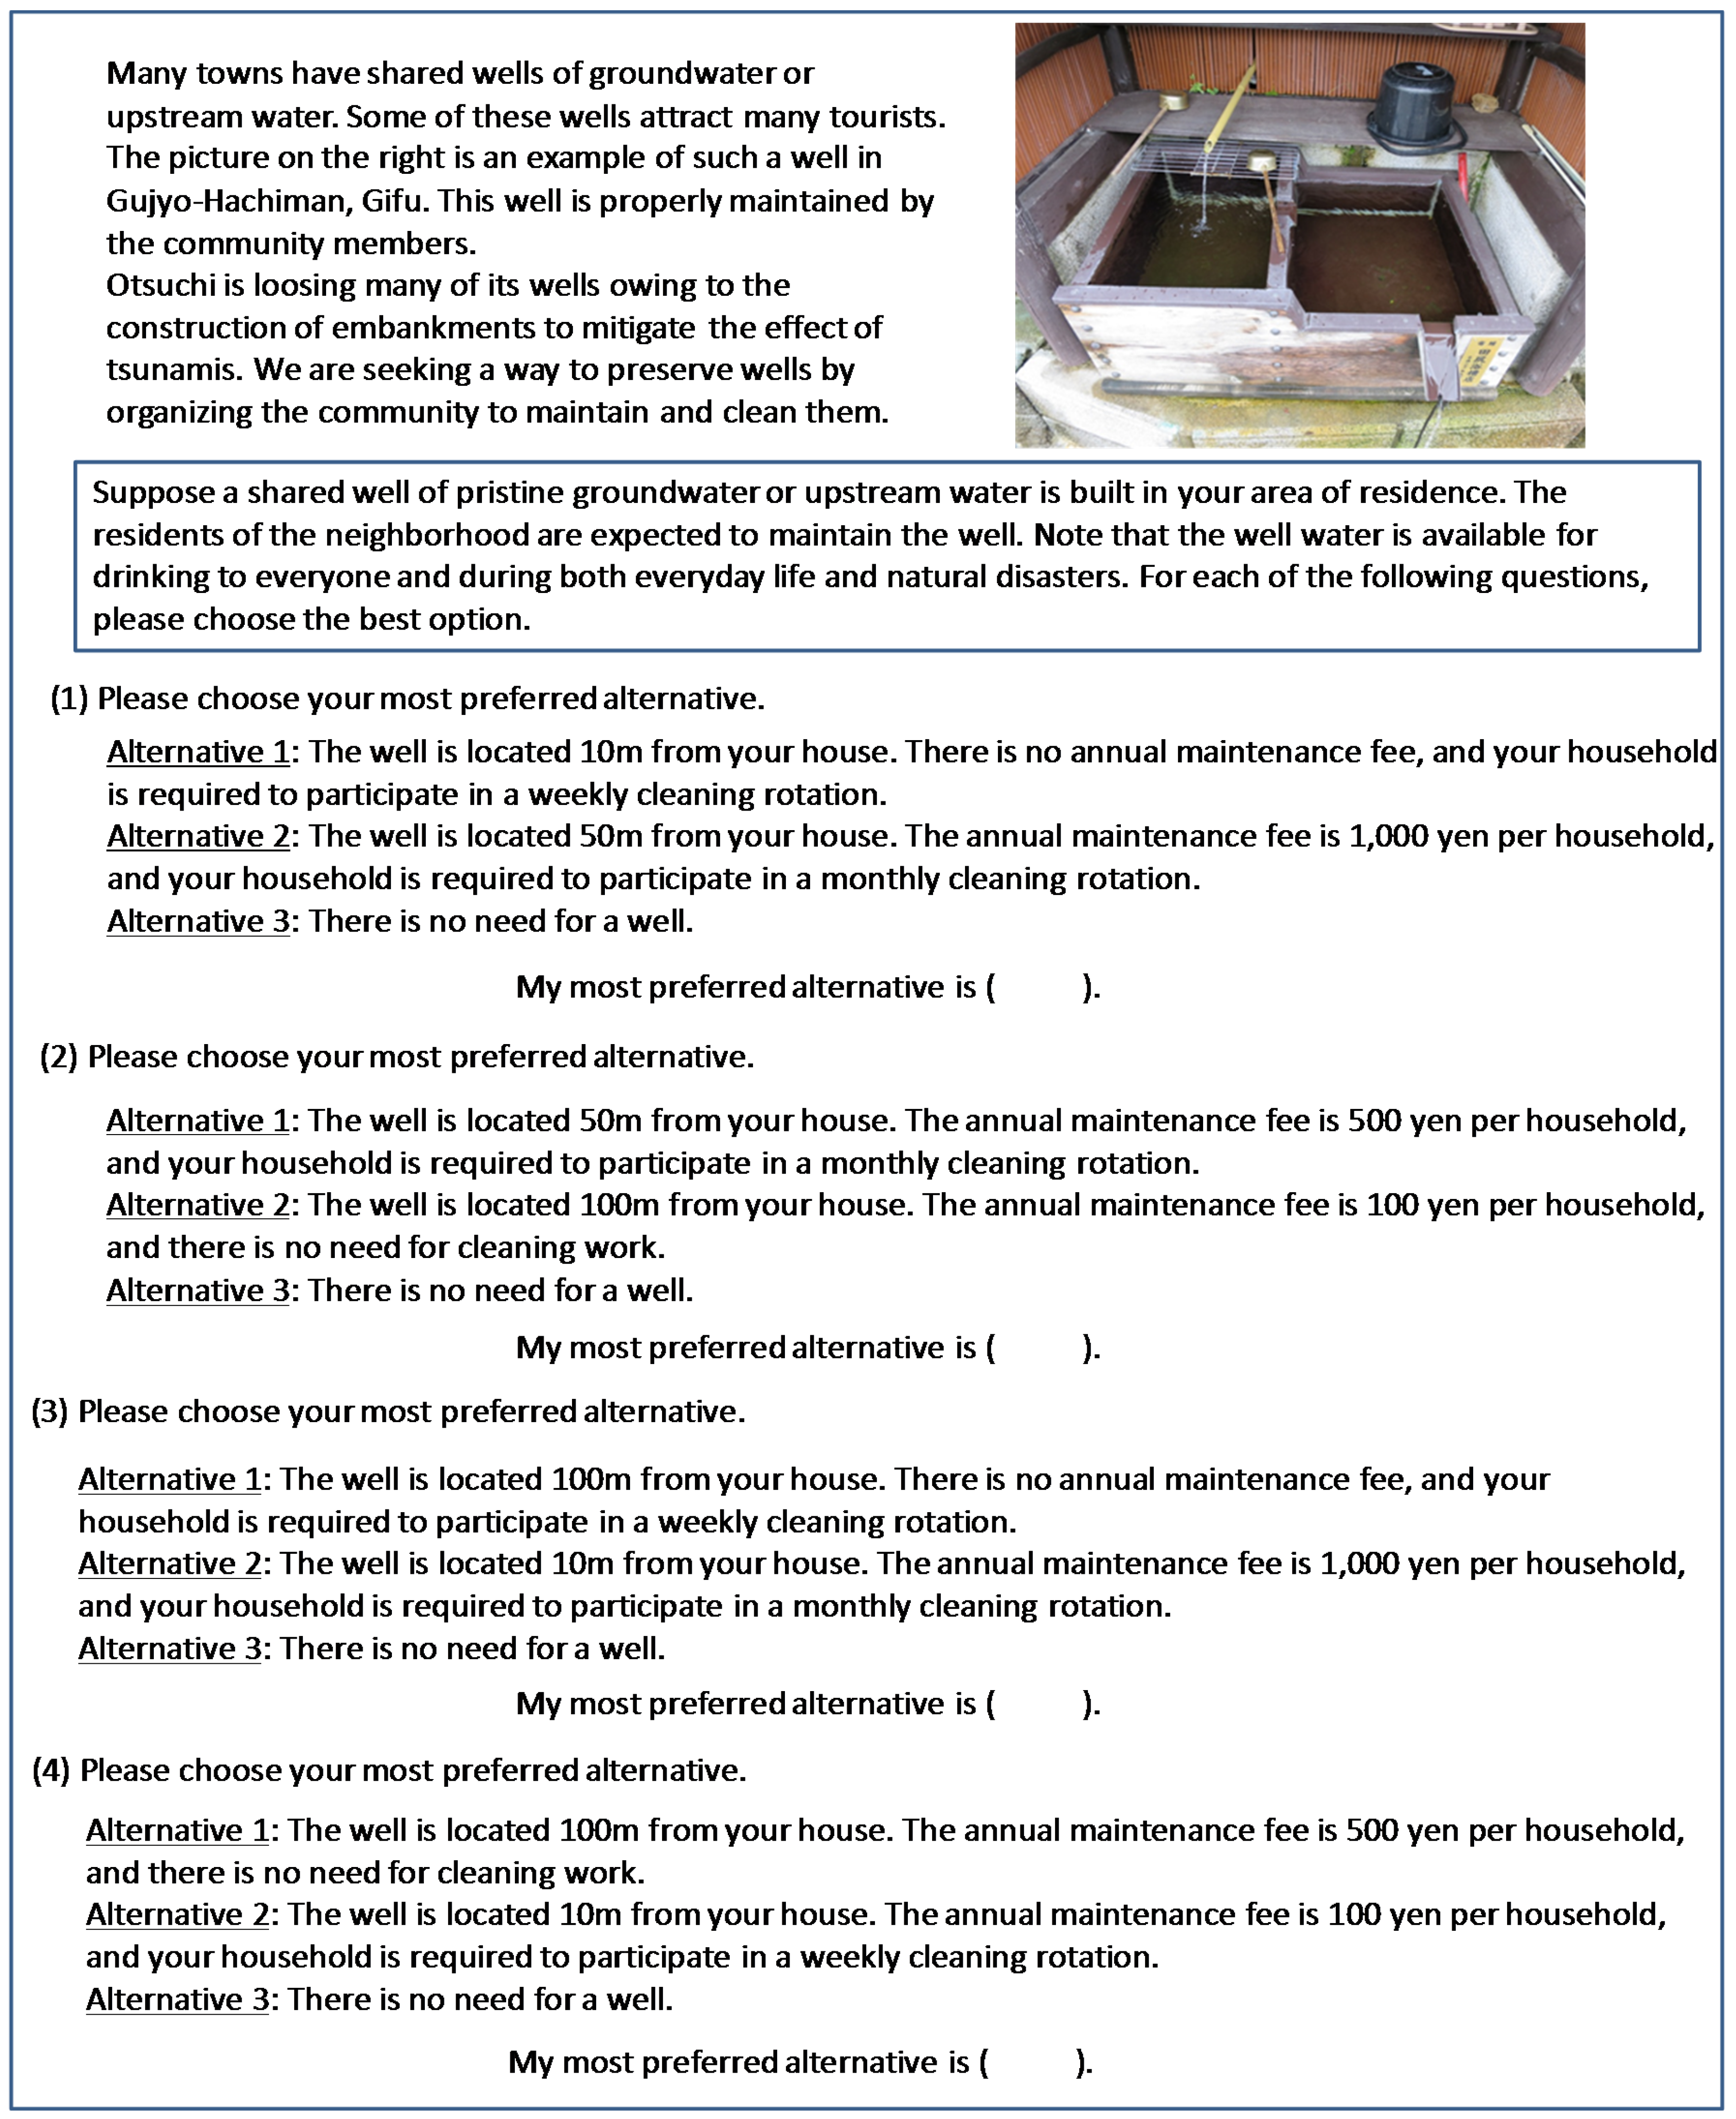
Figure 3.
Water use before the 2011 tsunami. Note: the respondents were allowed to choose multiple uses.
Figure 3.
Water use before the 2011 tsunami. Note: the respondents were allowed to choose multiple uses.
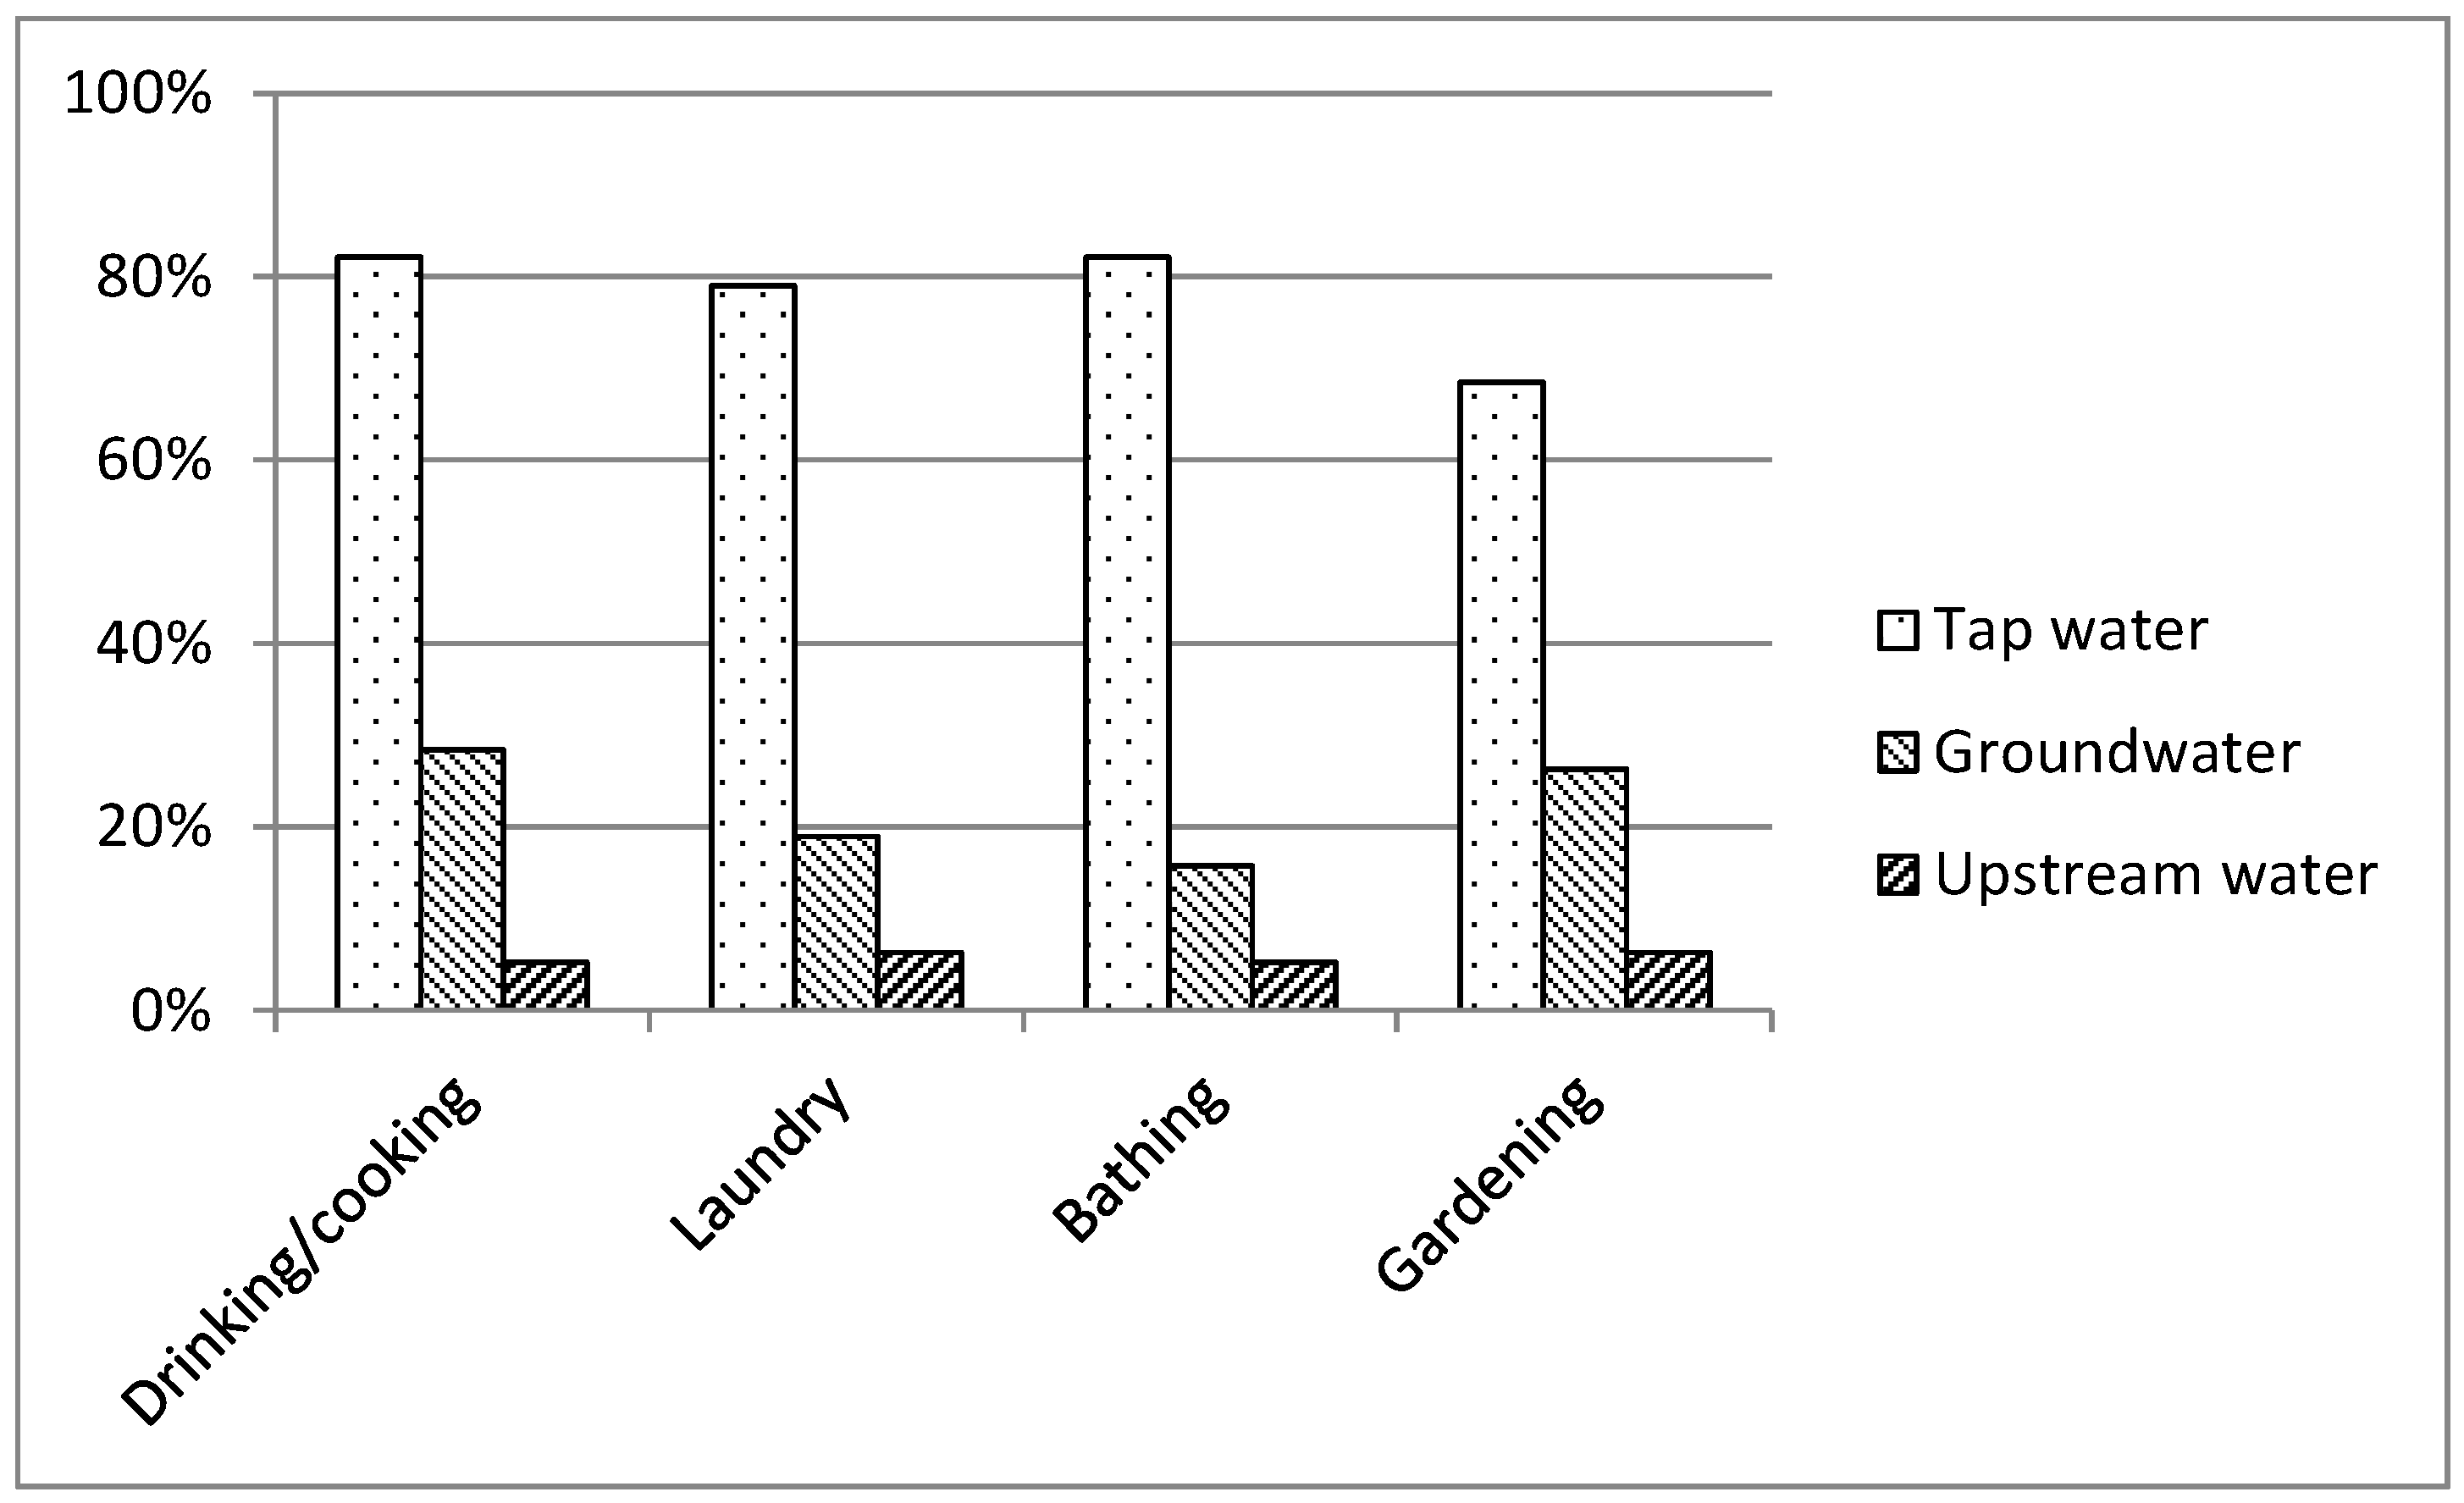
Figure 4.
Water use during first week after the tsunami. Note: the respondents were allowed to choose multiple uses.
Figure 4.
Water use during first week after the tsunami. Note: the respondents were allowed to choose multiple uses.
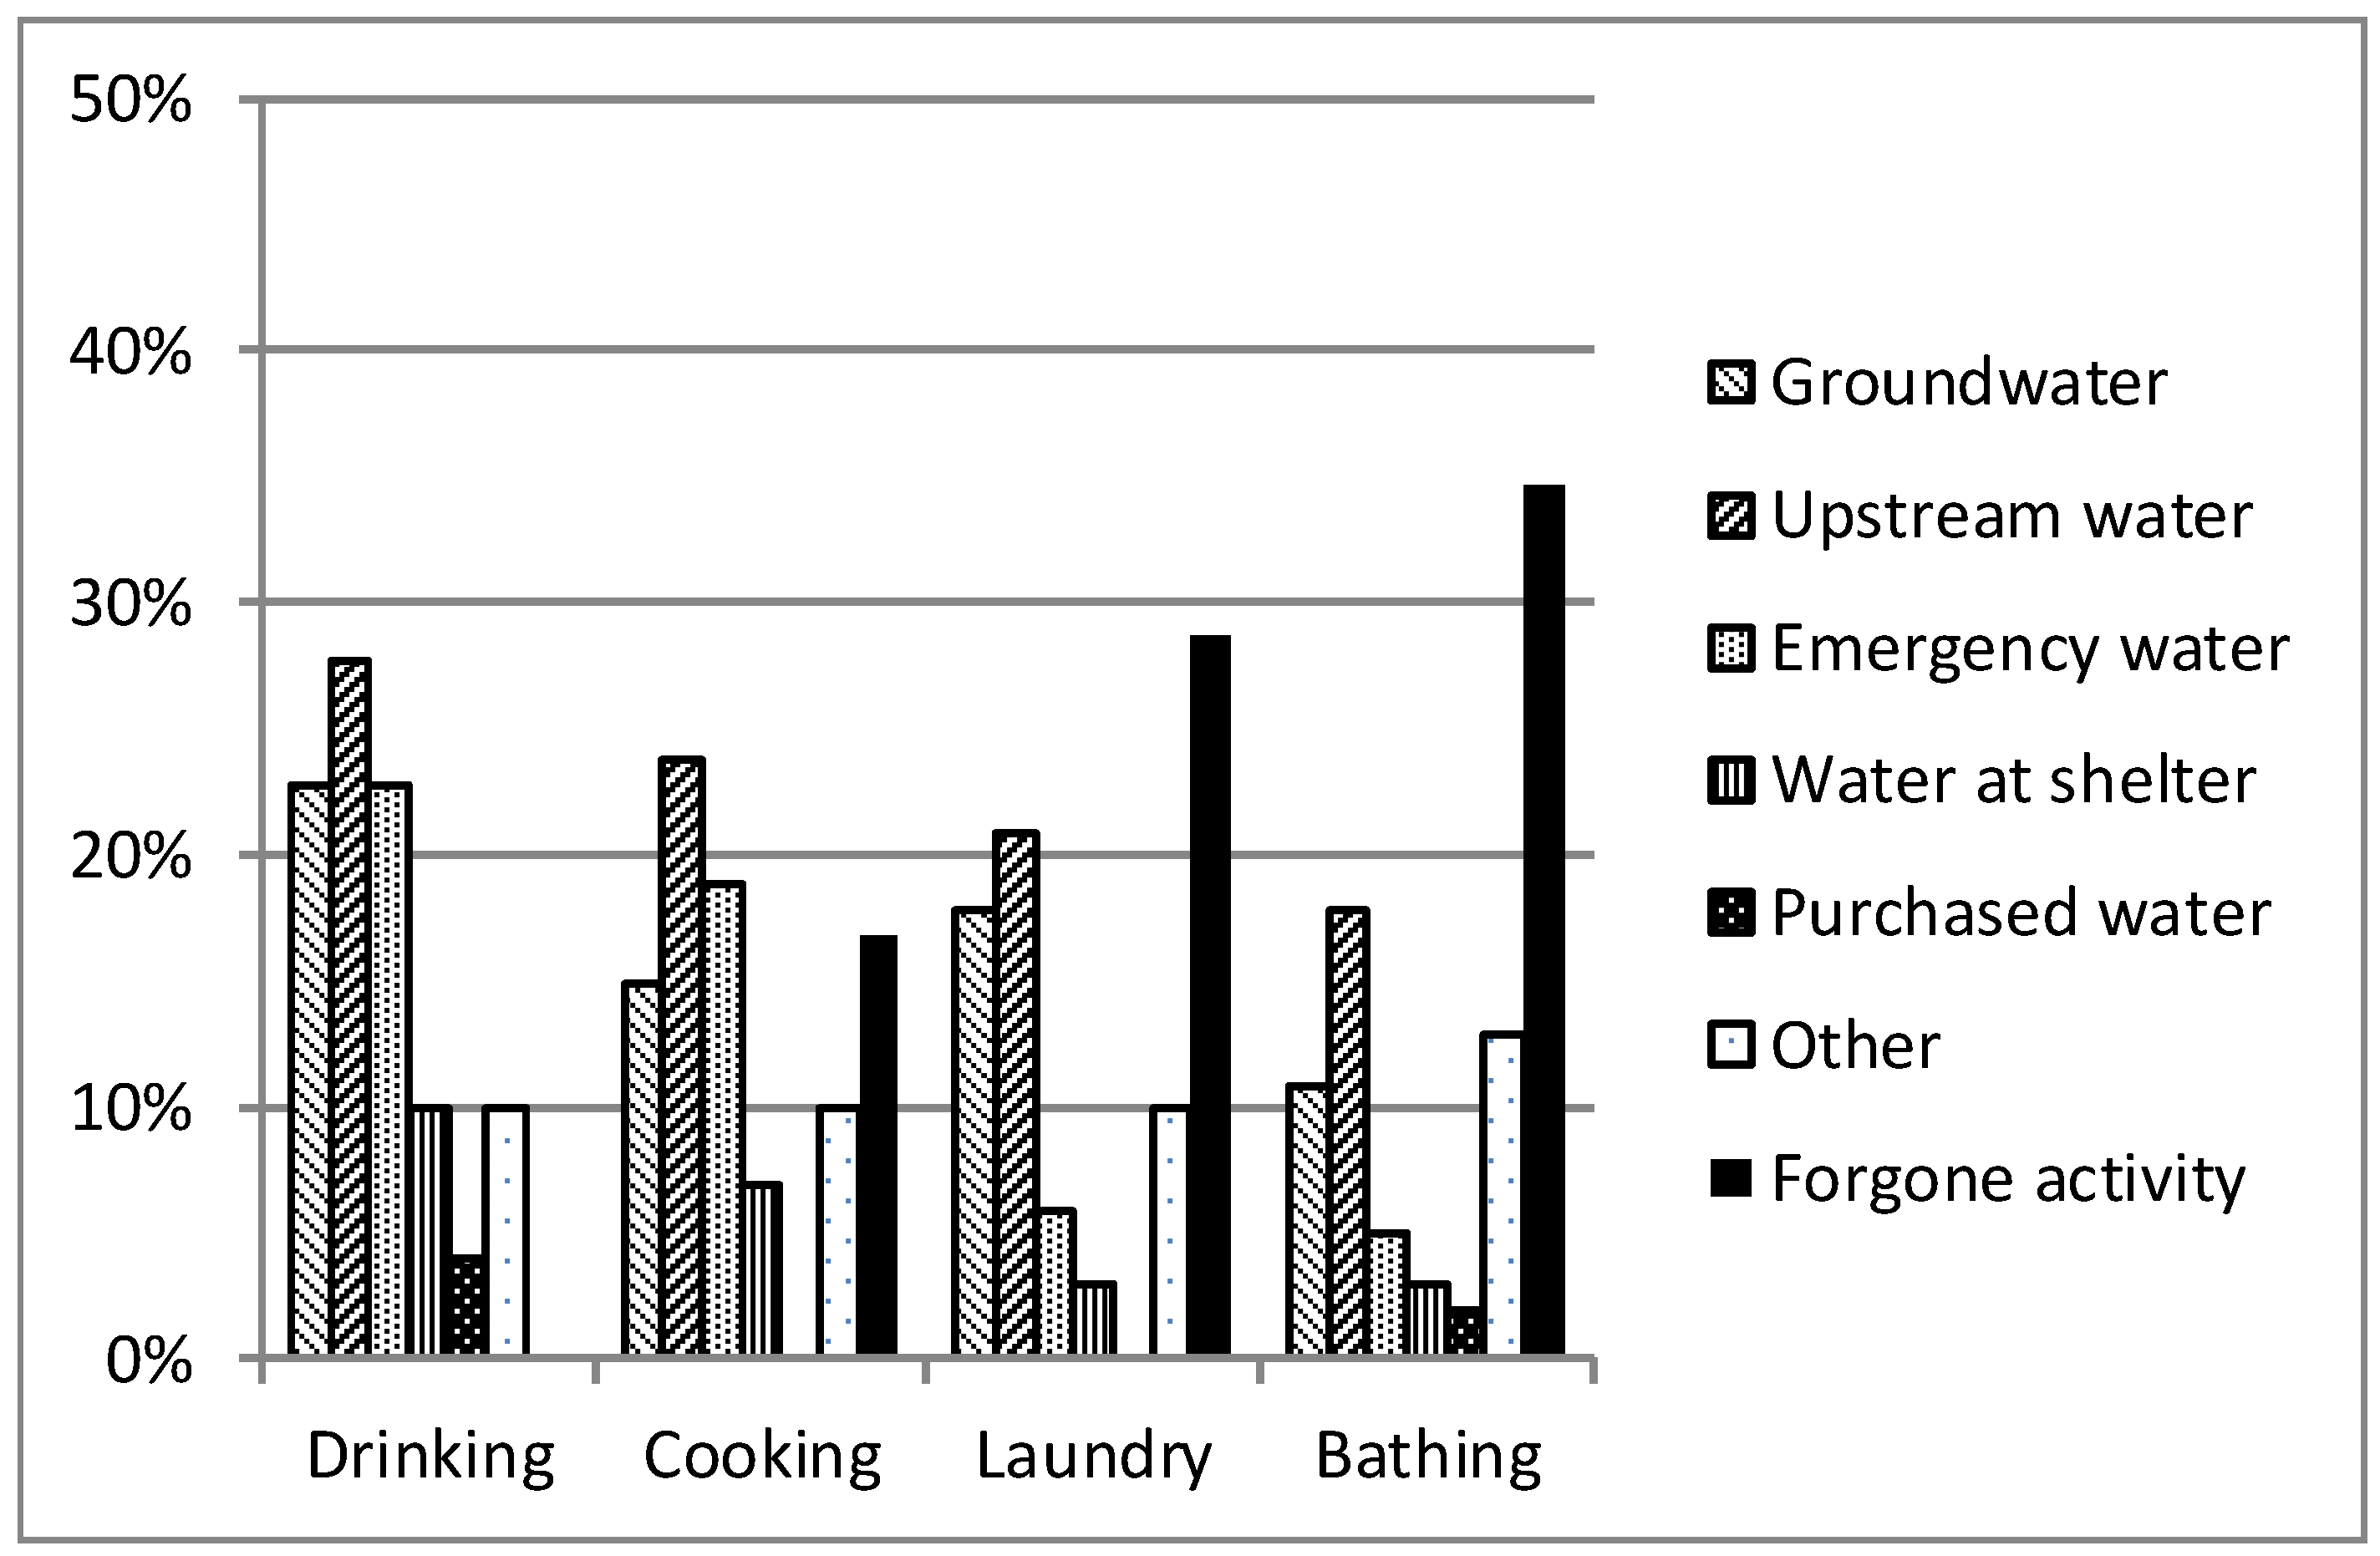
Figure 5.
Water use during second–fifth weeks after the tsunami. Note: the respondents were allowed to choose multiple uses.
Figure 5.
Water use during second–fifth weeks after the tsunami. Note: the respondents were allowed to choose multiple uses.
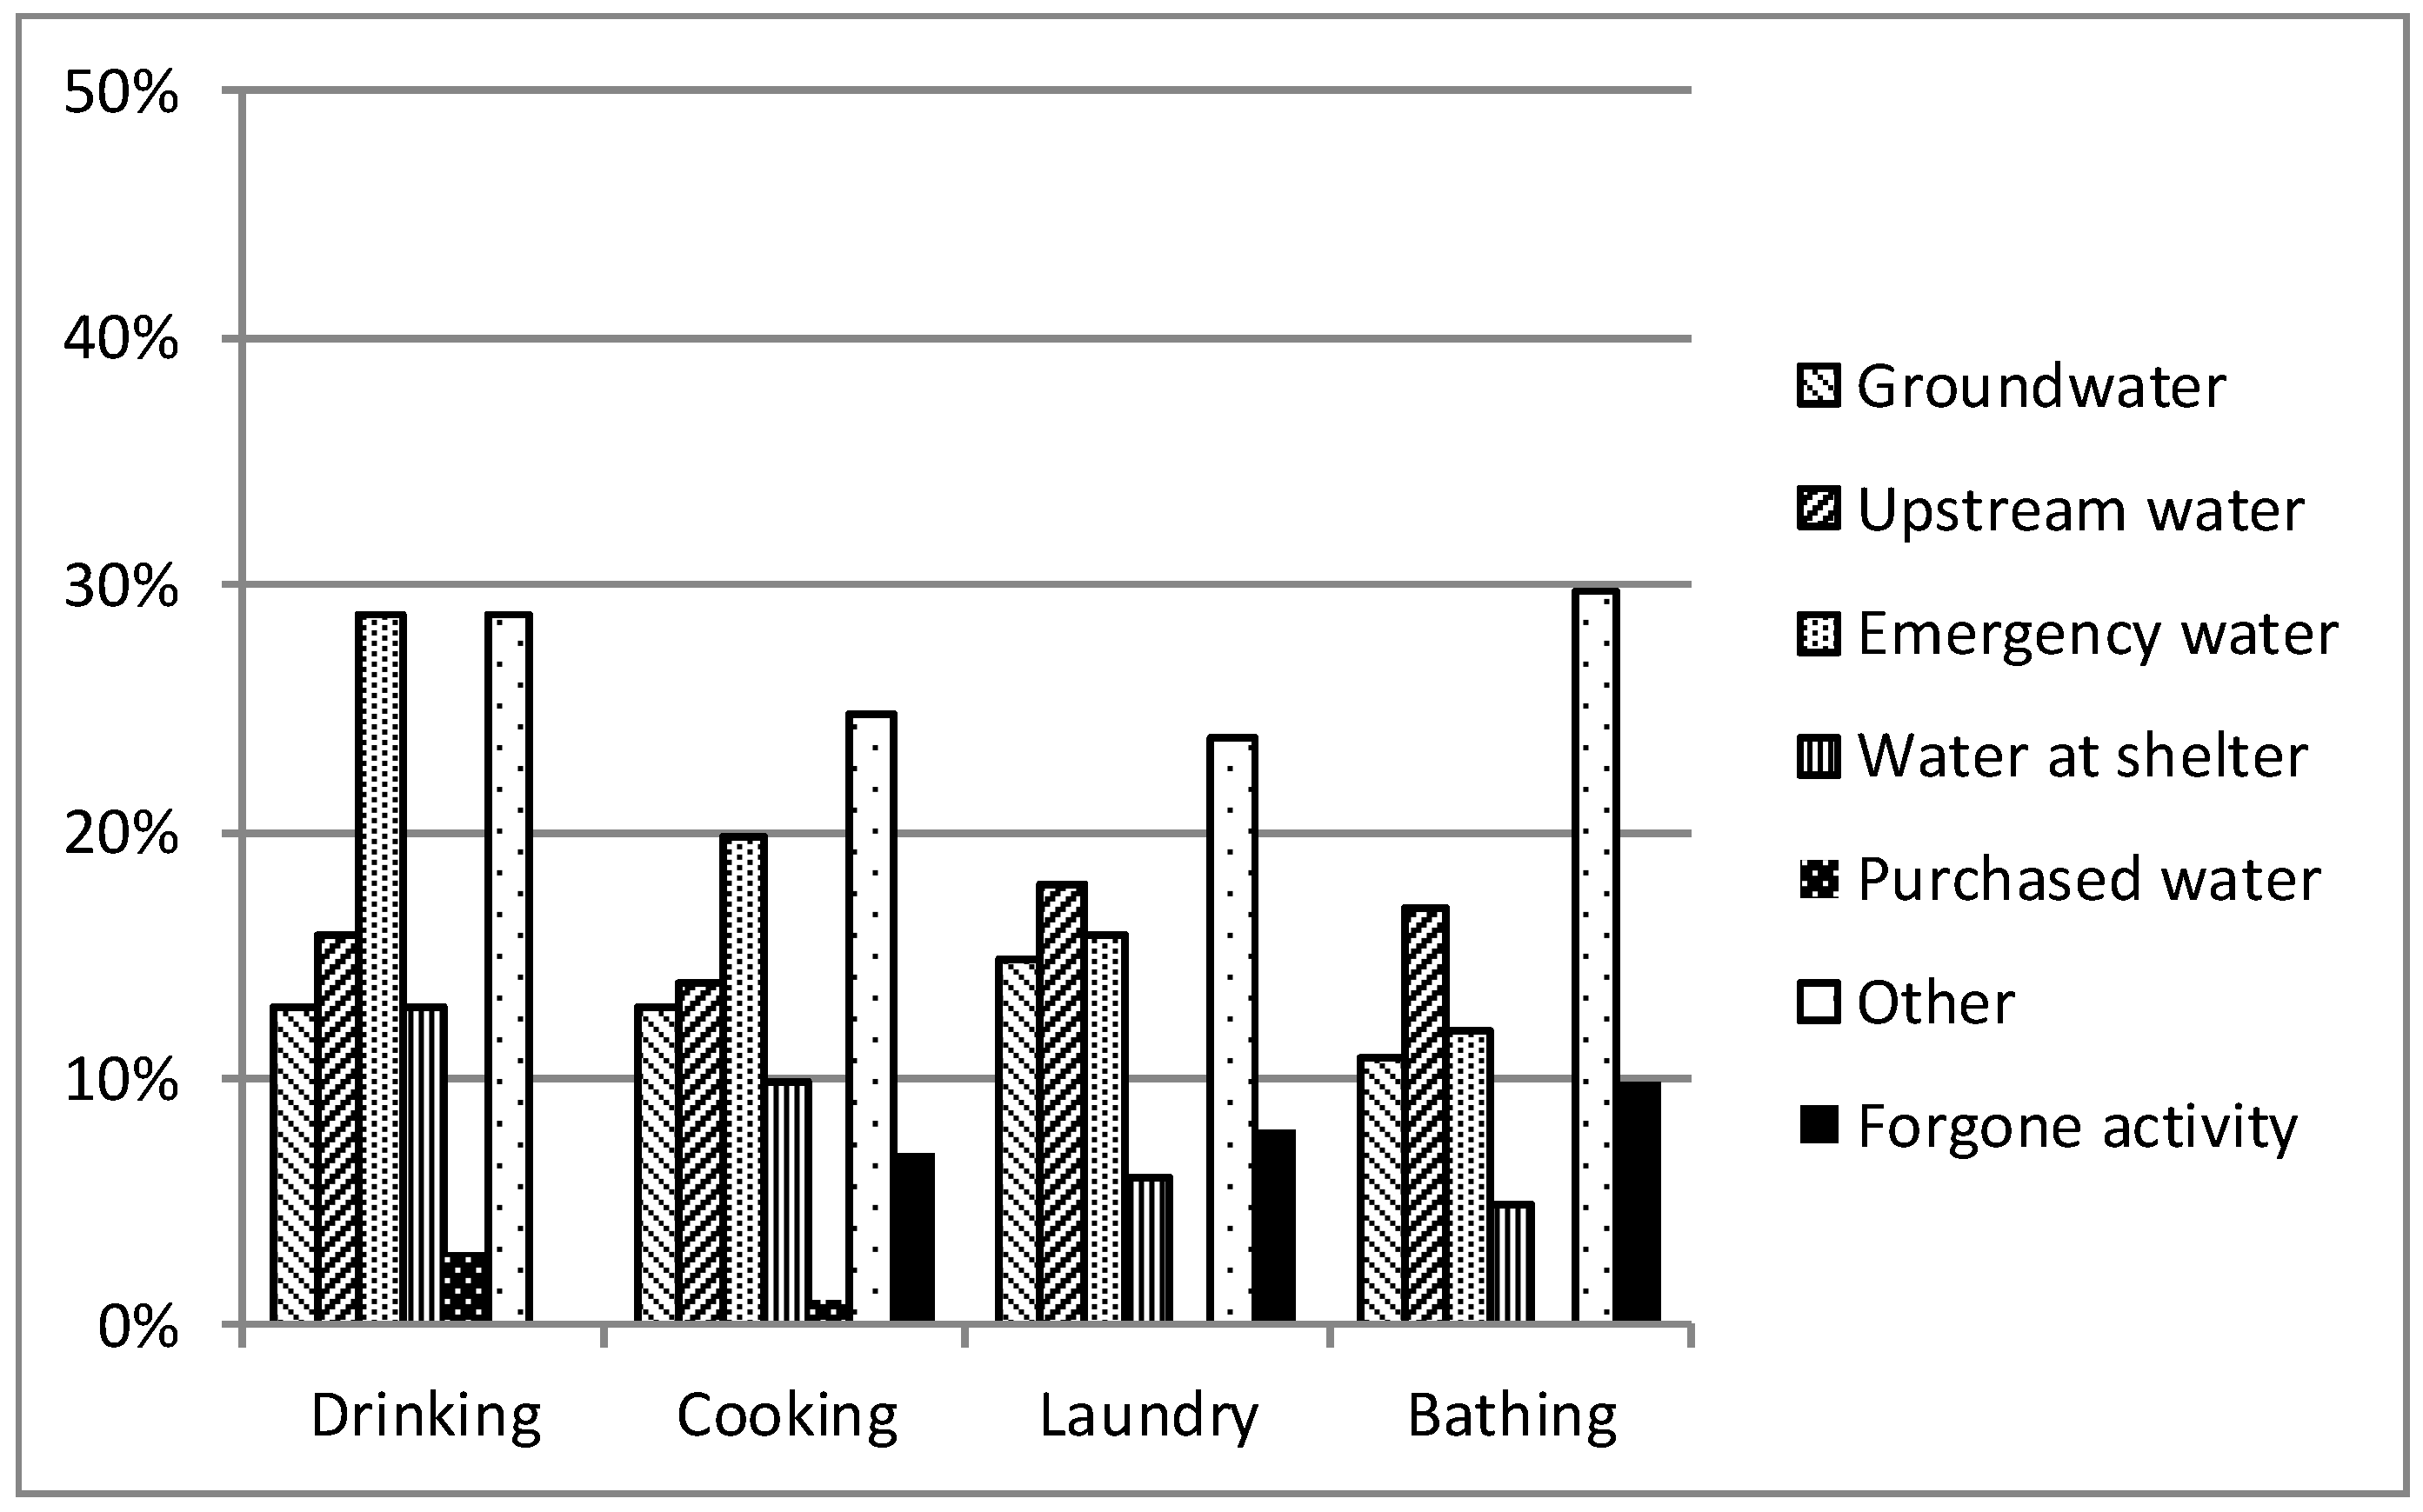
Figure 6.
Water-shortage experience and perception of natural water as adequate emergency water supply: (a) Number of forgone activities; (b) Duration of water shortage.
Figure 6.
Water-shortage experience and perception of natural water as adequate emergency water supply: (a) Number of forgone activities; (b) Duration of water shortage.

Table 1.
Explanatory variables.
| Variable |
|---|
Water-shortage index
|
Use of natural water after tsunami
|
Use of natural water before tsunami
|
Perception of natural water
|
Personal attribute
|
Table 2.
Distributions of personal demographic attributes (%).
| Attribute | Percentage |
|---|---|
| Gender (male) | 40.2 |
| Otsuchi resident during 2011 earthquake | 77.9 |
| Lives in temporary housing | 41.7 |
| Lives with children under 13 years | 13.0 |
| Lives with children aged 13–18 years | 10.0 |
Table 3.
Average values for personal demographic attributes.
| Attribute | Average | Standard Deviation |
|---|---|---|
| Age (years) | 58.6 | 17.1 |
| No. of household members | 2.7 | 1.8 |
| No. of voluntary activities | 0.7 | 0.9 |
Table 4.
Alternative specific conditional logit estimation.
| Variable | Model 1 | Model 2 | ||
|---|---|---|---|---|
| Coefficient | Standard Error | Coefficient | Standard Error | |
| Annual maintenance fee | −0.001 *** | 0.0002 | −0.001 *** | 0.0002 |
| Distance | −0.002 | 0.002 | −0.003 | 0.002 |
| Cleaning weekly | −0.805 *** | 0.176 | −0.868 *** | 0.180 |
| Cleaning monthly | −0.447 *** | 0.174 | −0.481 *** | 0.177 |
| Well | 1.232 *** | 0.241 | 1.645 *** | 0.274 |
| Well × water usage forgone | - | - | −0.938 *** | 0.153 |
| Well × duration of water shortage | - | - | 0.507 *** | 0.114 |
| Number of observations | 1113 | 1113 | ||
| Log-likelihood | −384.9 | −363.0 | ||
| AIC | 780 | 740 | ||
*, **, and *** denote significance at 10%, 5%, and 1% levels, respectively.
Table 5.
Mixed logit estimation.
| Variable | Coefficient | Standard Error |
|---|---|---|
| Mean | ||
| Annual maintenance fee | −0.006 *** | 0.002 |
| Distance | −0.015 | 0.009 |
| Weekly cleaning | −3.318 *** | 1.285 |
| Monthly cleaning | −1.467 *** | 0.555 |
| Well | 8.072 *** | 2.489 |
| Standard Deviation | ||
| Annual maintenance fee | 0.028 | 0.021 |
| Distance | 0.064 *** | 0.023 |
| Weekly cleaning | 4.547 ** | 1.827 |
| Monthly cleaning | 3.129 ** | 1.323 |
| Well | 7.330 *** | 2.347 |
| No. of observations | 1113 | |
| Log likelihood | −295.2 | |
| AIC | 610 | |
*, **, and *** denote significance at 10%, 5%, and 1% levels, respectively. The number of observations was calculated as the total number of choice experiment (CE) questions answered by the respondents multiplied by the number of alternatives per question. The coefficient of annual maintenance fee was a log normal distribution and others were normal distributions.
Table 6.
Regression of individual parameters on explanatory variables (well).
| Variable | Coefficient | Standard Error |
|---|---|---|
| Water-Shortage Experience | ||
| Water usage forgone | −1.879 *** | 0.704 |
| Duration of water shortage | 0.930 *** | 0.341 |
| Natural Water Use Post-Tsunami | ||
| Laundry and bathing during 1st week | 2.318 * | 1.195 |
| Laundry and bathing during 2nd to 5th week | −3.345 ** | 1.296 |
| Perception of Natural Water Use | ||
| Reliable during disasters | 2.032 * | 1.088 |
| Personal Attribute | ||
| Age | −0.603 ** | 0.278 |
| Constant | 10.481 *** | 1.836 |
| Sample size | 93 | |
| R2 | 0.270 | |
| F-test | F(6,86) = 6.52 *** | |
*, **, and *** denote significance at 10%, 5% and 1% levels, respectively. Standard errors are heteroscedasticity-robust.
Table 7.
Regression of individual parameters on explanatory variables (cost and cleaning duty).
| Variable | Cost | Weekly Cleaning | Monthly Cleaning | |||
|---|---|---|---|---|---|---|
| Coefficient | Standard Error | Coefficient | Standard Error | Coefficient | Standard Error | |
| Water shortage experience | ||||||
| Duration of water shortage | 0.001** | 0.0002 | - | - | - | - |
| Natural water use post-tsunami | ||||||
| Laundry and bathing during 2nd to 5th week | - | - | - | - | −0.752 ** | 0.359 |
| Natural water use before tsunami | ||||||
| Laundry and other purposes | - | - | - | - | 1.042 *** | 0.389 |
| Perception of natural water use | ||||||
| Reliable during disasters | 0.004 * | 0.002 | - | - | - | - |
| Personal attribute | ||||||
| Age | - | - | - | - | −0.210 * | 0.126 |
| Lives with children under age 13 years | 0.003 ** | 0.001 | −2.203 *** | 0.832 | - | - |
| Voluntary activity | - | - | −0.809 ** | 0.322 | - | - |
| Constant | 0.013 *** | 0.003 | −2.514 ** | 0.441 | −0.501 | 0.781 |
| Sample size | 93 | 93 | 93 | |||
| R2 | 0.092 | 0.105 | 0.113 | |||
| F-test | F(3, 89) = 2.82 ** | F(2, 90) = 5.65 ** | F(3, 89) = 4.25 *** | |||
*, **, and *** denote significance at 10%, 5% and 1% levels, respectively. Standard errors are heteroscedasticity-robust.
© 2017 by the authors. Licensee MDPI, Basel, Switzerland. This article is an open access article distributed under the terms and conditions of the Creative Commons Attribution (CC BY) license (http://creativecommons.org/licenses/by/4.0/).
Share and Cite
MDPI and ACS Style
Kato, T.; Endo, A. Contrasting Two Dimensions of Disaster-Induced Water-Shortage Experiences: Water Availability and Access. Water 2017, 9, 982. https://doi.org/10.3390/w9120982
AMA Style
Kato T, Endo A. Contrasting Two Dimensions of Disaster-Induced Water-Shortage Experiences: Water Availability and Access. Water. 2017; 9(12):982. https://doi.org/10.3390/w9120982
Chicago/Turabian StyleKato, Takaaki, and Aiko Endo. 2017. "Contrasting Two Dimensions of Disaster-Induced Water-Shortage Experiences: Water Availability and Access" Water 9, no. 12: 982. https://doi.org/10.3390/w9120982
Note that from the first issue of 2016, this journal uses article numbers instead of page numbers. See further details here.