Factors Influencing Stormwater Mitigation in Permeable Pavement

Department of Civil Engineering, The University of Hong Kong, Hong Kong, China
*
Author to whom correspondence should be addressed.
Water 2017, 9(12), 988; https://doi.org/10.3390/w9120988
Submission received: 6 November 2017
/
Revised: 4 December 2017
/
Accepted: 11 December 2017
/
Published: 18 December 2017
(This article belongs to the Special Issue Sponge Cities: Emerging Approaches, Challenges and Opportunities)
Abstract
:Permeable pavement (PP) is used worldwide to mitigate surface runoff in urban areas. Various studies have examined the factors governing the hydrologic performance of PP. However, relatively little is known about the relative importance of these governing factors and the long-term hydrologic performance of PP. This study applied numerical models—calibrated and validated using existing experimental results—to simulate hundreds of event-based and two long-term rainfall scenarios for two designs of PP. Based on the event-based simulation results, rainfall intensity, rainfall volume, thickness of the storage layer and the hydraulic conductivity of the subgrade were identified as the most influential factors in PP runoff reduction. Over the long term, PP performed significantly better in a relatively drier climate (e.g., New York), reducing nearly 90% of runoff volume compared to 70% in a relatively wetter climate (e.g., Hong Kong). The two designs of PP examined performed differently, and the difference was more apparent in the relatively wetter climate. This study generated insights that will help the design and implementation of PP to mitigate stormwater worldwide.
1. Introduction
Natural ground cover allows infiltration [1,2], which stabilises groundwater supply and purifies storm water. Surface runoff is reduced to a relatively low level, because most rainfall events are not large enough to fully saturate the soil. However, urbanisation worldwide has replaced the natural land cover with infrastructure, parking lots, streets and sidewalks, which has greatly disrupted the natural hydrological cycle [2,3]. Excessive use of impervious cover has created problems, such as flooding, water quality degradation and riverbank erosion [1,2,3,4,5]. To mitigate these problems, permeable pavement (PP) has been developed and used worldwide for many years as a form of stormwater control. It aims to mimic natural landscape features, allowing runoff to infiltrate and percolate through its pores, where it is filtered by different layers of aggregates before entering the soil and the environment. PP has been proven to reduce the volume and peak flow of runoff, and delay the timing of peak flow [6,7,8]. In rainfall events of less than 5 mm, the peak runoff was reduced by 95% and the total rainfall volume decreased by 90% [7]. Studies in North Carolina showed that the curve number—an index that indicates the amount of runoff generated from a given land use for a given storm—of PP, ranged from 45 to 89, while that of normal impervious pavement topped the list at 98 [6]. Some other notable benefits of PP include mitigation of the heat island effect and aesthetic enhancement [2].
A typical structure of PP consists of a surface layer, such as permeable concrete (PC), permeable asphalt (PA), permeable interlocking concrete pavers (PICP), or concrete grid pavers (CGP). Underneath the surface layer lies the storage layer, which usually consists of open-graded aggregates, such as ASTM No. 57 [9], or some other size of gravel or sand. The bottommost layer is the subgrade, which is basically the in-situ soil and can thus be of a wide range of conditions. Perforated drainage pipes can be installed within the storage layer or the subgrade. They are used when the subgrade cannot effectively drain away the infiltrated water [10] and are recommended when the infiltration rate of the in-situ soil is less than 15 mm/h [4].
PP can be effective in reducing runoff, but its performance is highly dependent on rainfall conditions. With certain PP designs, both rainfall intensity and rainfall depth are positively related to runoff [11]. Rainfall and runoff, however, do not have simple and linear relationships. Rainfall intensity has an influence when the infiltration rate of the surface layer is less than the rainfall intensity. In such conditions, PP cannot absorb more stormwater, even though the deeper layer of PP has not ‘filled up’. However, runoff is sometimes governed by rainfall depth, as the entire PP can be fully saturated with water flooding up to the surface, producing runoff [11]. Several studies concluded that the amount of runoff is more dependent on rainfall intensity than rainfall depth [8,11,12,13]. In other words, a longer rainfall event, of lower intensity, is less likely to trigger runoff than a shorter event, of high intensity. However, which factor (rainfall intensity or depth) has most influence depends on the actual rainfall pattern and the PP design. An experiment on a PP-refined parking lot showed that when rainfall intensity was greater than 50 mm/h, PP performed, more or less, like impervious asphalt [14]. When the rainfall intensity was reduced to 25 mm/h, PP resulted in a 40–50% reduction in runoff volume and about a 90% reduction in peak runoff [12].
PP, in wetter antecedent conditions, gives a significantly larger amount of runoff and a higher peak runoff [10,11,12]. In the absence of preceding rainfall, PP initiated runoff 5–10 min later and produced a flood peak at least 5% smaller than the values achieved, with a preceding rainfall of 119 mm/h [9]. It was also demonstrated in a laboratory study, that an initially air-dried PP could retain 55% of a 1 h, 15 mm storm, while merely 30% of the storm was retained by an initially wet PP [15]. Furthermore, experiments on PP showed that, even when a second rainfall event was less intense than a first, runoff produced by the later event was greater [12].
The design of PP is also important. As expected, the thicker the storage layer, the more effective the PP is in reducing runoff [16]. In terms of surface layers, PC and PICP were found to better reduce runoff and to have higher infiltration rates than CGP and PA [6,12,17]. However, the difference was only observable during extreme rainfall (e.g., >130 mm/h) [4]. Furthermore, the steeper the PP surface, the more runoff it generates [18]. A slope of around 1% is ideal, and it should not exceed 5% for structural stability [4]. Furthermore, PP relies on subgrade soil or an underdrain to drain away the water within the storage layer. High conductivity of the subgrade soil [19] or the presence of an underdrain prevents the PP from being ‘filled up’, resulting in less runoff [18].
Some factors influential to PP runoff have been thoroughly investigated (e.g., antecedent level, surface infiltration rate), and the general relationships between runoff and certain design parameters (e.g., storage thickness, subgrade conductivity and surface slope) have been experimentally confirmed. However, their relative importance has seldom been examined. This study therefore used numerical modelling to simulate the hydrologic performance of PP under different rainfall conditions and PP designs, with the aim of identifying the relative importance of each factor to runoff reduction. In addition to short-term design storm based simulations, long-term simulations that made use of tens of years of actual rainfall data were performed, to analyse the long-term runoff reduction of PP.
2. Materials and Methods
2.1. Model Development and Calibration
This study applied the Storm Water Management Model version 5.0 (SWMM 5, United States Environmental Protection Agency, Washington, DC, USA), which generates dynamic rainfall–runoff simulation models for single and continuous rainfall events. SWMM 5 can model the hydrologic performance of several types of low impact development controls, including PP. The numerical models developed in this study were based on rainfall-runoff experiments carried out at the Mentougou experimental station of the Beijing Hydraulic Research Institute [11]. Four treatments were used in these experiments (A, B, C and D). Numerical models were only developed for Treatments A, C and D, as Treatments B and C were very similar in structure. Both Treatments A and C were permeable pavements with permeable concrete blocks at the surface. Treatment A used only sand as the storage layer, while treatment C used concrete without sand plus aggregate as the storage layer. Treatment D was impervious, and acted as the control. The cross-sections of the selected permeable pavements and the control are listed in Table 1.
The experimental parameters from [11] were used, or common values were assumed if the data were missing, as listed in Table 2. However, there were two exceptions. First, the area of each treatment in [11] was only 6 m2, while the area simulated in the models was 6000 m2, to mimic the size of a real-life PP system (e.g., a large parking lot). Higher numerical precision was achieved with the SWMM, because the outputs are always rounded to 2 decimal points, irrespective of the PP size. The simulated PP was assumed not to receive runoff from the surrounding area. Second, the layer of concrete sub-base without sand in Treatment C was regarded as an aggregate, with a thickness scaled according to its relative porosity, and was modelled with the actual aggregate sub-base underneath as a single layer. This simplification caused minimal computational error, because the concrete layer was thin.
For calibration, the models were subjected to a relatively large rainfall event (a rainfall intensity of 59.36 mm/h for one hour). After fine-tuning some of the parameters, the calibrated models were subjected to the same rainfall intensity, but for two hours, for validation. The accuracy of the model was evaluated by computing the correlation coefficient (R-squared) and the Nash–Sutcliffe model efficiency coefficient (NSE), using the experimental and simulated runoff of the PP.
2.2. Event-Based Simulations
Based on the calibrated and validated models, eight parameters were varied, to understand their influence on runoff generation, as summarised in Table 3. At least two representative values for each of the eight parameters were examined, producing a total of 384 runoff hydrographs for Treatments A and C. The rainfall parameters were selected to represent large and extreme events, with reference to rainfall conditions in different continental regions. For example, in Hong Kong, China, rainfall of 60 mm/h that lasts for 1 and 2 h, represents events with return periods of less than 2 and 5 years, respectively, while rainfall of 120 mm/h that lasts for 1 and 2 h, represents events of return periods of 20 and more than 100 years, respectively [20]. However, in Auckland, New Zealand, and New York City, USA, rainfall of 60 mm/h that lasts for 1 h already has a return period of more than 10 years, while the other simulated events have return periods that are generally more than 100 years [21,22]. A consistent comparison of performance could be performed across scenarios, because only the parameters of interest were varied and this variation was systematic. For each hydrograph, three performance indicators—peak runoff, time to runoff initiation and runoff duration—were extracted. The correlation of each of the eight parameters with each of the performance indicators was analysed.
2.3. Long-Term Simulations
To understand the average performance of PP over a prolonged period, long-term simulations (i.e., 10 years or longer) were also performed, using the models of Treatments A, C and D. Long-term continuous simulations, unlike event-based simulations, can factor in antecedent conditions. Real rainfall data was used as the model inputs to better capture the actual rainfall characteristics (e.g., temporal pattern, including consecutive rainfall events). As rainfall conditions influence PP performance, two locations of different rainfall characteristics, namely, Hong Kong, China and New York, US, were selected. Twelve years of data (1 January 2003–31 December 2014) from Lok Ma Chau Station (LMC) in Hong Kong and around 45 years of data (4 April 1969–31 December 2013) from John. F. Kennedy International Airport (JFK) in New York were used. The LMC station represents a sub-tropical climate, whereas the JFK station represents a warm temperate climate, with annual average rainfall depths of 1780 mm and 1074 mm, respectively. Apart from having a higher annual average rainfall, the year-to-year fluctuation is also larger at LMC than at JFK. The two stations have similar fractions (i.e., 39.9% and 38.9%) of small to medium rainfall events, with a depth of less than 5 mm. However, 7.2% and 3.0% of rainfall events at LMC are between 100 and 200 mm and above 200 mm, respectively, while the corresponding figures for JFK are only 0.6% and 0.1%. Therefore, there are larger event-to-event variations at LMC than at JFK. The implementation of PP is at an early stage in Hong Kong and there is no existing design guideline. The PP models of Treatments A and C are rather generic, and the parameters are generally within the recommended values for New York [23,24].
3. Results and Discussion
3.1. Calibration and Validation
The simulated results generally matched the experimental results. Figure 1 shows the calibration and validation of Treatment A as an example, demonstrating a good match in the time to initiation, peak, rising and falling limbs. The R-squared and the NSE for all three treatments are summarised in Table 4, and were, in general, very high. The R-squared and the NSE of Treatment C were lower during calibration, but were still very high during validation. Overall, the models were found to be well calibrated and validated, and thus appropriate for use in the event-based and long-term simulations.
3.2. Event-Based Simulations
The correlations between each of the eight parameters and each of the three performance indicators are given in Table 5. The parameters for Treatments A and C correlated in a similar pattern, with all three performance indicators.
In terms of rainfall characteristics, rainfall intensity, rainfall volume and rainfall duration were all correlated. Rainfall intensity and rainfall volume were correlated with all three performance indicators, while rainfall duration governed runoff duration. As suggested in the introduction, rainfall intensity generally played a more dominant role in runoff generation than rainfall volume, which was confirmed by the slightly higher correlations between peak runoff and time to runoff initiation with rainfall intensity compared to their correlations with rainfall volume. Rainfall duration, however, did not correlate with these two performance indicators. The general conclusion was, therefore, that runoff from PP is mostly governed by rainfall intensity, followed by rainfall volume and then by rainfall duration.
Among the five design parameters, storage depth was the most influential factor, followed by the conductivity of the subgrade soil. Storage depth strongly governed the time to runoff initiation, and also influenced runoff duration. Its influence on peak runoff was similar to that of subgrade conductivity, which also correlated strongly with runoff duration. Based on these results, engineers should focus more on the selection and optimisation of the storage depth and subgrade conductivity in PP design, as the other factors do not matter as much. This is particularly true if the design rainfall is of a high volume (e.g., continuous rain), because both storage depth and subgrade conductivity enhances the subsurface storage capacity and the dissipation of water to restore that capacity. In contrast, surface parameters (e.g., surface slope and Manning’s roughness) are more related to high-intensity events (e.g., short intense storms) but are not as influential.
3.3. Long-Term Simulations
In the long-term simulation with the LMC data, Treatment A generally absorbed entire rainfall events of less than 10 mm, and partially reduced runoff in events larger than 10 mm. However, the reduction was not significant for events larger than 20 mm. Treatment C in general reduced runoff more significantly than Treatment A, effectively draining away events up to 20 mm, and the reduction was not significant, only in events larger than 40 mm. As in the event-based simulations, the two most influential design parameters were storage depth and subgrade conductivity. Treatments A and C had the same subgrade conductivity, and therefore the differences in their performance can be mostly attributed to the different storage depths of 200 and 240 mm. Both treatments generally reduced less runoff in wet antecedent conditions (i.e., preceding rainfall), as discussed in the introduction. However, it is challenging to determine the exact impact of the antecedent conditions on the two treatments from the simulations with long-term real rainfall data, because each rainfall event is unique, in terms of its size and temporal distribution, and also, the two treatments would have had different antecedent conditions for each event. Overall, similar observations were made in the JFK simulation.
For ease of comparison, the total volumetric reduction percentages were used to compare the foregoing results with the simulation results for Treatment D (the control). For LMC, throughout the 12 years of simulation, Treatment A and Treatment C, on average, gave volumetric reductions of 63 and 74%, respectively. For JFK, the two treatments reduced appreciably more runoff than at LMC, with volumetric reductions of 90% and 96% in the relatively drier climate of New York. The two treatments performed similarly in the relatively drier climate. It is therefore suggested that it is more important to optimise the design of PP in a location with a wetter climate like that of LMC. This recommendation is consistent with the conclusion drawn from the event-based simulations, that the more influential design parameters (storage depth and subgrade conductivity) should be more carefully selected if the design rainfall is of high volume.
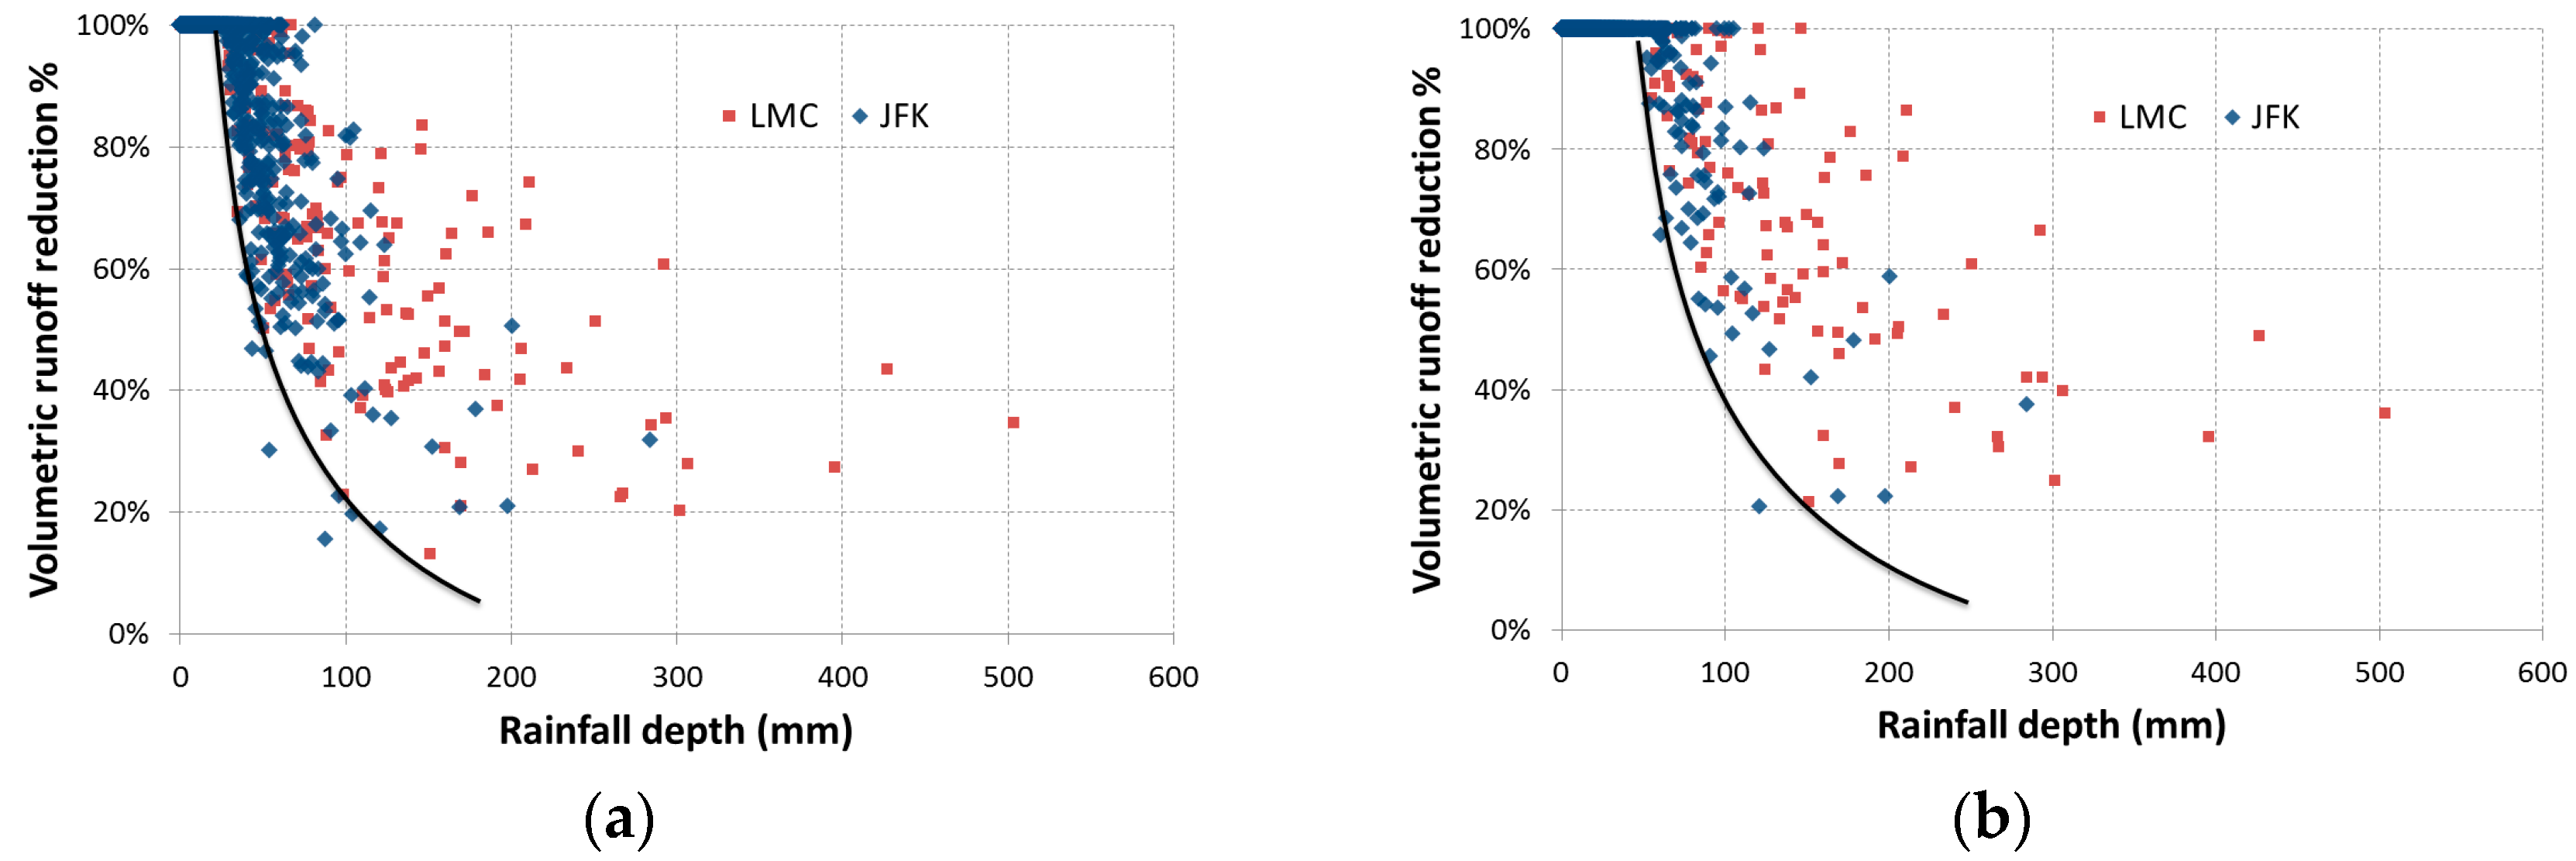
In addition to analysing the aggregate performance across years, the performance during individual rainfall events was also analysed. Two storm events were considered to be independent if they were separated by a dry spell of 24 h [25]. Figure 2 shows the negative relationships between the volumetric runoff reduction percentages and rainfall depths for Treatments A and C. There was a 100% reduction at low rainfall depths, and an exponential decrease in reduction as the rainfall depth increased. The performance at smaller rainfall depths was similar for both LMC and JFK, while there was a lower volumetric runoff reduction at LMC during extreme events with high rainfall depths. Curves have been added to Figure 2a,b to indicate the general lower bounds of the volumetric runoff reduction percentages for rainfall depths greater than 28 and 51 mm, respectively, for Treatments A and C.
Table 6 presents the percentage of rainfall events at each level of volumetric runoff reduction. Most rainfall events were fully absorbed by the PP (i.e., 76.7% and 91.4% of the events at LMC and JFK for Treatment A, and 93.2% and 97.6% of the events at LMC and JFK for Treatment C). Only a small percentage of events had volumetric runoff reductions of less than 40% (i.e., 3.2% and 0.4% of events at LMC and JFK for Treatment A, and 0.3% and 0.1% of events at LMC and JFK for Treatment C).
4. Conclusions
This study applied numerical modelling to identify the relative importance of each rainfall and design parameter to runoff reduction in PP. Based on a correlation analysis, the runoff from PP was found to be mostly governed by rainfall intensity, followed by rainfall volume and rainfall duration. In terms of PP design, the depth of the storage layer and the hydraulic conductivity of the subgrade soil had the most influence on runoff reduction, while other parameters had a minimal influence.
The results of the long-term simulations indicated that PP performed significantly better in a relatively drier climate (New York), reducing nearly 90% of the runoff volume compared to 70% in a relatively wetter climate (Hong Kong). The two designs of PP examined (Treatments A and C) performed differently, and the difference was more apparent in the wetter climate, suggesting that detailed design and optimisation of PP are more worthwhile in this environment. Analysis of individual events, within the long-term simulations, showed that most events (over 75% for Treatment A in Hong Kong, and over 90% in the other cases) were fully absorbed by the PP. Only a small percentage of events (i.e., less than 5% for Treatment A in Hong Kong and less than 1% in the other cases) had volumetric reductions of less than 40%.
Overall, this study generated insights on the relative importance of various factors governing runoff reduction and the long-term hydrologic performance of PP, which will help the design and implementation of PP to mitigate stormwater worldwide. It covered several rainfall conditions and PP design parameters, and both event-based and long-term hydrologic performance of PP. The scenarios considered were representative, but by no means exhaustive. Future work should consider more parameters and wider ranges of parameter values. Further questions that should be examined include the impact of antecedent moisture on the performance of different designs of PP and the optimal PP design for different climatic conditions. Finally, this study could only examine hundreds of scenarios, because it used numerical modelling. Although the models were well calibrated and validated, the results are still based on the assumptions built into the SWMM.
Acknowledgments
The work described in this paper was funded by a grant from the Research Grants Council of the Hong Kong Special Administrative Region, China (Project No. HKU17255516).
Author Contributions
Both authors conceived and designed the numerical experiments; C. Y. Liu performed the numerical experiments and analyzed the data; both authors wrote the paper.
Conflicts of Interest
The authors declare no conflict of interest.
References
- San Mateo Countywide Water Pollution Prevention Program. Stormwater Technical Guidance; Version 3.2.; San Mateo Countywide Water Pollution Prevention Program: San Mateo, CA, USA, 2013. [Google Scholar]
- Interpave. Guide to the Design, Construction and Maintenance of Concrete Block Permeable Pavements, 6th ed.; Interpave, The Precast Concrete Paving & Kerb Association, Product Association of the British Precast Concrete Federation Ltd.: Leicester, UK, 2010. [Google Scholar]
- Moglen, G. Hydrology and impervious areas. J. Hydrol. Eng. 2009, 14, 303–304. [Google Scholar] [CrossRef]
- Toronto and Region Conservation Authority (TRCA); Credit Valley Conservation Authority (CVC). Low Impact Development Stormwater Management Planning and Design Guide; Version 1.0; TRCA: Toronto, ON, Canada; CVC: Mississauga, ON, USA, 2010. [Google Scholar]
- Todeschini, S. Hydrologic and environmental impacts of imperviousness in an industrial catchment of Northern Italy. J. Hydrol. Eng. 2016, 21. [Google Scholar] [CrossRef]
- Bean, E.Z.; Hunt, W.F.; Bidelspach, D.A. Evaluation of four permeable pavement sites in eastern North Carolina for runoff reduction and water quality impacts. J. Irrig. Drain. Eng. 2007, 133, 583–592. [Google Scholar] [CrossRef]
- Brattebo, B.O.; Booth, D.B. Long-term stormwater quantity and quality performance of permeable pavement systems. Water Res. 2003, 37, 4369–4376. [Google Scholar] [CrossRef]
- Hunt, B.; Stevens, S.; Mayes, D. Permeable pavement use and research at two sites in Eastern North Carolina. In Global Solutions for Urban Drainage, Proceedings of the 9th International Conference on Urban Drainage, Portland, OR, USA, 8–13 September 2002; ASCE: Reston, VA, USA, 2002. [Google Scholar]
- Ferguson, B.K. Porous Pavements; CRC Press: Boca Raton, FL, USA, 2005. [Google Scholar]
- Dreelin, E.A.; Fowler, L.; Carroll, C.R. A test of porous pavement effectiveness on clay soil during natural storm. Water Res. 2006, 40, 799–805. [Google Scholar] [CrossRef] [PubMed]
- Hou, L.; Feng, S.; Hou, Z.; Ding, Y.; Zhang, S. Experimental study on rainfall-runoff relation for porous pavements. Hydrol. Res. 2008, 39, 181–190. [Google Scholar] [CrossRef]
- Collins, K.A.; Hunt, W.F.; Hathaway, J.M. Hydrologic comparison of four types of permeable pavement and standard asphalt in eastern North Carolina. J. Hydrol. Eng. 2008, 13, 1146–1157. [Google Scholar] [CrossRef]
- Valavala, S.; Montes, F.; Haselbach, L.M. Area-rated rational coefficients for Portland cement pervious concrete pavement. J. Hydrol. Eng. 2006, 11, 257–260. [Google Scholar] [CrossRef]
- Rushton, B.T. Low impact parking lot reduces runoff and pollutant loads. J. Water Resour. Plan. Manag. 2001, 127, 172–179. [Google Scholar] [CrossRef]
- Andersen, C.T.; Foster, I.D.L.; Pratt, C.J. Role of urban surfaces permeable pavements in regulating drainage and evaporation: Development of a laboratory simulation experiment. Hydrol. Process. 1999, 13, 597–609. [Google Scholar] [CrossRef]
- Yoo, C.; Ku, J.M.; Jun, C.; Zhu, J.H. Simulation of infiltration facilities using the SEEP/W model and quantification of flood runoff reduction effect by the decrease in CN. Water Sci. Technol. 2016, 74, 118–129. [Google Scholar] [CrossRef] [PubMed]
- Sañudo-Fontaneda, L.A.; Charlesworth, S.M.; Castro-Fresno, D.; Andres-Valeri, V.C.A.; Rodriguez-Hernandez, J. Water quality and quantity assessment of pervious pavements performance in experimental car park areas. Water Sci. Technol. 2014, 69, 1526–1533. [Google Scholar] [CrossRef] [PubMed]
- Straet, F.; Beckers, E.; Degre, A. Hydraulic behavior of greened porous pavements: A physical study. In Proceedings of the 11th International Conference on Urban Drainage, Edinburgh, UK, 31 August–5 September 2008. [Google Scholar]
- Chui, T.F.M.; Liu, X.; Zhan, W. Assessing cost-effectiveness of specific LID practice designs in response to large storm events. J. Hydrol. 2016, 533, 353–364. [Google Scholar] [CrossRef]
- Geotechnical Engineering Office (GEO); Civil Engineering and Development Department; The Government of the Hong Kong Special Administrative Region. New Intensity-Duration-Frequency Curves for Slope Drainage Design; GEO Technical Guidance Note No. 30; GEO: Hong Kong, China, 2011.
- Auckland Regional Council (ARC). Stormwater Management Devices: Design Guidelines Manual; ARC Technical Publication 10; ARC: Auckland, New Zealand, 2003. [Google Scholar]
- Cornell University. Extreme Precipitation in New York and New England. An Interactive Web Tool for Extreame Precipitation Analysis. Available online: http://precip.eas.cornell.edu (accessed on 12 October 2017).
- New York City Department of Transportation. Street Design Manual, 2nd ed.; New York City Department of Transportation: New York, NY, USA, 2015.
- Basch, E.; Brana, R.; Briggs, E.; Chang, C.; Iyalla, A.; Logsdon, D.; Meinke, R.; Moomjy, M.; Price, O.D.; Sinckler, S. Roadmap for Pervious Pavement in New York City. In A Strategic Plan for the New York City Department of Transportation; The Earth Institute, Columbia University: New York, NY, USA, 2012. [Google Scholar]
- Vandenberghe, S.; Verhoest, N.; Buyse, E.; Baets, B.D. A stochastic design rainfall generator based on copulas and mass curves. Hydrol. Earth Syst. Sci. 2010, 14, 2429–2442. [Google Scholar] [CrossRef]
Figure 1.
(a) Calibration and (b) validation of Treatment A.
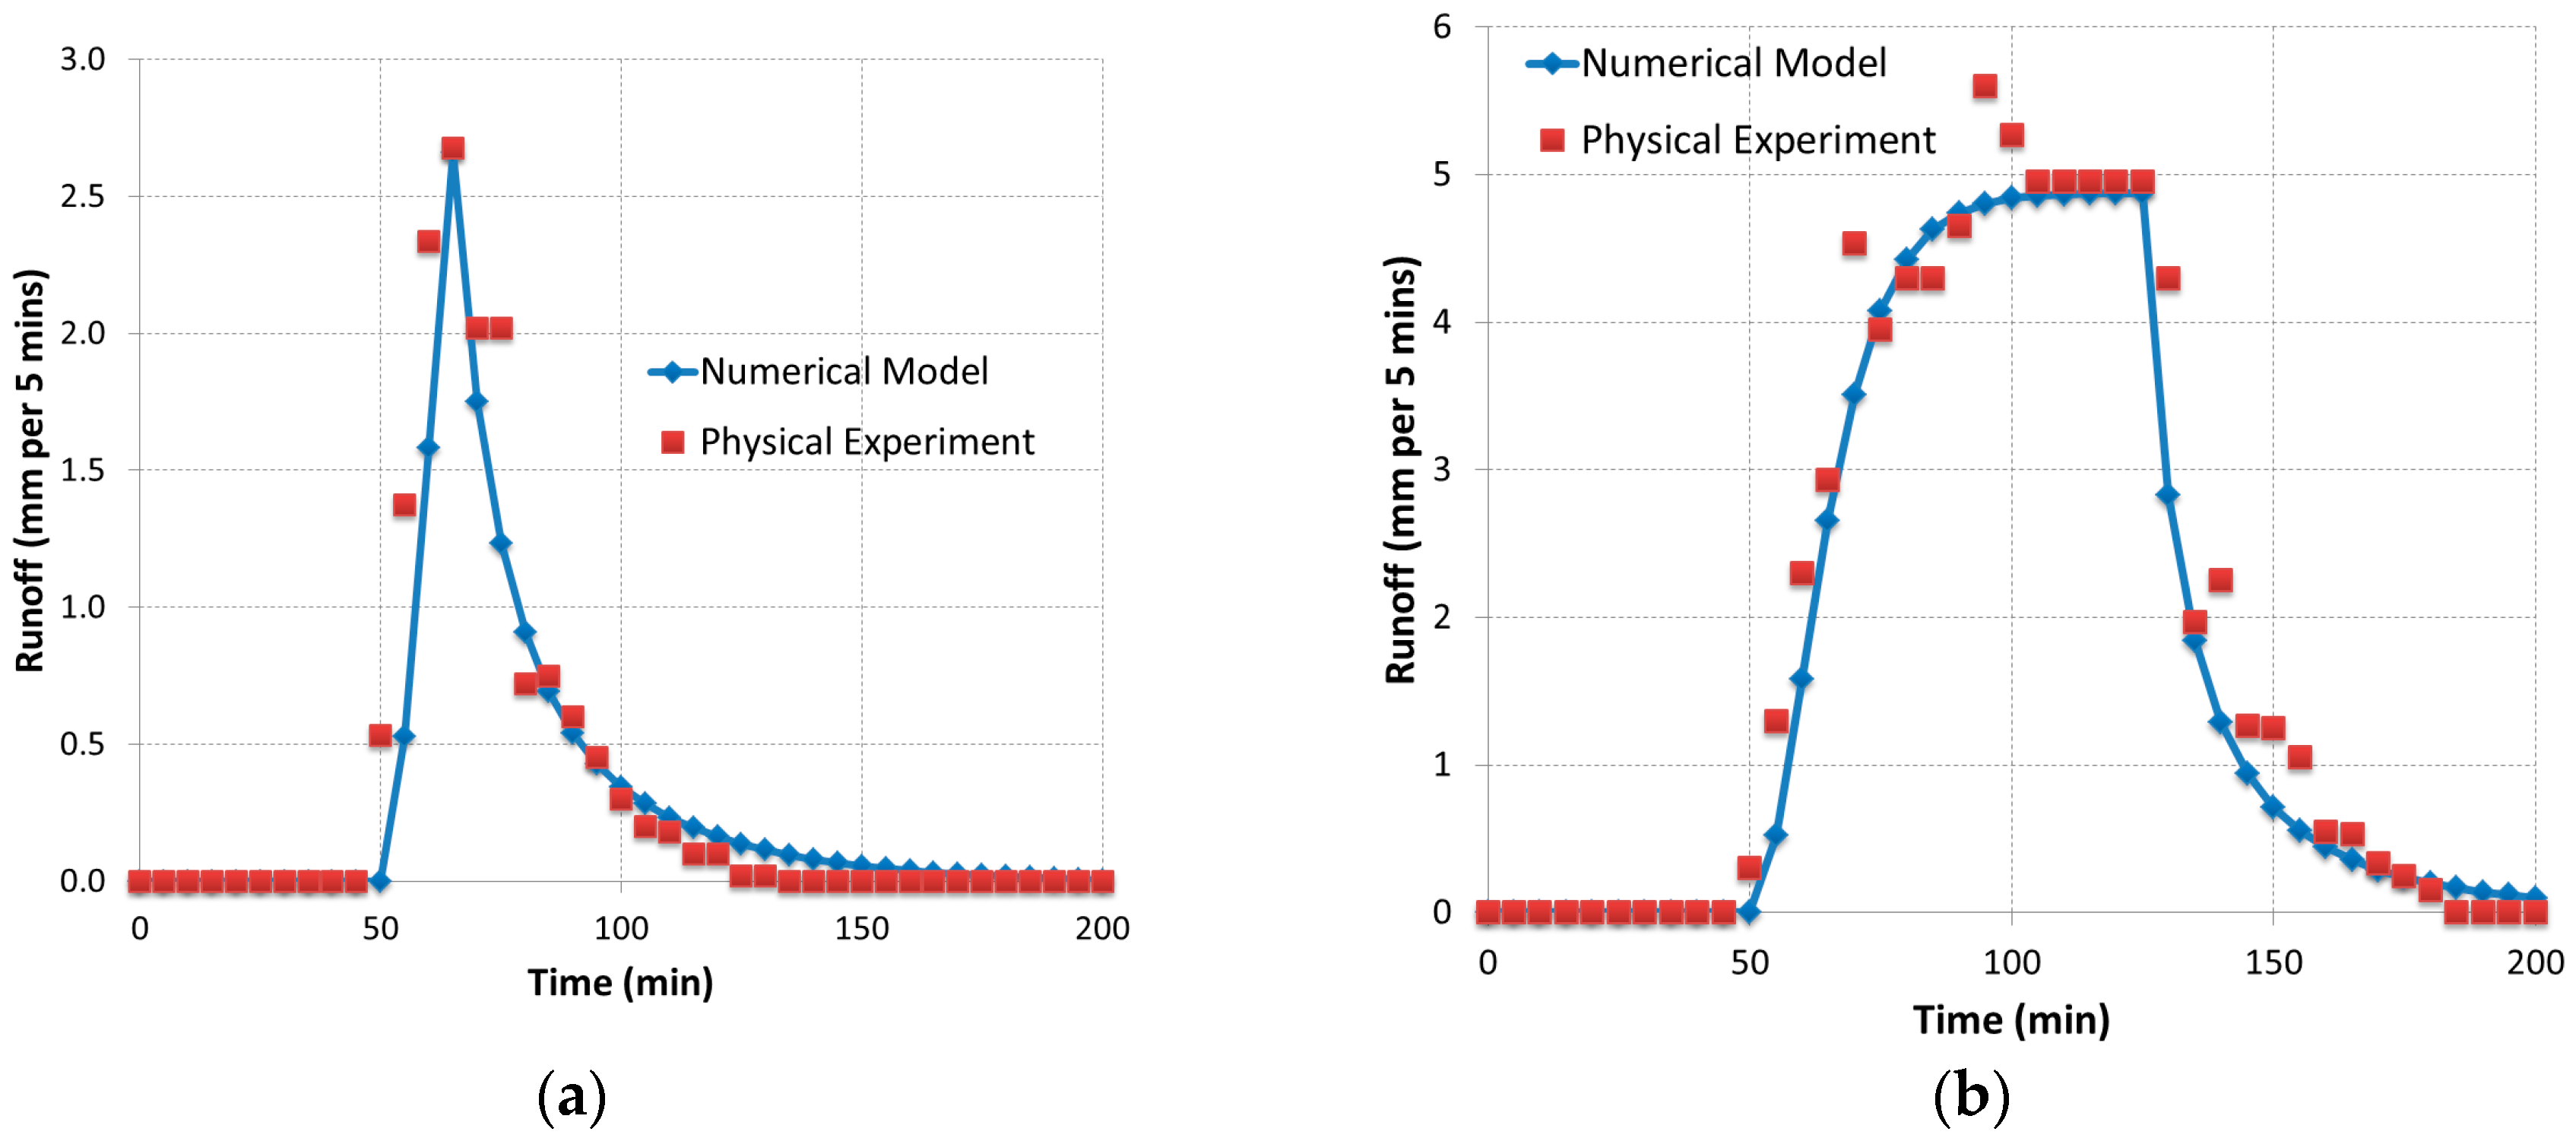
Figure 2.
Relationships between percentage of volumetric runoff reduction and rainfall depth for Treatments A (a) and C (b).
Figure 2.
Relationships between percentage of volumetric runoff reduction and rainfall depth for Treatments A (a) and C (b).


Table 1.
Cross-sections of the selected permeable pavements and the control (Treatments A, C and D) used for modelling. The numbers in brackets indicate the thickness in mm. Information extracted from [11].
Table 1.
Cross-sections of the selected permeable pavements and the control (Treatments A, C and D) used for modelling. The numbers in brackets indicate the thickness in mm. Information extracted from [11].
| Treatment A | Treatment C | Treatment D |
|---|---|---|
| Porous concrete block paving (60) | Porous concrete block paving (60) | Impervious surfaces (60) |
| Sand sub-base (200) | Concrete sub-base without sands (50) | Concrete (150) |
| Subgrade (640) | Aggregate sub-base (200) | Subgrade (740) |
| Subgrade (740) |
Table 2.
Input parameters of the pavement types for calibration and validation.
| Treatment A | Treatment C | Treatment D | ||||||
|---|---|---|---|---|---|---|---|---|
| Surface and pavement blocks | Manning’s roughness | 0.1 1 | Surface & pavement blocks | Manning’s roughness | 0.06 1 | Surface | Manning’s roughness | 0.1 1 |
| Slope (%) | 1.5 1 | Slope (%) | 1.35 1 | Slope (%) | 1.5 1 | |||
| Thickness (mm) | 60 | Thickness (mm) | 60 | |||||
| Conductivity (mm/h) | 2840 | Conductivity (mm/h) | 2840 | Conductivity (mm/h) | 0 | |||
| Sand | Thickness (mm) | 200 | Aggregate | Effective thickness (mm) 2 | 240 | Not applicable | ||
| Porosity | 0.3 1 | Void ratio | 0.2 1 | |||||
| Subgrade soil | Conductivity (mm/h) | 0.821 | Subgrade soil | Conductivity (mm/h) | 0.821 | |||
Note: 1 Obtained from calibration. Others extracted directly from [11]. 2 Effective thickness combined the thickness of the actual aggregate layer and the scaled thickness of the concrete layer.
Table 3.
Range of parameter values for Treatments A and C during the event-based simulations.
| Parameters | Symbol | Input Values |
|---|---|---|
| Rainfall intensity (mm/h) | i | 60, 120 |
| Rainfall volume (mm) | V | 60, 120, 240 |
| Rainfall duration (h) | t | 1, 2 |
| Slope of pavement surface (%) | s | 1, 3 |
| Manning’s roughness | n | 0.05, 0.1 |
| Thickness of storage layer (mm) | d | 75, 200, 400 |
| Porosity of storage layer | φ | 0.35, 0.50 (Treatment A) 0.26, 0.46 (Treatment C) |
| Hydraulic conductivity of subgrade soil (mm/h) | k | 2, 25 |
Table 4.
Accuracy of calibration and validation.
| Process | Treatment | R-Squared | Nash–Sutcliffe Model Efficiency Coefficient |
|---|---|---|---|
| Calibration | A | 0.91 | 0.88 |
| C | 0.62 | 0.51 | |
| D | 0.96 | 0.95 | |
| Validation | A | 0.97 | 0.97 |
| C | 0.96 | 0.95 | |
| D | 0.97 | 0.97 |
Table 5.
Correlation matrix for Treatments A and C.
| Treatment | Parameters | Peak Runoff | Time to Runoff Initiation | Runoff Duration |
|---|---|---|---|---|
| A | i (mm/h) | 0.73 | −0.43 | 0.36 |
| V (mm) | 0.71 | −0.41 | 0.57 | |
| t (h) | 0.28 | −0.16 | 0.46 | |
| s | 0.03 | −0.01 | −0.09 | |
| n | −0.04 | 0.00 | 0.12 | |
| d (mm) | −0.37 | 0.68 | −0.50 | |
| φ | −0.09 | 0.24 | −0.16 | |
| k (mm/h) | −0.25 | 0.16 | −0.46 | |
| C | i (mm/h) | 0.76 | −0.46 | 0.34 |
| V (mm) | 0.69 | −0.44 | 0.57 | |
| t (h) | 0.22 | −0.20 | 0.46 | |
| s | 0.03 | −0.00 | −0.10 | |
| n | −0.03 | −0.00 | 0.12 | |
| d (mm) | −0.33 | 0.66 | −0.50 | |
| φ | −0.13 | 0.22 | −0.18 | |
| k (mm/h) | −0.27 | 0.13 | −0.45 |
Note: Degree of association: strongly negative, fairly strongly negative, fairly strongly positive, strongly positive.
Table 6.
Percentage of rainfall events at each level of volumetric runoff reduction.
| Volumetric Runoff Reduction % | Lok Ma Chau Station (LMC) | John F Kennedy International Airport (JFK) | ||
|---|---|---|---|---|
| Treatment A | Treatment C | Treatment A | Treatment C | |
| 100% | 76.7% | 93.2% | 91.4% | 97.6% |
| 85–100% | 4.2% | 2.1% | 3.1% | 1.0% |
| 60–85% | 9.2% | 2.7% | 3.8% | 0.8% |
| 40–60% | 6.8% | 1.6% | 1.3% | 0.4% |
| 0–40% | 3.2% | 0.3% | 0.4% | 0.1% |
© 2017 by the authors. Licensee MDPI, Basel, Switzerland. This article is an open access article distributed under the terms and conditions of the Creative Commons Attribution (CC BY) license (http://creativecommons.org/licenses/by/4.0/).
Share and Cite
MDPI and ACS Style
Liu, C.Y.; Chui, T.F.M. Factors Influencing Stormwater Mitigation in Permeable Pavement. Water 2017, 9, 988. https://doi.org/10.3390/w9120988
AMA Style
Liu CY, Chui TFM. Factors Influencing Stormwater Mitigation in Permeable Pavement. Water. 2017; 9(12):988. https://doi.org/10.3390/w9120988
Chicago/Turabian StyleLiu, Chun Yan, and Ting Fong May Chui. 2017. "Factors Influencing Stormwater Mitigation in Permeable Pavement" Water 9, no. 12: 988. https://doi.org/10.3390/w9120988
Note that from the first issue of 2016, this journal uses article numbers instead of page numbers. See further details here.