Article

Surface Water and Groundwater Interactions in Traditionally Irrigated Fields in Northern New Mexico, U.S.A.

by
Karina Y. Gutiérrez-Jurado
1,
Alexander G. Fernald
2,
Steven J. Guldan
3 and
Carlos G. Ochoa
4,*
1
School of the Environment, Flinders University, Bedford Park, SA 5042, Australia
2
Water Resources Research Institute, New Mexico State University, Las Cruces, NM 88003, USA
3
Sustainable Agriculture Science Center, New Mexico State University, Alcalde, NM 87511, USA
4
Department of Animal and Rangeland Sciences, Oregon State University, Corvallis, OR 97331, USA
*
Author to whom correspondence should be addressed.
Water 2017, 9(2), 102; https://doi.org/10.3390/w9020102
Submission received: 18 December 2016 / Revised: 24 January 2017 / Accepted: 3 February 2017 / Published: 10 February 2017

Abstract

:
Better understanding of surface water (SW) and groundwater (GW) interactions and water balances has become indispensable for water management decisions. This study sought to characterize SW-GW interactions in three crop fields located in three different irrigated valleys in northern New Mexico by (1) estimating deep percolation (DP) below the root zone in flood-irrigated crop fields; and (2) characterizing shallow aquifer response to inputs from DP associated with irrigation. Detailed measurements of irrigation water application, soil water content fluctuations, crop field runoff, and weather data were used in the water budget calculations for each field. Shallow wells were used to monitor groundwater level response to DP inputs. The amount of DP was positively and significantly related to the total amount of irrigation water applied for the Rio Hondo and Alcalde sites, but not for the El Rito site. The average irrigation event DP using data for the complete irrigation season at each of the three sites was 77.0 mm at El Rito, 54.5 mm at Alcalde and 53.1 mm at Rio Hondo. Groundwater level rise compared to pre-irrigation event water levels ranged from 3 to 1870 mm, and was influenced by differences in irrigation practices between sites. Crop evapotranspiration estimates averaged across irrigation events were highest in Rio Hondo (22.9 mm), followed by El Rito (14.4 mm) and Alcalde (10.4 mm). Results from this study indicate there are strong surface water-groundwater connections in traditionally irrigated systems of northern New Mexico, connections that may be employed to better manage groundwater recharge and river flow.

1. Introduction

The agriculture sector faces increasing challenges as expected climate change conditions create uncertainty in water delivery, timing, and availability [1,2,3]. In snowmelt-runoff dominated areas such as in the southwestern United States (USA), climate variability trends indicate that decreases in snowpack and warmer winters may result in stream flows coming earlier in the season before water is needed for agriculture [1,2,3,4]. Consequently, farmers will face pressure to develop new water saving and management strategies to cope with water scarcity [5,6,7,8].
In New Mexico (NM) in the southwestern USA, more than 50% of irrigated acreage uses flood irrigation methods [9]. Approximately 18% of surface water withdrawals of the Rio Grande river basin in NM (10% of the total surface water withdrawals of the state) are used by acequia irrigation systems [9,10]. Acequia refers to both earthen ditch systems that enable small-scale farming and shared water governance institutions [10,11,12].
Agricultural practices such as irrigation can directly or indirectly affect the interactions of surface water and groundwater [13]. Several studies have shown that deep percolation (DP) from irrigation can be a major component of shallow groundwater recharge [8,14,15], and can contribute to groundwater return flows to the river [16,17]. Deep percolation is normally considered as the amount of water that moves below the root zone, and it has the potential to transit the unsaturated vadose zone and reach the shallow aquifer. Xu et al. found that seepage from canals and DP from irrigation together accounted for more than 90% of the total annual groundwater recharge in an irrigation district in China [8]. Kendy and Bredehoeft simulated that up to 50% of irrigation water became groundwater return flow in an agricultural valley in Montana, USA [17]. Our previous work at the Alcalde site showed that 16% of the unlined ditch flows seeped into the bed and banks causing water table rises during the irrigation season [18]. Our studies conducted at field and valley scales at this site showed that deep percolation inputs can contribute to shallow aquifer recharge up to 1350 mm·year−1 at the valley scale and up to 369 mm for individual irrigation events at the field scale [14]. These hydrologic linkages between surface water and groundwater suggest that seepage from acequia irrigation systems in northern New Mexico could result in temporary underground storage providing delayed return flow to the stream during critical low-flow periods such as late summer [16].
One approach to characterize surface water and groundwater interactions and to estimate aquifer recharge is to use quantitative techniques such as the water balance method (WBM) [19,20,21]. Components in the WBM include water applied (irrigation and rainfall), evapotranspiration, change in soil water storage, and runoff, with DP being the unknown variable calculated by difference [22]. With reliable WBM component estimates this method can help to characterize water gains and losses in irrigated crop fields [14,23,24,25].
Better quantification of water balance components and improved characterization of surface water and groundwater interactions can help improve water resource management in acequia irrigated systems in northern New Mexico. This study sought to characterize surface water-groundwater interactions in crop fields located in three different irrigated valleys in northern New Mexico by (1) estimating deep percolation below the root zone in flood-irrigated crop fields; and (2) characterizing shallow aquifer response to irrigation event deep percolation inputs.

2. Materials and Methods
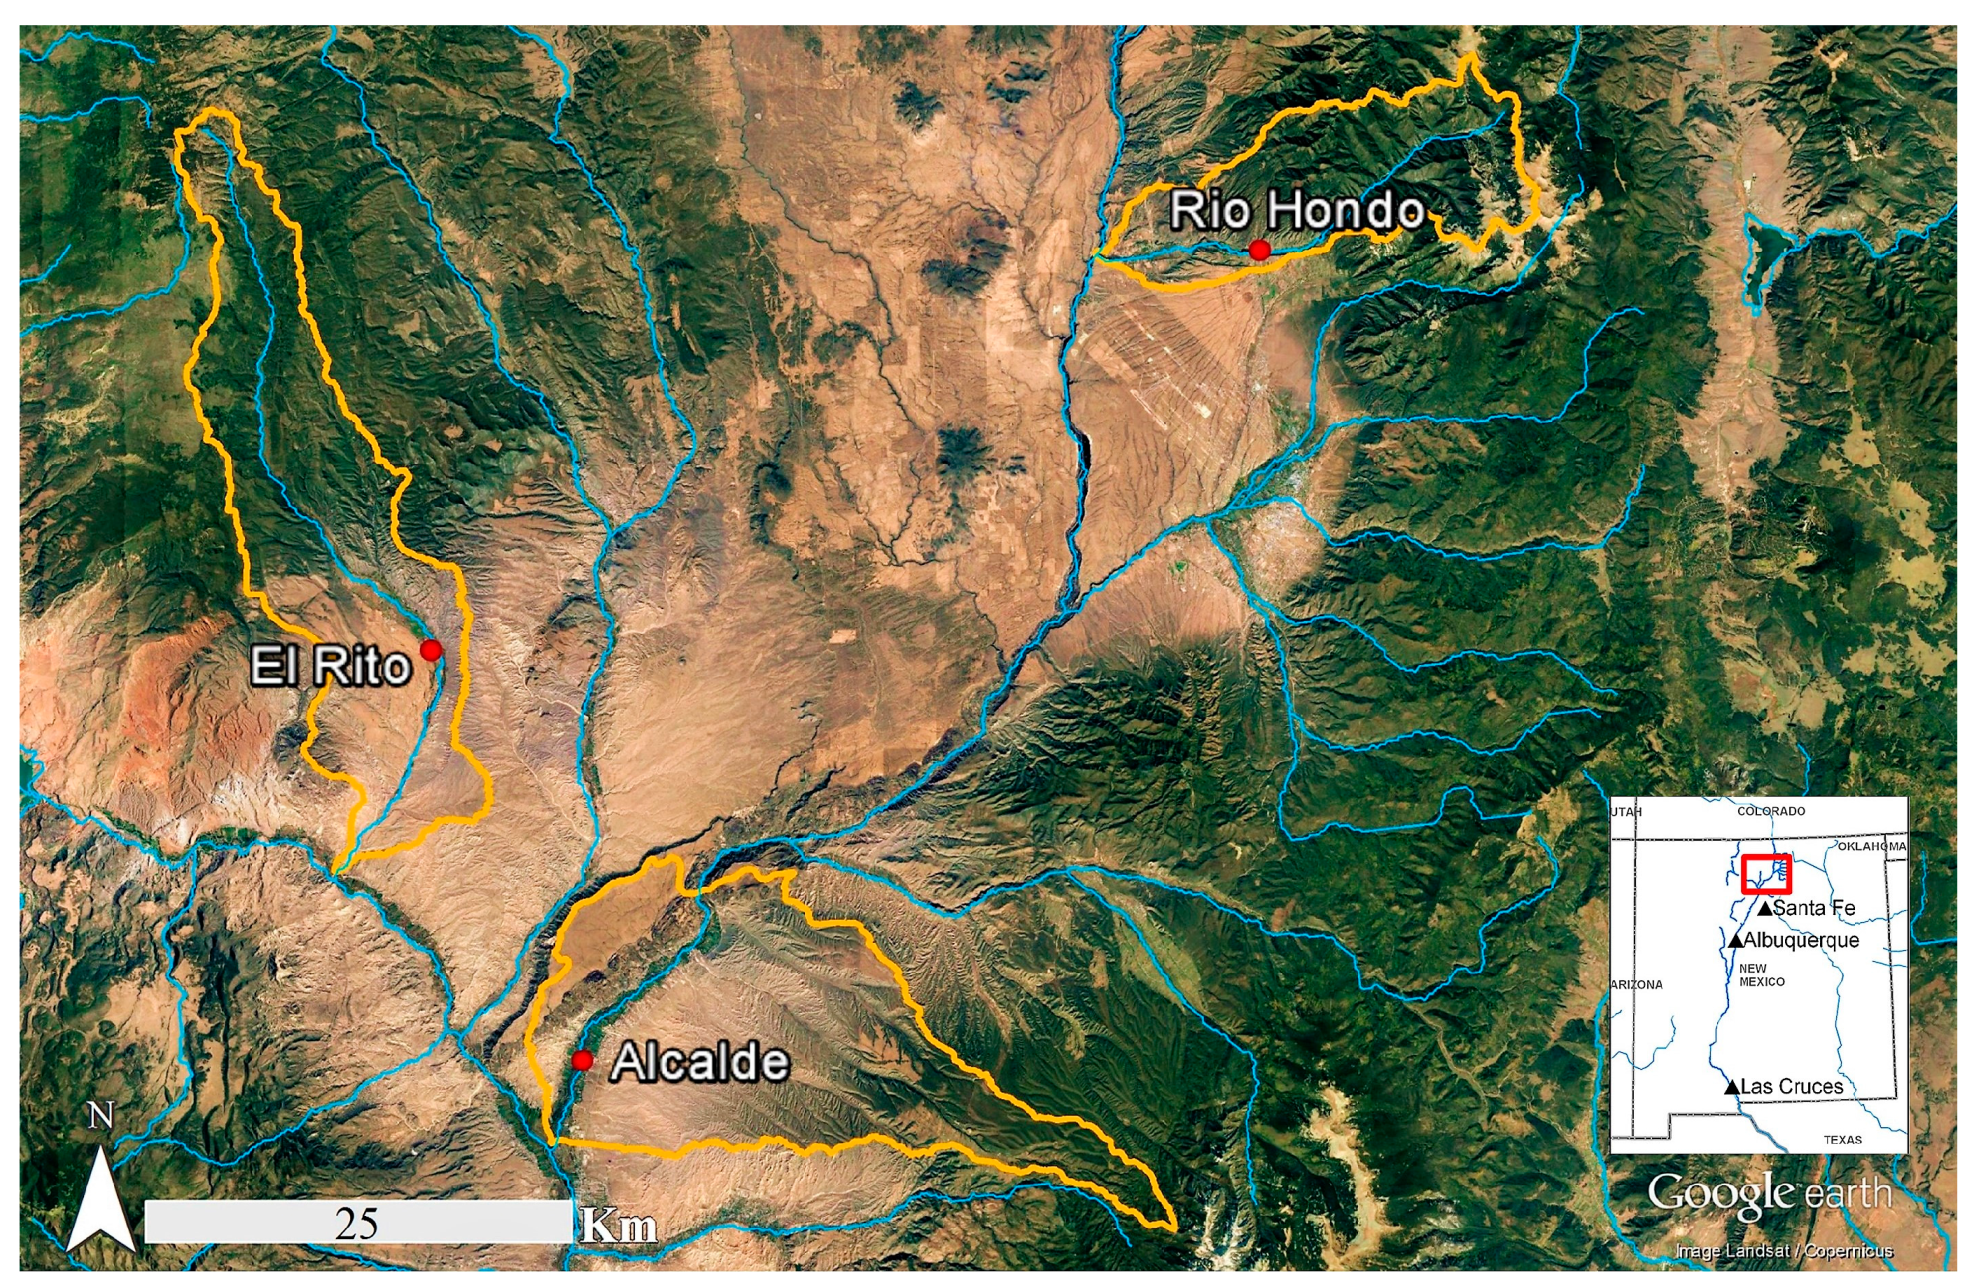
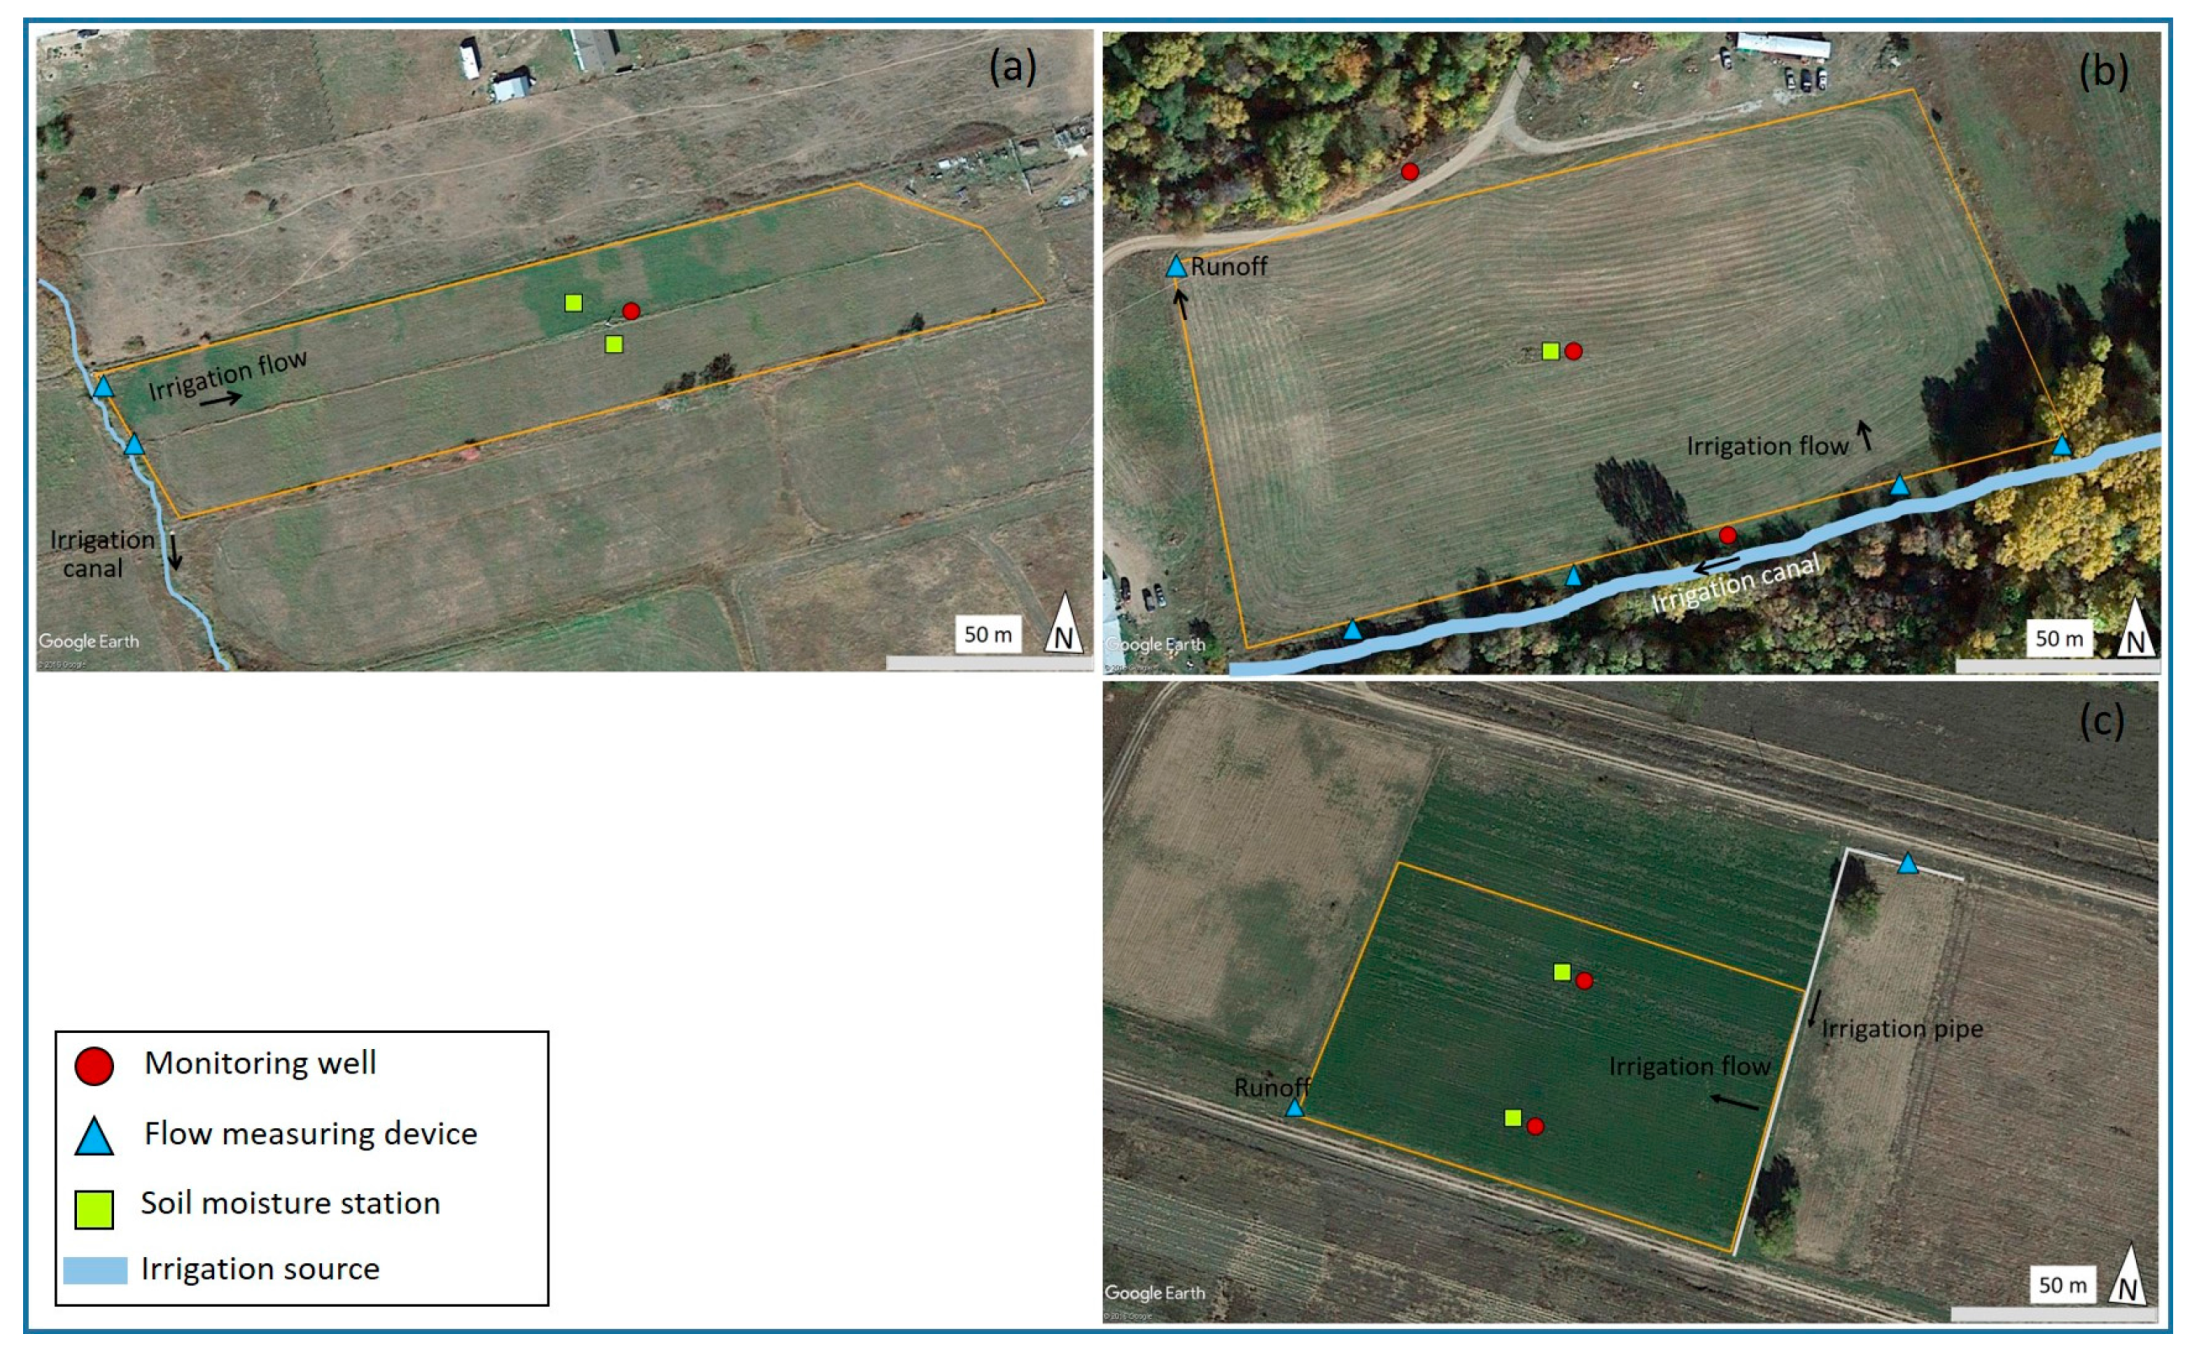
2.1. Study Sites

This study was conducted in one flood-irrigated field in each of three different agricultural valleys (El Rito, Rio Hondo, and Alcalde) located in the northern portion of the Rio Grande Basin in northern NM (Figure 1). These relatively narrow valleys are spread on alluvial deposits along the river where water is diverted into main irrigation canals to be applied as flood irrigation [14], the most common practice in the region [20].
The El Rito study site (36.32° Lat.; −106.16° Long.) is located in the community of El Rito, NM, 50 km north of Española, NM, at 2094 m elevation above mean sea level. For the period of record 1933–2005, the annual average maximum temperature was 17.7 °C, the annual average minimum temperature was 1.2 °C; average annual total precipitation was 311 mm [26]. Soil type is classified as Oelop loam and Sedillo loam [27]. Average depth to water table is over 2 m, the drainage class falls into the well-drained category, with slope values of 0%–5% [27]. The study was conducted in a one-hectare alfalfa (Medicago sativa) and grass (various spp.) crop field.
The Rio Hondo study site (36.53° Lat.; −105.56° Long.) is located in Valdez, NM, 27 km north of Taos, NM, at a 2300 m elevation above mean sea level. For the period of record 1914–2005, at the Taos climatological station, the annual average maximum and minimum temperatures were 17.4 and −0.7 °C, respectively, and the annual average total precipitation was 312 mm [28]. At this site, the study was conducted in a 3.6 ha crop field consisting of Timothy grass (Phleum pretense), Kentucky bluegrass (Poa pratensis), and clover (Trifolium spp.). Soil type at the site is classified as Manzano clay loam [29]. Average depth to water table is over 2 m, the drainage class falls into the well-drained category, with slope values of 3%–5% [29].
The Alcalde study site (36.09° Lat.; −106.06° Long.) is located in New Mexico State University’s Sustainable Agriculture Science Center at Alcalde, NM, (Alcalde Science Center), 8 km north of Española, NM. The Alcalde Science Center is part of an agricultural corridor between the Acequia de Alcalde (main irrigation ditch) and the Rio Grande, and is located at an elevation of 1731 m. For the period of record 1953–2005, the annual average maximum temperature was 20.1 °C, the average annual minimum temperature was 1.1 °C, and the annual average total precipitation was 251 mm [30]. Soil types at this site are classified as Werlog clay loam and Alcalde clay [27]. Depth to water table is about 2.8 m prior to the irrigation season [31], and the drainage class falls into the well-drained category, with slope values of 0%–3% [27]. The experiment took place on an alfalfa and grass (various spp.) crop field. The first two irrigations (29 April and 23 May) were done on the original 1.2 ha field. Because of problems of water distribution on the north side of the field attributed to rodent burrowing, the field was then reduced to 0.8 ha for the remaining five irrigations of the season.

2.2. Field Data Collection

Study sites were instrumented as described below to monitor soil moisture, irrigation water applied, runoff, and groundwater level fluctuations. Data was collected during the 2013 irrigation season. Also, soil was sampled at each site to determine soil physical properties (texture and bulk density).

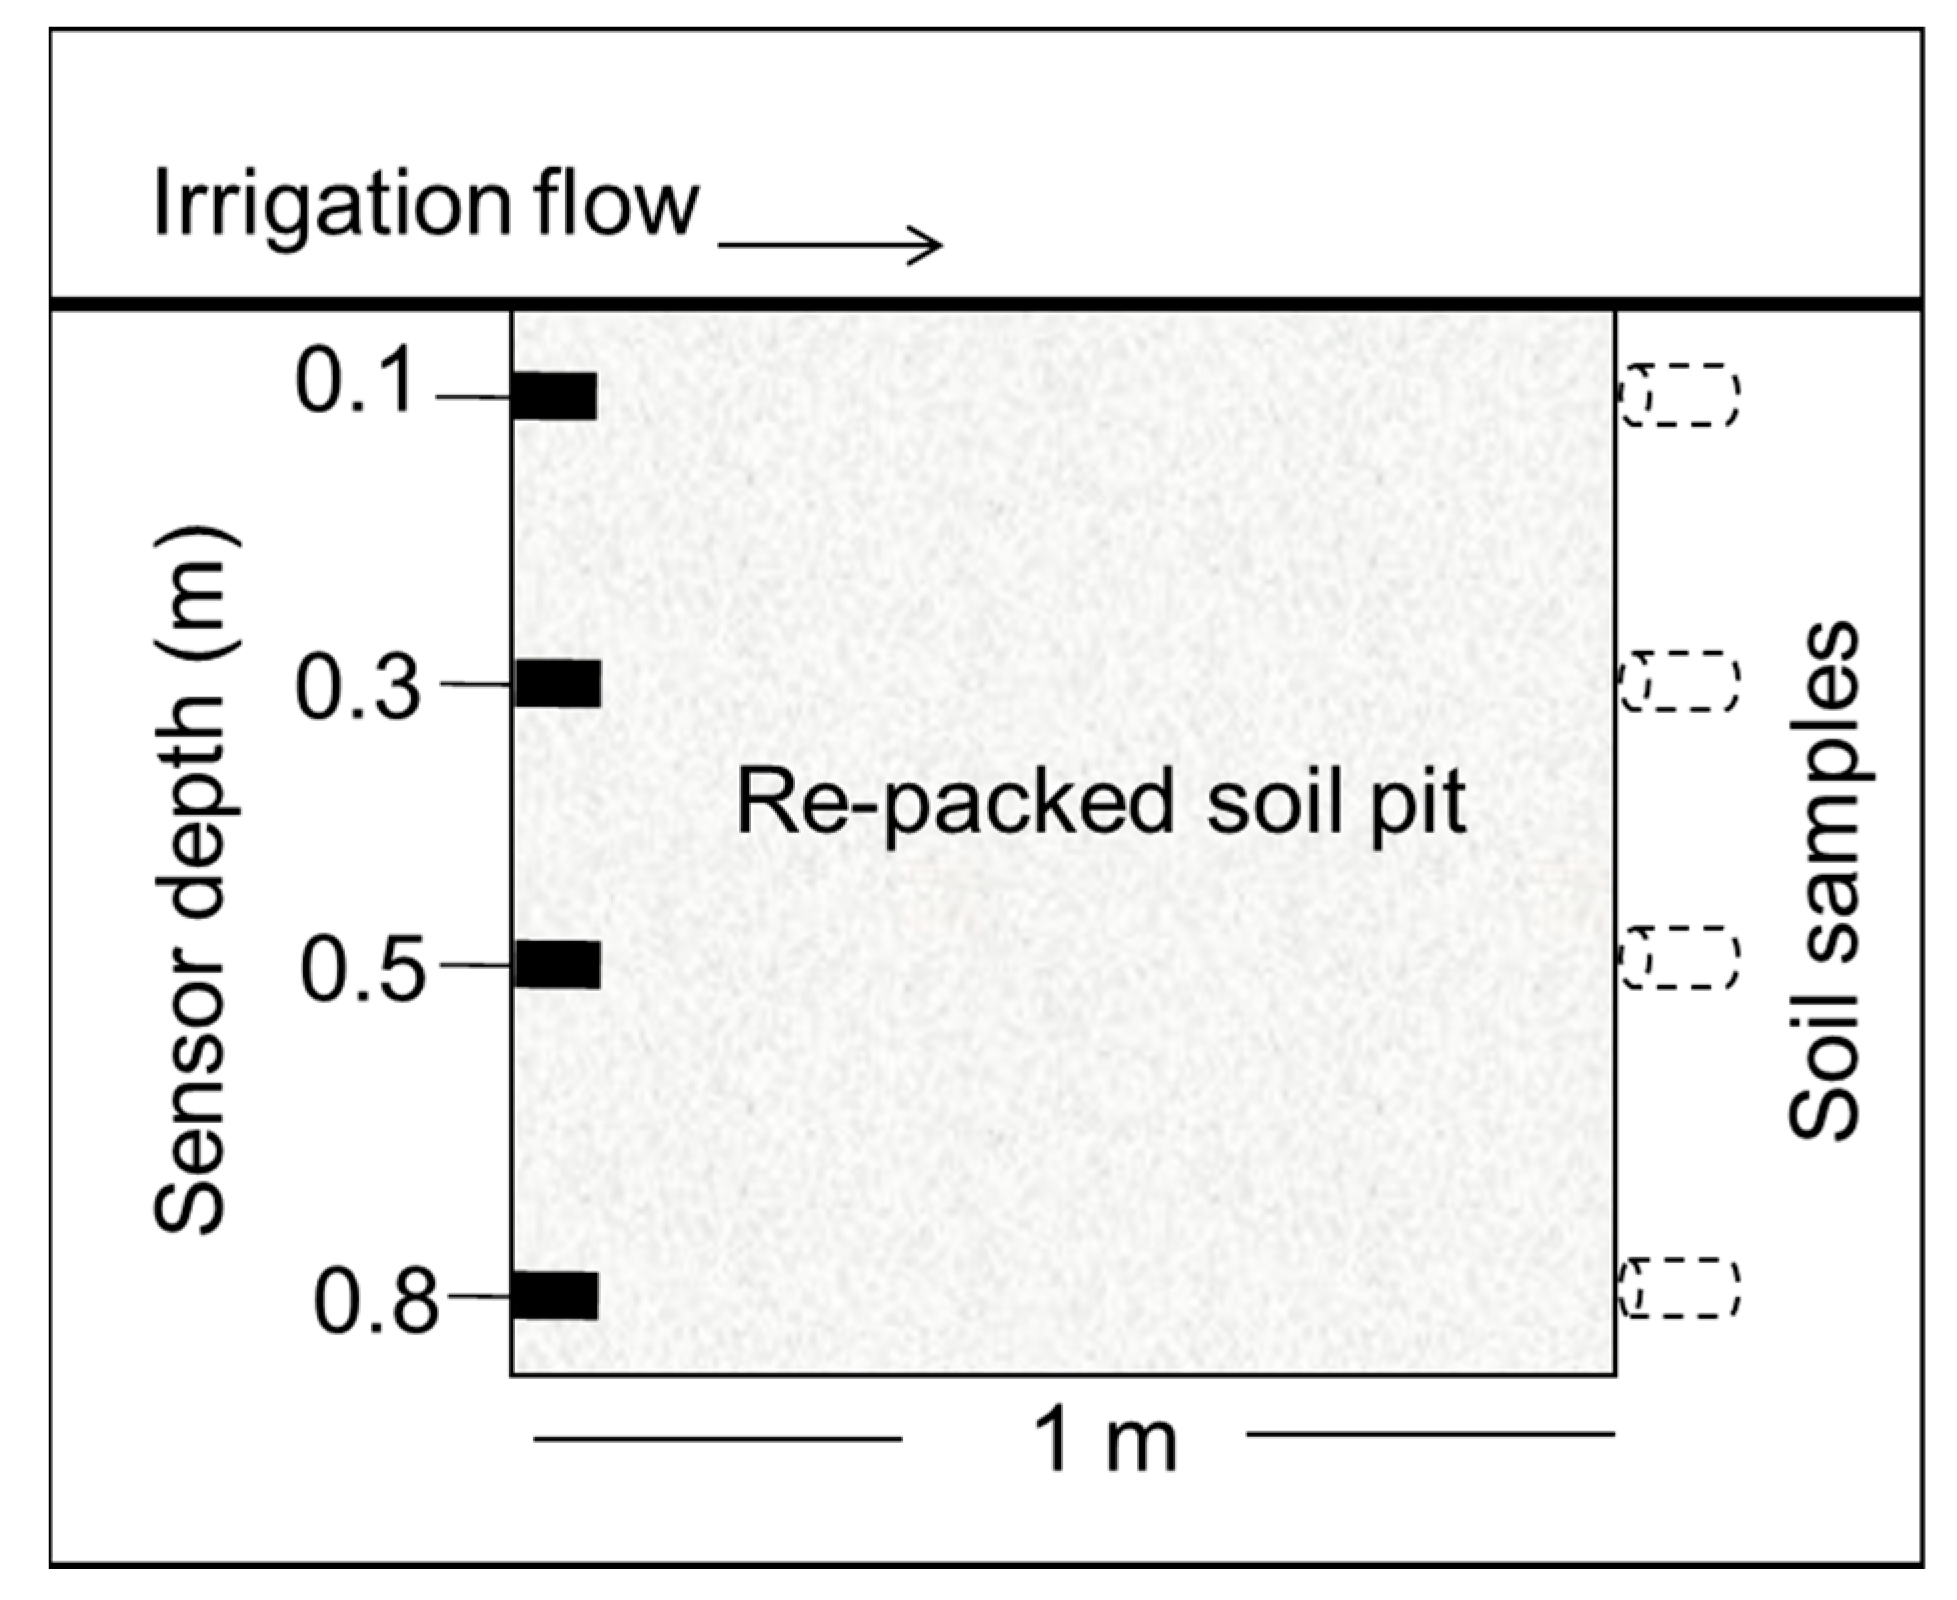
2.2.1. Soil Moisture and Soil Physical Properties

Vertical networks of soil sensors were used to track changes in soil moisture content in the effective rooting zone at each study site. A network of four sensors, model Hydra Probe II (Stevens Water Monitoring Systems; Portland, OR, USA), was installed in a dug out pit wall (Figure 2). At the El Rito and Alcalde sites, the sensors were installed at 0.1, 0.4, 0.8, and 1 m depths. At the Rio Hondo site, the sensors were installed at 0.1, 0.3, 0.5, and 0.8 m depths. Soil moisture equipment from preceding studies at the El Rito and Alcalde sites were used to complement the newer soil moisture stations. These older sensor networks consisted of CS616 soil water content probes (Campbell Scientific, Inc., Logan, UT, USA) installed in the upper 1-m soil profile at El Rito (at 0.1, 0.3, 0.5, 0.8, and 1 m depths) and in the 2.6 m soil profile at Alcalde, starting at 0.1 m and spaced every 0.5 m [31]. For this study, only the sensors in the upper 1.1 m were used. Each sensor network was connected to a CR1000 datalogger powered by a 12 V deep cycle battery, and equipped with a solar panel. Two soil moisture stations were used at the El Rito and Alcalde sites, and one soil moisture station was used at the Rio Hondo site. Soil volumetric water content data were collected hourly at all stations.
Soil samples for determining soil texture and bulk density were collected during soil moisture sensor installation. Three soil cores and three loose soil samples were collected at each sensor depth on the opposite walls of the pit from where the sensors were installed (Figure 2). The soil core samples were collected using a split soil core sampler (AMS, Inc., American Falls, ID, USA), and were analyzed for soil bulk density using the method described by Blake & Hartge [32]. The collected loose soil samples were used to determine soil texture at each site using the hydrometer method described by Gee & Bauder [33].

2.2.2. Irrigation Water Applied and Runoff

Flumes instrumented with pressure transducers at El Rito and Rio Hondo and an irrigation pipe equipped with a propeller flow meter at Alcalde were used to measure the amount of water applied during irrigation. At El Rito, water was applied through two water diversions and at Rio Hondo there were four diversions. At Alcalde, water was applied using an irrigation pipe connected to an underground gravity-fed pipeline from a nearby irrigation canal. Tail water channels at Rio Hondo and Alcalde were instrumented with flumes to measure runoff. Two flume models, an S-M type flume [34] and a ramp-type rectangular flume [35], were used for measuring water diversion from the main irrigation canal and tailwater runoff (Figure 3). The flumes were instrumented with CS450 pressure transducers connected to CR200 series dataloggers (Campbell Scientific, Inc.; Logan, UT, USA) powered by 12 V deep cycle batteries and equipped with solar panels. The pressure transducers were programmed to record water level data every five minutes to capture flow variations necessary to calculate a final volume of water applied during each irrigation event. At the El Rito site, there was no defined tail water channel thus no direct runoff measurements using a flume were possible. It was noted that during irrigation, water flowed into an adjacent field, thus runoff volume at this site was estimated by using measurements of the adjacent field wetted area resulting from water running off into it.

2.2.3. Shallow Groundwater Level

Data from monitoring wells were used to assess water table fluctuations in response to DP from irrigation at all study sites. At El Rito, one monitoring well was installed in the southeast corner of the newly installed soil water station. At Rio Hondo, three wells were installed along a transect, oriented southeast to northwest, crossing the mid-section of the field. The southeastern most well was located next to the main irrigation canal; a second well was installed next to the soil moisture station installed in the middle of the field; and a third well was installed 15 m outside of the field, between the field and the river. At Alcalde, two previously installed wells were used. These wells oriented north to south are located within the crop field along a transect crossing the middle section of the field (Figure 3).
All wells consisted of 50-mm diameter galvanized pipes with a 1.2-m screen section in the bottom. The monitoring well at El Rito was equipped with a CS450 pressure transducer (Campbell Scientific, Inc.; Logan, UT, USA), and it was connected to one of the CR1000 dataloggers. All wells at Rio Hondo and Alcalde were equipped with water level loggers (model HOBO U20-001-01, Onset ComputerCorp.; Bourne, MA, USA). The pressure transducer and water level loggers were programmed to record hourly water level data.

2.3. Water Balance Method

Deep percolation (DP) was calculated using a water balance method approach. DP is defined as the water that percolates below the influence of the effective root zone (ERZ). The ERZ depth for alfalfa and pasture grasses ranges from 0.45 to 0.9 m, and varies according to soil characteristics and root development [36]. For this study, the ERZ was estimated at each site by visual observations of the root system in the pits during sensor installation. The ERZ was determined to be 1 m at El Rito, 0.6 m at Rio Hondo, and 0.8 m at Alcalde. DP was calculated using the following equation:
DP = PPT + IRRRO ± ΔθAET
where, DP = Deep percolation (mm); PPT = Precipitation (mm); IRR = Irrigation water (mm); RO = Runoff (mm); Δθ = Change in soil water content (mm); and AET = Actual evapotranspiration (mm). DP was calculated as the total amount of water percolating below the ERZ for each irrigation event. Data for precipitation occurring during irrigation was obtained from nearby weather stations located at each study site. IRR and RO were estimated based on streamflow volumes entering and exiting the field. Change in soil water content Δθ (mm) was calculated as the difference between average soil volumetric water content at field capacity θ24h (m3·m−3) and average soil volumetric water content prior to irrigation θi (m3·m−3) multiplied by the ERZ depth as Δθ = [(θ24hθi) × ERZ]. Average θ24h was considered as the θ value 24 h after standing water was no longer present on the majority of the irrigated area. The end of standing water on the field was determined based on visual observations during each irrigation event. Reference crop evapotranspiration (ETo) was calculated using the method described by Hargreaves and Samani [37]. Estimation of actual evapotranspiration (AET) was calculated assuming an average crop coefficient (Kc) equal to one, as recommended for surface irrigated grazing pastures [38,39,40]. AET was calculated by converting daily ETo estimates to hourly ETo and multiplying it by time to field capacity tfc which was defined as the total number of hours from the onset of irrigation to field capacity. Thus, AET = [(ETo × 1)/24] × tfc.

2.4. Shallow Groundwater Level Response to Irrigation Percolation Inputs

Groundwater level data collected hourly were used to determine shallow aquifer response to deep percolation inputs from irrigation. Groundwater level rise (WLR) (mm) was calculated for all irrigation events at each study site. WLR in each individual well was calculated as the difference between groundwater level prior to irrigation onset (WLi) and maximum water level rise (WLmax) after the irrigation event, as WLR = WLmax − WLi. Linear regression models were developed to evaluate surface water and groundwater relationships at each study site, in particular the relationships between total water applied and deep percolation, deep percolation and groundwater level rise, and total water applied and groundwater level rise. The software SigmaPlot® 13.0 (Systat Software, Inc.; San Jose, CA, USA) was used in this statistical analysis.

3. Results

3.1. Soil Physical Properties

Soil texture and bulk density properties varied across study sites. However, sand was the predominant soil separate. At the El Rito study site, soil texture was classified as sandy clay loam for all sampling depths. Sand content ranged from 47% to 65% (Table 1). At Rio Hondo, the top three soil depths (0.1, 0.3, and 0.5 m) were sandy loam, and the 0.8-m depth was loam. Sand content decreased with depth, ranging from 76% at the top 0.1 m depth to 51% at the lowest measured soil depth of 0.8 m. At the Alcalde site, the top three soil depths (0.1, 0.4, and 0.8 m) were sandy loam, and the lowest 1-m soil depth was sandy clay. Sand percentage decreased with depth ranging from 78% to 56% (Table 1). Bulk density ranged from 1.34 to 1.59 Mg·m3 among all sites.

3.2. Irrigation Application

Irrigation histories differed among sites (Table 2). The average amount of irrigation that did not runoff and stayed on the field (IRR-RO) at El Rito was 162 mm, the average time between irrigations was 19 days. The average IRR-RO application at Rio Hondo was 85 mm, the average time between irrigations was 11 days. For Alcalde, the average IRR-RO application was 130 mm, the average time between irrigations was 16 days. No ponding was observed at El Rito and little at Alcalde. However, substantial ponding occurred at Rio Hondo following several irrigation events, with ponding times ranging from 5 to 75 h. Even though El Rito and Alcalde fields were similar in size, the amount of time needed for irrigation was substantially different due to the way water was applied onto the fields. A relatively small gate was used at the El Rito field, which resulted in relatively slow irrigation flows entering the field and longer irrigation time.

3.3. Deep Percolation Estimates by the Water Balance Method

Deep percolation varied across irrigation applications (Table 3). DP was estimated for all irrigation events at El Rito (six events) and Alcalde (seven events) during the irrigation season. For Rio Hondo, water did not reach the soil moisture station during 5 out of 15 irrigation events, thus no calculations of DP were done for these particular irrigations. Table 3 shows water balance component values used to estimate deep percolation for each study site. In general, IRR and Δθ had the greatest impact on deep percolation estimates. The first irrigation event of the season at both El Rito and Alcalde sites was the largest water application, and also resulted in the greatest Δθ value for each site. No Δθ measurements were obtained for the first and four other irrigations at the Rio Hondo site. At El Rito, Δθ ranged from 7 mm on 19 June, to 198 mm obtained during the first irrigation on 28 April (Table 3). At Rio Hondo, the Δθ ranged from 0 mm obtained on 21 May and 4 June to 62 mm on 7 May. During the 21 May and 4 June events, the soil was relatively saturated, thus change in soil water content was marginal. At Alcalde, Δθ values ranged from 14 mm for 24 June, to 106 mm observed during the first irrigation on 29 April (Table 3). Evapotranspiration estimates ranged from 7.5 to 32 mm across sites.
The statistical analysis conducted showed a positive relationship between DP and total amount of water applied, TWA (IRR + PPT − RO), for the Rio Hondo (R2 = 0.71, p-value = 0.002) and Alcalde (R2 = 0.57, p-value = 0.049) sites, but not for El Rito (R2 = 0.50, p-value = 0.113). Our previous research at the Alcalde site has shown that antecedent soil moisture can have a significant effect on deep percolation [31]. For this reason, we also ran the analysis subtracting Δθ from TWA (TWAθ). Results showed a strong relationship between TWAθ and DP (Rio Hondo, R2 = 0.96; Alcalde, R2 = 0.99; and El Rito, R2 = 0.99).

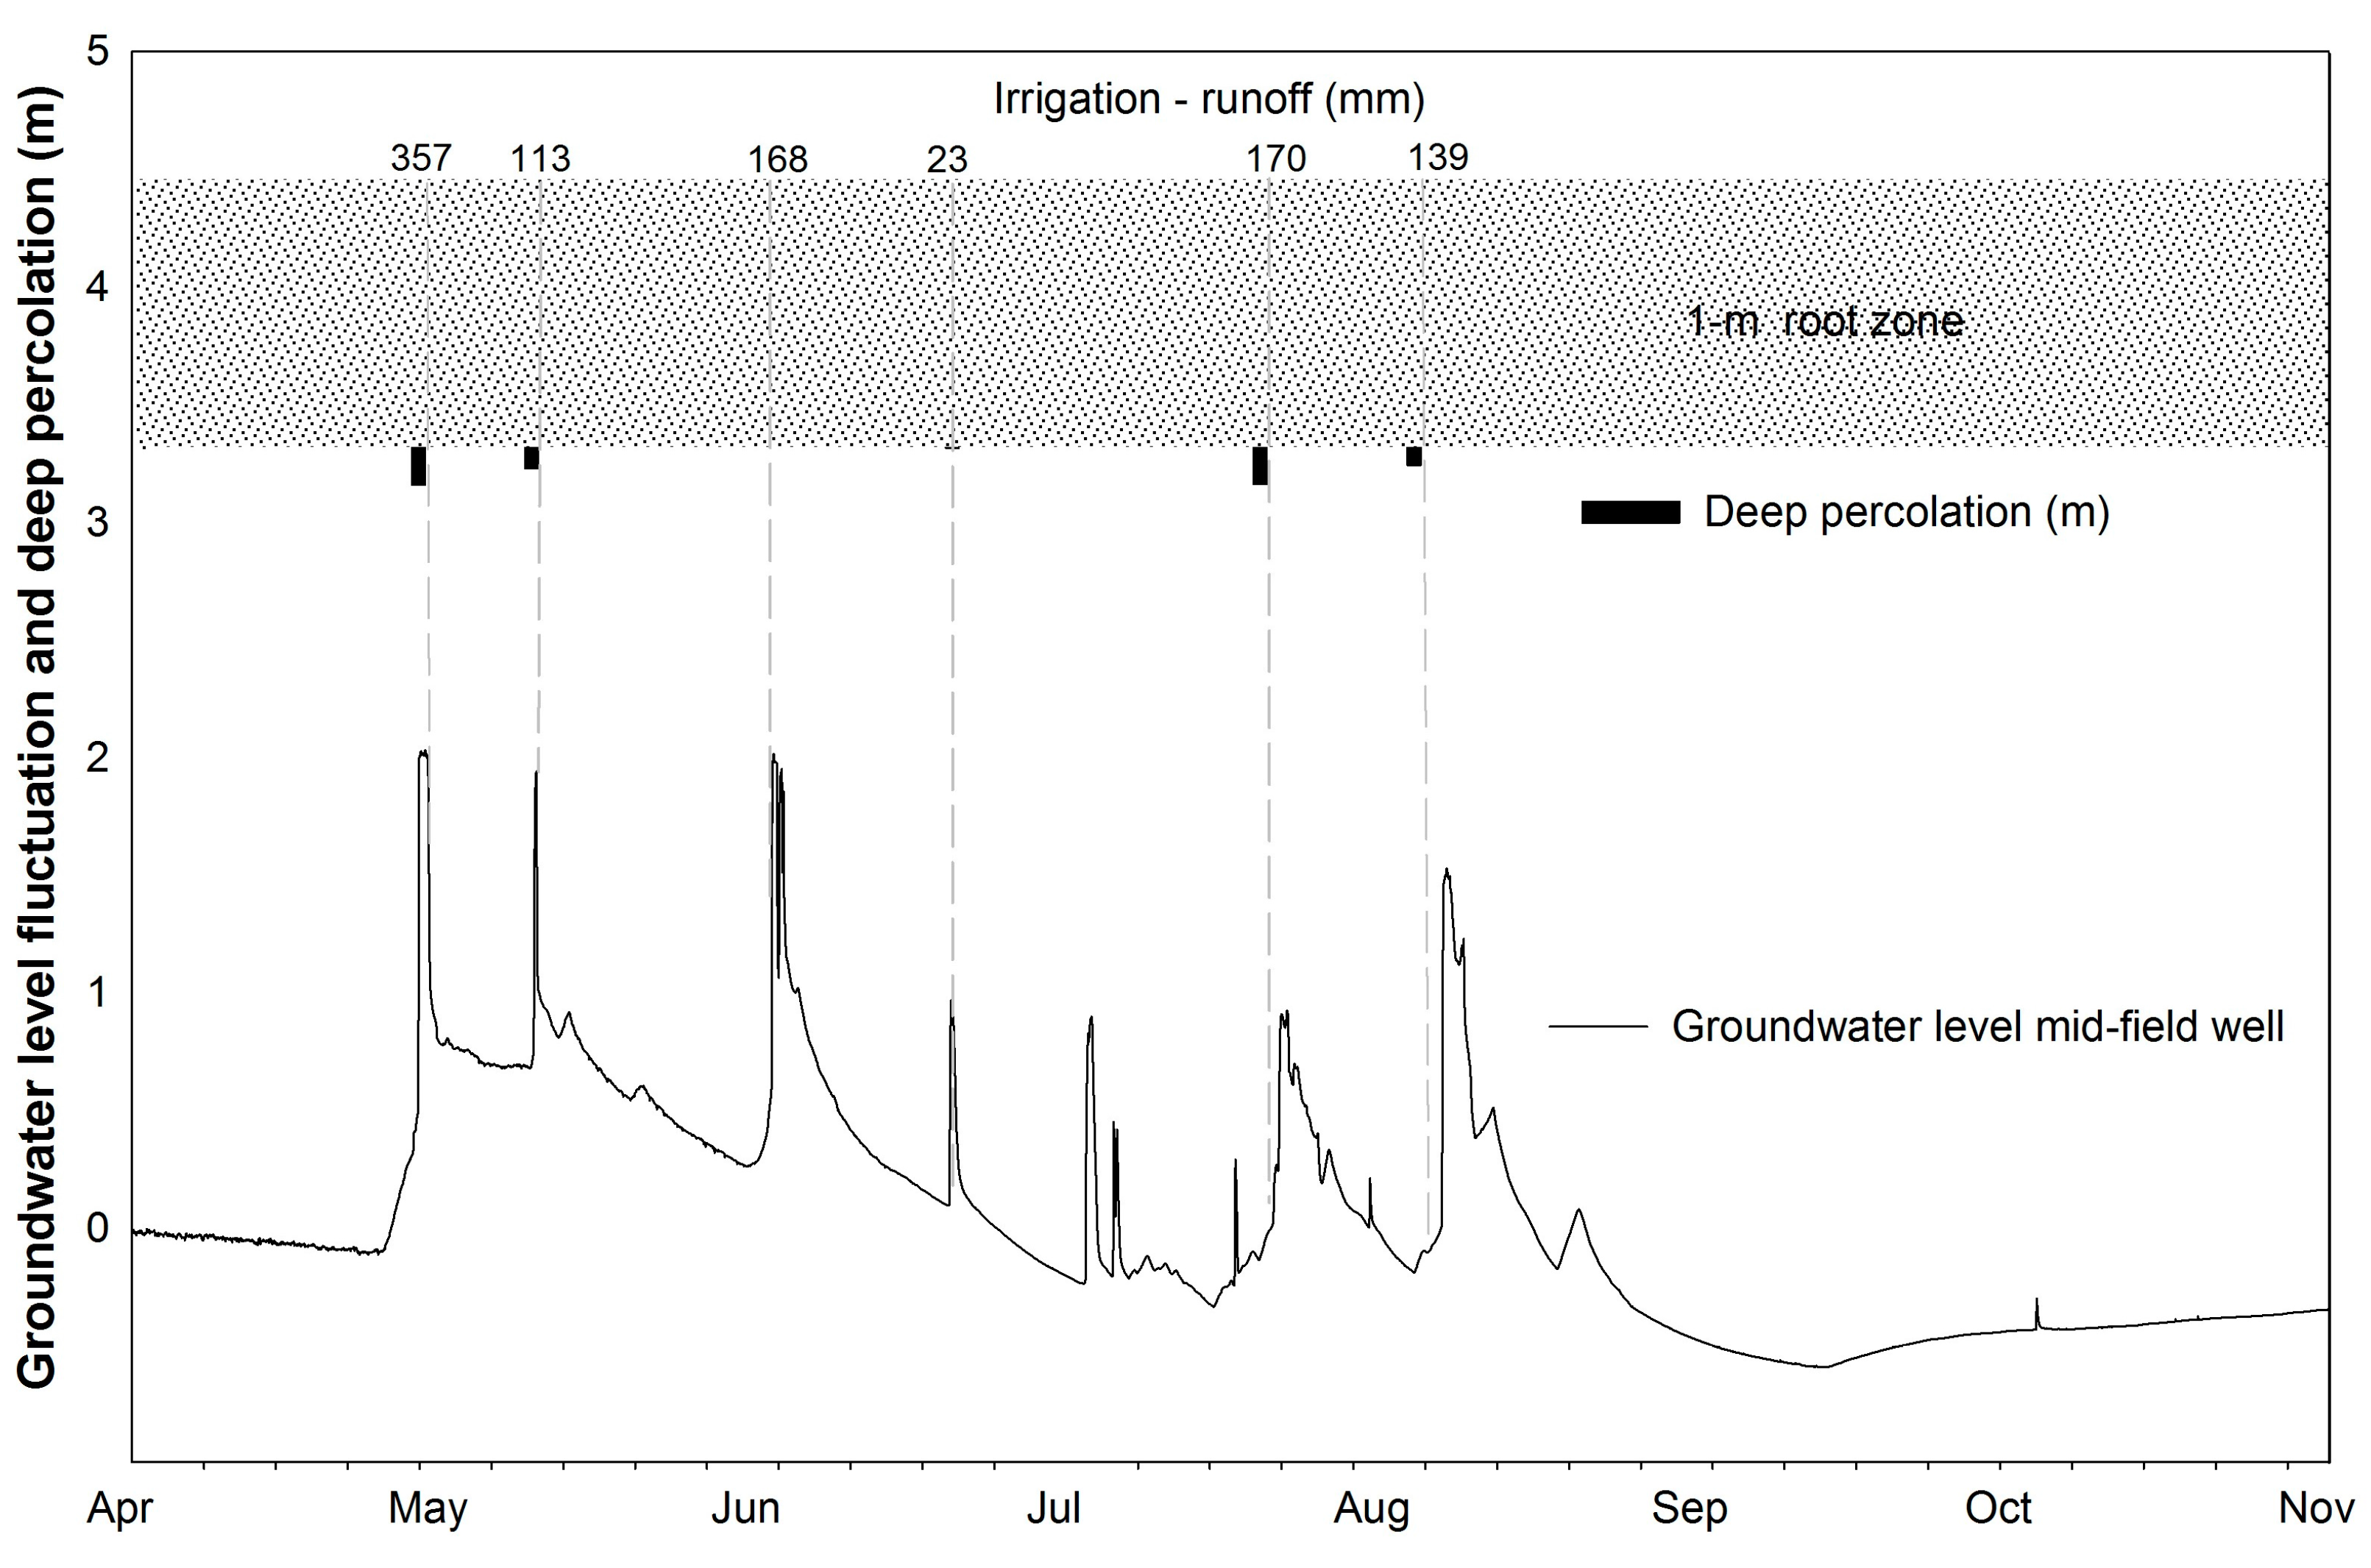
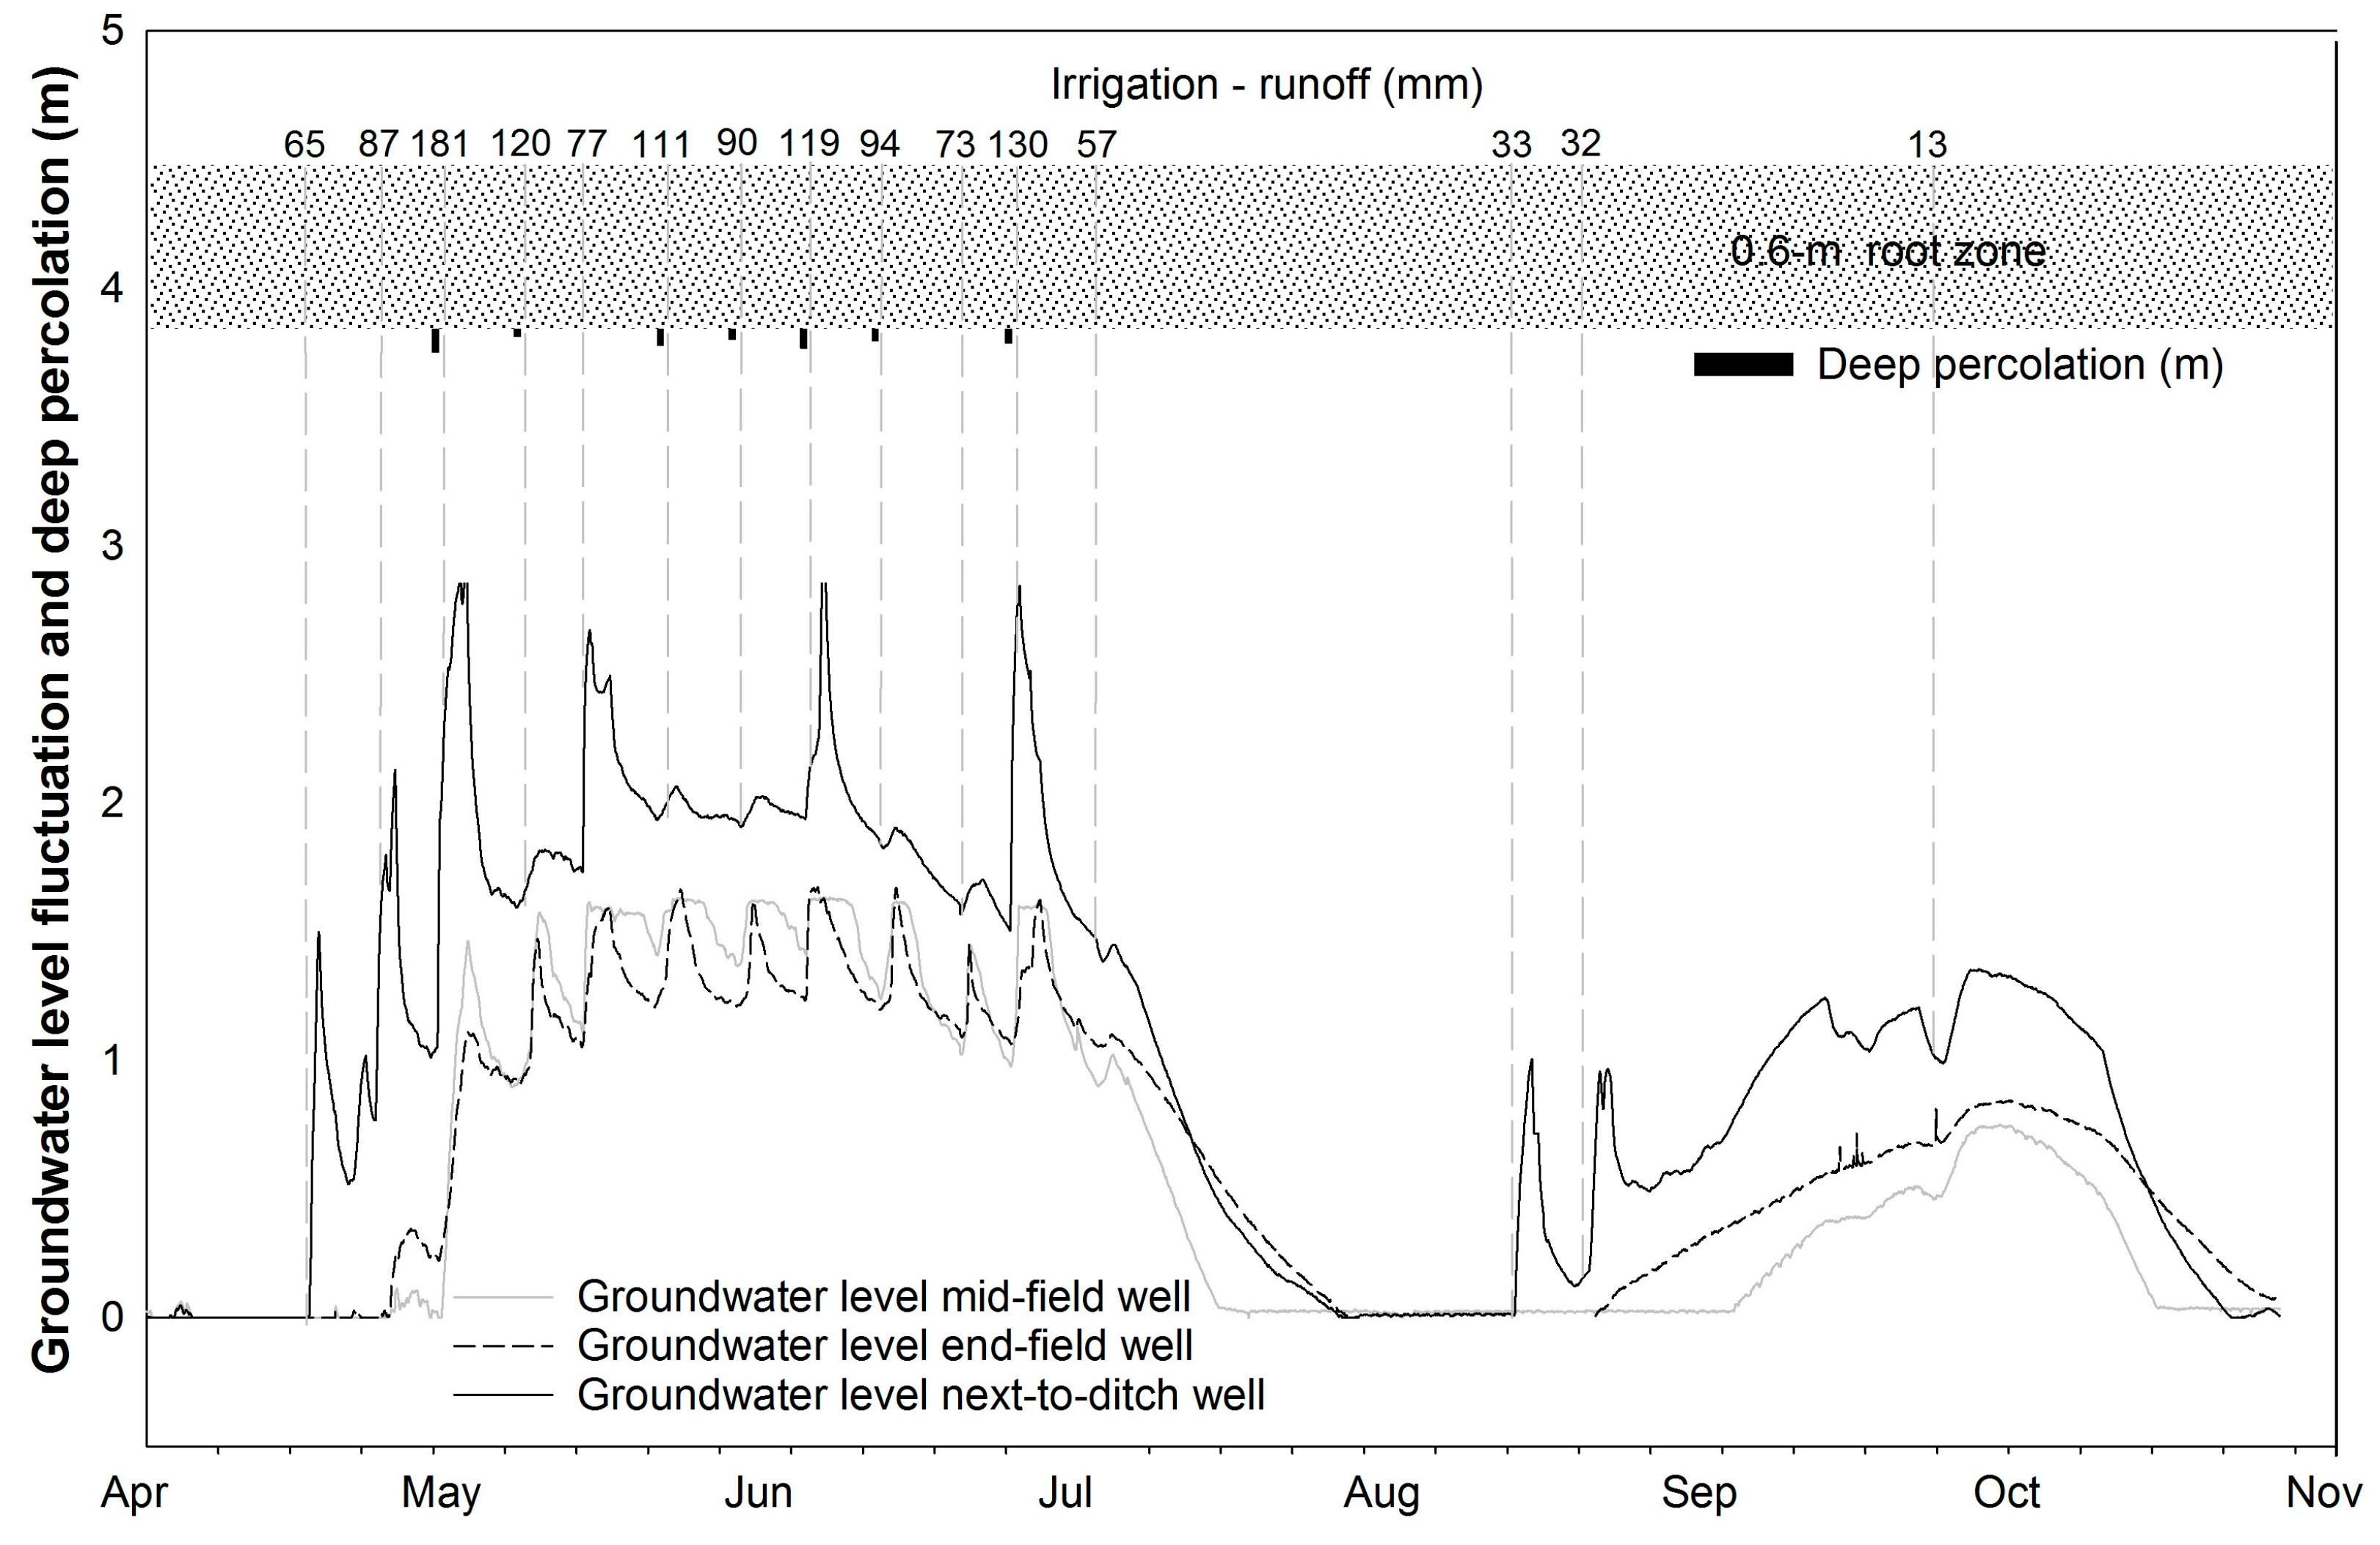
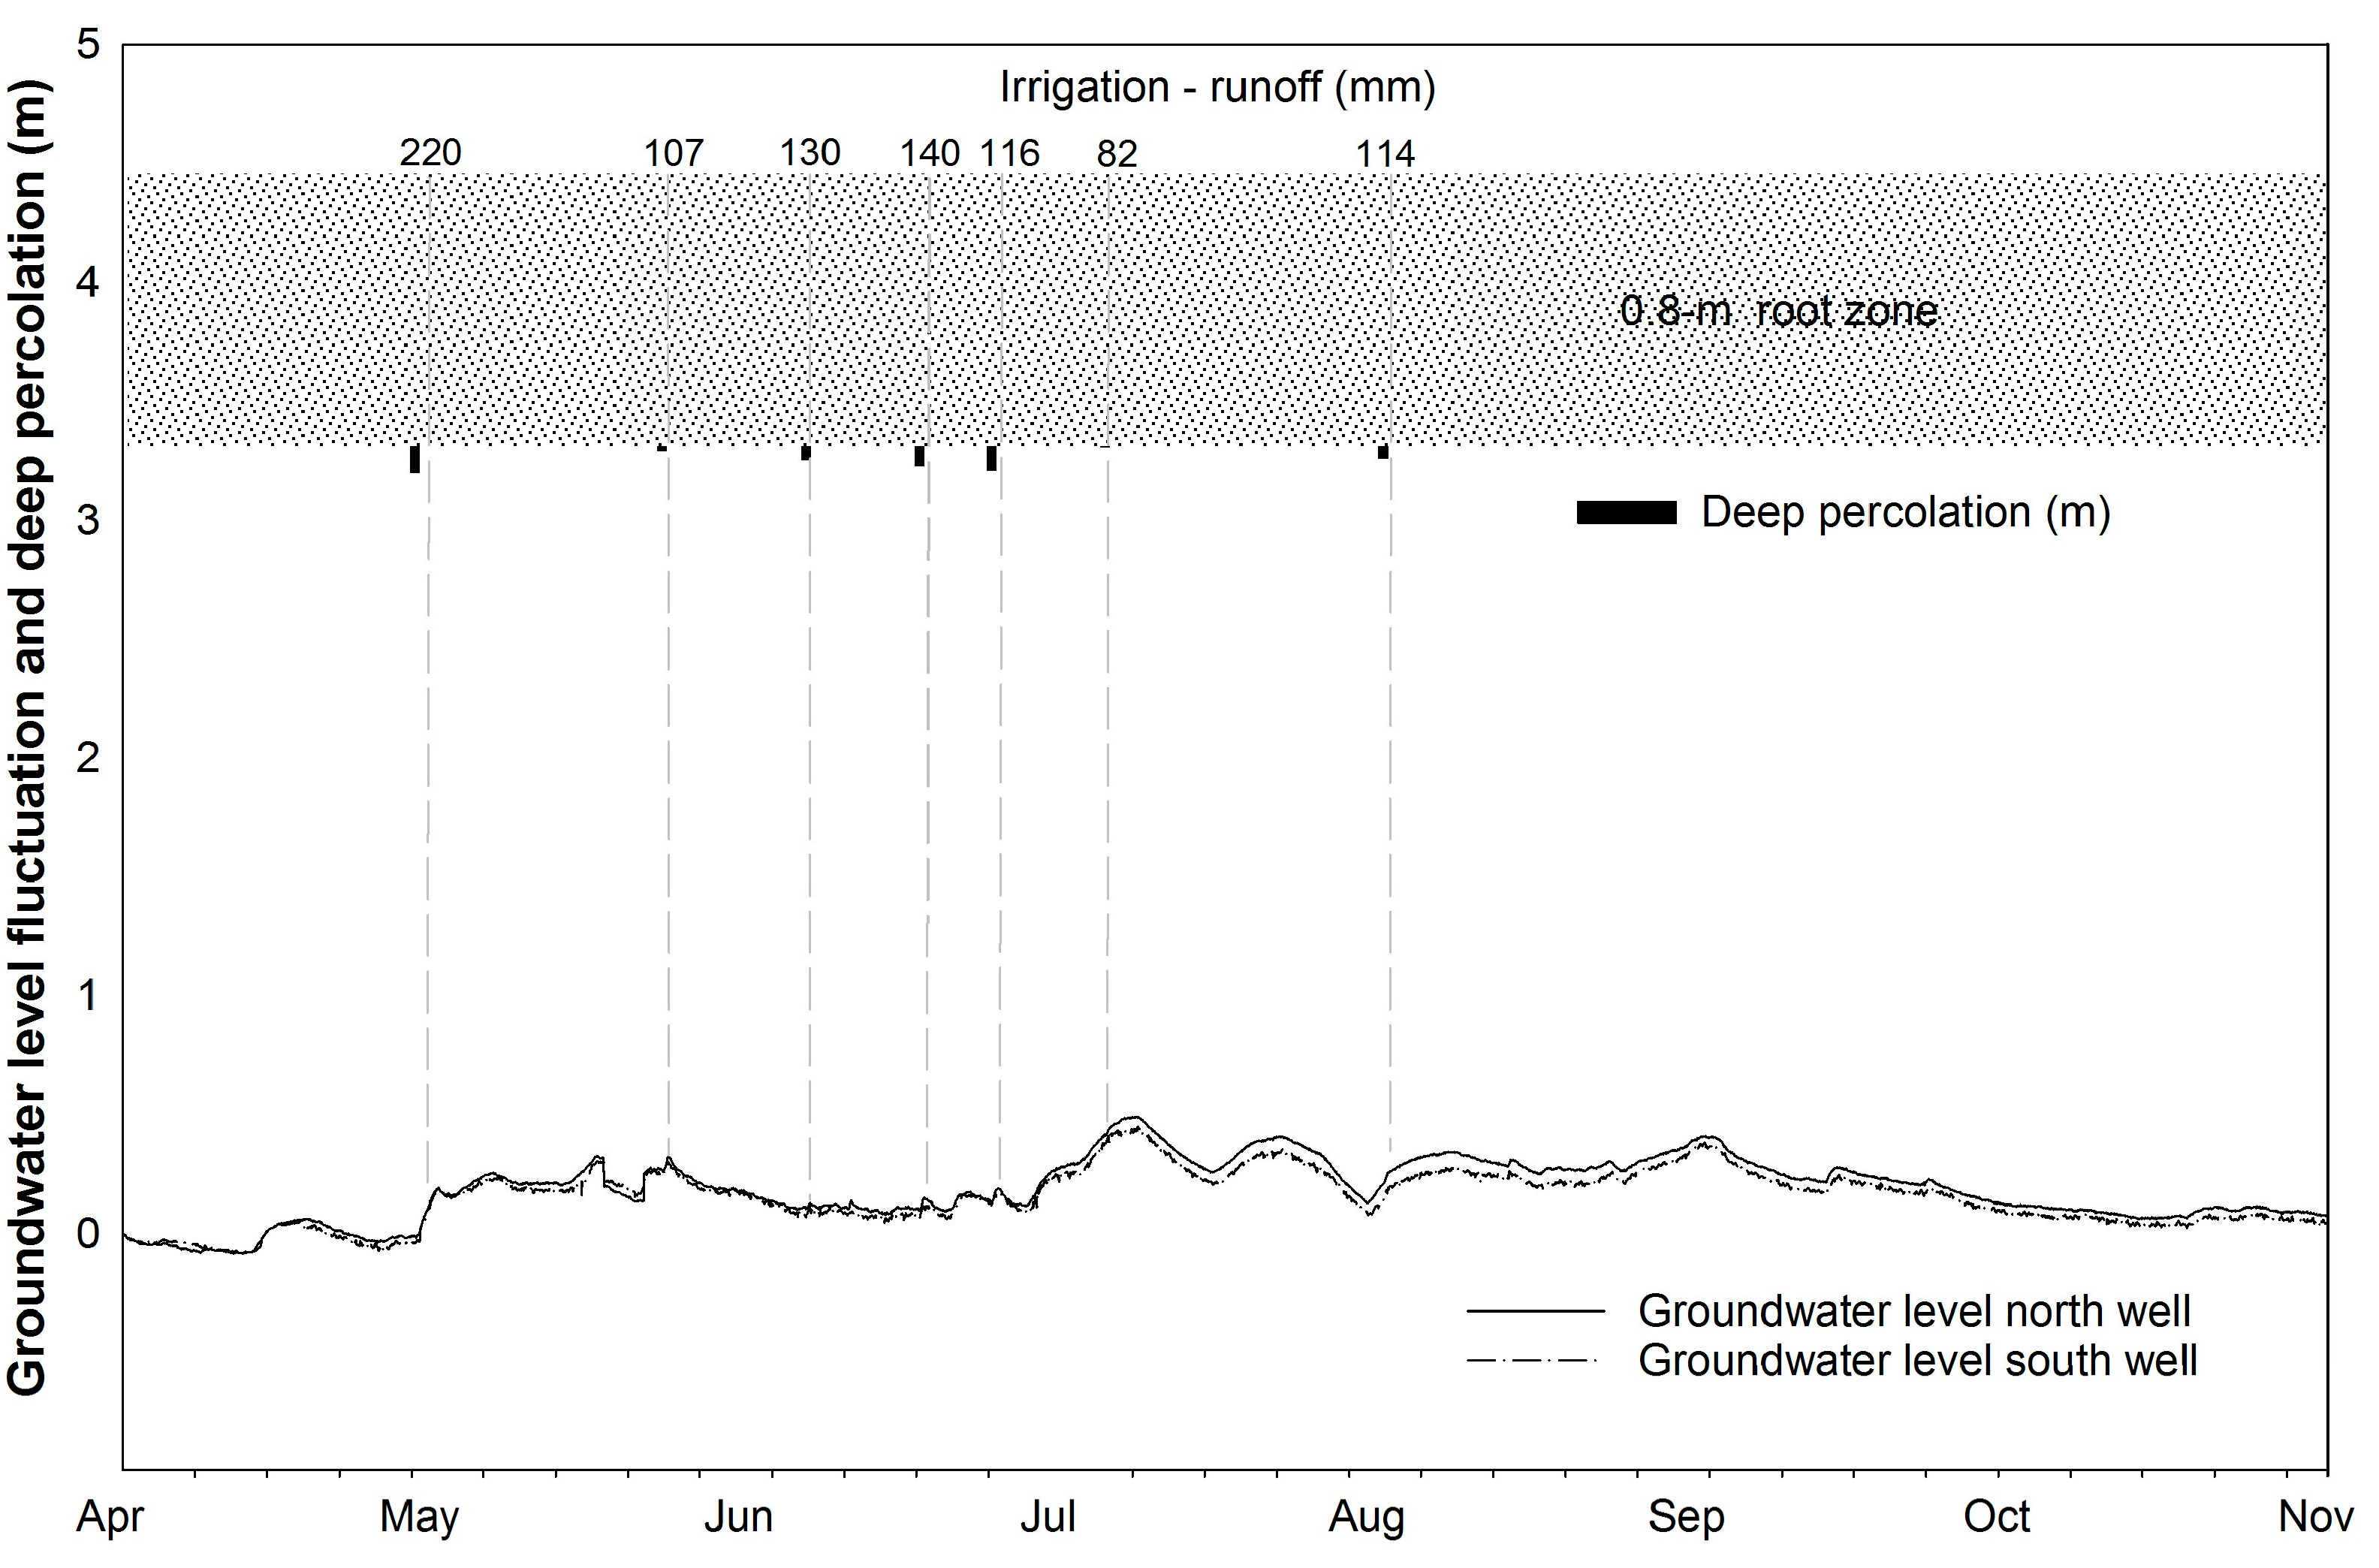
3.4. Shallow Groundwater Level Fluctuations in Response to Irrigation Percolation Inputs

A groundwater level rise in response to irrigation deep percolation inputs was observed at all wells for the three study sites during the irrigation season (Table 4). At El Rito, the highest groundwater level rise (1724 mm) was observed during the largest irrigation application depth (357 mm) at the beginning of the season, and the lowest groundwater level rise (873 mm) corresponded to the smallest irrigation depth (23 mm) on 19 June (see Table 2 and Table 4). At Rio Hondo, groundwater level response was influenced by the opening and closing of several gates that were used to control irrigation water distribution to the field. The maximum water level rise (1868 mm) was observed in the well next to the ditch on 29 April, and the smallest water level rise (3 mm) was observed on 23 April (Table 4). At Alcalde, a muted response in groundwater level rise was observed in all but the first irrigation event. Similar to the El Rito site, the highest groundwater level rise was observed during the first irrigation of the season. The smallest water level rise (24 mm) was observed in the south well after the irrigation on 6 June (Table 4).
For El Rito, a relatively rapid water level rise and decline was observed during each irrigation event (Figure 4). At this site, two other clearly distinct groundwater level rise events observed in the month of July, which were not connected to any irrigation application, were attributed to percolation inputs from two severe convective storms typical of the monsoon summer season in the region. Even though no deep percolation was observed for the third irrigation in the season, still a substantial rise in groundwater level was noted.
Figure 5 shows that during most irrigation events at the Rio Hondo site, a relatively sharp groundwater level rise and a moderately slow decline were observed in the well located next to the ditch. Shallow groundwater level rises observed in the mid-field well illustrate the saturated ponding conditions that occurred during several irrigation events at this location when peak water level rise plateaued for several hours before receding. Groundwater level rises in the well located at the end of field were similar in magnitude to those in the mid-field well but followed a more consistent, sharp rise and decline pattern. A temporary shutdown of the main irrigation canal in early July, and consequently an interruption of irrigation, resulted in a transient decline of the water table during late July through late August, which recovered once irrigation applications were resumed and lasted until the end of the irrigation season in October (Figure 5).
For the Alcalde site, groundwater level rise in the two monitoring wells were similar to each other. A more muted groundwater level response to deep percolation inputs was observed at this study site for all irrigation applications (Figure 6).
No significant (p ≤ 0.05) relationships for groundwater level rise (GWLR) versus TWA, and GWLR versus DP, were found at the El Rito study site. At the Rio Hondo site, a positive linear relationship between GWLR and TWA was observed for the midfield (R2 = 0.57) and end of the field (R2 = 0.65) well locations but not for the next-to-ditch well location. No significant relationship was found for GWLR versus DP in any of the three well locations. For the Alcalde dataset, a positive linear relationship was found between GWLR and TWA for both the north well (R2 = 0.79) and south well (R2 = 0.72). No significant relationship was found for GWLR versus DP in either of the two well locations at this site.

4. Discussion

This study shows that flood irrigation can significantly contribute to shallow aquifer recharge in traditionally irrigated agroecosystems of the upper Rio Grande Basin. Study results indicate that site physical attributes and differences in irrigation management practices observed across study sites played an important role in deep percolation and aquifer response. Relatively shallow groundwater systems (<3 m), permeable soils, and excess flood irrigation applications in all three sites may have contributed to the rapid transport of irrigation water through the soil profile and into the shallow aquifer. Differences in frequency of irrigation and in the total amount of water applied among irrigation events were important for deep percolation and shallow groundwater level response. The higher frequency of irrigation events observed at the Rio Hondo site helped maintain high soil moisture in the effective rooting zone. This in turn contributed to rapid water movement through the soil profile and into the aquifer. A positive correlation between irrigation water application and aquifer response has been previously documented by several authors [15,41] and by our own observations at the Alcalde study site [14,20,31].
There was a commonality of groundwater response to irrigation inputs across study sites that had differences in physical attributes and irrigation management. This common response shows that there are strong connections between surface water and the shallow aquifer in these traditionally irrigated valleys of northern New Mexico. These surface water-groundwater linkages may allow temporary underground reservoirs that delay return subsurface flows back to the stream [16].
We are confident that we have documented important patterns in surface water-groundwater interactions of traditional irrigation systems. At the same time, we expect that the precision of deep percolation estimates could be improved. As with most studies, precision of our water budget estimates may have been increased with additional and properly spaced field monitoring stations. Our traditional irrigation sites had a variety of physical attributes and flood irrigation management practices that may have affected uniformity of water flows across the fields, which in turn may have influenced water balance estimates. For example, at Rio Hondo, there were four different diversion gates from the main canal that were used to regulate irrigation flows onto the field, resulting in multiple surface flow paths and requiring four independent measurements to capture a single irrigation application amount. Although the Rio Hondo and El Rito experimental fields are located in smaller agricultural valleys than the Alcalde valley field, they had more variability of hydrologic processes because of the traditional irrigation techniques.
Expected effects of climate variability in the southwestern USA, which include less snowpack levels and earlier runoff, may affect the timing and amount of water available for crop irrigation in the region. Upper Rio Grande Basin streamflow decreases of about 30% are expected due to warming temperatures [42], and water availability for agriculture and other purposes could be negatively affected. Irrigation itself could help ameliorate some potential climate-driven water scarcity effects in these snowmelt runoff-driven agroecosystems by enhancing groundwater return flow. Though not treated directly in this study, other work has shown that irrigation return flow may prolong river flow for a few weeks to a few months [16], a time period that would extend river flow into summer dry periods exacerbated by climate change. In particular, it is important to continue irrigation to recharge groundwater. Results from this study can contribute to improved water management through a better understanding of the effects that traditional irrigation systems in northern New Mexico may have on Rio Grande Basin hydrology. Further work is needed in this headwaters region to expand field-scale hydrology research to the larger valley and regional scales.

Acknowledgments

The authors gratefully acknowledge the communities of Alcalde, El Rito, and Rio Hondo, and the staff of the NMSU Sustainable Agriculture Science Center at Alcalde; particularly David Archuleta and Marcos Romero for technical field assistance and Robert Heyduck for assisting with manuscript preparation. This study was supported by a National Science Foundation grant to New Mexico State University, award #101516, Acequia Water Systems Linking Culture and Nature: Integrated Analysis of Community Resilience to Climate and Land-Use Changes, and by the New Mexico Agricultural Experiment Station.

Author Contributions

Karina Y. Gutierrez-Jurado performed the field experiments. Alexander G. Fernald, Steven J. Guldan and Carlos G. Ochoa provided expert knowledge used in study design, field data collection, lab analysis, and data interpretation. Karina Y. Gutierrez-Jurado, Alexander G. Fernald, Steven J. Guldan and Carlos G. Ochoa wrote the manuscript.

Conflicts of Interest

The authors declare no conflict of interest.

References

  1. Ackerman, F.; Stanton, E.A. The Last Drop: Climate Change and the Southwest Water Crises; Stockholm Environment Institute: Somerville, MA, USA, 2011. [Google Scholar]
  2. Barnett, T.P.; Adam, J.C.; Lettenmaier, D.P. Potential impacts of a warming climate on water availability in snow-dominated regions. Nature 2005, 438, 303–309. [Google Scholar] [CrossRef] [PubMed]
  3. Barnett, T.P.; Pierce, D.W. Sustainable water deliveries from the Colorado River in a changing climate. Proc. Natl. Acad. Sci. USA 2009, 106, 7334–7338. [Google Scholar] [CrossRef] [PubMed]
  4. Huntington, J.L.; Niswonger, R.G. Role of surface-water and groundwater interactions on projected summertime streamflow in snow dominated regions: An integrated modeling approach. Water Resour. Res. 2012, 48. [Google Scholar] [CrossRef]
  5. Herrero, J.; Robinson, D.A.; Nogués, J. A regional soil survey approach for upgrading from flood to sprinkler irrigation in a semi-arid environment. J. Agric. Water Manag. 2007, 93, 145–152. [Google Scholar] [CrossRef]
  6. Seth, S.M. Human impacts and management issues in arid and semi-arid regions. Int. Contrib. Hydrogeol. 2003, 23, 289–341. [Google Scholar]
  7. Wheater, H.S.; Mathias, S.A.; Li, X. Groundwater Modelling in Arid and Semi-Arid Areas; Cambridge University Press: Cambridge, UK, 2010. [Google Scholar]
  8. Xu, X.; Huang, G.; Qu, Z.; Pereira, L.S. Assessing the groundwater dynamics and impacts of water saving in the Hetao Irrigation District, Yellow River basin. Agric. Water Manag. 2010, 98, 301–313. [Google Scholar] [CrossRef]
  9. Longworth, J.W.; Valdez, J.M.; Magnuson, M.L.; Albury, E.S.; Keller, J. New Mexico Water Use by Categories 2005; New Mexico Office of the State Engineer: Santa Fe, NM, USA, 2008. [Google Scholar]
  10. Brown, J.R.; Rivera, J.A. Acequias de Común: The Tension between Collective Action and Private Property Rights. In Proceedings of the Constituting the Commons: Crafting Sustainable Commons in the New Millennium, the Eighth Biennial Conference of the International Association for the Study of Common Property, Bloomington, IN, USA, 31 May–4 June 2000.
  11. Fernald, A.; Tidwell, V.; Rivera, J.; Rodríguez, S.; Guldan, S.; Steele, C.; Ochoa, C.; Hurd, B.; Ortiz, M.; Boykin, K.; Cibils, A. Modeling sustainability of water, environment, livelihood, and culture in traditional irrigation communities and their linked watersheds. Sustainability 2012, 4, 2998–3022. [Google Scholar] [CrossRef]
  12. Rivera, J.A.; Glick, T.F. The Iberian Origins of New Mexico’s Community Acequias. In XIII Congress of the International Economic History Association, Buenos Aires. 2002. Available online: http://taosacequias.org/Documents/GlickRivera409.pdf (accessed on 7 February 2017).
  13. Winter, T.C.; Harvey, J.W.; Franke, O.L.; Alley, W.M. Ground Water and Surface Water: A Single Resource; USGS Circular 1139; U.S. Geological Survey: Reston, VA, USA, 1998.
  14. Ochoa, C.G.; Fernald, A.G.; Guldan, S.J.; Tidwell, V.C.; Shukla, M.K. Shallow aquifer recharge from irrigation in a semiarid agricultural valley in New Mexico. J. Hydrol. Eng. 2013, 18, 1219–1230. [Google Scholar] [CrossRef]
  15. Willis, T.M.; Black, A.S.; Meyer, W.S. Estimates of deep percolation beneath cotton in the Macquarie Valley. Irrig. Sci. 1997, 17, 141–150. [Google Scholar] [CrossRef]
  16. Fernald, A.G.; Cevik, S.Y.; Ochoa, C.G.; Tidwell, V.C.; King, J.P.; Guldan, S.J. River hydrograph retransmission functions of irrigated valley surface water-groundwater interactions. J. Irrig. Drain. Eng. 2010, 136, 823–835. [Google Scholar] [CrossRef]
  17. Kendy, E.; Bredehoeft, J.D. Transient effects of groundwater pumping and surface-water-irrigation returns on streamflow. Water Resour. Res. 2006, 42. [Google Scholar] [CrossRef]
  18. Fernald, A.G.; Baker, T.T.; Guldan, S.J. Hydrologic, riparian, and agroecosystem functions of traditional acequia irrigation systems. J. Sustain. Agric. 2007, 30, 147–171. [Google Scholar] [CrossRef]
  19. Jaber, F.H.; Shukla, S.; Srivastava, S. Recharge, upflux and water table response for shallow water table conditions in southwest Florida. Hydrol. Process. 2006, 20, 1895–1907. [Google Scholar] [CrossRef]
  20. Ochoa, C.G.; Fernald, A.G.; Guldan, S.J.; Shukla, M.K. Deep percolation and its effects on shallow groundwater level rise following flood irrigation. ASABE Trans. 2007, 50, 73–81. [Google Scholar] [CrossRef]
  21. Sammis, T.W.; Evans, D.D.; Warrick, A.W. Comparison of methods to estimate deep percolation rates. J. Am. Water Resour. Assoc. 1982, 18, 465–470. [Google Scholar] [CrossRef]
  22. Ben-Asher, J.; Ayars, J.E. Deep seepage under nonuniform sprinkler irrigation. II: Field data. J. Irrig. Drain. Eng. 1990, 116, 354–362. [Google Scholar] [CrossRef]
  23. Scanlon, B.R.; Healy, R.W.; Cook, P.G. Choosing appropriate techniques for quantifying groundwater recharge. Hydrogeol. J. 2002, 10, 18–39. [Google Scholar] [CrossRef]
  24. Sophocleous, M.A. Combining the soilwater balance and water-level fluctuation methods to estimate natural groundwater recharge: Practical aspects. J. Hydrol. 1991, 124, 229–241. [Google Scholar] [CrossRef]
  25. Upreti, H.; Ojha, C.S.P. Estimation of deep percolation in sandy-loam soil using water-balance approach. Irrig. Drain. Syst. Eng. 2015, 4. [Google Scholar] [CrossRef]
  26. Western Regional Climate Center, Cooperative Climatological Data Summaries. El Rito, New Mexico. Available online: http://www.wrcc.dri.edu/cgi-bin/cliMAIN.pl?nmelri (accessed on 7 February 2017).
  27. Soil Survey Staff, Natural Resources Conservation Service, United States Department of Agriculture. Soil Survey of Rio Arriba Area, New Mexico, Parts of Rio Arriba and Sandoval Counties; Web Soil Survey. 2008. Available online: http://websoilsurvey.nrcs.usda.gov/ (accessed on 7 February 2017). [Google Scholar]
  28. Western Regional Climate Center, Cooperative Climatological Data Summaries. Taos, New Mexico. Available online: http://www.wrcc.dri.edu/cgi-bin/cliMAIN.pl?nmtaos (accessed on 7 February 2017).
  29. Soil Survey Staff, Natural Resources Conservation Service, United States Department of Agriculture. Soil Survey of Taos County and Parts of Rio Arriba and Mora Counties, New Mexico; Web Soil Survey. 1982. Available online: http://websoilsurvey.nrcs.usda.gov/ (accessed on 7 February 2017). [Google Scholar]
  30. Western Regional Climate Center, Cooperative Climatological Data Summaries. Alcalde, New Mexico. Available online: http://www.wrcc.dri.edu/cgi-bin/cliMAIN.pl?nmalca (accessed on 7 February 2017).
  31. Ochoa, C.G.; Fernald, A.G.; Guldan, S.J.; Shukla, M.K. Water movement through a shallow vadose zone: A field irrigation experiment. Vadose Zone J. 2009, 8, 414–425. [Google Scholar] [CrossRef]
  32. Blake, G.R.; Hartge, K.H. Particle Density. In Methods of Soil Analysis. Part 1. Physical and Mineralogical Methods; Klute, A., Ed.; SSSA Book Ser. 5.1. SSSA, ASA: Madison, WI, USA, 1986; pp. 377–382. [Google Scholar]
  33. Gee, G.W.; Bauder, J.W. Particle-size Analysis. In Methods of Soil Analysis. Part 1. Physical and Mineralogical Methods; Klute, A., Ed.; SSSA Book Ser. 5.1. SSSA, ASA: Madison, WI, USA, 1986; pp. 383–411. [Google Scholar]
  34. Samani, Z.; Magallanez, H. Simple flume for flow measurement in open channel. J. Irrig. Drain. Eng. 2000, 126, 127–129. [Google Scholar] [CrossRef]
  35. Bos, M.G.; Replogle, J.A.; Clemmens, A.J. Flow Measuring Flumes for Open Channel Systems; John Wiley and Sons: New York, NY, USA, 1984. [Google Scholar]
  36. United States Department of Agriculture, Natural Resources Conservation Service. New Jersey Irrigation Guide; USDA-NRCS: Somerset, NJ, USA, 2005.
  37. Hargreaves, G.H.; Samani, Z.A. Reference crop evapotranspiration from temperature. Appl. Eng. Agric. 1985, 1, 96–99. [Google Scholar] [CrossRef]
  38. Allen, R.G.; Pereira, L.S.; Raes, D.; Smith, M. Crop Evapotranspiration-Guidelines for Computing Crop Water Requirements; FAO Irrigation and Drainage Paper 56; FAO: Rome, Italy, 1998. [Google Scholar]
  39. Bethune, M.G.; Selle, B.; Wang, Q. Understanding and predicting deep percolation under surface irrigation. Water Resour. Res. 2008, 44, W12430. [Google Scholar] [CrossRef]
  40. Selle, B.; Minasny, B.; Bethune, M.; Thayalakumaran, T.; Chandra, S. Applicability of Richards’ equation models to predict deep percolation under surface irrigation. Geoderma 2011, 160, 569–578. [Google Scholar] [CrossRef]
  41. Scanlon, B.R.; Reedy, R.C.; Gates, J.B.; Gowda, P.H. Impact of agroecosystems on groundwater resources in the Central High Plains, USA. Agric. Ecosyst. Environ. 2010, 139, 700–713. [Google Scholar] [CrossRef]
  42. Llewellyn, D.; Vaddey, S. West-Wide Climate Risk Assessment: Upper Rio Grande Impact Assessment: Report; U.S. Department of the Interior, Bureau of Reclamation, Upper Colorado Region, Albuquerque Area Office: Albuquerque, NM, USA, 2013.
Figure 1. Map of the study area showing location of the study sites (red dots) in each irrigated valley within their watersheds.
Water 09 00102 g001
Figure 2. Schematic of soil water sensor placement and soil sampling depth at the Rio Hondo site.
Water 09 00102 g002
Figure 3. Monitoring instrumentation layout at the three different sites, (a) El Rito; (b) Rio Hondo; and (c) Alcalde.
Water 09 00102 g003
Figure 4. Irrigation water application, deep percolation, and shallow groundwater level fluctuations observed at the El Rito study site.
Water 09 00102 g004
Figure 5. Irrigation water application, deep percolation, and shallow groundwater level fluctuations observed at the Rio Hondo study site.
Water 09 00102 g005
Figure 6. Irrigation water application, deep percolation, and shallow groundwater level fluctuations observed at the Alcalde study site.
Water 09 00102 g006
Table 1. Soil physical properties for the three study sites, El Rito, Rio Hondo, and Alcalde, showing the average of three samples for soil bulk density and soil particle distribution of sand, silt, and clay at each soil depth. Standard deviation is shown in parentheses.
Soil DepthBulk DensitySandSiltClay
(Mg·m−3)(%)(%)(%)
El Rito
0.1 m1.40 (0.06)55.3 (2.31)19.3 (1.15)25.5 (2.00)
0.4 m1.34 (0.09)46.6 (4.02)19.9 (4.00)33.5 (4.00)
0.8 m1.39 (0.12)54.6 (2.00)17.9 (0.02)27.5 (2.02)
1.0 m1.45 (0.15)65.3 (2.30)13.3 (2.29)21.5 (0.02)
Rio Hondo
0.1 m1.59 (0.07)76.0 (1.09)13.9 (0.14)10.2 (1.15)
0.3 m1.59 (0.04)75.4 (3.18)15.2 (2.42)9.4 (2.00)
0.5 m1.49 (0.10)60.1 (1.10)25.2 (1.06)14.8 (1.17)
0.8 m1.44 (0.08)51.4 (1.23)29.8 (0.12)18.8 (1.17)
Alcalde
0.1 m1.57 (0.11)78.2 (9.6)11.2 (6.4)10.6 (3.4)
0.4 m1.56 (0.03)76.7 (0.4)11.9 (0.2)11.3 (0.3)
0.8 m1.47 (0.13)62.9 (3.3)19.2 (2.9)17.9 (1.0)
1.0 m1.41 (0.07)55.6 (7.9)19.8 (1.9)24.7 (6.0)
Table 2. Irrigation (IRR) summary for the 2013 irrigation season at the three study sites, El Rito, Rio Hondo, and Alcalde. N/A = Data Not Available.
DateIRR-RO Depth Time between IRRIRR TimePonding Time after End of IRR
(mm)(Days)(Hours)(Hours)
El Rito
28-April357.1N/A370
9-May112.811400
1-June167.923650
19-June23.218150
19-July170.330380
3-August139.415880
Average161.819.447.20
Rio Hondo
16-April64.7N/A440
23-April86.77440
29-April180.56730
7-May120.48495
13-May77.266773
21-May111.284761
28-May89.673875
4-June119.174967
11-June94.374532
19-June72.88240
24-June129.757318
2-July56.88390
12-August33.041480
19-August32.07600
22-September12.934640
Average85.411.450.922.1
Alcalde
29-April219.9N/A320
23-May106.524130
6-June129.71481
17-June139.81181
24-June115.8782
5-July82.21171
1-August114.02782
Average129.715.712.01.0
Table 3. Deep percolation (DP) results by the water balance method for the three study sites, El Rito, Rio Hondo, and Alcalde, showing total irrigation application (IRR), precipitation (PPT), change in soil volumetric water content (Δθ = (θ24h − θi)), and total evapotranspiration (AET) from the start of irrigation to 24 h after the end of irrigation. N/A = Data Not Available.
DateIRRROPPTΔθAETDP
(mm)(mm)(mm)(mm)(mm)(mm)
El Rito
28-April549.4192.30.0197.810.1149.2
9-May173.560.75.122.38.687.0
1-June258.390.40.0155.416.30.0
19-June35.712.50.06.511.45.4
19-July262.091.724.432.015.1147.6
3-August214.475.026.768.225.172.8
Average248.987.19.480.414.477.0
Rio Hondo
16-April64.70.00.0N/A9.8N/A
23-April86.70.02.0N/A7.5N/A
29-April185.34.70.055.817.3107.4
7-May120.40.00.061.812.046.6
13-May96.519.30.544.631.41.7
21-May111.20.00.00.029.282.0
28-May89.60.00.03.028.658.0
4-June135.216.14.30.032.091.4
11-June94.30.01.06.824.164.4
19-June72.80.00.060.712.10.0
24-June131.31.95.633.630.071.7
2-July56.80.00.8N/A14.1N/A
12-August33.00.00.5N/A14.2N/A
19-August31.50.0N/AN/AN/AN/A
22-September12.90.026.920.412.07.5
Average88.22.83.828.722.953.1
Alcalde
29-April224.34.40.0105.914.999.1
23-May114.88.20.077.511.317.7
6-June134.74.90.069.68.751.4
17-June152.512.70.056.59.573.7
24-June157.341.50.013.810.991.1
5-July87.65.50.069.88.73.7
1-August119.75.73.864.48.644.8
Average141.611.80.565.410.454.5
Table 4. Groundwater level rise (mm) in the different field well locations following irrigation for the three study sites, El Rito, Rio Hondo, and Alcalde.
El RitoRio HondoAlcalde
DateMid-FieldDateNext to DitchMid-FieldEnd of FieldDateSouthNorth
28-April172416-April1499452329-April207235
9-May126123-April1239115323-May6359
1-June162629-April186814608876-June2438
19-June8737-May21765755917-June5551
19-July106113-May94251254924-June5652
3-August171621-May1051273885-July5551
--28-May1202574091-August7168
--4-June1106227442---
--11-June79379474---
--19-June120424365---
--24-June1338633563---
--2-July6712348---
--12-August99812NA---
--19-August8111156---
--22-September36326142---
Average1377 725349350 7679

