Article

Decreased Streamflow in the Yellow River Basin, China: Climate Change or Human‐Induced?

1
College of Conservancy and Civil Engineering, Inner Mongolia Agricultural University, Hohhot 010018, China
2
Department of Water Resources and Environment, Sun Yat‐sen University, Guangzhou 510275, China
3
Key Laboratory of Environmental Change and Natural Disaster, Ministry of Education, Beijing Normal University, Beijing 100875, China
4
State Key Laboratory of Earth Surface Processes and Resource Ecology, Beijing Normal University, Beijing 100875, China
5
Academy of Disaster Reduction and Emergency Management, Beijing Normal University, Beijing 100875, China
*
Authors to whom correspondence should be addressed.
Water 2017, 9(2), 116; https://doi.org/10.3390/w9020116
Submission received: 20 October 2016 / Accepted: 30 January 2017 / Published: 13 February 2017
(This article belongs to the Special Issue Water-Soil-Vegetation Dynamic Interactions in Changing Climate)

Abstract

:
Decreased streamflow of the Yellow River basin has become the subject of considerable concern in recent years due to the critical importance of the water resources of the Yellow River basin for northern China. This study investigates the changing properties and underlying causes for the decreased streamflow by applying streamflow data for the period 1960 to 2014 to both the Budyko framework and the hydrological modelling techniques. The results indicate that (1) streamflow decreased 21% during the period 1980–2000, and decreased 19% during the period 2000–2014 when compared to 1960–1979; (2) higher precipitation and relative humidity boost streamflow, while maximum/minimum air temperature, solar radiation, wind speed, and the underlying parameter, n, all have the potential to adversely affect them; (3) decreased streamflow is also linked to increased cropland, grass, reservoir, urban land, and water areas and other human activities associated with GDP and population; (4) human activity is the main reason for the decrease of streamflow in the Yellow River basin, with the mean fractional contribution of 73.4% during 1980–2000 and 82.5% during 2001–2014. It is clear that the continuing growth of human-induced impacts on streamflow likely to add considerable uncertainty to the management of increasingly scarce water resources. Overall, these results provide strong evidence to suggest that human activity is the key factor behind the decreased streamflow in the Yellow River basin.

1. Introduction

Understanding of hydrological processes and their causes and mechanisms is crucial for effective basin-scale water resource management and the conservation of fluvial ecosystems [1,2,3]. It also represents the first step for any study of the impacts of climate change and human activities on the hydrological cycle at both the regional and global scale [4,5,6]. Hydrological processes are influenced by both climatic changes such as increased or decreased precipitation and human activities such as land use and land cover changes (LUCC) and the construction of water reservoirs, although it is important to note that the magnitudes of human- and climate-induced impacts on streamflow changes can differ markedly from one river basin to another [7,8]. In recent years, the scientific question—what is the impact on streamflow from a 10% annual change in precipitation?—has attracted increasing attention from hydrologists and geoscientists [9,10], with more and more research appearing that seeks to identify the underlying factors influencing streamflow variations utilizing climate elasticity as an important indicator [11,12,13].
The Yellow River, which is the second largest river in China, is an important water source that supplies a large part of north-western and northern China. However, dwindling streamflow throughout its vast river basin are rapidly becoming a serious concern [14]. Largely as a result of climatic change and intensifying human activities, particularly the ever-increasing level of withdrawal for agricultural irrigation, the streamflow in the lower Yellow River has decreased markedly since 1986 [15]. The Yellow River basin, with drainage area of 75.3 × 10⁴ km2, supplies water to 12% of the population of China, but the significant decreases in its streamflow, particularly since the 1990s, is now the focus of considerable concern [14,16].
Due to the critical importance of the water resources within the Yellow River basin and the decreased streamflow in recent years, which are posing serious challenges for regional water resource management, a great deal of research has been conducted into the changes in streamflow and their potential causes. With respect to methodologies, analyses of the factors influencing streamflow in the Yellow River basin have utilized both purely hydrological [17,18] and Budyko assumption-based models [16,19,20]. Hydrological models are good choices for modelling hydrological processes when physical mechanisms or causes are the main focus, although a great deal of uncertainty can be expected related to the precise model structure and parameterization implemented [21]. Validation of the model is very necessary for hydrological modelling as an inappropriate validation of a hydrological model has the potential to lead to significant errors in the subsequent evaluation of the impacts of climate change on streamflow [22]. Although Budyko based models benefit from certain physical implications compared to traditional statistical methods and are both convenient and effective [20], they must also be carefully validated.
It should be pointed out that the key parameter of Budyko framework, n, is believed to well reflect the changing properties of underlying features such as land use and land cover [19,23,24]. However, as yet few researchers have attempted to delve more deeply into its implications for human activities such as the building of water reservoirs and population growth, even though these could have a major impact on the performance of Budyko framework when modelling hydrological processes that take into account more human-induced impacts [25]. Most studies in this area have tended to assess the attribution of streamflow change for specific tributaries within the Yellow River basin, e.g., Weihe basin [26,27], Loess Plateau [20,24]; parts of the basin, e.g., upper Yellow River [28]; or a specific hydrological station, such as Tangnaihai hydrological stations [29]. Few studies that have so far been published to examine the hydrological processes for the entire Yellow River basin. Besides, those studies generally focused on a limited number of influencing factors such as precipitation [16,20,26,27], potential evaporation [16,26,27], and changes in either underlying watershed properties [20] or human activities [16,26]. This is a complex area, however, and there are many more factors that could potentially affect streamflow in a river basin such as this, including maximum/minimum air temperature, wind speed, relative humidity, solar radiation, and human activities such as cropland changes, forest land changes, and variations in water area, to name but a few.
Based on the Budyko framework, this study attempted to address (1) the elasticity and contribution of meteorological factors—such as precipitation, wind speed, maximum/minimum air temperature, relative humidity, and solar radiation—to the streamflow change; (2) the implications of underlying parameters, n, and its relationship with the human activities and the land use/land cover; and (3) what is the main reason for the decreasing streamflow in Yellow River basin from the perspective of climate change and/or human activities. The fractional contributions of six meteorological factors and the underlying parameter, n, to streamflow change were quantified at 37 stations along the main stem of the Yellow River basin. These results were tested and compared with those obtained from a conventional hydrological model, SIMHYD model, to confirm the robustness of the proposed model and the physical implications of the underlying parameter, n, considered in depth. This study provides a solid foundation for future work on the management of basin-scale water resources and serves as a reference case for similar studies of other major river basins around the world.

2. Data

Monthly streamflow data were collected from 37 stations across the Yellow River basin for the period 1960–2000, 12 of which are located along the main stem and the remaining 25 along 18 tributaries (Figure 1; Table 1). The daily streamflow data were only collected by two stations (Jimai and Tangnaihai station) and were used for validation of the hydrological modelling. There are three stations containing missing monthly data. However, only one station had three months of missing values, and two other stations had only one month of missing values. The missing values are very few, therefore, the missing data were processed using the simple seven-year moving average method. The missing values in these series were filled by the average in the same months before and after three years. Annual streamflow data were collected from nine stations (Table 1) for the period 2001–2014. Meteorological data for the period 1960–2014 were collected from 77 stations and consisted of precipitation, maximum/minimum air temperature, wind speed, and relative humidity. The locations of the meteorological stations are shown, but not numbered, in Figure 1.
The elevation dataset used here was the 30-arc-second (1-km) gridded, quality-controlled global Digital Elevation Model (DEM) obtained from http://www.ngdc.noaa.gov/mgg/topo/globe.html. The drainage basin area was extracted from this elevation dataset and is also shown in Figure 1. Spatial interpolations of the meteorological data were based on the inverse distance weighted method, taking into account the impact of altitude on the spatial distribution of meteorological factors; the spatial resolution was 100 m × 100 m. The areal average data for the meteorological variables of each sub-catchment area was obtained by applying the Zonal Histogram tool in the ArcGIS software package. To probe the impacts of socio-economic factors on streamflow changes, the GDP (Gross Domestic Product) and population density data were collected with a spatial resolution of 1 km × 1 km, and land use/land cover data for 2000 were provided by the Data Center of Resources and Environment, Chinese Academy of Sciences.

3. Methodology

3.1. Elasticity of Factors Influencing Streamflow

The Budyko hypothesis [30] stated that the water balance equation is primarily controlled by precipitation and potential evapotranspiration. Yang and Yang [31] deduced the following fluvial hydro-energy balance equation based on the Budyko hypothesis:
R = P P E 0 ( P n + E 0 n ) 1 / n
where n is the underlying surface parameter or land use and land cover change (LUCC) [19,23,24].
Based on the water balance equation, R = PE, we have R = f (P, E0, n). Streamflow changes can thus be computed by the following differential equation:
d R R =   ε P d P P + ε E 0 d E 0 E 0 + ε n d n n
where ε P = f P P R , ε E 0 = f E 0 E 0 R , ε n = f n n R , and ε P , ε E 0 and ε n denote the elasticity of precipitation, potential evaporation, and the change of underlying surface to streamflow, respectively. The elasticity of those factor denotes the percentage change of streamflow according to the 1% increase of each climatic variable.
Generally, the Penman-Monteith equation is recommended by the United Nations Food and Agriculture Organization (FAO) for modeling evapotranspiration [32], namely:
E 0 = 0.408 ( R n G ) + γ 900 T m e a n + 273 U 2 ( v p s v p ) + γ ( 1 + 0.34 U 2 )
where E0 is the potential evaporation (mm·day−1), Rn is the net radiation at the crop surface (MJ·m−2·day−1), G is the soil heat flux density (MJ·m−2·day−1), T is the mean daily air temperature at a height of 2 m (°C), U2 is the wind speed at 2 m above the ground (m·s−1), vps is the saturation vapor pressure (kPa), vp is the actual vapor pressure (kPa), vpsvp is the saturation vapor pressure deficit (kPa), Δ is the slope of the vapor pressure (kPa·°C−1), and γ is the psychrometric constant (kPa·°C−1). The unit conversion between MJ and Watts is: 1000 Watts·h = 3.6 MJ. The computation procedure follows that given in Chapter 3 of FAO Paper 56 [32]. Similar to the Roderick et al. [33], based on the Penman-Monteith equation, the impact of evaporation-related climatic variables to the potential evaporation change can be obtained by the following differential equation:
d E 0   E 0 R n d R n + E 0 T d T m a x + E 0 T d T m i n + E 0 U 2 d U 2 + E 0 R H d R H
Substituting the Equation (4) to the Equation (2). Then, the impact of climatic variables and underlying surface on streamflow can be evaluated by [25]:
d R R =   ε P d P P + ε n d n n + ε R n d R n R n + ε T m a x d T m a x T m a x + ε T m i n d T m i n T m i n + ε U 2 d U 2 U 2 + ε R H d R H R H
where ε R n = ε E 0 R n E 0 E 0 R n , ε T m a x = ε E 0 T m a x E 0 E 0 T m a x , ε T m i n = ε E 0 T m i n E 0 E 0 T m i n , ε U 2 = ε E 0 U 2 E 0 E 0 U 2 , ε R H = ε E 0 R H E 0 E 0 R H .   ε R n , and ε T m a x , ε T m i n , ε U 2 and ε R H denote the elasticity of solar radiation (Rn), maximum temperature (Tmax), minimum temperature (Tmin), wind speed (WS), and relative humidity (RH), respectively, to streamflow changes. The elasticity of each variable to streamflow changes denotes the streamflow change according to the 1% increase of each factor. It is worth noting that the impacts of evaporation-related variables on streamflow change were realized via evaporation change.
Based on Equation (5), the fractional contribution of each individual factor influencing variations in streamflow can be obtained using the following set of equations:
R p = ε P R P P ,   R n = ε n R n n ,   R R n = ε R n R R n R n ,   R T m a x = ε T m a x R T m a x T m a x ,   R T m i n = ε T m i n R T m i n T m i n ,   R U 2 = ε U 2 R U 2 U 2 ,   R R H = ε R H R R H R H
where R is the long-term annual average streamflow and R P , R n , R R n , R T m a x , R T m i n , R U 2 , and R R H denote changes in the streamflow due to the influences of precipitation, underlying parameter (n), solar radiation, maximum air temperature, minimum air temperature, wind speed, and relative humidity, respectively. Human activities have intensively changed the hydrological characteristic of underlying features of catchment, and then effects on the streamflow yielding process. Wang et al. [34] used the Budyko elasticity method to evaluate the attribution of streamflow in the contiguous United States, finding that the underlying parameter, n, can be applied to mirror the influence of human activities, such as dams, cropland, and irrigated land, on streamflow change. Similar results were also obtained in Canada [12]. Climate change tends to exert an impact on streamflow via variations in the precipitation, temperature, relative humidity, and so on, so the cumulative effect on the streamflow of these meteorological variables can be calculated as:
δ R c l i m = R c l i m × 100 % ,   δ R h u m = R h u m × 100 %
where δ R c l i m and δ R h u m are the fractional contributions of climate change and human activities, respectively, to changes in the streamflow expressed as a percentage of the total change, ∆.

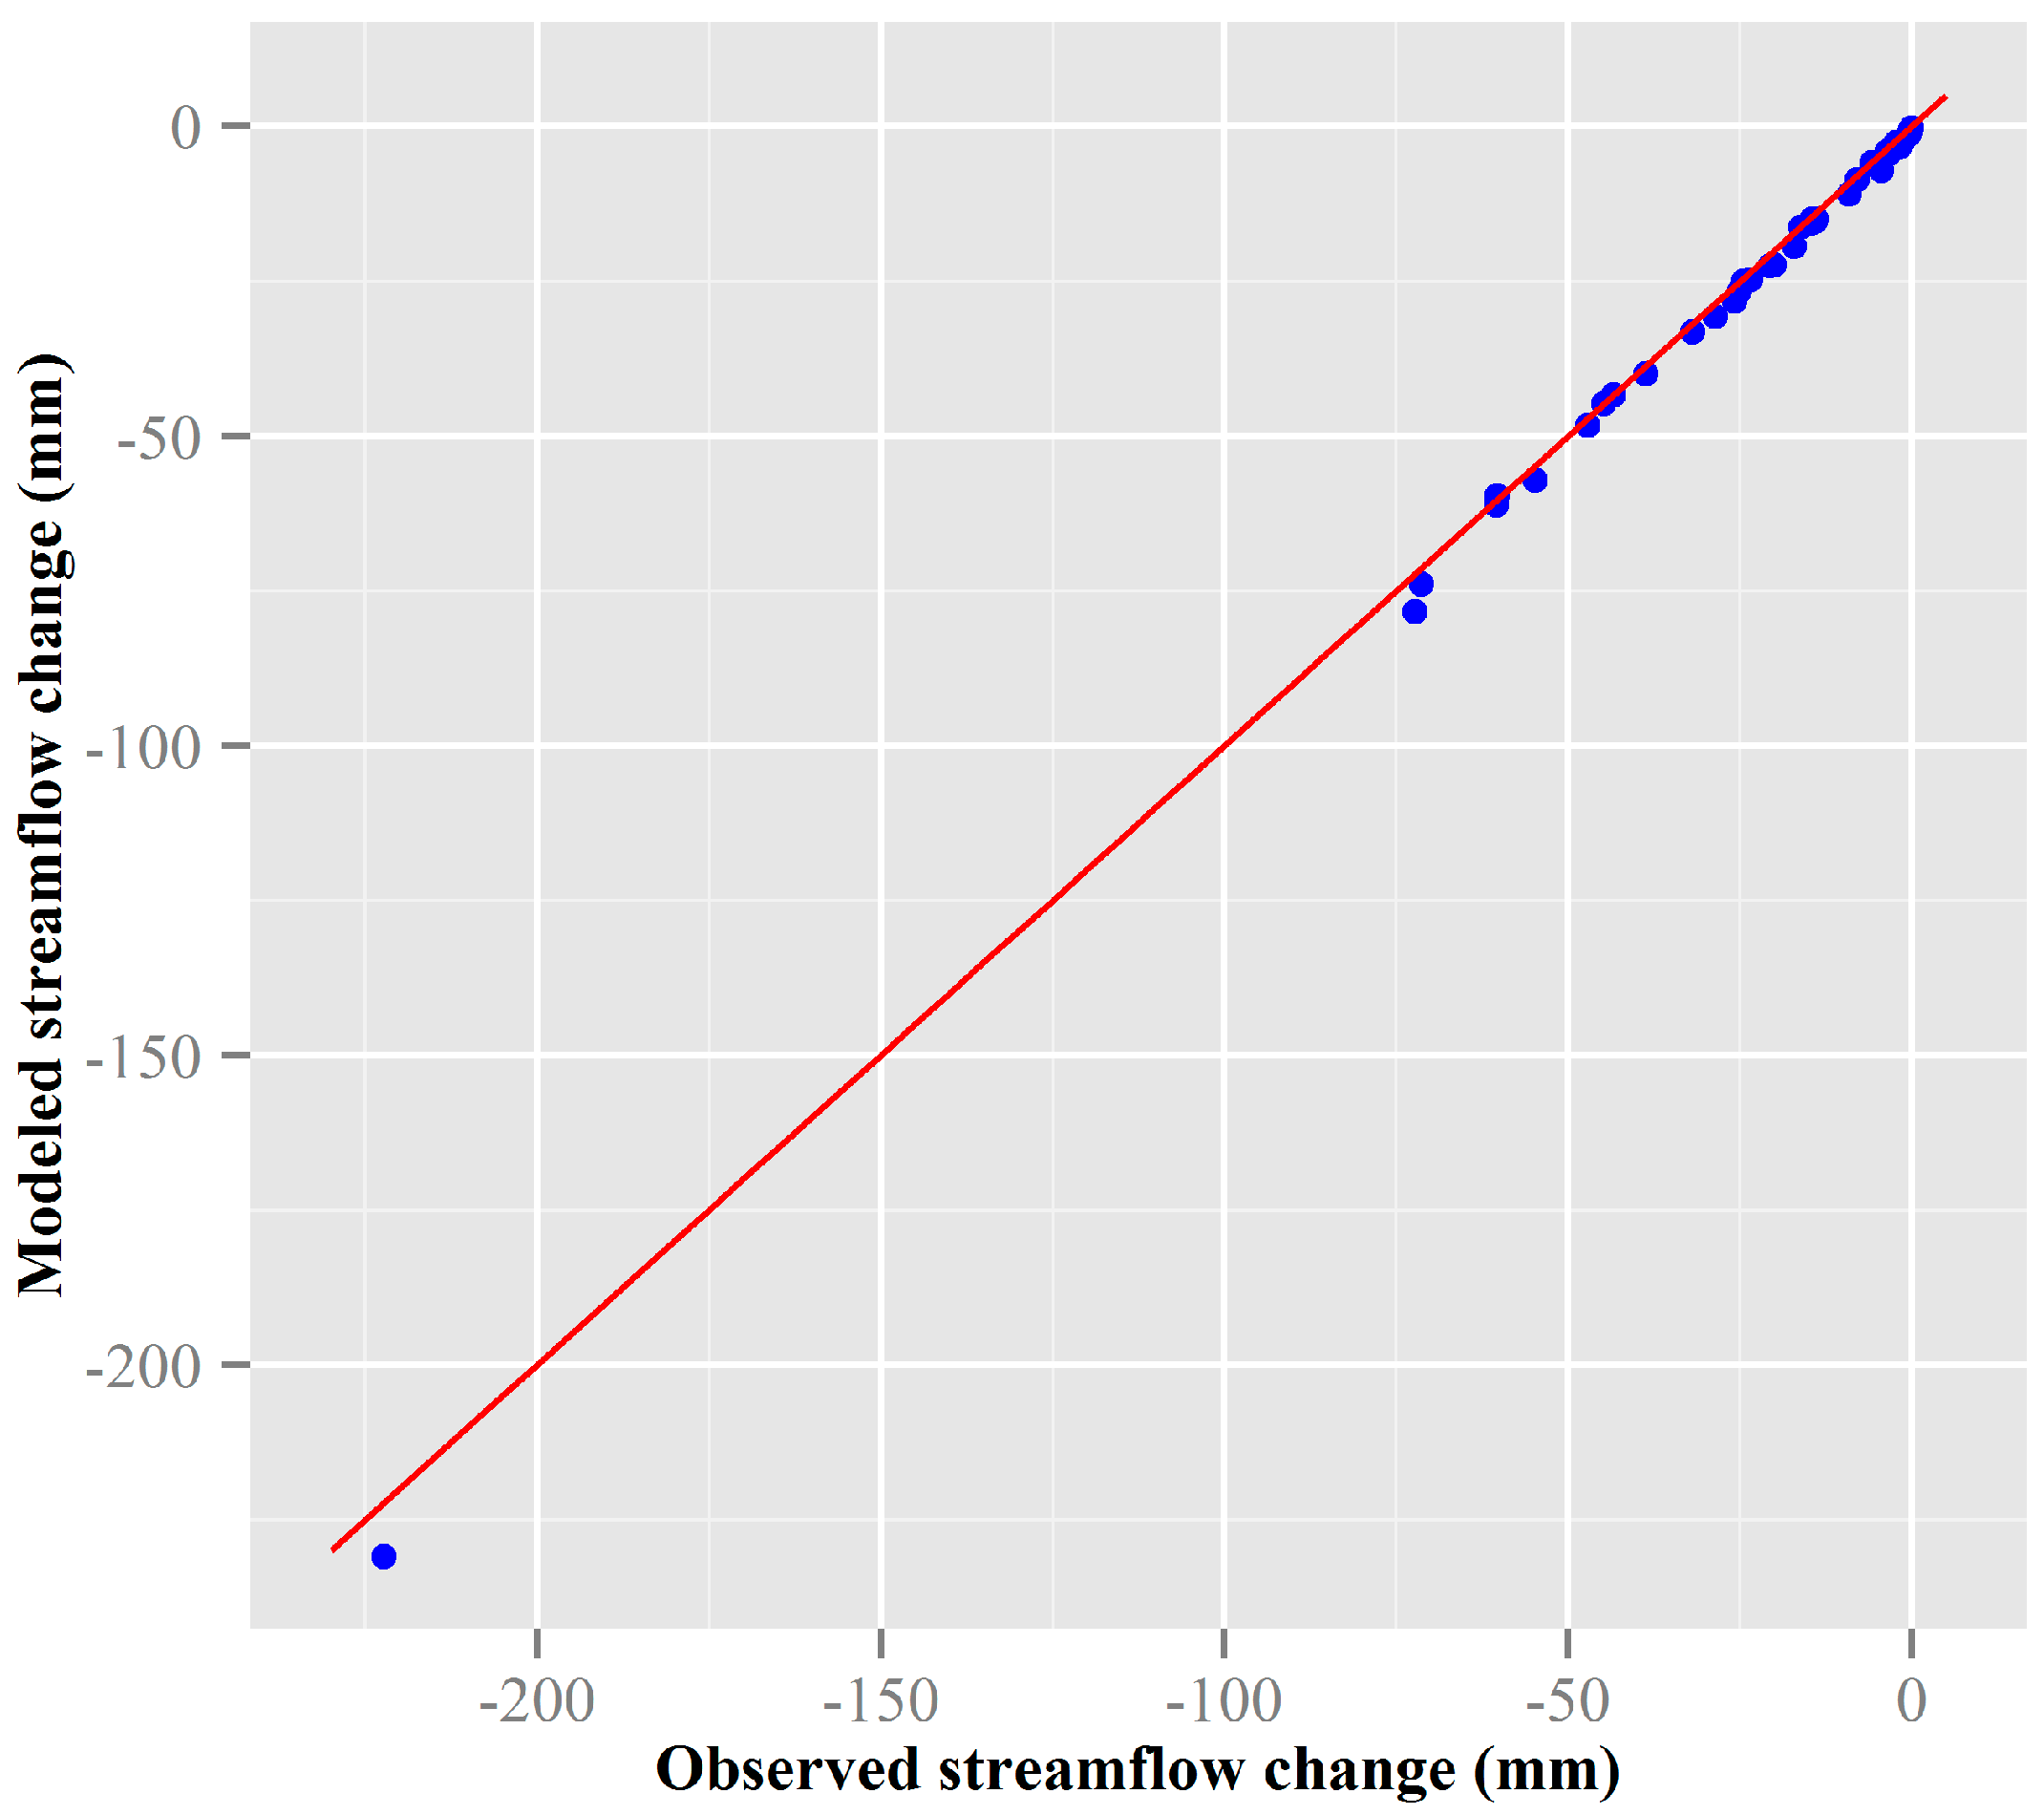
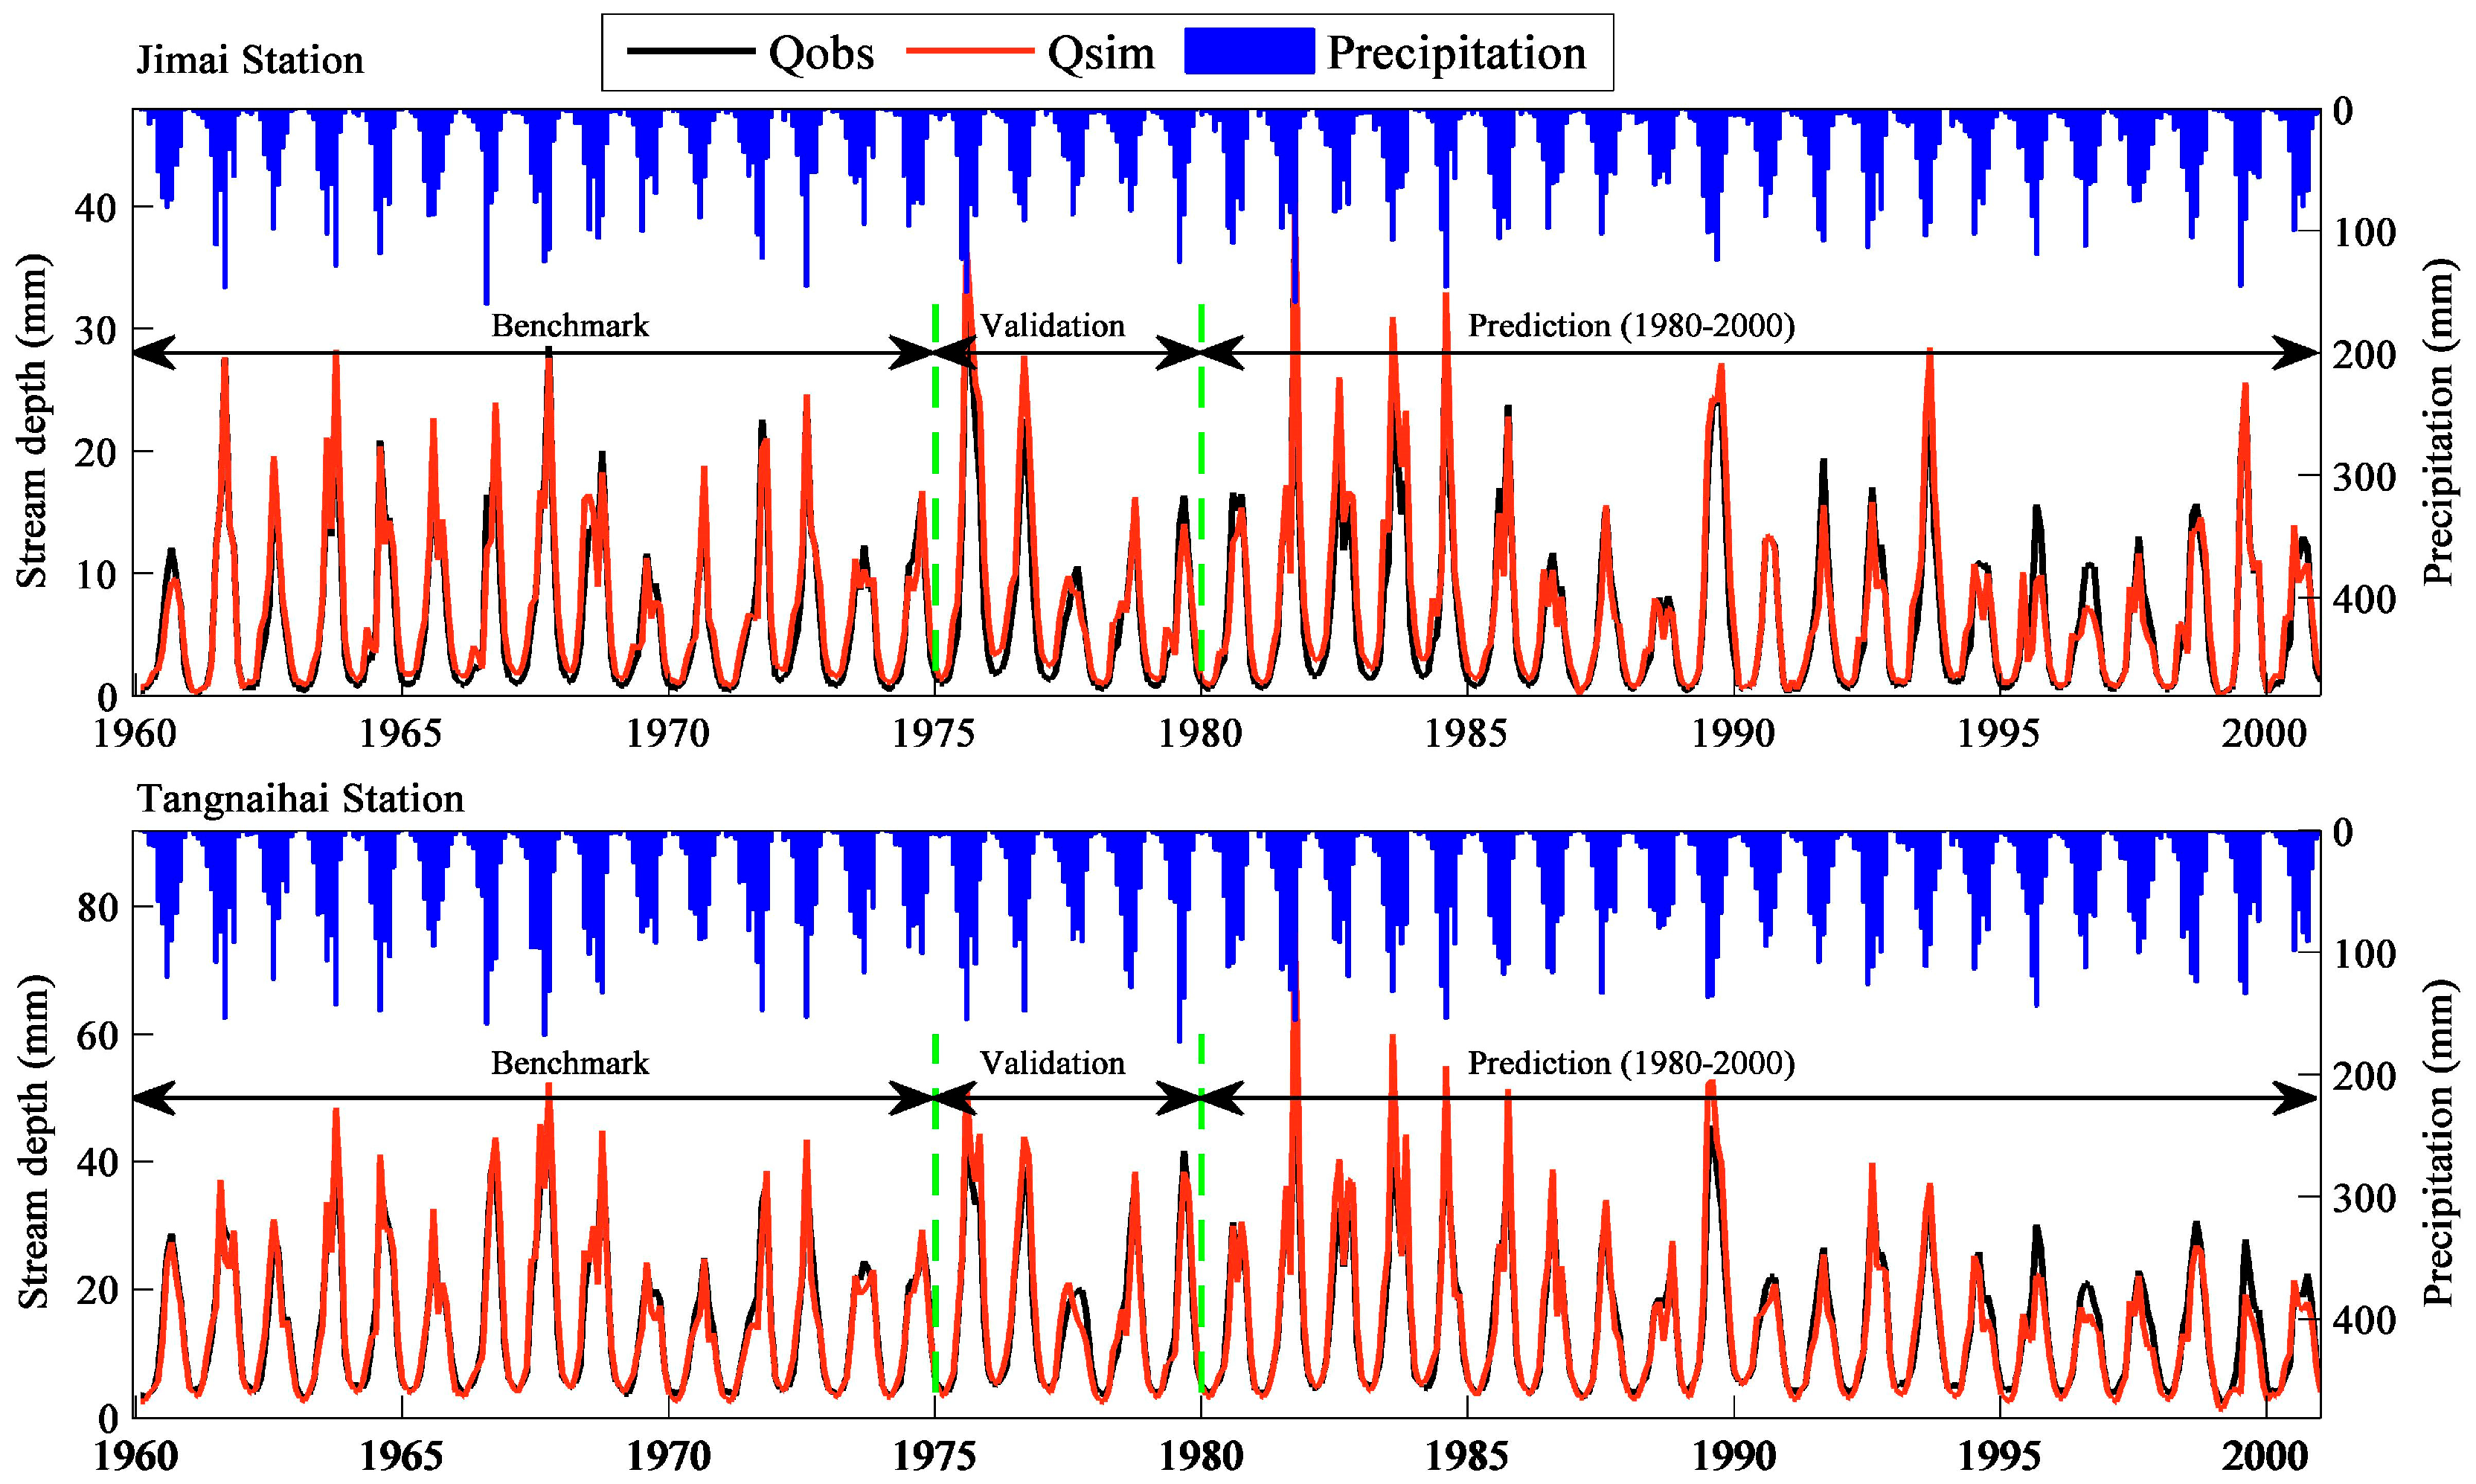
3.2. SIMHYD-Based Modelling

To further confirm the rationality and robustness of the results obtained by the Budyko framework, the SIMHYD model was also used to evaluate the impacts of climate change on streamflow in the Yellow River basin. SIMHYD is a conceptual model that was originally developed to estimate daily streamflow during the 1970s [35]. It is based on a consideration of streamflow yield under excess infiltration and excess storage and several of its parameters can usefully be applied for parameterization. The SIMHYD model has been widely used in hydrological modelling in India, Australia, and China, exhibiting generally good modelling performance [36]. In this study, optimization of the SIMHYD model was performed using a genetic algorithm with the Nash-Sutcliffe coefficient. The SIMHYD model is widely used in hydrological modelling and detailed information can be obtained from [35].
The hydrological model was calibrated based on the climatic conditions and underlying surface conditions in the benchmark period, and then the calibrated model was used to model streamflow by imputing the meteorological data in the impact period and keeping the calibrated parameter unchanged. The simulated streamflow in the impact period (Qsim) can be considered to include the climate change in the impact period and also human activities during the benchmark period. The observed streamflow in the benchmark period (Qobs1) is related to the climate conditions and human activities in the benchmark period. The observed streamflow in the impact period (Qobs2) is the result of the combined influences of climate change and human activities during benchmark and impact periods. Therefore, the difference between Qsim and Qobs1 was climate-induced streamflow change, and the difference between Qobs2 and Qsim was the human-induced streamflow change [18,37], namely:
Q c l i m = Q s i m Q o b s 1
Q h u m = Q o b s 2 Q s i m
The fractional contributions of climate change and human activities to streamflow are then calculated by Equation (7).
The simulated streamflow of the SIMHYD was evaluated by the determination coefficient [38] (R2), which can be calculated as:
R 2 = 1 i = 1 n ( Q o b s , i Q s i m , i ) 2   i = 1 n ( Q o b s , i Q o b s ¯ ) 2  
where Qobs,i and Qsim,i are the observed streamflow and simulated streamflow at the time i, respectively. Q o b s ¯ is the mean of observed streamflow.

3.3. Detection of the Change Points

Change points can be tested by many kinds of methods. Killick and Eckley [39] indicated that the At Most One Change (AMOC) test is free of the normality assumption based on the likelihood function, and can be used for both means and variances test, which is suitable for to detecting the change point. Liu et al. [40] suggested that the Ordered Clustering, a nonparametric test for variances of time series, can be used to analyze the change point. Villarini et al. [41] considered that the Pettitt test effective for detecting the change point. The Pettitt test is a nonparametric test which detect the change point in the mean when the change point is unknown. In order to avoid possible limitation and uncertainty by individual method, the assembled change point detection by all of the three test methods are adopted to get the final change point and confirm the change point with result from more than one method [42].

4. Results and Discussion

4.1. Abrupt Changes in the Factors Influencing Streamflow

The length of the streamflow time series used in this study was 41 years in most cases, covering the period 1960–2000. Tan and Gan [12] suggested that the mean time of the change points can be taken as the time point for the subdivision of streamflow series in a study region. In order to avoid possible limitation and uncertainty by one method, in the present study, the timing of change points was integratively detected using AMOC [39], the Pettitt test [8], and the ordered cluster test [40]. The assembled change points were confirmed based on more than one method. If the detected results are all different, the median change point would be selected.
The spatial distribution of the change points is shown in Figure 2a. The timing of change points varies considerably at different locations along the Yellow River basin, but their mean time is 1979. It should be noted here that 1980 marked the introduction of the Reform and Open policy in China, after which the construction of hydraulic engineering facilities and water reservoirs was vigorously pursued to support the development of agriculture and industry. It is therefore reasonable to choose 1980 as the time point at which abrupt changes are most likely to occur in streamflow series across China and the streamflow series for the Yellow River basin was therefore subdivided into two time intervals for this study, namely Period 1 (1960–1979) and Period 2 (1980–2000). Another time interval of 2001–2014 was taken as the third period or Period 3.

4.2. Elasticity of the Factors Influencing Streamflow

When compared to streamflow during 1960–1979, streamflow during 1980–2000 and 2001–2014 decreased with a different magnitude of 21% and 19%, respectively (Figure 2). The reductions of streamflow in the upper Yellow River basin were smaller than those in the middle and lower Yellow River basin, where streamflow fell by as much as 40% in places (Figure 2a). From Period 1 to Period 2, the streamflow in the upper, middle and lower Yellow River basin fell by 12.5%, 24.2%, and 32.5%, respectively. Figure 3 shows the spatial patterns of the elasticity coefficients of the factors driving these changes in streamflow across the Yellow River basin. As the figure shows, different elasticity coefficients for these factors influencing streamflow can be identified across the Yellow River basin, with elasticity coefficients lower in the upper Yellow River basin and relatively higher in the middle and lower Yellow River basin. Interestingly, the highest elasticity coefficients are in the Loess Plateau, markedly above those in the middle and lower Yellow River basin, which shows the higher sensitivity of the plateau’s streamflow to climate variations and changes in the underlying watershed properties. Streamflow is particularly sensitive to changes in precipitation and underlying watershed properties (Figure 3f); a 1% increase in precipitation can cause a 1.12%–3.78% increase in streamflow, while an increase of 1% in the underlying parameter can cause a drop of 0.47%–3.37%. In general, precipitation and relative humidity have positive impacts on streamflow, and maximum/minimum air temperature, solar radiation, wind speed, and underlying parameters all have a negative effect on streamflow (Figure 3). Streamflow change is more sensitive to precipitation than the underlying parameter and other evaporation-related factors.

4.3. Fractional Contribution of Driving Factors

Figure 4 compares the changes in the observed average annual streamflow and simulating one, which is the sum of the seven factors influencing variation in streamflow by Equation (6), for the years 1980–2000. As the linear plot shows, they are in very good agreement, with a correlation coefficient of 0.99, which is significant at a 95% confidence level and a mean error of 1.5 mm (5.1%). those confirm that the modelled streamflow changes based on the fractional contribution of the various factors do indeed provide a good representation of the observed streamflow processes. It is worthwhile mentioning that there is an outlier point in Figure 4, which is Laiwu hydrological station on the Dawen River (Table 1; Figure 1). The streamflow in Laiwu station is severely affected by the reservoirs. There are two large reservoirs in the catchment of Laiwu—i.e., Huangqian and Dongzhou reservoirs—with the sum capacity of 1.54 × 10⁹ m3, which accounts for 91.1% of the annual average streamflow in Laiwu station. That led to a large decrease of the streamflow and then cause the outlier point. Figure 5 shows the fractional contribution of the factors influencing streamflow for each of the meteorological stations in this study. Comparing Period 2 (1980–2000) and Period 1 (1960–1979), the underlying parameter clearly plays a key role in decreasing streamflow all across the Yellow River basin (Figure 5a). Underlying watershed properties are responsible for decreases of up to 20.3 mm in streamflow depth and make a fractional contribution of up to 54.7% of the total change in streamflow. Decreased precipitation is also important, decreasing streamflow by up to 9.8 mm and making a fractional contribution of up to 33.1% of the total. The wind speed also contributes, increasing the streamflow depth by as much as 1.36 mm and also boosting the stream’s flow rate, causing a further 1.39 mm increase in the streamflow depth. Less significant contributions come from the maximum and minimum air temperatures, the relative humidity, and solar radiation, which decrease the streamflow with fractional contributions of 1.9%, 2.5%, 1.8%, and 0.3%, respectively. The order of contribution for each influencing factors to streamflow change from large to small are: underlying parameter > precipitation > wind speed > minimum air temperature > maximum air temperature > relative humidity > solar radiation.
Figure 5b shows the relative fractional contribution of the factors influencing the changes in streamflow during Period 3 (2001–2014) relative to Period 1 (1960–1979). The fractional contribution of precipitation here is 12.4% and underlying watershed properties make a larger fractional contribution than precipitation to streamflow changes, at 64.4%, with an increase of 10% in the underlying parameter causing a 25.9 mm decrease in the streamflow. Compared with the fractional contribution of the underlying parameter to changes in streamflow during Period 2, the fractional contribution of the underlying parameter in Period 3 increased by 9.7%. Other meteorological factors also make a noticeably greater fractional contribution to streamflow changes during 2001–2014 compared to the earlier time intervals. The mean fractional contributions of the maximum and minimum air temperatures, wind speed, relative humidity and solar radiation for the most recent years are 6.0%, 4.1%, 6.9%, 5.4%, and 0.8%, respectively. In general, modifications to watershed properties are the major cause of the decreased streamflow in the Yellow River basin. Climate change does still play a role, however; decreased precipitation is the second most important factor driving the declining streamflow across the river basin.

4.4. Climate- and Human-Induced Impacts and the Implications of Underlying Parameters

Climate change affects streamflow via changes in precipitation, air temperature, solar radiation, relative humidity, and wind speed, while underlying parameters reflect human-induced impacts on streamflow. For this study, the fractional contribution of climate change and human activities to changes in streamflow were quantitatively evaluated for Periods 2 and 3 (Figure 6). The data presented in Figure 6a clearly indicate that although climate change played a significant role in influencing streamflow changes during Period 2 than it did in Period 1, human activities still made a higher fractional contribution of 63.5% to the changes in streamflow across the Yellow River basin. Although streamflow changes at stations along the tributaries of the Yellow River basin are highly sensitive to climate change, the hydrological processes monitored by stations along the main stem of the Yellow River are primarily influenced by human activities with an overall fractional contribution larger than 29.3%—with the mean of 73.4%—implying the more significant impact of human activities. Figure 6b shows the increasing impact of human activities on streamflow variations in Period 3, with the mean fractional contribution of human activities being responsible for larger than 71.6% (with the mean of 82.5%) of the changes in streamflow. Those imply that the human activity is the key factor for decreasing streamflow in the Yellow River basin, and the impacts of human activities appear to be intensifying. Chang et al. [26] used the Variable Infiltration Capacity (VIC) model to evaluate the impact of climate change and human activities on streamflow in the Weihe River basin (a sub-catchment of Yellow River basin), and found that the contribution of human activities to streamflow change are 64%–90% from 1970s to 2000s. Their results of human-deduced contribution are consistent with ours.
The underlying parameter, n, is known to provide a good proxy for human-induced streamflow changes [12,24], but the impact of human activities on streamflow changes or hydrological processes are complex in both space and time. Generally, fluvial tributaries are grouped based on the different degrees of impacts their underlying features have on streamflow [12,34], especially different land use and land cover changes. Based on the degree to which the Human activities affected streamflow during Period 2 (1980–2000) relative to Period 1 (1960–1979), the 37 hydrological stations in the Yellow River basin were classified into nine groups (about four stations for each group) for each subgraph to address the relationship between human-induced streamflow changes and human-related factors (Figure 7).
The human-induced streamflow change rates (human-induced streamflow changes/mean annual streamflow) are compared with the land use/land cover changes (Figure 7a–f). The change of farmland area, water area, forest area, and grass area has no obvious correlation with the human-induced streamflow changes (Figure 7a–d). However, it is worth noting that the relationships are relatively obvious for the cropland area changes when human-induced streamflow change in the range of −40%–0% (Figure 7a), implying that the farmland area changes are one of the important factors for decreased streamflow in the Yellow River basin, but not the reason for the sharp decrease or increase of streamflow. Actually, the Yellow River basin is mainly located in arid and semi-arid climate regions, 40% of the farmland is irrigated using the water from Yellow River. Thus, increased farmland increased the irrigation water and hence decreased streamflow. Figure 7e shows that reservoir capacity ratio (total storage/mean annual streamflow) has a negative correlation with the human-induced streamflow changes. The storage of reservoirs was directly related to the impoundment effects, which increased evaporation and hence decreased streamflow. Five large water reservoirs were constructed in the Yellow River basin during the 1980s and 1990s with a total water storage capacity of 3.365 × 10¹⁰ m3, 62.2% of the entire water storage capacity of the reservoirs were built prior to 2000. The urban land changes are also compared with the human-induced streamflow changes (Figure 7f). Generally, larger urban land decreases the evaporation and infiltration, then leads to larger streamflow. However, it is interesting to note that the human-induced streamflow changes show a negative correlation with the urban land change. That may be due to the increasing water withdrawal along with the urbanization.
It should be noted here that human activities such as water withdrawal for agricultural and living purposes are not easily quantifiable even given good datasets. In this study, population density and GDP were used as indices of human activities to examine the impact of human activities on streamflow in the Yellow River basin (Figure 7g,h). The figures show that population density and GDP are closely related to decreased streamflow, indicating that socio-economic development and high population density lead to significant decreases in streamflow because both require the withdrawal of large amounts of water, inevitably decreasing streamflow in the local area and further downstream. In this sense, the underlying parameter, n, includes information on both land use and land cover changes as well as human consumption of water resources for agricultural and industrial development.

4.5. Comparison of Results Obtained for the Budyko Framework and SIMHYD Model

Daily streamflow data collected at the Jimai and Tangnaihai meteorological stations for the period of 1960–2000 were used for the SIMHYD-based hydrological modelling, with 1960–1974 as the benchmark period and 1975–1979 the validation period. The impacts of climate change on streamflow in those locations were then tested using the data for 1980–2000. Figure 8 shows a comparison of the modelled and observed monthly streamflow processes, demonstrating the statistically good modelling performance achieved by the SIMHYD model with NASH coefficients of above 0.93 when modelling the hydrological processes at these two hydrological stations. Based on the SIMHYD-based modelling results, the fractional contributions of climate change to changes in the streamflow at the Jimai and Tangnaihai monitoring stations are 52.4% and 39.2%, respectively, very close to the results obtained using the Budyko framework (Table 2), further corroborating robustness of this new method. The findings of this study also support those reported by previous studies in the same river basin. Zhao et al. [16] demonstrated that streamflow changes in 16 of the 18 tributaries in the middle Yellow River basin were primarily affected by human activities. Liang et al. [20] evaluated the effects of ecological conservation activities for the period 1960–2009 on streamflow, reporting that the fractional contribution of climate change to streamflow changes was 38% and that of ecological conservation activities, which are after all a type of human activity, were 62%. Gao et al. [24] analyzed the impacts of climate change and human activities on streamflow on the Loess Plateau, suggesting that the fractional contributions of changes in underlying watershed properties and precipitation were 64.75% and 41.55%, respectively. Compared to these earlier studies, the current study includes more meteorological factors and a wider range of human activities beyond simply land use and land cover by examining changes in forest land, cropland and water areas, population density, and GDP, as well as providing a more detailed picture of both climate- and human-induced impacts on hydrological processes.

5. Conclusions

Based on an improved Budyko framework that incorporates the FAO’s Penman-Monteith model, the elasticity of climatic and human components that influence changes in the streamflow in the Yellow River basin were analyzed in both space and time. The results of the analysis led to the following interesting and important conclusions:
(1)
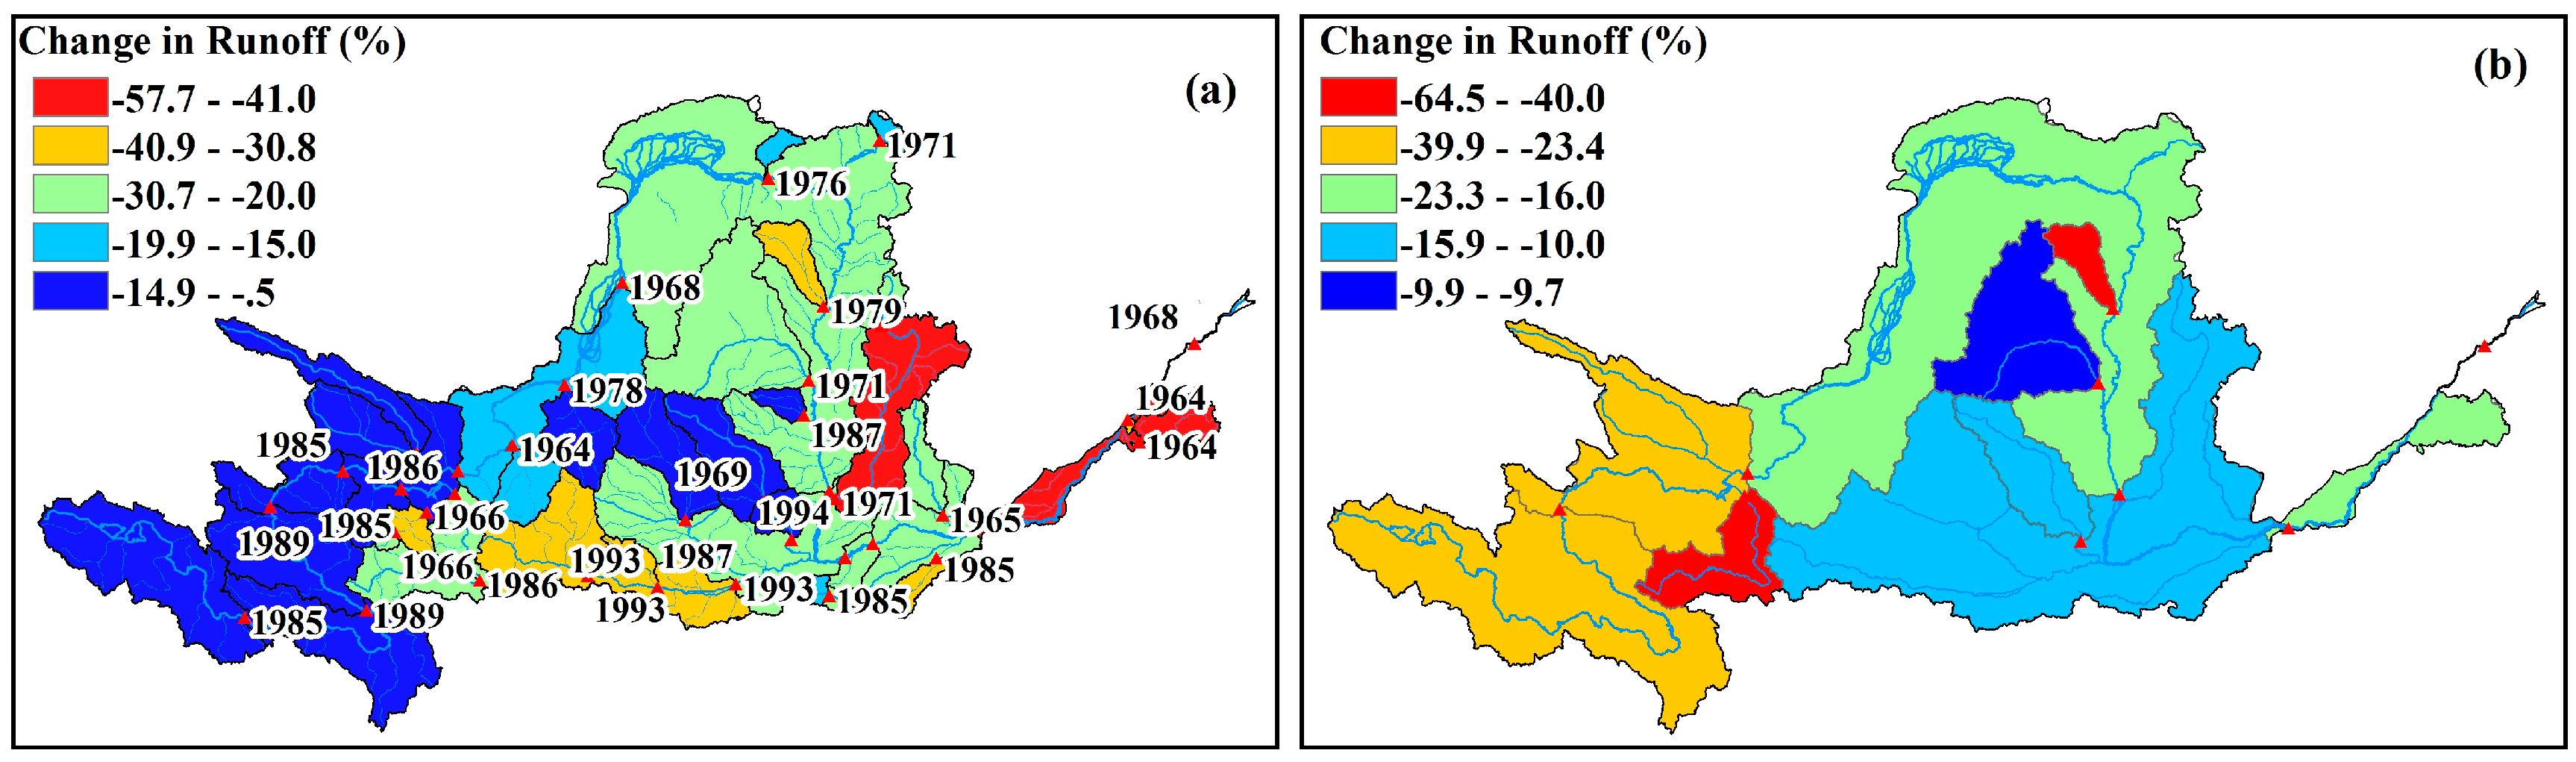
Compared to the period 1960–1979, a mean decrease of 21% was observed in streamflow in the Yellow River basin for the period 1980–2000, and this decrease was most strongly evident in the lower Yellow River basin. A further decrease of 19% in the streamflow was observed for the period 2001–2014.
(2)
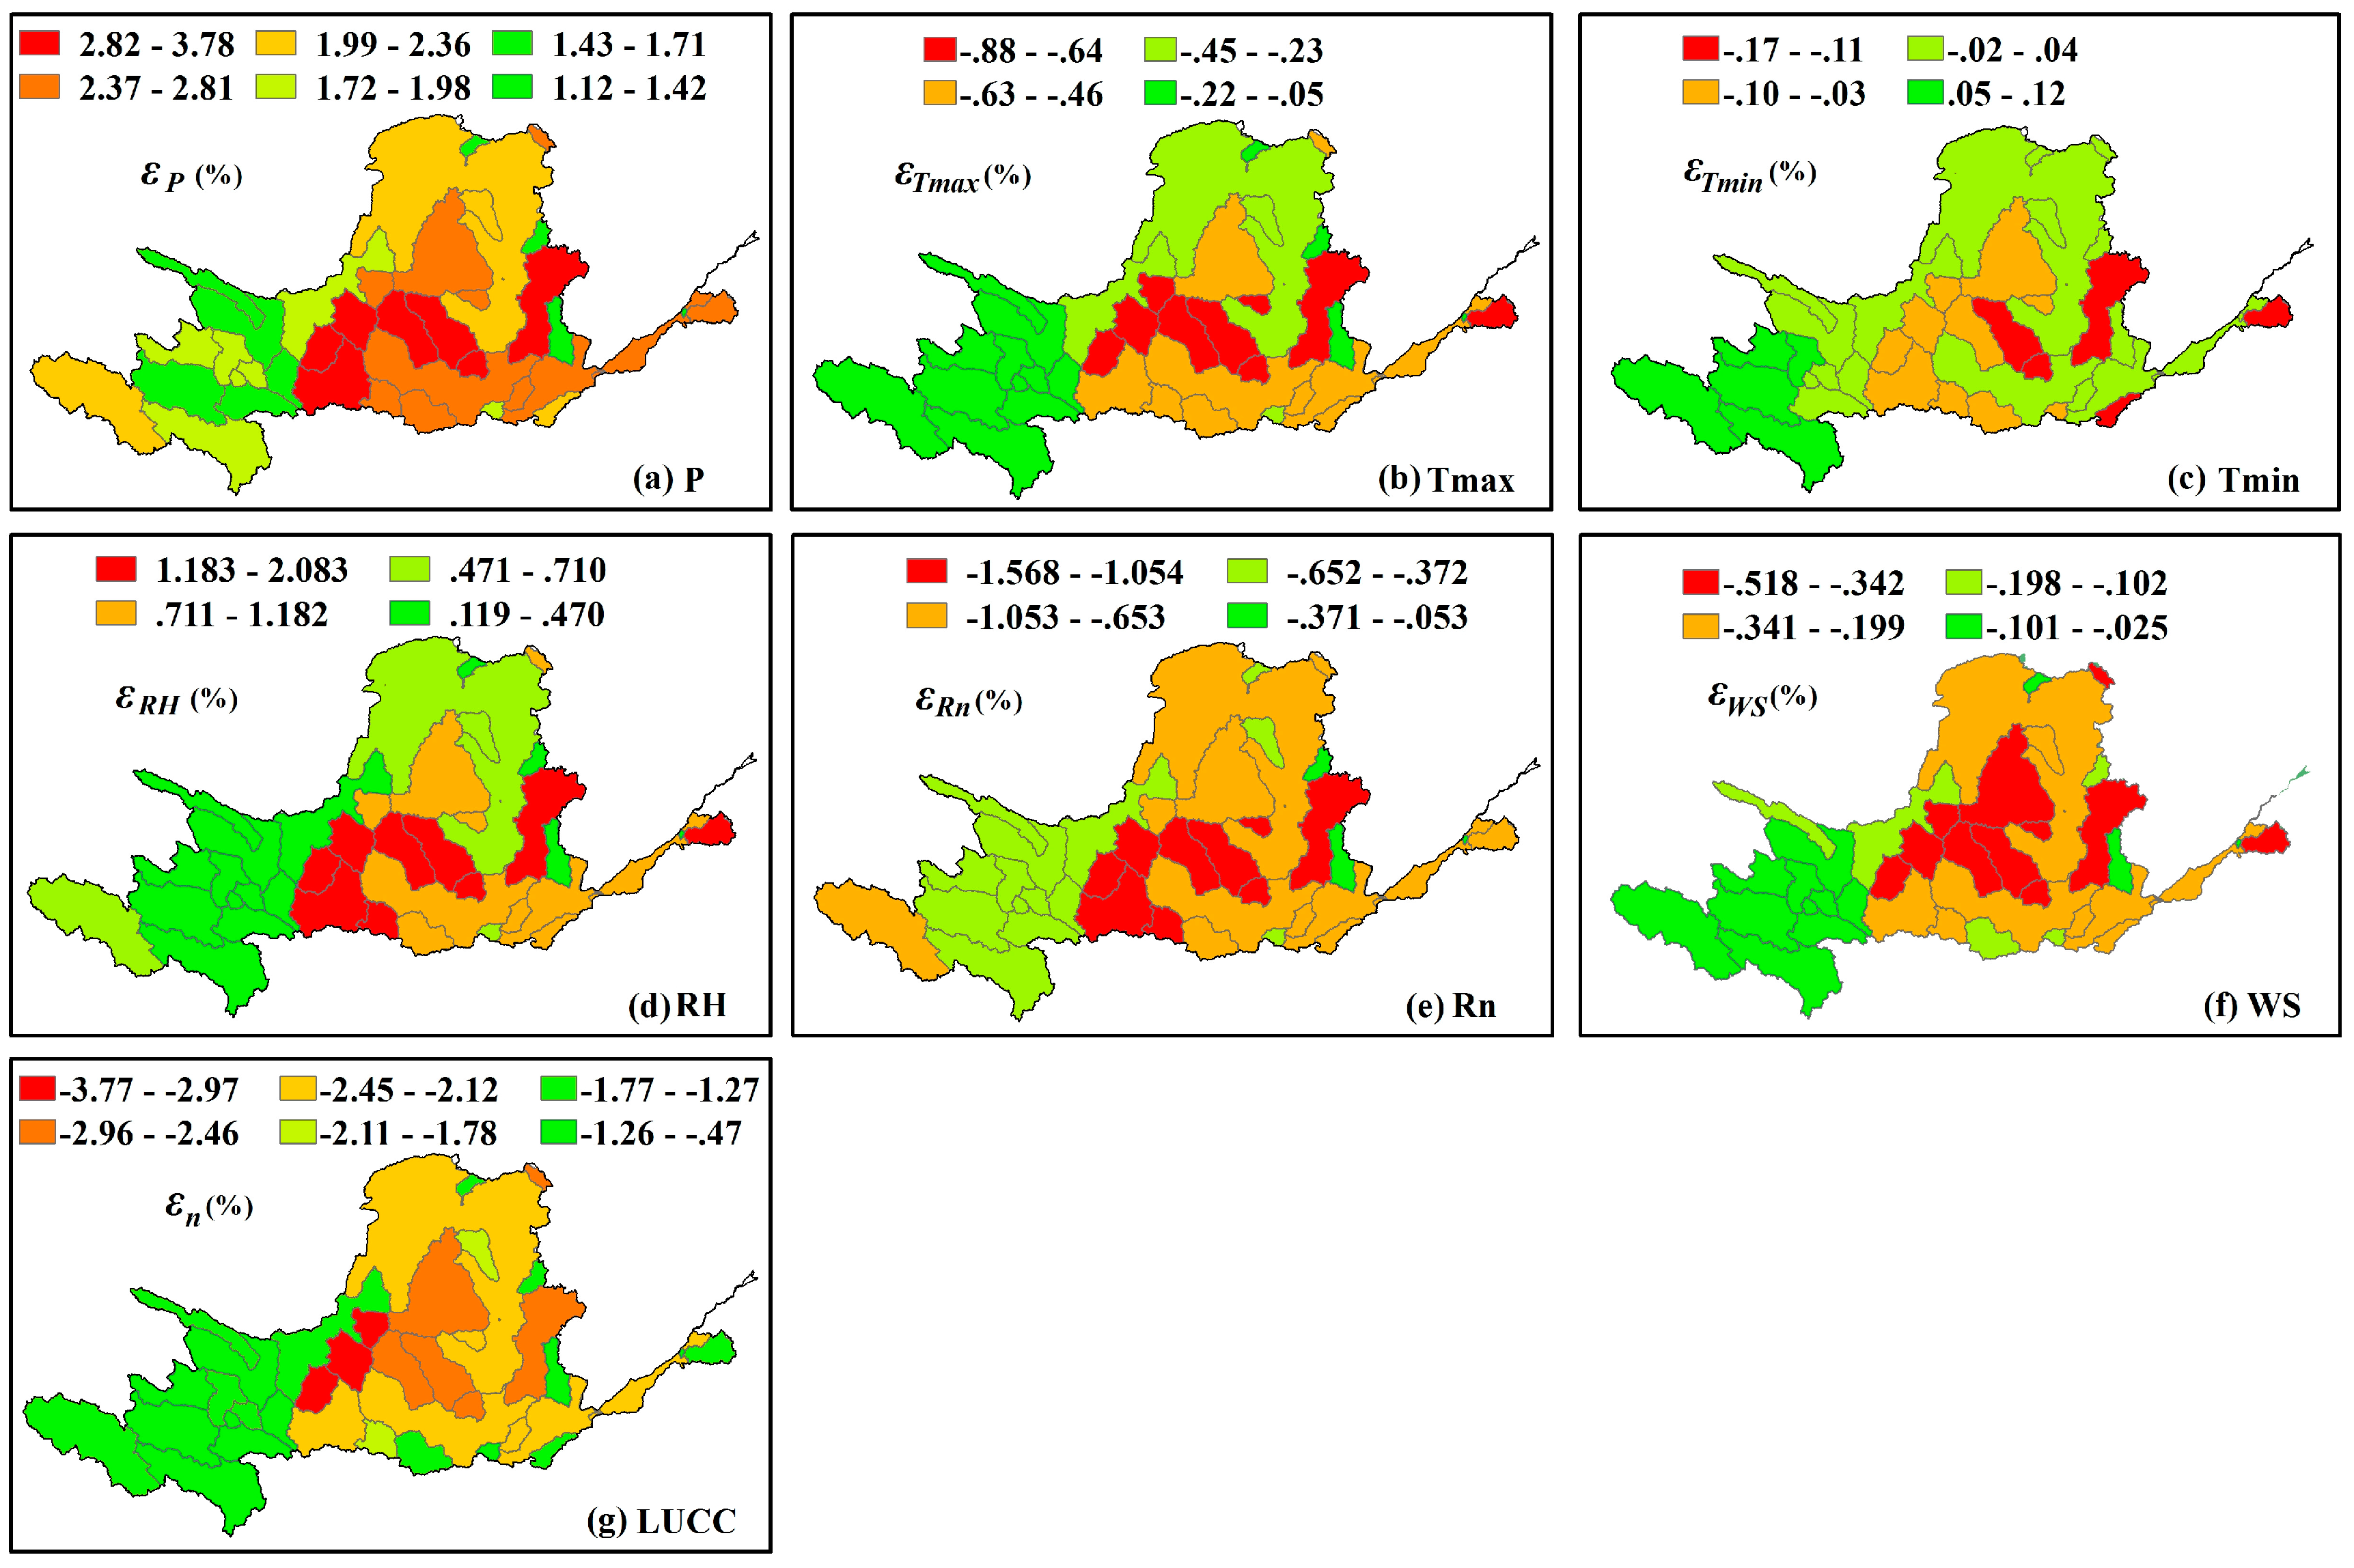
The impacts of the various factors influencing streamflow are different spatially across the Yellow River basin. The highest sensitivity of streamflow changes to the factors considered in this study was observed in the Loess Plateau. Precipitation and relative humidity both have positive impacts, increasing streamflow, but maximum/minimum air temperature, solar radiation, wind speed, and the underlying parameter all have negative impacts on streamflow. Streamflow change is more sensitive to precipitation than the underlying parameter and other evaporation-related factors.
(3)
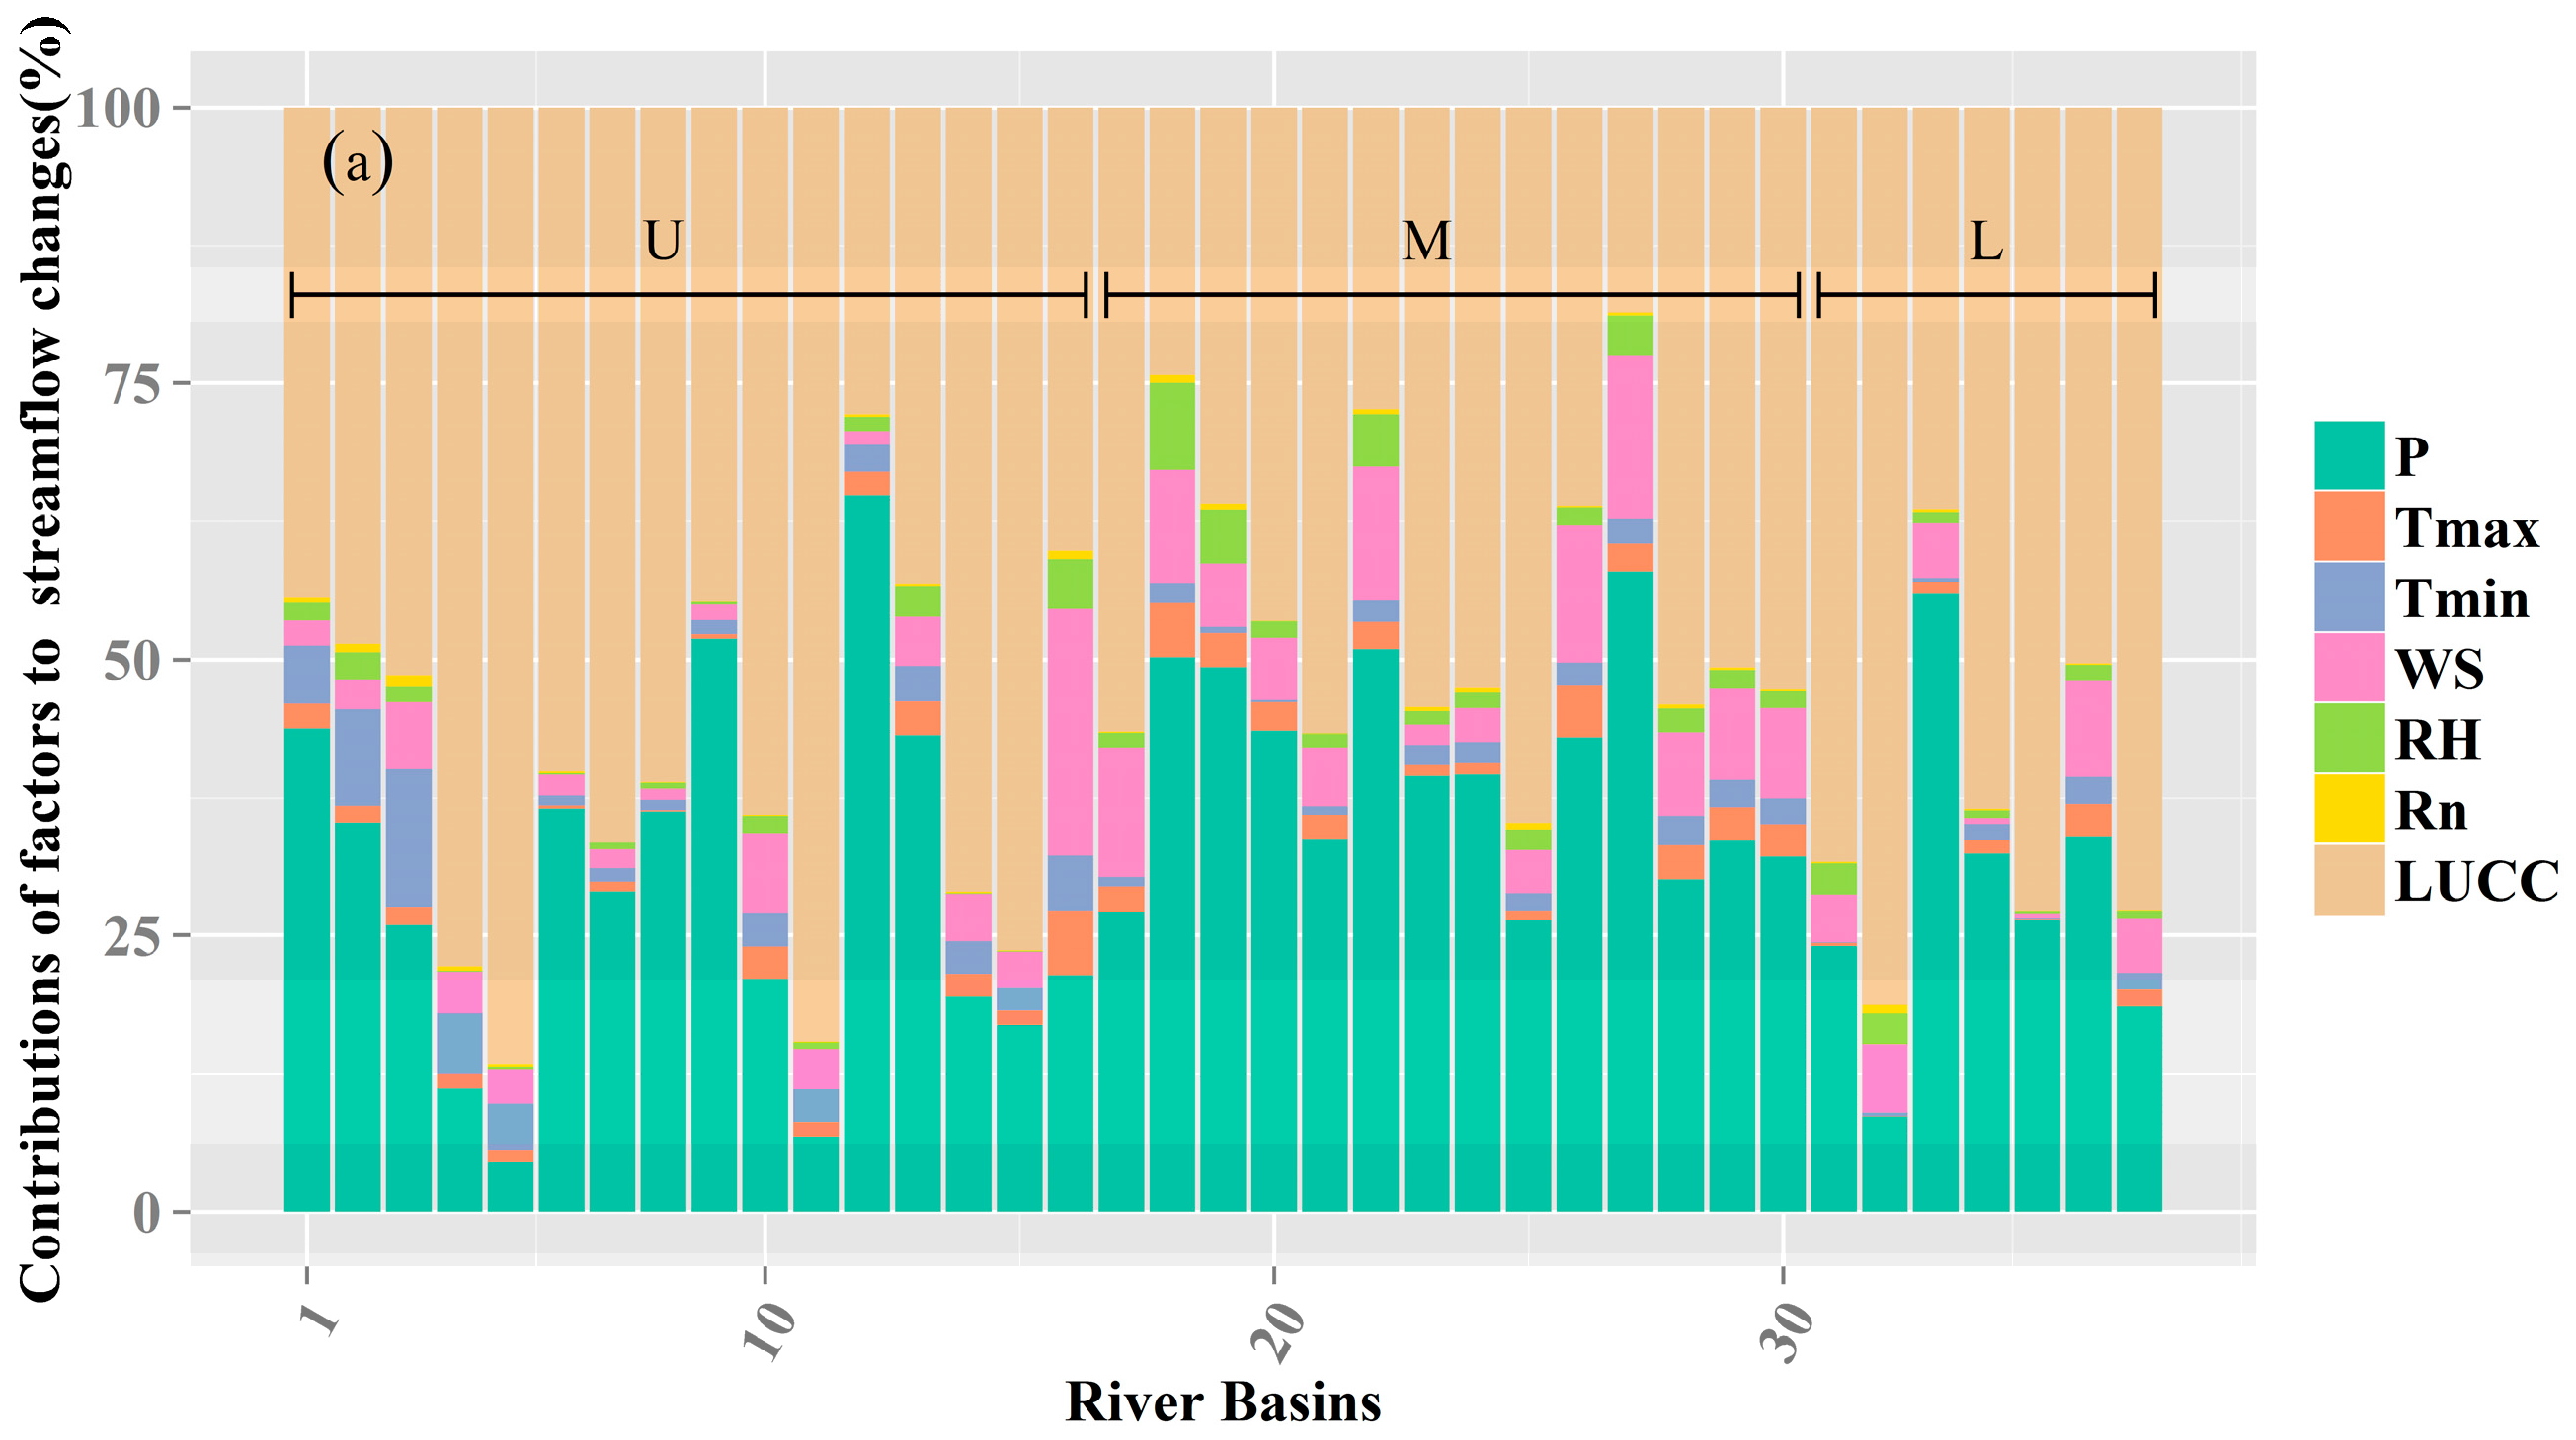
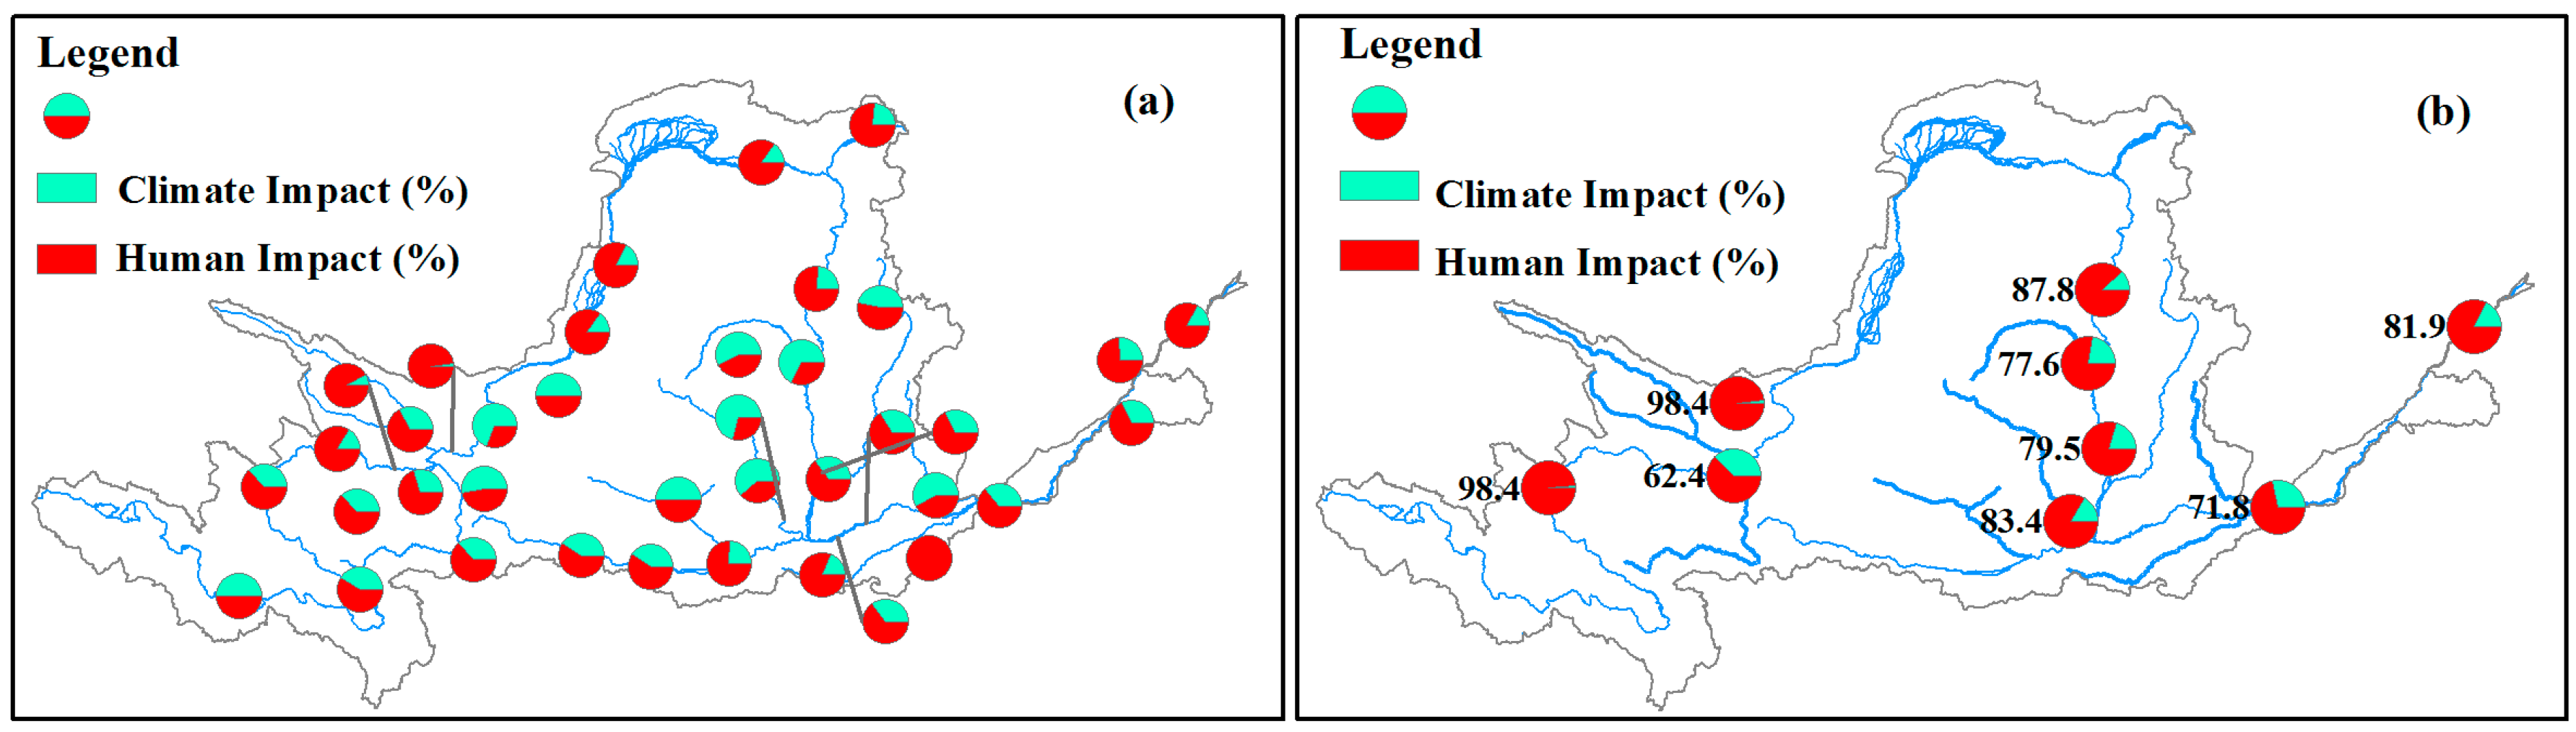
Human activities have a greater effect on hydrological processes than other influential factors. Relative to the benchmark period of 1960–1979, the fractional contribution of human activities to streamflow changes during 1980–2000 was 63.5% and increased further during the period 2001–2014. The amplifying effect of human impacts on changing streamflow due to the rapid intensification of human activities clearly has the potential to add considerable uncertainty for the management of water resources, posing a serious challenge to basin-scale water resource management in the Yellow River basin as well as in similar major river basins across the globe.
(4)
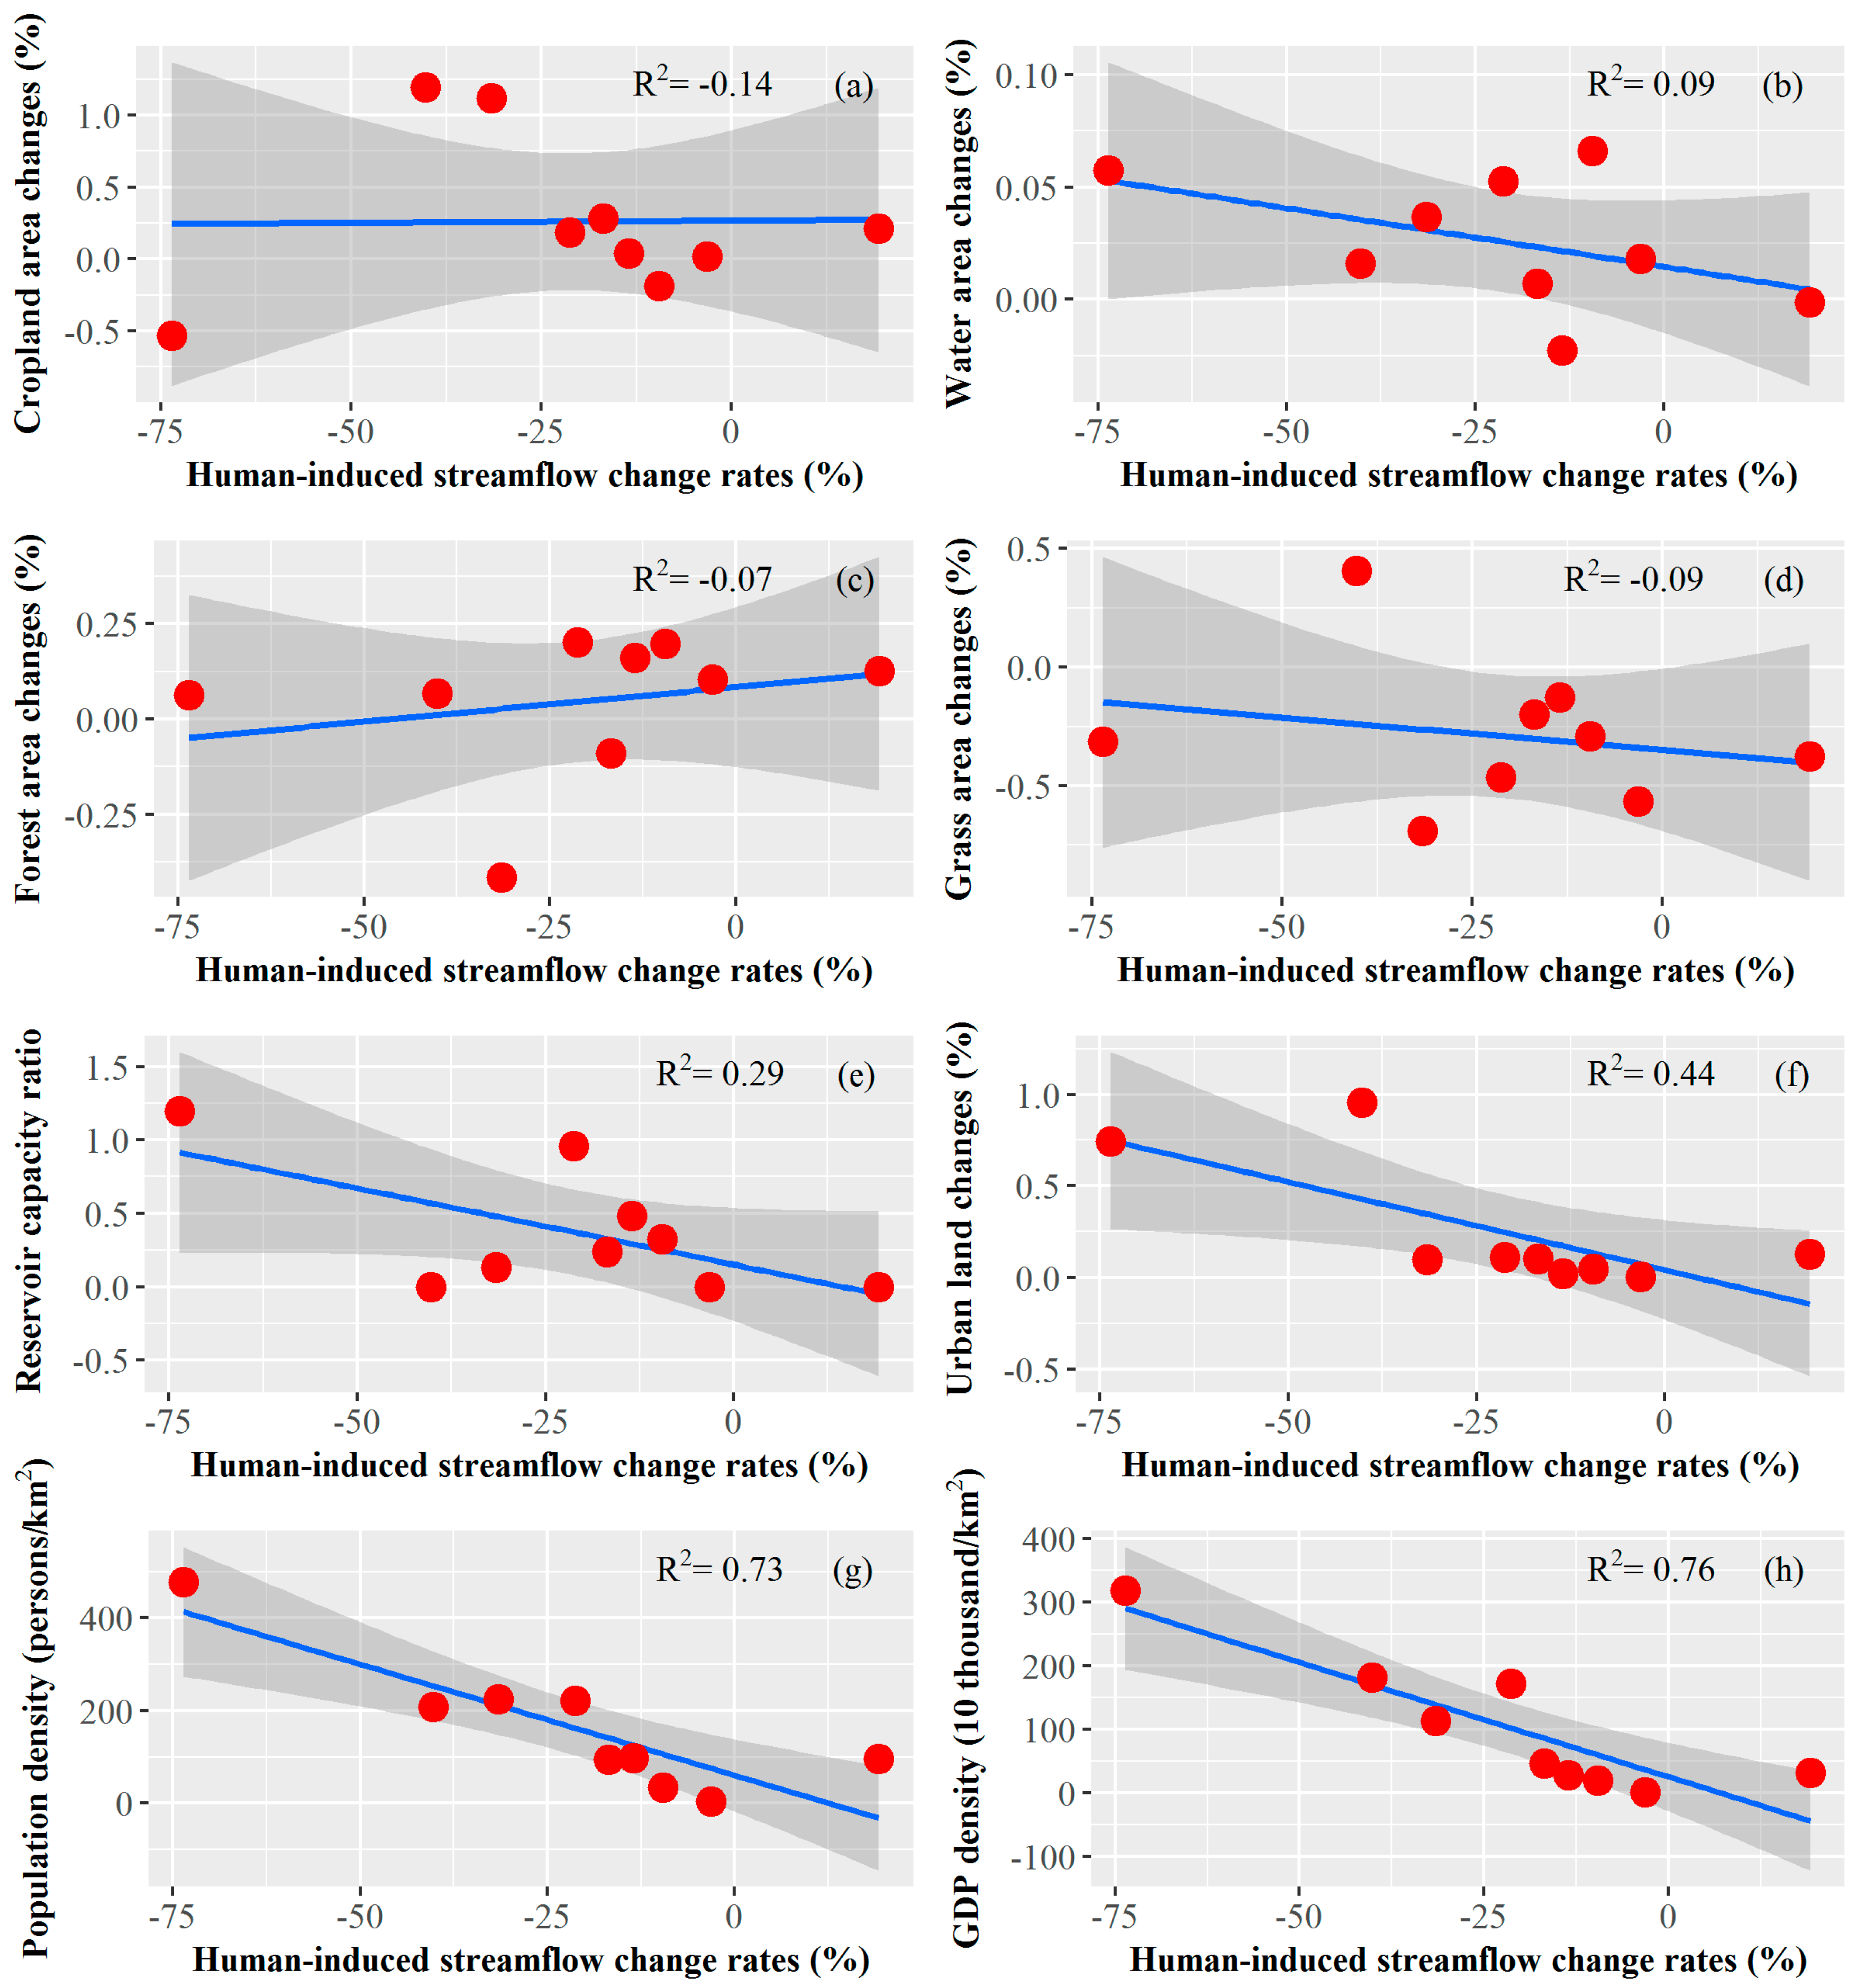
Cropland, forest land, water area, and the underlying parameter, n, all have significant negative impacts on streamflow. However, the most significant impacts were detected for GDP and population density. The use of these relatively simple terms to represent human activities inevitably fails to convey sufficient information regarding human-induced impacts on streamflow in the world’s great river systems. Additional components of human activities such as water withdrawal rates need to be considered and appropriate datasets need to be developed. How best to take into account the full range of human activities that may affect our waterways and their related impacts on hydrological processes remains a vitally important scientific issue that will continue to be addressed in the ongoing research being conducted in this area.

Acknowledgments

This work received financial support from the National Natural Science Foundation of China (Grant No.: 51139002, 51369016, and 41621061), the Ministry of Education Innovative Research Team (Grant No.: IRT13069), the Excellent Young Scientist Foundation of Inner Mongolia Agricultural University of China (Grant No.: 2014XYQ-11), the Natural Science Foundation of Inner Mongolia (Grant No.: 2015MS0566), the National Science Foundation for Distinguished Young Scholars of China (Grant No.: 51425903), and was fully supported by a grant from the Research Grants Council of the Hong Kong Special Administrative Region, China (Project No. CUHK441313; HKBU 22301916). Our cordial gratitude should be extended to the anonymous reviewers for their pertinent and professional comments and suggestions which are greatly helpful for further quality improvement of this paper.

Author Contributions

Bin Li and Jianyu Liu conceived and designed the experiments; Bin Li and Changyou Li performed the experiments; Qiang Zhang and Limin Duan analyzed the data; Bin Li and Jianyu Liu contributed analysis tools; Bin Li and Qiang Zhang wrote the paper.

Conflicts of Interest

The authors declare no conflict of interest.

References

  1. Dinpashoh, Y.; Jhajharia, D.; Fakheri-Fard, A.; Singh, V.P.; Kahya, E. Trends in reference evapotranspiration over Iran. J. Hydrol. 2011, 399, 422–433. [Google Scholar] [CrossRef]
  2. Zhu, Z.; Chen, Z.; Chen, X.; He, P. Approach for evaluating inundation risks in urban drainage systems. Sci. Total Environ. 2016, 553, 1–12. [Google Scholar] [CrossRef] [PubMed]
  3. Zhang, Y.; You, Q.; Chen, C.; Ge, J. Impacts of climate change on streamflows under RCP scenarios: A case study in Xin River Basin, China. Atmos. Res. 2016, 178, 521–534. [Google Scholar] [CrossRef]
  4. Xiao, M.; Zhang, Q.; Singh, V.P. Influences of ENSO, NAO, IOD and PDO on seasonal precipitation regimes in the Yangtze River basin, China. Int. J. Climatol. 2014. [Google Scholar] [CrossRef]
  5. Zhou, Y.; Zhang, Q.; Singh, V.P. Fractal-based evaluation of the effect of water reservoirs on hydrological processes: The dams in the Yangtze River as a case study. Stoch. Environ. Res. Risk Assess. 2014, 28, 263–279. [Google Scholar] [CrossRef]
  6. Liu, J.; Zhang, Q.; Singh, V.P.; Gu, X.; Shi, P. Nonstationarity and clustering of flood characteristics and relations with the climate indices in the Poyang Lake basin, China. Hydrol. Sci. J. 2017, in press. [Google Scholar]
  7. Poff, N.L.; Olden, J.D.; Merritt, D.M.; Pepin, D.M. Homogenization of regional river dynamics by dams and global biodiversity implications. Proc. Natl. Acad. Sci. USA 2007, 104, 5732–5737. [Google Scholar] [CrossRef] [PubMed]
  8. Zhang, Q.; Gu, X.; Singh, V.P.; Xiao, M.Z.; Chen, X.H. Evaluation of flood frequency under non-stationarity resulting from climate indices and reservoir indices in the East River basin, China. J. Hydrol. 2015, 527, 565–575. [Google Scholar] [CrossRef]
  9. Roderick, M.L.; Farquhar, G.D. A simple framework for relating variations in runoff to variations in climatic conditions and catchment properties. Water Resour. Res. 2011, 47, W00G07. [Google Scholar] [CrossRef]
  10. Yang, H.; Qi, J.; Xu, X.; Yang, D.; Lv, H. The regional variation in climate elasticity and climate contribution to runoff across China. J. Hydrol. 2014, 517, 607–616. [Google Scholar] [CrossRef]
  11. Dooge, J.C.; Bruen, M.; Parmentier, B. A simple model for estimating the sensitivity of runoff to long-term changes in precipitation without a change in vegetation. Adv. Water Resour. 1999, 23, 153–163. [Google Scholar] [CrossRef]
  12. Tan, X.; Gan, T.Y. Contribution of human and climate change impacts to changes in streamflow of Canada. Sci. Rep. 2015, 5, 17767. [Google Scholar] [CrossRef] [PubMed]
  13. Ma, H.A.; Yang, D.W.; Tan, S.K.; Gao, B.; Hu, Q.F. Impact of climate variability and human activity on streamflow decrease in the Miyun Reservoir catchment. J. Hydrol. 2010, 389, 317–324. [Google Scholar] [CrossRef]
  14. Zhang, Q.; Xu, C.-Y.; Yang, T. Variability of water resource in the Yellow River basin of past 50 years, China. Water Resour. Manag. 2009, 23, 1157–1170. [Google Scholar] [CrossRef]
  15. Xu, J.X. River sedimentation and channel adjustment of the lower Yellow River as influenced by low discharges and seasonal channel dry-ups. Geomorphology 2002, 43, 151–164. [Google Scholar] [CrossRef]
  16. Zhao, G.; Tian, P.; Mu, X.; Jiao, J.; Wang, F.; Gao, P. Quantifying the impact of climate variability and human activities on streamflow in the middle reaches of the Yellow River basin, China. J. Hydrol. 2014, 519, 387–398. [Google Scholar] [CrossRef]
  17. Chang, J.; Zhang, H.; Wang, Y.; Zhu, Y. Assessing the impact of climate variability and human activities on streamflow variation. Hydrol. Earth Syst. Sci. 2016, 20, 1547–1560. [Google Scholar] [CrossRef]
  18. Zhang, Q.; Liu, J.; Singh, V.P.; Gu, X.; Chen, X. Evaluation of impacts of climate change and human activities on streamflow in the Poyang Lake basin, China. Hydrol. Process. 2016. [Google Scholar] [CrossRef]
  19. Yang, H.B.; Yang, D.W.; Lei, Z.D.; Sun, F.B. New analytical derivation of the mean annual water-energy balance equation. Water Resour. Res. 2008, 44, W034103. [Google Scholar] [CrossRef]
  20. Liang, W.; Bai, D.; Wang, F.; Fu, B.; Yan, J.; Wang, S.; Yang, Y.; Long, D.; Feng, M. Quantifying the impacts of climate change and ecological restoration on streamflow changes based on a Budyko hydrological model in China's Loess Plateau. Water Resour. Res. 2015, 51, 6500–6519. [Google Scholar] [CrossRef]
  21. Legesse, D.; Vallet-Coulomb, C.; Gasse, F. Hydrological response of a catchment to climate and land use changes in Tropical Africa: Case study South Central Ethiopia. J. Hydrol. 2003, 275, 67–85. [Google Scholar] [CrossRef]
  22. Fu, G.; Charles, S.P.; Chiew, F.H.S. A two-parameter climate elasticity of streamflow index to assess climate change effects on annual streamflow. Water Resour. Res. 2007, 43. [Google Scholar] [CrossRef]
  23. Xu, X.; Yang, D.; Yang, H.; Lei, H. Attribution analysis based on the Budyko hypothesis for detecting the dominant cause of runoff decline in Haihe basin. J. Hydrol. 2014, 510, 530–540. [Google Scholar] [CrossRef]
  24. Gao, G.; Fu, B.; Wang, S.; Liang, W.; Jiang, X. Determining the hydrological responses to climate variability and land use/cover change in the Loess Plateau with the Budyko framework. Sci. Total Environ. 2016, 557, 331–342. [Google Scholar] [CrossRef] [PubMed]
  25. Liu, J.; Zhang, Q.; Singh, V.P.; Shi, P. Contribution of multiple climatic variables and human activities to streamflow changes across China. J. Hydrol. 2016, 545, 145–162. [Google Scholar] [CrossRef]
  26. Chang, J.; Wang, Y.; Istanbulluoglu, E.; Bai, T.; Huang, Q.; Yang, D.W.; Huang, S. Impact of climate change and human activities on runoff in the Weihe River Basin, China. Quat. Int. 2015, 380, 169–179. [Google Scholar] [CrossRef]
  27. Chang, J.; Li, Y.; Wei, J.; Wang, Y.; Guo, A. Dynamic changes of sediment load and water discharge in the Weihe River, China. Environ. Earth Sci. 2016, 75, 1–17. [Google Scholar] [CrossRef]
  28. Zheng, H.; Zhang, L.; Zhu, R.; Liu, C.; Sato, Y.; Fukushima, Y. Responses of streamflow to climate and land surface change in the headwaters of the Yellow River Basin. Water Resour. Res. 2009, 45. [Google Scholar] [CrossRef]
  29. Tang, Y.; Tang, Q. Response of Natural Runoff to Recent Climatic Changes in the Yellow River Basin, China. In Proceedings of the 2012 AGU Fall Meeting, San Francisco, CA, USA, 3–7 December 2017.
  30. Budyko, M.I. Climate and Life; Academic Press: New York, NY, USA, 1974. [Google Scholar]
  31. Yang, H.; Yang, D. Derivation of climate elasticity of runoff to assess the effects of climate change on annual runoff. Water Resour. Res. 2011, 47, W07526. [Google Scholar] [CrossRef]
  32. Allen, R.G.; Pereira, L.S.; Raes, D.; Smith, M. Crop Evapotranspiration: Guidelines for Computing Crop Water Requirements; FAO Irrigation and Drainage Paper 56; Food and Agriculture Organization of the United Nations: Rome, Italy, 1998. [Google Scholar]
  33. Roderick, M.L.; Rotstayn, L.D.; Farquhar, G.D.; Hobbins, M.T. On the attribution of changing pan evaporation. Geophys. Res. Lett. 2007, 34. [Google Scholar] [CrossRef]
  34. Wang, D.; Hejazi, M. Quantifying the relative contribution of the climate and direct human impacts on mean annual streamflow in the contiguous United States. Water Resour. Res. 2011, 47. [Google Scholar] [CrossRef]
  35. Chiew, F.H.S.; Peel, M.C.; Western, A.W. Application and testing of the simple rainfall-runoff model SIMHYD. In Mathematical Models of Small Watershed Hydrology and Applications; Singh, V.P., Frevert, D., Eds.; Water Resources Publications, LLC.: Littleton, CO, USA, 2002; pp. 335–367. [Google Scholar]
  36. Kumar, A.; Singh, R.; Jena, P.P.; Chatterjee, C.; Mishra, A. Identification of the best multi-model combination for simulating river discharge. J. Hydrol. 2015, 525, 313–325. [Google Scholar] [CrossRef]
  37. Ahn, K.H.; Merwade, V. Quantifying the relative impact of climate and human activities on streamflow. J. Hydrol. 2014, 515, 257–266. [Google Scholar] [CrossRef]
  38. Steel, R.G.D.; Torrie, J.H. Principles and Procedures of Statistics: With Special Reference to the Biological Sciences; McGraw-Hill: New York, NY, USA, 1960. [Google Scholar]
  39. Killick, P. Changepoint: An R package for changepoint analysis. J. Stat. Softw. 2014, 58, 1–19. [Google Scholar] [CrossRef]
  40. Liu, J.Y.; Zhang, Q.; Gu, X. Evaluation of ecological flow with considerations of hydrological alterations in the Poyang Lake basin. Acta Ecol. Sin. 2015, 35, 5477–5485. (In Chinese) [Google Scholar]
  41. Villarini, G.; Serinaldi, F.; Smith, J.A.; and Krajewski, W.F. On the stationarity of annual flood peaks in the continental United States during the 20th century. Water Resour. Res. 2009, 45. [Google Scholar] [CrossRef]
  42. Zhang, Q.; Gu, X.; Singh, V.P.; Xiao, M. Flood frequency analysis with consideration of hydrological alterations: Changing properties, causes and implications. J. Hydrol. 2014, 519, 803–813. [Google Scholar] [CrossRef]
Figure 1. Locations of the 37 hydrological and meteorological stations in the Yellow River basin, China. The five-point stars are the limits for the upper, middle, and lower reaches.
Water 09 00116 g001
Figure 2. Change in mean annual streamflow from the benchmark (Period 1, 1960–1979) for Period 2 (1980–2000) (a) and Period 3 (2000–2014) (b). The dates shown in Figure 2a denote the times at which the change points in the streamflow series occurred.
Water 09 00116 g002
Figure 3. Elasticity of annual streamflow in terms of: annual precipitation (a); maximum air temperature (b); minimum air temperature (c); relative humidity (d); net solar radiation (e); wind speed (f), and landscape parameter n (g).
Water 09 00116 g003
Figure 4. Comparison between the modeled ( R P + R n + R R n + R T m a x + R T m i n + R U 2 + R R H ) and observed changes in the average annual streamflow for the years 1960–2000. The red line represents a 1:1 linear relationship.
Water 09 00116 g004
Figure 5. Changes in the fractional contributions of various influencing factors and their relative impact on changing streamflow between Period 2 and Period 1 (a) and between Period 3 and Period 1 (b) across the Yellow River basin. Note: data was only available for nine stations for Period 3. U = upper reaches, M = middle reaches, and L = lower reaches.
Water 09 00116 g005aWater 09 00116 g005b
Figure 6. Spatial distributions of the fractional contributions of human activities and climate change to streamflow variations during Period 2 (a) and Period 3 (b) across the Yellow River basin.
Water 09 00116 g006
Figure 7. Relationships between human-induced streamflow changes and underlying parameter (n), population density, and GDP. Percentage of land use/cover changes denotes the ratio between land use types to the entire drainage area.
Water 09 00116 g007
Figure 8. Comparison of simulated and observed monthly streamflow depths during the calibration, validation, and influence periods for the SIMHYD model.
Water 09 00116 g008
Table 1. Basic characteristics of 37 hydrological stations throughout the Yellow River.
LocationRiverHydrological StationsNo.Drainage Area (104 km2)Data PeriodAnnual P (mm)Annual E0 (mm)
Upper basinMain streamJimai14.861960–2000434849
Maqu28.671960–2000530828
Tangnaihai311.861960–2014519830
Guide413.621960–2000498841
Xunhua514.671960–2000492844
Lanzhou620.651960–2014468854
Shizuishan727.671960–2000425916
Zuli RiverJinyuan81.071960–2000397921
Qinshui RiverQuanyanshan91.431960–20003581125
Kundulun RiverTaerwan100.021960–2000424919
Zhao RiverMinxian111.491960–2000563796
Hongqi122.491960–2014539804
Daxia RiverShuangcheng130.401960–2000489831
Zheqiao140.621960–2000501809
Datong RiverMinhe151.511960–2000374896
Middle basinMain streamLongmen1652.261960–20143901031
Sanmenxia1765.121960–20004281024
Xiaolangdi1866.221960–20004291024
Kuye RiverWenjiachuan190.861960–20144021146
Fen RiverHekouzhen209.111960–20004551057
Hejin303.941960–20004871055
Qingjian RiverYanchuan210.361960–20004851059
Dahei RiverQixiaying220.271960–20003591063
Wei RiverBeidao232.751960–2000506863
Linjiacun243.541960–2000530868
Xianyiang254.801960–2000565886
Jin RiverYuluopin261.901960–20004681032
Wuding RiverBaijiachuan272.971960–20143701187
Beiluo RiverJiaokouhe282.041960–20005151022
Zhuangtou292.571960–20145261043
Lower basinMain SteamHuayuankou3170.211960–20144401027
Lijin3272.251960–20144481029
Yiluo RiverLingkou330.231960–20006961021
Yi RiverLongmenzhen340.531960–20007521026
Qin RiverHeishiguan350.931960–20005641002
Dawen RiverLaiwu360.031960–20007001136
Daicunba370.841960–20008131085
Table 2. Comparison between SIMHYD-based results and those obtained by the climate elasticity method for streamflow changes at the Jimai and Tangnaihai stations.
StationsSIMHDY-Based ResultsBudyko-Based Results
Streamflow (mm)Calibration R2Validation R2Climate-Induced Contribution (%)Climate-Induced Contribution (%)Human-Induced Contribution (%)
Jimai−0.470.960.9152.450.149.9
Tangnaihai−1.860.940.9239.237.362.7

